bitumen foaming optimisation process on the basis of
TRANSCRIPT

materials
Article
Bitumen Foaming Optimisation Process on the Basisof Rheological Properties
Marek Iwanski, Grzegorz Mazurek * and Przemysław Buczynski
Department of Transportation Engineering, Faculty of Civil Engineering and Architecture,Kielce University of Technology, Al. Tysiaclecia Panstwa Polskiego 7, 25-314 Kielce, Poland;[email protected] (M.I.); [email protected] (P.B.)* Correspondence: [email protected]; Tel.: +48-41-34-24-560
Received: 10 September 2018; Accepted: 25 September 2018; Published: 28 September 2018�����������������
Abstract: This article discusses the results of bitumen foam properties optimisation with respectto three factors: air pressure, bitumen temperature and amount of water. The test materials wereunmodified bitumen 50/70 and bitumen 50/70 modified with 2.5% synthetic wax. The experimentwas designed according to the 3(3−1) fractional factorial design. The distribution of parametersof bitumen foam were measured with the authors’ original apparatus using a laser beam.This measurement method increased the accuracy of maximum expansion ratio (ER) and half-life(HL) estimation. Based on HL and ER results, it was found that the foaming process increasedbitumen stiffness due to the dynamic ageing of the bitumen. The experimental design allows moreeffective control over the properties of foamed bitumen with respect to its intended use. The presenceof synthetic wax extended the half-life of the bitumen foam.
Keywords: foamed bitumen; Fisher-Tropsch wax; design of experiment; bitumen rheology; foamdecay parameters
1. Introduction
One of the important factors for obtaining durable bituminous mixtures is the use of bitumenwith a viscosity that will provide the mix with high in-service resistance to permanent deformationthat correlates with high stiffness modulus and with adequate workability in the manufacturingprocess [1,2]. Foamed bitumen technology, aimed at reducing bitumen viscosity, was initially appliedto the stabilisation of soils and road subgrades in which bitumen foam was used as a binder [3,4].Bitumen foam exhibited poor aggregate coating ability during the first stage of its application topavement upper layers. The situation changed with the introduction of half-warm mixtures in whichthe aggregates were pre-heated. Then, the workability of the mixture increased due to the drop inviscosity of H-WMA (half worm mix asphalt). As a result, the parameters of the H-WMA mixturewere comparable to the traditional HMA technology (hot mix asphalt) [5,6]. Research results reportedin [7,8] indicate that foam expansion and its stability are dependent on the proportion of water used inthe foaming process. It affects the size and distribution of the foam bubbles, thereby the shape of thefoam decay curve [9] and the foaming index (FI) need to be determined [7]. This approach, however, iscontroversial due to a complex shape of the foam decay curve and the fact that a decrease in half-life(HL) may not correspond to an increase in the expansion ratio (ER). Saleh [10] demonstrated thatbitumen viscosity could be a more useful measure of bitumen foam quality than the measurement ofonly two parameters, ER and HL. Viscosity can be reduced with the application of zeolites [11] or ofsynthetic waxes that improve foaming parameters by stabilising foam decay [12], as does increasing theasphaltene fractions [13]. Chemical foam-enhancing agents are also used to improve foam stability [9].
Materials 2018, 11, 1854; doi:10.3390/ma11101854 www.mdpi.com/journal/materials

Materials 2018, 11, 1854 2 of 20
Foam distribution evaluation is strongly influenced by the accuracy of measurement. Generally,ER and HL based assessment does not provide exhaustive information about to what extent thefoaming process affects the changes in bitumen rheology and chemical composition [14]. ER and HLparameters depend on temperature, water quantity, and pressure used in the foaming process. Usuallyonly the water content is controlled. The effect of other parameters on the quality of foam depends onthe type of bitumen used. The process of foaming causes a rapid change of water into vapour in hotbitumen. The presence of water vapour can contribute to a significant increase in bitumen stiffness.This hardening of the bitumen is a consequence of the distilling water vapour action on petroleumoils [2]. The process is similar to that of gudron hydrocracking in a vacuum tower. Acceleration of theageing process was also observed in the simulation of bitumen ageing in the presence of water [15].High temperatures with high water vapour pressure may cause the foamed bitumen to reach a highdegree of stiffness over time. Information on optimal foaming, accounting for all aspects of the foamingprocess, ageing and minimum stiffness of H-WMA mixtures during the service period is scarce inthe literature.
This article discusses the influence of foaming process quality on rheological properties ofbitumen, considering viscosity changes after foaming and bitumen modification with synthetic waxes.The optimum solutions with several criteria accounted for will contribute to broadening the knowledgeof the bitumen foaming process.
2. Materials and Methods
2.1. Bitumen
Paving bitumen 50/70, assigned to the sol-gel rheological type, was used in the tests withoutmodification and modified with 2.5% Fischer-Tropsch synthetic wax (FT wax), denoted as 50/70M [16,17]. The amount of the synthetic wax incorporated into neat bitumen was optimised [18].Basic standard parameters determination was supplemented with the measurement of stiffnessmodulus G*, phase angle δ, dynamic viscosity η and zero shear viscosity ηZSV. The additionalrheological parameters were determined at 60 ◦C. The results are summarised in Table 1.
Table 1. Bitumen test results.
Parameter u·m Standard Results
50/70 50/70 M (2.5% FT wax)Penetration 0.1 mm PN-EN 1426 65 58
Softening point ◦C PN-EN 1427 49 73G*/sinδ at 60 ◦C and 1.59 Hz Pa PN-EN 14770 4093 5483
η at 60 ◦C Pa·s PN-EN 12596 350 339ηZSV at 60 ◦C Pa·s CEN/TS 15325 542 656
2.2. Sampling
Foamed bitumen samples were collected in separate glass containers. The number of containersfollowed the experimental design assumptions, with necessary replication. To maintain the propertiesof the bitumen after foam collapse, the adopted protocol assumed cooling the samples to thetemperature of −10 ◦C 15 min after foaming [14,19]. The samples were stored under these conditionsuntil the rheological parameter determination started.
2.3. Dynamic Viscosity
Viscometer Rheotest 4.1 was used in compliance with the relevant standard [20]. Dynamic viscositywas determined at 60 ◦C for two levels of shear rate, i.e., for dynamic viscosity of the Newton’slaw state,
.γ = 1 s−1 (experimental) and for zero shear viscosity ηZSV determined at a shear rate of
0.0032 s−1 [21].

Materials 2018, 11, 1854 3 of 20
2.4. Rheological Tests in Oscillation
Rheological tests for the complex shear modulus G*and phase angle δ were performed with acone-plate (25 mm) viscometer with a gap of 150 µm between the measuring systems, operated inforced oscillation mode [22,23]. The stress amplitude used in the tests was 40 Pa (LVE) and the testtemperatures were 40 ◦C and 60 ◦C. The frequency range was between 0.1 Hz and 10 Hz. The linearviscoelastic range stress was established using procedure and model found in SHRP-A-370 [24].
2.5. Experimental Design 3(3−1)
Three independent factors were considered. These factors/variables controlled the foamingprocess. Typically, the optimal temperature for foaming is greater than 140 ◦C. However, using amodifier such as synthetic wax allows decreasing the bitumen viscosity; therefore, it was assumed thatthe foam could be manufactured below that temperature limit. The main purpose of this study was alsoto conduct an experiment at low temperature regardless of the final result. To perform an optimisation,this experiment was carried out beyond a typical apparatus setting. The factors represented thesettings of the apparatus, which in this case was the laboratory-scale bitumen foamed plant WBL-10S.The experiment was performed using the following WLB-10S setting values (independent factors):
• Air pressure: 100 kPa, 400 kPa, and 700 kPa;• Bitumen temperature: 110 ◦C, 145 ◦C, and 180 ◦C; and• Water content: 1%, 2.5%, and 5%.
A detailed description of the 3(3−1) fractional factorial design is given in [25,26]. This fractionalfactorial experiment plan is a special case of full factorial plan. Due to the high labour intensity,the effects of interaction between factors (interactions) have been omitted. The fractional factorialdesign plan 3k−p was built (assuming that the corresponding synergy effects are equal to zero) bycomparing the p columns of interactions in the full plan 33 to the columns of independent variables.The number of N experiments, forming this plan, should be greater than the number k + 1 specifyingthe number of regression coefficients. Therefore, creating plan for k independent variables, the p wasset in such way that N = 3k − p > k + 1. According to this, for this design, no assessment of variabilityinduced by interactions between independent variables was performed. In this study, the design wasdeveloped by comparing interaction columns to the columns of new independent variables, as a resultof which the number of factor combinations was reduced from 27 to 9 and only the most importantpart of the full design was run. This approach is a trade-off between maximisation of informationfrom the model approximation and the effort made when the full design is used. The design wasrandomised within the blocks to reduce the systemic error appearing during the sequential samplingand determining the parameters. Table 2 compiles the WLB-10S setting combinations.
Table 2. Experimental design 33−1.
Standard Run3(3−1) Fractional Factorial Design, 1 Block, 9 Runs
Air Pressure, kPa Temperature, ◦C Water Proportion, %
1 100 110 14 400 110 57 700 110 2.52 100 145 55 400 145 2.58 700 145 13 100 180 2.56 400 180 19 700 180 5
Materials 2018, 11, 1854 4 of 20
This design required variables to be coded. For example, 400-145-2.5 means that the bitumenfoaming process was performed at 400 Pa, 145 ◦C and 2.5% foaming water. Adoption of the model hadto meet the condition of the number of factor combinations being greater than the number of modelparameters sought plus one. A second order polynomial model without interaction was adopted as anappropriate mathematical function. To determine the measured variable (Y), seven unknowns includedin the regression equation were estimated, which were essentially the second order polynomial withoutinteraction [25] (Equation (1)):
Y = bo +k
∑i=1
bi·xi +k
∑i=1
bi·xi2 (1)
where: xi is an independent variable (laboratory-scale bitumen foamed plant setting), bi representsexperimental parameters of regression, Y is a dependent variable, and k is the number of unknownregression parameters (seven in the experiment).
The model was used to predict both foaming parameters and rheological parameters of bitumenafter foaming. The quality of fit of the objective function mathematical model to the experimentalresults was determined using the coefficient of determination R2 and the declared value of the rootmean square error (RMSE).
3. New Testing Method for Foam Decay Determination
3.1. Laser Measurement of HL and ER
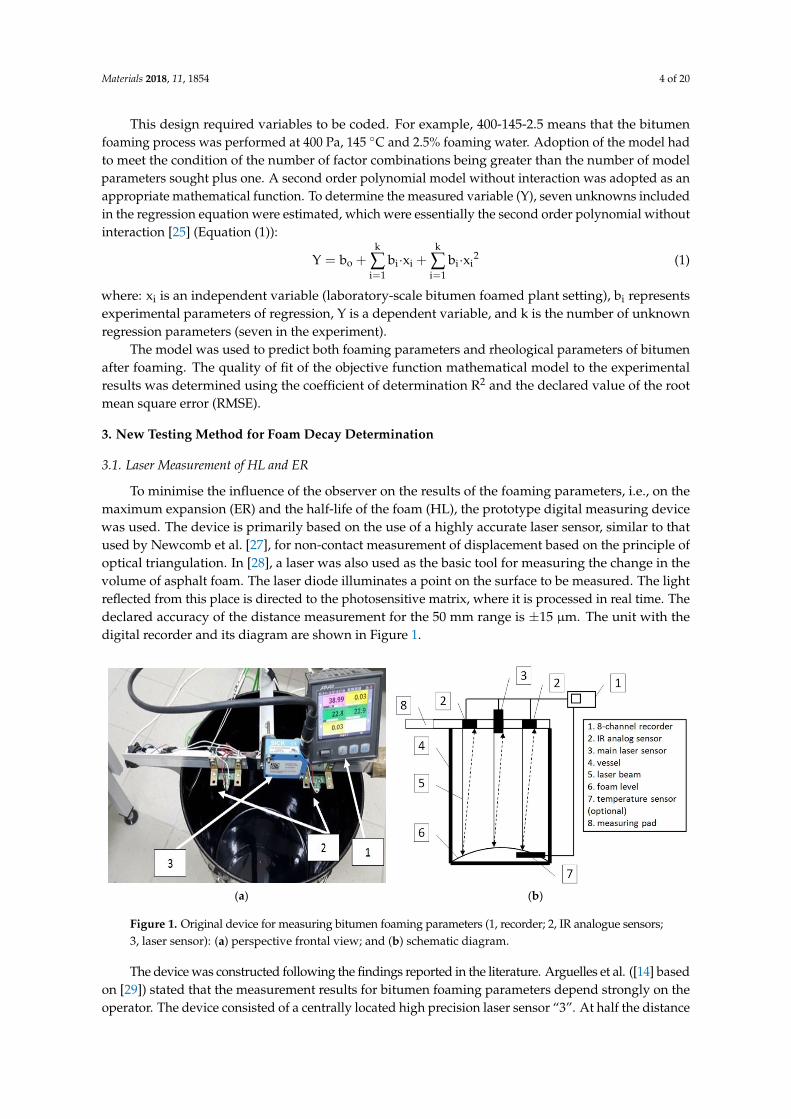
To minimise the influence of the observer on the results of the foaming parameters, i.e., on themaximum expansion (ER) and the half-life of the foam (HL), the prototype digital measuring devicewas used. The device is primarily based on the use of a highly accurate laser sensor, similar to thatused by Newcomb et al. [27], for non-contact measurement of displacement based on the principle ofoptical triangulation. In [28], a laser was also used as the basic tool for measuring the change in thevolume of asphalt foam. The laser diode illuminates a point on the surface to be measured. The lightreflected from this place is directed to the photosensitive matrix, where it is processed in real time. Thedeclared accuracy of the distance measurement for the 50 mm range is ±15 µm. The unit with thedigital recorder and its diagram are shown in Figure 1.
Materials 2018, 11, x FOR PEER REVIEW 4 of 20
This design required variables to be coded. For example, 400-145-2.5 means that the bitumen foaming process was performed at 400 Pa, 145 °C and 2.5% foaming water. Adoption of the model had to meet the condition of the number of factor combinations being greater than the number of model parameters sought plus one. A second order polynomial model without interaction was adopted as an appropriate mathematical function. To determine the measured variable (Y), seven unknowns included in the regression equation were estimated, which were essentially the second order polynomial without interaction [25] (Equation (1)):
Y = b + b ∙ x + b ∙ x (1)
where: x is an independent variable (laboratory-scale bitumen foamed plant setting), b represents experimental parameters of regression, Y is a dependent variable, and k is the number of unknown regression parameters (seven in the experiment).
The model was used to predict both foaming parameters and rheological parameters of bitumen after foaming. The quality of fit of the objective function mathematical model to the experimental results was determined using the coefficient of determination R2 and the declared value of the root mean square error (RMSE).
3. New Testing Method for Foam Decay Determination
3.1. Laser Measurement of HL and ER
To minimise the influence of the observer on the results of the foaming parameters, i.e., on the maximum expansion (ER) and the half-life of the foam (HL), the prototype digital measuring device was used. The device is primarily based on the use of a highly accurate laser sensor, similar to that used by Newcomb et al. [27], for non-contact measurement of displacement based on the principle of optical triangulation. In [28], a laser was also used as the basic tool for measuring the change in the volume of asphalt foam. The laser diode illuminates a point on the surface to be measured. The light reflected from this place is directed to the photosensitive matrix, where it is processed in real time. The declared accuracy of the distance measurement for the 50 mm range is ±15 µm. The unit with the digital recorder and its diagram are shown in Figure 1.
(a) (b)
Figure 1. Original device for measuring bitumen foaming parameters (1, recorder; 2, IR analogue sensors; 3, laser sensor): (a) perspective frontal view; and (b) schematic diagram.
The device was constructed following the findings reported in the literature. Arguelles et al. ([14] based on [29]) stated that the measurement results for bitumen foaming parameters depend strongly on the operator. The device consisted of a centrally located high precision laser sensor “3”. At half the distance between the main sensor “3” and the container sideline, two IR analogue sensors “2”
Figure 1. Original device for measuring bitumen foaming parameters (1, recorder; 2, IR analogue sensors;3, laser sensor): (a) perspective frontal view; and (b) schematic diagram.
The device was constructed following the findings reported in the literature. Arguelles et al. ([14] basedon [29]) stated that the measurement results for bitumen foaming parameters depend strongly on theoperator. The device consisted of a centrally located high precision laser sensor “3”. At half the distance

Materials 2018, 11, 1854 5 of 20
between the main sensor “3” and the container sideline, two IR analogue sensors “2” with accuracyof ±3 mm were mounted to verify the operation of the main sensor “3”. The results were recordedusing the eight-channel recorder “1” with 1 s measurement interval. Typically, the measurementof the foaming parameters is carried out by means of a measuring rod together with a calibratedcontainer (for ER) and a stopwatch (for HL). The calibrated measuring rod has a resolution of ERquintuple. The distance laser sensor has a resolution of ±5 µm for the 50 mm range. To compare theaccuracy of expansion measurement, uncertainty was determined based on a number of relevant andknown factors affecting the ER measurement. The preliminary uncertainty assessment followed thegeneralised pattern of the sum of systematic errors [30] of expanded uncertainty (Equation (2)):
U(y) = k·
√√√√ m
∑j=1
[df(x)dxj
·u(xj)]2
(2)
where: U(y) is the expanded uncertainty of variable y, u(xj)
is the standard component uncertainty(partial uncertainty), and k is the coverage factor associated with the confidence interval.
The analysis did not account for random error because the database containing the repeatabilityresults for both methods with respect to one bitumen type and one combination of device settingsdid not reach the result close to 30 runs. Table 3 compiles expanded uncertainties of both methods,including the distribution shapes of systematic error results.
Table 3. Initial comparative evaluation of uncertainties of foamed bitumen ER measurement methods.
Method Source of Uncertainty Distribution ofMeasurands
PartialUncertainty
Original Method(prototype)
Sensor resolution (±5 µm at the measured distance of 50 cm) rectangular 0.001 mm
Accuracy class(0.05% measured quantity + 0.01% measurement range) rectangular 0.104 mm
Sensor repeatability of measurement(±15 µm at the measured distance of 50 cm) rectangular 0.009 mm
Linearity error (±20 µm at the measured distance of 50 cm) rectangular 0.004 mm
Amplitude of readings due to measured sample surfaceirregularity based on the max RMSE of the estimated
regression functions (read for 700-110-2.5)normal 1.87 mm
Expanded Uncertainty (k = 2) of ERU(ER) = 0.51
Classical Method
Measuring rod resolution(every 5 ER units in the calibrated container) rectangular 1.44 (ER)
Expanded Uncertainty (k = 2) of ERU(ER) = 2.9
Note that the ER measurement uncertainty from the prototype device is a factor of 6 times smallerthan the result obtained from the measuring rod. Time registration (for HL) is far more accurate. In thiscase, uncertainty related to the operator’s perception is eliminated.
3.2. Bitumen Foam Distribution Model
A single bitumen sample for a given settings combination (combination of foaming parameters)of the WLB-10S plant was fixed at 500 g. The bitumen flow rate was set at 100 g/s. Continuousmeasurement of the ER using the laser device required recording the height of the foam in themeasuring device and its corresponding expansion time. Precise estimation of foaming parameters,ER and HL, needed to find a mathematical relationship between them. Based on the mathematicaldescription of bitumen foaming reported in the literature [7,9], the sigmoid function was proposed.The general form of this function is used in pharmacological experiments and also in modelling the
Materials 2018, 11, 1854 6 of 20
bitumen viscosity versus shear rate. The shape of this function coincides with observations of changesin the volume of bitumen foam. After some mathematical transformations, this model was adopted formodelling the bitumen foam decay. The foam bubbles rapidly collapse during the first five seconds,making it impossible to measure properly. Therefore, the behaviour of the foam during the first 5 swas determined by the extrapolation of the assumed function of the model. Its character is representedin Equations (3) and (4):
ER(t) = 1 +ERmax
1 +( t
HL)c (3)
ERmax =max(b(t))
a(4)
where ER(t) is the calculated expansion ratio vs. time, a is the height of 500 g of non-foamed bitumenin the container (a constant value), b(t) is the distance between the foamed bitumen upper surfaceand the sensor (changing over time), HL is the model half-life, t is the measurement time, c is theratio defining the foam decay rate (the ratio of changing HL vs. time), and ERmax is the maximum ofexpansion ratio (ER).
The choice of this model was dictated by the fact that, by means of a small number of parameters,it was possible to satisfactorily characterise how quickly the volume of foamed bitumen was changed.Based on the conducted simulation and considering the resolution of the recording device, it wasfound that Equation (3) best represented the expansion of bitumen foam and its stability. Nevertheless,such model is a hypothesis, which does not exclude the use of more advanced mathematical models.To determine model parameters in Equation (3), the experiment was performed twice. In the case ofa large discrepancy, a third replication was used. The model does not exhaust all the behaviours ofbitumen foam, but in the case of the bitumens being analysed the matching of functions to the resultswas very high. In the cases where calculated HL is extremely low, below 1 s, either the foaming effectin bitumen did not take place or was hard to estimate. Unusually, the low value of HL was related toeither low temperature (110 ◦C) or low pressure (100 kPa). Regardless of a low HL, all test results weretaken for further analysis. Only in few cases the R2 parameter was about 0.6. In most cases, it was>0.7. The results of parameter matching, the mean of the two results, of the function describing thedistribution of the foaming parameters are compiled in Table 4. Additional measurements were usedto determine the variance of repeatability required to calculate the significance of the parameters.
Table 4. Distribution of foaming parameters.
CASE
Bitumen Type
50/70 (a = 0.6 cm) 50/70 M (a = 0.6 cm)
b50/70,cm
HL50/70,s c50/70
RMSE(b50/70),cm R2 b50/70M,
cmHL50/70M,
s c50/70MRMSE(b50/70M),
cm R2
100-110-1 1.86 34.25 2.74 0.48 0.99 1.58 135.22 1.10 0.28 0.97100-145-5 3.33 56.13 1.54 1.38 0.98 4.80 20.48 0.94 0.97 0.99
100-180-2.5 3.48 0.001 0.09 0.91 0.61 35.00 0.002 0.45 1.50 0.65400-110-5 2.82 16.99 1.16 0.56 0.98 3.56 44.79 1.66 1.19 0.98
400-145-2.5 11.18 16.14 1.50 1.58 0.98 5.77 20.95 2.32 1.40 0.98400-145-2.5(additional) 12.42 15.05 1.50 1.68 0.98 5.62 22.41 2.21 1.65 0.99
400-145-2.5(additional) 11.01 15.89 1.53 1.84 0.97 5.52 19.02 2.32 1.45 0.98
400-180-1 1.10 123.00 0.90 1.04 0.78 1.02 14.08 4.37 0.40 0.65700-110-2.5 35.0 0.20 0.82 1.54 0.93 4.68 20.37 1.48 1.87 0.97700-145-1 35.0 1.28 0.88 1.42 0.98 35.00 0.78 0.63 1.50 0.98700-180-5 5.89 7.20 3.10 0.98 0.87 7.03 10.00 2.25 0.46 0.99
The set of results of the model parameters assigned in accordance with the experimental designwas used to make a preliminary comparison of the foam distribution parameters for the bitumenfoam degradation rate (parameter c), ER determined by the foam height in the container (parameter b)

Materials 2018, 11, 1854 7 of 20
and HL. A box plot depicting 50% distribution of the population through its quartiles was used (firstquartile 25% and third quartile 75%). The summarised results of the evaluation are shown in Figure 2.
Materials 2018, 11, x FOR PEER REVIEW 7 of 20
b) and HL. A box plot depicting 50% distribution of the population through its quartiles was used (first quartile 25% and third quartile 75%). The summarised results of the evaluation are shown in Figure 2.
Figure 2. Box-and-whisker plot for the bitumen foam distribution parameters.
Since the model parameters have different scales, they are all included in one graph using logarithmic scaling. The preliminary comparison by bitumen type was used with the median result (the line in middle of the box plot) instead of the arithmetic mean. By comparing the average value of the population to the median, bitumen 50/70 M was found to have slightly higher ER (represented by parameter b) and slightly higher HL. The foam decay rate (parameter c) of bitumen 50/70 was comparable to that of bitumen 50/70 M, but the 50/70 M data were less spread out than the 50/70 bitumen data. Longer and more gradual HL and the stable c value extends the time at which bitumen foam is suitable for use. With longer HL, the 50/70 M foam will be more suitable for H-WMA mixtures and for deep recycling with RAS. This seems to be related to the rheological properties characteristic of a given bitumen composition. A graphical interpretation of the foam distribution model against the cases imposed by the experimental design at a 5 s resolution is shown in Figure 3. To increase the legibility of the graphical representation in Figure 3, only the results from numerical simulations based on the model in Equation (3) with the parameters in Table 4 are included.
(a) (b)
Figure 3. Distribution of bitumen foam according to the logit of the model (5 s resolution): (a) bitumen 50/70; and (b) bitumen 35/50 M.
After completing the stage of estimating the ER, HL (foaming parameters), the coefficients of the assumed model in Equaiton (1) were estimated. To estimate the significance of these coefficients, two
Figure 2. Box-and-whisker plot for the bitumen foam distribution parameters.
Since the model parameters have different scales, they are all included in one graph usinglogarithmic scaling. The preliminary comparison by bitumen type was used with the median result(the line in middle of the box plot) instead of the arithmetic mean. By comparing the average value ofthe population to the median, bitumen 50/70 M was found to have slightly higher ER (representedby parameter b) and slightly higher HL. The foam decay rate (parameter c) of bitumen 50/70 wascomparable to that of bitumen 50/70 M, but the 50/70 M data were less spread out than the 50/70bitumen data. Longer and more gradual HL and the stable c value extends the time at which bitumenfoam is suitable for use. With longer HL, the 50/70 M foam will be more suitable for H-WMA mixturesand for deep recycling with RAS. This seems to be related to the rheological properties characteristicof a given bitumen composition. A graphical interpretation of the foam distribution model againstthe cases imposed by the experimental design at a 5 s resolution is shown in Figure 3. To increase thelegibility of the graphical representation in Figure 3, only the results from numerical simulations basedon the model in Equation (3) with the parameters in Table 4 are included.
Materials 2018, 11, x FOR PEER REVIEW 7 of 20
b) and HL. A box plot depicting 50% distribution of the population through its quartiles was used (first quartile 25% and third quartile 75%). The summarised results of the evaluation are shown in Figure 2.
Figure 2. Box-and-whisker plot for the bitumen foam distribution parameters.
Since the model parameters have different scales, they are all included in one graph using logarithmic scaling. The preliminary comparison by bitumen type was used with the median result (the line in middle of the box plot) instead of the arithmetic mean. By comparing the average value of the population to the median, bitumen 50/70 M was found to have slightly higher ER (represented by parameter b) and slightly higher HL. The foam decay rate (parameter c) of bitumen 50/70 was comparable to that of bitumen 50/70 M, but the 50/70 M data were less spread out than the 50/70 bitumen data. Longer and more gradual HL and the stable c value extends the time at which bitumen foam is suitable for use. With longer HL, the 50/70 M foam will be more suitable for H-WMA mixtures and for deep recycling with RAS. This seems to be related to the rheological properties characteristic of a given bitumen composition. A graphical interpretation of the foam distribution model against the cases imposed by the experimental design at a 5 s resolution is shown in Figure 3. To increase the legibility of the graphical representation in Figure 3, only the results from numerical simulations based on the model in Equation (3) with the parameters in Table 4 are included.
(a) (b)
Figure 3. Distribution of bitumen foam according to the logit of the model (5 s resolution): (a) bitumen 50/70; and (b) bitumen 35/50 M.
After completing the stage of estimating the ER, HL (foaming parameters), the coefficients of the assumed model in Equaiton (1) were estimated. To estimate the significance of these coefficients, two
Figure 3. Distribution of bitumen foam according to the logit of the model (5 s resolution): (a) bitumen50/70; and (b) bitumen 35/50 M.
After completing the stage of estimating the ER, HL (foaming parameters), the coefficients ofthe assumed model in Equaiton (1) were estimated. To estimate the significance of these coefficients,
Materials 2018, 11, 1854 8 of 20
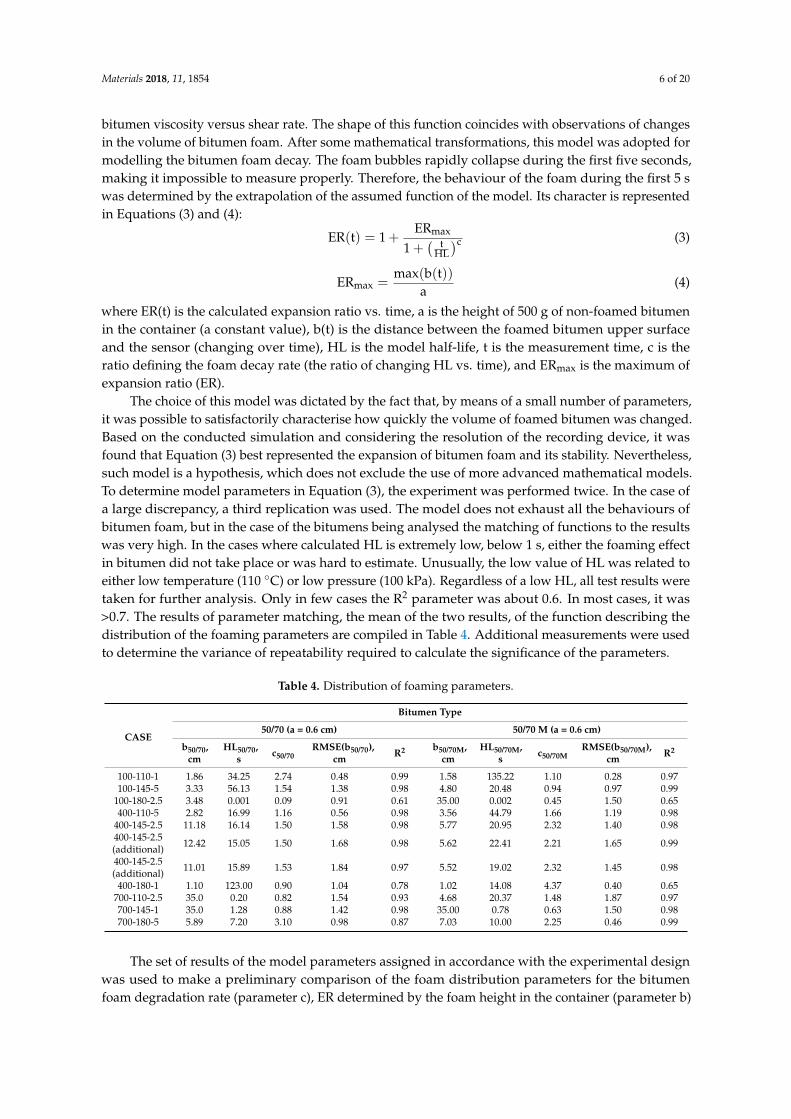
two additional measurements of bitumen foam were used for case 400-145-2.5 They played role of“fictitious” additional experiments (Table 4). It was necessary to evaluate a significance of the modelcoefficients in Equation (1). Aforementioned polynomial equation was fitted to the history of ER andHL plots. Table 5 summarises the results for the model parameters.
Table 5. Fitting parameters of the objective function of foam distribution parameters (ER and HL) forbitumen 50/70 and bitumen 50/70 M (2.5% FT wax) with respect to Equation (1).
Regression ModelParameters
Bitumen Type
Bitumen 50/70 Bitumen 50/70 M (2.5% FT wax)
Variable—ERR2 = 0.92
RMSE(ER) = 4.0
Variable—HLR2 = 0.73
RMSE(HL) = 5.8 s
Variable—ERR2 = 0.83
RMSE(ER) = 1.3
Variable—HLR2 = 0.98
RMSE(HL) = 8.9 s
Coefficient p-Value Coefficient p-Value Coefficient p-Value Coefficient p-Value
Mean/Const. −168.356 0.001611 −107.349 0.080420 −294.983 <0.0001 638.2769 0.000074(1) PRESSURE (L **) −0.072 0.003419 −0.026 0.350907 −0.066 <0.0001 −0.0022 0.960100PRESSURE (Q ***) 0.000 <0.0001 −0.000 0.466805 0.000 <0.0001 −0.0002 0.017506(2) TEMP (L) 2.670 0.000712 2.450 0.010745 4.632 <0.0001 −6.0151 0.001159TEMP (Q) −0.010 0.000366 −0.009 0.008153 −0.016 <0.0001 0.0159 0.005498(3) WATER (L) 15.446 0.001344 −25.045 0.000603 −20.245 <0.0001 −35.7525 0.001552WATER (Q) −3.174 0.000239 4.477 0.000277 3.118 <0.0001 3.3096 0.031701
* the values given in bold are not statistically significant; ** linear component (L); *** quadratic component (Q).
It should be noted that ER variability, irrespective of the bitumen type, was affected by allindependent variables, i.e., the bitumen temperature, air pressure and amount of water. As for theHL parameter, water pressure had the least effect in the model. Analysis of the quality of fitting themodel to the results of ER for bitumen 50/70 revealed the estimation error ER50/70 = ±4.0, greater thanthe estimation error for bitumen 50/70 M, ER50/70M = 1.3, indicating that the results would be moreuniform for the FT wax modified bitumen. The polynomial model explained ER changes far better forbitumen 50/70 (R2 = 0.92). However, the difference was small compared to the bitumen with syntheticwax. Graphical interpretation of the foaming parameter distribution at 2.5% water dose (the middlevalue of the experimental design) for both bitumen types is given in Figure 4.
Analysis of the results (Figure 4a,b) shows that, at the 2.5% water content, ER was similar forboth bitumen types. The highest ER parameters for bitumen 50/70 were obtained at a temperature ofabout 140 ◦C and a pressure of above 400 kPa. The increase in temperature lowered the viscosity ofthe bitumen to limit the formation of large air bubbles, just as high viscosity did at low temperatures.With this setting range of the WLB-10S, the low HL of the foam was inversely proportional to theresults of the ER. In the case of 50/70 M bitumen, the ER maximum was reached at a temperature ofapproximately 145 ◦C and a pressure of >600 kPa. However, the ER values of bitumen 50/70 M weregenerally lower. As for the HL parameter of bitumen 50/70 M, the bitumen foam rapidly decayedwith an interactive rise in bitumen and water pressure. This character of bitumen foam decay in the50/70 M bitumen was probably due to the low viscosity of bitumen dispersed by the synthetic waxphase. As a result, the decrease in bitumen cohesion contributed to the rapid foam collapse. It isapparent that the 2.5% water content does not have to be the optimum amount for the bituminoustypes tested. The foaming process will thus change the rheological properties of the bitumen in adifferent manner.

Materials 2018, 11, 1854 9 of 20
Materials 2018, 11, x FOR PEER REVIEW 8 of 20
additional measurements of bitumen foam were used for case 400-145-2.5 They played role of “fictitious” additional experiments (Table 4). It was necessary to evaluate a significance of the model coefficients in Equation (1). Aforementioned polynomial equation was fitted to the history of ER and HL plots. Table 5 summarises the results for the model parameters.
Table 5. Fitting parameters of the objective function of foam distribution parameters (ER and HL) for bitumen 50/70 and bitumen 50/70 M (2.5% FT wax) with respect to Equation (1).
Regression Model Parameters
Bitumen Type Bitumen 50/70 Bitumen 50/70 M (2.5% FT wax)
Variable—ER R2 = 0.92
RMSE(ER) = 4.0
Variable—HL R2 = 0.73
RMSE(HL) = 5.8s
Variable—ER R2 = 0.83
RMSE(ER) = 1.3
Variable—HL R2 = 0.98
RMSE(HL) = 8.9s
Coefficient p-Value Coefficien
t p-Value
Coefficient
p-Value Coeffici
ent p-Value
Mean/Const. −168.356 0.001611 −107.349 0.080420 −294.983 <0.0001 638.2769 0.000074 (1) PRESSURE (L **) −0.072 0.003419 −0.026 0.350907 −0.066 <0.0001 −0.0022 0.960100 PRESSURE (Q ***) 0.000 <0.0001 −0.000 0.466805 0.000 <0.0001 −0.0002 0.017506 (2) TEMP (L) 2.670 0.000712 2.450 0.010745 4.632 <0.0001 −6.0151 0.001159 TEMP (Q) −0.010 0.000366 −0.009 0.008153 −0.016 <0.0001 0.0159 0.005498 (3) WATER (L) 15.446 0.001344 −25.045 0.000603 −20.245 <0.0001 −35.7525 0.001552 WATER (Q) −3.174 0.000239 4.477 0.000277 3.118 <0.0001 3.3096 0.031701
* the values given in bold are not statistically significant; ** linear component (L); *** quadratic component (Q).
It should be noted that ER variability, irrespective of the bitumen type, was affected by all independent variables, i.e., the bitumen temperature, air pressure and amount of water. As for the HL parameter, water pressure had the least effect in the model. Analysis of the quality of fitting the model to the results of ER for bitumen 50/70 revealed the estimation error ER50/70 = ±4.0, greater than the estimation error for bitumen 50/70 M, ER50/70M = 1.3, indicating that the results would be more uniform for the FT wax modified bitumen. The polynomial model explained ER changes far better for bitumen 50/70 (R2 = 0.92). However, the difference was small compared to the bitumen with synthetic wax. Graphical interpretation of the foaming parameter distribution at 2.5% water dose (the middle value of the experimental design) for both bitumen types is given in Figure 4.
(a) (b)
Materials 2018, 11, x FOR PEER REVIEW 9 of 20
(c) (d)
Figure 4. Response surface of foam parameters (2.5% water amount): (a) expansion ratio (ER), 50/70; (b) expansion ratio (ER), 50/70 M; (c) half-life (HL), 50/70; and (d) half-life (HL), 50/70 M.
Analysis of the results (Figure 4a,b) shows that, at the 2.5% water content, ER was similar for both bitumen types. The highest ER parameters for bitumen 50/70 were obtained at a temperature of about 140 °C and a pressure of above 400 kPa. The increase in temperature lowered the viscosity of the bitumen to limit the formation of large air bubbles, just as high viscosity did at low temperatures. With this setting range of the WLB-10S, the low HL of the foam was inversely proportional to the results of the ER. In the case of 50/70 M bitumen, the ER maximum was reached at a temperature of approximately 145 °C and a pressure of >600 kPa. However, the ER values of bitumen 50/70 M were generally lower. As for the HL parameter of bitumen 50/70 M, the bitumen foam rapidly decayed with an interactive rise in bitumen and water pressure. This character of bitumen foam decay in the 50/70 M bitumen was probably due to the low viscosity of bitumen dispersed by the synthetic wax phase. As a result, the decrease in bitumen cohesion contributed to the rapid foam collapse. It is apparent that the 2.5% water content does not have to be the optimum amount for the bituminous types tested. The foaming process will thus change the rheological properties of the bitumen in a different manner.
4. Results of Rheological Parameters
4.1. Viscoelastic Characterisation of Bitumen Foam
The viscoelastic nature of the bitumen foam was determined by measuring the complex shear modulus G* and the phase shift angle δ in the frequency range 0.01–10 Hz and for temperatures of 40 °C and 60 °C. The Black curve makes the representation of the results combining frequency and temperature that allows the comparison of the viscoelastic nature of various bitumens. Figure 5 shows the Black curves for bitumens 50/70 and 50/70 M with different combinations of bitumen foaming programmes, and with non-foamed reference bitumens.
Figure 4. Response surface of foam parameters (2.5% water amount): (a) expansion ratio (ER), 50/70;(b) expansion ratio (ER), 50/70 M; (c) half-life (HL), 50/70; and (d) half-life (HL), 50/70 M.
4. Results of Rheological Parameters
4.1. Viscoelastic Characterisation of Bitumen Foam
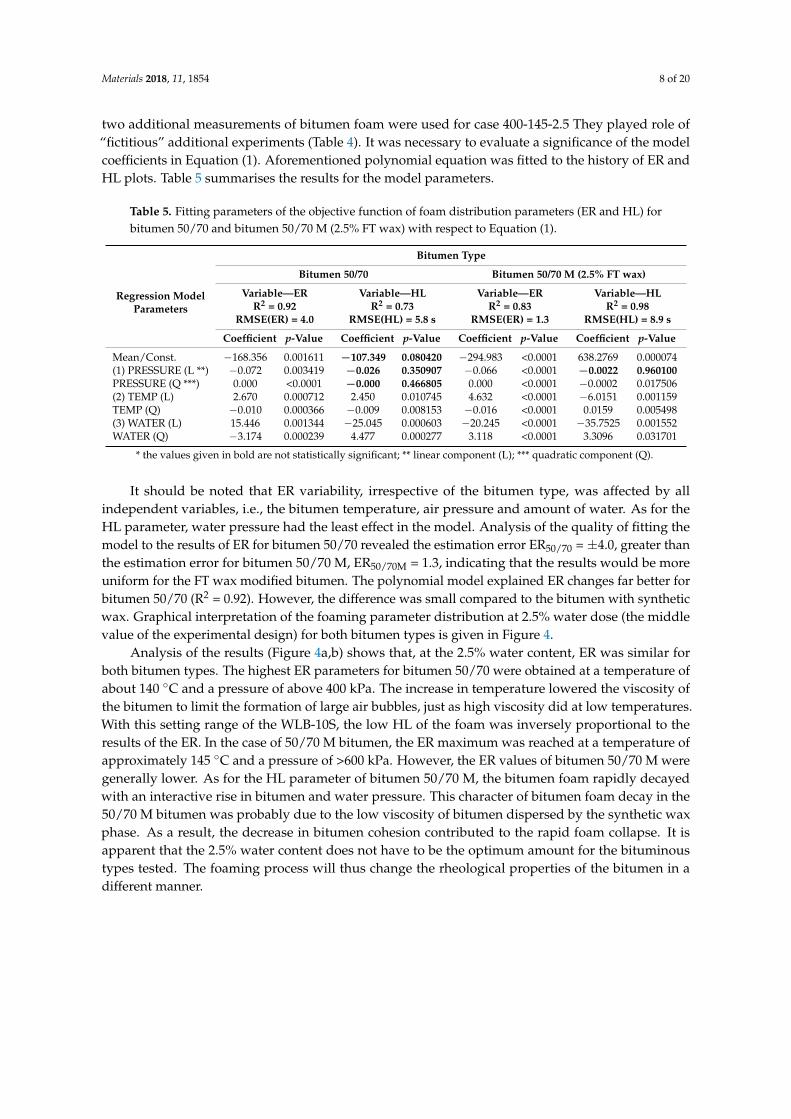
The viscoelastic nature of the bitumen foam was determined by measuring the complex shearmodulus G* and the phase shift angle δ in the frequency range 0.01–10 Hz and for temperatures of40 ◦C and 60 ◦C. The Black curve makes the representation of the results combining frequency andtemperature that allows the comparison of the viscoelastic nature of various bitumens. Figure 5 showsthe Black curves for bitumens 50/70 and 50/70 M with different combinations of bitumen foamingprogrammes, and with non-foamed reference bitumens.
The phase shift angle is considered more sensitive to chemical changes in bitumen [31]. The resultsof the Black curve analysis for bitumen 50/70 revealed a slight shift in the results of the G* after thefoaming process towards the higher phase angle values (Figure 5a) relative to the reference bitumen.This behaviour of the bitumen after the foaming process illustrates the increase in dominance of theimaginary component G” over the real component G’. The Black curve shifted also with respect tothe vertical axis and was related to the increase in the value of the complex modulus G* after foamingrelative to the reference bitumen. Such a change in the rheological nature of the bitumen after foamingindicates chemical changes in the bitumen, caused by oxidation in the bitumen ageing process [31,32].Only the 100-110-1 variant of bitumen foaming gained a slightly more viscous character than thereference bitumen. This may be related to the large number of small air bubbles in the bitumen which,at the stress applied, cause a rapid collapse of the bitumen structure and its yielding. The presence of
Materials 2018, 11, 1854 10 of 20
entrapped air bubbles probably was also responsible for the predominance of the viscous part in theabsolute value of the complex stiffness modulus, which, in turn, could accelerate the accumulation inirreversible deformations that could arise as a result of cyclic loading in the layer made with foamedbitumen. This is because the high level of G” affects the increase in amount of dissipated energy in oneloading cycle [1].Materials 2018, 11, x FOR PEER REVIEW 10 of 20
(a) (b)
Figure 5. Black curve based on the data determined at 40 °C and 60 °C: (a) bitumen 50/70; and (b) bitumen 50/70 M.
The phase shift angle is considered more sensitive to chemical changes in bitumen [31]. The results of the Black curve analysis for bitumen 50/70 revealed a slight shift in the results of the G* after the foaming process towards the higher phase angle values (Figure 5a) relative to the reference bitumen. This behaviour of the bitumen after the foaming process illustrates the increase in dominance of the imaginary component G’’ over the real component G’. The Black curve shifted also with respect to the vertical axis and was related to the increase in the value of the complex modulus G* after foaming relative to the reference bitumen. Such a change in the rheological nature of the bitumen after foaming indicates chemical changes in the bitumen, caused by oxidation in the bitumen ageing process [31,32]. Only the 100-110-1 variant of bitumen foaming gained a slightly more viscous character than the reference bitumen. This may be related to the large number of small air bubbles in the bitumen which, at the stress applied, cause a rapid collapse of the bitumen structure and its yielding. The presence of entrapped air bubbles probably was also responsible for the predominance of the viscous part in the absolute value of the complex stiffness modulus, which, in turn, could accelerate the accumulation in irreversible deformations that could arise as a result of cyclic loading in the layer made with foamed bitumen. This is because the high level of G” affects the increase in amount of dissipated energy in one loading cycle [1].
The Black curve plots for the modified material, 50/70 M, are slightly different from those of bitumen 50/70. The use of synthetic wax in the bitumen after the foaming process resulted in the shift of the foamed bitumen Black curves even further towards the smaller values of the phase angle. It can be seen that, for the curve range of high temperatures, in some cases of foamed bitumens have a lower phase angle compared to the reference bitumen (Figure 5b). This is attributed to the presence of synthetic wax crystallites in the bitumen, increasing the molecular weight and imparting a more elastic character to the bitumen, particularly at high service temperatures, in this case at 60 °C. As a result, the presence of FT wax could compensate a loss in elasticity of the bitumen after foaming caused by presence of entrapped air in bitumen. This characteristic can be particularly beneficial in mixtures produced by deep-cold recycling. For the intermediate frequency/temperature range, the curves fluctuate compared to the reference bitumen curve. Bitumen foams produced at low water pressures usually achieve lower values of complex shear modulus, whereas high temperatures promote its increase in the 50/70 M bitumen. Nevertheless, the discrepancy between the Black curve plots of foamed and reference bitumens can be attributed to entrapped air (amount of noncollapsed bubbles), presence of wax crystallites and chemical changes occurring in FT wax modified bitumen during foaming. It should also be noted that the presence of synthetic wax alters the rheological character of the bitumen to be considerably more elastic—this characteristic is more pronounced than in the foamed 50/70 bitumen.
Figure 5. Black curve based on the data determined at 40 ◦C and 60 ◦C: (a) bitumen 50/70; and(b) bitumen 50/70 M.
The Black curve plots for the modified material, 50/70 M, are slightly different from those ofbitumen 50/70. The use of synthetic wax in the bitumen after the foaming process resulted in theshift of the foamed bitumen Black curves even further towards the smaller values of the phase angle.It can be seen that, for the curve range of high temperatures, in some cases of foamed bitumens have alower phase angle compared to the reference bitumen (Figure 5b). This is attributed to the presence ofsynthetic wax crystallites in the bitumen, increasing the molecular weight and imparting a more elasticcharacter to the bitumen, particularly at high service temperatures, in this case at 60 ◦C. As a result,the presence of FT wax could compensate a loss in elasticity of the bitumen after foaming caused bypresence of entrapped air in bitumen. This characteristic can be particularly beneficial in mixturesproduced by deep-cold recycling. For the intermediate frequency/temperature range, the curvesfluctuate compared to the reference bitumen curve. Bitumen foams produced at low water pressuresusually achieve lower values of complex shear modulus, whereas high temperatures promote itsincrease in the 50/70 M bitumen. Nevertheless, the discrepancy between the Black curve plots offoamed and reference bitumens can be attributed to entrapped air (amount of noncollapsed bubbles),presence of wax crystallites and chemical changes occurring in FT wax modified bitumen duringfoaming. It should also be noted that the presence of synthetic wax alters the rheological characterof the bitumen to be considerably more elastic—this characteristic is more pronounced than in thefoamed 50/70 bitumen.
4.2. Effect of Foaming on Stiffness Modulus G*/sin(δ)
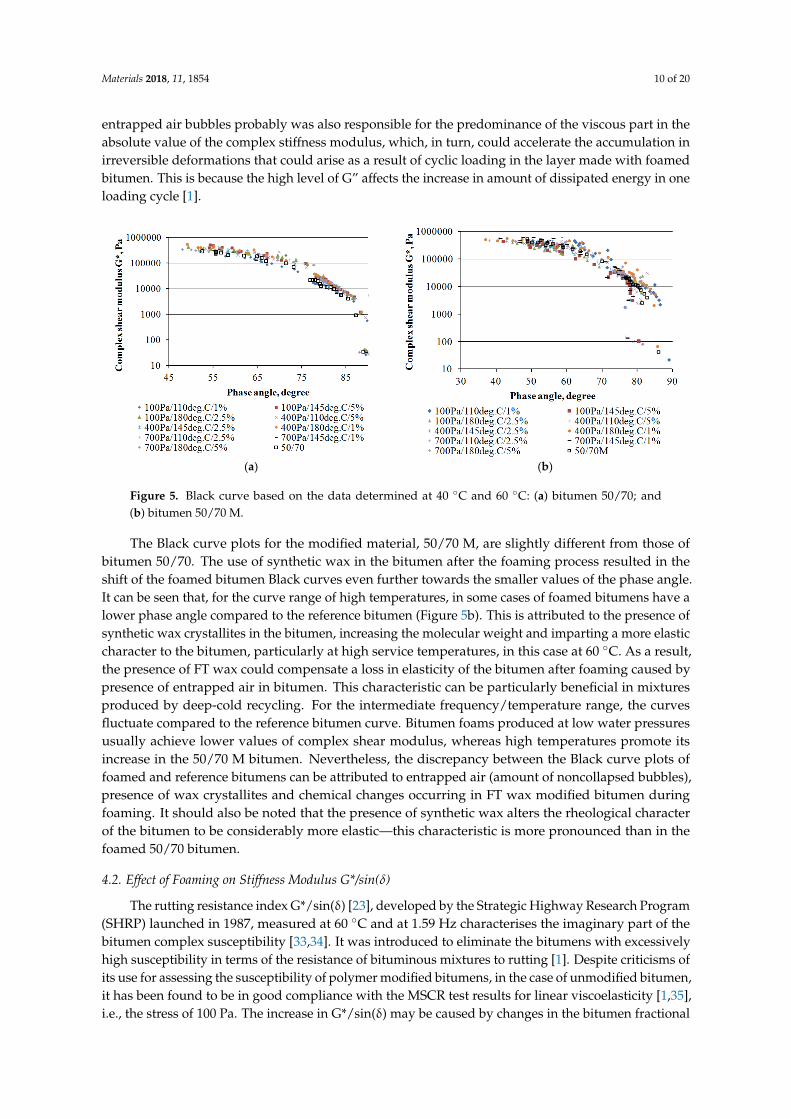
The rutting resistance index G*/sin(δ) [23], developed by the Strategic Highway Research Program(SHRP) launched in 1987, measured at 60 ◦C and at 1.59 Hz characterises the imaginary part of thebitumen complex susceptibility [33,34]. It was introduced to eliminate the bitumens with excessivelyhigh susceptibility in terms of the resistance of bituminous mixtures to rutting [1]. Despite criticisms ofits use for assessing the susceptibility of polymer modified bitumens, in the case of unmodified bitumen,it has been found to be in good compliance with the MSCR test results for linear viscoelasticity [1,35],i.e., the stress of 100 Pa. The increase in G*/sin(δ) may be caused by changes in the bitumen fractional

Materials 2018, 11, 1854 11 of 20
composition due to the aromatic hydrocarbon condensation process during ageing as well as due tothe crystallisation of synthetic wax. As in the previous section, the results of the calculated G*/sin(δ)parameter were approximated with respect to the adopted experimental design, as shown on the boxplot diagram in Figure 6.
Materials 2018, 11, x FOR PEER REVIEW 11 of 20
4.2. Effect of Foaming on Stiffness Modulus G*/sin(δ)
The rutting resistance index G*/sin(δ) [23], developed by the Strategic Highway Research Program (SHRP) launched in 1987, measured at 60 °C and at 1.59 Hz characterises the imaginary part of the bitumen complex susceptibility [33,34]. It was introduced to eliminate the bitumens with excessively high susceptibility in terms of the resistance of bituminous mixtures to rutting [1]. Despite criticisms of its use for assessing the susceptibility of polymer modified bitumens, in the case of unmodified bitumen, it has been found to be in good compliance with the MSCR test results for linear viscoelasticity [1,35], i.e., the stress of 100 Pa. The increase in G*/sin(δ) may be caused by changes in the bitumen fractional composition due to the aromatic hydrocarbon condensation process during ageing as well as due to the crystallisation of synthetic wax. As in the previous section, the results of the calculated G*/sin(δ) parameter were approximated with respect to the adopted experimental design, as shown on the box plot diagram in Figure 6.
Figure 6. Box plot for G*/sin(δ) and the elastic component of the complex modulus at frequency 1.59 Hz at 60 °C.
Analysis of the population (Figure 6) clearly indicates that the increase in G*/sin(δ) for bitumen 50/70 M after foaming compared to bitumen 50/70 is much more dynamic. The median of the unmodified foamed bitumen results is near the level of G*/sin (δ) with respect to bitumen 50/70.
Nearly all 50/70 M bitumen results are higher than those of non-foamed bitumen. The distance between the median of the results distribution and the G*/sin(δ) value are significant. Moreover, comparing the median result, the level for 50/70 M is higher than for 50/70. Kruskal–Wallis nonparametric tests show a significant difference in the assessment of the average G*/sin(δ) value, depending on the bitumen type tested. A similar significant difference was observed for the average value of elastic component, G’, of the complex modulus. FT wax crystallites present in the bitumen are responsible for the increase in the elasticity of the tested bitumens [36]. The marked G*/sin(δ) limits determined by [15] indicate that at the test temperature of 60 °C, common under Polish conditions in summer months, rutting will be significantly limited in all bitumen types tested.
On the other hand, this significant increase in bitumen stiffness at service temperatures will contribute to higher brittleness of the bitumen at low temperatures and high critical temperature (fatigue) defined by G*x sin(δ) < 5000 Pa. In addition, this bitumen stiffness will noticeably affect the stiffness of low temperature and recycled bituminous mixtures [37]. The lowest value not distant from other observations in the quartile distribution with respect to the G*/sin (δ) parameter was reached by the case denoted as 100-110-1 (pressure, Pa; foaming temperature, °C; water content, %). Regardless of the bitumen type of bitumen, the G*/sin(δ) parameter was lower than the base bitumen.
Figure 6. Box plot for G*/sin(δ) and the elastic component of the complex modulus at frequency1.59 Hz at 60 ◦C.
Analysis of the population (Figure 6) clearly indicates that the increase in G*/sin(δ) for bitumen50/70 M after foaming compared to bitumen 50/70 is much more dynamic. The median of theunmodified foamed bitumen results is near the level of G*/sin (δ) with respect to bitumen 50/70.
Nearly all 50/70 M bitumen results are higher than those of non-foamed bitumen. The distancebetween the median of the results distribution and the G*/sin(δ) value are significant. Moreover,comparing the median result, the level for 50/70 M is higher than for 50/70. Kruskal–Wallisnonparametric tests show a significant difference in the assessment of the average G*/sin(δ) value,depending on the bitumen type tested. A similar significant difference was observed for the averagevalue of elastic component, G’, of the complex modulus. FT wax crystallites present in the bitumen areresponsible for the increase in the elasticity of the tested bitumens [36]. The marked G*/sin(δ) limitsdetermined by [15] indicate that at the test temperature of 60 ◦C, common under Polish conditions insummer months, rutting will be significantly limited in all bitumen types tested.
On the other hand, this significant increase in bitumen stiffness at service temperatures willcontribute to higher brittleness of the bitumen at low temperatures and high critical temperature(fatigue) defined by G* × sin(δ) < 5000 Pa. In addition, this bitumen stiffness will noticeably affectthe stiffness of low temperature and recycled bituminous mixtures [37]. The lowest value not distantfrom other observations in the quartile distribution with respect to the G*/sin (δ) parameter wasreached by the case denoted as 100-110-1 (pressure, Pa; foaming temperature, ◦C; water content, %).Regardless of the bitumen type of bitumen, the G*/sin(δ) parameter was lower than the base bitumen.This is an interesting observation because the resulting bitumen stiffness is lower than that of the basebitumen. This singularity was noticed during the analysis of the Black curves. The trapped air in theform of bitumen bubbles and the marginal effect of ageing could affect the bitumen yielding in anybitumen type. A wider discussion of this singularity will be presented when analysing the results ofthe bitumen hardening index.

Materials 2018, 11, 1854 12 of 20
As in the case of foam distribution analysis, also in the case of G*/sin(δ) parameter evaluation,its parameters were described by the regression model adopted in the experimental design. The resultsof the adjustment of experimental parameters are shown in Table 6.
Table 6. Fitting parameters of the objective function of G*/sin(δ) for bitumen 50/70 and 50/70 M(2.5% FT wax).
Regression ModelParameters
Bitumen Type
Bitumen 50/70 Bitumen 50/70 M (2.5% FT Wax)
Regression CoefficientsR2 = 0.72
RMSE(G*/sin(δ)) = 137.3 Pa
Regression CoefficientsR2 = 0.99
RMSE(G*/sin(δ)) = 128.3 Pa
Coefficient p-Value Coefficient p-Value
Mean/Const. −935.887 ** 0.823416 ** −18160.0 0.000000(1) PRESSURE (L) 5.165 0.024038 8.8 0.000000PRESSURE (Q) −0.004 ** 0.134533 ** −0.001 0.000132(2) TEMP (L) 61.657 ** 0.305960 ** 214.8 0.000001TEMP (Q) −0.220 0.0485013 −0.5 0.000022(3) WATER (L) −177.080 ** 0.637377 ** 3270.2 0.000000WATER (Q) 24.229 ** 0.686761 ** −432.0 0.000000
** the values given in bold are not statistically significant.
The analysis of fitting the G*/sin(δ) distribution to the objective function model assumed inthe experiment shows a good fit for bitumen 50/70 M. The explanation of the G*/sin(δ) parametervariability is 99% with an average estimation error (RMSE) of ±128.3 Pa. All parameters turnedout to be significant. A high sensitivity of G*/sin (δ) to slight changes in the setting of the foamingdevice was confirmed. As for bitumen 50/70, the model explains only 72% of the variability of thisparameter. The error of estimation, ±137.3 Pa was not significantly greater than that for the modifiedbitumen. In the case of unmodified bitumen, 50/70, only the linear coefficient for water pressureand the non-linear temperature coefficient were found to be significant. The remaining cases werestatistically insignificant. This result clearly indicates the slight sensitivity of G*/sin(δ) due to the50/70 bitumen foaming process compared to the 50/70 M bitumen. This conclusion is supported bythe analysis in Figure 6. Graphical representation of the G*/sin(δ) distribution is shown in Figure 7.
Materials 2018, 11, x FOR PEER REVIEW 12 of 20
This is an interesting observation because the resulting bitumen stiffness is lower than that of the base bitumen. This singularity was noticed during the analysis of the Black curves. The trapped air in the form of bitumen bubbles and the marginal effect of ageing could affect the bitumen yielding in any bitumen type. A wider discussion of this singularity will be presented when analysing the results of the bitumen hardening index.
As in the case of foam distribution analysis, also in the case of G*/sin(δ) parameter evaluation, its parameters were described by the regression model adopted in the experimental design. The results of the adjustment of experimental parameters are shown in Table 6.
Table 6. Fitting parameters of the objective function of G*/sin(δ) for bitumen 50/70 and 50/70 M (2.5% FT wax).
Regression Model Parameters
Bitumen Type Bitumen 50/70 Bitumen 50/70 M (2.5% FT Wax)
Regression Coefficients R2 = 0.72
RMSE(G*/sin(δ)) = 137.3 Pa
Regression Coefficients R2 = 0.99
RMSE(G*/sin(δ)) = 128.3 Pa Coefficient p-Value Coefficient p-Value
Mean/Const. −935.887 ** 0.823416 ** −18160.0 0.000000 (1) PRESSURE (L) 5.165 0.024038 8.8 0.000000 PRESSURE (Q) −0.004 ** 0.134533 ** −0.001 0.000132 (2) TEMP (L) 61.657 ** 0.305960 ** 214.8 0.000001 TEMP (Q) −0.220 0.0485013 −0.5 0.000022 (3) WATER (L) −177.080 ** 0.637377 ** 3270.2 0.000000 WATER (Q) 24.229 ** 0.686761 ** −432.0 0.000000
** the values given in bold are not statistically significant.
The analysis of fitting the G*/sin(δ) distribution to the objective function model assumed in the experiment shows a good fit for bitumen 50/70 M. The explanation of the G*/sin(δ) parameter variability is 99% with an average estimation error (RMSE) of ± 128.3 Pa. All parameters turned out to be significant. A high sensitivity of G*/sin (δ) to slight changes in the setting of the foaming device was confirmed. As for bitumen 50/70, the model explains only 72% of the variability of this parameter. The error of estimation, ±137.3 Pa was not significantly greater than that for the modified bitumen. In the case of unmodified bitumen, 50/70, only the linear coefficient for water pressure and the non-linear temperature coefficient were found to be significant. The remaining cases were statistically insignificant. This result clearly indicates the slight sensitivity of G*/sin(δ) due to the 50/70 bitumen foaming process compared to the 50/70 M bitumen. This conclusion is supported by the analysis in Figure 6. Graphical representation of the G*/sin(δ) distribution is shown in Figure 7.
(a) (b)
Figure 7. Response surface of G*/sin(δ)at the 2.5% water content: (a) bitumen 50/70; and (b) bitumen50/70 M.
The response surfaces shown in Figure 6 indicate that the value of G*/sin(δ) is not significantlychanged in the bitumen 50/70 at pressure above 600 Pa, temperatures above 140 ◦C and 2.5% water

Materials 2018, 11, 1854 13 of 20
quantity. With doubtful p-value for the non-linear coefficient of temperature, the temperature effect canbe assumed to be negligible and may have a constant value for the specified range. For the 50/70 Mbitumen, temperature and pressure increase results in improved foaming parameters (Table 6) and astatistically significant increase in G*/sin(δ), leading to increased stiffness of the 50/70 M bitumen.
4.3. Effect of Foaming on the Ageing Index (IS)
The observation about excessive increase in bitumen stiffness during the foaming process,probably due to bitumen ageing, was supplemented by an analysis of the dynamic viscosity parameter.Its results were used to determine the ageing index. Dynamic viscosity was determined according toSection 2.3 for bitumen before and after foaming. The dynamic viscosity results were compared withthe results of zero shear viscosity, ηZSV. The results of G*/sin(δ) were added to the scale, as shown inFigure 8. All tests were performed at 60 ◦C.
Materials 2018, 11, x FOR PEER REVIEW 13 of 20
Figure 7. Response surface of G*/sin(δ)at the 2.5% water content: (a) bitumen 50/70; and (b) bitumen 50/70 M.
The response surfaces shown in Figure 6 indicate that the value of G*/sin(δ) is not significantly changed in the bitumen 50/70 at pressure above 600 Pa, temperatures above 140 °C and 2.5% water quantity. With doubtful p-value for the non-linear coefficient of temperature, the temperature effect can be assumed to be negligible and may have a constant value for the specified range. For the 50/70 M bitumen, temperature and pressure increase results in improved foaming parameters (Table 6) and a statistically significant increase in G*/sin(δ), leading to increased stiffness of the 50/70 M bitumen.
4.3. Effect of Foaming on the Ageing Index (IS)
The observation about excessive increase in bitumen stiffness during the foaming process, probably due to bitumen ageing, was supplemented by an analysis of the dynamic viscosity parameter. Its results were used to determine the ageing index. Dynamic viscosity was determined according to Section 2.3 for bitumen before and after foaming. The dynamic viscosity results were compared with the results of zero shear viscosity, ηZSV. The results of G*/sin(δ) were added to the scale, as shown in Figure 8. All tests were performed at 60 °C.
Figure 8. Foaming process (mean values) influence on the dynamic viscosity η, zero shear viscosity ηZSV and G*/sin(δ) at 60 °C.
Analysis of the viscosity results and the difference between dynamic viscosity (Newtonian viscosity state II) and zero shear viscosity (Newtonian viscosity state I) indicates that the dynamic viscosity difference in the Newtonian states in 50/70 is smaller than in 50/70 M. The minor difference observed indicates that the viscosity measurement temperature is close to that of the bitumen behaving like a viscous liquid. A slight increase in the dynamic viscosity and G*/sin(δ) at 60 °C relative to the reference bitumen 50/70 is a proof that bitumen after foaming is affected by ageing. In bitumen 50/70 M, the difference between dynamic and zero shear viscosities is noticeably greater, which suggests a more non-Newtonian character of 50/70 M bitumen, with a strong influence of synthetic wax crystallites on viscosity increase in intact state. However, the proportions of differences between viscosity states in terms of values were roughly the same. This result can be attributed to the presence of synthetic wax crystallites. The difference increases with increasing foaming temperature (50/70 M) and with increasing amount of water used in the foaming process. Similarly, in the process
Figure 8. Foaming process (mean values) influence on the dynamic viscosity η, zero shear viscosityηZSV and G*/sin(δ) at 60 ◦C.
Analysis of the viscosity results and the difference between dynamic viscosity (Newtonianviscosity state II) and zero shear viscosity (Newtonian viscosity state I) indicates that the dynamicviscosity difference in the Newtonian states in 50/70 is smaller than in 50/70 M. The minor differenceobserved indicates that the viscosity measurement temperature is close to that of the bitumen behavinglike a viscous liquid. A slight increase in the dynamic viscosity and G*/sin(δ) at 60 ◦C relative tothe reference bitumen 50/70 is a proof that bitumen after foaming is affected by ageing. In bitumen50/70 M, the difference between dynamic and zero shear viscosities is noticeably greater, whichsuggests a more non-Newtonian character of 50/70 M bitumen, with a strong influence of syntheticwax crystallites on viscosity increase in intact state. However, the proportions of differences betweenviscosity states in terms of values were roughly the same. This result can be attributed to the presenceof synthetic wax crystallites. The difference increases with increasing foaming temperature (50/70 M)and with increasing amount of water used in the foaming process. Similarly, in the process of bitumenproduction, excessive temperature of crude oil distillation in the presence of water also causes a rapidincrease in stiffness through the evaporation of bitumen oils [2]. Therefore, the factors responsible forthe overall difference between the dynamic viscosity states of bitumen 50/70 M after foaming werethe bitumen ageing process and the presence of FT wax crystallites. Note that the phase transition
Materials 2018, 11, 1854 14 of 20
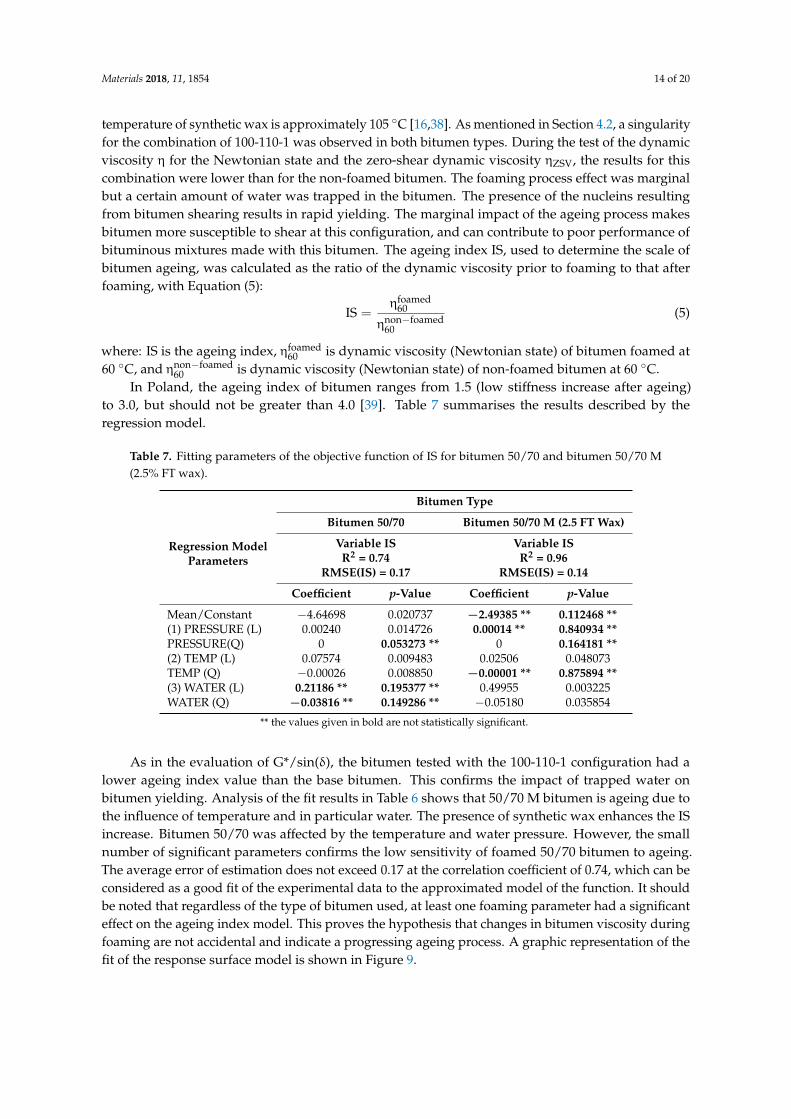
temperature of synthetic wax is approximately 105 ◦C [16,38]. As mentioned in Section 4.2, a singularityfor the combination of 100-110-1 was observed in both bitumen types. During the test of the dynamicviscosity η for the Newtonian state and the zero-shear dynamic viscosity ηZSV, the results for thiscombination were lower than for the non-foamed bitumen. The foaming process effect was marginalbut a certain amount of water was trapped in the bitumen. The presence of the nucleins resultingfrom bitumen shearing results in rapid yielding. The marginal impact of the ageing process makesbitumen more susceptible to shear at this configuration, and can contribute to poor performance ofbituminous mixtures made with this bitumen. The ageing index IS, used to determine the scale ofbitumen ageing, was calculated as the ratio of the dynamic viscosity prior to foaming to that afterfoaming, with Equation (5):
IS =ηfoamed
60
ηnon−foamed60
(5)
where: IS is the ageing index, ηfoamed60 is dynamic viscosity (Newtonian state) of bitumen foamed at
60 ◦C, and ηnon−foamed60 is dynamic viscosity (Newtonian state) of non-foamed bitumen at 60 ◦C.
In Poland, the ageing index of bitumen ranges from 1.5 (low stiffness increase after ageing)to 3.0, but should not be greater than 4.0 [39]. Table 7 summarises the results described by theregression model.
Table 7. Fitting parameters of the objective function of IS for bitumen 50/70 and bitumen 50/70 M(2.5% FT wax).
Regression ModelParameters
Bitumen Type
Bitumen 50/70 Bitumen 50/70 M (2.5 FT Wax)
Variable ISR2 = 0.74
RMSE(IS) = 0.17
Variable ISR2 = 0.96
RMSE(IS) = 0.14
Coefficient p-Value Coefficient p-Value
Mean/Constant −4.64698 0.020737 −2.49385 ** 0.112468 **(1) PRESSURE (L) 0.00240 0.014726 0.00014 ** 0.840934 **PRESSURE(Q) 0 0.053273 ** 0 0.164181 **(2) TEMP (L) 0.07574 0.009483 0.02506 0.048073TEMP (Q) −0.00026 0.008850 −0.00001 ** 0.875894 **(3) WATER (L) 0.21186 ** 0.195377 ** 0.49955 0.003225WATER (Q) −0.03816 ** 0.149286 ** −0.05180 0.035854
** the values given in bold are not statistically significant.
As in the evaluation of G*/sin(δ), the bitumen tested with the 100-110-1 configuration had alower ageing index value than the base bitumen. This confirms the impact of trapped water onbitumen yielding. Analysis of the fit results in Table 6 shows that 50/70 M bitumen is ageing due tothe influence of temperature and in particular water. The presence of synthetic wax enhances the ISincrease. Bitumen 50/70 was affected by the temperature and water pressure. However, the smallnumber of significant parameters confirms the low sensitivity of foamed 50/70 bitumen to ageing.The average error of estimation does not exceed 0.17 at the correlation coefficient of 0.74, which can beconsidered as a good fit of the experimental data to the approximated model of the function. It shouldbe noted that regardless of the type of bitumen used, at least one foaming parameter had a significanteffect on the ageing index model. This proves the hypothesis that changes in bitumen viscosity duringfoaming are not accidental and indicate a progressing ageing process. A graphic representation of thefit of the response surface model is shown in Figure 9.

Materials 2018, 11, 1854 15 of 20Materials 2018, 11, x FOR PEER REVIEW 15 of 20
(a) (b)
Figure 9. Response surface of the ageing index IS at 2.5% water: (a) bitumen 50/70; and (b) bitumen 50/70 M.
The IS results shown in Figure 8 have a similar distribution to that of G*/sin(δ) and confirm the hypothesis that the foaming process significantly alters rheological properties of bituminous material. In this case, high temperature and pressure increase the value of IS in bitumen 50/70 M. With a given amount of water, the bitumen temperature of 180 °C and the pressure of 700 Pa, the ageing index reached the value close to 4.0. For bitumen 50/70, the IS variability is lower than that of 50/70 M and reaches a maximum of 1.79 for the 547-145-2.8 configuration. It should be noted that the variation in the hardness index for bitumen 50/70 is small compared to 50/70 M. The presence of synthetic wax intensifies the increase in the IS value. Based on these observations, consideration should be given to including the ageing phenomenon as a factor in the selection of bitumens for foaming. It is important to find the optimal settings of the WLB-10S with regard to the distribution of foaming parameters and to analyse rheological performance characteristics. The results of these analyses are of key importance for the technological process during which foaming parameters determine adequate aggregate coating while maintaining the appropriate stiffness needed for the durability of pavement layers.
5. Optimisation Process
Results for foaming confirm the observations reported in the literature that the correlation between the ER and HL parameters is not determined conclusively [7,40]. The bitumen rheological properties, i.e., dynamic viscosity and stiffness modulus, change during foaming. This makes it unclear where the optimum of foaming parameters is, because, for example, the settings at which high quality bitumen foam can be obtained coincide with a change in bitumen stiffness. To resolve the problem of how to obtain the maximum efficiency of foaming, the optimisation process was applied to simultaneously maximise input data by maximising the utility function. The optimisation function, which is in fact the geometric mean of partial utilities, was used based on the utility profiles. Detailed theoretical information can be found in [25,26,41]. First, it was necessary to determine the utility profile, which transforms each target variable to a value from the range <0;1>, thus expressing satisfaction with the result obtained at a given level. In fact, there is a range of acceptable values for the target variable. The analysis used a linear utility profile between the lowest and highest satisfaction with the results. The example profile for the IS variable is shown in Figure 10.
Figure 9. Response surface of the ageing index IS at 2.5% water: (a) bitumen 50/70; and (b) bitumen50/70 M.
The IS results shown in Figure 8 have a similar distribution to that of G*/sin(δ) and confirm thehypothesis that the foaming process significantly alters rheological properties of bituminous material.In this case, high temperature and pressure increase the value of IS in bitumen 50/70 M. With a givenamount of water, the bitumen temperature of 180 ◦C and the pressure of 700 Pa, the ageing indexreached the value close to 4.0. For bitumen 50/70, the IS variability is lower than that of 50/70 M andreaches a maximum of 1.79 for the 547-145-2.8 configuration. It should be noted that the variation inthe hardness index for bitumen 50/70 is small compared to 50/70 M. The presence of synthetic waxintensifies the increase in the IS value. Based on these observations, consideration should be given toincluding the ageing phenomenon as a factor in the selection of bitumens for foaming. It is importantto find the optimal settings of the WLB-10S with regard to the distribution of foaming parameters andto analyse rheological performance characteristics. The results of these analyses are of key importancefor the technological process during which foaming parameters determine adequate aggregate coatingwhile maintaining the appropriate stiffness needed for the durability of pavement layers.
5. Optimisation Process
Results for foaming confirm the observations reported in the literature that the correlation betweenthe ER and HL parameters is not determined conclusively [7,40]. The bitumen rheological properties,i.e., dynamic viscosity and stiffness modulus, change during foaming. This makes it unclear where theoptimum of foaming parameters is, because, for example, the settings at which high quality bitumenfoam can be obtained coincide with a change in bitumen stiffness. To resolve the problem of how toobtain the maximum efficiency of foaming, the optimisation process was applied to simultaneouslymaximise input data by maximising the utility function. The optimisation function, which is in factthe geometric mean of partial utilities, was used based on the utility profiles. Detailed theoreticalinformation can be found in [25,26,41]. First, it was necessary to determine the utility profile, whichtransforms each target variable to a value from the range <0;1>, thus expressing satisfaction with theresult obtained at a given level. In fact, there is a range of acceptable values for the target variable.The analysis used a linear utility profile between the lowest and highest satisfaction with the results.The example profile for the IS variable is shown in Figure 10.
Optimisation has an infinite number of solutions. The desirable result is determined by theadopted criteria. Table 8 summarises target variable ranges required for establishing utility profileranges and gives relevant literature references.

Materials 2018, 11, 1854 16 of 20Materials 2018, 11, x FOR PEER REVIEW 16 of 20
Figure 10. Example of a utility profile based on the ageing index IS.
Optimisation has an infinite number of solutions. The desirable result is determined by the adopted criteria. Table 8 summarises target variable ranges required for establishing utility profile ranges and gives relevant literature references.
Table 8. Limiting ranges of utility profiles.
Level ER HL, s G*/sin(δ), Pa IS Low (0) <8 [4,40,42] ≤12 [4,43,44] <2200 [34,35] ≥4 [39] High (1) >15 [4,45] ≥45 [4,45] ≥2200 [34,35] <1.5 [39]
The main goal of the optimisation was to find a combination of the WLB-10S settings with which the value of the generalised utility function would be about 0.5. This value would guarantee a moderately satisfactory result with all the requirements met (Table 8). The profiles of approximated solutions search with utility profiles accounted for, in the Statistica package, are shown in Figure 11.
(a) (b)
Figure 11. Optimisation outcomes: (a) bitumen 50/70; and (b) bitumen 50/70 M (2.5% FT wax).
The search for the optimal solution for a utility function of about 0.5 was performed using the simplex method. With regard to bitumen 50/70, the 400-145-2.5 configuration is the optimum configuration of foaming parameters assuming that the requirements for the foam quality distribution parameters and the ageing index are met. Considering the utility profiles obtained, more water, up to 3.0%, can be used. This will, however, increase the ageing index. Obtaining the optimum
Figure 10. Example of a utility profile based on the ageing index IS.
Table 8. Limiting ranges of utility profiles.
Level ER HL, s G*/sin(δ), Pa IS
Low (0) <8 [4,40,42] ≤12 [4,43,44] <2200 [34,35] ≥4 [39]High (1) >15 [4,45] ≥45 [4,45] ≥2200 [34,35] <1.5 [39]
The main goal of the optimisation was to find a combination of the WLB-10S settings withwhich the value of the generalised utility function would be about 0.5. This value would guarantee amoderately satisfactory result with all the requirements met (Table 8). The profiles of approximatedsolutions search with utility profiles accounted for, in the Statistica package, are shown in Figure 11.
Materials 2018, 11, x FOR PEER REVIEW 16 of 20
Figure 10. Example of a utility profile based on the ageing index IS.
Optimisation has an infinite number of solutions. The desirable result is determined by the adopted criteria. Table 8 summarises target variable ranges required for establishing utility profile ranges and gives relevant literature references.
Table 8. Limiting ranges of utility profiles.
Level ER HL, s G*/sin(δ), Pa IS Low (0) <8 [4,40,42] ≤12 [4,43,44] <2200 [34,35] ≥4 [39] High (1) >15 [4,45] ≥45 [4,45] ≥2200 [34,35] <1.5 [39]
The main goal of the optimisation was to find a combination of the WLB-10S settings with which the value of the generalised utility function would be about 0.5. This value would guarantee a moderately satisfactory result with all the requirements met (Table 8). The profiles of approximated solutions search with utility profiles accounted for, in the Statistica package, are shown in Figure 11.
(a) (b)
Figure 11. Optimisation outcomes: (a) bitumen 50/70; and (b) bitumen 50/70 M (2.5% FT wax).
The search for the optimal solution for a utility function of about 0.5 was performed using the simplex method. With regard to bitumen 50/70, the 400-145-2.5 configuration is the optimum configuration of foaming parameters assuming that the requirements for the foam quality distribution parameters and the ageing index are met. Considering the utility profiles obtained, more water, up to 3.0%, can be used. This will, however, increase the ageing index. Obtaining the optimum
Figure 11. Optimisation outcomes: (a) bitumen 50/70; and (b) bitumen 50/70 M (2.5% FT wax).
The search for the optimal solution for a utility function of about 0.5 was performed usingthe simplex method. With regard to bitumen 50/70, the 400-145-2.5 configuration is the optimumconfiguration of foaming parameters assuming that the requirements for the foam quality distributionparameters and the ageing index are met. Considering the utility profiles obtained, more water, up to3.0%, can be used. This will, however, increase the ageing index. Obtaining the optimum for bitumen50/70 M with 2.5% synthetic wax is burdened with lower tolerance and a moderately satisfactory

Materials 2018, 11, 1854 17 of 20
result is possible at a temperature 10 ◦C lower than in bitumen 50/70. As an optimal solution, it isunderstood to achieve average and acceptable bitumen foam performance (desirability function equalto 0.5). The optimal configuration of the foaming process parameters is 400-135-2.5. This will be ofgreat importance from the perspective of technological processes of bituminous mix manufacture withsuch bitumen. It should be noted that the change in bitumen composition is very important from theperspective of bitumen rheological properties and rheology if the bitumen foam. Regardless of thetype of bitumen, the increase in water volume and temperature at high pressures results in increasedER leading to rapid bitumen ageing and a reduction in the HL of the foam. Table 9 compiles the resultsobtained with the established optimal settings of the laboratory-scale bitumen foamed plant.
Table 9. Comparison of bitumen foam optimisation results with regard to the DOE.
ParameterBitumen Type
Bitumen 50/70 Bitumen 50/70 M
Optimisation Outcome 400 kPa-145 ◦C-2.5% 400 kPa-135 ◦C-2.5%
ER 25.3 9.6HL, s 14.1 21
G*/sin(δ), Pa 4533 10108IS 1.7 1.9
From the characteristics of the tested bitumens shown in Table 9, it follows that bitumen50/70 reached better and higher ER values than bitumen 50/70 M. The ageing factor is comparable inboth bitumen types. Bitumen 50/70 M had the ER value higher than minimum with a considerablyhigher HL, indicating a more stable foam in this bitumen. Despite lower ER, G*/sin(δ) in bitumen50/70 M was 2.23 times that of bitumen 50/70. Considering the effect of bitumen 50/70 M incorporatedin H-WMA mixtures in terms of the resistance to permanent deformation, the results are good unlesssevere bitumen ageing is entailed. To increase ER in bitumen 50/70 M, the temperature needs to beincreased with a slight increase in pressure and water amount applied. This will result in bitumenstiffness increase due to ageing and effective HL reduction. This study demonstrates that ageing ofbitumen 50/70 and 50/70 M can be limited with acceptable bitumen properties maintained. Referringto deep cold recycling technology, an increase in bitumen stiffness will also significantly affect thestiffness modulus of the recycled layer, as also mentioned in [37]. As a result, the use of synthetic waxin bitumen 50/70 will ensure that the bitumen foam will have acceptable ER and will be stable, with alonger period in which a potential bituminous mixture will be workable and, ultimately, will havehigher stiffness in service. Nevertheless, this method and optimisation results have some limitations:
• The basic limitation of this method is the lack of validation in terms of reproducibility. However,repeatability results make this method promising and more accurate in comparison with commoncalibrated rod method.
• A 3(3−1) experimental design does not take into account the interaction. Therefore, additionalexplanation of the model variability, coming from interactions, was not possible.
• The model used for determining ER and HL took into consideration only neat bitumen50/70 penetration grade. Certain singularities associated with the foaming process for otherbitumens with a different penetration grade may be omitted. For this reason, more sophisticatedmathematical models would be needed. Such research and analyses are still ongoing.
6. Conclusions
The following conclusions were drawn from the tests for foaming optimisation in the context ofbitumen viscoelastic performance changes:

Materials 2018, 11, 1854 18 of 20
• Digital registration of ER and HL values improves the accuracy of the measurement and minimisesthe impact on the part of operators. The indicative increase in measurement accuracy is six timesthat of the classical approach.
• Comparative analysis of foam distribution function parameters indicates that the presence of FTwax stabilises the foam decay rate over time.
• The G*/sin(δ) parameter is particularly sensitive to bitumen temperature and air pressure changes.Regardless of the bitumen type, G*/sin(δ) increased considerably after foaming, compared to thenon-foamed reference bitumen.
• Significant differences were observed between dynamic viscosity and zero shear viscosity at thetest temperature of 60 ◦C. The largest differences were found in bitumen 50/70 M due to thepresence of crystallites of the synthetic wax.
• The foaming process causes a horizontal shift of the Black curve to lower values of phase angle δ.The same characteristics are exhibited by road bitumen subjected to simulated ageing.
• The significance of the adopted mathematical models of bitumen rheological performanceindicates that foaming strongly affects rheological parameters of the control bitumen.
• Evaluation of the increase in stiffness of the bitumen after foaming, using the ageing index, revealedthat foaming increases bitumen viscosity. This suggests that the foaming process distillates the oilfractions from the bitumen. The process intensifies with increasing temperature, water amountand air pressure.
• A certain singularity was identified in bitumen behaviour for the 100-110-1.0 combination, regardlessof the bitumen type. For a given combination of the foaming apparatus settings, a stiffness declinewas recorded, attributed to the presence of air bubbles in the bitumen, which at the negligibleimpact of ageing caused an increase in bitumen susceptibility to shear.
• The fractional experimental design considerably facilitates the optimisation of foaming parameters.Optimisation in terms of water alone does not guarantee good results. The findings in this studyreveal that the foam distribution changes noticeably also with air pressure and temperaturechange, which may lead to an adjustment of the amount of water during foaming.
• The best foaming parameters for bitumen 50/70 were obtained for the 400-145-2.5 combination.The best combination for bitumen 50/70 M was 400-135-2.5.
• The optimisation results at the adopted utility function level of about 0.5 indicate that bitumen50/70 M had a lower but acceptable expansion compared to bitumen 50/70. Bitumen 50/70 Mhad a longer and more stable foam decay rate and G*/sin(δ) that was 2.23 times higher thanthat for bitumen 50/70. This level of stiffness will have a beneficial effect on the resistance topermanent deformations in the mixtures produced with this bitumen. These results were obtainedfor the low ageing index in the range 1.7–1.9.
Author Contributions: M.I. (20%) corrected some mistakes and commented some test results. G.M. (40%):co-wrote an article, elaborate a device prototype, analyzed data files with preparing necessary macro scripts. P.B.(40%): co-wrote an article, performed experiments and performed some device validation.
Funding: Narodowe Centrum Badan i Rozwoju: TECHMATSTRATEG1/349326/9/NCBR/2017.
Acknowledgments: The research results were developed as part of the project entitled “The innovativetechnology used the binding agent optimization that provides the long service life of the recycled base course”(TECHMATSTRATEG1/349326/9/NCBR/2017) within the scientific undertaking of Strategic Research andDevelopment Program entitled “Modern Materials Technology” (TECHMATSTRATEG I), which is financed bythe National Center for Research and Development (NCBiR).
Conflicts of Interest: The authors declare no conflict of interest.
References
1. Kim, Y.R. Modeling of Asphalt Concrete; ASCE Press: Reston, VA, USA; McGraw-Hill: New York, NY, USA, 2009.2. Stefanczyk, B.; Mieczkowski, S. Mieszanki Mineralno−Asfaltowe: Wykonawstwo i Badania; WKŁ: Warsaw,
Poland, 2009. (In Polish)

Materials 2018, 11, 1854 19 of 20
3. Buczynski, P.; Iwanski, M. Complex modulus change within the linear viscoelastic region of themineral−Cement mixture with foamed bitumen. Constr. Build. Mater. 2018, 172, 52–62. [CrossRef]
4. Hailesilassie, B.W.; Hugener, M.; Partl, M.N. Influence of foaming water content on foam asphalt mixtures.Constr. Build. Mater. 2015, 85, 65–77. [CrossRef]
5. Jenkins, K.J.; de Groot, J.L.A.; van de Ven, M.F.C.; Molenaar, A. Half−warm foamed bitumen treatment,a new process. In Proceedings of the 7th Conference on Asphalt Pavements for Southern Africa,August–September 1999.
6. Chomicz-Kowalska, W.; Gardziejczyk, M.; Iwanski, M. Analysis of IT−CY stiffness modulus of foamedbitumen asphalt concrete compacted at 95 ◦C. Procedia Eng. 2017, 172, 550–559. [CrossRef]
7. Jenkins, K.J. Mix Design Considerations for Cold and Half-Warm Bituminous Mixes with Emphasis onFoamed Bitumen. Ph.D. Thesis, Department of Civil Engineering, Faculty of Engineering, University ofStellenbosch, Stellenbosch, South Africa, 2000.
8. Ozturk, H.I.; Kutay, M.E. Novel Testing Procedure for Assessment of Quality of Foamed Warm Mix AsphaltBinders. J. Mater. Civil Eng. 2014, 26, 04014042. [CrossRef]
9. He, G.; Wong, W. Decay properties of the foamed bitumens. Constr. Build. Mater. 2006, 20, 866–877. [CrossRef]10. Saleh, M. Characterisation of Foam Bitumen Quality and the Mechanical Properties of Foam Stabilised Mixes;
University of Canterbury Research Repository: Christchurch, New Zealand, 2006.11. Woszuk, A.; Zofka, A.; Bandura, L.; Franus, W. Effect of zeolite properties on asphalt foaming.
Constr. Build. Mater. 2017, 139, 247–255. [CrossRef]12. Iwanski, M.; Chomicz-Kowalska, A.; Maciejewski, K. Application of synthetic wax for improvement of
foamed bitumen parameters. Constr. Build. Mater. 2015, 83, 62–69. [CrossRef]13. Brainov, E.N. Formation and properties of bituminous foams. Chem. Technol. Fuels Oils 1990, 26, 544–548.
[CrossRef]14. Martinez-Arguelles, G.; Giustozzi, F.; Crispino, M.; Flintsch, G.W. Investigating physical and rheological
properties of foamed bitumen. Constr. Build. Mater. 2014, 72, 423–433. [CrossRef]15. Standard Specification for Performance-Graded Asphalt Binder; AASHTO M 320-05; American Association of
State Highway and Transportation Officials: Washington, DC, USA, 2005.16. Jamshidi, A.; Hamzah, M.O.; You, Z. Performance of Warm Mix Asphalt containing Sasobit®: State-of-the-art.
Constr. Build. Mater. 2013, 38, 530–553. [CrossRef]17. Iwanski, M.; Mazurek, G. Structuring role of F−T synthetic wax in bitumen. Bull. Pol. Acad. Sci. Tech. Sci.
2014, 62, 525–534. [CrossRef]18. Iwanski, M.; Mazurek, G. Optimization of the Synthetic Wax Content on Example of Bitumen 35/50. Procedia
Eng. 2013, 57, 414–423.19. Sunarjono, S. The Infuence of Foamed Bitumen Characteristic on Cold-Mix Asphalt Properties. Ph.D. Thesis,
University of Nottingham, Nottingham, UK, 2008.20. Bitumen and Bituminous Binder—Determination of Complex Shear Modulus and Phase Angle—Dynamic Shear
Rheometer; PN-EN 13302-09; PKN: Warsaw, Poland, 2009.21. Morea, F.; Zerbino, R.; Agnusdei, J. Improvements on asphalt mixtures rutting performance characterization
by the use of low shear viscosity. Mater. Struct. 2013, 46, 267–276. [CrossRef]22. Bitumen and Bituminous Binder—Determination of Complex Shear Modulus and Phase Angle; PN-EN 14770-12;
PKN: Warsaw, Poland, 2012.23. Superpave Asphalt Mixture Design & Analysis (NATC−SP 101); FHWA-SA-95-003; National Technical
Information Service: Springfield, VA, USA, 1995.24. Petersen, J.C. Binder Characterization and Evaluation; Strategic Highway Research Program (U.S.); National Research
Council: Washington, DC, USA, 1994.25. Lazic, Ž.R. Design of Experiments in Chemical Engineering: A Practical Guide; Wiley-VCH: Weinheim, Germany, 2004.26. Montgomery, D.C. Design and Analysis of Experiments, 8th ed.; John Wiley & Sons, Inc.: Hoboken, NJ, USA, 2013.27. Newcomb, D.E.; Arambula, E.; Yin, F.; Zhang, J.; Bhasin, A.; Li, W.; Arega, Z. Properties of Foamed Asphalt for
Warm Mix Asphalt Application; Transportation Research Board: Washington, DC, USA, 2015.28. Abreu, L.S.F.; Oliveira, J.R.M.; Silva, H.M.R.D.; Palha, D.; Fonseca, S.V. Suitability of different foamed
bitumens for warm mix asphalts with increasing recycling rates. Constr. Build. Mater. 2017, 142, 342–353.[CrossRef]
Materials 2018, 11, 1854 20 of 20
29. Saleh, M.F. Effect of rheology on the bitumen foamability and mechanical properties of foam bitumenstabilised mixes. Int. J. Pavement Eng. 2007, 8, 99–110. [CrossRef]
30. Taylor, N.; Kuyatt, C.E. Guidelines for Evaluating and Expressing the Uncertainty of NIST Measurement Results;NIST Technical Note 1297; National Institute of Standards and Technology: Washington, DC, USA, 1994.
31. Airey, G. Rheological properties of styrene butadiene styrene polymer modified road bitumens. Fuel 2003,82, 1709–1719. [CrossRef]
32. Iwanski, M.; Cholewinska, M.; Mazurek, G. Viscoelastic Properties of Polymer Modified Bitumen in WarmMix Asphalt Technology in Terms of Ageing. Procedia Eng. 2017, 172, 401–408.
33. Sybilski, D. Zastosowanie Metody SHRP do Oocenay Nawierzchni w Polsce Metodami SHRP [Application of SHRPMethods for Evalutation of Road Pavements in Poland]; IBDiM: Warsaw, Poland, 2000. (In Polish)
34. Anderson, A.; Kennedy, T.W. Development of SHRP binder specification. J. Assoc. Asph. Paving Technol. 1993,62, 481–501.
35. Anderson, A. Understanding the MSCR Test and Its Use in the PG Asphalt Binder Specyfication; Asphalt Institute:Lexington, KY, USA, 2011.
36. Król, J.B.; Kowalski, K.J.; Radziszewski, S.; Sarnowski, M. Rheological behaviour of n-alkane modifiedbitumen in aspect of Warm Mix Asphalt technology. Constr. Build. Mater. 2015, 93, 703–710.
37. Gonzalez, A.A. An Experimental Study of the Deformational and Performance Characteristics of FoamedBitumen Stabilized Pavement. Ph.D. Thesis, University of Canterbury, Christchurch, New Zealand, 2009.
38. Silva, H.M.R.D.; Oliveira, J.R.M.; Peralta, J.; Zoorob, S.E. Optimization of warm mix asphalts using differentblends of binders and synthetic paraffin wax contents. Constr. Build. Mater. 2010, 24, 1621–1631. [CrossRef]
39. Klabinska, M.; Piłat, J. Reologia Asfaltów i mas Mineralno-Asfaltowych [Rheology of Bitumen and BituminousMixture]; WKŁ: Warsaw, Poland, 1982. (In Polish)
40. Wirtgen Group. Cold Recycling Technology; Wirtgen GmbH: Windhagen, Germany, 2012.41. Derringer, G.; Suich, R. Simultaneous Optimization of Several Response Variables. J. Qual. Technol. 1980, 14,
214–219. [CrossRef]42. Asphalt Academy. Technical Guideline: Bitumen Stabilized Materials; Asphalt Academy: Cape Town,
South Africca, 2009.43. Muthen, K.M.; Lewis, R.M.; Vos, R.M. Foamed asphalt mixes, mix design procedure. Proceedings of 7th
Conference on Asphalt Pavements for Southern Africa, Pretoria, South Africa, August–September 1999.44. Milton, L.J.; Earland, M. Design Guide and Specification for Structural Maintenance of Highway Pavements by Cold
In-Situ Recycling; TRL386; Transport Research Laboratory: Berkshire, UK, 1999.45. Leek, C.; Jameson, G. Review of Foamed Bitumen Stabilisation Mix Design Method; Austroads: Sydney, Australia, 2011.
© 2018 by the authors. Licensee MDPI, Basel, Switzerland. This article is an open accessarticle distributed under the terms and conditions of the Creative Commons Attribution(CC BY) license (http://creativecommons.org/licenses/by/4.0/).