bitumen partial upgrading 2018 whitepaper - alberta innovates · bitumen partial upgrading 2018...
TRANSCRIPT

Bitumen Partial Upgrading 2018 Whitepaper
AM0401A
Alberta Innovates
Prepared By
Bill Keesom, Jacobs Consultancy – Technical Lead
John Gieseman, Jacobs Consultancy – Project Manager
March 2018
Document Ti tle

Bitumen Partial Upgrading 2018 Whitepaper - AM0401A
1
Study No: JC158400
Document Title: Bitumen Partial Upgrading 2018 Whitepaper - AM0401A
Client Name: Alberta Innovates
Revision: 6
Date: May 11, 2018
Study Manager: John Gieseman
Approved by: Robert S. Brasier
Jacobs Consultancy Inc.
525 W. Monroe, Suite 1600
Chicago, IL 60661
United States
www.jacobsconsultancy.com
Document History and Status
Revision Date Description By Reviewed Approved
0 4 Dec 2017 WHK JCG
1 8 Dec 2017 Updated figures 5.23, 5.24, 5.25 and Table 5.3 and
Updated chapter 4 – Bitumen Fundamentals
WHK JCG
2 9-Jan 2018 Included comments from reviewers; moved most of
refining and marketing to Appendices
WHK JCG
3 26-Jan 2018 Included further comments and changes from reviewers WHK JCG
4 12-Feb-2018 Address further comments and changes from reviewers WHK JCG RSB
5 28-Feb-2018 Address further comments and changes from reviewers WHK JCG RSB
6 2 Mar-2018 Address further comments and changes from reviewers WHK JCG RSB
7 3 Apr-2018 Address further comments and changes from reviewers WHK JCG RSB
This study or report was prepared by Jacobs Consultancy Canada Inc., (“Jacobs”) for the sole benefit of ALBERTA INNOVATES. There are no third party beneficiaries intended, and none of Jacobs and its affiliates, Alberta Innovates or any of their respective officers, directors, partners, employees, agents shall have any liability whatsoever to third parties for any defect, deficiency, error, or omission in any statement contained in or any way related to the study or report or any related documents. Neither Jacobs nor any person acting on Jacobs’ behalf make any warranty, express or implies, or assumes any liability with respect to use or reliance on any information, technology, engineering or methods disclosed or discussed in the study or report. Any forecasts, estimates, projections, opinions or conclusions reached in the study or report are dependent upon numerous technical and economic conditions over which Jacobs has no control, and which are or may not occur. Reliance upon such opinions or conclusions by any person or entity is at the sole risk of the person relying thereon. The data, information and assumptions used to develop the report or study were obtained or derived from documents or information furnished by others. Jacobs did not independently verify or confirm such information and does not assume responsibility for its accuracy or completeness. Any forecasts, or costs or pricing estimates in the study or report are considered forward-looking statements and represent Jacobs’ current opinion and expectation of a
likely outcome. They do not anticipate possible changes in governmental policies, governmental regulations, military actions, embargoes or production cutbacks, regional conflicts, or other events or factors that could cause the forecast or estimates to differ materially from what is contained in our forward-looking statements. The study or report is dated as of the date Jacobs completed its work. Jacobs has no obligation to update or revise the study or report or to revise any opinions, forecasts or assumptions because of events, circumstances or transactions occurring after the date of the study or report.

Bitumen Partial Upgrading 2018 Whitepaper - AM0401A
2
Contents
1. Executive Summary ........................................................................................................................ 5
2. Introduction ..................................................................................................................................... 6
2.1 Definition of Partial Upgrading .................................................................................................. 7
2.2 Incentives for partial upgrading ................................................................................................. 8
2.3 National Partial Upgrading Program ....................................................................................... 10
2.4 Scope of this Whitepaper ........................................................................................................ 10
3. Market Overview ........................................................................................................................... 12
3.1 Crude Oil Overview ................................................................................................................. 13
3.1.1 Crude Oil Characterization...................................................................................................... 13
3.1.2 Yield from Crude Oil Refining ................................................................................................. 15
3.1.3 Greenhouse Gas Emissions from Refining ............................................................................. 16
3.2 Markets for Canadian Crude Oil ............................................................................................. 17
3.5.1 Classification of US Refining Capability by Geographic Regions ........................................... 22
3.5.2 US Refining Capability to Process Heavy Crude Oils ............................................................ 22
3.5.3 Shipment of Crude Oil from Alberta ........................................................................................ 24
3.6 US Markets for Canadian Crude Oil ....................................................................................... 29
3.6.1 20-25 API Gravity Crude Oil Imported into the US ................................................................. 33
3.6.2 20-25 API Gravity Crude Oil Imported into PADD1 ................................................................ 34
3.6.3 Crude Oil Imported into PADD2 .............................................................................................. 34
3.6.4 20-25 API Gravity Crude Oil Imported into PADD3 ................................................................ 35
3.6.5 20-25 API Gravity Crude Oil Imported into PADD4 ................................................................ 36
3.6.6 20-25 API Gravity Crude Oil Imported into PADD 5 ............................................................... 37
3.7 Market Opportunities for Alberta Heavy Crude Oils in the US ................................................ 37
3.8 Market Opportunities for Alberta Heavy Crude Oils in Asia .................................................... 40
3.9 Pricing Heavy Crude Oil .......................................................................................................... 43
3.10 Other Market Forces Affecting Heavy Crude Oil .................................................................... 45
4. Bitumen and Heavy Oil Fundamentals ....................................................................................... 47
4.1 Bitumen Composition .............................................................................................................. 47
4.2 Physical Properties and Dependence on Composition .......................................................... 49
4.2.1 Reduction in Bitumen Viscosity .............................................................................................. 50
4.2.2 Reduction in Bitumen Density ................................................................................................. 51
4.3 Market Value – Composition Relationships ............................................................................ 51
4.4 Processing Reactions to Improve Properties and Market Value ............................................ 52
4.5 Thermal Reactions .................................................................................................................. 53
4.5.1 Thermal Cracking .................................................................................................................... 53

Bitumen Partial Upgrading 2018 Whitepaper - AM0401A
3
4.5.2 Addition reactions ................................................................................................................... 56
4.5.3 Hydrogen transfer reactions ................................................................................................... 57
4.5.4 Coking ..................................................................................................................................... 58
4.5.5 Scale-up of thermal cracking processes ................................................................................. 62
4.5.6 Boundaries on thermal cracking ............................................................................................. 62
4.6 Catalytic Cracking ................................................................................................................... 64
4.7 Catalytic Hydrogenation .......................................................................................................... 64
4.8 Other Catalytic Cycles ............................................................................................................ 64
4.8.1 Sodium-Sodium Sulfide Cycle ................................................................................................ 64
4.8.2 Carbon Oxidation-Water Reduction ........................................................................................ 65
4.8.3 Other Process Pathways ........................................................................................................ 65
4.8.3.1 Ionizing Radiation ................................................................................................................... 65
4.8.3.2 Fluid-Mechanical Alteration..................................................................................................... 66
4.8.3.3 Oxidative Desulfurization ........................................................................................................ 66
4.9 Separations to Improve Properties and Market Value ............................................................ 67
4.10 Feasible Range of Partial Upgrading Products....................................................................... 69
4.11 Combinations of Processes .................................................................................................... 70
5. Bitumen Partial Upgrading and Technology Readiness ........................................................... 73
5.1 Partial Upgrading Overview .................................................................................................... 73
5.2 Upgrading Technology Classification ..................................................................................... 76
5.2.1 Thermal Processing ................................................................................................................ 76
5.2.1.1 Visbreaking ............................................................................................................................. 76
5.2.1.2 Coking ..................................................................................................................................... 79
5.2.2 Asphaltene Rejection .............................................................................................................. 82
5.2.2.1 Solvent Deasphalting .............................................................................................................. 82
5.2.3 Fluid Mechanical ..................................................................................................................... 84
5.3 Upgrading Technology Assessment ....................................................................................... 85
5.3.1 Technology Readiness Levels ................................................................................................ 85
5.4 Overview of Potential New Upgrading Technologies ............................................................. 86
5.4.1 Thermal Cracking and Coking ................................................................................................ 88
5.4.1.1 Fluid Oil Viscositor .................................................................................................................. 88
5.4.1.2 ETX System IYQ Technology ................................................................................................. 89
5.4.1.3 Husky Diluent Reduction (HDR™) Technology ...................................................................... 90
5.4.1.4 UMATAC Industrial Processes’ Alberta Taciuk Retort Process (ATP) ................................... 91
5.4.1.5 Water-Based Catalytic Visbreaking (Aquaconversion) ........................................................... 91
5.4.2 Asphaltene Rejection .............................................................................................................. 92
5.4.2.1 Commercial Paraffin Froth Treatment Process Block ............................................................ 92

Bitumen Partial Upgrading 2018 Whitepaper - AM0401A
4
5.4.2.2 Selex-Asp for Rejection of Solid Asphaltene .......................................................................... 93
5.4.3 Combined Thermal Cracking and Deasphalting ..................................................................... 94
5.4.3.1 MEG HI-Q® Partial Upgrading Technology ............................................................................. 94
5.4.3.2 Nexen BituMax™ Partial Upgrading Technology ................................................................... 96
5.4.3.3 Water-Based Supercritical Solvent Extraction (JGC) ............................................................. 98
5.4.3.4 VCI's ADC and COC Technologies ........................................................................................ 99
5.4.4 Hydrogen Addition and Cracking .......................................................................................... 100
5.4.4.1 Hydrovisbreaking .................................................................................................................. 100
5.4.5 Fluid Mechanical ................................................................................................................... 101
5.4.5.1 Superior Upgrading Tech./Hammer Technology .................................................................. 101
5.4.5.2 Electromechanical Based Technologies ............................................................................... 102
5.4.5.3 Petrosonic ............................................................................................................................. 102
5.4.6 Fluid Mechanical and Thermal Cracking .............................................................................. 102
5.4.6.1 Fractal Systems Jet Shear™/Enhanced Jet Shear™ ........................................................... 102
5.4.7 Other technologies ................................................................................................................ 105
5.4.7.1 Field Upgrading - Molten Sodium Upgrading........................................................................ 105
5.4.7.2 Novel Additive-Based Upgrading .......................................................................................... 106
5.4.7.3 Novel Diluent ......................................................................................................................... 107
5.4.7.4 Bitumen Solidification ............................................................................................................ 107
5.4.7.5 Auterra Oxidative Desulfurization the FlexUP™ Process ..................................................... 107
5.4.7.6 In Situ Upgrading .................................................................................................................. 107
5.4.7.7 Expander Energy FTCrude® ................................................................................................ 108
5.5 Partial Upgrading Technology Comparisons ........................................................................ 109
5.6 Partial Upgrading Technology Selection ............................................................................... 113
6. Summary of Challenges and Recommendations .................................................................... 115
6.1 Recommendations for Further Research and Development ................................................ 115
Appendix A: Glossary and List of Acronyms....................................................................................... 116
Appendix B References .......................................................................................................................... 123
Appendix C: Petroleum Refining ........................................................................................................... 131
Appendix D: US Markets for Imported Crude Oil ................................................................................. 136
Appendix E. Hydrogen Addition Upgrading Processes ...................................................................... 155

Bitumen Partial Upgrading 2018 Whitepaper - AM0401A
5
1. Executive Summary
This whitepaper discusses market access for partially upgraded bitumen, the chemistry of
bitumen and bitumen upgrading that govern technology choices, and a number of promising
partial upgrading technologies. Considerable progress has been made in their development but
challenges remain on the path to commercialization. These include: changing market conditions,
logistical barriers, mismatch between properties desired by crude oil refiners and achieved by
partial upgrading, high capital and operating costs, yield loss, GHG impact, lack of scale, and
technical risks. However, multiple pilots, R&D work, and government support are underway to
mitigate many of these issues.
The growing supply of Alberta bitumen-derived crude oils must access US refining markets on
the US Gulf Coast (USGC), as the Rocky mountain and mid-western refineries are fully supplied
with this oil. East coast, Pacific coast, and overseas markets are not easily accessible. Bitumen-
derived crude oils from Alberta must compete in the USGC with heavy crude oils from Venezuela
and Mexico, which have shorter and lower cost distribution channels.
Most Alberta bitumen-derived crude oils are transported to US refining markets via pipeline.
However, pipeline viscosity and density limits require either adding diluent to bitumen or
upgrading it to a lighter crude oil. Adding new upgrading capacity to produce synthetic crude oil
in Alberta is expensive. Adding diluent is a significant cost. In the second quarter of 2017, diluent
used to transport bitumen to the USGC, cost producers nearly US$14 per barrel of bitumen
(US$14/bbl). Eliminating or reducing diluent would make it less expensive to ship these crude oils
from Alberta to markets and make them more competitive with crude oils supplied via blue water.
New upgrading technologies have been proposed to address these issues.
The National Partial Upgrading Program (NPUP) was created to identify technologies that
upgrade bitumen to meet the minimum pipeline specifications at a low cost. To achieve these
goals, bitumen partial upgrading technologies must convert/reject asphaltenes and convert heavy
molecules to lighter ones to reduce or eliminate diluent addition.
Partial upgrading technology developers have approached these requirements in different ways.
One approach minimizes cost and maximizes yield by partial conversion of heavy components
with no rejection of contaminants. A second approach combines thermal conversion with removal
of a portion of the asphaltenes to achieve pipeline specifications and simultaneously improve the
value of the partially upgraded product. Due to its low cost, thermal conversion is at the heart of
all promising technologies mature enough to consider for demonstration or commercialization.
Despite long use in petroleum refinery processing, several aspects of thermal processing remain
poorly understood, which may impact the valuation of partially upgraded bitumen-derived crude
oils.

Bitumen Partial Upgrading 2018 Whitepaper - AM0401A
6
2. Introduction
Canada contains the third largest crude oil reserves in the world. Figure 1.1 shows the geographic
distribution of crude oil reserves, including natural gas plant and other liquid hydrocarbons.
Included in Figure 1.1 is a graph from the US Energy Information Administration (EIA) showing
reserve estimates for the top ten countries.
Figure 1.1: Crude Oil and Other Liquid Hydrocarbon Reserves (2016)
Source (EIA, 2017)
Unfortunately, Canada’s major oil production region in Alberta is geographically isolated from
world markets and most of its oil reserves are heavy, which require more refining than crude oils
from most other top reserve countries with the exception of Venezuela and Mexico. Refining
Canadian bitumen and heavy crude oil in the country for domestic use and for export is limited by
insufficient clean-fuel pipeline capacity for transport of refined products and the high cost of
building new refining capacity in Canada. As a result, bitumen and heavy oil production from
300
267
171158
143
102 9880
4837
0
50
100
150
200
250
300
350
Venezuela SaudiArabia
Canada Iran Iraq Kuwait United ArabEmirates
Russia Libya Nigeria
Reserv
es -
Cru
de O
il, G
as P
lant
and O
ther Liq
uid
s,
Bill
ion B
bls
LEGEND
300 Bil Bbls

Bitumen Partial Upgrading 2018 Whitepaper - AM0401A
7
Alberta and Saskatchewan is exported to existing petroleum refineries outside of Canada.
Capacity expansion at existing refineries in distant markets is less expensive than building new
greenfield refining capacity in Canada.
The most cost effective high volume mode for transporting crude oil over land is by pipeline and
most Alberta bitumen moves on the existing pipeline network. Viscosity maxima and API gravity
minima are specified by pipeline companies to ensure efficient operations and maximize
movement of heavy oil from Alberta. Table 1.1 lists the current specifications for pipeline
transportation, and the corresponding properties of bitumen. To satisfy these specifications,
Alberta bitumen must be diluted by a lighter material, which reports as a cost to the bitumen
producer. Diluents are primarily light naphtha, natural gas condensate, or synthetic crude oil,
produced from upgrading bitumen. When bitumen is diluted with condensate it is called dilbit and
with synthetic crude oil (SCO), synbit.
Table 1.1 Pipeline Specifications and Representative Alberta Bitumen Products
Property Specification Athabasca
bitumen
Diluted bitumen
from in situ
production1
Synthetic crude
oil (SCO)2
Viscosity maximum 350
centistokes (cSt)
at pipeline
temperature
5000 to 300,000
cSt at 25 °C
209 cSt at 15oC 8 cSt at 15oC
Density, kg/m3 < 940 1015 922.1+5.1 863.3+4.4
Gravity °API >19 7.9 21.8+0.8 32.3+0.8
Bottom solids
and water
< 0.5 vol% 0-2% < 0.1% 0
Olefin content < 1 wt% 0 0 0
Notes:
1. Access Western Blend (AWB), a heavy, high TAN dilbit produced by Devon Energy Canada and
MEG Energy Corp, five-year average from the ( (Crude Monitor, 2017))
2. Syncrude Sweet Premium, a light sweet synthetic crude produced from the Syncrude Canada, five-
year average from ( (Crude Monitor, 2017))
2.1 Definition of Partial Upgrading
Bitumen upgrading removes contaminants and can reduce or eliminate the need to add diluent to
meet pipeline specifications for viscosity and density. There is a continuum of possible product
properties, starting from bitumen and ranging to synthetic crude oil (SCO) and beyond (Table 1.1).
The original upgraders were built in Alberta because the bitumen from mining contained too much

Bitumen Partial Upgrading 2018 Whitepaper - AM0401A
8
bottom sediment and water (BS&W) and therefore could not be transported by pipeline. The
products from these plants in Fort McMurray can be considered “full upgrading” to produce a
range of blended and easily-transported synthetic crude oil products with a significantly higher
price than diluted bitumen. In contrast, the bitumen produced by in situ methods from Athabasca,
Cold Lake, and Peace River are blended with diluent to produce a pipeline-able, fungible product,
without requiring any investment in an upgrader. Diluent is typically condensate or synthetic crude
oil. Condensate diluent is typically around 30 volume percent (vol%) or more in a diluted bitumen
(dilbit) blend like AWB. SCO diluent may be as high as 50 vol% in the synbit blend. Development
of paraffin froth treatment has enabled mined bitumen to be blended with diluent and transported
via pipeline.
Partial upgrading is defined for the purpose of this whitepaper as any combination of bitumen
processing steps and reduced diluent addition to meet the specifications for pipeline transport,
listed in Table 1.1. Although a range of products between the pipeline specification and fully
upgraded SCO can be produced, and might be profitable, they are not considered in this
whitepaper. Here we consider partial upgrading of bitumen to meet pipeline specifications with no
or reduced diluent addition. At present, no partial upgrading plants are in operation, and no fully
commercial technologies are available that make partial upgrading a feasible investment.
2.2 Incentives for partial upgrading
While the majority of bitumen from oil sands mining is upgraded, very little bitumen from in situ
production is upgraded in Alberta and Saskatchewan. A study by the University of Calgary School
of Public Policy, published in 2017 (Fellows, et al., 2017), highlighted the significant potential
opportunity for benefits both to the oil sands industry and to the Provinces of Alberta and
Saskatchewan through increased investment and employment in value-added manufacturing.
The existing facilities for full upgrading of bitumen are complex and expensive to build and
operate. The capital cost of the Suncor Voyageur Upgrader, at the time of its cancellation in 2013,
was estimated at $11.5 billion, for a cost per flowing barrel of approximately $60,000/(bbl/day)
(Jang, 2017). The costs to install new capacity in Alberta have escalated, diminishing economic
and financial incentives to build new capacity for SCO production. At the same time, using diluent
or SCO to meet pipeline specifications for transporting bitumen is expensive and takes up pipeline
capacity. To ensure market access for Alberta bitumen, a new approach to upgrading is required
that optimizes the amount and type of processing that is performed. New technology and
combinations of technologies for just enough partial upgrading of bitumen to meet pipeline
specifications and minimize downstream processing should reduce costs overall.
Transporting bitumen to refineries in pipelines requires blending with 30 volume percent (vol%)
or more of condensate to meet pipeline viscosity specifications. Transporting bitumen as a diluted

Bitumen Partial Upgrading 2018 Whitepaper - AM0401A
9
bitumen (dilbit) blend reduces the amount of pipeline capacity available to ship bitumen as some
capacity is used by the diluent. At the refinery, the diluent in dilbit can be separated and returned
to Alberta, refined to gasoline, or sold as a petrochemical feedstock. However, the high vapor
pressure of the light condensate diluent, limits its use as a gasoline blendstock in the US in
summer when gasoline vapor pressure is restricted. Ultimately adding diluent to bitumen to enable
pipeline transport becomes a significant cost to producers (around US $14/bbl of bitumen in the
second quarter of 2017 – this includes loss incurred by the difference in price between the cost
of diluent and the price diluent sells for as dilbit and the cost of transporting diluent in dilbit).
The following figure illustrates significant financial benefit from reducing diluent use. The basis is
a dilbit containing 31.5 vol% diluent. Prices are second quarter 2017 with the following
assumptions:
• Pipeline tariff from Hardisty to the US Gulf Coast via the Enbridge pipeline system - $US
7.79/bbl
• Pipeline tariff from the in situ production site to Hardisty - $C 1.85/bbl
• Exchange rate is 1.3 CAD/USD
• Condensate diluent is prices at $C 71/bbl at Edmonton
• Dilbit is priced at $US 37.18/bbl at the US Gulf Coast
• No benefit taken for any bitumen quality improvements
• Products meet pipeline specifications.
Figure 2.1: Cost of Diluent in Transporting Bitumen*
*Assumes diluent price of US$56/bbl at production site; dilbit price of US$35.8 at USGC; and pipeline tariff of US$9.2/bbl from production site to USGC. Quality changes from partial upgrading are not considered in this figure.
0
2
4
6
8
10
12
14
0% 5% 10% 15% 20% 25% 30% 35%Co
st o
f D
ilue
nt, U
S$
/bb
l of
bitum
en
Diluent used in Transporting Bitumen, vol% of Total Product

Bitumen Partial Upgrading 2018 Whitepaper - AM0401A
10
2.3 National Partial Upgrading Program
The National Partial Upgrading Program (NPUP) was initiated in 2015 by Alberta Innovates (AI)
and the CANMET Energy Laboratories of Natural Resources Canada. Oil sands producers were
invited to join an Advisory Committee to work on a range of collaborative projects. NPUP’s vision
is that Canadian bitumen and heavy oil are purchased and valued globally as cost competitive
and environmentally attractive. NPUP’s mission is to accelerate innovation for partial upgrading
of bitumen and heavy oil to:
• Reduce or eliminate the use of diluent for pipeline transport
• Improve oil product quality and mitigate by-products
• Increase overall resource value and market access
• Reduce environmental impacts
It is the view of NPUP that commercially available technologies may not fit current needs of the
bitumen production industry. As a result, participants in the NPUP Advisory Committee are
working together to identify, investigate, and reduce the risk of the most promising pre-commercial
partial upgrading solutions. The scope of NPUP is to investigate market, policy, and technology
opportunities and challenges to support development and commercialization of partial upgrading
solutions in Canada. Current industry members are Cenovus, Canadian Natural, Husky, MEG
Energy, Nexen, and Suncor. Government members are Alberta Innovates, Alberta Energy,
CANMET and the Saskatchewan Ministry of Economy.
2.4 Scope of this Whitepaper
The objective of this whitepaper is to provide a comprehensive document to inform and guide
NPUP and help accelerate targeted innovations in partial upgrading of bitumen.
The specific objectives of this Whitepaper are to:
A. Provide a global market perspective and opportunities for bitumen partial upgrading
products (Chapter 3 Market Overview). The opportunities for market expansion and
improved pricing determine which partial upgrading technologies will give the highest
benefit.
B. Provide a summary of bitumen and heavy oil chemistry (Chapter 4). The chemistry of
bitumen determines what changes will deliver product that meets pipeline
specifications and defines the technical boundaries of partial upgrading.
C. Review technologies that have been proposed for partial upgrading, and assess their
technology readiness levels and ability to meet the pipeline specifications (Chapter 5).

Bitumen Partial Upgrading 2018 Whitepaper - AM0401A
11
D. Summarize the key characteristics of bitumen partial upgrading products (Chapters 4
and 5)
E. Identify critical challenges and gaps remaining for commercializing bitumen partial
upgrading solutions and maximizing the value of partially upgraded products
(Chapter 6).
F. Make recommendations for research and development to overcome challenges and
close gaps for the National Partial Upgrading Program (Chapter 6).

Bitumen Partial Upgrading 2018 Whitepaper - AM0401A
12
3. Market Overview
Most crude oil is refined to light transportation fuels: gasoline, jet fuel, and diesel. Crude oil is a
source for heavy fuel oil used in power production, industrial use, and as bunker fuel for ships. It
is also a source of petrochemical feedstocks. Figure 3.1 shows the trend in worldwide demand
for refined products from crude oil since 1985. Annual growth for each major product since 2005
is also shown on this figure. The category ‘Others’ consists of refinery gas, liquefied petroleum
gas (LPG), solvents, petroleum coke, lubricants, bitumen, wax, other refined products, and
refinery fuel and loss. Demand growth for most products is correlated with economic and
population growth. Fuel oil demand is falling because of replacement by other fuels – natural gas
and because of greater conversion of heavy residue in crude oil to more valuable lighter products.
Figure 3.1: Worldwide Growth in Products from Crude Oil Refining
* (BP, 2017) Residue or resid are the common abbreviations for residuum or residual fuel oil which is the
heaviest oil and recovered from the bottom of a refinery vacuum column. We will use the term residue
throughout this paper.
0
10,000
20,000
30,000
40,000
50,000
60,000
70,000
80,000
90,000
100,000
Ref
ined
Pro
du
ct D
eman
d,
KB
PD
Growth 2005-2016
Others: 1.8%
Fuel Oil: -1.9%
Diesel/Gas Oil: 1.5%
Jet/Kerosene: 0.6%
Gasoline: 1.6%
Naphtha: 2.0%

Bitumen Partial Upgrading 2018 Whitepaper - AM0401A
13
3.1 Crude Oil Overview
Market demand for refined products is met by petroleum crude oil refineries that convert crude
oil’s wide range of molecules into products. Refineries first distill crude oil into fractions that are
further processed by making the molecules smaller, adding or rearranging hydrogen and
removing impurities. The extent of refining depends on crude oil quality and the processing
capability of the refinery.
In general, lighter crude oils contain less sulfur, nitrogen, metals, and micro-carbon residue (MCR)
and require less processing than heavier crude oils to meet finished product quality specifications
and demand. However, light, low sulfur, nitrogen, metals, and MCR content crude oils are more
expensive than heavier crude oils. Finally, refining configurations are optimized to meet market
demand for refined products within a fairly narrow range of crude oil properties. A refinery
optimized to process a heavy crude oil slate may be sub-optimized when processing a light crude
oil slate and vice versa.
3.1.1 Crude Oil Characterization
Crude oils are characterized for petroleum refining by API gravity, amount of sulfur, nitrogen, MCR
and total acid number (TAN), as well as the yield of typical products like naphtha, distillate, heavy
gasoil, that can be distilled from the crude oil and the vacuum residue, that is too heavy to distill.
The acidic compounds that contribute to TAN corrode refining equipment and refiners will either
improve the metallurgy in their equipment to enable processing of high TAN crudes or offset high
TAN with low TAN crudes. TAN is a barrier to processing crude oil but does not affect refining
yield as do sulfur, nitrogen, metals, MCR, and crude oil API gravity.
Figure 3.2 shows the amount of butane and lighter hydrocarbons (C4-), naphtha, distillate, heavy
gasoil, and vacuum residue for a range of crude oils. Naphtha is a rough surrogate for gasoline.
Distillate is used to produce diesel and jet fuel. Heavy gasoil is typically converted to lighter fuels
via refining. Vacuum residue is undistillable material that can end up in heavy fuel oil and bunker
fuel or it can be converted to lighter fuels via further refining. Light crude oils yield more naphtha,
gasoline, jet fuel, and diesel fuel with less refinery processing than heavy crude oils, which contain
more vacuum residue.
Crude oils in Figure 3.2 are sorted from lowest to highest API gravity—in other words, from
heaviest crude to lightest crude. In this figure we see that crude oils fall on a continuum.
Bachaquero is slightly lighter than Athabasca bitumen (higher API gravity) yet has similar yield of
residual material, heavy gasoil and naphtha. Based on this assay, it is expected that the refining
configuration and yields from Bachaquero would be similar to those needed to process Athabasca
bitumen.

Bitumen Partial Upgrading 2018 Whitepaper - AM0401A
14
Figure 3.3 shows that refractory carbon, measured as MCR, correlates with the amount of vacuum
residue (Figure 3.2). Lighter crudes contain less residue and less MCR. Sulfur has a less
pronounced correlation with crude API than does MCR. The heavy crude oils, Bachaquero, Maya,
and Athabasca bitumen have similar amounts of MCR, which means they contain similar amounts
of refractory, hard to convert carbon-rich components and will require similar heavy crude bottoms
conversion capability.
Figure 3.2: Yield by Boiling Point for a Range of Crude Oils. (Resid is vacuum residue)
(Haverly Chevron Crude Assay Library - with Jacobs Analysis, 2016)
0
5
10
15
20
25
30
35
40
45
50
0
10
20
30
40
50
60
70
80
90
100
AP
I Gra
vity
Yie
ld, w
t%
C4-
Naphtha C5-177°C
Distillate 177-243°C
Heavy Gas Oil 343-550°C
Resid 550 °C+
API
Heavy Light

Bitumen Partial Upgrading 2018 Whitepaper - AM0401A
15
Figure 3.3: Micro Carbon Residue (MCR) and Sulfur Content for a Range of Crude Oils.
(Haverly Chevron Crude Assay Library - with Jacobs Analysis, 2016)
3.1.2 Yield from Crude Oil Refining
Petroleum refineries combine a range of processes in order to convert crude oils into
transportation fuels or other valuable products. Further details on refinery processes are given in
Appendix C. The value of a crude oil to a refinery is related to the yield of products that can be
achieved. Figure 3.4 shows the yield of major refined products as a percent of crude oil from a
high conversion refinery designed to maximize light transportation fuel. Sulfur and petroleum coke
have been converted to barrels of fuel oil equivalent.
0
5
10
15
20
25
30
35
40
45
50
0
2
4
6
8
10
12
14
AP
I Gra
vity
Su
lfu
r or C
on
Ca
rbo
n, w
t%
Sulfur
ConCarbon
API
Heavy Light
Sulf
ur
or
MC
R, w
t%
MCR

Bitumen Partial Upgrading 2018 Whitepaper - AM0401A
16
Figure 3.4: Product Yield from Refining a Range of Crude Oils to Maximize Light Transport Fuels
(JacobsConsultancy, 2012)
Higher yield of refined products from a barrel of crude oil is achieved with heavy crude oils as a
result of greater hydrogen and isobutane addition in the refining process.
3.1.3 Greenhouse Gas Emissions from Refining
The energy required to refine crude oils depends on the API gravity of the crude oil, the extent of
conversion desired, and the refinery configuration (JacobsConsultancy, 2012). Figure 3.5 shows
how the GHG emissions from refining, which are highly correlated with energy consumption,
decrease as the crude oil API gravity goes up (density goes down) (Jacobs Consultancy, 2016).
These data are from modeling the conversion, yield, energy consumption, and GHG emissions
from refining different crude oils in a coking based, high-conversion refinery that maximizes the
production of light transportation fuels (gasoline, jet fuel and diesel fuel). The capacity of the
process units in this refinery are allowed to change to match crude oil composition and assay.
Energy consumption and process unit yields are consistent with refining industry experience
(JacobsConsultancy, 2012). Further details on oil refining is in Appendix C.
15% 15%9% 5% 6% 4% 1% 1%
34% 37%43%
39% 35% 38% 45%33%
63% 56% 61%
57% 56% 57%56%
62%
4%4%
3%
4% 5% 5% 2%5%
0
200
400
600
800
1,000
1,200
1,400
0%
20%
40%
60%
80%
100%
120%
140%
Hyd
rog
en A
dd
ed
, SC
F p
er B
bl C
rud
e
Pro
duct
Yie
ld,
vo
l% o
f C
rude
LPG
MoGas
Distillate
Sulfur
Coke
H2 Addition

Bitumen Partial Upgrading 2018 Whitepaper - AM0401A
17
Figure 3.5: GHG from Crude Oil Refining – Coking Based, High-Conversion Refinery
(Jacobs Consultancy, 2016)
3.2 Markets for Canadian Crude Oil
Most Canadian crude oil comes from Western Canada and most is from the oil sands region in
Alberta, which produces bitumen and SCO. Figure 3.6 shows historical production of crude oil in
Canada and projected production to 2030 from the Canadian Association of Petroleum Producers
(CAPP, 2017). CAPP forecasts that Western Canada will increase bitumen crude oil production
by 1.3 MM BPD from 2016 to 2030. This forecast from CAPP is more optimistic than the one in
June 2016, which considered lower crude oil prices and the impact of wildfires around Fort
McMurray in Alberta, the major oil sands production area.
y = -0.96x + 79.35R² = 0.92
0
10
20
30
40
50
60
70
80
0 5 10 15 20 25 30 35 40 45 50
GH
G E
mis
sio
ns
, k
g C
O2
e/b
bl
of
Cru
de
Crude Oil API Gravity

Bitumen Partial Upgrading 2018 Whitepaper - AM0401A
18
Figure 3.6: Historical and Forecast Crude Oil Production in Canada
(CAPP, 2017)
Table 3.1 shows Canadian crude oil production in 2016. Western Canada produced around 2.4
MM BPD of oil sands based crude oil in 2016 (including bitumen that was upgraded to SCO).
Table 3.1: 2016 Crude Oil Production in Canada
Conventional
Pentanes and
Condensate
Oil Sands* Total Crude
Oil
Mined In Situ KBPD KBPD KBPD KBPD
Eastern Canada 213 213
Western Canada
Manitoba 40 0 40
Saskatchewan 459 0 459
Alberta** 440 220 1,030 1,370 3,060
British Columbia 23 38 61
Subtotal Western Canada 962 258 1,030 1,370 3,620
Total Canada 1,175 258 1,030 1,370 3,833
(CAPP, 2017) * Bitumen sent to market, which includes bitumen that has been upgraded (mostly from mined bitumen). ** Bitumen is produced primarily in Alberta. However, some is from Saskatchewan, which is not broken out in this table; bitumen reported here is as if all is from Alberta.
Cru
de
Oil
Pro
du
ctio
n, M
M B
PD
Actual Forecast
Eastern Canada
2017
Western Canada

Bitumen Partial Upgrading 2018 Whitepaper - AM0401A
19
According to CAPP, in 2016 Canada consumed around 1 MM BPD of Canadian crude oil
(Table 3.2).
Table 3.2: 2016 Crude Oil Consumption in Canada
Refineries Processing Capacity
Crude Processed
Canadian Crude Oil Processed
Imported Crude
Western Canada
Eastern Canada
KBPD KBPD KBPD KBPD KBPD
Eastern Canada 8 1,200 1,047 264 202 581
Western Canada 8 683 553 553 0 0
Total 16 1,883 1,600 817 202 581
(CAPP, 2017)
3.3 Transport of Canadian Oil
Most Canadian crude oil is exported to the US. According to the Canadian National Energy Board,
(NEB) approximately 1% of crude oil exports went to countries that were not the U. S (National
Energy Board, 2017). Figure 3.7 shows transport modes from 2012-2016 for Canadian crude oil.
These data are reported in m3/yr. and were converted to KBPD by assuming 365 days per year.
Most Canadian crude oil is delivered by pipeline. Delivery by rail is a small transport mode, but
may increase if new pipeline capacity is not added.
Figure 3.7: Mode of Crude Oil Transport from Canada
(National Energy Board, 2017)
0
500
1,000
1,500
2,000
2,500
3,000
3,500
2012 2013 2014 2015 2016
Vo
lum
e,
KB
PD
MarineRailPipeline

Bitumen Partial Upgrading 2018 Whitepaper - AM0401A
20
3.4 Alberta Bitumen Production
The Alberta Energy Regulator (AER) reports that Alberta produced 1,390 KPBD of bitumen via in
situ methods and 1,150 KBPD of bitumen via mining in 2016 (Alberta Energy Regulator, 2017).
Most bitumen production growth is forecast by AER to be from in situ production. By 2026, the
AER projects in situ production will grow to 2,170 KBPD and mined bitumen will grow to 1,620
KBPD for a total growth in bitumen production of around 1,250 KBPD from 2016, which is higher
than the 1,020 KBPD forecast by CAPP for this period. AER’s historical and forecast for bitumen
production are shown in Figure 3.8.
Figure 3.8: Alberta Bitumen Production – Historical and Projected
(Alberta Energy Regulator, 2017)
Historical and forecast disposition of bitumen are shown in Figure 3.9. Demand for bitumen in
Alberta is projected to grow by 2% from 2016 to 2026. Export of upgraded bitumen (SCO) is
projected to grow by 3.7% while export of non-upgraded bitumen is projected to grow by 5.1%
over this period. As we will discuss further in this section, it will be challenging to find a market for
this additional crude oil in North American refineries.
0
500
1,000
1,500
2,000
2,500
3,000
3,500
4,000
Pro
ductio
n, K
BP
D
In Situ
Surface Mining
Actual Forecast

Bitumen Partial Upgrading 2018 Whitepaper - AM0401A
21
Figure 3.9: Alberta Bitumen Disposition – Historical and Projected
(Alberta Energy Regulator, 2017)
Non-upgraded bitumen requires diluent for transport in pipelines. Pipeline specifications require
crude oils transported from Alberta be less than 350 centistokes (cSt) in viscosity with density
less than 940 kg/m3 (greater than 18.9 API gravity) with no detectable olefins by hydrogen nuclear
magnetic resonance (HNMR) measurement (the detection limit by this method is 1 wt%) and
bottoms sediment and water (BS&W) less than 0.5 vol%. Condensate (30% vol% or more) is
added to bitumen to meet these specifications, producing dilbit which is transported by pipeline.
Fully upgraded bitumen (SCO) has been processed to reduce viscosity, sulfur, TAN, MCR, and
density (increase in API). Many SCOs are in the range of 830 to 870 kg/m3 (30-38 API). (Crude
Monitor). SCO competes with the growing shale oil supply from the US and with West Texas
Intermediate (WTI) types of crude oil used in refineries that have limited or no capacity for
converting and refining vacuum residue in the crude oil.
The primary target for partially upgraded bitumen is to economically meet the pipeline
specifications with reduced or no diluent addition. Product quality improvement is a side benefit
of meeting pipeline specifications while some entities treat it as another goal of partial upgrading.
3.5 Access to Markets for Alberta Heavy Crude Oils
Market access for crude oils from Alberta is primarily via pipeline to the US. As we will discuss
subsequently in more detail, most Alberta crude oil has historically gone into the US Midwest and
Rocky Mountain regions. Access to the US Gulf Coast has only occurred in the last few years.
0
500
1,000
1,500
2,000
2,500
3,000
3,500
4,000
Pro
ductio
n, K
BP
D
Nonupgraded bitumen removals
Upgraded bitumen removals from Alberta
Alberta demand
Actual Forecast

Bitumen Partial Upgrading 2018 Whitepaper - AM0401A
22
We now provide a brief overview of the US market to better understand opportunities for Alberta
crude oils.
3.5.1 Classification of US Refining Capability by Geographic Regions
The US government divides the US into different geographic regions called Petroleum
Administration Districts for Defense (PADD), shown below in Figure 3.10.
Figure 3.10: US PADDs
(EIA-2, 2017)
3.5.2 US Refining Capability to Process Heavy Crude Oils
Refining capacity is often expressed as amount of atmospheric distillation unit capacity. Trends
in US refining capacity by PADD are shown in Figure 3.11. PADD 3 has the most crude oil refining
capacity followed by PADD 2 and then PADD 5. PADD 4 has the smallest crude oil refining
capacity. PADD 1, which has greater population than any other PADD, has the second smallest
refining capacity. Refined products move by pipeline between PADD 3 and PADD 1 and PADD 3
and PADD 2. There is not much movement of refined products from other PADDs to PADDs 4
and 5. There is little movement of product from PADD 2 to PADD 1. These data show little or no
change in crude oil distillation capacity in PADDs 2 and 4. A slight decline in PADDs 1 and 5 and
a slow increase in crude oil distillation capacity in PADD 3.

Bitumen Partial Upgrading 2018 Whitepaper - AM0401A
23
Figure 3.11: US Refining Capacity by PADD – Atmospheric Crude Unit Capacity
(EIA-3 Plotted by Jacobs, 2017)
Processing heavy crude oils to maximize light transportation fuels, requires bottoms conversion.
Coking is the most common type of bottoms conversion in US refineries. Figure 3.12 shows the
change in coking capacity in US refineries over time. PADDs 2 and 3 have added coking capacity.
PADD 1 has seen a small increase in coking capacity. PADDs 4 and 5 have seen little change in
coking capacity.
Figure 3.12: Coking Capacity by US PADD
(EIA-3 Plotted by Jacobs, 2017)
0
2,000
4,000
6,000
8,000
10,000
12,000
2010 2011 2012 2013 2014 2015 2016 2017
Cru
de
Dis
tilla
tio
n C
ap
acity,
KB
PD
PADD 3
PADD 1
PADD 2
PADD 5
PADD 4
0
200
400
600
800
1000
1200
1400
1600
1800
2010 2011 2012 2013 2014 2015 2016 2017
Ca
pa
city,
KB
PS
D
PADD 5
PADD 3
PADD 2
PADD 1PADD 4

Bitumen Partial Upgrading 2018 Whitepaper - AM0401A
24
Figure 3.13 shows the distribution of coking capacity as a percent of atmospheric crude oil
distillation capacity in different US PADDs. PADD 5 has the most coking capacity as a percent of
crude oil distillation capacity. PADD 1 has the least. PADD 2 has added coking capacity to process
heavier crude oils. PADD 4 has similar coking capacity as percent of crude distillation capacity as
PADD 2. The apparent growth in coking capacity as a percent of crude distillation capacity in
PADD 5 is mainly a result of reduced crude distillation capacity.
Figure 3.13: Coking Capacity– as Percent of Crude Distillation Capacity
(EIA-3 Plotted by Jacobs, 2017)
3.5.3 Shipment of Crude Oil from Alberta
PADDs 2 and 4 have been supplied with Alberta crude oil for some time via pipeline. Access to
the US Gulf Coast (PADD 3) has been established in the last few years and additional pipeline
transport capacity is likely. There is limited access to the Canadian West Coast near Vancouver,
which limits access to PADD 5. There is no access for Alberta crude oils to the Canadian East
Coast via pipeline. Plans for new pipeline capacity to either Canadian coast are on hold. Kinder
Morgan is in the process of final approval for its Trans Mountain pipeline expansion from the
industrial heartland of Alberta to Burnaby, BC, which will triple its capacity to 890 KBPD. (Gordon,
2018)). Figure 3.14 shows the pipeline map of Canada and the US. (CAPP-2, 2017)
Rail is another option for transporting heavy crude oil from Alberta. It is more expensive and not
a major transportation route for Canadian crude oil in the US. Figure 3.15 shows Canadian crude
oil transport to the US since 2012. Figure 3.16 shows transport of Canadian crude oil to PADD 2
and Figure 3.17 shows transport of Canadian crude oil to PADD 3. There is little crude oil transport
by rail to PADDs 1,4, or 5. These data are from the EIA, and do not report from where in Canada
0
2
4
6
8
10
12
14
16
18
20
2010 2011 2012 2013 2014 2015 2016 2017
Ca
pa
city,
% o
f C
rud
e D
ist C
ap
acity PADD 3
PADD 2
PADD 4
PADD 1
PADD 5

Bitumen Partial Upgrading 2018 Whitepaper - AM0401A
25
the crude oil is sourced (EIA-4, 2017), (EIA-5, 2017). We assume that most of this crude is from
Alberta, as AER and CAPP show Alberta to be the major source of crude oil from Canada.

Bitumen Partial Upgrading 2018 Whitepaper - AM0401A
26
Figure 3.14: Canadian and US Pipelines (CAPP)
(CAPP-2, 2017)

Bitumen Partial Upgrading 2018 Whitepaper - AM0401A
27
Figure 3.15: Transport of Canadian Crude Oil to the US
(EIA-4, 2017) (EIA-5, 2017)Analyzed and plotted by Jacobs
Figure 3.16: Transport of Canadian Crude Oil to PADD 2
(EIA-4, 2017) (EIA-5, 2017); analyzed and plotted by Jacobs
0
500
1,000
1,500
2,000
2,500
3,000
3,500
4,000
Cru
de
Oil
Co
nsum
ptio
n, K
BP
D
Rail US
Other US
0
500
1,000
1,500
2,000
2,500
3,000
3,500
4,000
Cru
de
Oil
Co
nsum
ptio
n, K
BP
D
Rail PADD 2
Other PADD 2

Bitumen Partial Upgrading 2018 Whitepaper - AM0401A
28
Figure 3.17: Transport of Canadian Crude Oil to PADD 3
(EIA-4, 2017) (EIA-5, 2017); analyzed and plotted by Jacobs
With plans to increase heavy crude oil production in Alberta by 1.3 MM BPD by 2030, where will
these additional barrels go? Is future demand for US refined products sufficient? is the US crude
market big enough for this additional Alberta crude oil?
As discussed above, US refining capability has not changed much over the last seven years.
According to the EIA, operating crude oil distillation capacity has grown less than 1%/year over
this period. Further, US refined product demand is expected to remain relatively flat in the future.
Projections by the EIA of the hydrocarbon portion of gasoline, jet fuel, and diesel fuel demand in
their Annual Energy Outlook show gasoline demand declining by 1.2% per year, jet fuel demand
increasing by 1.4% per year, and diesel fuel demand decreasing by 0.2% per year (Figure 3.18)
(EIA-6, 2017).
Much of the decline in US fuel demand is a result of higher corporate average fuel economy
(CAFE) standards for light duty vehicles and higher efficiency standards for heavy duty vehicles
(EIA-6, 2017), (NHTSA, 2017), (EPA, 2016). Reduced hydrocarbon based fuel use also results
from increased use of renewable and alternative fuels (EPA RFS, 2018).
Future opportunity to process more heavy crude oil from Alberta will result from displacing crude
oil from other suppliers.
0
500
1,000
1,500
2,000
2,500
3,000
3,500
4,000
Cru
de
Oil
Co
nsum
ptio
n, K
BP
D
Rail PADD 3
Other PADD 3

Bitumen Partial Upgrading 2018 Whitepaper - AM0401A
29
Figure 3.18: US Demand Forecast for Light Transportation Fuels: Hydrocarbon Only
(EIA-6, 2017); Plotted by Jacobs
Let us next look in more detail at the US market for crude oils by quantity refined, by country of
origin and by API gravity.
3.6 US Markets for Canadian Crude Oil
In 2016, the US refined 16.3 MM BPD of crude oil (EIA-11) . Of this, 7.9 MM BPD were supplied
by imports and 8.4 MM BPD were supplied by domestic production. Let us next look at the
countries supplying crude oil and where these crude oils are refined in the US.
According to the US EIA (EIA-4, 2017), Canada supplied 3.3 MM BPD of crude oil in 2016, 41%
of crude oil imported to the US in that year. In 2016, Saudi Arabia supplied 1.1 MM BPD,
Venezuela supplied 0.7 MM BPD, and Mexico supplied 0.6 MM BPD of crude oil to the US. Figure
3.19 shows the top ten suppliers of imported crude oils to the US and the percent of 2016 crude
oil demand supplied by domestic production.
0
2
4
6
8
10
2015 2020 2025 2030 2035 2040
Pro
du
ct,
MM
BP
D
Jet
Diesel w/o Bio/Renewable Diesel
Gasoline w/o Ethanol

Bitumen Partial Upgrading 2018 Whitepaper - AM0401A
30
Figure 3.19: Supply of Crude Oil to US Refineries in 2016
(EIA-4, 2017); Analyzed and plotted by Jacobs
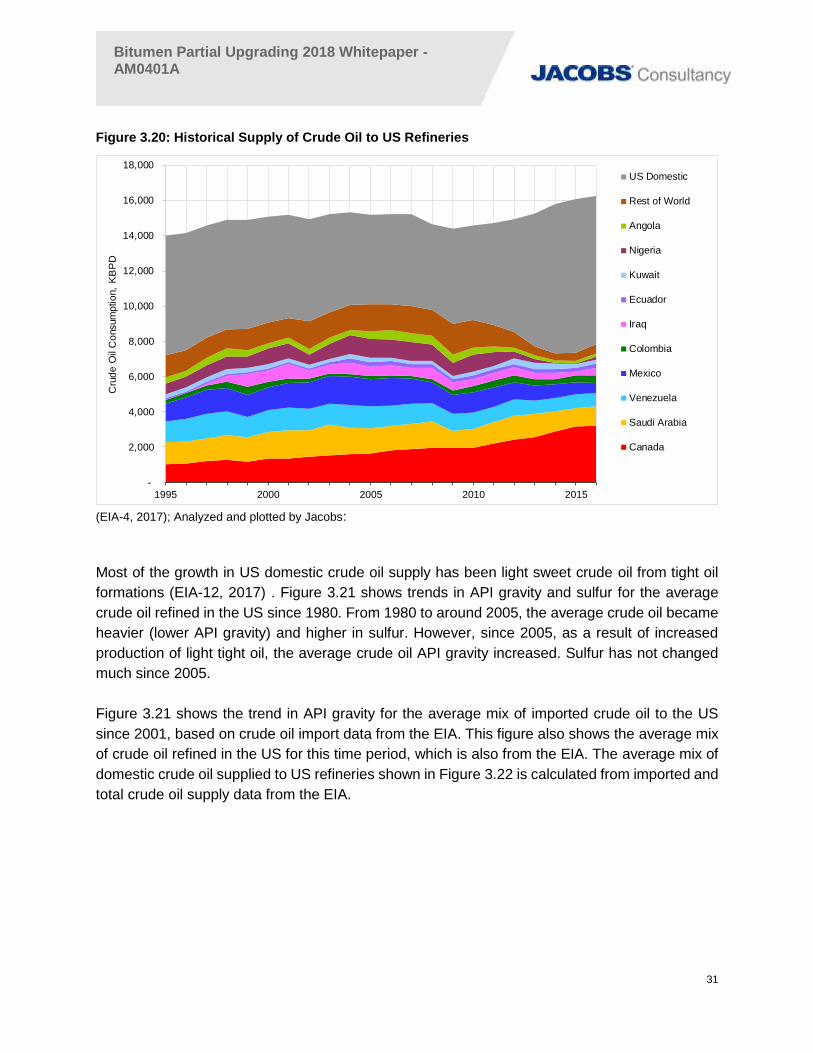
Figure 3.20 shows the historical supply of crude oil to the US from the top ten suppliers, the rest
of the world, and US domestic production (EIA-4, 2017). The countries tracked in this figure were
the top ten suppliers of crude oil to the US in 2016. Overall demand for crude oil in the US has
grown by 0.7% per year from 2006 to 2016. US domestic supply of crude oil has grown by 5.1%
per year over this period. Canadian crude oil supply to the US has grown by 6% per year since
2006.
US Domestic52%
Canada20%
Saudi Arabia7%
Venezuela4%
Mexico4%
Colombia3%
Iraq3%
Ecuador1%
Kuwait1%
Nigeria1%
Angola1%
Rest of World3%
Bitumen Partial Upgrading 2018 Whitepaper - AM0401A
31
Figure 3.20: Historical Supply of Crude Oil to US Refineries
(EIA-4, 2017); Analyzed and plotted by Jacobs:
Most of the growth in US domestic crude oil supply has been light sweet crude oil from tight oil
formations (EIA-12, 2017) . Figure 3.21 shows trends in API gravity and sulfur for the average
crude oil refined in the US since 1980. From 1980 to around 2005, the average crude oil became
heavier (lower API gravity) and higher in sulfur. However, since 2005, as a result of increased
production of light tight oil, the average crude oil API gravity increased. Sulfur has not changed
much since 2005.
Figure 3.21 shows the trend in API gravity for the average mix of imported crude oil to the US
since 2001, based on crude oil import data from the EIA. This figure also shows the average mix
of crude oil refined in the US for this time period, which is also from the EIA. The average mix of
domestic crude oil supplied to US refineries shown in Figure 3.22 is calculated from imported and
total crude oil supply data from the EIA.
-
2,000
4,000
6,000
8,000
10,000
12,000
14,000
16,000
18,000
1995 2000 2005 2010 2015
Cru
de
Oil
Co
nsum
ptio
n,
KB
PD
US Domestic
Rest of World
Angola
Nigeria
Kuwait
Ecuador
Iraq
Colombia
Mexico
Venezuela
Saudi Arabia
Canada

Bitumen Partial Upgrading 2018 Whitepaper - AM0401A
32
Figure 3.21: Change in API Gravity and Sulfur of Crude Oil Refined in US
(EIA-7, 2017); Plotted by Jacobs
Figure 3.22: Change in API Gravity of US Crude Oil Supply Since 2001
(EIA-7, 2017) (EIA-8, 2017); Domestic crude API estimated by Jacobs
These results show that the mix of US domestic crude oils is getting lighter and the mix of imported
crude oils is getting heavier. However, the overall mix of crude oils refined in the US is getting
only slightly lighter. This is consistent with how crude oils are chosen and processed: refiners
choose crude oils based on price and the ability of their refinery to meet market demand for refined
products while maximizing their profits. Although crude oils can be substitutes for each other,
30.0
30.5
31.0
31.5
32.0
32.5
33.0
0.00
0.20
0.40
0.60
0.80
1.00
1.20
1.40
1.60
1980 1990 2000 2010 2020
Cru
de
Oil A
PI
Gra
vit
y
Cru
de
Oil S
ulf
ur,
wt%
SulfurAPI
24
26
28
30
32
34
36
38
Nov-2001 Nov-2003 Nov-2005 Nov-2007 Nov-2009 Nov-2011 Nov-2013 Nov-2015
Cru
de
Oil A
PI
Gra
vit
y
Imported Crude API
Domestic Crude API
US Crude Avg API

Bitumen Partial Upgrading 2018 Whitepaper - AM0401A
33
refiners will keep the overall properties of the crude oil mix they process in a fairly narrow range
to match the refinery’s processing capability. It is expensive to make major processing changes
in a refinery to accommodate a crude oil that changes the refinery’s preferred crude oil mix.
US refining capability has not changed much since 2010. As discussed above, and shown in
Figures 3.10 and 3.11, the US has not undergone significant change in major refinery distillation
capacity or coking (bottoms conversion) capacity since 2010, which means that the overall crude
processed has not changed much.
The next discussion will look at crude imports into the US to identify opportunities for the additional
heavy bitumen based crude oil from Alberta, either as dilbit or partially upgraded bitumen.
3.6.1 20-25 API Gravity Crude Oil Imported into the US
Let us focus on crude oils in the range 20-25 API range, to better understand US markets for
partially upgraded bitumen from Alberta. Pipelines from Canada require Canadian heavy crude
oil to be greater than 19 API gravity and less than 350 cSt. To meet this viscosity specification,
most heavy Canadian crude oil is a minimum of 20 API gravity and we focus on this range. Figure
3.23 shows US import of crude oils with API gravity in 20-25 API gravity range. Canada is the
largest and growing supplier of crude oils in this range. Other countries, notably Mexico and
Venezuela show declining supply of crude oil in this API range. There is more discussion on the
US crude markets in Appendix D.
Figure 3.23: US Crude Import 20-25 API Gravity
(EIA-9, 2017); Analyzed and plotted by Jacobs
0
500
1,000
1,500
2,000
2,500
3,000
3,500
2007 2008 2009 2010 2011 2012 2013 2014 2015 2016
KB
PD
Rest of World
CHAD
SAUDI ARABIA
BRAZIL
ANGOLA
VENEZUELA
COLOMBIA
IRAQ
ECUADOR
MEXICO
CANADA

Bitumen Partial Upgrading 2018 Whitepaper - AM0401A
34
3.6.2 20-25 API Gravity Crude Oil Imported into PADD1
The number of operating refineries has decreased in PADD 1 since 2010 as has crude distillation
capacity (Appendix D). This PADD has little coking capacity. Figure 3.24 shows crude oil imports
to PADD 1 between 20-25 API. There has been a decline in the amount of crude oil supplied to
PADD 1 in this range from its peak in 2008.
Figure 3.24: Crude Oils Imported to PADD 1 20-25 API Gravity
(EIA-9, 2017)Analyzed and plotted by Jacobs
PADD 1 has historically not been a market for Alberta heavy crude oils. It is logistically distant
from Alberta and lacks bottoms conversion capacity. Most crude oils imported from Canada to
PADD 1 are in the range of 30-35 API (Appendix D) and are from Canada’s east coast.
3.6.3 Crude Oil Imported into PADD2
PADD 2 has seen no increase in crude atmospheric distillation capacity. But has seen small
increases in vacuum distillation and coking capacities (Appendix D). PADD 2 has seen big
changes in the import of crude oil in the 20-25 API range. Nearly all of this oil came from Canada
(Figure 3.25).
0
50
100
150
200
250
300
2007 2008 2009 2010 2011 2012 2013 2014 2015 2016 2017
KB
PD
Rest of World
CHAD
SAUDI ARABIA
BRAZIL
ANGOLA
VENEZUELA
COLOMBIA
IRAQ
ECUADOR
MEXICO
CANADA

Bitumen Partial Upgrading 2018 Whitepaper - AM0401A
35
Figure 3.25: Crude Oils Imported to PADD 2 between 20-25 API Gravity
(EIA-9, 2017); Analyzed and plotted by Jacobs
Most of the growth in imports of crude oil from Canada to PADD 2 have been in the 20-25 API
gravity range (Appendix D). The growth in capacity for Canadian heavy crude oil in the 20-25 API
range seems to be slowing. Further capacity for this type of crude must be found elsewhere.
3.6.4 20-25 API Gravity Crude Oil Imported into PADD3
PADD 3 has seen a small increase in crude atmospheric distillation capacity and a small increase
in vacuum distillation capacity and coking capacity (Appendix D).
PADD 3 has seen a decline in imports of crude oil in the 20-25 API range. Most of this crude oil
came from Mexico. There has been an increase in imports in this API range from Canada,
especially since 2014 (Figure 3.26).
0
200
400
600
800
1,000
1,200
1,400
1,600
2007 2008 2009 2010 2011 2012 2013 2014 2015 2016
KB
PD
Rest of World
CHAD
SAUDI ARABIA
BRAZIL
ANGOLA
VENEZUELA
COLOMBIA
IRAQ
ECUADOR
MEXICO
CANADA

Bitumen Partial Upgrading 2018 Whitepaper - AM0401A
36
Figure 3.26: Crude Oils Imported to PADD 3 between 20-25 API Gravity
(EIA-9, 2017); Analyzed and plotted by Jacobs
3.6.5 20-25 API Gravity Crude Oil Imported into PADD4
PADD 4 has seen a small increase in crude atmospheric distillation capacity, a small increase in
vacuum distillation capacity, and no increase in coking capacity (Appendix D).
PADD 4 has seen little or no change in imports of crude oil in the 20-25 API range. All of this oil
came from Canada (Figure 3.27).
Figure 3.27: Crude Oils Imported to PADD 4 between 20-25 API Gravity
(EIA-9, 2017); Analyzed and plotted by Jacobs
0
200
400
600
800
1,000
1,200
1,400
1,600
1,800
2,000
2007 2008 2009 2010 2011 2012 2013 2014 2015 2016
KB
PD
Rest of World
CHAD
SAUDI ARABIA
BRAZIL
ANGOLA
VENEZUELA
COLOMBIA
IRAQ
ECUADOR
MEXICO
CANADA
0
20
40
60
80
100
120
140
160
180
200
2007 2008 2009 2010 2011 2012 2013 2014 2015 2016
KB
PD
Rest of World
CHAD
SAUDI ARABIA
BRAZIL
ANGOLA
VENEZUELA
COLOMBIA
IRAQ
ECUADOR
MEXICO
CANADA

Bitumen Partial Upgrading 2018 Whitepaper - AM0401A
37
3.6.6 20-25 API Gravity Crude Oil Imported into PADD 5
PADD 5 has seen a decline in the number of operating refineries since 2010 but very little change
in overall processing capabilities. Crude atmospheric distillation capacity has decreased slightly
as has vacuum distillation capacity and coking capacity (Appendix D). PADD 5 has seen little or
no change in imports of crude oil in the 20-25 API range. This crude oil comes from a number of
countries; very little comes from Canada (Figure 3.28). California has its own supply of heavy
crude oil from the San Joaquin valley.
Figure 3.28: Crude Oils Imported to PADD 5 between 20-25 API Gravity
(EIA-9, 2017); Analyzed and plotted by Jacobs
3.7 Market Opportunities for Alberta Heavy Crude Oils in the US
CAPP and AER both project that by 2030, bitumen production in Alberta will increase by around
1.3 MM BPD. This bitumen, if shipped via pipeline as dilbit, will be in the 20-25 API gravity range.
Access to the US market for this additional Alberta heavy crude oil requires displacing crude oil
supplied by other countries. PADD 1 has little or no access to heavy oil from Alberta and no
capacity to refine this crude. PADD 5 has the conversion capacity to process heavy crude oils,
but access to heavy crude oil from Alberta is limited. Further, California is well supplied by its own
heavy crude oil, and refiners will incur costs if greenhouse gas emissions from refining heavy
crude oils increase. PADDs 2 and 4 are fully supplied with crude oil from Alberta. Only PADD 3
has potential room for Alberta heavy crude oil. Figures 3.29-3.32 show the import of crude oils
into US PADDs by API gravity in 2016 and the potential crude that could be displaced in PADD 3
by Canadian crude oil.
0
50
100
150
200
250
300
2007 2008 2009 2010 2011 2012 2013 2014 2015 2016
KB
PD
Rest of World
CHAD
SAUDI ARABIA
BRAZIL
ANGOLA
VENEZUELA
COLOMBIA
IRAQ
ECUADOR
MEXICO
CANADA

Bitumen Partial Upgrading 2018 Whitepaper - AM0401A
38
Figure 3.29: 2016 Imports of < 20 API Crude Oil
(EIA-9, 2017); Analyzed and plotted by Jacobs
Figure 3.30: 2016 Imports of 20-25 API Crude Oil
(EIA-9, 2017); Analyzed and plotted by Jacobs
Figure 3.31: 2016 Imports of 25-30 API Crude Oil
(EIA-9, 2017); Analyzed and plotted by Jacobs
-100
100
300
500
700
900
1,100
1,300
1,500
PADD1 PADD2 PADD3 PADD4 PADD5
Cru
de
Oil
Sup
plie
d, K
BP
D Rest of WorldAngolaKuwaitNigeriaEcuadorIraqColombiaMexicoVenezeulaSaudi ArabiaCanada
940 KBPD
-100
100
300
500
700
900
1,100
1,300
1,500
PADD1 PADD2 PADD3 PADD4 PADD5
Cru
de
Oil
Sup
plie
d, K
BP
D Rest of WorldAngolaKuwaitNigeriaEcuadorIraqColombiaMexicoVenezeulaSaudi ArabiaCanada
860 KBPD
-100
100
300
500
700
900
1,100
1,300
1,500
PADD1 PADD2 PADD3 PADD4 PADD5
Cru
de
Oil
Sup
plie
d, K
BP
D Rest of WorldAngolaKuwaitNigeriaEcuadorIraqColombiaMexicoVenezeulaSaudi ArabiaCanada
270 KBPD

Bitumen Partial Upgrading 2018 Whitepaper - AM0401A
39
Figure 3.32: 2016 Imports of 30-40 API Crude Oil
(EIA-9, 2017); Analyzed and plotted by Jacobs
The quantity of crude oil that could potentially be displaced in PADDs 3 and 5 by Canadian crude
oil is shown in Table 3.3. These results are based on 2016 import volumes. The analysis here
shows potential markets. Whether the markets are available to this oil depends on many factors
Determining markets for crude oils depends on price and refining capability. Refiners routinely
use linear programming with sophisticated models to make decisions on which crude to process
to maximize their economic return. It also depends on the response of crude oils suppliers who
will be displaced by Canadian crude oil.
Table 3.3: Potential Crude Oil Displacement by Alberta Crude Oils
Crude Oil API Range
< 20 20-25 25-30 30-40
PADD3 KBPD 940 860 270 920
PADD5 KPBD 80 230 130 490
Most crude < 25 API is from Venezuela and Mexico and could be replaced by dilbit or partially
upgraded bitumen. Crude oil 25-40 API is primarily from Ecuador, Colombia, Iraq, and Saudi
Arabia and could be replaced by SCO from a full upgrading operation. However, adding new full
bitumen upgrading capacity in Alberta is expensive and not planned at this time. Also, consider
that dilbit is around a 30/70 mixture of condensate (API gravity ~65) and bitumen (API gravity ~
8-12). The US is awash in condensate as a result of fracking to produce natural gas and light tight
crude oil. Diluent removed from imported dilbit will compete with this US domestic condensate.
Demand for non-Canadian crude oil < 20 API in PADD 3 was 940 KBPD in 2016. Demand for this
range of crude in PADD 5 was 80 KBPD. For these markets to be open to Canadian crude oil,
either the pipeline specifications must be relaxed or it must be transported by rail.
-100
100
300
500
700
900
1,100
1,300
1,500
PADD1 PADD2 PADD3 PADD4 PADD5
Cru
de
Oil
Sup
plie
d, K
BP
D Rest of WorldAngolaKuwaitNigeriaEcuadorIraqColombiaMexicoVenezeulaSaudi ArabiaCanada
920 KBPD

Bitumen Partial Upgrading 2018 Whitepaper - AM0401A
40
The US market for refined products is projected to shrink by 2030 according to the EIA, and
discussed above. US refineries, especially in PADDs 3 and 5 have ready access to crude oils that
can be delivered via blue water transport (large tanker ships). PADDs 3 and 5 will be challenged
to absorb the 1.3 MM BPD of additional bitumen projected to be supplied by Alberta by 2030.
PADDs 2 and 4 are fully supplied by Canada and there are no imports of heavy crude oil from
other countries to these PADDs. Without significant, expensive refinery investment, there is not
much room for additional heavy Alberta crude oil in PADDs 2 and 4. If the additional heavy crude
oil from Alberta cannot be placed in PADDs 3 or 5, it will have to find other markets or be upgraded
to better fit the existing US refinery configurations.
3.8 Market Opportunities for Alberta Heavy Crude Oils in Asia
Potential markets for Alberta crude oil are in the EU, Latin America, and Asia. EU refining markets
are not growing. Latin America competes with Alberta for crude markets and its refining capacity
is not growing much. New markets for Alberta crude oils are likely to be in Asia.
Table 3.4 compares refining capacity for major bottoms conversion in China, India, Japan, and
Korea with capacity in PADD 3. Crude oil distillation capacity is shown in KBPD. Major bottoms
processing capacity: vacuum unit, coking unit, thermal cracking, and residue hydrotreating and
hydrocracking are shown as percent of crude capacity. Distance from Alberta to markets is shown
via Houston, using existing pipeline infrastructure, or via Burnaby (or another port in British
Columbia), using what will most likely be new pipeline capacity.
Some observations of the Asian markets are as follows:
• China is expected to add refining capacity to meet demand for products. Security of crude
oil supply is a major issue for China. China has great demand for light naphtha in
condensate for petrochemical production which could actually make dilbit more appealing
than it is otherwise in North America.
• Japan has the most vacuum unit capacity relative to crude unit capacity of the Asian
countries that could be targeted for Alberta crude oil. However, the Japanese refining
industry has been shrinking for a number of years.
• Japan has residue hydrotreating capacity to make sweet (low sulfur) fuel oil. This capacity
does not provide much conversion of residue. Japan could be a target for partially
upgraded bitumen that incorporates asphaltene rejection to reduce MCR.
• South Korea has little or no coking capacity but has residue FCC units that can handle
some bottoms material and regularly processes heavy oil, up to the capability of these
units. South Korea could be a target for partially upgraded bitumen produced with
asphaltene rejection to reduce MCR. Petroleum refining in South Korea is modern and
designed to supply refined products for export.

Bitumen Partial Upgrading 2018 Whitepaper - AM0401A
41
• India has more coking capacity than other Asian countries. Since publication of the data
used in Table 3.4, India has added more coking capacity. India is an excellent target
market for both unconverted and partially converted bitumen. India has great demand for
light naphtha in condensate for petrochemical production. India has growing domestic
demand but also growing capability to supply products for export. However, India is close
to the oil markets in the Middle East.
• Distances to Asian markets are around 14,000 miles via Houston, which includes 2,700
miles of pipeline from Alberta to Houston.
• Distances to Asian markets via Vancouver are around 6,000 miles to China, Japan, and
South Korea, but around 12,000 miles to Mumbai. These distances include the 720-mile
pipeline from Alberta to Burnaby B.C.
• None of the Asian countries are as well positioned to process Alberta heavy crude oil as
PADD 3
• Refining systems with residue hydrogen addition capacity can process partially upgraded
bitumen. Table 3.4 shows the residue hydrogen addition capacity in each region. If we
assume that 50% of the material in PUB must be treated via residue hydrogen addition,
these data suggest that the regions shown in Table 3.4 could process twice the capacity
shown for existing residue hydrogen addition, or around 5 MM BPD of PUB.

Bitumen Partial Upgrading 2018 Whitepaper - AM0401A
42
Table 3.4: Asian Refining Capacity and Distance from Alberta Production
China India Japan Korea US PADD 3
Crude Capacity KBPD 7,066 4,343 4,423 2,959 9,211
Process Capacity to Crude Capacity
Vacuum Unit % of Crude Cap. 3.4 18.7 36.6 17.4 45.2
Coking
Fluid % of Crude Cap. - 3.1 1.2 - 0.7
Delayed % of Crude Cap. 2.2 0.8 1.6 0.6 15.2
Total Coking % of Crude Cap. 2.2 3.9 2.8 0.6 15.9
Thermal Cracking
Visbreaking % of Crude Cap. - 1.7 0.5 - 0.1
Residue Hydrogen Addition
Residue Hydrocracking % of Crude Cap. - - 1.1 8.2 1.6
Residue Hydrotreating % of Crude Cap. 1.9 - 10.3 4.9 2.0
Residue Hydrotreating/ Hydrocracking % of Crude Cap. 1.9 - 11.4 13.1 3.6
Residue Hydrogen Addition capacity KBPD 268 1008 775 663
Distance
Alberta to Asia via Houston
Bluewater Miles 11,500 11,500 11,000 11,000 -
Pipeline Alberta to Houston Miles 2,700 2,700 2,700 2,700 2,700
Total Miles 14,200 14,200 13,700 13,700 2,700
Alberta to Asia via Vancouver
Bluewater Miles 5,900 10,900 5,300 5,300 -
Pipeline Alberta to Vancouver Miles 720 720 720 720 -
Total Miles 6,620 11,620 6,020 6,020 -
Sources: Refining capacity: (Pennwell, 2014); Sea Distances: (Sea-Distances.org, 2017); Pipeline distances (Kinder Morgan, 2017)and (TransCanada, 2017)

Bitumen Partial Upgrading 2018 Whitepaper - AM0401A
43
3.9 Pricing Heavy Crude Oil
Crude oil prices quoted by analysts generally refer to a small group of specific crude oils
(benchmark crude oils) that are widely and actively traded. Use of benchmark crudes makes it
easier for buyers and sellers to price the various crude oils produced around the world.
Benchmark crude oils typically have five characteristics in common:
1. Stable and ample production
2. Transparent, free-flowing market located in a geopolitically and financially stable region to
encourage market interaction
3. Adequate storage to encourage market development
4. Delivery points at locations suitable for trade with other markets, enabling arbitrage so that
prices reflect global supply and demand
5. Fungible with ready substitutes
Three of the most significant benchmarks in global crude oil markets are Brent, West Texas
Intermediate (WTI), and Dubai/Oman. Heavy crude oils from Alberta use Western Canadian
Select (WCS) as a benchmark.
Brent, is the most widely used global crude oil benchmark. It includes four separate light, sweet
crude oil streams produced in the North Sea: Brent and Forties (produced offshore UK) as well
as Ekofisk and Oseberg (produced offshore Norway). Brent is used to price light, sweet crude oil
that is produced and traded in not only Europe, the Mediterranean, and Africa but also Australia
and some countries in Asia. It is estimated that 60% of the world’s traded oil is priced off of Brent.
West Texas Intermediate (WTI) is a light, sweet crude oil produced in the United States that is
priced at the crude oil trading hub of Cushing, Oklahoma. WTI is used as a benchmark for other
types of crude oil produced in the United States, such as Mars, a medium, sour crude produced
in the Gulf of Mexico, and Bakken, a light, sweet crude produced in North Dakota. WTI is also
used as a benchmark for imported crude oil produced in Canada, Mexico, and South America. A
major drawback to WTI is that access to the US Gulf Coast and world markets via pipelines is
logistically more complex than for waterborne crude oils like Brent.
Dubai/Oman is a third major benchmark crude. The prices of Dubai and Oman crudes, both of
which are medium and sour, are often averaged to create a benchmark that is typically used to
price crude oil produced in the Middle East and exported to Asian markets. Dubai crude oil
production has steadily declined for more than two decades, and in 2013 was only 34,000 BPD.
As a result, Oman crude oil, which reached 0.94 MM BPD of production in 2013, has been used
to support the continued use of Dubai crude as a benchmark. Saudi Aramco uses the Dubai/Oman
benchmark when determining the price of its crude oil sold for delivery to Asia.

Bitumen Partial Upgrading 2018 Whitepaper - AM0401A
44
Western Canadian Select (WCS) is a heavy crude oil composed mostly of bitumen blended with
condensate diluents as well as SCO and conventional Alberta crude oils at the large Husky
terminal in Hardisty, Alberta. WCS is one of North America’s largest heavy crude oil streams and
is the benchmark for emerging heavy crude oils delivered to the US Gulf Coast.
Other crude oils can be compared with these benchmarks by agreed-upon differentials, which
take into account factors such as API gravity, sulfur content, sometimes TAN, transportation costs
from production areas to refineries, regional and global supply and demand conditions, including
refinery utilization. Figure 3.33 shows API gravity and sulfur for a number of crude oils.
Figure 3.33: Sulfur and API Gravity of Crude Oils
(EIA-10, 2013)
The price for partially upgraded crude oils would be related to the price of WCS depending on the
changes in partially upgraded crude oil quality. In a 2015 study, Muse Stancil Inc. (Muse Stancil,
2015) identified the following parameters that affect the value to refineries of partially upgraded
crude, relative to diluted bitumen:
• Sulfur content of the crude oil
• Coke-forming tendency of the crude oil, measured as the microcarbon-residue (MCR)
content (see further discussion in Chapter 4).
• Distillate fraction in the crude oil
• Quality of the heavy distillates (vacuum gas oil fraction aromaticity factor)
Crude Oil API Gravity
Cru
de
Oil
Sulf
ur,
wt%

Bitumen Partial Upgrading 2018 Whitepaper - AM0401A
45
There was no direct correlation for value with C5 asphaltene content. This result does not mean
that the asphaltenes are a desirable component in crude oils, but rather that the parameter of
MCR content captured the impact of the concentration of C5 asphaltenes because the two
parameters are cross-correlated.
Crude oil prices received by the producer are net of transportation costs to market. Similar heavy
crude oils from Mexico and Alberta selling for similar prices in Houston will net the producers
different amounts of money. It costs nearly US$10/bbl to ship oil from Fort McMurray to Houston
via pipeline but typically only around a dollar per barrel by ship from the east coast of Mexico.
As discussed above, in the second quarter of 2017, the cost of using diluent to transport bitumen
was around $US14/bbl of bitumen. Eliminating diluent use is the biggest incentive to partial
upgrading. Access to open markets and low cost transportation are key to profitability.
3.10 Other Market Forces Affecting Heavy Crude Oil
The price of heavy crude oils may be affected by restrictions on bunker fuel sulfur under MARPOL
Annex VI and by the availability of low cost LNG on the world market (Jacobs Consultancy, 2017).
Figure 3.34 shows the average price from 2015-2017 for landed LNG in different markets (FERC,
2018).
Figure 3.34: Worldwide Landed LNG Price: Average 2015-2017 – Prices are US$/MM BTU
(FERC, 2018)

Bitumen Partial Upgrading 2018 Whitepaper - AM0401A
46
Although ships may use scrubbers to meet emissions standards of MARPOL VI, which go into
effect January 1, 2020, it is uncertain how many will. The availability of low cost LNG on the world
market may affect demand for heavy fuel oil for marine fuel and stationary use. It is likely that any
heavy fuel oil displaced from marine and stationary use will go into refineries with bottoms
conversion, which could reduce demand for heavy crude oils and increase the light-heavy crude
oil differential.

Bitumen Partial Upgrading 2018 Whitepaper - AM0401A
47
4. Bitumen and Heavy Oil Fundamentals1
4.1 Bitumen Composition
Bitumen and heavy oil are naturally-occurring petroleum materials that are characterized by high
density and high viscosity. Bitumen has a density of 1,000 kg/m3 or higher, which corresponds to
a gravity of 10 °API or less. Heavy oil is commonly defined as petroleum material with density
between 922 and 1,000 kg/m3, with a viscosity too high for pipeline transportation at ambient
temperature. A comparison of a variety of crude oils is shown in Figure 4.1 together with the
typical limit for pipeline transportation.
Figure 4.1: Crude Oil Viscosity and Density Comparison
(Gray, 2015)
These materials are part of a continuum of petroleum or crude oil materials. All of the main
components of bitumen and heavy oil are also present in lighter, more valuable crude oils but at
lower concentrations. For convenience, the term “bitumen” will be used throughout this section to
indicate heavy petroleum material, but in every case the same comments will apply to heavy oils.
Petroleum is an extremely complex mixture of hundreds of thousands or millions of chemical
components containing the elements carbon, hydrogen, sulfur, oxygen, nitrogen, vanadium, and
nickel (Gray, 2015) An increase in density is correlated with an increase in carbon, sulfur, and
1Section 4 - Bitumen and Heavy Oil Fundamentals - is by Murray R. Gray
Gravity, oAPI
10 20 30 40 50
Vis
cosity,
mP
a·s
at
15
oC
10-1
100
101
102
103
104
105
106
107
Extra Heavy Oil
Heavy Oil
MediumOil
Light Oil
Condensate
Bitumen
Athabasca
Cold Lake
Lloydminster
Maya
WCS
WTI
Minimum Gravity forPipeline
Maximum Viscosity for PIpeline

Bitumen Partial Upgrading 2018 Whitepaper - AM0401A
48
nitrogen (Gray, 2002), and with an increase in the size of molecules. Bitumens are richer in these
elements and in larger molecules than lighter crude oils. In addition to elemental analysis and
density, petroleum materials are characterized by their boiling fractions, by solubility, and by
specific assays for chemical functional groups or reaction properties. Typical data for Athabasca
bitumen are listed in Table 4.1. Other bitumens and heavy oils from Western Canada have similar
properties. Rather than listing all of the terminology for petroleum composition and properties
here, a glossary is attached at the end of this report in Appendix A.
Table 4-1. Composition and properties of Athabasca bitumen
Component Units Value
Carbon wt% 83.1
Hydrogen wt% 10.6
Sulfur wt% 4.8
Nitrogen wt% 0.4
Vanadium wt ppm 145
Nickel, ppm by weight wt ppm 75
Density kg.m3 1015
Gravity °API 7.9
Viscosity at 25°C cP or mPa·s 300,000
Boiling fractions
Light gas oil (LGO, 177-343 C) wt% 10
Heavy gas oil (HGO, 343-524 C) wt% 40
Vacuum residue, 524C + wt% 50
Micro carbon residue (MCR) wt% 13.6
Asphaltene, heptane (C7) insoluble wt% 11.5
Asphaltene, pentane (C5) insoluble wt% 17.2
(Gray, 2015)
Laboratory assays determine the boiling fractions in petroleum and indicate how much material
will vaporize at a given temperature. This information provides insight on how much material is
available to process into different refinery products. Due to the abundance of sulfur and nitrogen
in bitumen, the low concentration of hydrogen, and the large size molecules in bitumen,
approximately half of the bitumen will not distill even at a maximum temperature of 350°C under
vacuum. This material is called vacuum residue, which has normal boiling points at atmospheric
pressure ranging from 524C to over 720C. When this fraction is subjected to temperatures over
350°C, it reacts to form smaller molecules and solid insoluble material called “coke.” The tendency
of bitumen to form coke is measured under standardized reaction conditions as either the
Conradson Carbon Residue (CCR) or the Micro-Carbon Residue (MCR), reported as weight
percent of sample. These two methods give equivalent results (ASTM, 2017). The weight percent

Bitumen Partial Upgrading 2018 Whitepaper - AM0401A
49
MCR indicates the amount of difficult to process, carbon rich material in a crude oil or bitumen
and is an important indicator for refinery processing.
The solubility of crude oil components is also important for production and upgrading, and
standard assays are used to test solubility behavior. When bitumen is diluted in paraffinic
solvents, the densest fraction becomes insoluble and precipitates as a solid. This fraction is called
asphaltene, and contributes to the weight of the vacuum residue fraction. The asphaltene content
of crude oils is determined using a standard procedure using dilution in either n-pentane, to give
C5-asphaltenes, or n-heptane to give C7-asphaltenes. Both results are reported as mass of
asphaltene precipitate per mass of crude oil or bitumen sample. The fraction of crude oil that does
not precipitate is commonly separated into saturates, aromatics, and resins by chromatography.
The resin fraction is highest in the vacuum residue, along with the asphaltene fraction.
A significant fraction of the asphaltene material is present as aggregates of molecules with a size
in the range of 2-20 nm (Yarranton, et al., 2013)). The aggregation of these components prevents
comprehensive molecular analysis by any techniques available currently (McKenna, et al., 2013),
(Chacon-Patino, 2017) and gives rise to complex behavior at interfaces. Changes in the
asphaltene aggregates are important in determining the viscosity of bitumen blends and in the
formation of coke (Wiehe, 1993)
When crude oils are processed at high temperature, the solubility of the asphaltene components
tends to decrease. These changes are normally tested by determining the fraction of the product
blend that will not dissolve in toluene. Initially, bitumen is completely soluble in toluene, except for
mineral contaminants such as clay. With exposure to high temperatures, coke can begin to form,
giving material that is toluene-insoluble. A second type of assay examines the compatibility of the
processed crude oil with other streams. Compatibility can be examined using spot-tests on filter
paper, microscopic examination after dilution with solvents, or titration measurements (Wiehe,
2000), (Wiehe, 2008).
4.2 Physical Properties and Dependence on Composition
The primary goal of partial upgrading is to enhance the transportability of bitumen, which focuses
on the crucial properties of viscosity and density. The reduction of viscosity to 350 cSt at pipeline
operating temperature is the most important target, because this viscosity most commonly
controls the amount of diluent required to make bitumen transportable by pipeline. For example,
Access Western Blend (AWB) cycles seasonally from 20.3 API in summer to 23.3 API in winter,
with a long-term average of 21.8 API (Crude Monitor, 2017). However, for dilbits produced from
other bitumen, density may be the limiting specification in summer. As a secondary benefit, partial
upgrading may enhance the value of the crude oil by reducing the content of low value or
problematic components. In contrast to partial upgrading, full upgrading of bitumen, currently

Bitumen Partial Upgrading 2018 Whitepaper - AM0401A
50
practiced in Alberta and Saskatchewan is focused on improving the value of the crude oil well
beyond the minimum transportation specifications.
4.2.1 Reduction in Bitumen Viscosity
The high viscosity of bitumen is due to the high-boiling components in the vacuum residue
fraction, which includes the asphaltenes. The strong physical interactions of the large molecules
and the aggregated asphaltene species give rise to this high viscosity. Viscosity is extremely
sensitive to temperature; an increase in temperature reduces the strength of the molecular
interactions and reduces the viscosity. As a blend of these heavy components with lighter
material, the viscosity of bitumen is also extremely sensitive to the presence of low-boiling
hydrocarbons, i.e. solvents (Seyer, et al., 1989). Both temperature and composition can reduce
the viscosity by orders of magnitude, from 106 mPas to 102 mPas or less ( (Seyer, et al., 1989) ).
An example of the reduction in viscosity due to increase in temperature and solvent addition is
shown in Figure 4.2. Biases in measurement of high viscosities are common, due to viscous
heating during experiments or the presence of residual solvents (Seyer, et al., 1989), (Bazyleva,
et al., 2010)). Errors are much less significant for diluted or upgraded bitumens. In general, any
change in viscosity due to composition or temperature, in the absence of chemical reactions, are
completely reversible. Once the composition or temperature is returned to the original condition,
the viscosity will return to its original value within a few days.
Figure 4.2: Viscosity Reduction via Temperature and/or Solvent Addition
Data are for Athabasca bitumen from (Zhang, 2012)MSc Thesis, U of Alberta, courtesy of JH Masliyah. The left panel
shows viscosity as a function of temperature, and the right panel shows viscosity as a function of addition of naphtha
as a solvent. To achieve a viscosity of 100 Pa-s (A), heating to 40C or addition of 3.5% solvent are equivalent.
Reduction to 3Pa-s requires 80C or 18% solvent. Achieving a pipeline viscosity of approximately 0.3 Pa-s requires
around 33% solvent.
(A)
(B)
No Solvent addition 25 oC temperature

Bitumen Partial Upgrading 2018 Whitepaper - AM0401A
51
In order to achieve a reduction in viscosity, the chemical composition of the bitumen mixture must
change due to physical removal or addition of components, or the structure of the components
must change due to chemical reaction. The following changes are known to reduce viscosity:
• Increase in the fraction of low-boiling components, by adding a solvent or diluent (physical
change), or by cracking large molecules to make small solvent-like fragments (chemical
reaction)
• Decrease in the fraction of high boiling components, e.g. vacuum residue and asphaltene,
by physical removal or chemical reaction. For the asphaltene fraction, the volume fraction
in solution is particularly important (Barre, et al., 2008)
• Reduction in density, due to chemical reactions such as hydrogenation or desulfurization.
Models for viscosity of bitumen and diluted bitumen give directional information on the
contributions from the main components as discussed above (Yarranton, et al., 2009) but the
complexity of the vacuum residue components and asphaltenes requires experimental data for
verification.
4.2.2 Reduction in Bitumen Density
The target for current pipeline operation is a minimum gravity of approximately 19 °API, or a
maximum density of 940 kg/m3. The same factors that reduce viscosity also reduce density: more
light components, less heavy components, and shifting the elemental composition to increase
hydrogen and decrease sulfur and nitrogen content. (Gray, 2002). Reducing the density of
bitumen from approximately 1,000 kg/m3 to approximately 940 kg/m3 requires the addition of
around 24 vol% of 750 kg/m3 density condensate.
4.3 Market Value – Composition Relationships
Blends containing bitumens are discounted relative to light crude oils because the yields of
desirable distillate products are lower and cracking of large components is needed to increase
distillate yield. In addition, more processing is required to remove unwanted contaminants such
as sulfur and metals and achieve the required product specifications. Additional factors that affect
the bitumen price are the acidity of the feed, measured as total acid number (TAN), and the
content of olefins, which arise from thermal cracking. High TAN can result in increased corrosion
of refining equipment. It does not affect refining yields. Refiners that have not upgraded their
refining equipment may not be able to process much high TAN crude oils. Refiners that have
upgraded their metallurgy can process more. The data of Table 4-2 list the main components of
bitumen that change the crude oil properties of interest to refiners.

Bitumen Partial Upgrading 2018 Whitepaper - AM0401A
52
Table 4-2: Effect of Composition Changes on Value of Blends Containing Bitumens
Bitumen Component Crude Oil Properties
Assessed by Refiners
Effect on Refinery
Vacuum residue, including
asphaltenes
Micro Carbon Residue (MCR)
content or Conradson Carbon
(CCR)
C7 Asphaltene content
Reduced yield of distillate,
more coke
Limited capacity for processing
in some units
Sulfur and nitrogen Sulfur and nitrogen, weight% More hydrotreating of products
or discounted value
Metals (V and Ni) Metals, parts per million Catalyst deactivation
Acids in bitumen Total acid number (TAN) Potential for corrosion and
corrosion mitigation costs, or
limits on feed blends
Olefins Weight % olefins by 1H-NMR,
Bromine number, diene number
Potential for fouling in refinery
equipment, and indicator of
unstabilized thermally cracked
material
Aromatic compounds in
distillates
Vacuum gas oil density, sulfur
content, aniline point; Cetane
number of distillates
Yields from refinery processing
and blending into products
The content of nitrogen compounds is not often examined in crude oil marketing because unlike
sulfur, the nitrogen content does not have an environmental impact that is subject to regulation.
However, the presence of high nitrogen levels in bitumen has significant impact on catalytic
processes used to remove sulfur. Nitrogen has significant negative impact on operation of
hydrotreating units in upgraders or refineries. Metals and C7 asphaltene contents are mainly
concerns for catalytic processing of heavy fractions. MCR and Conradson carbon (CCR) are
different analytic methods that measure the coke forming tendencies of the oil. Results from the
two methods are equivalent. (ASTM, 2017)
4.4 Processing Reactions to Improve Properties and Market Value
Dozens of process technologies have been used over the past century to add value to heavy
petroleum fractions by inducing chemical reactions, and many more have been pilot tested. At
the base of this process technology is a very limited range of chemistry, consisting of thermal
reactions, and a limited set of catalytic reactions. This section reviews the main reactions that are
relevant to partial upgrading of bitumen, which emphasises liquid-range products rather than
gases. Data are presented from laboratory experiments under idealized conditions. Chapter 5 will
describe the process technologies that use these reactions to achieve partial upgrading of
bitumen.

Bitumen Partial Upgrading 2018 Whitepaper - AM0401A
53
4.5 Thermal Reactions
Heating of petroleum liquids to over 350°C begins a complex series of reactions at rates that are
sufficiently fast to be of commercial and practical interest. The yields and product properties from
a given feed depend on the time and temperature history of the components, which in turn affect
the formation of vapor phase or solid phase coke. The fundamental reactions are:
• Cracking, which breaks carbon-carbon, carbon-sulfur, and carbon oxygen bonds to
produce liquid and gas products, and reactive species such as olefins and diolefins
• Addition reactions of reactive species in the liquid phase, giving coke precursors
• Hydrogen transfer reactions between hydrogen-rich donor species and hydrogen-deficient
acceptors
4.5.1 Thermal Cracking
Cracking in the liquid phase gives all three reactions, while cracking in the vapor phase gives
mainly cracking, with little addition or hydrogen transfer. Cracking in the vapor phase gives much
higher yields of light olefin products, such as ethylene, propylene, and butylenes. Addition
reactions in the liquid phase increase the concentration of the asphaltene fraction, which
eventually becomes insoluble in the liquid and begins to form solid coke (Wiehe, 1993)).
The most reactive components are in the vacuum residue, while the least reactive components
are in the middle distillate and naphtha fractions. Within the vacuum residue, the reactivity of the
asphaltenes is significantly different. For example, Figure 4.3 shows the conversion of ten
fractions of Athabasca vacuum residue by cracking with and without hydrogen. The ten fractions
were prepared by extraction with supercritical pentane. The heaviest fraction, number 10,
contained most of the asphaltenes (88 wt% C5 asphaltenes). This fraction resulted in lower
conversion to light products than the other fractions but higher coke yield. The asphaltene-rich
fraction 10 gave 29% coke yield (as g coke/g fraction 10) when reacted under nitrogen, compared
to only 2.7 wt% from fraction 1 and 4.7 wt% from fraction 9.

Bitumen Partial Upgrading 2018 Whitepaper - AM0401A
54
Figure 4.3: Reactivity of Heavy Fractions of Athabasca Bitumen at 430C for 1 Hour
(Chung, et al., 1998)
The activation energy for thermal cracking of vacuum residue is in the range 200-250 kJ/mol,
which is consistent with a free-radical chain reaction mechanism (Nelson, 1958), (Gray, 2015)).
Once the conversion of vacuum residue exceeds approximately 20-30%, coke formation can be
a significant operating problem (Nelson, 1958), depending on how the heat is provided to the
reacting liquid. The time to achieve 20% conversion ranges from approximately 1 hour at 365°C
to less than 10 minutes at 400°C.
The data of Figure 4.4 illustrate how the properties of bitumen change with thermal cracking
without formation of insoluble solids. As shown in this figure, viscosity is reduced significantly over
time, but the API gravity of the oil increases only slightly. The lowest viscosity obtained in this
example was still too high for pipeline transport, and the API gravity was still much too low.
Fraction Number
1 2 3 4 5 6 7 8 9 10
Resid
ue C
onvers
ion t
o <
524
oC
,%
0
10
20
30
40
50
60
70
80
Maltene fractions
Asp
ha
lte
ne
Hydrogen at 10 MPa + Catalyst
Nitrogen at 0.24MPa
Hydrogen at 10 MPa
Mean for Fractions 1 - 9
St Dev

Bitumen Partial Upgrading 2018 Whitepaper - AM0401A
55
Figure 4.4: Effect of Thermal Cracking on the Properties Athabasca Bitumen
(Rahimi, et al., 2001). Experiments were in a laboratory batch reactor at maximum temperatures from 423-
449 C. The reaction time is given as equivalent time at 427 C2.
Thermal reactions alter the properties of the asphaltene components, so that they become less
stable in the product oil. The stability of asphaltenes is measured by titrating the sample with the
paraffin n-heptane until precipitation is observed, and the result is expressed as the peptization
value or P-value. Peptization is defined as the dispersion of sub-micron sized particles, or
“colloids” in a liquid, which in this case is the dispersion of asphaltenes in the crude oil. A P-value
of 1.0 indicates that the asphaltenes are on the verge of precipitation without adding any n-
heptane. Higher P-values indicate more stability.
In the example shown in Figure 4.4., the unreacted bitumen has a P-value of 3.4 so that it would
be stable in a mixture with up to 80% diluent. In contrast, the product at the highest reaction time
2 In Figure 3.3, 𝐸𝑞𝑢𝑖𝑣𝑎𝑙𝑒𝑛𝑡 𝑡𝑖𝑚𝑒 = 𝑡𝑖𝑚𝑒 ∙ exp (− (
𝐸𝑎
𝑅) ∙ (
1
𝑇+273−
1
700), with Ea = 50.1 kcal/mol and R = 1.987 cal/mol/K
Vis
cosity, cP
at 25
oC
103
104
105
106
Reaction time, s
0 200 400 600 800 1000 1200
P-v
alu
e
0.5
1.0
1.5
2.0
2.5
3.0
3.5
Gra
vity,
oA
PI
0
2
4
6
8
10
12
Minimum for stability
Bitumen Partial Upgrading 2018 Whitepaper - AM0401A
56
has a P-value of only 1.05, which would begin to precipitate material when mixed with only 25%
diluent (Rahimi, et al., 2001). The minimum recommended P-value is 1.1 in refinery practice
(Rahimi, et al., 2001). The key point is that too much thermal cracking of bitumen gives unstable
products even before coke begins to form. The result is that this processed bitumen may be
incompatible with diluent or with refinery streams. These data show why thermal cracking by itself
cannot achieve pipeline specifications without addition of some diluent. The primary goal for
partial upgrading of bitumen is to economically meet pipeline specifications with reduced or no
addition of diluent.
The main driver for thermal cracking is temperature. The weakest bonds in bitumen begin to break
in the range of 250C, giving rise to the formation of detectable hydrogen sulfide. At 350C the
rates of cracking weak carbon-carbon bonds are more pronounced, so that short residence times
of a few minutes at this temperature are considered the limit for distillation with minimal alteration
of the feed.
Pressure has little effect on the reactions in the liquid phase, because the liquid density is only
changed significantly at pressures well over 3,000 psia (21 MPa), the normal upper limit for
refinery processing. The combination of pressure and reactor configuration can, however, have a
significant impact on the outcome of the thermal reactions, when the thermal cracking is carried
out in a continuous process. Higher pressure operation suppresses the formation of the vapor
phase, which reduces the formation of light olefin products such as ethylene, and increases the
residence time of the liquid in flow reactors (Langer, et al., 1962).
Reactor design can allow the separation of liquid and vapor phases, so that the vapor phase is
subjected to much shorter reaction times than the liquid phase. Addition of gases such as steam
further enhance the vaporization of lighter components at a given pressure, and can reduce the
time available for reaction in both liquid and vapor phase by increasing the velocity of fluids in
process furnaces. Steam can be used to sweep the vapors out of a reactor to give much shorter
reaction times for the vapor phase than for the liquid phase and thereby reduce over-cracking and
olefin formation in the vapor phase.
4.5.2 Addition reactions
Although the temperatures that produce thermal cracking of bitumen favor the cracking of
chemical bonds to give lighter products, reactions in the liquid phase always progress to give
larger molecules via addition reactions. Due to the complexity of the mixture of compounds that
comprise bitumen, these reactions are exceedingly difficult to track directly, but they are easily
identified in reactions of representative pure compounds at the same conditions (Gray, 2015). An
example of this type of reaction is illustrated in Figure 4.5:, which shows an actual reaction based

Bitumen Partial Upgrading 2018 Whitepaper - AM0401A
57
on experimental data. In this case, the product has almost twice the molecular weight of the
reactant.
Figure 4.5: Example: Addition Reaction of a Model Bitumen Component.
(Alshareef, et al., 2011) Addition products were 40 wt% of the total products of reaction at 420C after 20
minutes
These reactions result in formation of less soluble material in the bitumen, which is detected as
asphaltenes (heptane insoluble) and coke (toluene insoluble). These solubility characteristics are
a major factor in coke formation, which is covered in Section 4.5.4 below.
4.5.3 Hydrogen transfer reactions
Thermal cracking reactions tend to redistribute hydrogen. The light cracked products from
bitumen tend to be richer in hydrogen than the initial mixture, so that the liquid phase becomes
more depleted in hydrogen as the reactions proceed. Within the liquid phase, components can
donate hydrogen by undergoing reactions that release hydrogen. For example, partly
hydrogenated aromatic compounds give up hydrogen to form more aromatic products (lower H/C
ratio). The hydrogen that is released has been observed to saturate olefins at 270-310C in the
liquid phase (Ruchardt, et al., 1992)).
Hydrogen donor compounds are naturally present in the vacuum residue and asphaltene fractions
of bitumen, but the exact concentrations of donatable hydrogen are difficult to measure. Estimates
range from 10% of the total hydrogen content (Rahmani, et al., 2002) to 30% (Gould, et al., 2007)),
although the latter value is too high based on data for the types of hydrogen present (Gray, 2015).
2

Bitumen Partial Upgrading 2018 Whitepaper - AM0401A
58
Athabasca asphaltenes are able to transfer measurable hydrogen at temperatures as low as 100-
150C, and give conversion of olefins at 250C (Naghizada, et al.)) . The quantity of hydrogen
transferred was about 5% of the total hydrogen content.
Augmenting the natural hydrogen donor capacity by adding partly hydrogenated aromatic
compounds gives benefits during thermal cracking (Langer, et al., 1961)). These streams can
both act as hydrogen donors and enhance the solubility of asphaltenes. The result is suppression
of solids or coke formation at a given reaction time and temperature. When the stability of the
product oil limits conversion, the addition of hydrogen donors allows more conversion, which can
achieve lower viscosity and still maintain the P-value within an acceptable range. (Langer, et al.,
1962)
4.5.4 Coking
If thermal cracking continues past the point where asphaltenes are no longer stably dispersed in
the crude oil, they begin to precipitate from the oil and form a new phase, commonly called coke
(Wiehe, 1993). The coke material can attach to the surfaces of process equipment, causing
severe fouling and plugging. While coke can be plastic at high temperature, it is a solid at normal
temperatures.
The progress of coke formation is illustrated in an open reactor in Figure 4.6. The concentration
of asphaltenes increases with time for the first 45 min, then begins to fall as toluene-insolubles,
or coke, begins to form. The delay of the onset of coke formation is called the induction time.
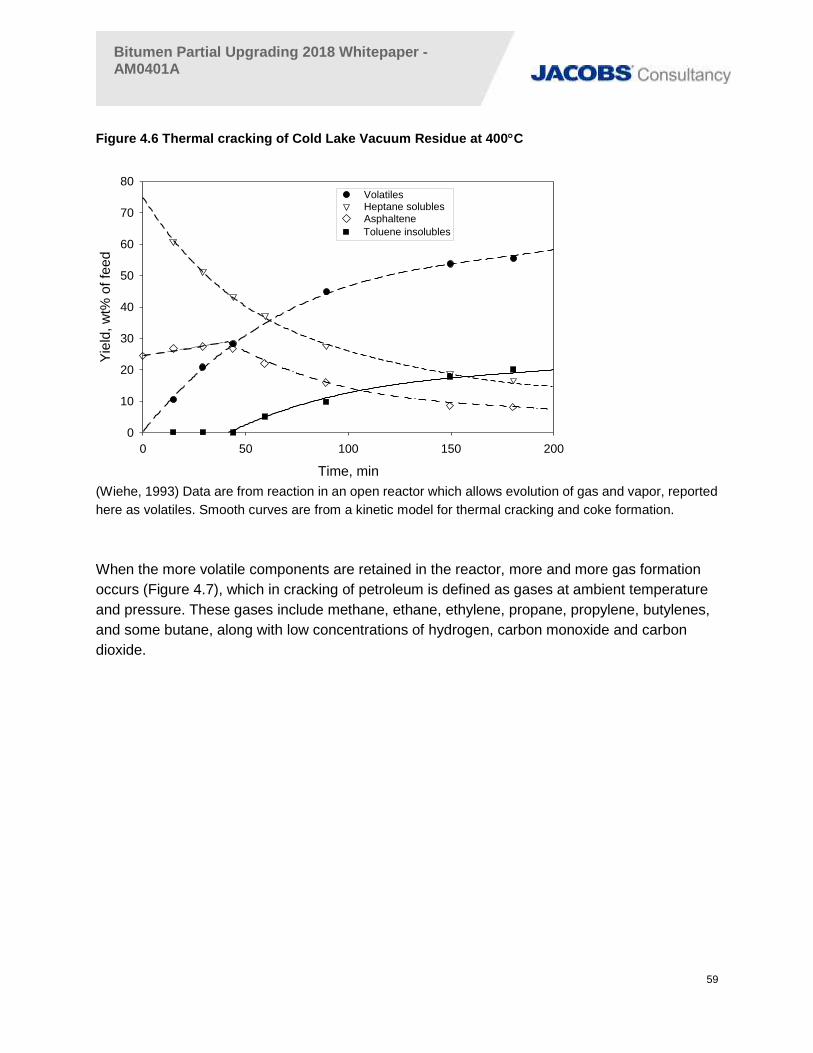
Bitumen Partial Upgrading 2018 Whitepaper - AM0401A
59
Figure 4.6 Thermal cracking of Cold Lake Vacuum Residue at 400C
(Wiehe, 1993) Data are from reaction in an open reactor which allows evolution of gas and vapor, reported
here as volatiles. Smooth curves are from a kinetic model for thermal cracking and coke formation.
When the more volatile components are retained in the reactor, more and more gas formation
occurs (Figure 4.7), which in cracking of petroleum is defined as gases at ambient temperature
and pressure. These gases include methane, ethane, ethylene, propane, propylene, butylenes,
and some butane, along with low concentrations of hydrogen, carbon monoxide and carbon
dioxide.
Time, min
0 50 100 150 200
Yie
ld, w
t% o
f fe
ed
0
10
20
30
40
50
60
70
80VolatilesHeptane solubles
Toluene insolubles
Asphaltene

Bitumen Partial Upgrading 2018 Whitepaper - AM0401A
60
Figure 4.7: Thermal cracking of Athabasca bitumen in a closed reactor at 400C
(Zachariah, et al., 2016) Solids yields are net formation of filterable material, subtracting the mineral solids
present in the initial bitumen.
The data of Figure 4.7 show three distinct phases of solids formation: an initial induction period
that is around 80 minutes in duration where very small amounts of solids are formed, linear
formation from 80 min to around 300 min, then a significant increase in solids yield starting at 300
min of reaction. The duration of the induction period was longer than on Figure 4.6 for Cold Lake
Vacuum Residue, which illustrates that the onset of coking is a function of the composition of both
the liquid phase in the reactor and the reacting asphaltene material.
The formation of almost 12% gases, which are rich in hydrogen, gave liquid and solid products
that were depleted in hydrogen relative to the initial bitumen. The H/C ratio of the liquid product
dropped from 1.455 mol/mol at time zero to 1.06 at 360 min.
If the coke formation occurs in a controlled fashion within a reaction vessel, then this mechanism
provides a means to continue cracking the heavy components of the vacuum residue to obtain
Time, min
0 100 200 300 400
Yie
ld,
wt%
0
10
20
Yie
ld,
wt%
0
20
40
60
80
100
Solids
Liquid product
Gas

Bitumen Partial Upgrading 2018 Whitepaper - AM0401A
61
very high conversions. In this case the conversion of the vacuum residue fraction to coke, lighter
liquid fractions, and gases can approach 100%.
A large number of studies show that coke forms most easily from the asphaltene fraction, so that
partial or complete removal of the asphaltenes will significantly reduce the formation of coke. An
example is given in Table 4.3, for a whole vacuum residue and two deasphalted samples. The
yields of coke and asphaltene are given after thermal cracking at 420 C for one hour.
Table 4.3. Formation of Asphaltenes and Coke from Fractions of Vacuum Residue*.
Composition Whole vacuum residue
C7 soluble, deasphalted with heptane
C5 soluble, deasphalted with pentane
Initial C7-asphaltenes, wt% 9.4 0 0
Initial C5-asphaltenes, wt% 12.6 3.5 0
Initial C5 soluble-C7 insoluble, wt% 3.2 3.5 0
Final toluene-insoluble coke, wt% 2.1 0.0 0
Final C7-asphaltenes, wt% 15.5 13.6 6.0
Reference: (Avid, et al., 2006).
*Reaction conditions: 20wt% solution of sample in 1-methylnaphthalene, react at 420C for 1 hour. Vacuum residue
from a Middle East crude oil. Weight fractions are for weight of initial sample
Removal of the C7-asphaltenes eliminated the formation of coke, but due to addition and other
reactions, significant amounts of asphaltenes were formed. The removal of the C5-insoluble
asphaltenes resulted in much less asphaltene formation. These results suggest that material that
is soluble in heptane but insoluble in pentane may play an important role in the formation of
asphaltenes during thermal cracking. Several process technologies for partial upgrading remove
portions of the asphaltene fraction (see Chapter 5.4.3). The contribution of these different
fractions to coke formation and generation of more asphaltenes during thermal cracking is an
important fundamental knowledge gap.

Bitumen Partial Upgrading 2018 Whitepaper - AM0401A
62
4.5.5 Scale-up of thermal cracking processes
The data presented in this section on the fundamentals of bitumen reactions are derived from
idealized conditions, in laboratory reactors that use either intense mixing by impellers or very
small scale (a few millilitres of liquid) to achieve uniform temperatures. Under these conditions,
the temperature of the reacting liquid in the bulk is very similar to the reactor walls.
When thermal cracking is conducted at a larger scale, as in pilot plants or demonstration plants,
these conditions no longer apply. Heating of bitumen in process furnaces can give wall
temperatures that are significantly higher than the bulk liquid, giving localized reaction conditions
with coke formation even as the bulk fluid is just beginning to react. Such localized conditions can
give rise to fouling of surfaces and formation of solids even when the temperatures might appear
safe in the bulk liquid. Continuous reactor operation tends to cumulate these effects with time of
operation, so that fouling that may not be detected in a batch laboratory reactor can shut down a
continuous process in a matter of hours.
4.5.6 Boundaries on thermal cracking
The trends in product yield and API gravity can be illustrated by plotting the results of reactions
or upgrading processes on a x-y plot of gravity versus volumetric yield (Gray, 2002). The target
for partial upgrading technologies is to achieve pipelineable density and viscosity with minimal
loss of liquid yield. Data for thermal cracking is illustrated in Figure 4.8.

Bitumen Partial Upgrading 2018 Whitepaper - AM0401A
63
Figure 4.8: API gravity and yield from thermal cracking of Athabasca bitumen
Data are for cracking at 400C (Zachariah, et al., 2016) with gravity estimated from refractive index (
(Yarranton, et al., 2015), at 263-371C (Henderson, et al., 1965) estimated data for single-pass coking at
530-550C (Soskind, et al., 1962), (Brown, 2009)) and delayed coking (Gray, 2002).
The data illustrate that mild thermal cracking alone does not significantly change the gravity of
the product. All but one product reported by Henderson and Weber (Henderson, et al., 1965) had
a gravity within 3 API of the feed, similar to the data presented in Figure 4.1. Without the removal
of dense components or elements, breaking of bonds alone does not significantly change the
density of the liquid product. The formation of dense insoluble solids, such as coke, which is
removed from the liquid product, can provide a means of changing the density. This is illustrated
in Figure 4.8 for single-pass coking, which achieves around 80% conversion of vacuum residue,
and delayed coking, which achieves 100% conversion. The latter process exceeds the required
specifications for partial upgrading.
The data of Zachariah and de Klerk illustrate that formation of solids alone does not guarantee
lighter liquid products (Zachariah, et al., 2016). In their closed reactor, gas yields were significant
and the liquid likely underwent significant addition reactions. The combination of loss of hydrogen
to the gas components and increasing molecular weight in the liquid, gave consistently denser
products than the initial bitumen, and illustrates a very undesirable trend for a partial upgrading
process.

Bitumen Partial Upgrading 2018 Whitepaper - AM0401A
64
4.6 Catalytic Cracking
Catalysts with strong acidity have the capacity to accelerate cracking of carbon-carbon bonds in
petroleum materials, and these materials are widely used in processing of distillates. The vacuum
residue components of bitumen, however, are rich in nitrogen compounds, which strongly
suppress the activity of these catalysts and often result in irreversible deactivation, and formation
of high-boiling compounds that react to form coke on the catalyst surface. The lifetime of acid
catalyst materials when exposed to bitumen is so short that they act as one-time adsorbents
rather than economic catalysts. Consequently, catalytic cracking can only be applied to heavy
bitumen fractions if the severe deactivation is controlled. Examples are processing only a small
fraction of bitumen vacuum residue with gas oil feed in fluid catalytic cracking, or using high-
pressure hydrogen in hydrocracking of deasphalted and hydrotreated material. The opportunity
for partial upgrading of bitumen is to produce more acceptable feeds for catalytic cracking in
refineries.
4.7 Catalytic Hydrogenation
Catalysts based on metal sulfides, particularly molybdenum-nickel blends, are very effective for
hydrogenation of sulfur, nitrogen, and metal-bearing compounds, and for hydrogenation of
aromatic compounds and olefins. These reactions are the basis of commercial hydrotreating
processes. Reaction conditions range from very mild, for conversion of diolefins in cracked
products, to very severe for removing sulfur from vacuum residues (Topsoe, et al., 1996) (Yui,
1999).
The addition of metal sulfide catalyst and high-pressure hydrogen during thermal cracking
reactions enables much more conversion of vacuum residue components without the formation
of coke. This combination of conditions results in hydrogenation of all olefin products from thermal
cracking, which suppresses their addition reactions (Habib, et al., 2013) and prevents coke
formation (Gray, et al., 2002).
4.8 Other Catalytic Cycles
4.8.1 Sodium-Sodium Sulfide Cycle
Metallic alkali metals, such as sodium and lithium, are strong reducing agents that react readily
with organic sulfur compounds and hydrogen to produce sulfur-free hydrocarbons and sodium
sulfide. (Sternberg, et al., 1974), (Verkade, et al., 1999), (Field_Upgrading, 2015))._ A small
amount of hydrogen gas is required at low pressure to ensure that the fragments of bitumen do
not undergo addition reactions after the sulfur is removed. A catalytic cycle can be established if
the sodium sulfide is separated from the reaction products and reduced to regenerate the sodium

Bitumen Partial Upgrading 2018 Whitepaper - AM0401A
65
metal (Brons, et al., 2001)). Removal of sulfur is accompanied by significant removal of metals,
conversion of vacuum residue, reduction in density, and reduction in viscosity.
4.8.2 Carbon Oxidation-Water Reduction
The direct use of water as a source of hydrogen is highly desirable, but extremely challenging
due to the thermodynamic stability of water. Gasification reactions at high temperature, over
600C, result in reaction of carbon-rich solids like coal and coke with steam to produce carbon
dioxide and hydrogen. A number of studies have attempted to use this type of chemistry with
liquid hydrocarbons and bitumen. The most successful approach is to use catalysts to establish
a redox cycle to transfer the oxygen from water to carbon, forming carbon dioxide, and thereby
enable the incorporation of hydrogen from water into the oil (Fumoto, et al., 2009), (Fumoto, et
al., 2015). The approach has been demonstrated for iron oxide supported on titanium dioxide
powder. Data for dispersed particulate catalysts have also given some evidence for increased
carbon dioxide formation, but in lower amounts (Fathi, et al., 2011)
In the absence of a catalyst, the effect of adding water to thermal cracking reactions is to add a
solvent which alters the phase behavior of bitumen components (Cheng, et al., 2009). Lower
molecular weight species in bitumen readily dissolve in liquid water at high-pressure or
supercritical conditions (Watanabe, et al., 2010), (Vilcaez, et al., 2012) and the solubility of water
in heavy bitumen fractions increases dramatically with temperature (Amani, et al., 2014). Although
water exchanges isotopes with bitumen under thermal cracking conditions, the available scientific
papers do not suggest significant net transfer of hydrogen (Cheng, et al., 2009)).
4.8.3 Other Process Pathways
The current industry practice is to use heat to initiate the cracking reactions of bitumen fractions,
leading to operation in the range of 360-550°C as discussed above. These temperatures are
sufficient to break a very small fraction of weak bonds in the bitumen, which in turn begins chain
reactions that give significant conversion.
4.8.3.1 Ionizing Radiation
Other techniques can create active reactive species in bitumen, including ionizing radiation (e.g.
beams of electrons or gamma rays (Soebianto, et al., 1992)), and contacting with hydrogen
plasma (Rahimi, et al., 1998)). In order for these reactive species to give measurable conversion,
the temperature of the bitumen must be high enough to thermodynamically favor cracking
reactions (Raseev, 2003)), and to support chain reactions at useful rates. Consequently, these
schemes would need to operate at comparable temperatures to conventional thermal processes,
as demonstrated on hydrocarbons (Soebianto, et al., 1992)

Bitumen Partial Upgrading 2018 Whitepaper - AM0401A
66
4.8.3.2 Fluid-Mechanical Alteration
A number of patents have proposed the use of cavitation from sonication or fluid expansion from
jets to cause reactions and structural changes in heavy bitumen fractions (Duyvesteyn, et al.,
2011), (Kostrov , et al., 2011)). The collapse of bubbles during cavitation can give tiny hot spots
with temperatures over 3,000C that initiate reaction (Thompson, et al., 1999). However, at low
temperature of the bulk liquid, the rate of conversion of hydrocarbons is insignificant and addition
or polymerization reactions are favored (Suslick, et al., 1983), (Cataldo, 2000). Like ionizing
radiation, significant conversion would require operation at temperatures comparable to
conventional thermal processes. Shear forces in liquids can break high molecular-weight
polymers (Kuijpers, et al., 2004) and DNA (Bowman, et al., 1972).
The molecular components of bitumen are all below a molecular weight of 3,000 (McKenna, et
al., 2013), (Chacon-Patino, 2017), which is much lower than the molecular weight of polymers,
which are over 1 million and can be broken by fluid forces. The largest aggregated species in
bitumen are the asphaltene aggregates, which are in the range 2-20 nm (Yarranton, et al., 2013)),
and are also smaller than the size of polymers that break due to cavitation shear.
A combination of cavitation, heating to temperatures known to cause thermal reactions, and
heating under pressure may result in partial upgrading, but the contribution of cavitation against
the background effects of thermal reactions at elevated pressure is extremely difficult to assign
unambiguously.
4.8.3.3 Oxidative Desulfurization
Oxidative desulfurization can be used to reduce the sulfur content of crude oils by converting
sulfur species into the corresponding sulfoxides and sulfones, which are removed by extraction
or adsorption. The amount of material removed depends on the molecular weight of the species
containing the sulfur, the number of sulfur molecules on the species, and the solubility properties
of the reacted material.
We can examine the impact of oxidative desulfurization for a typical bitumen. Assume the bitumen
contains around 5 wt% sulfur and has a molecular weight of around 582 g/mole (Lu, et al., 1989),
(Agrawal, et al., 2012). This gives an average ratio of 0.87 moles sulfur per mole of bitumen,
which means that a typical molecule contains at least one sulfur. If there is one sulfur atom on
each typical molecule, removal of half of the sulfur requires removing around 40 wt% of the
bitumen.
In the asphaltene fraction, the average molecular weight is higher, approximately 2,000 (Agrawal,
et al., 2012), and the sulfur content is higher at 6.5 wt%. Conversion of 50% of the sulfur would
convert at least one sulfur per molecule to a polar sulfoxide or sulfone. Such oxidation of bitumen

Bitumen Partial Upgrading 2018 Whitepaper - AM0401A
67
generates more material that will not dissolve in heptane, nominally asphaltenes (Moschopedis,
et al., 1977). These high density, oxidized products are unlikely to give efficient removal by
extraction into water or by adsorption. The combination of high molecular weight and polar sulfur
species could result in almost complete conversion to highly insoluble surface-active solids that
dissolve in neither hydrocarbon solvents nor water. Such oxidation products would cause serious
problems with attempts to extract the rest of the oxidized sulfur species from the bitumen into an
aqueous solution. The combination of large losses of oxidized sulfur species and potential
insolubility of products makes oxidative desulfurization better suited to removing low levels of
sulfur, as a polishing step for distillates rather than bulk desulfurization of high density materials.
In order to minimize the serious loss of yield, the sulfones and sulfoxides would need to be reacted
to remove the sulfur. Such chemistries have not been demonstrated on heavy bitumen fractions.
4.9 Separations to Improve Properties and Market Value
Two types of separation technology are commonly used in petroleum processing; distillation and
solvent deasphalting. Distillation under vacuum can remove up to half of the bitumen, which is
useful in processing of fractions in an upgrading or refining plant, but not by itself as a means of
partial upgrading.
In solvent deasphalting, paraffinic solvents such as propane, butane, pentane or hexane are used
to precipitate the least soluble components of the vacuum residue, either as a liquid phase or as
a solid depending on the solvent used and the temperature. By selection of solvent and solvent-
bitumen ratio any desired amount of precipitation can be observed, from 1% up to 50% of the
initial bitumen (Brons, et al., 1995), (Gray, 2015).
For example, the data of Figure 4.9 show that a range of material can be precipitated from
Athabasca bitumen depending on the choice of solvent. If solvents such as butane or propane
are used, which are weaker than pentane, then the trend continues to the upper left in the plot in
Figure 4.9, and larger and larger amounts of material is precipitated. The precipitate is rich in
asphaltenes, which are the densest fraction of crude oil with the highest concentrations of sulfur,
nitrogen, and metals. The asphaltenes also have the highest yield of MCR.

Bitumen Partial Upgrading 2018 Whitepaper - AM0401A
68
Figure 4.9: Precipitation of Asphaltene Components as a Function of the Solubility Parameter of
the Liquid Phase
(Mitchell, et al., 1973). Data are for Athabasca bitumen at 20C and a 20:1 ratio of solvent to bitumen. The
Hildebrand solubility parameter is tabulated for different solvents (Barton, 1991)).
Consequently, the precipitation of asphaltene components produces a product of lower density
with reduced MCR, sulfur, nitrogen and metals, as illustrated in Figure 4.10. The density of
deasphalted bitumen is reduced (API gravity increases) as a result of removing material via
solvent deasphalting, and the diluent requirement to meet pipeline specifications is reduced. At
the same time that the yield of bitumen is reduced, the yield of asphaltene by product is increased,
which must be sold or disposed of in some way.
Solubility parameter, MPa1/2
13 14 15 16 17 18 19
Am
ou
nt
pre
cip
ita
ted,
wt%
0
5
10
15
20
Benzene + n-pentane
Pure solvents
n-p
en
tane
tolu
ene

Bitumen Partial Upgrading 2018 Whitepaper - AM0401A
69
Figure 4.10: Yield and Gravity of Product Oil from Solvent Deasphalting
( (Brons, et al., 1995)) Data for Cold Lake bitumen from deasphalting with butane and pentane.
4.10 Feasible Range of Partial Upgrading Products
Given the range of possible reactions and separation processes that can be applied to bitumen
to achieve partial upgrading, the technically feasible space for potential upgrading operation can
be defined. Figure 4.11 shows the potential range of options to meet pipeline viscosity
specifications.
The default option for a SAGD producer is to add diluent and ship the product, at the cost of
transportation as discussed in Section 2. This option allows selling 100% of the bitumen product,
plus the volume of the purchased diluent; the diluent component in dilbit is sold at a discount to
its purchase price. At the opposite extreme is solvent deasphalting, which removes the denser
asphaltenes and other components from the bitumen, but can only achieve pipeline gravity at the
expense of removing approximately half the initial bitumen (Brons, et al., 1995). Similarly, delayed
coking gives gravities higher than 19 API, but the volume yield is reduced due to coke rejection
from the process.
The volume of bitumen can also be increased by catalytic reactions with hydrogen gas, giving
removal of the dense sulfur and nitrogen atoms, and net addition of hydrogen. This trend is
illustrated for two representative processes in Figure 4.11 for sodium metal desulfurization and
catalytic hydroconversion.

Bitumen Partial Upgrading 2018 Whitepaper - AM0401A
70
Figure 4.11: Trajectories for Partial Upgrading Processes Based on Known Process Chemistries.
Data are for Athabasca bitumen, and are approximate for illustration of trends in yield versus gravity of
product ( (Rahimi, et al., 2001), (Gray, 2002), (Field_Upgrading, 2015))
4.11 Combinations of Processes
If processes are combined, a larger feasible operating space will open to achieve the desired
pipeline specifications. Many combinations are possible, and a number of combinations are
discussed in Section 5.4 For example, thermal cracking, addition of diluent, and deasphalting can
be combined pairwise to meet pipeline specifications for partially upgraded bitumen. The possible
operating space for two- and three-way combinations of these technologies is illustrated in
Figure 4.12.
Yield, vol%
40 60 80 100 120 140
AP
I G
ravity
5
10
15
20
25
Solvent deasphalting
Diluent addition (Total volume)
Delayed coking
Thermal cracking
Sodium desulfurization
Hydroconversion
Pipelineable gravityAthabasca bitumen
7.8 API
Minimum Pipeline Gravity

Bitumen Partial Upgrading 2018 Whitepaper - AM0401A
71
Figure 4.12: Feasible Operating Space for Combinations of Thermal Cracking, Diluent Addition, and
Deasphalting for the case of Athabasca Bitumen.
The three extreme cases are delayed coking for thermal cracking, dilbit production by diluent
addition, and deasphalting. Operating zones A through D are discussed in the text.
In this triangular diagram, the apices are single technologies to produce pipelineable product from
Athabasca bitumen. The top of the diagram is diluent addition to produce dilbit, the right hand
apex is delayed coking to give 100% conversion of the vacuum residue fraction, and the left hand
apex is deasphalting. The deasphalting apex is the extreme case, based on the data of Figure
4.10, for 50% removal of the bitumen by solvent deasphalting. This approach is not economic,
but it is technically feasible.
Each edge of the triangle is a combination of two technologies as indicated. The limit indicated
on thermal cracking plus diluent is the formation of incompatible asphaltenes, giving unstable
product as illustrated in Figure 4.4. The white zone is excluded because operation is not feasible.
Zone A is where the combination of thermal cracking and diluent addition will require the smallest
volume of diluent. Zone B is where the combination of thermal cracking and deasphalting will give
the highest liquid yield. Zone C is the feasible operating space for combinations of all three
technologies.
Diluent
Thermal CrackingDeasphalting
Unstable productat 30% conversion
Minimum solid asphaltenerejection
Dilbit with 25% condensate
Coking with 100% residueconversion
Deasphalting + Thermal cracking
Feasible operation
A
B
Zone C
D
50% of bitumenprecipitatedby deasphalting

Bitumen Partial Upgrading 2018 Whitepaper - AM0401A
72
The minimum limit on solid asphaltene rejection achieved in a commercial process corresponds
to precipitation of 8-10% of the bitumen, or 50-65% of the asphaltenes, as demonstrated in the
paraffinic froth treatment process. Rejection of less asphaltenes is technically possible, as
indicated in Figure 4.9, but has not been demonstrated in commercial operation. Consequently,
although operation in Zone D is theoretically possible, it would likely require a new approach to
removal of precipitated asphaltenes.
The depiction in Figure 4.12 shows two boundaries within the operating space, but the exact
position of these boundaries depends on the details of process design. For example, the minimum
limit for deasphalting could potentially be shifted by using new technology for removal of
precipitated asphaltenes, or by operating at higher temperature. The boundary on the stability of
product from thermal cracking will shift up or down depending on the details of the cracking
process conditions. For example, time, temperature and the addition of solvents can shift the
boundary. All thermal cracking based technologies, have a limit of the type shown in Figure 4.12.
An equivalent diagram can be drawn for the case of hydroconversion, which uses thermal
cracking in combination with hydrogen and a catalyst to suppress coke formation and to maintain
a compatible product over a wider range of conversion.
Bitumen Partial Upgrading 2018 Whitepaper - AM0401A
73
5. Bitumen Partial Upgrading and Technology Readiness
We begin with a general overview of the steps required for a functional partial upgrading process,
then begin an examination of the bitumen conversion and separation technologies. We review
the existing commercial technologies that are relevant to partial upgrading, including the standard
reference technology used in the refining industry, which is delayed coking.
New technologies for partial upgrading that are under development by a number of groups seek
to address the need for lower cost approaches to produce a partially upgraded bitumen in contrast
to the full upgrading operations currently practiced on a commercial scale in Alberta. These
technologies are at different stages of development. We therefore provide a classification based
on technology readiness level and apply it to the range of technologies proposed for partial
upgrading.
Our review of partial upgrading technologies includes a range of information from published
sources as available, including block flow diagrams, yields, utility requirements, and
environmental impact. In addition, we identify the underlying scientific principles associated with
each technology (or gaps in knowledge to fully appreciate the underlying scientific principles and
evaluate the utility of the technology). We cross reference to supporting literature and identify
possible R&D activities that could reduce the technical risk of these technologies.
5.1 Partial Upgrading Overview
A schematic of the steps from bitumen production to upgraded products is shown in Figure 5.1.
Starting on the left in Figure 5.1:
• Bitumen from a mine or in situ production facility is blended with diluent for transport
• Diluent is removed from bitumen in the DRU (diluent recovery unit) and returned to the
production site
• The DRU can be designed to remove only diluent or also lighter material leaving only the
heavy residue for upgrading
• Gas from bitumen upgrading is sent to the gas plant for clean-up, including sulfur removal
• Treatment of some or all of the products from bitumen upgrading to remove olefins may
be necessary to meet pipeline specifications
• Olefin treatment may be done via hydrotreating or other process
• Products from olefin removal are combined with the other products from bitumen
processing and products that bypass upgrading

Bitumen Partial Upgrading 2018 Whitepaper - AM0401A
74
• Diluent must be added to meet pipeline specifications for viscosity and density if upgrading
does not make sufficient improvement in these properties
• If hydrogen is used in olefin removal, a hydrogen plant is needed that converts natural gas
to hydrogen via steam methane reforming (SMR)
• Offsites-utilities section includes a steam plant, water treatment plant, sulfur plant, etc. as
needed

Bitumen Partial Upgrading 2018 Whitepaper - AM0401A
75
Figure 5.1: Block Process Diagram of a Partial Upgrading Plant
GHG Emissions
To Process Energy
Natural Gas To SMR as Needed H2 Fuel Gas
To Process Energy
Electricity To Process Energy Sulfur
Diluent Return Gas
Gas H2
Naphtha to Naphtha
to Hvy Gas Oil
Bitumen Dilbit
Treated
Naphtha
Diesel + (or Gas Oil +)
Rejected material
Diluent as needed To pipeline
In SituWell
or
Mine
DRU as Needed
Bitumen Upgrading
Technology
Olefin Reductionas Needed
Naphtha(Kero +
Diesel in some
cases)Removal
as
Needed
SMR as Needed
H2S Removal&
Gas ProcessingAs Needed
Offsites
Utilities

Bitumen Partial Upgrading 2018 Whitepaper - AM0401A
76
5.2 Upgrading Technology Classification
Bitumen upgrading technologies can be classified into four major categories:
1. Thermal cracking – breakup large molecules in bitumen using heat
2. Hydrogen addition and cracking – add hydrogen to molecules during bitumen upgrading
combined with breakup of large molecules
3. Asphaltene separation – remove refractory, difficult to convert components using their
solubility properties
4. Fluid mechanical – breakup aggregations of molecules in bitumen using mechanical
forces
The first three of these technology types are available as commercial technologies, and examples
are in use in Alberta. The commercial hydrogen addition technologies exceed the requirements
for partial upgrading, therefore, these processes are not discussed further. Descriptions are
provided in Appendix E. We discuss the remaining major technology classifications below and
highlight technologies that are practiced commercially. Some upgrading technologies include
more than one of these four technology classifications.
Several new approaches have been proposed which do not fit this classification, and these will
be described in Section 5.4.7.
5.2.1 Thermal Processing
The two most commonly used commercial variants of thermal processing for crude oil are
visbreaking, and coking. These processes rely on thermal decomposition of some or all of the oil
being processed with visbreaking being the mildest form and coking being more extreme.
5.2.1.1 Visbreaking
Visbreaking (viscosity reduction, viscosity breaking), developed in the late 1930s, is a mild form
of thermal cracking of vacuum residue that produces more desirable and valuable products and
fuel oil that meets viscosity specifications. Visbreaking relies on mild thermal reaction in contrast
to delayed coking, which uses much longer residence times and allows thermal reactions to
proceed to completion.
Visbreaking occurs predominantly in the liquid phase at temperatures ranging from 455 to 510 °C
(850 to 950 °F) with short residence times and pressures from 50 to 300 psi at the heating coil

Bitumen Partial Upgrading 2018 Whitepaper - AM0401A
77
outlet. The major process variables are (1) feedstock type, (2) temperature, (3) pressure, and (4)
residence time, which controls the extent of cracking.
Feedstock (residue or bitumen) is passed through a furnace where it is heated to 480 °C (895°F)
under an outlet pressure of about 100 psi. Liquid-phase thermal cracking under these low-severity
conditions produces some naphtha, kerosene and gasoil boiling range materials that are removed
as overhead using a flash-distillation chamber. Liquid products from the flash chamber are cooled
with a gasoil flux and can be sent to a vacuum fractionator for further separation to produce a
heavy gasoil distillate and a residue of reduced viscosity. Conversion of 5%–10% of the residue
feed to naphtha is usually sufficient to reduce the viscosity in the residue product by a factor of
five compared to the viscosity of the residue feed to the visbreaking process.
There are two general types of visbreaker design: coil and soaker. Visbreaking reactions are
carried out at contact times of a few minutes in furnace coil tubes of a coil type visbreaker
(simplified schematic in Figure 5.2) or in longer residence time in a soaker-type visbreaker
(simplified schematic in Figure 5.3). Furnace inlet pressure must be sufficient to keep gasoil and
heavier reaction constituents in the liquid phase at the furnace outlet (generally around 150-300
psi). The limit on reaction temperature is set by the desired severity of cracking, which depends
on the visbreaker feed composition and the need to maintain a stable fuel oil product.
Figure 5.2: Coil Type Visbreaker Schematic
(Beccari, et al., 2006) – redrawn

Bitumen Partial Upgrading 2018 Whitepaper - AM0401A
78
Figure 5.3: Soaker Type Visbreaker Schematic
(Beccari, et al., 2006) - redrawn
Stability of the heavy oil product is a critical aspect of visbreaker operation, as discussed in
Section 4.5.6. Feed asphaltenes are stabilized by the aromatic components in the feed so they
are dispersed as colloids. Visbreaking converts vacuum residue to lighter products and produces
additional asphaltenes by polymerization reactions. Most feed asphaltenes undergo little or no
change in visbreaking and are often described as refractory or difficult to react.
As the severity of visbreaking increases and vacuum residue are converted, there is insufficient
peptizing capability from the liquid phase to keep the asphaltenes in colloidal dispersion.
Asphaltenes are mutually attracted and flocculate, resulting in an unstable heavy oil product from
visbreaking. The severity at which asphaltenes flocculate depends on the composition of the feed
to the visbreaker, which depends on the crude oil characteristics. The type of cutter stock used in
fuel oil blending, to reduce viscosity, also affects fuel oil stability.
Fuel oil stability can be measured using a P-value (Peptizing value) test: P-values less than or
equal to 1.0 indicate the fuel oil is unstable; P-values between 1.0-1.1 indicates borderline fuel oil
stability; P-values greater than 1.1 indicate a stable fuel oil.
Milder cracking conditions can be achieved by lowering the temperature in the furnace and using
a soaking drum between the furnace and the fractionator to enable longer residence time at
temperature. Mild cracking conditions (low feedstock conversion per pass through the heater)
result in higher yield of naphtha with low gas production and decreased coke production.

Bitumen Partial Upgrading 2018 Whitepaper - AM0401A
79
However, mild cracking results in lower conversion of higher boiling residues which must be
recycled through the heater and can result in increased yield of refractory material.
Decoking is not as frequent with soaker drum visbreaker designs as with coil-type visbreaker
designs. However, the soaker design requires more equipment for coke removal and handling.
Coke removal from the drum requires cutting it out with high-pressure water, which results in
significant amount of coke laden water that must be filtered for reuse.
Due to the limitations on the stability of the product, commercial visbreaking processes cannot
convert bitumen into a product that meets pipeline specifications. In principle, visbreaking of
bitumen could be used to reduce the amount of diluent required to meet pipeline specifications,
but this combination has not been adopted in Alberta. The only visbreaker to operate in an
upgrader in Alberta was at the Nexen Long Lake Plant, where it was used to obtain conversion of
vacuum residue prior to a deasphalting process. The basic approach of visbreaking, which is mild
thermal conversion of a portion of the bitumen, is attractive and features prominently in proposed
partial upgrading processes in Sections 0 and 5.4.3.
5.2.1.2 Coking
In coking processes, residue is heated to high temperatures (450-500 °C). Light boiling products
distill overhead leaving solid coke behind. Coking is the most popular conversion choice for resids
that are high in asphaltene cores (low hydrogen, high heteroatoms, and high MCR) because
coking reactively separates asphaltene cores into a low value byproduct (coke) leaving the resins
for further upgrading. Coking is an extreme form of thermal cracking with carbon rejection. By
rejecting refractory carbon-rich material, which is high in metals and sulfur, coking enables the
remaining products to be readily processed in most petroleum refineries. The mechanism and
time course of the coking reactions was discussed in Section 4.5.4.
Coking was first introduced to commercial upgrading of bitumen when the Great Canadian Oil
Sands (GCOS now Suncor) started up delayed coking in 1968. The next commercial application
of coking in oil sands bitumen upgrading was by Syncrude when they started up Fluid Cokers in
1978. Coking technologies are central primary upgrading units in full upgrading facilities that
produce bottomless SCOs. In most full upgrading plants, the blendstocks in SCO have been
hydrotreated to stabilize and remove all olefins and much of the sulfur and nitrogen. Some
producers sell a sour SCO, which blends unhydrotreated heavy coker products with hydrotreated
lighter products.

Bitumen Partial Upgrading 2018 Whitepaper - AM0401A
80
Delayed Coking
Delayed Coking is a semi-batch process where a furnace heats the feed to the point of incipient
coking. The heated material is transferred in the minimum possible time to the coke drum where
the coking reaction completes and cracked vapors exit the top of the drum. Coke drums are
operated in pairs where one drum is filling with coke while the other is being decoked and
prepared to accept feed. Cycles vary from 12-20 hours depending on the feed rate and size of
the drums. A schematic of delayed coking is shown in Figure 5.4.
Figure 5.4: Delayed Coking Schematic
(MOGAS-2, 2017)
The delayed coking process produces a product that exceeds the required specifications for
pipeline transportation, therefore, its normal operation does not fit the definition of partial
upgrading as used in this study.
FLUID COKING™
FLUID COKING is licensed by ExxonMobil and used in the Syncrude Upgrader in Alberta. A
simplified diagram is shown in Figure 5.5. Feed is typically a 1050°F/565°C-plus vacuum residue
that enters the scrubber (1) for integrated, direct contact heat exchange with reactor overhead
effluent vapors. The scrubber condenses higher boiling hydrocarbons in the reactor effluent

Bitumen Partial Upgrading 2018 Whitepaper - AM0401A
81
(typically > 975°F/ 525°C) and recycles this material together with fresh feed to the reactor. Light
overhead vapors are sent to conventional fractionation and light ends recovery. In the reactor (2),
feed is thermally cracked to a full range of lighter products and coke. Coke inventory is maintained
by transferring bed coke from the reactor to the burner (3) via a coke transfer line. Depending
upon the feed, 15-25% of the coke is burned with air to satisfy process heat requirements,
eliminating the need for an external fuel supply. Hot coke from the burner is circulated back to the
reactor through a coke transfer line and supplies the heat needed to maintain reactor temperature
and sustain thermal cracking reactions. The balance of coke is withdrawn and sold as a product.
The coke burner also produces a low heating value flue gas that is usually sent to a CO boiler for
further energy recovery through steam production.
Figure 5.5: FLUID COKING
(ExxonMobil, 2017) Support Units Required for Coking
Coking requires the following support units in addition to utilities:
• Upstream crude and vacuum distillation
• Amine Plant
• Sulfur Recovery
• Sour water Plant

Bitumen Partial Upgrading 2018 Whitepaper - AM0401A
82
• Product hydrotreating (potentially mild in a partial upgrading application)
• Hydrogen production (to support hydrotreating)
• Offsites and storage
Coking units produce the following byproducts and waste streams:
• Sour fuel gas from which sulfur is recovered
• Coke
• Sour water
The normal commercial operation of fluid cokers is to recycle the unconverted vacuum residue
until it is completely converted. This 100% conversion of the heavy material gives a liquid product
that falls above the range of API gravity that defines partial upgrading. The commercial fluid coking
process can be operated in a once-though mode, without recycle of the vacuum residue. In this
case, the result is a partially upgraded crude oil that is much closer to the definition of partial
upgrading. Consequently, once-through coking constitutes an available commercial technology
that fits the performance definition of partial upgrading, in combination with some hydrotreating to
remove olefins as illustrated in Figure 4.8. Mild hydrotreating of naphtha through kerosene or light
diesel would be sufficient to remove olefins.
5.2.2 Asphaltene Rejection
5.2.2.1 Solvent Deasphalting
Solvent deasphalting (SDA) processes heavy gasoils and resids to produce a product low in
asphaltenes and another high in asphaltenes. The SDA product that is low in asphaltenes has
lower density, viscosity, metals and other contaminants than the feed The product high in
asphaltenes concentrates the impurities in the feed and can be used as fuel, or in production of
road asphalt.
Solvents used in SDA include: propane, butane, pentane, and light naphtha. Solvent selection is
based on the desired deasphalted oil purity and yield for a given feedstock. Higher molecular
weight solvents provide higher yield of DAO, but with higher level of contaminants.
SDA together with delayed coking are commercially practiced asphaltene rejection technologies
in heavy oil and bitumen upgrading and refining. SDA may be a better fit for partial upgrading
because of its relatively low costs compared to coking. However, SDA achieves greater liquid
product loss than coking (depending on solvent choice, ratio and design) as a result of some
rejection of feed with the refractory carbon containing fraction (asphaltene product) – especially if
the rejected carbon is a liquid pitch product. In addition, there is less conversion of refractory
carbon in SDA than coking which operates at more severe conditions.

Bitumen Partial Upgrading 2018 Whitepaper - AM0401A
83
SDA uses an external circulated/recycled light hydrocarbon solvent that acts to separate
asphaltenes and heavier portions of bitumen (maltenes and resins) which contains most of the
metals and coke precursors in the bitumen from the gasoil and lighter portion. The SDA flow
scheme is shown in Figure 5.6.
Figure 5.6: SDA Flow Schematic
(Gary, et al., 2007).
Figure 5.7 shows the tradeoff between yield of deasphalted oil (DAO) and rejection of
contaminants. Lighter hydrocarbons go into the solvent, which is lighter than the heavy remaining
fraction containing the asphaltene molecules. Choice of solvent affects the degree of hydrocarbon
attraction and the quantity of DAO. As shown in Figure 5.7, as the yield of DAO increases, more
contaminants remain in the DAO. Heavier solvents lead to less rejection of asphaltenes and
higher yield of DAO, but with more contaminants.

Bitumen Partial Upgrading 2018 Whitepaper - AM0401A
84
Figure 5.7: Solvent Deasphalting Selectivity
(Beeston, S., 2014)
Solvent deasphalting by itself can only meet pipeline specifications with a very high fraction of the
bitumen rejected, as in Figure 4.10, which is not economically feasible. SDA could be used for
partial upgrading by coupling it with thermal cracking, however, the significant loss of volume with
the rejected asphaltenes make the technology unattractive in comparison to newer deasphalting
approaches discussed in Sections 5.4.2 and 5.4.3 below.
5.2.3 Fluid Mechanical
Fluid Mechanical upgrading technologies aim to reduce the viscosity of bitumen mixtures by
breaking up the aggregated molecules in bitumen. Mechanical force is applied to bitumen as
shear introduced via high pressure dispersal through nozzles, cavitation, or other means. The aim
of mechanical upgrading is to change or modify the asphaltene microstructures in bitumen and
heavy oils, which comprise the heaviest fraction and contribute to the high viscosities observed
in these heavy oils. This mechanism is a matter of debate, as discussed in Section 4.8.3.2.
Energy used in mechanical upgrading is generally much lower than in other upgrading methods.
Because there is usually no rejection of contaminants with mechanical upgrading and the
conditions are mild, product yields are high. Some technologies may include adding heat to effect
product upgrading, which brings the energy consumption closer to the thermal processes.
However, product stability from modifying the asphaltene aggregates can be an issue which could
lead to asphaltene precipitation over time and an unstable product.

Bitumen Partial Upgrading 2018 Whitepaper - AM0401A
85
5.3 Upgrading Technology Assessment
New technologies for partial upgrading are at different stages of development. Some are still in
laboratory evaluation others have been demonstrated in a continuous manner in small integrated
units. We will begin with a discussion of technology readiness then briefly discuss many promising
partial upgrading technologies and their level of readiness.
Technology readiness level (TRL) is a key finding from our work. We use the definition of TRL
provided by Alberta Innovates. A key component of this assessment is early identification of
issues (operational, availability, and constructability issues) coupled with technical, engineering,
and economic assessment tailored to match the quality of the available data, which can be
somewhat sketchy for new and novel technologies.
5.3.1 Technology Readiness Levels
The technology readiness levels defined by Alberta Innovates are shown in Table 5.1. In this
report, we use available public information to place technologies in the stages: Research,
Development, Pilot, Demonstration, and Commercial.

Bitumen Partial Upgrading 2018 Whitepaper - AM0401A
86
Table 5.1: Technology Readiness Levels
Development Stage Achievement Step
Research: Research is primarily done in
the lab and ranges from fundamental curiosity driven research to proof of concept in a lab setting. Theory and scientific principles are focused on specific application area to define concept. Analytic tools are developed.
Basic principles of concept observed and reported 1
Technology concept and/or application formulated 2
Analytical and experimental critical function and/or characteristic proof of concept
3
Development: The basic technological components are integrated for testing in a simulated environment and includes alpha testing of options
Component and/or subsystem validation in a laboratory environment
4
Pilot: The prototype is tested in the field in an operational environment and is well integrated with other systems. 0.1-0.5% of commercial. Scale needs to be demonstrated.
Component and/or validation in a simulated environment 5
System/subsystem model or prototype demonstration in a simulated end-to-end environment 6
Demonstration: The technology is being scaled up and tested in its final form and under expected conditions. Activities include the deployment of handbooks, documents, and maintenance. Typically, greater than 5% of commercial scale.
System prototyping demonstration in an operational environment 7
Actual system completed and qualified through tests and demonstration in an operational environment 8
Commercialization: The first
commercial application of the technology is established; the technology is ready for widespread adoption by others.
Actual system proven through successful deployment in operational setting 9
Wide scale deployment 10
5.4 Overview of Potential New Upgrading Technologies
In this section we discuss a number of technologies that could be used to partially upgrade
bitumen, giving improved quality and/or eliminating or reducing diluent for pipeline transport. The
list of technologies is not based on a comprehensive search of patents and publications; rather it
is a collection of processes that have been proposed by technology developers to the Alberta oil
sands industry for implementation. This information is from public documents, and statements by
developers. We have not substantiated the claims.
In addition to assigning a technology readiness level to each technology, and classifying it
according to the main underlying fundamental steps, we comment on the other attributes of each
process as follows:
a) Fit to Partial Upgrading of Bitumen (PUB) – Does the product from the technology meet
the definition of partial upgrading, or does it exceed the definition? (Does not meet, Meets,
Exceeds, or Unknown)

Bitumen Partial Upgrading 2018 Whitepaper - AM0401A
87
b) Olefin Treating – Is treatment of produced olefins required in order to meet pipeline
specifications? (YES or NO)
c) Technical Basis – Are the underlying engineering principles fully established, based at
least on results from pilot testing? (YES, NO, or Unknown)
d) Market Basis – Defines the acceptance of the product(s)
High – Established products with defined markets. This designation applies to well
established technologies such as coking, hydroconversion and Fischer-Tropsch
Med – The products have attributes in common with heavy crudes and coker products,
but are not identical and not on the market yet
Unknown – Very different products to established markets or ill-defined early-stage
processes
Asphaltenes (+A) – The technology produces significant amounts of asphaltenes or
similar byproducts for which no market has been defined yet and which may require
disposal
e) Environmental Basis – GHG Emissions – How do the GHG emissions compare to
established technologies?
Baseline or near-baseline – similar to delayed coking
Below baseline – Lower than delayed coking
Medium – higher than baseline due to significant hydrogen consumption or partial coke
combustion
High – complete coke combustion, gasification, or significant combustion of unconverted
vacuum residue
f) Potential location for the use of such a process
SAGD Integrated – The partial upgrader is located at the SAGD site and integrated with
water treatment and steam generation
Bolt-on – Add on to a SAGD central processing facility
Central PUF – A centrally sited Partial Upgrading Facility (PUF) collecting product from
multiple SAGD fields

Bitumen Partial Upgrading 2018 Whitepaper - AM0401A
88
5.4.1 Thermal Cracking and Coking
5.4.1.1 Fluid Oil Viscositor
FluidOil has obtained the Heavy-to-Light (HTL) process from Ivanhoe. The basis for the HTL
process is rapid, high temperature pyrolysis thermal cracking and coking of the feed using
reactor technology similar to an FCC process, but without catalyst. The technology is now
called Viscositor Heavy to Light (VHTL) and incorporating some additional technology. In
VHTL, the coking reactions take place in a fluidized bed and then coke is burned off in a
second bed to provide process heat. The difference with the FCC process is that VHTL uses
circulating sand as the heating medium instead of FCC catalyst. A flow diagram for the
process is in Figure 5.8.
Figure 5.8: HTL Process Flow Schematic
(Fluid Oil Corp., 2017)
The VHTL process was originally designed to be used at a heavy oil production site where
waste heat recovered from burning coke would be used to reduce natural gas requirements
for steam production for oil recovery. Because the HTL process burns coke and generates
excess energy, this process has a high GHG footprint. In addition, because the process relies
on thermal cracking, the product is olefinic and requires treatment to eliminate olefins. Fluid
Oil claims that the VHTL product meets pipeline density and viscosity specifications and there

Bitumen Partial Upgrading 2018 Whitepaper - AM0401A
89
is no need to use diluent for pipeline transport. Fluid Oil claims that the technology was studied
extensively during early pilot plant work and then validated by successful operation of a 1,000
bpd commercial demonstration facility in Bakersfield, California. Never-the-less, Fluid Oil’s
Viscositor technology’s high GHG footprint makes it less attractive than other new
technologies for partial upgrading of bitumen. Full conversion of vacuum residue would give
a product that exceeds the range for partial upgrading.
(Fluid Oil Corp., 2017)
5.4.1.2 ETX System IYQ Technology
ETX has developed the IYQ short residence time coking process which a uses cross-flow
fluidized bed shown in schematic form in Figure 5.9. The principle of the IYQ process is a
cross-flow of solids and gas that ensures short residence time at temperature for the feed
molecules and reduces over cracking and yield loss. The process uses a bed of solids that
provides heat for reaction. This bed is horizontally transported while being fluidized by sweep
gas that flows in the vertical direction. The rates of solid and gas flow can be adjusted for
maximum liquid yield and minimum over-cracking, and also allow for operation at a lower
reactor temperature. This combination is claimed to offer higher yields of liquid products than
the Fluid CokingTM technology (Section 5.2.1.2).
Figure 5.9: ETX IYQ Cross Flow Coking Process Schematic
(ETX Systems, 2017)
In the IYQ process, a bed of inert solids or coke is vertically fluidized by recycle product gas
and moves, via gravity, in a horizontal direction from left to right in the schematic shown in
Figure 5.9. Liquid feed oil is sprayed onto the hot solids as they enter the reactor on the left
in Figure 5.9. Cracking takes place on the hot solids. Volatile components in the oil are
vaporized as a result of contact with the hot solids. Coking reactions take place in the
remaining liquid. All volatile materials are swept from the reaction chamber with fluidization

Bitumen Partial Upgrading 2018 Whitepaper - AM0401A
90
gas. Any coke formed as a reaction product is transported to the right in Figure 5.9 together
with the moving bed of solids.
Solid fines are removed from the reactor vapor via cyclones; condensable liquids are
recovered. Solids exiting the reactor on the right in Figure 5.9 are routed to a fluidized-bed
boiler to burn off coke and generate steam and also to reheat the solids before they are
recycled back to the reactor.
ETX claims that the IYQ process offers significant advantage over fluid coking and other
competing coking processes. ETX claims between 66-90 wt% yield of liquid product
depending on reactor temperature and whether the unconverted vacuum residue is recycled
to the reactor to be fully converted. The corresponding volumetric yields are claimed to range
from 77% to over 90%, based on pilot-plant data.
The IYQ process produces a product that is similar to other coking processes, depending on
the extent of recycle of vacuum residue. Operating on a single pass mode, the product would
likely require a small amount of diluent to achieve the pipeline specifications (see Figure 4.8).
With recycle of vacuum residue, the product would exceed the partial upgrading definition of
this whitepaper, similar to delayed coking. A portion of the coke must be burned to maintain a
heat balance, which leads to a medium increase in GHG emissions above baseline.
(ETX Systems, 2017), Brown, W. (2009). (Castaneda, et al., 2014).
5.4.1.3 Husky Diluent Reduction (HDR™) Technology
Husky claims that their Husky Diluent Reduction (HDR™) technology has the potential to
reduce condensate diluent requirements by 50 per cent or more. The process relies on
hydrogen donation from tetralin-like molecules in SCO to quench free radicals formed during
thermal cracking of bitumen. As a result of hydrogen present during thermal cracking, deeper
conversion can be achieved than in typical thermal cracking. Husky claims the HDR™ process
can achieve 20+% conversion vs. <10% in conventional visbreaking to vacuum residue.
In the HDR™ process, bitumen undergoes specific heating, soaking, cracking, quenching
conditions similar to thermal cracking (Figure 5.2). Husky claims the HDR™ process
maximizes TAN reduction and minimizes coke make while converting residue to lighter
fractions and leaving MCR unchanged. Thermal conversion of TAN is consistent with
published studies and patents for TAN reduction. Included in the HDR™ process is a
hydrotreating step to eliminate olefins.

Bitumen Partial Upgrading 2018 Whitepaper - AM0401A
91
According to Husky, the HDR™ process has undergone evaluation in the CANMET 0.5 BPD
pilot test facility. Development has focused on identifying the optimum range of operating
conditions. Husky claims that the HDR™ process results in no coke formation and the product
meets pipeline viscosity specifications. However, the severity/conversion in the HDR™
process is limited by product stability as there is no asphaltene rejection step. According to
Husky, blended product volume increased 1-2% over feed. Husky claims their HDR™ product
met TAN specifications as a result of thermal conversion of naphthenic acids.
The product from HDR™ is claimed to meet the specifications for pipelining, therefore, this is
a partial upgrading technology. The product would not be identical to medium crude oils due
to its thermal history, but the significance of this difference to the refinery market is not well
defined. Greenhouse gas emissions would be below baseline, similar to visbreaking.
(Husky, 2017)
5.4.1.4 UMATAC Industrial Processes’ Alberta Taciuk Retort Process (ATP)
The Alberta Taciuk Process (ATP) is a horizontal rotating kiln retort originally designed in the
1980s to extract cracked bitumen products from mined oil sands. ATP is offered by UMATAC
Industrial Processes, part of Thyssenkrupp and is operating in Fushun, China for shale oil
production. ATP is claimed to process oil sands mined bitumen in capacities up to 800 MT/hr.
of mined bitumen, equivalent to 10,000 BPD per unit. This process claims to handle ores that
are oil or water wet and high or low grade.
This technology is applicable only to mined bitumen, and exceeds the requirements for
partially upgraded bitumen. It is not suitable for SAGD operations. GHG production is high
due to significant combustion of coke by-product.
(ThyssenKrupp UMATAC Taciuk, 2016)
5.4.1.5 Water-Based Catalytic Visbreaking (Aquaconversion)
Aquaconversion is a residue upgrading technology developed by PDVSA-Intevep in
Venezuela. It is a form of visbreaking that incorporates catalytic steam conversion that claims
to transfer hydrogen from water vapor into the unconverted bottoms of the crude, increasing
its stability by avoiding the formation of more unstable asphaltenes.
Aquaconversion uses an oil soluble catalyst such as alkali metals salts based on potassium
or sodium or metals in the crude oil. The catalyst is claimed to enhance dissociation of water
to release hydrogen atoms, which are consumed in hydroprocessing. The oil soluble catalyst

Bitumen Partial Upgrading 2018 Whitepaper - AM0401A
92
and presence of water prevent coke formation and deposition of sediment that often occurs
during visbreaking. It was developed in the 1990s and early 2000s but is no longer licensed.
(Oil and Gas Journal, 2001)
5.4.2 Asphaltene Rejection
5.4.2.1 Commercial Paraffin Froth Treatment Process Block
Paraffin froth treatment (PFT) is a commercial technology used to process bitumen from
mining, for example at Muskeg River, Jackpine, Kearl and Fort Hills. PFT typically rejects 10%
of the bitumen, which reduces the concentration of asphaltenes and improves the bitumen
properties, primarily by lowering the MCR. The major attraction of the technology is that it
allows the diluted bitumen to meet the specification for bottoms sediment and water (BS&W)
content. The treated bitumen also requires less diluent for pipeline transport. A simplified flow
diagram is in Figure 5.10. The PFT process rejects significantly less material than
conventional solvent deasphalting because the asphaltenes are solids, and are pumped as a
slurry in water.
Figure 5.10 Paraffin Froth Treatment
(Oil Sands Magazine, 2017)
In a study for the Albert Department of Energy (JacobsConsultancy, 2012), the API gravity
of PFT treated bitumen increased from around 8.5 to 9.5 °API and the MCR decreased from
roughly 13 wt% to 9 wt% as a result of PFT. Additional energy was required to recover the

Bitumen Partial Upgrading 2018 Whitepaper - AM0401A
93
solvent from paraffin froth treatment and there is a loss of roughly 8 vol% of bitumen, which
is primarily asphaltenes sent to disposal (JacobsConsultancy, 2012). The energy
consumption for mined bitumen processed by paraffin froth treatment is slightly higher than
bitumen processed by naphtha froth treatment. However, there are energy savings in the
overall well-to-wheels lifecycle GHG pathway because the bitumen can be refined directly
and because this bitumen is of higher quality than bitumen from naphtha froth treatment. The
well-to-wheels GHG intensity of gasoline and diesel from mined bitumen produced via PFT
and then refined is around 2% lower than gasoline and diesel from mined bitumen produced
via naphtha froth treatment, upgraded to SCO, and then refined.
PFT by itself is not sufficient by itself to achieve the pipeline specifications for viscosity and
density, and would need to be coupled with other processes to significantly reduce the
requirement for diluent. The capability of rejecting a portion of the asphaltene content, as
practiced in PFT, is a powerful tool in partial upgrading, and it features in several of the
combination technologies discussed in Section 5.4.3.
(Oil Sands Magazine, 2017), (Gray, 2015)
5.4.2.2 Selex-Asp for Rejection of Solid Asphaltene
SELEX-Asp, developed by Well Resources, is a solvent extraction technology that uses
paraffinic solvents to separate asphaltenes, and in some variants resins, from other
components in crude oil. Unlike other commercialized solvent extraction processes (e.g. the
KBR Rose and UOP-Foster Wheeler SDA processes), SELEX-Asp produces dry granulates
of asphaltenes.
The asphaltene rejected from Athabasca bitumen contains about 88% C5 insoluble
asphaltenes, which means that as much as 20% of the bitumen could be rejected in the
SELEX-Asp process. This yield loss is intermediate between solvent deasphalting (Section
5.2.2.1) and PFT. The relatively high rejection of bitumen as an asphaltene byproduct requires
a market for this byproduct. In locations such as China, where there is a strong market for
asphaltenes in non-fuel use as an asphalt blending stock, the economic incentives for SELEX-
Asp are stronger than in a market like Alberta, which at this time has a limited market for
rejected asphaltenes. Currently, Well Resources reports that four plants utilizing the SELEX-
Asp technology are operating in China with capacities between 500 bpd and 20,000 bpd
(Roche, Feb 5, 2018). Well Resources is investigating other uses for rejected asphaltenes.
According to Well Resources, the SELEX-Asp process can improve the API gravity of a 7.8
API bitumen to 13 API by rejecting 16 wt% of the bitumen as an asphaltene byproduct (Chung,
et al., 2006 Q4). The net result of processing bitumen in SELEX-Asp is that the volume of

Bitumen Partial Upgrading 2018 Whitepaper - AM0401A
94
diluent needed to transport bitumen in a diluent-bitumen mixture meeting the pipeline
minimum of 19 API decreases from 30 vol% for raw bitumen to around 18 vol% for the
upgraded bitumen product from SELEX-Asp. A schematic for processing bitumen in SELEX-
Asp is in Figure 5.11.
Figure 5.11: Well Resources SELEX-Asp Process
To further reduce diluent usage, the SELEX-Asp process must be coupled with a conversion
process, such as thermal cracking, coking, or resid hydrocracking.
(Yuan, 2016), (Xu, et al., 1998; Well Resources, 2018).
5.4.3 Combined Thermal Cracking and Deasphalting
5.4.3.1 MEG HI-Q® Partial Upgrading Technology
MEG Energy has developed the HI-Q® bitumen partial upgrading process that yields a product
that meets pipeline transportation specifications without needing to add diluent. The
technology is based on modified mild thermal conversion to yield a totally distillable overhead
product and a heavy bottoms product that is further upgraded by novel solvent de-asphalting
to yield near asphaltene-free oil (DAO). Solvent deasphalting and thermal cracking are well
proven technologies. The process schematic is shown in Figure 5.12.
Diluent to Production Site Diluent to Product SELEX-Asp Product
Diluted Bitumen
Vacuum Resid Solid Asphaltenes
DRU/VDU SELEX-Asp
Diluent DAO Product
Material heavierthan diluent & lighter than vacuum resid
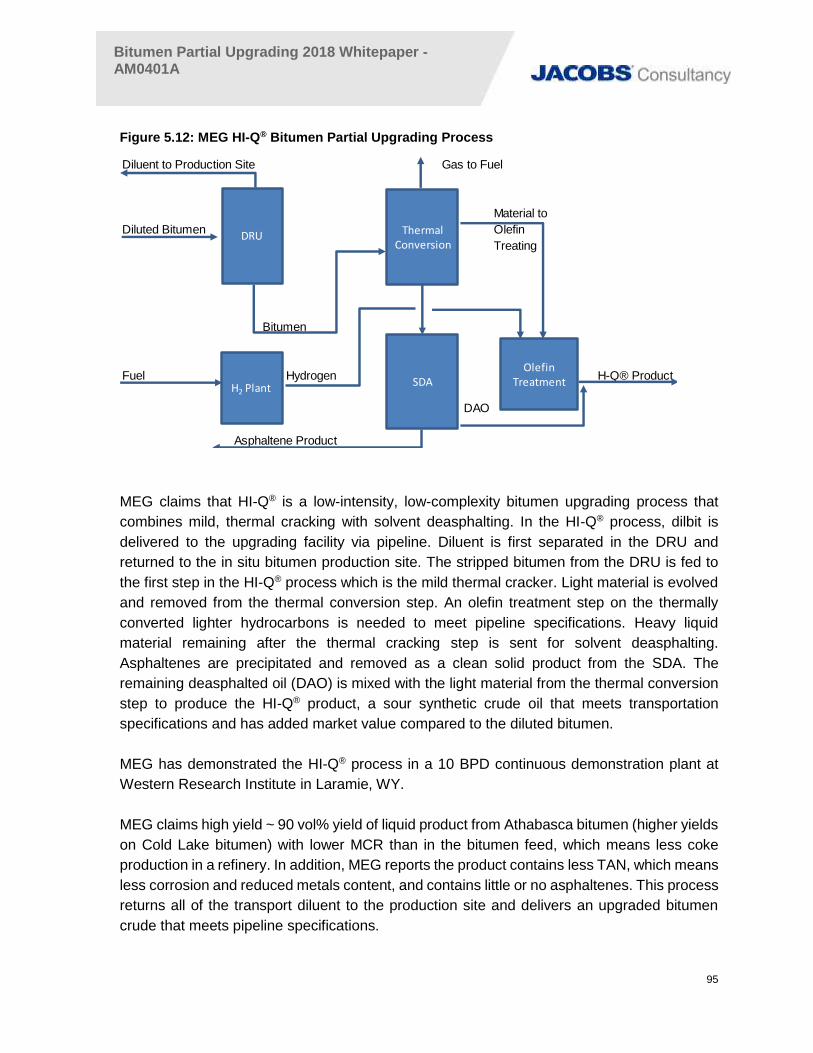
Bitumen Partial Upgrading 2018 Whitepaper - AM0401A
95
Figure 5.12: MEG HI-Q® Bitumen Partial Upgrading Process
MEG claims that HI-Q® is a low-intensity, low-complexity bitumen upgrading process that
combines mild, thermal cracking with solvent deasphalting. In the HI-Q® process, dilbit is
delivered to the upgrading facility via pipeline. Diluent is first separated in the DRU and
returned to the in situ bitumen production site. The stripped bitumen from the DRU is fed to
the first step in the HI-Q® process which is the mild thermal cracker. Light material is evolved
and removed from the thermal conversion step. An olefin treatment step on the thermally
converted lighter hydrocarbons is needed to meet pipeline specifications. Heavy liquid
material remaining after the thermal cracking step is sent for solvent deasphalting.
Asphaltenes are precipitated and removed as a clean solid product from the SDA. The
remaining deasphalted oil (DAO) is mixed with the light material from the thermal conversion
step to produce the HI-Q® product, a sour synthetic crude oil that meets transportation
specifications and has added market value compared to the diluted bitumen.
MEG has demonstrated the HI-Q® process in a 10 BPD continuous demonstration plant at
Western Research Institute in Laramie, WY.
MEG claims high yield ~ 90 vol% yield of liquid product from Athabasca bitumen (higher yields
on Cold Lake bitumen) with lower MCR than in the bitumen feed, which means less coke
production in a refinery. In addition, MEG reports the product contains less TAN, which means
less corrosion and reduced metals content, and contains little or no asphaltenes. This process
returns all of the transport diluent to the production site and delivers an upgraded bitumen
crude that meets pipeline specifications.
Diluent to Production Site Gas to Fuel
Material to
Diluted Bitumen Olefin
Treating
Bitumen
Fuel Hydrogen H-Q® Product
DAO
Asphaltene Product
DRU Thermal Conversion
SDAOlefin
TreatmentH2 Plant

Bitumen Partial Upgrading 2018 Whitepaper - AM0401A
96
MEG reports that the HI-Q® vacuum residue fraction is reduced from 56% in the feed bitumen
to 18% of the product. Naphtha production is minimized and represents about 8% of the
product. The largest portion of the HI-Q® product is kerosene, diesel and gasoils. A
comparison of the feed bitumen properties with HI-Q® product properties provided by MEG is
shown in Table 5.2.
Table 5-2: Properties – Bitumen vs. HI-Q® Product
Property Bitumen HI-Q® Product
API Gravity 8 20.1
Viscosity cSt 166,000,000 58.5
MCR wt% 15.5 2.7
TAN Mg KOH/g 2.5 0.3
Nickel ppm 104 5.54
Vanadium ppm 279 10
MEG claims that the HI-Q® process offers the potential to upgrade bitumen sufficiently to meet
pipeline specifications in a process that is simpler than full upgrading using delayed coking
with higher liquid yields. The bitumen product would be similar to medium crude oils but with
some differences in the vacuum residue due to the thermal cracking history. Greenhouse gas
emissions would be below baseline. The location could be at a SAGD site or a centralized
facility.
(MEG-1, 2017)
5.4.3.2 Nexen BituMax™ Partial Upgrading Technology
Nexen Energy ULC has developed the BituMax™ process to partially upgrade bitumen
sufficiently to reduce or eliminate the need for diluent. The process combines solvent
deasphalting and thermal cracking to produce an upgraded oil called BMX and a solid
asphaltene product. The order of thermal cracking and solvent desaphalting is reversed from
the line up used in the HI-Q® process (Figure 5.15).

Bitumen Partial Upgrading 2018 Whitepaper - AM0401A
97
The BituMax™ process is close coupled with the SAGD process for in situ production of
bitumen. Feed to the process is a water-oil emulsion from SAGD. Water is recovered in the
BituMax™ solvent deasphalting process and returned to the SAGD process. The BituMax™
SDA processing step recovers three phases: water, asphaltene pitch, and DAO. Nexen claims
there is equipment savings compared to separate stand-alone SAGD and partial upgrading
facilities. Because this process uses thermal cracking to improve yield, it produces olefins that
must be removed in an olefin treating process. Nexen is progressing research on a new
chemistry path (alkylation) for treating the olefins. If successful, this would represent an
improvement in capital and operating costs and a reduction in GHG emissions over
conventional hydroprocessing.
Figure 5.13 shows a schematic of the BituMax™ flow diagram. In this process, solvent
deasphalting is completed before thermal cracking. DAO from solvent deasphalting goes to
thermal cracking. Products are fractionated and some of the bottoms may be recycled to
thermal cracking. Nexen claims the configuration enables milder thermal cracking to better
achieve the level of conversion desired and maintain product stability.
Figure 5.13: Nexen BituMax™ Process Schematic
Steam
Diluent Makeup
Asphaltene Product
Gas to Fuel
DAO
Bitumen
Emulsion
Material to
Olefin BMX Product
Treating
SAGDWell
CPFandSDA
Olefin Treatment
ThermalConversion

Bitumen Partial Upgrading 2018 Whitepaper - AM0401A
98
Nexen has demonstrated the processing steps in the BituMax™ process at small pilot plant
level. Solvent deasphalting of the bitumen-water mixture from in situ production has been
demonstrated. Thermal deasphalting of DAO from the deasphalting process has been
demonstrated. Olefin reduction via alkylation is undergoing demonstration at pilot-plant scale.
A comparison of bitumen feed and BituMax™ product from Nexen is shown in Table 5.3.
Table 5.3: Properties – Bitumen vs. BituMax™ Product
Property Units Bitumen BituMax™ Product
API Gravity 8.3 20.5
Viscosity @20°C cSt 420,000 147
Sulphur wt% 4.8 3.7
MCR wt% 14.6 10.4
TAN Mg KOH/g 2.2 1.6
Nickel ppm 89 40
Vanadium ppm 247 101
(Nexen, 2017)
The BituMax™ process offers the potential to upgrade bitumen sufficiently to meet pipeline
specifications. Like the MEG HI-Q® process, the BituMax™ process is simpler than full
upgrading using delayed coking and gives higher yields, but produces a product that needs
to be explored for acceptance by petroleum refiners. The opportunity to fully integrate with
SAGD operation offers opportunities for savings. GHG emissions would be below baseline.
(Nexen, 2017)
5.4.3.3 Water-Based Supercritical Solvent Extraction (JGC)
In the JGC Supercritical Water Cracking process, undiluted bitumen from a SAGD process is
heated to improve flow and contacted in a reactor with supercritical water in approximately
1:1 weight ratio. The operating conditions are 22-25 MPa (3,200-3,600 psi) and 395-430 °C
(743-806 °F).
Supercritical water acts as a partially miscible solvent (similar to a traditional deasphalting
process) to form two liquid phases in the reactor. The lighter, water rich phase containing the
hydrocarbon product, leaves the top of the reactor where it is cooled and the water and
hydrocarbon phases separate in a two stage high pressure/low pressure separation system.
A flow diagram is shown in Figure 5.14.

Bitumen Partial Upgrading 2018 Whitepaper - AM0401A
99
Figure 5.14: JGC Supercritical Water Cracking Technology
(Kayukawa,, et al., 2017)
The heavier, residue rich phase, leaves the bottom of the reactor where it is cooled and
flashed to recover lighter hydrocarbon fractions, which can be blended with the overhead
hydrocarbon stream. The flash conditions can be optimized to maximize product yield and
minimize pitch yield. The pitch stream is a by-product that is a separate commercial product,
most likely used as fuel. Water in the pilot plant is used once-through. In a commercial plant,
the water will be cleaned and recycled.
This process has been demonstrated at 0.15 and 5 BPD pilot plants operating on Alberta
bitumen.
The JGC Supercritical Water Cracking process is not applicable for partial upgrading because
it involves expensive high-pressure processing of bitumen in large volumes of supercritical
water, producing a large volume of heavy residue pitch product, which reduces the amount of
material available for further upgrading, and results in high GHG emissions if used as fuel.
5.4.3.4 VCI's ADC and COC Technologies
Value Creation (VCI) claims to have developed a partial upgrading process based on
deasphalting followed by thermal cracking. VCI’s solvent deasphalting process is called

Bitumen Partial Upgrading 2018 Whitepaper - AM0401A
100
accelerated decontamination (ADC™) and is based on the use of water as in paraffinic froth
treatment used to process mined bitumen. (This is similar to the approach in Nexen’s BituMax
process.) The product from ADC™ is a decontaminated oil (DCO) product and an asphaltene
pitch. The deasphalted oil is converted to lighter material in their Clean Oil Cracking (COC™)
process. They claim an upgraded sour synthetic crude that requires no diluent but is olefinic.
Asphaltene pitch goes to sales or storage.
This process appears to have similarities to Nexen BituMax™ in coupling solvent deasphalting
and thermal cracking with a feed from SAGD wells, but insufficient information is unavailable
to enable a more detailed comparison. The development of the processes appears to be in
hiatus and it is not clear if they have been demonstrated. The VCI website has not been
updated since June 2016.
(Value Creation, 2016)
5.4.4 Hydrogen Addition and Cracking
5.4.4.1 Hydrovisbreaking
The Hydrovisbreaking Process (HYCAR) is a non-catalytic process, based on visbreaking,
that involves visbreaking followed by treatment with hydrogen at mild conditions to increase
conversion, reduce impurities, and produce higher quality products than conventional
visbreaking. Developed by Showa Shell in the 1980’s, hydrovisbreaking requires three
reactors: a visbreaking reactor for thermal cracking; a catalytic demetallization; and
hydrocracking. The visbreaking reactor uses mild thermal conditions in the presence of
hydrogen to crack molecules, the demetallization reactor catalytically removes contaminants,
particularly metals, prior to the hydrocracking reactor. The hydrocracking reactor uses an
inexpensive cobalt molybdenum catalyst to remove metals and crack complex molecules.
This technology has been around for more than twenty years. As far as we know, it is not
licensed nor has any commercial process been built. It is more complicated than simple
visbreaking and is considerably more complex and expensive than the lower capital partial
upgrading technologies.
(Arahata, et al.).

Bitumen Partial Upgrading 2018 Whitepaper - AM0401A
101
5.4.5 Fluid Mechanical
5.4.5.1 Superior Upgrading Tech./Hammer Technology
Superior Upgrading Technologies has developed the Hammer Technology for upgrading
bitumen. This technology relies on the combination of fluid hammer effect and hydrodynamic
cavitation. Superior Upgrading Technologies claims that extreme shear can create sufficient
high-velocity fluid kinetic energy to break bitumen’s molecular hydrocarbon bonds at nearly
ambient temperature and pressure (cold cracking) and meet pipeline specifications with little
or no diluent. This technology does not reject contaminants. The block flow diagram shown in
Figure 5.15 includes a heater
Figure 5.15: Superior Technology Hammer Technology
(CERI, 2015)
It is not clear from the process description whether this process is a kinetic process with
thermal cracking or simply a kinetic upgrading process. Product stability is a key parameter in
processes such as this.
The Hammer technology is still in the early stages of development.
(CERI, 2015)
Bitumen Partial Upgrading 2018 Whitepaper - AM0401A
102
5.4.5.2 Electromechanical Based Technologies
5.4.5.3 Petrosonic
Petrosonic has patented the Sonoprocess, which uses soundwaves to break down the
viscosity of heavy crude. Very little can be found about this process or this company. The
technology does not appear to have been demonstrated.
(Petrosonic Sonoro) – there is no Petrosonic website; Sonoro has exited this business
5.4.6 Fluid Mechanical and Thermal Cracking
5.4.6.1 Fractal Systems Jet Shear™/Enhanced Jet Shear™
Fractal System’s JetShear™ bitumen partial upgrading technology uses low severity,
hydrodynamic cavitation and heat to structurally modify asphaltene molecules by separating
resin groups attached to the asphaltene core. Fractal claims that JetShear™ causes a rapid
change in pressure at temperatures below incipient cracking temperature which allow
microbubbles to form around nucleation sites. Fractal claims that kinetic energy from
cavitation, converts to chemical energy and modifies heavy oil microstructures and the state
of aggregation of bitumen asphaltenes. Fractal claims that the resulting breakup of asphaltene
structures reduces viscosity and bulk density with essentially no change in the chemical
composition or volumetric yield. Fractal claims that the JetShear™ process improves viscosity
and density as well as results in a reduction in a modest reduction in TAN. With Enhanced
JetShear™ further reductions in these properties are possible. Fractal combines fluid
mechanical breakup of asphaltene aggregates with thermal cracking.
Figure 5.16 shows the process configuration for the Enhanced JetShear™ which adds a
hydrotreating step to the JetShear™ process to meet the pipeline olefin specification.

Bitumen Partial Upgrading 2018 Whitepaper - AM0401A
103
Figure 5.16: Fractal Enhanced JetShear™
Source: Fractal 2016/2017
In a commercial configuration of the JetShear™ and Enhanced JetShear™ processes, a dilbit
or heavy oil blend is delivered from the production facility or terminal. The first step is removal
of light ends by fractionation. These light ends are not further processed and are separated
and then blended, as required, into the final sales blend, recirculated back to the CPF or
diverted to sales. Heavy oil from fractionation goes to the core JetShear™ module where it is
heated to thermal cracking temperatures and pumped through proprietary jet-nozzles where
cavitation occurs. The upgraded product is cooled and sent to the sales tank to be blended
with enough light ends removed in the first processing step to become the partially upgraded
bitumen product that meets pipeline specifications.
A comparison of product quality from JetShear™ and Enhanced JetShear™ from Fractal
System’s public representations of their processes is in Table 5.4. These data show diluent
use is reduced from 32 vol% in the original dilbit to 20 vol% with JetShear™ and 18 vol% with
Enhanced JetShear™.
Hydrogen
Fuel Sulfur
Enhanced
JetShear™
Product
Dilbit or
under diluted Dilbit
Diluent
High
Pressure
Feed Pump
OlefinRemoval
NaphthaStripper
HeaterNozzle Bank
H2 Plant Sulfur Recovery
Front End Fractionator

Bitumen Partial Upgrading 2018 Whitepaper - AM0401A
104
Table 5.4: Fractal Systems’ Representation of JetShear™ and Enhanced JetShear™ Pipeline Spec Products
Properties Raw Bitumen Dilbit JetShear™ Enhanced JetShear™
Density (°API) 7.5 22 19 19
Viscosity (cSt) @ 12° C 200,000-
1,500,000 <350 <325 <250
Diluent content (%) n/a ~32 ~20 ~18
Diluent displacement (%) n/a n/a ~42 ~53
Olefin content (wt %)* 0 0 ~1% <0.5%
Acid Number (mg KOH/g) 2.25 1.68 1.25 0.6
Sulphur content (wt %) 4.75 ~3.6 4.0 3.9 *Detection limit is 0.5 wt% via NMR
According to Fractal, the JetShear™ process has been tested in a 1 to 30 BPD laboratory
pilot facility prior to 2009. From 2009-2012 it was tested in a 300 BPD field test facility using
two 150 bpd nozzles.
During 2013, Fractal entered into technology and testing agreements with a large Canadian
oil sands producer and in April of 2014, the parties commenced testing diluted bitumen at
Fractal’s 1,000 barrel per day JetShear™ demonstration facility located near Provost, Alberta.
The facility operated for approximately one year. During this period, the facility processed over
113,000 barrels of partially diluted bitumen that was trucked to the site.
The goal of the project was to (1) meet processing objectives with two 500 bpd commercial-
size nozzles, (2) achieve desired nozzle life performance (> 6 months) (3) meet facility
operability and throughput expectations with no safety or environmental incidents, and (4) to
achieve certain product quality targets for product stability (P-value >1.5), TAN reduction
(>15%), and liquid yield (~100 vol%). According to Fractal, all key targets were met or
exceeded and the demonstration was deemed a success by the partnership.
Supported by the successful demonstration of the JetShear™ technology platform, Fractal
commenced engineering for a retrofit and expansion of the existing facility to demonstrate the
Enhanced JetShear™ and Acid Reduction Process™ (ARP™) platforms. Construction on the
retrofit started in the first quarter of 2016, was commissioned through that summer and
operated from late August 2016 through August 2017.
According to Fractal, during the operating period, the Facility processed over 113,000 barrels
of partially-diluted bitumen that was trucked to the site from a SAGD project. The Facility
achieved up to 53% diluent displacement and the TAN of the diluted bitumen was reduced by

Bitumen Partial Upgrading 2018 Whitepaper - AM0401A
105
at least 60% to well below a TAN level equal to 1 mg KOH/g. In addition, according to Fractal,
this performance was achieved while maintaining olefinic content of the crude at or below the
detection limit (1% by weight).
Because there are no asphaltenes removed in the JetShear™ process, product stability is a
concern. However, Fractal Systems claims experience at the commercial demonstration
facility have shown product stability not to be an issue, with P-values for Enhanced JetShear™
products meeting pipeline specifications falling in a range between 1.5 to 2.4, depending on
the processing severity employed.
Fractal claims that the Enhanced JetShear™ process offers the potential to reduce diluent
needs by 50 to 60% and upgrade bitumen sufficiently to meet pipeline specifications in a
process that is simpler than visbreaking (Section 5.2.1.1). Like the other thermally altered
bitumens, the product has attributes in common with heavy crudes and coker products, but it
is not identical and not on the market yet. The market value of these partially upgraded
products depends on results from refinery processing. GHG emissions would be below
baseline.
(Fractal Systems, 2016-2017), (Chornet, et al., 2008).
5.4.7 Other technologies
5.4.7.1 Field Upgrading - Molten Sodium Upgrading
Field Upgrading uses molten sodium to remove sulfur and upgrade bitumen. They use an
advanced ceramic membrane in an electrochemical process to recover sodium. The process
is called the De-Sulphurization & Upgrading (DSU™) process.
The DSU™ process mixes elemental molten sodium and hydrogen with a sour heavy oil
feedstock. The DSU™ product is a low sulfur upgraded heavy oil product that is 8-10 API
higher than the feed. According to Field Upgrading, the level of API increase depends on the
amount of sulfur in the feed. In addition, the DSU™ product contains no sulfur, no heavy
metals, no TAN and is greatly reduced in asphaltene content.
The key to DSU™ is sodium, a potent reducing agent with a strong affinity for heteroatoms
and metals interspersed in the complex hydrocarbon molecule. There are three steps in the
process:
1) Removal of metals, sulfur and nitrogen from bitumen by reaction with sodium.
2) Radical capping of upgraded molecules using hydrogen to prevent formation of cyclic
hydrocarbons and olefins.

Bitumen Partial Upgrading 2018 Whitepaper - AM0401A
106
3) Recovery of sodium using a patented ceramic transport membrane reactor developed
by Ceramatec. When electricity is applied to the ceramic membrane, elemental
sodium is extracted ionically through the membrane and recycled to the process.
Sulfur and metals are the other products.
A schematic of the process is in Figure 5.17
Figure 5.17: Field Upgrading DSU Process
(Field Upgrading, 2017)
The DSU™ process does increase the gravity of the product and reduces viscosity as a
consequence of sulfur removal. However, such a low-sulfur product is not valued by the US
refineries which already have sulfur removal capacity. Rather than partial upgrading, this
technology is a likely to be a better fit in low-sulfur fuel markets.
5.4.7.2 Novel Additive-Based Upgrading
Bayshore Petroleum has developed a Cold Catalytic Cracking (CCC) upgrading technology
for partial upgrading of bitumen (to lighter oil), and full upgrading (to diesel fuel). According to
Bayshore, Cold Catalytic Cracking achieves upgrading without hydrogen, pressure vessels,
and uses less heat and energy than other partially upgrading processes. According to
Bayshore, CCC has a smaller greenhouse gas footprint than conventional upgrading
processes.
The physical and chemical principles of this process are unpublished, and no patents appear
to have been awarded in Canada or the United States. In addition, it is still at lab scale.
(Bayshore Petroleum, 2015)

Bitumen Partial Upgrading 2018 Whitepaper - AM0401A
107
5.4.7.3 Novel Diluent
Use of light paraffinic condensate as diluent instead of the current heavier diluent has been
proposed. A lighter diluent will reduce dilbit viscosity with less volume than the current heavier
condensate. The objective is to use less diluent than is currently being used. However, diluent
cost will be higher because the diluent is a specialty product. Novel diluent is out of scope for
this technology evaluation.
5.4.7.4 Bitumen Solidification
The University of Calgary is investigating encapsulating bitumen with a solid coating made
from bitumen to produce a solid brick that can be shipped like coal.
This technology is still at the development stage. It is out of scope because it does not address
partial upgrading criteria.
5.4.7.5 Auterra Oxidative Desulfurization the FlexUP™ Process
Oxidative desulfurization converts sulfur in oils to sulfites, sulfates, sodium naphthenates, and
sulfones. The process is claimed to increase oil API gravity. Lab results on heavy oils are
lacking and this process has not been piloted. Patents only describe conversion of sulfones
from very simple diesel-range model compounds. To our knowledge, no oxidative
desulfurization on any feedstock is operating or has operated commercially. According to
Auterra, FlexUP™ is a “catalytic process that offers the disruptive ability to upgrade heavy-
sour crude oil, providing an increase in value as high as 5% -20%. Because FlexUP™ has a
small physical and carbon foot print; oil producers can field upgrade heavy-sour oil while
drastically improving their economics. FlexUP™ has been successfully tested on many heavy-
sour crude oils as well as bitumen and asphaltene feeds.” One of their patents claims oxidative
desulfurization using a titanium (IV) catalyst and organo-hydroperoxides.
This technology is still at the development stage and has not been piloted.
(Auterra, 2017)
5.4.7.6 In Situ Upgrading
The University of Calgary is researching at lab scale, injection of catalysts into an in situ
bitumen production well to upgrade bitumen to meet pipeline specifications. Asphaltene coke
products from reaction are left in the reservoir. This concept is still at lab scale.
(Hashemi, 2013)

Bitumen Partial Upgrading 2018 Whitepaper - AM0401A
108
5.4.7.7 Expander Energy FTCrude®
Expander Energy offers the FTCrude® bitumen upgrading process that uses a novel
arrangement of existing commercialized/licensed technologies, mainly based on the well-
established Fisher-Tropsch technology. In this process, dilbit is first fractionated in a distillate
recovery unit (DRU) which also removes gas oils. The atmospheric residue from the DRU is
deasphalted in an SDA unit. The pitch from this process, containing the asphaltenes, is
gasified to generate clean syngas, primarily consisting of H2 and CO. Gasifier syngas is
enhanced with hydrogen-rich reformer syngas from steam methane reforming of natural gas
to provide a stoichiometric feed for FT synthesis, which produces a synthetic fuel product that
is primarily high-cetane diesel. Light material removed from the DRU is blended with
deasphalted oil, and the FT product to make a partially upgraded bitumen product that meets
pipeline specifications without needing to blend diluent. The volumetric yield of upgraded
bitumen is in excess of 110% of bitumen feed as a result of the natural gas used in addition
to bitumen. A schematic of the process is given in Figure 5.1.
Figure 5.18: Process Schematic Expander Energy offers the FTCrude®
The FTCrude® process has not been demonstrated in lab or pilot scale. However, all the
individual technologies have been demonstrated. This technology would give a high-quality
product well outside the range defined for partial upgrading. This process would not likely be
viable in the oil sands industry even for full upgrading for SCO production given its the high
capital cost for the multiple processes illustrated in Figure 5.1. GHG emissions from
gasification are high, unless carbon capture and sequestration are added to the process.
(Expander Energy, 2017)

Bitumen Partial Upgrading 2018 Whitepaper - AM0401A
109
5.5 Partial Upgrading Technology Comparisons
The upgrading technologies discussed in this section have been put on similar basis for
comparison in Table 5.5. The descriptors use for each technology in the columns of Table 5.5
were introduced in Section 5.4 on Page 86. They are as follows:
a) Technology Status – Stages are Commercial, Demonstration, Pilot, Development, and
Research, as listed in Table 5.1.
b) Fit to Partial Upgrading of Bitumen (PUB) – Does the product from the technology meet
the definition of partial upgrading, or does it exceed the definition?
• Does not meet
• Meets
• Exceeds
• Unknown
c) Principles Behind Processing Technology
• Primary upgrading step
• Secondary upgrading step
• Olefin Treating – is treatment of produced olefins required in order to meet pipeline
specifications?
- YES
- NO
d) Viability of Technology
• Technical Basis – Are the underlying engineering principles fully established, based
at least on results from pilot testing?
- YES
- NO
- Unknown
• Market Basis defines the acceptance of the product(s)
- High – Established products with defined markets. This designation applies to
well established technologies such as coking, hydroconversion and Fischer-
Tropsch
- Medium – The products have attributes in common with heavy crudes and coker products, but are not identical and not on the market yet
Bitumen Partial Upgrading 2018 Whitepaper - AM0401A
110
- Unknown – Very different products to established markets or ill-defined early-
stage processes
- Asphaltenes (+A) – The technology produces significant amounts of
asphaltenes or similar byproducts for which no market has been defined yet
and which may require disposal
• Environmental basis – GHG Emissions – How do the GHG emissions compare to
established technologies?
- Baseline or near-baseline – Similar to delayed coking
- Below baseline – Lower than delayed coking
- Medium – Higher than baseline due to significant hydrogen consumption or
partial coke combustion
- High – Complete coke combustion, gasification, or significant combustion of
unconverted vacuum residue
e) Potential location for the use of such a process
• Integrated – The partial upgrader is located at the SAGD site and integrated with water
treatment and steam generation
• Bolt-on – Add on to a SAGD central processing facility
• Central PUF – A centrally located Partial Upgrading Facility (PUF) collecting product
from multiple SAGD fields
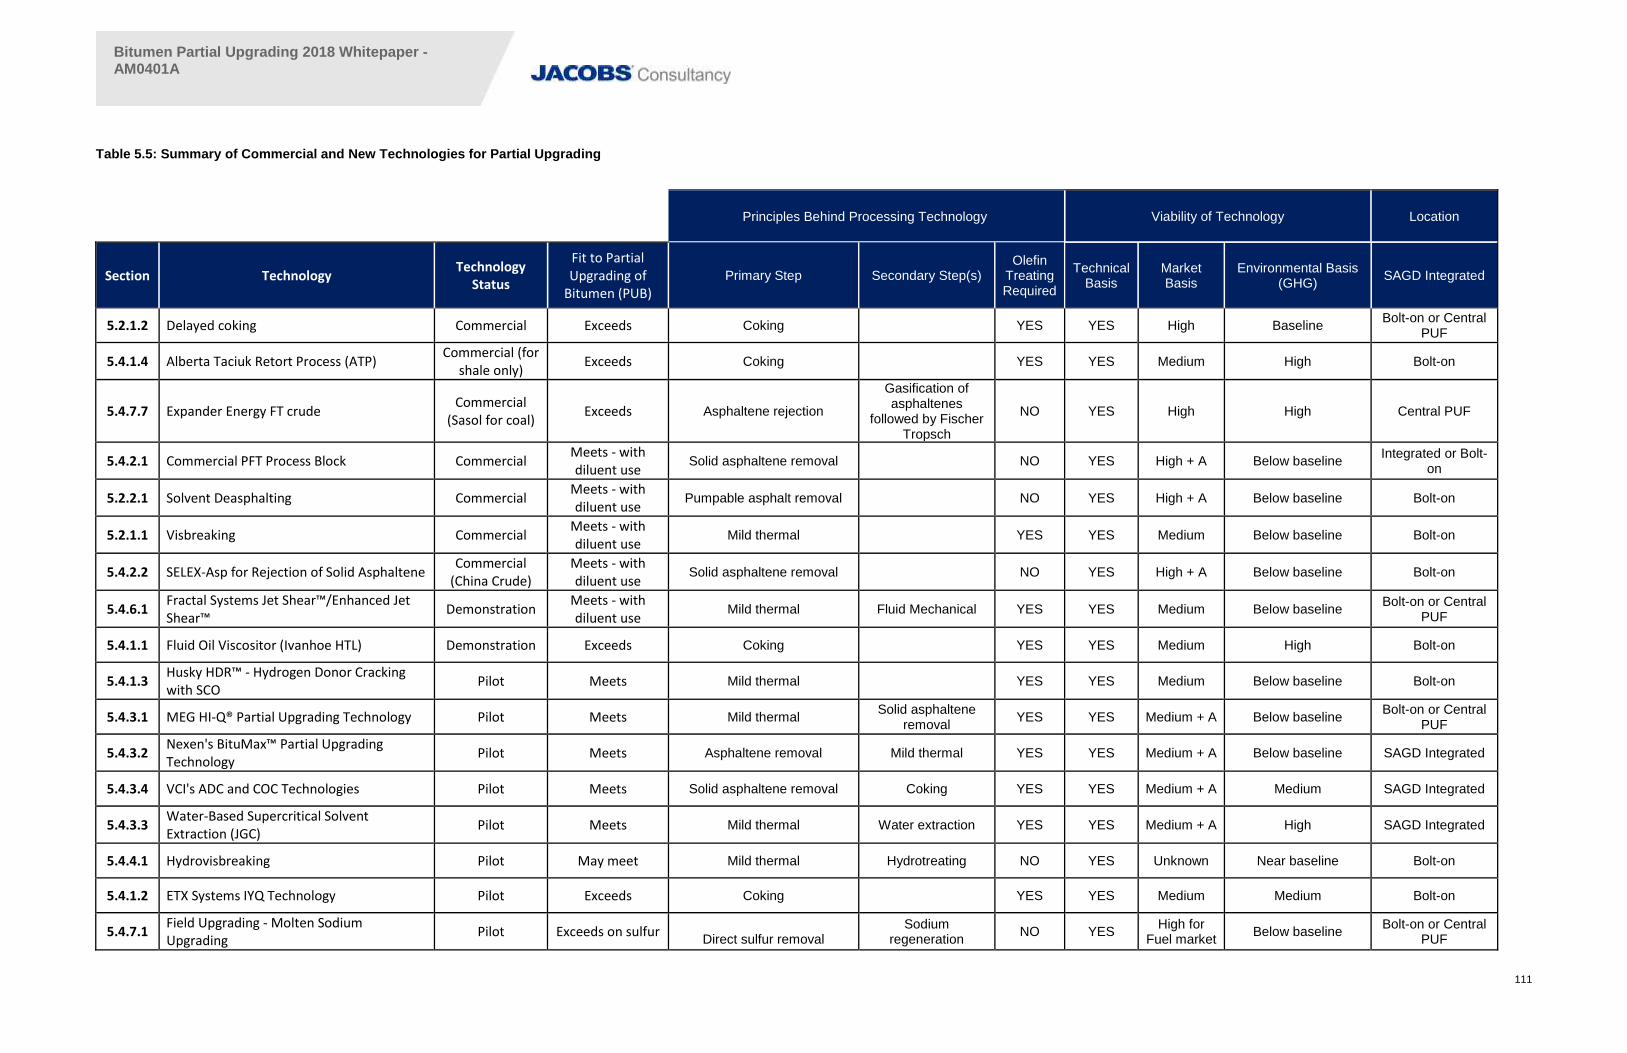
Bitumen Partial Upgrading 2018 Whitepaper - AM0401A
111
Table 5.5: Summary of Commercial and New Technologies for Partial Upgrading
Principles Behind Processing Technology Viability of Technology Location
Section Technology Technology
Status
Fit to Partial Upgrading of
Bitumen (PUB) Primary Step Secondary Step(s)
Olefin Treating Required
Technical Basis
Market Basis
Environmental Basis (GHG)
SAGD Integrated
5.2.1.2 Delayed coking Commercial Exceeds Coking YES YES High Baseline Bolt-on or Central
PUF
5.4.1.4 Alberta Taciuk Retort Process (ATP) Commercial (for
shale only) Exceeds Coking YES YES Medium High Bolt-on
5.4.7.7 Expander Energy FT crude Commercial
(Sasol for coal) Exceeds Asphaltene rejection
Gasification of asphaltenes
followed by Fischer Tropsch
NO YES High High Central PUF
5.4.2.1 Commercial PFT Process Block Commercial Meets - with diluent use
Solid asphaltene removal NO YES High + A Below baseline Integrated or Bolt-
on
5.2.2.1 Solvent Deasphalting Commercial Meets - with diluent use
Pumpable asphalt removal NO YES High + A Below baseline Bolt-on
5.2.1.1 Visbreaking Commercial Meets - with diluent use
Mild thermal YES YES Medium Below baseline Bolt-on
5.4.2.2 SELEX-Asp for Rejection of Solid Asphaltene Commercial
(China Crude) Meets - with diluent use
Solid asphaltene removal NO YES High + A Below baseline Bolt-on
5.4.6.1 Fractal Systems Jet Shear™/Enhanced Jet Shear™
Demonstration Meets - with diluent use
Mild thermal Fluid Mechanical YES YES Medium Below baseline Bolt-on or Central
PUF
5.4.1.1 Fluid Oil Viscositor (Ivanhoe HTL) Demonstration Exceeds Coking YES YES Medium High Bolt-on
5.4.1.3 Husky HDR™ - Hydrogen Donor Cracking with SCO
Pilot Meets Mild thermal YES YES Medium Below baseline Bolt-on
5.4.3.1 MEG HI-Q® Partial Upgrading Technology Pilot Meets Mild thermal Solid asphaltene
removal YES YES Medium + A Below baseline
Bolt-on or Central PUF
5.4.3.2 Nexen's BituMax™ Partial Upgrading Technology
Pilot Meets Asphaltene removal Mild thermal YES YES Medium + A Below baseline SAGD Integrated
5.4.3.4 VCI's ADC and COC Technologies Pilot Meets Solid asphaltene removal Coking YES YES Medium + A Medium SAGD Integrated
5.4.3.3 Water-Based Supercritical Solvent Extraction (JGC)
Pilot Meets Mild thermal Water extraction YES YES Medium + A High SAGD Integrated
5.4.4.1 Hydrovisbreaking Pilot May meet Mild thermal Hydrotreating NO YES Unknown Near baseline Bolt-on
5.4.1.2 ETX Systems IYQ Technology Pilot Exceeds Coking YES YES Medium Medium Bolt-on
5.4.7.1 Field Upgrading - Molten Sodium Upgrading
Pilot Exceeds on sulfur
Direct sulfur removal Sodium
regeneration NO YES
High for Fuel market
Below baseline Bolt-on or Central
PUF

Bitumen Partial Upgrading 2018 Whitepaper - AM0401A
112
Principles Behind Processing Technology Viability of Technology Location
Section Technology Technology
Status
Fit to Partial Upgrading of
Bitumen (PUB) Primary Step Secondary Step(s)
Olefin Treating Required
Technical Basis
Market Basis
Environmental Basis (GHG)
SAGD Integrated
Unknown on other properties
5.4.1.5 Water-Based Catalytic Visbreaking (Aquaconversion)
Pilot Does not meet Mild thermal YES NO Medium Below baseline Bolt-on
5.4.5.1 Superior Upgrading Tech./Hammer Technology
Pilot Unknown Fluid mechanical Unknown NO Unknown Below baseline Bolt-on
5.4.7.3 Novel Diluent Development Does not meet No partial upgrading
achieved NO YES High Below baseline Unknown
5.4.7.4 Bitumen solidification Development Does not meet No partial upgrading
achieved NO Unknown Unknown Below baseline Unknown
5.4.7.5 Auterra Oxidative Desulfurization Development Unknown Oxidation of sulfur Aqueous hydrolysis NO NO Unknown Potentially below
baseline Unknown
5.4.5.2 Electromechanical based technologies Development Unknown Various YES Unknown Unknown Unknown Bolt-on
5.4.7.2 Novel Additive-Based Upgrading Development Unknown Coking Unknown Unknown Unknown Unknown Unknown
5.4.7.6 In Situ Upgrading Development Unknown Various Unknown Unknown Unknown Unknown SAGD-Integrated

Bitumen Partial Upgrading 2018 Whitepaper - AM0401A
113
5.6 Partial Upgrading Technology Selection
As we discussed, there are a number of promising technologies at varying stages of development
that could be used to partially upgrade or fully upgrade bitumen. Partial upgrading technology
selection should take the following criteria into consideration:
1. Unable to meet partial upgrading specifications – Visbreaking and solvent
deasphalting are examples of commercial technologies that, by themselves, cannot meet
the product specifications without diluent use. Newer deasphalting technologies, such as
paraffinic froth treatment and Selex-Asp, are in the same category.
2. Overconversion that exceeds partial upgrading specifications – Commercial
technologies based on coking, such as delayed coking and fluid coking, produce products
that exceed the specifications for partial upgrading. These technologies would give much
higher quality crude oil but at substantially higher cost.
3. Excessive greenhouse gas emissions – Technologies that incorporate significant
combustion of coke, asphaltene, or residual materials may lead to high GHG emissions.
4. Production of large amounts of low value or unwanted byproducts – Technologies
such as oxidized sulfur, and partially converted pitch from water-based supercritical
conversion create large amounts of byproducts.
5. Insufficient level of development, inactive development, or outside the scope of
partial upgrading – A number of technologies are no longer being actively developed.
For example, Aquaconversion and Petrosonic.
Applying these criteria to the technologies listed in Table 5.5, two main themes emerge for
potential pathways for partial upgrading to meet pipeline specifications with low or no diluent use:
1. Mild thermal cracking of bitumen to break down some of the large molecules, with or
without enhancements such as fluid-mechanical manipulation or addition of other crude
oil fractions. This approach maintains volumetric yield. However, diluent addition is still
required and the stability of the thermally cracked asphaltenes are concerns.
2. Mild thermal cracking in combination with partial asphaltene rejection to produce a crude
oil that meets pipeline specifications with no diluent addition or reduced diluent addition.
This approach produces a stable crude oil and eliminates or reduces the need for diluent
addition. However, there is some volumetric yield loss and production of asphaltene by-
products for which no market exists.
The use of mild thermal cracking, common to both approaches, is based on its low cost and
effectiveness in reducing bitumen viscosity. Despite long use in refining, details of how high
temperatures modify the asphaltenes and their properties require better definition.

Bitumen Partial Upgrading 2018 Whitepaper - AM0401A
114
There are likely to be many more technologies that will be offered for partial upgrading of bitumen
in the future. Choosing which ones to pursue should be based on their providing a solid scientific
basis for technical claims. New partial upgrading technologies must also address issues
concerning bitumen and bitumen transport discussed here, namely reducing or eliminating the
need for diluent by reducing or rejecting asphaltenes, and converting heavy molecules to lighter
ones. Because it is expensive to build new technology in Alberta, low capital cost and high yield
are other key attributes of successful partial upgrading technology.

Bitumen Partial Upgrading 2018 Whitepaper - AM0401A
115
6. Summary of Challenges and Recommendations
Challenges remain on the path to commercialization of bitumen partial upgrading technology.
These include: changing market conditions, logistical barriers, mismatches between properties
desired by crude oil refiners and achieved by partial upgrading, high capital and operating costs,
yield loss, GHG impact, lack of scale, and technical risks. However, multiple pilots, R&D work,
and government support are underway to mitigate many of these issues.
6.1 Recommendations for Further Research and Development
The following key topics are recommended for further research and development:
1. Viscosity reduction of partially upgraded bitumen with minimal energy input, and without
producing unstable asphaltenes in the product – Alternatives to mild thermal cracking
could be valuable, to reduce energy consumption and avoid changes to the stability of the
asphaltenes.
2. Asphaltene stability in thermally cracked partially upgraded bitumen is a potential fouling
issue for downstream refineries, because thermally cracked asphaltenes may become
unstable when blended with other crude oils in the refinery. Research on the relationship
between metrics of asphaltene stability and fouling could be helpful in increasing the
market acceptance of partially upgraded bitumen.
3. Olefin reduction in partially upgraded bitumen without hydrogen addition – The existing
technology for olefin reduction is based on expensive hyrotreatment. Alternatives that
convert or separate the olefin components without the use of hydrogen could reduce the
cost of partial upgrading processes.
4. Uses for rejected asphaltenes from partial upgrading – The removal of a portion of the
asphaltenes from the bitumen enhances the product quality and value, but it creates a
byproduct for which markets do not exist. Research on new products from asphaltenes
could provide alternatives for the use of this material.
5. Impact of quality improvement on price of partially upgraded bitumen – Partial upgrading
can improve the quality of the product by reducing MCR and sulfur and increasing the
fraction of distillates. The value of these improvements to refineries needs to be
investigated at current crude oil prices.
6. TAN reduction in partially upgraded bitumen. Thermal processing gives a reduction in TAN
by breaking down a portion of the carboxylic acids, but alternate approaches are desirable.

Bitumen Partial Upgrading 2018 Whitepaper - AM0401A
116
Appendix A: Glossary and List of Acronyms
Glossary of Selected Terms Commonly Used in Oilsands Upgrading
Acid gas A gas mixture containing hydrogen sulfide, and possibly carbon dioxide. The components from acid gas partition into aqueous solutions and lower the pH.
Aliphatic Hydrocarbon compounds or fragments of larger molecules comprised of saturated carbons, in CH, CH2 and CH3 groups depending on the specific structure.
°API A measure of liquid gravity defined by the American Petroleum Institute and common in the oil industry, derived from the Baume scale. The liquid gravity of water is set at 10 °API. If an oil has a gravity greater than 10 °API, it is less dense and floats on water; if less than 10 °API, it is more dense than water and sinks. Light crudes have gravities of 35–40 °API. Bitumens by convention typically have gravities below 10 °API.
Aromaticity The fraction of carbon in a compound or a petroleum fraction that is in aromatic rings (see Aromatics)
Aromatics Hydrocarbon species containing at least one planar ring with delocalized p-electrons, usually represented as alternating double and single bonds. Such molecules are typically more stable than similar non-aromatic structures toward thermal cracking. Aromatics occur in unusually high concentrations in bitumen and some derived products, and the presence of aromatics decreases the quality of distillate fuels. The simplest compound in the aromatic series is benzene.
Asphaltenes The heaviest and most aromatic hydrocarbon fraction of bitumen, isolated by precipitation with a paraffinic solvent such as n-pentane or n-heptane.
Asphaltene Micelle Organization of relatively more polar asphaltene molecules in a relatively less polar hydrocarbon solution. Solubilization of asphaltene molecules in a hydrocarbon solution can be achieved by surfactant molecules like maltenes. As maltenes are converted in partial upgrading, asphaltene solubility decreases and they begin to precipitate.
Barrel (bbl) The generally accepted commercial unit of measurement for oil. One barrel of oil equals 159 liters, and one cubic meter of oil contains 6.29 barrels. Within the oil industry, the abbreviation “Mbbl” was used to symbolize thousands of barrels, and “MM bbl” millions of barrels. However, many in the industry now use SI prefixes instead; that is, “kbbl” for thousands of barrels and “Mbbl” for millions of barrels.

Bitumen Partial Upgrading 2018 Whitepaper - AM0401A
117
Biodiesel Diesel fuel from fats and oils. It is a fatty acid methyl ester.
Boiling curve The continuous relationship between the cumulative mass or volume of a petroleum or bitumen sample that is distilled into vapor and the boiling temperature of the liquid. The curve begins at the initial boiling point (IBP) and ends at the final boiling point (FBP) or at the limiting temperature for distillation in the case of heavy bitumen fractions. The limits are around 524 °C for vacuum distillation and 750 °C for simulated distillation.
Bottom solids and water (BS&W)
The volume fraction of a crude oil that consists of water and solid particles, determined by adding solvent and centrifugation.
Bromine number A measure of the concentration of olefins (or alkene groups) in a sample, based on the reaction of bromine (Br2) with these compounds.
Buffer shipment A pipeline shipment of crude oil that is used to separate material with undesirable olefins content for previous and subsequent pipeline batches.
Carbon number The number of carbon atoms in a compound, often used to relate properties to the paraffinic compound series.; C6 = n-hexane, C10=n-decane, C16=n-hexadecane etc.
Catalyst A material that increases the rate of a chemical reaction but is not consumed by the reaction. Catalysts are used in upgrading processes to assist hydrogenation, sulfur and nitrogen removal, cracking and other upgrading reactions.
Cetane number A measure used to describe the combustion characteristics of a diesel fuel. A high cetane number indicates a better fuel. The scale is from zero for naphthalene to 100 for n hexadecane (cetane) .
Coke The solid black residue of carbon, sulfur, nitrogen, hydrogen and metals that remains after the more valuable components have been removed (from bitumen) by heating to high temperatures.
Condensate A mixture of light hydrocarbons recoverable from gas reservoirs, mainly in the range from C5 to C6; also called natural gas liquid, natural gas condensate, natural gasoline or pentanes plus. Condensate is used as a diluent to reduce bitumen viscosity for pipeline transportation.
Conradson carbon residue (CCR)
The amount of solid carbonaceous residue from a sample, as a weight fraction, from thermal cracking under standardized conditions. CCR content is proportional to the yield of coke in coking processes. The CCR assay has largely been replaced by the simpler Micro-Carbon Residue (MCR) assay which gives equivalent results.

Bitumen Partial Upgrading 2018 Whitepaper - AM0401A
118
Cracking The process of breaking down larger, heavier and more complex hydrocarbon molecules into simpler, lighter molecules by thermal or catalytic reactions.
CAFE Corporate average fuel standards (CAFE) are established by the US EPA and National Highway Transportation Safety Administration (NHTSA) for light duty vehicles.
CO2e CO2 equivalents, which GHG emissions from CO2 and NOx and CH4 converted to CO2 equivalents by their global warming potentials
Deasphalting A family of processes that use light solvents to selectively separate highly aromatic asphaltene fractions from heavy feeds. The two products are asphaltenes (or asphalt) and a deasphalted oil (DAO).
Diluent A solvent added to bitumen or heavy oil to reduce its viscosity and raise its API gravity to allow pipeline transportation. Diluents include natural gas condensate (see Condensate), naphtha, and synthetic crude oil.
Diluted bitumen (dilbit)
A mixture of crude bitumen and a diluent (solvent).
Distillate A fraction of bitumen or synthetic crude oil than can be recovered as the overhead stream from distillation.
Distillation curve See Boiling curve.
EPA US Environmental Protection Agency
Flue gas desulfurization
Scrubbing processes for removing sulfur dioxide from gas streams after combustion of fuels.
Fouling Deposition of solid layers on surfaces in heat transfer equipment such as heat exchangers and process furnaces; accumulation of deposits in any process vessel that may eventually impede flow and performance.
Fraction A separate, identifiable part of crude oil that can be isolated by refining, distillation, precipitation or chromatographic separation.
Gas oil A mid-range distillate fraction of petroleum or synthetic crude oil, typically with boiling points of 177–524 °C. Gas oils in the upper end of this temperature range require distillation under a vacuum and are called vacuum gas oils (VGO).
Gasification A process to partially oxidize any hydrocarbon (usually heavy residues) to a mixture of hydrogen and carbon monoxide. Gasification can also be used to produce hydrogen and synthesis gas for making petrochemical products.
Heavy crude oil Oil with a gravity below 22 °API. Heavy crudes must be blended with condensate before they can be shipped by pipeline.

Bitumen Partial Upgrading 2018 Whitepaper - AM0401A
119
Heavy gas oil A gas oil with a boiling range mainly above 343 °C (see Gas oil).
Hydrocarbons Chemical compounds of hydrogen and carbon that form the basis of all petroleum products. Hydrocarbons may be solid, liquid or gaseous.
Hydroconversion An upgrading process that converts vacuum residue to distillates using high temperatures (above 410 °C), high-pressure hydrogen and a catalyst. The catalyst may be either pellets of ceramic impregnated with active metal sulfides or fine particles of metal sulfides. The high temperature cracks the molecules and the catalyst prevents coke formation. The main licensed hydroconversion technologies are LC-Fining and H-Oil.
Hydrocracking A refining process that converts heavy gas oil into lighter fractions using hydrogen and a bifunctional catalyst. The catalyst has both hydrogenation and acid cracking activity. The feed material is normally vacuum gas oil and/or deasphalted oil.
Hydrodemetallation (HDM)
Removal of Ni and V from petroleum streams through reactions with hydrogen over a metal sulfide catalyst.
Hydrodenitrogenation (HDN)
Removal of nitrogen from petroleum streams through reactions with hydrogen over a metal sulfide catalyst.
Hydrodesulfurization (HDS)
Removal of sulfur from petroleum streams through reactions with hydrogen over a metal sulfide catalyst.
Hydroprocessing A range of upgrading processes that catalytically hydrogenate petroleum fractions to improve their quality, including hydroconversion, hydrocracking and hydrotreating. This term is often used interchangeably with hydroconversion, most commonly for fixed-bed reactors.
Hydrotreating A process that removes sulfur, nitrogen, and olefins from the components of synthetic crude oil by the catalytic addition of hydrogen in the final stage in the upgrading process. Separate units are used to hydrotreat naphtha and gas oil. The main reactions are hydrodesulfurization (HDS) and hydrodenitrogenation (HDN).
Isoparaffins Branched paraffins.
Kerosene Middle distillate fraction of petroleum traditionally used for heating or lighting.
Light crude oil Liquid petroleum with a gravity of 28 °API or higher. A high-quality light crude oil might have a gravity of 40 °API. Upgraded crude oils from the oil sands have values of around 33 °API (compared to 32–34 °API for Light Arab and 42 °API for West Texas Intermediate).
Light ends Gaseous components in distillation and conversion processes, usually consisting of C1-C4 hydrocarbons.
Light gas oil Lowest boiling range of gas oil, usually boiling below 424 °C.

Bitumen Partial Upgrading 2018 Whitepaper - AM0401A
120
Liquid hourly space velocity (LHSV)
The volume of a reactor divided by the hourly liquid feed rate at standard conditions of temperature and pressure.
Maltenes The fraction of crude oil that is not asphaltenes, i.e. soluble in n-heptane.
Mesophase Coke material that has ordered molecules giving liquid-crystal behavior, also called carbonaceous mesophase.
Middle distillate Fraction of crude oil or process streams boiling between 177 and 343 °C.
Naphtha Light distillate from cracked products or synthetic crude. Naphtha is most commonly defined as the distillate fraction with a boiling point below 177 °C.
Naphthenes Cyclic paraffin; saturated hydrocarbons containing one or more rings, e.g. cyclohexane.
Naphthenic acid Acid components in the bitumen that have a carboxylic acid group attached to a hydrocarbon tail, most commonly a cyclic paraffin (which is also known as a naphthene). These acids are important surface active components (surfactants) in the extraction process but cause corrosion in upgrading operations.
NHTSA US National Highway Transportation Safety Administration
Olefin A hydrocarbon compound containing a single double bond or unsaturation; also called an alkene. Olefins are formed during thermal and catalytic cracking of bitumen fractions. Diolefins contain two double bonds per molecule and are prone to fouling equipment through the formation of polymers.
Paraffin A straight-chain hydrocarbon of the elemental formula CnH2n+2; the formal chemical term is n-alkane.
Petroleum A complex mixture of a wide range of hydrocarbons and non-hydrocarbon liquid components in various combinations. Commonly called crude oil.
PFT Paraffinic froth treatment - removal of water and fine solids from bitumen froth by precipitating a portion of the asphaltenes using a paraffinic solvent such as hexane.
Polynuclear aromatic hydrocarbon (PAH)
Aromatic compounds with more than one ring in a fused structure.
RFS Renewable fuel standard. A US EPA requirement for the type and quantity of renewable fuel used in vehicle fuel

Bitumen Partial Upgrading 2018 Whitepaper - AM0401A
121
Renewable diesel Diesel from renewable sources that is indistinguishable from hydrocarbon based diesel fuel. It is often produced by hydrotreating fats and oils from biological sources.
Residue, vacuum residue or residuum (resid)
The fraction of bitumen or petroleum with a boiling point over 524 °C.
SARA Fractionation of petroleum by precipitation and chromatography into saturates, aromatics, resins and asphaltenes.
Simulated distillation Calculation of a boiling curve from gas chromatographic separation of a sample.
Solubility parameter A measure of the solvent power of a liquid.
Sour Containing sulfur compounds, as in sour crude oil.
Synthetic crude oil A high-quality light sweet crude oil manufactured by upgrading oilsands bitumen, composed of a blend of processed distillate fractions. The crude bitumen is upgraded through the addition of hydrogen or the removal of coke.
Total acid number (TAN)
A measure of the concentration of acid components in a crude oil.
Upgrading Conversion of bitumen into a lighter, sweeter, high-quality crude oil through either the removal of highly aromatic and high-molar-mass components (coking) or the addition of hydrogen (hydroconversion).
Vacuum distillation Distillation under reduced pressure to recover high-boiling compounds (See Distillation).
Vacuum gas oil (VGO)
Petroleum fraction recovered by distillation under vacuum, with a boiling range from 343 – 524 °C.
Vacuum residue The fraction of crude oil remaining after vacuum distillation, with a majority of components boiling over 524 °C.
Visbreaking A process that reduces residue viscosity by thermal cracking without any appreciable degree of coke formation.
Viscosity The ability of a liquid to flow; the lower the viscosity, the more easily the liquid will flow. Dynamic viscosity is defined as the ratio between the stress exerted by the fluid when subjected to a rate of strain, which is the gradient in the velocity. Kinematic viscosity is the dynamic viscosity divided by the density of the fluid.
WTW Well-to-wheels – the boundaries for analysis of energy consumption and greenhouse gas emissions from producing a crude oil, transporting to upgrading or refining, refining of the crude oil, distribution of refined products to end users, and end use

Bitumen Partial Upgrading 2018 Whitepaper - AM0401A
122
West Texas Intermediate (WTI)
Reference crude oil for the United States.
Western Canada Select (WCS)
A bitumen blend produced by several companies in Western Canada.
Common Acronyms for Upgrading
AWB Access Western Blend, a diluted Athabasca bitumen
BPD Barrels per day
BPSD Barrels per standard day
BS&W Bottom solids and water
CCR Conradson carbon residue
DAO Deasphalted oil
HDN Hydrodenitrogenation (see Hydrotreating)
HDS Hydrodesulfurization (see Hydrotreating)
HGO Heavy gas oil
KBPD Kilo barrels per day
Wh Micro-carbon residue; the solid residue or coke that remains after heating a sample of oil to 500 °C using a standard test protocol.
PAH Polynuclear aromatic hydrocarbon
SAGD Steam-assisted gravity drainage (see in situ recovery and Steam-assisted gravity drainage)
SCFE Supercritical fluid extraction
SCO Synthetic crude oil
TAN Total acid number
TBP True boiling point
VGO Vacuum gas oil (see Gas oil)
VTB Vacuum-topped bitumen, a mixture of VGO and vacuum residue
WCS Western Canada select
WTI West Texas intermediate

Bitumen Partial Upgrading 2018 Whitepaper - AM0401A
123
Appendix B References
Agrawal, P., et al. 2012. Measurement and modeling of the phase behavior of solvent diluted bitumens :
Fluid Phase Equilib., 2012, Vols. 334: 51-64.
Alberta Energy Regulator. 2017. 2017: ST98:2017 Alberta’s Energy Reserves & Supply/Demand
Outlook. [Online] 2017. http://www1.aer.ca/st98/data/executive_summary/ST98-
2017_Executive_Summary.pdf.
Alshareef, A.H., et al. 2011. Formation of archipelago structures during thermal cracking implicates a
chemical mechanism for the formation of petroleum asphaltenes : Energy Fuels, 2011, Vols. 25: 2130-
2136.
Amani, M.J., Gray, M.R. and Shaw, J. M. 2014. On correlating water solubility in ill-defined
hydrocarbons : Fuel, 2014, Vols. 134: 644-658.
Arahata, Y., et al. Upgrading of Oil Sands Bitumen (Part 2) Effect of Hydrovisbreaking as Pretreatment to
Catalytic Demetallization and Hydrocracking : Sekiyu Gakkaishi, Vols. 31, No. 4, 1988.
ASTM. 2017. ASTM D4530, Standard Test Method for Determination of Carbon Residue (Micro Method).
[Online] 2017. https://www.astm.org/Standards/D4530.htm.
Auterra. 2017. Flex UP Process. [Online] 2017. https://auterrainc.com/pdf/flexup-overview.pdf.
Avid, B., et al. 2006. Effect of n-pentane and n-heptane insolubles on the pyrolysis of vacuum residue :
Energy Fuels, 2006, Vols. 20(6): 2475-2477.
Baldassari, M. and Mukherjee, U. 2012. LC‐MAX and Other LC‐FINING Process Enhancements to
Extend Conversion and Onstream Factor, : AFPM, 2012, Vols. AM-12-73. Chveron Lummus Global.
Barre, L., Simon, S. and Palermo, T. 2008. Solution properties of asphaltenes : Langmuir, 2008, Vols.
24(8): 3709-3717.
Barton, A.F.M. 1991. CRC handbook of solubility parameters and other cohesion parameters, second
editio. Boca Raton, FL : CRC Press., 1991.
Bayshore Petroleum. 2015. Partial Upgrading--Bitumen to Synthetic Crude OIl. Bayshore Petroleum.
[Online] 2015. http://www.bayshorepetroleum.com/.
Bazyleva, A.B, et al. 2010. 1389-1397., Bitumen and heavy oil rheological properties: Reconciliation with
viscosity measurements : J. Chem. Eng. Data, 2010, Vol. 55.
Beccari, M. and Romano, U. 2006. Encyclopaedia of hydrocarbons. / [Vol. II, Refining and
petrochemicals]. s.l. : ENI : Istituto della Enciclopedia italiana, cop, 2006.
Beeston, S. 2014. Dubai : ME Tech, 2014. SOLVENT DEASPHALTING OPTIONS How SDA can
increase residue upgrading margins, AMEC/Foster Wheeler.
Bowman, R.D. and Davidson, N. 1972. Hydrodynamic shear breakage of DNA : Biopolymers, 1972,
Vols. 11(12): 2601-2624.
BP. 2017. BP Statistical Review of World Energy 2017. bp.com. [Online] 2017.
https://www.bp.com/en/global/corporate/energy-economics/statistical-review-of-world-energy.html.

Bitumen Partial Upgrading 2018 Whitepaper - AM0401A
124
Brons, G. and Yu , J. M. 1995. Solvent deasphalting effects on whole cold lake bitumen : Energy Fuels,
1995, Vols. 9: 641-647.
Brons, G., et al. 2001. Process for desulfurization of petroleum feeds utilizing sodium metal. 6,210,564.
US, 2001.
Brown, W. 2009. Edmonton, AB : 5th NCUT Upgrading and Refining Conference - Iyq upgrading at a 1
bbl/d scale, 2009.
CAPP. 2017. 2017 Crude Oil Forecast, Markets, and Transportation. [Online] 2017.
https://www.capp.ca/publications-and-statistics/crude-oil-forecast.
CAPP-2. 2017. Canadian and U.S. Crude Oil Pipelines and Refineries - 2017. [Online] 2017.
https://www.capp.ca/publications-and-statistics/crude-oil-forecast.
Carlson, C.S., et al. 1958. Thermal hydrogenation. Transfer of hydrogen from tetralin to cracked residua :
Ind. Eng. Chem., 1958, Vols. 53: 1067-1070.
Castaneda, L.C., Munoz, J.A.D. and Ancheyta, J. 2014. Current situation of emerging technologies for
upgrading of heavy oils : Catalysis Today, 2014, Vols. 220– 222 (2014) 248– 273.
Cataldo, F. 2000. Ultrasound-induced cracking and pyrolysis of some aromatic and naphthenic
hydrocarbons : Ultrasonics Sonochemistry, 2000, Vols. 7(1): 35-43.
CERI. 2015. CERI Commodity Report — Crude Oil: New Upgrading Technology Holds Promise. [Online]
2015. https://www.ceri.ca/market-updates/new-upgrading-technology-holds-promise.
Chacon-Patino, M., S. M. Rowland and R. P. Rodgers. 2017. Advances in asphaltene petroleomics.
Part 1: Asphaltenes are composed of abundant island and archipelago structural motifs : Energy Fuels:
DOI: 10.1021/acs.energyfuels.1027b02873., 2017.
Cheng, Z.M., et al. 2009. Effects of supercritical water in vacuum residue upgrading : Energy Fuels,
2009, Vols. 23: 3178-3183.
Chornet, M. and Chornet, E. 2008. Process for treating heavy oils. 2,814,773. Canada, 2008.
—. 2008. Process for treating heavy oils. 2814773 A1 assigned to Fractal Systems, 2008.
Chung, K. H., et al. 1998. The chemistry, reactivity and processability of athabasca bitumen pitch : Rev.
Process Chem. Eng., 1998, Vols. 1: 41-79.
Chung, K.H., et al. 2006 Q4. Asphaltene removal from heavy oil. Petroleum Technology Quarterly. 2006
Q4.
Crude Monitor. 2017. crudemonitor.ca. [Online] 2017. http://www.crudemonitor.ca/.
Dawson, W.H., et al. 1992. Process for reducing the viscosity of heavy hydrocarbon oils. 5,096,566 A.
US, 1992.
Dutta, R.P., et al. 2000. Thermal cracking of athabasca bitumen: Influence of steam on reaction
chemistry : Energy Fuels, 2000, Vols. 14(3): 671-676.

Bitumen Partial Upgrading 2018 Whitepaper - AM0401A
125
Duyvesteyn, W.P.C., Salazar, J.A. and Ard, C.D. 2011. Systems and methods for processing nozzle
reactor pitch. 2011046660 A1 WPO, 2011.
EIA. 2017. eia.gov. [Online] 2017.
https://www.eia.gov/beta/international/data/browser/#/?pa=0000000000000000000008&c=ruvvvvvfvtvnvv
1urvvvvfvvvvvvfvvvou20evvvvvvvvvnvvuvo&ct=0&tl_id=5-A&vs=INTL.57-6-AFG-.
EIA-10. 2013. Crude oils have different quality characteristics. [Online] 2013.
https://www.eia.gov/todayinenergy/detail.php?id=7110.
EIA-11. Weekly Inputs & Utilization. eia.gov. [Online]
https://www.eia.gov/dnav/pet/pet_pnp_wiup_dcu_nus_4.htm.
EIA-12. 2017. Tight oil expected to make up most of U.S. oil production increase through 2040. eia.gov.
[Online] 2017. https://www.eia.gov/todayinenergy/detail.php?id=29932.
EIA-2. 2017. [Online] 2017. https://www.eia.gov/petroleum/marketing/monthly/pdf/paddmap.pdf.
EIA-3 Plotted by Jacobs. 2017. Number and Capacity of Petroleum Refineries. [Online] 2017.
http://www.eia.gov/dnav/pet/pet_pnp_cap1_dcu_nus_a.htm.
EIA-4. 2017. U.S. Energy Information Administration 2017:PADD level imports of crude oil by country.
[Online] 2017. http://www.eia.gov/dnav/pet/pet_pnp_crq_a_epc0_ycs_pct_m.htm.
EIA-5. 2017. U.S. Energy Information Administration 2017:Crude movement by rail. [Online] 2017.
https://www.eia.gov/dnav/pet/pet_move_railna_a_epc0_rail_mbbl_m.htm.
EIA-6. 2017. U.S. Energy Information Administration 2017:Annual Energy Outlook 2017. [Online] 2017.
https://www.eia.gov/outlooks/aeo/.
EIA-7. 2017. U.S. Energy Information Administration 2017:Sulfur and API gravity of crude processed in
US. [Online] 2017. http://www.eia.gov/dnav/pet/pet_pnp_crq_a_epc0_ycs_pct_m.htm.
EIA-8. 2017. U.S. Energy Information Administration 2017:Annual imports by API gravity. [Online] 2017.
http://www.eia.gov/dnav/pet/pet_move_ipct_k_m.htm.
EIA-9. 2017. U.S. Energy Information Administration 2017:Company Level Imports. [Online] 2017.
https://www.eia.gov/petroleum/imports/companylevel/archive/.
EPA. 2016. Final Rule for Greenhouse Gas Emissions and Fuel Efficiency Standards for Medium- and
Heavy-Duty Engines and Vehicles - Phase 2. [Online] 2016. https://www.epa.gov/regulations-emissions-
vehicles-and-engines/final-rule-greenhouse-gas-emissions-and-fuel-efficiency.
EPA RFS. 2018. Renewable Fuel Standard Program. epa.gov. [Online] 2018.
https://www.epa.gov/renewable-fuel-standard-program.
ETX Systems. 2017. IYQ Upgrading. [Online] 2017.
http://www.etxsystems.com/Publications/Presentations/ETX%20presentation%20for%20TDP%20July%2
02017.pdf.
Expander Energy. 2017. FTCrude. http://www.expanderenergy.com. [Online] Expander Energy, 2017.
http://www.expanderenergy.com/ftcrudereg.html.

Bitumen Partial Upgrading 2018 Whitepaper - AM0401A
126
ExxonMobil. 2017. FLUID COKING™ Conversion Technology. [Online] 2017.
http://www.digitalrefining.com/data/literature/file/523514257.pdf.
Fathi, M.M. and Pereira-Almao, P. 2011. Catalytic aquaprocessing of arab light vacuum residue via
short space times : Energy Fuels, 2011, Vols. 25(11): 4867-4877.
Fellows, G.K., et al. 2017. 1, Public Interest Benefit Evaluation of Partial Upgrading Technology :
University of Calgary School of Public Policy, 2017, SPP Research Papers, Volume 10 • Issue 1, Vols.
SPP Research Papers, Volume 10 • Issue 1.
FERC. 2018. Federal Regulatory Commission. Source: Waterborne Energy, Inc. Data in $US/MMBtu.
Landed prices are based on a netback calculation. [Online] 2018. https://www.ferc.gov/market-
oversight/mkt-gas/overview/archives.asp.
Field Upgrading. 2017. De-Sulphurization & Upgrading (DSU™),. [Online] 2017.
http://www.fieldupgrading.com/technology/overview.
Field_Upgrading. 2015. Edmonton, AB : World Heavy Oil Conference, 2015. Desufurizing and upgrading
the bottom of the barrel.
Fluid Oil Corp. 2017. VHTL Technology. [Online] 2017. http://fluidoilcorp.com/vhtl-technology/vhtl-
technology/.
Fractal Systems. 2016-2017. Understanding the Value Proposition of the JetShearTM. Technology
Platform. 2016-2017. http://fractalsys.com/.
Fumoto, E., et al. 2009. Recovery of lighter fuels by cracking heavy oil with zirconia-alumina-iron oxide
catalysts in a steam atmosphere : Energy Fuels, 2009, Vols. 23: 1338-1341.
Fumoto, E., et al. 2015. Catalytic cracking of heavy oil with iron oxide-based catalysts using hydrogen
and oxygen species from steam : J. Jpn. Pet. Inst, 2015, Vols. 58(5): 329-335.
Gary, J.H., Handwerk, G.E. and Kaiser, M.J. 2007. Petroleum Refining, 5th Edition. NY : CRC Press,
2007. 311-312.
Gordon, J. 2018. UPDATE 1-Canadian city argues Trans Mountain pipeline route harmful,. Reuters.
January 23, 2018.
Gould, K.A. and Wiehe, I.A. 2007. Natural Hydrogen Donors in Petroleum Resids : Energy Fuels, 2007,
Vols. 21 (3), pp 1199–1204.
Gray, M.R. 2002. 1, New technique defines the limits of upgrading heavy oil, bitumens : Oil Gas J., 2002,
Vol. 100.
Gray, M.R. and McCaffrey, W.C. 2002. Role of chain reactions and olefin formation in cracking,
hydroconversion and coking of petroleum and bitumen fractions : Energy Fuels, 2002, Vols. 16: 756-766.
Gray, M.R. 2015. Upgrading oilsands bitumen and heavy oil. Upgrading oilsands bitumen and heavy oil.
Edmonton : University of Alberta Press., 2015.
Habib, F., et al. 2013. Suppression of addition reactions during thermal cracking using hydrogen and
sulfide catalyst : Energy Fuels, 2013, Vols. 27: 6637-6645.

Bitumen Partial Upgrading 2018 Whitepaper - AM0401A
127
Hashemi, R. 2013. In-Situ Upgrading and Recovery Enhancement of Athabasca Bitumen by Ultra-
Dispersed. Calgary, AB : University of Calgary, 2013. Vol. pHD thesis.
https://prism.ucalgary.ca/bitstream/handle/11023/1189/UCalgary_2013_Hashemi_Rohallah.pdf?sequenc
e=4.
Haverly Chevron Crude Assay Library - with Jacobs Analysis. 2016. Chevron Crude Oil Assay
Library. 2016.
Henderson, J. H. and Weber, L. 1965. Physical upgrading of heavy crude oils by the application of
heat : Journal of Canadian Petroleum Technology, 1965, Vols. 4: 206-212.
Husky. 2017. Private communication 2017. 2017.
Jacobs Consultancy. 2017. Meeting New Fuel Requirements – Providing a Compass in Uncertain
Times : American Fuel and Petrochemical Manufacturers 2017 Annual Conference, 2017. AM-17-20.
Jacobs Consultancy. 2016. Oil-Climate Index Review Final Report Prepared for Alberta Department of
Energy. 2016.
JacobsConsultancy. 2012. EU Pathway Study: Life Cycle Assessment of Crude Oils in a European
Context for Alberta Dept. of Energy. 2012.
Jang, B. 2017. Suncor cancels Voyageur project, takes hit to profit. Globe and Mail. March 26, 2017.
Kayukawa,, T., et al. 2017. Development of Supercritical Water Cracking Process to Upgrade
Unconventional Extra Heavy Oil at Wellhead : Journal of the Japan Petroleum Institute, 2017, Vols. 60
(5), 241-247, 2017.
Kinder Morgan. 2017. [Online] 2017.
https://www.kindermorgan.com/business/canada/transmountain.aspx.
Kostrov , S.A., et al. 2011. Method and apparatus for treatment of crude oil or bitumen under auto-
oscillation conditions for viscosity decrease. 20110005973A1 US Patent Application, 2011.
Kuijpers, M. W. A., et al. 2004. The mechanism of cavitation-induced polymer scission; experimental and
computational verification : Polymer, 2004, Vols. 45(19): 6461-6467.
Langer, A.W., et al. 1962. Hydrogen donor diluent visbreaking of residua : Industrial & Engineering
Chemistry Process Design and Development, 1962, Vols. 1(4): 309-312.
Langer, A.W., et al. 1961. Thermal hydrogenation of crude residua : Ind. Eng. Chem., 1961, Vols. 53: 27-
30.
Lu, B., Fu, C.Y. and Fu, C.T. 1989. Phase equilibria and pvt properties. [book auth.] L. G. Hepler and C.
Hsi. Aostra technical handbook on oil sands, bitumens, and heavy oils. Edmonton, AB : AOSTRA: 131-
151., 1989.
McKenna, A.M.,L. J. Donald, J. E. Fitzsimmons, P. Juyal, V. Spicer, K. G. Standing, A. G. Marshall
and R. P. Rodgers, et al. 2013. 3, Heavy petroleum composition. 3. Asphaltene aggregation. : Energy
Fuels, 2013, Vol. 27. 1246-1256..
MEG-1. 2017. Private Communication. 2017.

Bitumen Partial Upgrading 2018 Whitepaper - AM0401A
128
Mitchell, D.L. and Speight, J. G. 1973. The solubility of asphaltenes in hydrocarbon solvents : Fuel,
1973, Vols. 52: 149-152.
MOGAS-2. 2017. Delayed Coking Product Brochure. [Online] 2017. https://www.mogas.com/en-
us/industries/refining.
Moschopedis, S.E. and Speight, J.G. 1977. Effect of air blowing on properties and constitution of a
natural bitumen : J. Mater. Sci., 1977, Vols. 12(5): 990-998.
Muse Stancil. 2015. Stage 1 Parametric Analysis of Partially Upgraded Bitumen for Alberta Innovates
Energy and Environment Solutions. Dallas : Muse Stancil Inc. , 2015.
Naghizada, N., Prado, G. H. C. and de Klerk , A. Uncatalyzed hydrogen hransfer during 100–250 °c
conversion of asphaltenes : Energy Fuels, Vols. 31: 6800–6811.
National Energy Board. 2017. 2016 Oil Exports Statistics Summary. [Online] 2017. https://www.neb-
one.gc.ca/nrg/sttstc/crdlndptrlmprdct/stt/crdlsmmr/2016/smmry2016-eng.html.
Nelson, W.L. 1958. Petroleum refinery engineering (4th edition). New York, NY : McGraw-Hill., 1958.
Nexen. 2017. Public Statements and Private Communication 2017. 2017.
NHTSA. 2017. Corporate Average Fuel Economy. https://www.nhtsa.gov. [Online] 2017.
https://www.nhtsa.gov/laws-regulations/corporate-average-fuel-economy.
Oil and Gas Journal. 2001. Aquaconversion technology offers added value to E. Venezuela synthetic
crude oil production, : Oil and Gas Journal, 05/14/2001, 2001.
Oil Sands Magazine. 2017. FROTH TREATMENT EXPLAINED. [Online] Oil Sands Magazine, 2017.
http://www.oilsandsmagazine.com/technical/mining/froth-treatment.
Oil-Sands-Magazine. 2017. PARAFFINIC FROTH TREATMENT. [Online] 2017.
http://www.oilsandsmagazine.com/technical/mining/froth-treatment/paraffinic.
Pennwell. 2014. Worldwide Refinery Survey. Tulsa, OK : PennWell Corporation, Tulsa, OK. All Rights
Reserved., 2014.
Petrosonic Sonoro. [Online] http://www.sonoroenergy.com/technology/.
Rahimi, P., Fairbridge, C. and Tanner , D.D. 1998. The use of methane as a source of higher
hydrocarbons and hydrogen for upgrading heavy oils and bitumen : Prepr. Pap. – Am. Chem. Soc., Div.
Fuel Chem., 1998, Vols. 43(3): 476-480.
Rahimi, P., Parker, R.J. and Wiehe, I.A. 2001. Stability of visbroken products obtained from athabsca
bitumen for pipeline transportation : Prepr. – Am. Chem. Soc. Div. Petrol. Chem., 2001, Vols. 46(2): 95-
98.
Rahmani, S., McCaffrey, W.C. and Gray, M.R. 2002. Kinetics of solvent interactions with asphaltenes
during coke formation : Energy Fuels, 2002, Vols. 16: 148-154.
Raseev, S. 2003. Thermal and catalytic processes in petroleum refining. New York : Marcel Dekker.,
2003.

Bitumen Partial Upgrading 2018 Whitepaper - AM0401A
129
Roche, P. Feb 5, 2018. Former Syncrude Researcher Sees Oilsands Opportunity for Upgrading
Commercialized In China. Oil Daily Bulletin, Feb 5, 2018.
Ruchardt, C.M., Gerst, C.M. and Nolke, M. 1992. Bimolecular formation of radicals by hydrogen
transfer. 1. The uncatalyzed transfer hydrogenation of alpha-methylstyrene by dihydroanthracene or
xanthene - a radical reaction : Angew. Chem., Int. Ed. Engl, 1992, Vols. 31: 1523-1525.
Sea-Distances.org. 2017. Blue water 2017. https://sea-distances.org/. [Online] 2017. https://sea-
distances.org/; .
Seyer, F.A. and Gyte, C.W. 1989. Viscosity pages: 155-184. [book auth.] L. C. Hepler and C. Hsi. Aostra
technical handbook on oil sands, bitumens, and heavy oils. Edmonton, AB : AOSTRA, 1989.
Snamprogetti - Montanari, R. 2005. Snamprogetti’s Highlights EST Technology. [Online] Rice Global
E&C Forum, 2005. http://www.forum.rice.edu/wp-
content/uploads/roundtables/RT%20031105%20Montanari.pdf.
Soebianto, Y.S., et al. 1992. Protection in radiolysis of n-hexadecane .2. Radiolysis of n-hexadecane in
the presence of additives. : Radiat. Phys. Chem., 1992, Vols. 40(6): 451-459.
Soskind, D. M., et al. 1962. Fluid coking of heavy resids : Khimiya i Tekhnologiya Topliv i Masel, 1962,
Vols. 10(October): 5-9.
Sternberg, H.W., et al. 1974. Reaction of sodium with dibenzothiophene - method for desulfurization of
residua : Ind. Eng. Chem. Prod. Res. Dev., 1974, Vols. 13: 433-436.
Suslick, K.S., et al. 1983. Alkane sonochemistry : J. Phys. Chem., 1983, Vols. 87(13): 2299-2301.
Thompson, L.H. and Doraiswamy, L. K. 1999. Sonochemistry: Science and engineering : Ind. Eng.
Chem. Res., 1999, Vols. 38(4): 1215-1249.
ThyssenKrupp UMATAC Taciuk. 2016. http://www.umatac.ca/. [Online] 2016.
http://www.umatac.ca/includes/media/downloads/WHOC16-263_UMATAC_ATP-Process.pdf.
Topsoe, H., Clausen, B. S. and Massoth, F. E. 1996. Hydrotreating catalysis. Berlin : Springer, 1996.
TransCanada. 2017. [Online] 2017. https://www.transcanada.com/en/operations/oil-and-liquids/keystone-
pipeline-system/.
Value Creation. 2016. Presentation to Strathcona County, 2016. [Online] 2016. https://pub-
strathcona.escribemeetings.com/filestream.ashx?DocumentId=5349.
Verkade, J.G. and Yu, Z. 1999. Desulfurization of organosulfur compounds with lithium and sodium :
Energy Fuels, 1999, Vols. 13: 23-28.
Vilcaez, J., et al. 2012. Hydrothermal extractive upgrading of bitumen without coke formation : Fuel,
2012, Vols. 102: 379-385.
Watanabe, M., et al. 2010. Heavy oil upgrading in the presence of high density water: Basic study : J.
Supercrit. Fluids, 2010, Vols. 53: 48-52.
Well Resources. 2018. SELEX-Asp Selective Extraction of Asphaltenes. [Online] 2018.
https://www.wellresources.ca/selex-asp.

Bitumen Partial Upgrading 2018 Whitepaper - AM0401A
130
Wiehe. 1993. A phase separation kinetic model for coke formation : Ind. Eng. Chem. Res., 1993, Vol. 32.
2447-2457..
Wiehe, I. A. and R. J. Kennedy. 2000. The oil compatibility model and crude oil incompatibility. : Energy
Fuels, 2000, Vol. 14. 56-59.
Wiehe, I. A. 2008. Process chemistry of petroleum macromolecules Vol 121. Boca Raton, FL : CRC
Press, 2008.
Xu, S., et al. 1998. The chemistry, reactivity and processability of athabasca bitumen pitch : Rev. Process
Chem. Eng., 1998, Vols. 1: 41-79.
Yarranton, H.W. and Satyro, M.A. 2009. Expanded fluid-based viscosity correlation for hydrocarbons :
Ind. Eng. Chem. Res., 2009, Vols. 48(7): 3640-3648.
Yarranton, H.W., et al. 2015. Density and refractive index of petroleum, cuts, and mixtures : Energy
Fuels, 2015, Vols. 29(9): 5723-5736.
Yarranton, H.W., et al. 2013. On the size distribution of self-associated asphaltene : Energy Fuels, 2013,
Vols. 27(9): 5083-5106.
Yuan, B. 2016. Asphaltenes extraction treatment yields advantaged hydroprocessing feedstock : Oil and
Gas Journal, 2016.
Yui, S.M. 1999. Removing diolefins from coker naphtha necessary before hydrotreating : Oil Gas J.,
1999, Vols. 97(36): 64-68.
Zachariah, A. and de Klerk, A. 2016. Thermal conversion regimes for oilsands bitumen : Energy Fuels,
2016, Vols. 30(1): 239-248.
Zhang, M. 2012. Role of Bitumen Viscosity in Bitumen Recovery from Athabasca Oil Sands. MsC Thesis.
Edmonton : University of Alberta, 2012.

Bitumen Partial Upgrading 2018 Whitepaper - AM0401A
131
Appendix C: Petroleum Refining
Petroleum refining converts crude oil primarily into transportation fuels. A schematic of a typical
refinery in Figure C.1 shows most major processing units used by refineries. The first step is
desalting to remove salt and water from the crude oil followed by fractionation of the crude oil into
major components: naphtha, distillate, gasoil, and resid. Subsequent steps convert these streams
into lighter components or treat them to improve their quality, for example, by removing sulfur and
nitrogen, improving octane or cetane, or making other changes to maximize production of the
most valuable products.
Figure-C.1: Petroleum Refinery Schematic
Catalytic Reforming
Gas
olin
eJe
t Fu
elD
iese
l Fu
elFu
el O
il
FUEL OIL
OxygenatesMTBE/ETBEEthanol

Bitumen Partial Upgrading 2018 Whitepaper - AM0401A
132
Source: MOGAS: with additions/modifications by Jacobs
Individual refineries use a subset of the processing units shown in Figure C.1. Choosing which
processing units to incorporate into the refinery depends on the crude oil characteristics and the
market for refined products. Figure C.1 shows all the possible processing units available to a
refiner. Refineries that process heavy crude oils, including Alberta bitumen, require large amounts
of bottoms conversion capacity: vacuum distillation, visbreaking, solvent deasphalting, coking,
FCC, and hydrocracking, which are all designed to convert heavy components in the crude oil to
light material suitable to make gasoline, jet, and diesel fuels.
The major products from petroleum refining are transportation fuels – gasoline, jet fuel, and diesel
fuel. Fuel oil for stationary use and for ships (bunker fuel) is produced from heavy material that
the refinery cannot process or upgrade. Petroleum refineries also produce products for the
petrochemical industry. These can be propylene, other olefins and diolefins, naphthas, and
aromatics. In addition, petroleum refineries produce asphalt for roads and a host of other specialty
products.
Transportation fuels from petroleum are increasingly augmented with fuels from other sources.
Gasoline is often blended with ethanol, butanol, or other compatible biofuel. Diesel is often
blended with biodiesel, a fatty acid methyl ester with methanol (FAME) produced from bio-derived
fats and oils or with renewable diesel, a paraffin made from hydrotreating bio-derived fats and
oils. Jet fuel can be augmented with renewable jet fuel, which is similar to renewable diesel. Future
transportation fuels are likely to include electricity supplied to battery electric vehicles, natural gas,
or even hydrogen.
• Atmospheric Distillation Unit also called Crude Distillation Unit or CDU—The crude
distillation unit fractionates the crude oil feed into straight run naphtha, kerosene, distillate
and heavy atmospheric resid. The CDU is a single column with a one or two-stage preflash
and a desalter. Fuel gas, C3s and C4s are sent to the gas plant. Naphtha is sent to the
naphtha hydrotreating unit (NHT). Kerosene and atmospheric gasoil go to the DHT
(distillate hydrotreating unit). The CDU atmospheric residue bottoms (AR) is sent to the
vacuum distillation unit (VDU) for further gasoil recovery.
• Vacuum Distillation Unit or VDU—The vacuum distillation unit (VDU) produces vacuum
resid, which is sent to a delayed coking unit, and light and heavy vacuum gasoils (VGOs)
which are sent to the gasoil hydrotreating Unit (GOHT). The CDU and VDU are heat
integrated.
• Delayed Coking Unit—The coking unit converts vacuum residue from the VDU into
lighter components, fuel gas, C3 and C4 paraffins and olefins, naphtha, distillate, gasoils
and solid petroleum coke product. The delayed coker consists of several coke drums that

Bitumen Partial Upgrading 2018 Whitepaper - AM0401A
133
feed a common fractionator. Fuel gas, C3s and C4s go to the Gas Plant. Naphtha from the
coker is routed to the naphtha hydrotreating unit (NHT). The light coker gasoil (LCGO)
from the coker is low in cetane number and high in sulfur and requires processing in the
distillate hydrotreating unit (DHT). The heavy coker gasoil (HCGO) is further processed in
the gasoil hydrotreating unit (GOHT) to achieve the sulfur target. Coke from the delayed
coker is routed to sales. The solid coke from this unit can be used as a fuel substitute in
power production or cement manufacture or in some cases it is used to make anodes for
aluminum production.
• Visbreaking Unit—The Visbreaking unit is an alternative processing route to reduce the
amount of vacuum residue that must go to fuel oil if there is no delayed coking unit or other
bottoms upgrading unit.
• Gasoil Hydrotreating Unit or GOHT—The gasoil hydrotreating unit (GOHT) desulfurizes
heavy gasoil from the CDU, VDU, and coking units. The level of desulfurization can be set
so that the feed to the fluidized catalytic cracking (FCC) unit contains less than 1,000
weight parts per million (ppm) sulfur, which is often sufficient to avoid needing an FCC
naphtha hydrotreating unit. The GOHT is a significant user of hydrogen.
• Hydrocracking—The hydrocracking unit is a high pressure unit that cracks gasoil and
vacuum gasoil to lighter products in the gasoline and diesel range. Distillate range
products are often of high enough quality that they can be blended to products with little
or no additional processing. Gasoline range material generally needs further processing
– heavy naphtha in a catalytic reforming unit and light naphtha in an isomerization unit.
Unconverted product from the hydrocracking unit is an excellent low sulfur feed to the
fluidized catalytic cracking unit (FCC) or can be blended to fuel oil.
• Fluidized Catalytic Cracking Unit or FCC—The FCC unit converts heavy gasoils,
vacuum gasoils, and heavy hydrotreated gasoils to lighter products. Light cycle oil (LCO)
from the FCC unit is sent to the distillate hydrotreating (DHT) unit. FCC naphtha is sent to
gasoline blending if it is low enough in sulfur or it can be treated in an FCC naphtha
desulfurization unit. Unconverted oil from the FCC unit (called slurry oil) can be blended
to fuel oil or recycled to the coking unit to avoid producing fuel oil. The FCC unit consists
of a reactor / regenerator, a main fractionator, and a wet gas compressor. Flue gas treating
with a third stage separator is generally necessary to meet emission specifications.
• FCC Naphtha Desulfurization Unit—The FCC naphtha desulfurization unit removes
sulfur from FCC naphtha to meet low sulfur specifications in most modern gasolines. As
a result of olefin saturation during desulfurization, there can be significant octane loss.
• Alkylation Unit—The alkylation unit reacts C3 and C4 olefins with isobutane to produce
alkylate for gasoline blending. Purchased isobutane often supplements that produced in
the refinery.

Bitumen Partial Upgrading 2018 Whitepaper - AM0401A
134
• Oligomerization Unit—The oligomerization unit combines mainly C3 olefins but in some
cases also C4 olefins into larger, gasoline range molecules. Product octane is lower than
alkylate, the product is olefinic, and there is lower yield than from alkylation because this
process reacts two olefins together rather than one olefin with one isobutane molecule.
Alkylation and oligomerization units convert LPG range material to gasoline.
• Naphtha Hydrotreating Unit or NHT—Naphtha from the CDU, coker, DHT,
hydrocracking and GOHT units are hydrotreated in the NHT. The resulting product can be
fractionated to send the C6/C7+ components to the catalytic reforming unit and the C5/C6
components to the isomerization unit. The cut-point between light and heavy naphtha can
be set to minimize benzene and its precursors in the feed to the catalytic reforming unit.
Depending on the feed and degree of desulfurization, the NHT is a low to moderate user
of hydrogen.
• Catalytic Reforming Unit or Reformer—The catalytic reforming unit processes heavy
naphtha from the naphtha splitter that follows the naphtha hydrotreating unit. The catalytic
reforming unit or reformer is the major producer of high octane for gasoline blending. The
severity (Research Octane or RON) of the unit is adjusted to meet overall gasoline octane
specifications for finished gasoline resulting from blending all gasoline range components.
Most of the octane in reformate from the catalytic reforming unit comes from aromatics
produced in this process, which results in volume loss due to hydrogen removal in making
aromatics. There is also volume loss in catalytic reforming as some naphtha is cracked to
gas. The extent of volume loss and gas production depends on the severity that the
catalytic reforming unit is operated at: higher severity (RON) results in more octane,
hydrogen, and aromatics, but less volume. The catalytic reforming unit is an important
source of hydrogen in the refinery.
To meet the benzene limits imposed by gasoline regulations in most countries, the
naphtha feed to the catalytic reforming unit can be fractionated in a naphtha splitter to
concentrate benzene precursors in light naphtha that can be blended directly to gasoline
or processed in a light naphtha isomerization unit. Alternatively, to meet benzene
specifications, the reformate product from the catalytic reforming unit can be fractionated
to produce light and heavy reformate. Light reformate containing most of the benzene is
processed together with the light naphtha from the naphtha splitter in the C5/C6
isomerization unit.
When oxygenates are added in gasoline blending, there is less need for octane from the
catalytic reforming unit and more hydrotreated naphtha feed to the catalytic reforming unit
can be bypassed around this unit and blended directly to gasoline and/or the severity
(RON) of the catalytic reforming unit can be reduced. The result is more gasoline
production as a result of adding oxygenates and less processing in the catalytic reforming
unit.

Bitumen Partial Upgrading 2018 Whitepaper - AM0401A
135
• Isomerization Unit or C5/C6 Isom—The isomerization unit is a once-through unit that
processes light naphtha and light reformate to increase their research octane from the
mid-70s to the low-80s and eliminate benzene. If the feed to the isomerization unit
exceeds 5 vol% benzene, a separate benzene saturation reactor is used ahead of the
isomerization reactor. The isomerization unit uses a small amount of hydrogen to
isomerize the C5/C6 paraffins. Isomerization increases the RVP in the product relative to
the feed. Three moles of hydrogen per mole of benzene are used to convert benzene to
cyclohexane. A depentanizer can be used ahead of the Isom unit to minimize the RVP
impact of isomerization.
• Benzene Saturation Unit—An alternative to eliminating benzene in an isomerization unit
is to simply saturate it in a benzene saturation unit. Because there is no isomerization of
C5/C6 paraffins that helps offset the octane loss from benzene saturation, it is necessary
to operate the catalytic reforming unit at slightly higher severity than when an isomerization
unit is used to eliminate benzene. The net effect is less overall gasoline yield but more
hydrogen from the catalytic reforming unit as a result of operating at higher severity.
• Distillate Hydrotreating Unit or DHT—The Distillate Hydrotreating Unit (DHT) reduces
sulfur in the distillate range material (kerosene and distillate) from the CDU, coker, GOHT
units and sometimes from the hydrocracking unit. In addition, the DHT processes light
cycle oil (LCO) from the FCC unit to meet ultra-low sulfur diesel (ULSD) specifications.
The DHT unit is a significant user of hydrogen.
• Hydrogen Unit—Hydrogen is produced in the catalytic reforming unit and in the hydrogen
plant, by converting natural gas and/or refinery fuel gas to hydrogen via steam methane
reforming. Process heat to the hydrogen plant is supplied by fuel gas supplemented by
natural gas as needed. The hydrogen plant includes a pressure swing adsorption unit
(PSA) to achieve 99%+ purity hydrogen. Production of hydrogen is particularly
greenhouse gas intensive as the byproduct is CO2.
• Merox Treating Unit—Merox treating units are relatively low cost units that convert or
remove mercaptans from LPG, FCC naphtha, and jet fuel. As refined product sulfur levels
are reduced to meet clean fuel specifications, Merox treating is not sufficient and it
becomes necessary to hydrotreat FCC naphtha and jet fuel.
• Gas Plants—Gas plants are designed to achieve high recoveries of C3s and C4s. Process
units include a Primary Absorber, Stripper, Debutanizer, and Amine Treating.
• Sulfur Plant—Sulfur is recovered in the sulfur plant from H2S that is produced during the
refining steps. The sulfur plant consists of a Claus unit, Tail Gas Treating Plant, Amine
Regeneration, and Sour Water stripper.

Bitumen Partial Upgrading 2018 Whitepaper - AM0401A
136
Appendix D: US Markets for Imported Crude Oil
Crude Oil Imported into the US
Figure D.1 shows the change in imported crude oil by 5 °API gravity increments. As can be seen
in this figure, there has been slow increase in heavy crude oil imports (< 30 API) and a big drop
in lighter crude oil imports (>30 API), consistent with the results shown in Figure D.1.
Figure D.1: Trends in API Gravity of Crude Oil Imported to the US
(EIA-9, 2017); Analyzed and plotted by Jacobs
Let us focus on crude oils in the range < 30 API, to better understand US markets for bitumen
and partially upgraded bitumen from Alberta. Figures 10.2-10.4 show US import of crude oils with
API gravity in the following ranges: < 20, 20-25, and 25-30. Canada is the largest supplier of crude
oils in the range 20-25 API and 25-30 API. Venezuela is the largest supplier of crude oils in the
range < 20 API. Crude oils in the range 25-30 API are supplied by a number of countries, with
Canada as the largest supplier in this range. Pipelines from Canada require Canadian heavy
crude oil to be greater than 19 API gravity and less than 350 cSt. To meet this viscosity
specification, most heavy Canadian crude oil is a minimum of 20 API gravity.
-
2,000
4,000
6,000
8,000
10,000
12,000
2008 2009 2010 2011 2012 2013 2014 2015 2016
KB
PD
>45
40-45
35-40
30-35
25-30
20-25
15-20
<15
API

Bitumen Partial Upgrading 2018 Whitepaper - AM0401A
137
Figure D.2: US Crude Import < 20 API
(EIA-9, 2017); Analyzed and plotted by Jacobs
Figure D.3: US Crude Import 20-25 API
(EIA-9, 2017); Analyzed and plotted by Jacobs
0
500
1000
1500
2000
2500
3000
3500
2007 2008 2009 2010 2011 2012 2013 2014 2015 2016
KB
PD
Rest of World
ALBANIA
GUATEMALA
UNITED KINGDOM
SAUDI ARABIA
ECUADOR
MEXICO
BRAZIL
COLOMBIA
CANADA
VENEZUELA
0
500
1,000
1,500
2,000
2,500
3,000
3,500
2007 2008 2009 2010 2011 2012 2013 2014 2015 2016
KB
PD
Rest of World
CHAD
SAUDI ARABIA
BRAZIL
ANGOLA
VENEZUELA
COLOMBIA
IRAQ
ECUADOR
MEXICO
CANADA

Bitumen Partial Upgrading 2018 Whitepaper - AM0401A
138
Figure D.4: US Crude Import 25-30 API
(EIA-9, 2017); Analyzed and plotted by Jacobs
Figure D.5 shows the breakdown of all crude oils imported to the US in 2016. Canada was the
major supplier to the US of crude oil in the 20-25 API range, which is where most dilbits fall.
Mexico is the next largest supplier in this API range. Venezuela is the largest supplier of crude
oils in the 15-20 API range. Many SCOs from Alberta fall in the range of 30-40 API gravity.
Figure D.5: Crude Oils Imported to the US by API Gravity in 2016
(EIA-9, 2017); Analyzed and plotted by Jacobs
0
500
1,000
1,500
2,000
2,500
3,000
3,500
2007 2008 2009 2010 2011 2012 2013 2014 2015 2016
KB
PD
Rest of World
BRAZIL
VENEZUELA
SAUDI ARABIA
NIGERIA
ANGOLA
CHAD
KUWAIT
COLOMBIA
IRAQ
CANADA
0
500
1,000
1,500
2,000
2,500
3,000
3,500
KB
PD
Crude Oil API Gravity
Rest of World
Angola
Kuwait
Nigeria
Ecuador
Iraq
Colombia
Mexico
Venezeula
Saudi Arabia
Canada

Bitumen Partial Upgrading 2018 Whitepaper - AM0401A
139
The historical breakdown of Canadian crude oils imported to the US by API gravity is shown in
Figure D.6. Growth in US import of Canadian crude oil has been mainly in the range 20-25 API.
Figure D.6: Canadian Crude Oils Imported to the US by API Gravity
(EIA-9, 2017); Analyzed and plotted by Jacobs
Crude Oil Imported into PADD1
To better understand markets for Alberta bitumen based crude oils, we will focus on crude oils in
the range < 20, 20-25 and 25-30 API gravity imported into different PADDs. First let us look at the
refinery processing capability in PADD 1. The number of operating refineries has decreased since
2010 as has crude distillation capacity. This PADD has no coking capacity (Figure D.7).
Figure D.7: PADD 1 Refinery Process Unit Capacity
(EIA-3 Plotted by Jacobs, 2017)
-
500
1,000
1,500
2,000
2,500
3,000
3,500
2008 2009 2010 2011 2012 2013 2014 2015 2016
KB
PD
>45
40-45
35-40
30-35
25-30
20-25
15-20
<15
API
0
2
4
6
8
10
12
0
1,000
2,000
3,000
4,000
5,000
6,000
Op
era
ting
Re
fine
rie
s
Cap
acity,
KB
PD
HT - Hvy GO/Other Resid
DHT
Gasoline HT
NHT
Cat Reforming
HCU, Residual
HCU, Distillate/Gas Oill
FCC
Coking
Vacuum Distillation
Atmospheric Distillation
Operating Refineries

Bitumen Partial Upgrading 2018 Whitepaper - AM0401A
140
PADD 1 imports a limited amount of heavy crude oils and very little or none from Canada. Figure
D.8 shows crude oil imports to PADD 1 < 20 API. Figure D.9 shows crude oil imports to PADD 1
between 20-25 API. Figure D.10 shows crude oil imports to PADD 1 between 25-30 API.
Figure D.8: Crude Oils Imported to PADD 1 < 20 API Gravity
(EIA-9, 2017); Analyzed and plotted by Jacobs
Figure D.9: Crude Oils Imported to PADD 1 between 20-25 API Gravity
(EIA-9, 2017); Analyzed and plotted by Jacobs
0
50
100
150
200
250
300
2007 2008 2009 2010 2011 2012 2013 2014 2015 2016
KB
PD
Rest of World
ALBANIA
GUATEMALA
UNITED KINGDOM
SAUDI ARABIA
ECUADOR
MEXICO
BRAZIL
COLOMBIA
CANADA
VENEZUELA
0
50
100
150
200
250
300
2007 2008 2009 2010 2011 2012 2013 2014 2015 2016
KB
PD
Rest of World
CHAD
SAUDI ARABIA
BRAZIL
ANGOLA
VENEZUELA
COLOMBIA
IRAQ
ECUADOR
MEXICO
CANADA

Bitumen Partial Upgrading 2018 Whitepaper - AM0401A
141
Figure D.10: Crude Oils Imported to PADD 1 between 25-30 API Gravity
(EIA-9, 2017); Analyzed and plotted by Jacobs
PADD 1 has historically not been a market for Alberta heavy crude oils. It is logistically distant
from Alberta and lacks bottoms conversion capacity. Most crude oils imported from Canada to
PADD 1 are in the range of 30-35 API (Figure D.11) and are from Canada’s east coast.
Figure D.11: Canadian Crude Oils Imported to PADD 1
(EIA-9, 2017); Analyzed and plotted by Jacobs
Crude Oil Imported into PADD2
PADD 2 has seen no increase in crude atmospheric distillation capacity. But has seen small
increases in vacuum distillation and coking capacities (Figure D.12).
0
50
100
150
200
250
300
2007 2008 2009 2010 2011 2012 2013 2014 2015 2016
KB
PD
Rest of World
BRAZIL
VENEZUELA
SAUDI ARABIA
NIGERIA
ANGOLA
CHAD
KUWAIT
COLOMBIA
IRAQ
CANADA
-
50
100
150
200
250
300
2008 2009 2010 2011 2012 2013 2014 2015 2016
KB
PD
45-50
40-45
35-40
30-35
25-30
20-25
15-20
<15
API

Bitumen Partial Upgrading 2018 Whitepaper - AM0401A
142
Figure D.12: PADD 2 Refinery Process Unit Capacity
(EIA-3 Plotted by Jacobs, 2017)
Most crudes imported to PADD 2 are from Canada. Figure D.13 shows crudes imported < 20 API,
Figure D.14 shows crudes imported between 20-25 API, and Figure D.15 shows crude imported
between 25-30 API. PADD 2 has seen little change in imports of crude oil in the < 20 API range.
Most of this crude is from Canada.
Figure D.13: Crude Oils Imported to PADD 2 < 20 API Gravity
(EIA-9, 2017); Analyzed and plotted by Jacobs
PADD 2 has seen big change in imports of crude oil in the 20-25 API range. Nearly all of this oil
came from Canada (Figure D.14).
20
21
22
23
24
25
26
27
28
29
30
0
2,000
4,000
6,000
8,000
10,000
12,000
14,000
Op
era
ting
Re
fine
rie
s
Cap
acity,
KB
PD
HT - Hvy GO/Other Resid
DHT
Gasoline HT
NHT
Cat Reforming
HCU, Residual
HCU, Distillate/Gas Oill
FCC
Coking
Vacuum Distillation
Atmospheric Distillation
Operating Refineries
0
200
400
600
800
1000
1200
1400
1600
2007 2008 2009 2010 2011 2012 2013 2014 2015 2016
KB
PD
Rest of World
ALBANIA
GUATEMALA
UNITED KINGDOM
SAUDI ARABIA
ECUADOR
MEXICO
BRAZIL
COLOMBIA
CANADA
VENEZUELA

Bitumen Partial Upgrading 2018 Whitepaper - AM0401A
143
Figure D.14: Crude Oils Imported to PADD 2 between 20-25 API Gravity
(EIA-9, 2017); Analyzed and plotted by Jacobs
PADD 2 has seen a little or no change in imports of crude oil in the range 25-30 API range. Most
of this oil came from Canada (Figure D.15).
Figure D.15: Crude Oils Imported to PADD 2 between 25-30 API Gravity
(EIA-9, 2017); Analyzed and plotted by Jacobs
Most of the growth in imports of crude oil from Canada to PADD 2 have been in the 20-25 API
gravity range (Figure D.16). The growth in capacity for Canadian heavy crude oil in the 20-25 API
range seems to be slowing. Further capacity for this crude oil must be found elsewhere.
0
200
400
600
800
1,000
1,200
1,400
1,600
2007 2008 2009 2010 2011 2012 2013 2014 2015 2016
KB
PD
Rest of World
CHAD
SAUDI ARABIA
BRAZIL
ANGOLA
VENEZUELA
COLOMBIA
IRAQ
ECUADOR
MEXICO
CANADA
0
200
400
600
800
1,000
1,200
1,400
1,600
2007 2008 2009 2010 2011 2012 2013 2014 2015 2016
KB
PD
Rest of World
BRAZIL
VENEZUELA
SAUDI ARABIA
NIGERIA
ANGOLA
CHAD
KUWAIT
COLOMBIA
IRAQ
CANADA
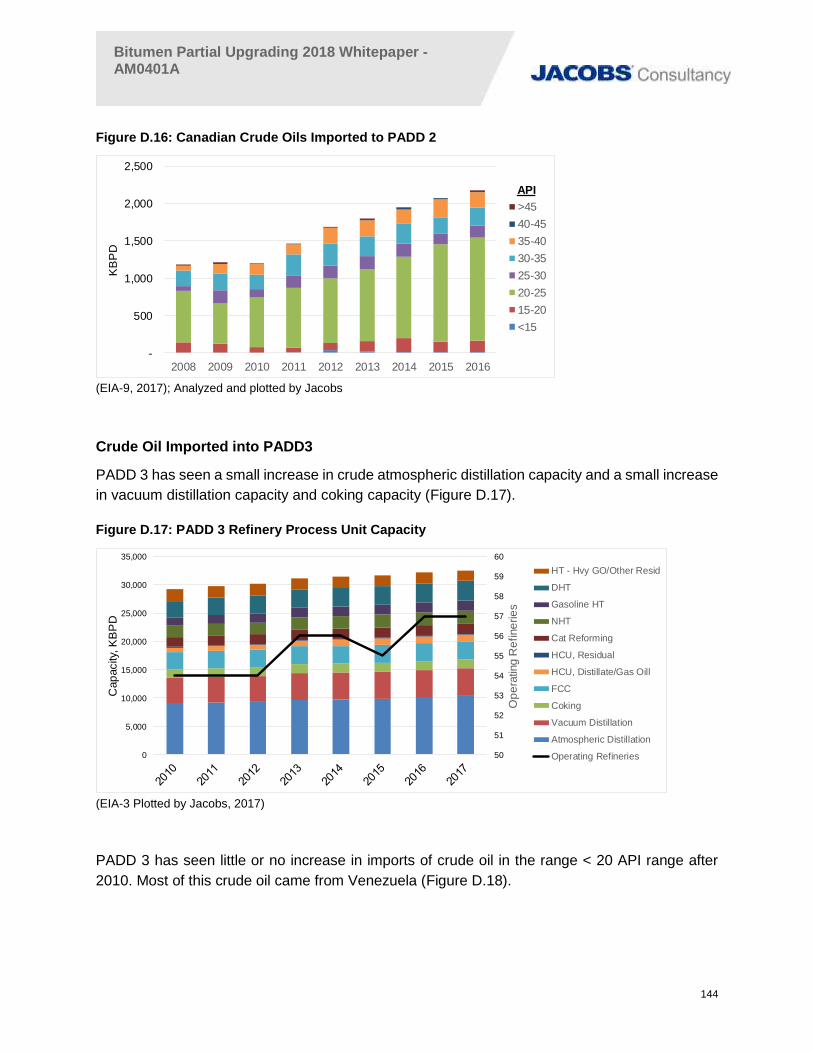
Bitumen Partial Upgrading 2018 Whitepaper - AM0401A
144
Figure D.16: Canadian Crude Oils Imported to PADD 2
(EIA-9, 2017); Analyzed and plotted by Jacobs
Crude Oil Imported into PADD3
PADD 3 has seen a small increase in crude atmospheric distillation capacity and a small increase
in vacuum distillation capacity and coking capacity (Figure D.17).
Figure D.17: PADD 3 Refinery Process Unit Capacity
(EIA-3 Plotted by Jacobs, 2017)
PADD 3 has seen little or no increase in imports of crude oil in the range < 20 API range after
2010. Most of this crude oil came from Venezuela (Figure D.18).
-
500
1,000
1,500
2,000
2,500
2008 2009 2010 2011 2012 2013 2014 2015 2016
KB
PD
>45
40-45
35-40
30-35
25-30
20-25
15-20
<15
API
50
51
52
53
54
55
56
57
58
59
60
0
5,000
10,000
15,000
20,000
25,000
30,000
35,000
Op
era
ting
Re
fine
rie
s
Cap
acity,
KB
PD
HT - Hvy GO/Other Resid
DHT
Gasoline HT
NHT
Cat Reforming
HCU, Residual
HCU, Distillate/Gas Oill
FCC
Coking
Vacuum Distillation
Atmospheric Distillation
Operating Refineries

Bitumen Partial Upgrading 2018 Whitepaper - AM0401A
145
Figure D.18: Crude Oils Imported to PADD 3 < 20 API Gravity
(EIA-9, 2017); Analyzed and plotted by Jacobs
PADD 3 has seen a decline in imports of crude oil in the 20-25 API range. Most of this crude oil
came from Mexico. There has been an increase in imports in this API range from Canada,
especially since 2014 (Figure D.19).
Figure D.19: Crude Oils Imported to PADD 3 between 20-25 API Gravity
(EIA-9, 2017); Analyzed and plotted by Jacobs
PADD 3 has seen a decline in imports of crude oil in the 25-30 API range. This crude oil came
from multiple countries (Figure D.20).
0
200
400
600
800
1000
1200
1400
1600
1800
2000
2007 2008 2009 2010 2011 2012 2013 2014 2015 2016
KB
PD
Rest of World
ALBANIA
GUATEMALA
UNITED KINGDOM
SAUDI ARABIA
ECUADOR
MEXICO
BRAZIL
COLOMBIA
CANADA
VENEZUELA
0
200
400
600
800
1,000
1,200
1,400
1,600
1,800
2,000
2007 2008 2009 2010 2011 2012 2013 2014 2015 2016
KB
PD
Rest of World
CHAD
SAUDI ARABIA
BRAZIL
ANGOLA
VENEZUELA
COLOMBIA
IRAQ
ECUADOR
MEXICO
CANADA

Bitumen Partial Upgrading 2018 Whitepaper - AM0401A
146
Figure D.20: Crude Oils Imported to PADD 3 between 25-30 API Gravity
(EIA-9, 2017); Analyzed and plotted by Jacobs
Most of the growth in imports of crude oil from Canada to PADD 3 have been in the 20-25 API
gravity range (Figure D.21). Growth has increased since 2014.
Figure D.21: Canadian Crude Oils Imported to PADD 3
(EIA-9, 2017); Analyzed and plotted by Jacobs
Crude Oil Imported into PADD4
PADD 4 has seen a small increase in crude atmospheric distillation capacity, a small increase in
vacuum distillation capacity, and no increase in coking capacity (Figure D.22).
0
200
400
600
800
1,000
1,200
1,400
1,600
1,800
2,000
2007 2008 2009 2010 2011 2012 2013 2014 2015 2016
KB
PD
Rest of World
BRAZIL
VENEZUELA
SAUDI ARABIA
NIGERIA
ANGOLA
CHAD
KUWAIT
COLOMBIA
IRAQ
CANADA
-
50
100
150
200
250
300
350
400
2008 2009 2010 2011 2012 2013 2014 2015 2016
KB
PD
>45
40-45
35-40
30-35
25-30
20-25
15-20
<15
API

Bitumen Partial Upgrading 2018 Whitepaper - AM0401A
147
Figure D.22: PADD 4 Refinery Process Unit Capacity
(EIA-3 Plotted by Jacobs, 2017)
PADD 4 imports a small quantity of crude oil from Canada in the range < 20 API (Figure D.23).
Figure D.23: Crude Oils Imported to PADD 4 < 20 API Gravity
(EIA-9, 2017); Analyzed and plotted by Jacobs
PADD 4 has seen little or no change in imports of crude oil in the 20-25 API range. All of this oil
came from Canada (Figure D.24).
10
11
12
13
14
15
16
17
18
19
20
0
500
1,000
1,500
2,000
2,500
Op
era
ting
Re
fine
rie
s
Cap
acity,
KB
PD
HT - Hvy GO/Other Resid
DHT
Gasoline HT
NHT
Cat Reforming
HCU, Residual
HCU, Distillate/Gas Oill
FCC
Coking
Vacuum Distillation
Atmospheric Distillation
Operating Refineries
0
20
40
60
80
100
120
140
160
180
200
2007 2008 2009 2010 2011 2012 2013 2014 2015 2016
KB
PD
Rest of World
ALBANIA
GUATEMALA
UNITED KINGDOM
SAUDI ARABIA
ECUADOR
MEXICO
BRAZIL
COLOMBIA
CANADA
VENEZUELA

Bitumen Partial Upgrading 2018 Whitepaper - AM0401A
148
Figure D.24: Crude Oils Imported to PADD 4 between 20-25 API Gravity
(EIA-9, 2017); Analyzed and plotted by Jacobs
PADD 4 imports a small amount of crude oil in the 25-30 API range from Canada (Figure D.25).
Figure D.25: Crude Oils Imported to PADD 4 between 25-30 API Gravity
(EIA-9, 2017); Analyzed and plotted by Jacobs
There has been little or no increase in imports of crude oil from Canada to PADD 4 Most crude
oils are in the 20-25 API range (Figure D.26).
0
20
40
60
80
100
120
140
160
180
200
2007 2008 2009 2010 2011 2012 2013 2014 2015 2016
KB
PD
Rest of World
CHAD
SAUDI ARABIA
BRAZIL
ANGOLA
VENEZUELA
COLOMBIA
IRAQ
ECUADOR
MEXICO
CANADA
0
20
40
60
80
100
120
140
160
180
200
2007 2008 2009 2010 2011 2012 2013 2014 2015 2016
KB
PD
Rest of World
BRAZIL
VENEZUELA
SAUDI ARABIA
NIGERIA
ANGOLA
CHAD
KUWAIT
COLOMBIA
IRAQ
CANADA

Bitumen Partial Upgrading 2018 Whitepaper - AM0401A
149
Figure D.26: Canadian Crude Oils Imported to PADD 4
(EIA-9, 2017); Analyzed and plotted by Jacobs
Crude Oil Imported into PADD 5
PADD 5 has seen a decline in the number of operating refineries since 2010 but very little change
in processing capabilities. Crude atmospheric distillation capacity has decreased slightly as has
vacuum distillation capacity and coking capacity (Figure D.27).
Figure D.27: PADD 5 Refinery Process Unit Capacity
Source: EIA-3 2017– Plotted by Jacobs
PADD 5 has seen a decrease in imports of crude oil in the < 20 API range. The majority of this
heavy crude oil is from Ecuador and Colombia; only a small amount is from Canada (Figure D.28).
-
50
100
150
200
250
300
2008 2009 2010 2011 2012 2013 2014 2015 2016
KB
PD
>45
40-45
35-40
30-35
25-30
20-25
15-20
<15
25
26
27
28
29
30
31
32
33
34
35
0
2,000
4,000
6,000
8,000
10,000
12,000
Op
era
ting
Re
fine
rie
s
Cap
acity,
KB
PD
HT - Hvy GO/Other Resid
DHT
Gasoline HT
NHT
Cat Reforming
HCU, Residual
HCU, Distillate/Gas Oill
FCC
Coking
Vacuum Distillation
Atmospheric Distillation
Operating Refineries

Bitumen Partial Upgrading 2018 Whitepaper - AM0401A
150
Figure D.28: Crude Oils Imported to PADD 5 < 20 API Gravity
(EIA-9, 2017); Analyzed and plotted by Jacobs
PADD 5 has seen little or no change in imports of crude oil in the 20-25 API range. Most of this
oil is from Ecuador; only a small amount is from Canada (Figure D.29).
Figure D.29: Crude Oils Imported to PADD 5 between 20-25 API Gravity
(EIA-9, 2017); Analyzed and plotted by Jacobs
PADD 5 has seen little or no change in imports of crude oil in the 25-30 API range. This crude oil
comes from a number of countries; very little comes from Canada (Figure D.30).
0
50
100
150
200
250
300
2007 2008 2009 2010 2011 2012 2013 2014 2015 2016
KB
PD
Rest of World
ALBANIA
GUATEMALA
UNITED KINGDOM
SAUDI ARABIA
ECUADOR
MEXICO
BRAZIL
COLOMBIA
CANADA
VENEZUELA
0
50
100
150
200
250
300
2007 2008 2009 2010 2011 2012 2013 2014 2015 2016
KB
PD
Rest of World
CHAD
SAUDI ARABIA
BRAZIL
ANGOLA
VENEZUELA
COLOMBIA
IRAQ
ECUADOR
MEXICO
CANADA

Bitumen Partial Upgrading 2018 Whitepaper - AM0401A
151
Figure D.30: Crude Oils Imported to PADD 5 between 25-30 API Gravity
(EIA-9, 2017); Analyzed and plotted by Jacobs
Most of the growth in imports of crude oil from Canada to PADD 5 have been in the 30-40 API
gravity range (Figure D.31).
Figure D.31: Canadian Crude Oils Imported to PADD 5
(EIA-9, 2017); Analyzed and plotted by Jacobs
CAPP and AER both project that by 2030, bitumen production in Alberta will increase by around
1.3 MM BPD. This bitumen shipped via pipeline as dilbit will be in the 20-25 API gravity range.
Access to the US market means displacing crude oil supplied by other countries. PADD 1 has
little or no access to heavy oil from Alberta and no capacity to refine this crude. PADD 5 has the
conversion capacity to process heavy crude oils, but access to heavy crude oil from Alberta is
0
50
100
150
200
250
300
2007 2008 2009 2010 2011 2012 2013 2014 2015 2016
KB
PD
Rest of World
BRAZIL
VENEZUELA
SAUDI ARABIA
NIGERIA
ANGOLA
CHAD
KUWAIT
COLOMBIA
IRAQ
CANADA
-
50
100
150
200
250
2008 2009 2010 2011 2012 2013 2014 2015 2016
KB
PD
>45
40-45
35-40
30-35
25-30
20-25
15-20
<15
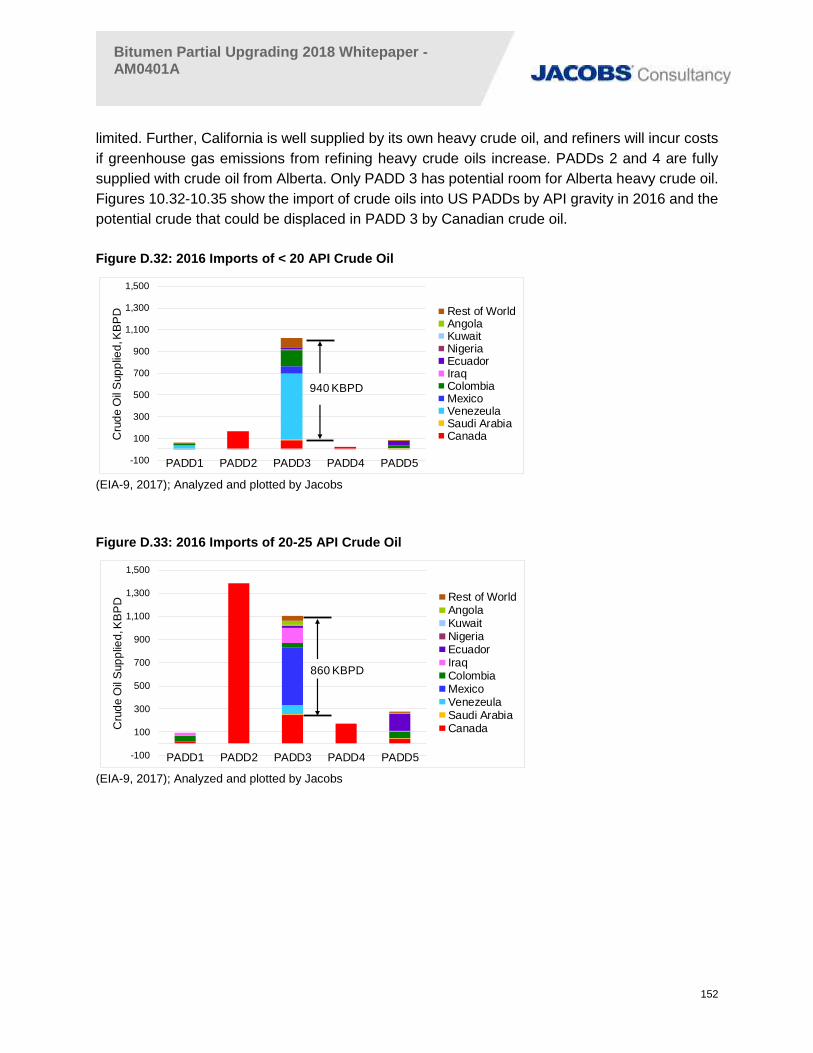
Bitumen Partial Upgrading 2018 Whitepaper - AM0401A
152
limited. Further, California is well supplied by its own heavy crude oil, and refiners will incur costs
if greenhouse gas emissions from refining heavy crude oils increase. PADDs 2 and 4 are fully
supplied with crude oil from Alberta. Only PADD 3 has potential room for Alberta heavy crude oil.
Figures 10.32-10.35 show the import of crude oils into US PADDs by API gravity in 2016 and the
potential crude that could be displaced in PADD 3 by Canadian crude oil.
Figure D.32: 2016 Imports of < 20 API Crude Oil
(EIA-9, 2017); Analyzed and plotted by Jacobs
Figure D.33: 2016 Imports of 20-25 API Crude Oil
(EIA-9, 2017); Analyzed and plotted by Jacobs
-100
100
300
500
700
900
1,100
1,300
1,500
PADD1 PADD2 PADD3 PADD4 PADD5
Cru
de
Oil
Sup
plie
d, K
BP
D Rest of WorldAngolaKuwaitNigeriaEcuadorIraqColombiaMexicoVenezeulaSaudi ArabiaCanada
940 KBPD
-100
100
300
500
700
900
1,100
1,300
1,500
PADD1 PADD2 PADD3 PADD4 PADD5
Cru
de
Oil
Sup
plie
d, K
BP
D Rest of WorldAngolaKuwaitNigeriaEcuadorIraqColombiaMexicoVenezeulaSaudi ArabiaCanada
860 KBPD

Bitumen Partial Upgrading 2018 Whitepaper - AM0401A
153
Figure D.34: 2016 Imports of 25-30 API Crude Oil
(EIA-9, 2017); Analyzed and plotted by Jacobs
Figure D.35: 2016 Imports of 30-40 API Crude Oil
(EIA-9, 2017); Analyzed and plotted by Jacobs
The quantity of crude oil that could potentially be displaced in PADDs 3 and 5 by Canadian crude
oil are shown in Table 10.1. These results are based on 2016 import volumes.
Table 10.1: Potential Crude Oil Displacement by Alberta Crude Oils
Crude Oil API Range
< 20 20-25 25-30 30-40
PADD3 KBPD 940 860 270 920
PADD5 KPBD 80 230 130 490
Most crude < 25 API is from Venezuela and Mexico and could be replaced by dilbit or partially
upgraded bitumen. Crude oil 25-40 API is primarily from Ecuador, Colombia, Iraq, and Saudi
Arabia and could be replaced by SCO from a full bitumen upgrading operation. However, adding
-100
100
300
500
700
900
1,100
1,300
1,500
PADD1 PADD2 PADD3 PADD4 PADD5
Cru
de
Oil
Sup
plie
d, K
BP
D Rest of WorldAngolaKuwaitNigeriaEcuadorIraqColombiaMexicoVenezeulaSaudi ArabiaCanada
270 KBPD
-100
100
300
500
700
900
1,100
1,300
1,500
PADD1 PADD2 PADD3 PADD4 PADD5
Cru
de
Oil
Sup
plie
d, K
BP
D Rest of WorldAngolaKuwaitNigeriaEcuadorIraqColombiaMexicoVenezeulaSaudi ArabiaCanada
920 KBPD

Bitumen Partial Upgrading 2018 Whitepaper - AM0401A
154
new full bitumen upgrading capacity in Alberta is expensive and not planned at this time. Also,
consider that dilbit is around a 30/70 mixture of condensate (API gravity ~65) and bitumen (API
gravity ~ 8-12). The US is awash in condensate as a result of fracking to produce natural gas and
light tight crude oil. Diluent removed from imported dilbit will compete with this US domestic
condensate. Demand for non-Canadian crude oil < 20 API in PADD 3 was 940 KBPD in 2016.
Demand for this range of crude in PADD 5 was 80 KBPD. For these markets to be open to
Canadian crude oil, either the pipeline specifications must be relaxed or it must be transported by
rail.
The US market for refined products is projected to shrink by 2030 according to the EIA, and
discussed above. US refineries, especially in PADDs 3 and 5 have ready access to crude oils that
can be delivered via blue water transport (large tanker ships). PADDs 3 and 5 will be challenged
to absorb the 1.3 MM BPD of additional bitumen projected to be supplied by Alberta by 2030.
PADDs 2 and 4 are fully supplied by Canada and there are no imports of heavy crude oil from
other countries to these PADDs. Without significant, expensive refinery investment, there is not
much room for additional heavy Alberta crude oil in PADDs 2 and 4. If the additional heavy crude
oil from Alberta cannot be placed in PADDs 3 or 5, it will have to find other markets or be upgraded
to better fit the existing US refinery configurations.

Bitumen Partial Upgrading 2018 Whitepaper - AM0401A
155
Appendix E. Hydrogen Addition Upgrading Processes
A number of processes have been developed to allow refineries to gain high conversion of
vacuum residue to distillable products by combining cracking with hydrogenation reactions.
These commercial processes are focused on conversion of vacuum residue and removing
sulfur, and they give products that exceed the pipeline specifications and fall outside the
definition of partial upgrading. Consequently, these processes are listed here as background
information.
Adding hydrogen during upgrading leads to greater volumetric yield and higher quality products.
Several residue hydrotreating/hydrocracking technologies have been commercialized. These
technologies are complex and have high capital cost. Products are much higher quality than
necessary to meet minimum pipeline specifications.
Ebullated Bed Hydrocracking
Ebullated bed residue hydrocracking converts residue in an ebullating bed of catalyst in the
presence of hydrogen at elevated temperatures and pressures. The heaviest portion of residue
is cracked to light and heavy vacuum gasoils (LVGO and HVGO), distillate and naphtha. Light
fuel gas is produced as a reaction byproduct. As a result of cracking with hydrogen, aromatic
chains are saturated as are olefins. Contaminants like metals, sulfur, and nitrogen are removed.
This process produces a heavy byproduct that contains some unreacted refractory carbon.
Ebullated bed residue hydrocracking units can upgrade atmospheric and vacuum resid. Two
versions are licensed commercially by technology suppliers: LC-Fining from Chevron Lummus
Global and H-Oil from Axens.
Figure E.1 shows the schematic for a typical ebullating bed hydrocracking unit (shown here as
LC Fining). Process flow in the reactor is upflow to ebullate the catalyst. These reactors act more
like a stirred tank reactor and conversion is lower than in a plug flow reactor, which is more
typically used in hydroprocessing/hydrotreating of lighter materials less prone to bed plugging. It
is necessary to operate residue hydrocrackers in ebullated bed mode to avoid plugging with feed
and product contaminants, especially asphaltene agglomerates formed as a result of reacting
molecules that solubilize asphaltenes.

Bitumen Partial Upgrading 2018 Whitepaper - AM0401A
156
Figure E.1: LC Fining Schematic
(Baldassari, et al., 2012)
Ebullating bed residue hydrocracking is currently used in bitumen upgrading at the Husky Bi-
Provincial Upgrader, Syncrude and Shell Scotford. A fourth unit is under construction at the
Sturgeon refinery (North West Redwater Partnership).
Slurry-Phase Residue Hydrocracking
Slurry-phase residue hydrocracking uses a dispersed molybdenum based nano-catalyst
(molybdenite, MoS2) or other low cost catalyst to effect hydrocracking of resids. Spent catalyst is
removed with the unreacted bottoms. Catalyst cost is low and withdrawal and make up rates are
low. Because of the small size of the catalyst, molecular diffusion to catalyst active sites is less of
an issue than with ebullating bed residue hydrocracking.
Slurry phase hydrocracking operates at high pressure (1,500-2,000 psig) and temperature (700-
850 °F). As a result of catalyst circulation, coking tendencies are reduced. Slurry bed processes
are designed to handle residue with high dirt, asphaltenes, and wastes because these processes
use very fine particles of catalyst to reduce bed plugging and keep the pressure drop in the reactor
section low. Because these processes improve contact with feed, they are reported to achieve
upwards of 90% conversion. A fixed bed reactor is often used after the slurry reactor to further
treat the reaction products. It can be difficult to operate a slurry reactor because the catalyst tends
to accumulate in the reactor section, leading to the plugging of downstream equipment.

Bitumen Partial Upgrading 2018 Whitepaper - AM0401A
157
In slurry-phase hydrocracking, heavy residue from the vacuum distillation unit is processed in the
slurry bed to upgrade and convert the residue to heavy gasoils, distillates, and naphtha. Fuel gas
containing H2S is a byproduct that goes to the gas plant. The conversion level in the reactor is
controlled to maintain stability of the unconverted material and avoid precipitation of asphaltenes.
Figure E.2 shows a simple schematic of the reactor and product separation. A solvent
deasphalting unit is required when processing vacuum residue from bitumen.
Figure E.2: Slurry Phase Hydrocracking Flow Scheme
(Snamprogetti - Montanari, R., 2005)
A number of licensors offer slurry phase residue hydrocracking: Veba Combi-cracking (VCC) by
KBR; ENI’s slurry technology (EST); and UOP’s Uniflex technology (originally from CANMET).
ENI’s 23,000 BPD EST unit has been commissioned at the ENI refinery in Sannazzaro, Italy. The
Veba-Combi cracking unit was demonstrated at 3,500 BPD at the BP refinery in Gelsenkirchen,
Germany. The CANMET slurry phase hydrocracking process was demonstrated in a 5,000 BPD
commercial demonstration unit at the PetroCanada Montreal refinery.
ENI has processed Athabasca bitumen in their demonstration unit and found it necessary to
process the recycle stream from the fraction system in a solvent deasphalting (SDA) unit to
recover heavier gasoils, improve yield, and reduce recycle. Adding an SDA unit concentrates
metals and spent catalyst in the pitch (bottoms) from the SDA unit for purge. ENI has not tested
slurry phase hydrocracking at the minimum conditions needed to generate a partially upgraded
bitumen that meets but does not exceed pipeline specifications.

Bitumen Partial Upgrading 2018 Whitepaper - AM0401A
158
Support Units for Residue Hydrocracking
Residue hydrocracking requires the following support units if used in partial upgrading:
• Upstream crude and vacuum distillation
• Amine plant
• Sulfur recovery
• Sour water plant
• Hydrogen production
• Offsites and storage
• Catalyst addition and removal; recovery and disposal
Summary – Hydrogen Addition
As a result of hydrogen addition, the quality of products from residue hydrocracking is higher than
from thermal cracking and there is greater volume yield. However, limitations on conversion
because of the need to keep asphaltenes from precipitating, often results in unconverted oil
containing refractory carbon. Both ebullating bed and slurry phase hydrocracking require close
attention to feedstock composition to maintain operating conditions that avoid asphaltene
agglomeration. Residue hydrocracking is a complex process that yields products that exceed the
definition of partial upgrading. Although new processes based on these commercial technologies
could conceivably be developed to operate at lower conversions to meet pipeline specifications,
they are likely to be too expensive for partial upgrading.