bknqi :knktctkpos ph @skoi =girgsskpo cof ;gco … · bknqi:knktctkpos ph @skoi =girgsskpo cof ;gco...
TRANSCRIPT
FORUM
Limitations of Using Regression and Mean Separation Analysesfor Describing the Response of Crop Yield to Defoliation:
A Case Study of the Colorado Potato Beetle(Coleoptera: Chrysomelidae) on Potato
BRIAN A. NAULT1 AND GEORGE G. KENNEDY
Department of Entomology, Box 7630, North Carolina State University, Raleigh, NC 27695-7630
J. Econ. Entomol.91 (1): 7-20 (1998)ABSTRACT The relationship between Irish potato tuber yield, So/anum tuberosum L., anddefoliation by the Colorado potato beetle, Leptinotarsa decem/ineata (Say), was investigated andthe use of regression and mean separation analyses as a basis for developing economic injurylevels were compared. The type of statistical analysis used to describe this relationship greatlyaffected the interpretation of data. Mean separation (=multiple-comparison) procedures wereinadequate to detect accurately defoliation levels tolerated by potato, because these proceduresdid not have significant statistical power to detect small reductions in yield. Similarly, regressionanalyses failed to identify a level of defoliation tolerable to potato because a consistent biologicalrelationship between yield and defoliation could not be determined. For example, a quadraticterm (nonlinear) in the analysis of variance was significant in only 2 of 8 experiments, and therelationship between 'Atlantic' and 'Superior' yield and defoliation in these experiments wasconcave, indicating that yield losses were greatest at low levels of defoliation. A plateau model(nonlinear) suggested that Atlantic potato could tolerate low levels of defoliation (1.8-13% in4 of6 data sets), but it did not fit data for the variety Superior. Although a negative linear modelprovided a statistically significant fit to 7 of 8 data sets (average slopes [±SEM] for Atlantic andSuperior were -0.12 ± 0.01 and -0.15 ± 0.03 T/ha per the percentage of defoliation, respec-tively), it is likely that a linear model underestimates the actual level of defoliation that potatocan tolerate, especially at low levels. The implications of these findings for the development ofeconomic injury levels and economic thresholds for the Colorado potato beetle on potato arediscussed.
KEY WORDS Colorado potato beetle, yield, defoliation, regression, mean separation proce-dures, economic injury level
ECONOMIC INJURY LEVEL'> and economic thresholdsare key components in decision-making for arthro-pod pest management (Poston et al. 1983, Pedigoand Higley 1992). Stern et al. (1959) defined theeconomic injury level as the lowest population den-sity that will cause economic damage; and the eco-nomic threshold as the density of the pest popula-tion at which a control decision should be made toprevent damage from reaching this density. Devel-oping an economic injury level and economicthreshold requires knowledge of the market value ofthe crop, cost of managing the pest, and the cropyield response to pest density or damage. Under-standing the relationship between crop yield anddamage provides a biological foundation for theeconomic injury level model (Pedigo et al. 1986).
Crop yield responses to arthropod damage havebeen discussed extensively (Poston et al. 1983,
I Virginia Polytechnic Institute and State University, EasternShoreAgriculturalResearchand ExtensionCenter, 33446 ResearchDrive, Painter, VA23420.
Pedigo et al. 1986, Pedigo 1989). Poston et al. (1983)categorized these 3 responses into the following: (1)susceptive response is a negative linear response todamage, (2) tolerant response is a sigmoidal re-sponse to damage that includes a plateau region atlow damage levels, and (3) overcompensatory re-sponse is a sigmoidal response to damage that in-cludes a slight increase in yield at low damage levels.Researchers have described the crop yield/ damagerelationship using regression and mean separation(=multiple-comparison) analyses. Regression anal-yses have been used to identify linear or nonlinearrelationships between yield and damage, whereasmean separation analyses have been used to identifydamage levels at which yields are not reduced. Inmean separation analyses a tolerant or overcom-pensatory response is assumed when yield differ-ences among low damage levels are not declaredsignificant. Despite controversy over the appropri-ate use of mean separation procedures (=multiple-comparison procedures) (Jones 1984, Swallow 1984,Perry 1986), they have been the most commonly
0022-0493/98/0007-0020$02.00/0 © 1998 EntomologicalSociety of America
by guest on February 3, 2016http://jee.oxfordjournals.org/
Dow
nloaded from
8 JOURNAL OF ECONOMIC ENTOMOLOGY Vol. 91, no. 1
used statistical approach for determining the toler-ance level of Irish potato, Solanum tuberosum (L.),to defoliation (Cranshaw and Radcliffe 1980, Welliket al. 1981, Ferro et al. 1983, Shields and Wyman1984, Zehnder and Evanylo 1989, Zehnder et al.1995). However, a few investigators (Senanayakeand Holliday 1990, Nault et al. 1995) have usedre!l;ression analysis to describe the yield response ofpotato to defoliation and to potato beetle density(Mailloux et al. 1991, 1995).
The Colorado potato beetle, Leptinotarsa decem-lineata (Say), is the principal defoliator of Irishpotato in North America (Hare 1990). In NorthCarolina, it is the only pest that defoliates potatoesand the highest levels of defoliation occur consis-tently during the bloom stage. The effect of defo-liation on tuber yield has been shown to vary dra-matically with the phenological stage of the potatoplant. In general, potato plants seem least suscep-tible to yield loss when defoliated very early or latein the season (Hare 1980, Ferro et al. 1983). Hare(1980) and Zehnder and Evanylo (1989) demon-strated that potato plants could withstand very highlevels of defoliation within a few weeks before har-vest without a significant yield reduction. Most stud-ies have shown that potato plants are least tolerantof defoliation during or near the bloom stage (Hare1980, Cranshaw and Radcliffe 1980, Wellik et al.1981, Ferro et al. 1983, Shields and Wyman 1984,Dripps and Smilowitz 1989, Senanayake and Holli-day 1990). However, Zehnder and Evanylo (1989)and Zehnder et al. (1995) reported that 'Superior'potatoes were most sensitive to yield loss whendefoliated (20%) during the prebloom stage.
Based on a failure to detect significant differencesin tuber yields among experimental treatments dif-fering in levels of defoliation using mean separationprocedures, thresholds have been determined to bethe maximum level of defoliation in which the cor-responding yield did not differ significantly from theyield of the nondefoliated control. Using this crite-rion, defoliation-based thresholds during bloom forpotato have been reported to be as high as 30% forthe cultivar Superior in Virginia (Zehnder et al.1995) and as low as 10% for Superior and 'RussetBurbank' in Wisconsin (Shields and Wyman 1984).
In contrast, other research has shown a lack oftolerance by potato to defoliation during bloom(Senanayake and Holliday 1990, Nault et al. 1995).Senanayake and Holliday (1990) reported a nega-tive linear response between yield of 'Norland' tu-bers and defoliation by the Colorado potato beetleduring bloom in Manitoba. However, because theirexperimental unit was a single plant, their studyfailed to account for the possibility that less dam-aged neighboring plants might compensate for yieldlosses by more heavily damaged plants (Entz andLaCroix 1984, Rex et al. 1987). Nault et al. (1995)investigated this possibility in 'Atlantic' potato andfound that nondefoliated potato plants did not com-pensate for reduced tuber yield by adjacent plantsdefoliated during the bloom stage.
Because the conclusions regarding the ability ofpotato to tolerate defoliation may be influenced bythe statistical approach (regression versus meanseparation analyses), the objectives of this researchwere to determine the response of potato tuberyields to defoliation by Colorado potato beetlesduring the bloom stage, and to compare conclusionsbased on regression analyses (e.g., non linear andlinear) and mean separation procedures. Addition-ally, 8 data sets from 3 previously published studies,which determined defoliation tolerance levels forpotato using mean separation analyses, were reex-amined using nonlinear and linear regression.
Materials and Methods
Two studies were conducted in 1991 and 3 wereconducted in both 1992 and 1993. All were con-ducted at the Tidewater Research Station in Wash-ington County, North Carolina, except for the 1991Atlantic yield experiment 2, which was conducted inCarteret County, North Carolina. Soil types at theWashington and Carteret County sites were a Ports-mouth loam soil and a Deloss fine sandy loam, re-spectively. Atlantic and Superior, the most com-monly grown cultivars in eastern North Carolina,were used. Because we were not interested in char-acterizing cultivar X defoliation interaction effectson yield, separate experiments were conducted forAtlantic and Superior.
Atlantic Yield Experiments. Seed pieces of At-lantic potato were planted on 26 March and 4 April1991 (experiments 1 and 2, respectively), 16 March1992, and 25 March 1993. Seed pieces in 1992 and1993 were treated with captan (0.45 kg/45.4 kg ofseed) and planted at 0.23 m within-row spacing; in1991, plant spacing was 0.3 m. Plots were single rows(each 6.1, 7.6, 9.1, and 9.1 m long in experiments1991 [1], 1991 [2], 1992, and 1993, respectively)with 2 planted guard rows on each side. Row spacin!l;was 0.97 m. Plots were separated within rows by a1.52-m gap in which a red-skinned cultivar, either'Red Pontiac' or Norland, was planted so the plotscould be distinguished at harvest.
Studies in 1991 had 8 target levels of defoliation(0, 3-9, 9.5-17, 17.5-27, 27.5-38, 38.5-50, 50.5-62,and 62.5-73%). Experiment 1 in 1991 was arrangedin a completely randomized design replicated 3times (total of 24 plots), whereas experiment 2 in1991 had the same 8 target levels of defoliationarranged in a randomized complete block designreplicated 4 times. In experiment 2, each target levelof defoliation was triplicated within each block (to-tal of 96 plots). Defoliation and harvest proceduresfor all experiments are described below. Experiment1 in 1992 had 5 target levels of defoliation (0,0 ..5-3,3.5-9, 9.5-17, and 17.5-27%) arranged in a random-ized complete block design with 6 replications. Eachtarget level of defoliation was triplicated withineach block (total of 90 plots). Experiment 2 in 1992had 6 target levels of defoliation (0, 0.5-3, 3.5-9,9.5-17, 17.5-27, and 27.5-38%) arranged in a ran-
by guest on February 3, 2016http://jee.oxfordjournals.org/
Dow
nloaded from
Ft'llfllary 1998 NAULT AND KENNEDY: DESCRIBING YIELD RESPONSE TO DEFOLIATION 9
domized complete block design replicated 8 times(total 48 plots). Experiment 1 in 1993 included the~am{' 6 target levels of defoliation arranged in arandomized complete block design replicated 6times and each target level of defoliation was trip-licated within each block (total of 108 plots). Ex-periment 2 in 1993 had 5 target levels of defoliation(0.0.5-3,3.5-9,9.5-17, and 17.5-27%) arranged in arandomized complete block design replicated 5times (total of 25 plots).
During 1991, plots in experiment 1 received 572kglha of (10:10:10, N:P:K) fertilizer before plantingand 560 kg/ha of (15:0:14, N:P:K) on 14 May,wlwreas the test site for experiment 2 was fertilizedin early May at rates appropriate for commercialpotato production in the region. Plots in 1992 re-c{'ived 818 kg/ha of (17:17:17, N:P:K) fertilizer be-fore planting and 163 kg/ha of (34:0:0, N:P:K) fer-tilizer on 14 May. Plots in 1993 received 701 kg/haof (17:17:17. N:P:K) fertilizer before planting and163 kg/ha of (34:0:0, N:P:K) fertilizer on 11 May.
In 1991, weeds were controlled in experiment 1with 1 application of metolachlor at 2.24 kg (AI) I haand metribuzin at 1.12 kg (AI) I ha on 12 April,whereas weeds were controlled in experiment 2 bycultivation. Foliar diseases were managed in exper-iment 1 with applications of mancozeb at a rate of0.91 kg/378 liter of water on 10 and 30 May, and 10June. and in experiment 2 by 1 application of beno-myl at 1.12 kg (AI) Iha on 10 June. In 1992, weedcontrol was achieved by a preemergence applica-tion of metribuzin at 1.12 kg (AI) Iha on 15 April. Inaddition. chlorothalonil at 0.59 kg (AI) Iha was ap-pli{,d as a foliar spray for disease control on 13 and22 May. In 1993, metribuzin was applied at 1.05 kg(AI) I ha on 15 April for weed control, and chlo-rothalonil was applied at 0.59 kg (AI) Iha on 13 and27 May for control of foliar diseases.
European corn borer, Ostrinia nubilalis (Hub-ner), infestations were managed in plots using 1foliar application of acephate (Orthene 75 S [solid],1.12 kg [AI] Iha, Valent, Walnut Creek, CA) in earlyMay 1991 (experiment 1). Because the infestationwas very low «10% infested stems) in experiment2, no control measure was applied. In 1992 and 1993,European corn borer infestations were managedwith 1 application of acephate at 0.56 kg (AI) I ha inearly May. Acephate applications did not affect thetiming or level of defoliation by Colorado potatobeetles.
Superior Yield Experiments. Seed piece treat-ment, seed piece spacing, planting dates, and plotsize were identical to those described in the 1992and 1993 Atlantic yield experiments. The experi-ment in 1992 had 6 target levels of defoliation (0,0.5-3.3.5-9,9.5-17,17.5-27, and 27.5-38%) arrangedin a randomized complete block design replicated 8times (total 48 plots). The experiment in 1993 wassimilar except that the 27.5-38% defoliation levelwas excluded, and there were only 5 replications(total of 25 plots). Plots in both experiments re-ceived the same cultivation practices, were treated
with acephate to manage European corn borer, andwere harvested and graded on the same dates asthose in the other 1992 and 1993 experiments.
Defoliation and Harvest Procedures. Because arange of Colorado potato beetle densities wasneeded to achieve desired levels of defoliation, nat-ural populations of overwintered Colorado potatobeetles were permitted to colonize the test site. Thisoccurred during late April and early May, whenplants were 10-20 cm tall. Defoliation peaked dur-ing bloom in late May through early June. Levels ofdefoliation before bloom were monitored in eachplot, but never exceeded an average of 1-2% perplot. Colorado potato beetle densities were manip-ulated by adding additional Colorado potato beetleadults and small larvae to certain plots to achieve arange of plant damage. Within a 4-d period duringbloom, further insect damage was terminated in allplots using insecticides, regardless of whether or notthe target level of defoliation for a certain plot wasreached. Plots and their guard rows were treatedwith either esfenvalerate (Asana XL 0.66 EC [emul-sifiable concentrate] at 0.034 or 0.056 kg [AIl/ha,DuPont, Wilmington, DE) or oxamyl (Vydate 2 L[liquid] at 0.56 or 1.12 kg [AI] Iha, DuPont). Es-fenvalerate was applied to the entire test at a rate of0.056 kg (AI) Iha in June to prevent additional de-foliation during the postbloom stage. In all cases,these applications, which were made using a CO2-
pressurized, backpack sprayer equipped with a3-nozzle (D-3 disk/25 core hollow cone) single-rowboom calibrated to deliver 250 liters of solution perhectare at 275.7 kPa, prevented further defoliation.
Twice weekly, visual estimates of defoliation ineither a 1.83-m section of each plot that best rep-resented the average defoliation of the entire plot(experiments in 1991) or in four 2.3-m sections ineach plot (experiments in 1992 and 1993) wererecorded. Defoliation estimates were based on aweighted, pretransformed rating scale that divided90° into 13 defoliation categories corresponding toarcsine transformation values, each represented asa percentage (e.g., 3-9%) (Little and Hills 1978).The midpoint of the category was then assigned toeach estimate (e.g., 6% for 3-9% defoliation class).This defoliation rating in our plots was assignedbased on a comparison of defoliation in our plotswith photographs of potato plants with known levelsof defoliation by Colorado potato beetles, each ofwhich corresponded to 1 of the 13 defoliation cat-egories (Zehnder et al. 1995). Plots were harvestedwith a I-row digger, and tubers were graded aseither U.S. No.1 or 2 on 26 June 1991 (experiment1),27 June 1991 (experiment 2), 6 July 1992, and 28June 1993. These harvest dates were 83, 97,112, and95 d after planting, respectively. Tubers 2:4.8 cm indiameter were classified as U.S. No.1; anythingsmaller was a U.S. No.2 (USDA 1972). Only U.S. No.1 and 2 tubers were weighed; rotted tubers, whichwere rare, were ignored.
Statistical Analyses. Because plots that had a poorstand were excluded from the analyses, the number
by guest on February 3, 2016http://jee.oxfordjournals.org/
Dow
nloaded from
10 JOURNAL OF ECONOMIC ENTOMOLOGY Vol. 91, no. 1
of plots used in analyses of the Atlantic yield ex-periments were 20, 55, 68, 38, 67, and 16 for exper-iment 1 (1991), 2 (1991), 1 (1992), 2 (1992), 1(1993) and 2 (1993), respectively, whereas the num-ber used in the analyses of the Superior yield ex-periment were 34 and 14 for the 1992 and 1993experiments, respectively. The defoliation esti-mates recorded at the time defoliation was termi-nated in each plot (i.e., during bloom) were used inthe analyses. In the 1991 experiments, the midpointof the single defoliation estimate for each plot wasused in the analyses. In all 1992 and 1993 experi-ments, the midpoints for each of the 4 defoliationestimates in each plot were averaged, and the re-sulting mean was used in the analyses. Data in allexperiments were subjected to an analysis of vari-ance (ANOVA) using a general linear model(PROC GLM) to identify significant treatment ef-fects (P ~ 0.05) (SAS Institute 1990). If the modelstatement for a given data set was significant (P <0.05), regression analyses, which included a plateaumodel (PROC NLIN), quadratic and other higher-order polynomial models (PROC REG), and a sim-ple linear model (PROC REG), were used to iden-tify the relationship between tuber yield anddefoliation. Because many of the defoliation levelswere replicated in the 1991 data sets, a lack of fit tothe quadratic term was included in the ANOVA.
Additionally, data in all experiments were ana-lyzed using mean separation analysis. The proce-dure used to assign specific plots to defoliationclasses was similar to that used by other investiga-tors who used mean separation procedures to ana-lyze their results (Ferro et al. 1983, Zehnder et al.1995). Because each plot was assigned a specificdefoliation rating, plots with a mean defoliationvalue that fell within 1 of the defoliation ranges wereassigned to a defoliation class represented by themidpoint of that range (e.g., if the mean defoliationvalue for a plot was 10%,it would be within the rangeof 9.5-17%, and would be assigned to the 13% de-foliation class). These defoliation classes (1.5,6,13,22, 32.5, 44, 56, and 67.5%) then were considered asexperimental treatments and were subjected toANOVA with mean separation by the Fisher pro-tected least significant difference (LSD) (P ~ 0.05;PROC GLM; SAS Institute 1990). The Fisher pro-tected LSD was chosen because it was the mostconservative test for unbalanced data (i.e., moreconservative tests such as the Dunnett and Bonfer-roni inequality tests require balanced data sets).Only defoliation classes that had ;:::2 replicationswere analyzed.
Results
Marketable (U.S. No.1 + U.S. No.2) and U.S. No.1 tuber yields from undamaged plots varied sub-stantially each year, but they were within the rangetypical for this growing region (NCDA 1993, 1995).The quadratic (defoliation X defoliation) and lackof fit terms in the ANOVA did not account for a
significant portion of the total variation in tuberyield in the 1991 experiments (Table 1). In the 1992Atlantic yield experiment 1, the quadratic term wassignificant in the analysis of total marketable tuberyield, but the curve generated using nonlinear re-gression was concave (F = 16.51; df = 2, 65; P =0.0001; y = 31.62 - 0.30x + 0.004x2 ; R2 = 0.34),indicating that yield losses were greatest at lowlevels of defoliation. Similarly, in the 1993 Superioryield experiment 2, the quadratic term was signifi-cant in the analysis of U.S. No.1 and total market-able tuber yield, but both curves were concave (U.S.No.1, F = 7.81; df = 2, 11; P = 0.0078; y = 9.41 -0.45x + 0.01x2 ; R2 = 0.59, and marketable, F = 6.49;df = 2, 11; P = 0.0137; y = 11.35 - 0.50x + 0.0Ix2;R2 = 0.54). None of the higher-order polynomialmodels in the ANOVA accounted for a significantportion of the total variation in tuber yield in the1992 and 1993 experiments, so they were not con-sidered in further analyses.
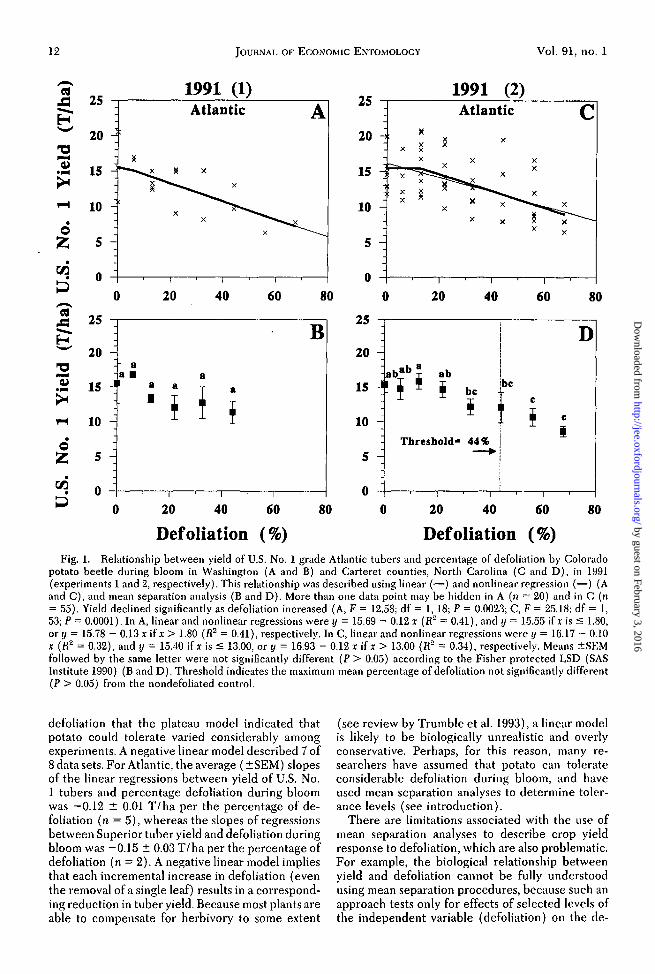
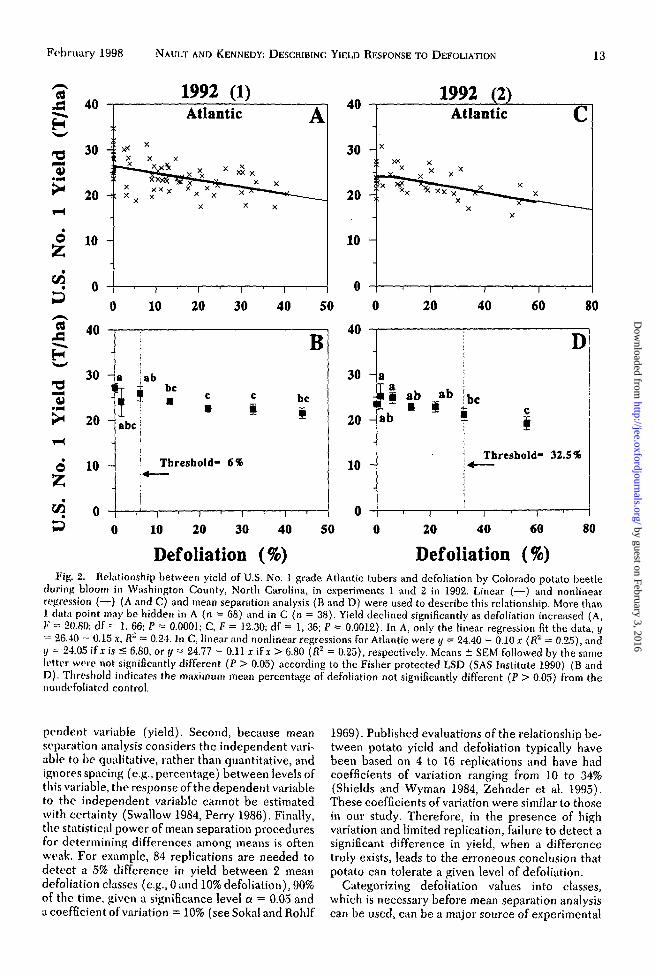
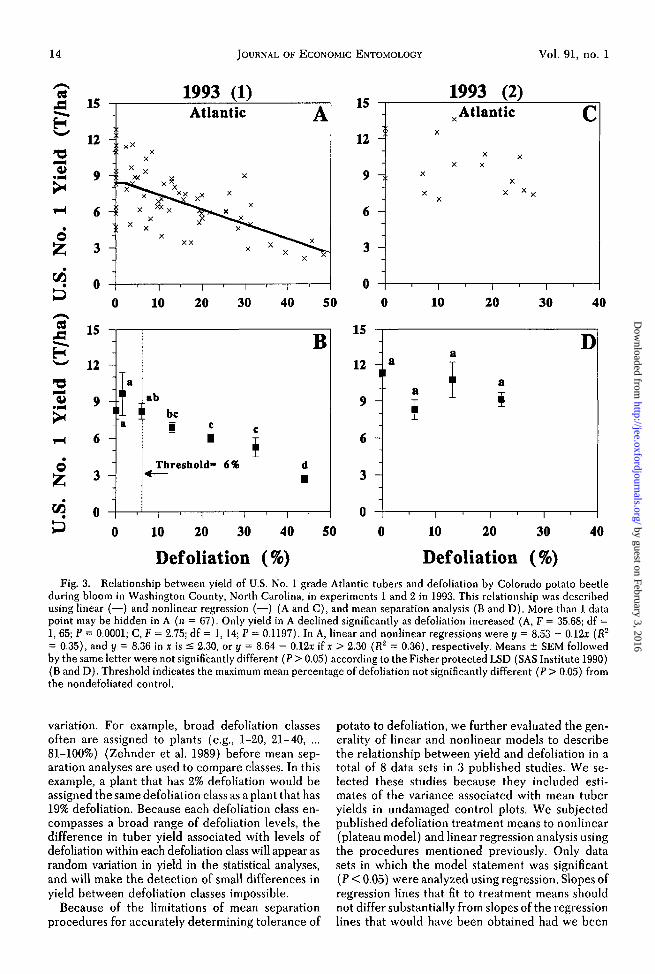
Atlantic Yield Experiments. Defoliation by Col-orado potato beetles significantly reduced yields ofmarketable and U.S. No.1 tubers in all cases exceptin the 1993 experiment (2) (Table 1; Figs. 1 A andC, 2 A and C, 3 A and C). The relationship betweenyield and defoliation was described by a plateau(nonlinear) model in 4 of the 6 experiments, sug-gesting that Atlantic potato could withstand up to1.8 (1991 [1)), 13 (1991 [2)),6.8 (1992 [2]), and2.3% (1993 [1]) defoliation during bloom withoutyield loss (Figs. 1 A and C, 2C, and 3A). However,the 95% CIs for these levels of defoliation werelarge--33.98-37.59% (1991 [1)), -10.60-36.60%(1991 [2]), -15.92-29.52% (1992 [2]), and -9.04-13.64% (1993 [1]) -indicating that the reliability ofthese estimates of potato tolerance to defoliation islimited. Additionally, a plateau model accounted fornearly identical proportions of total variation inyield as a negative linear model (R2 = 0.41 and 0.41(1991 [1)),0.34 and 0.32 (1991 [2)),0.25 and 0.25(1992 [2]), and 0.36 and 0.35 (1993 [1]) for theplateau and negative linear models, respectively). Aplateau model did not fit data from the 1992 Atlanticexperiment I (Fig. 2A). A negative linear modelprovided a significant fit to data in 5 of6 experimentsand slopes of the regression lines for each of theseexperiments were -0.12, -0.10, -0.15, -0.10, and-0.12 T /ha per the percentage of defoliation in the1991 (1),1991 (2),1992 (1),1992 (2), and 1993 (1)experiments, respectively.
Mean separation analyses on the same data setsindicated that mean U.S. No.1 tuber yields from thedefoliation classes up to 44 (1991 [1 and 2]), up to6 (1992 [1] and 1993 [1]), up to 32.5 (1992 [2]), andup to 22% (1993 [2]) were not significantly differentfrom the nondefoliated control, suggesting that po-tato could tolerate at least 44 (Fig. 1 Band D), 6(Fig. 2B and 3B), 32.5 (Fig. 2D), and 22% (Fig. 3D)defoliation during bloom without yield loss, respec-tively. Coefficients of variation for yield of U.S. No.1 tubers from nondefoliated plots in these experi-ments were 32 (1991 [1]),20 (1991 [2]),14 (1992
by guest on February 3, 2016http://jee.oxfordjournals.org/
Dow
nloaded from
February 1998 NAULT AND KENNEDY: DESCRIBING YIELD RESPONSE TO DEFOLIATION 11
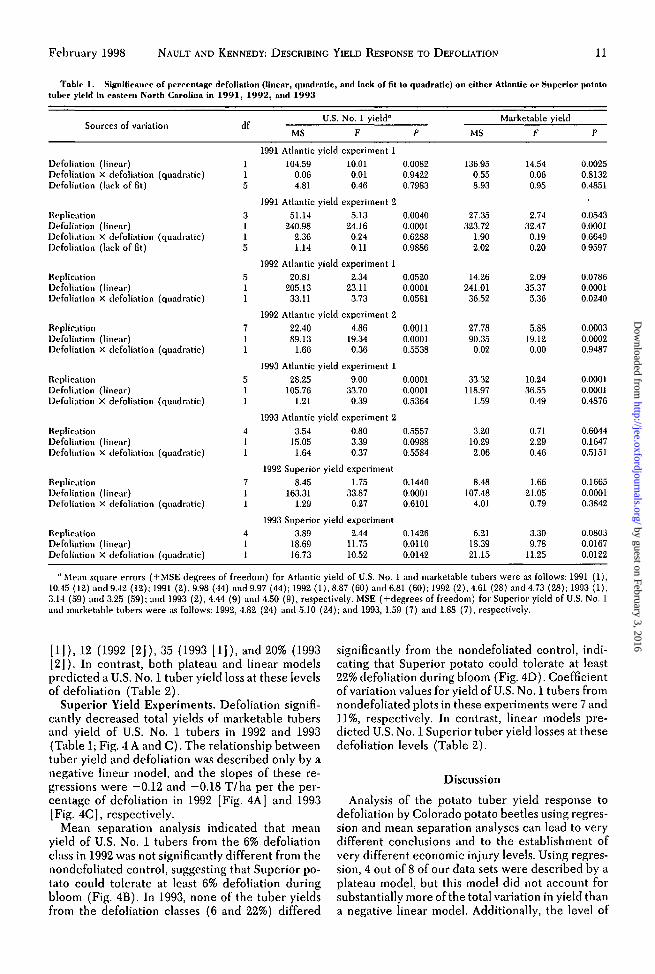
Tab\,> I. Si!(11mcanceof per<entage defoliation (linear, quadratic, and lack of /it to quadratic) on either Atlantic or Superior potatotuber yield in ea"ternl"ortb Carolina in 1991, 1992, and 1993
Sources of variation dFU.S. No.1 yield" Marketable yield
MS F P MS F P
1991 Atlantic yield experiment 1DeFoliation (linear) 1 104.59 10.01 0.0082 136.95 14.54 0.0025Dt'Foliation x deFoliation (quadratic) 1 0.06 0.01 0.9422 0.55 0.06 0.8132D"Foliation (lack of lit) 5 4.81 0.46 0.7983 8.93 0.95 0.4851
1991 Atlantic yield experiment 2Rt'plication 3 51.14 5.13 0.0040 27.35 2.74 0.0543Defoliation (linear) I 240.98 24.16 0.0001 323.72 32.47 0.0001D<'foliation X defoliation (quadratic) 1 2.36 0.24 0.6288 1.90 0.19 0.6649Defoliation (lack of lit) 5 1.14 0.11 0.9886 2.02 0.20 0.9597
1992 Atlantic yield experiment 1Rt'plication 5 20.81 2.34 0.0520 14.26 2.09 0.0786Dt-Foliation (linear) 1 205.13 23.11 0.0001 241.01 35.37 0.0001Dt'Foliation X dt'Foliation (quadratic) 1 33.11 3.73 0.0581 36.52 5.36 0.0240
1992 Atlantic yield experiment 2Replkation 7 22.40 4.86 0.0011 27.78 5.88 0.0003D••foliation (lint"") I 89.13 19.34 0.0001 90.35 19.12 0.0002Defoliation X defoliation (quadratic) 1 1.66 0.36 0.5538 0.02 0.00 0.9487
1993 Atlantic yield experiment 1Heplication 5 28.25 9.00 0.0001 33.32 10.24 0.0001Dt'Foliation (linear) 1 105.76 33.70 0.0001 118.97 36.55 0.0001D••foliation X defoliation (quadratic) I 1.21 0.39 0.5364 1.59 0.49 0.4876
1993 Atlantic yield experiment 2Rt'plication 4 3.54 0.80 0.5557 3.20 0.7] 0.6044DeFoliation (linear) 1 15.05 3.39 0.0988 10.29 2.29 0.1647Dt'foliation X defoliation (quadratic) 1 1.64 0.37 0.5584 2.06 0.46 0.5151
1992 Superior yield experimentReplication 7 8.45 1.75 0.1440 8.48 1.66 0.1665Dt'foliation (Iint'ar) I 163.31 33.87 0.0001 107.48 21.05 0.0001Dt'foliation X dt'foliation (quadratic) 1 1.29 0.27 0.6101 4.01 0.79 0.3842
1993 Superior yield experimentReplication 4 3.89 2.44 0.1426 6.21 3.30 0.0803DeFoliation (liIlt'ar) 1 18.69 11.75 0.0110 18.39 9.78 0.0167Dt'Foliation X dt'Foliation (quadratic) 1 16.73 10.52 0.0142 21.15 11.25 0.0122
"Mean square errors (+MSE degrees of freedom) for Atlantic yield of U.S. No.1 and marketable tubers were as follows: 1991 (1).10.45 (12) and 9.42 (12); 1991 (2),9.98 (44) and 9.97 (44); 1992 (1),8.87 (60) and 6.81 (60); 1992 (2),4.61 (28) and 4.73 (28); 1993 (1),3.14 (59) and 3.25 (59); and 1993 (2).4.44 (9) and 4.50 (9). respectively. MSE (+degrees of Freedom) for Superior yield of U.S. No. Iand marketable tubers were as follows: 1992, 4.82 (24) and 5.10 (24); and 1993, 1.59 (7) and 1.88 (7), respectively.
(1]),12 (1992 [2]),35 (1993 [1]), and 20% (1993[2] ). In contrast, both plateau and linear modelspredicted a U.S. No.1 tuber yield loss at these levelsof defoliation (Table 2).
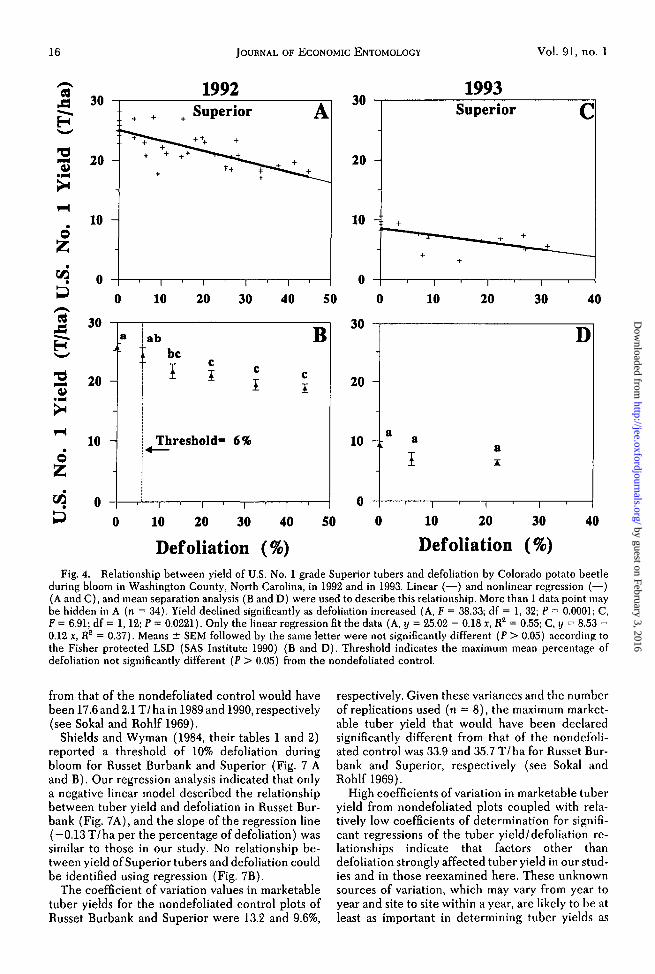
Superior Yield Experiments. Defoliation signifi-cantly decreased total yields of marketable tubersand yield of U.S. No. 1 tubers in 1992 and 1993(Table 1;Fig. 4 A and C). The relationship betweentuber yield and defoliation was described only by anegative linear model, and the slopes of these re-gressions were -0.12 and -0.18 T/ha per the per-centage of defoliation in 1992 [Fig. 4A] and 1993[Fig. 4C], respectively.
Mean separation analysis indicated that meanyield of U.S. No.1 tubers from the 6% defoliationclass in 1992 was not significantly different from thenondefoliated control, suggesting that Superior po-tato could tolerate at least 6% defoliation duringbloom (Fig. 4B). In 1993, none of the tuber yieldsfrom the defoliation classes (6 and 22%) differed
significantly from the nondefoliated control, indi-cating that Superior potato could tolerate at least22% defoliation during bloom (Fig. 4D). Coefficientof variation values for yield of U.S. No.1 tubers fromnondefoliated plots in these experiments were 7 and11%, respectively. In contrast, linear models pre-dicted U.S. No.1 Superior tuber yield losses at thesedefoliation levels (Table 2).
Discussion
Analysis of the potato tuber yield response todefoliation by Colorado potato beetles using regres-sion and mean separation analyses can lead to verydifferent conclusions and to the establishment ofvery different economic injury levels. Using regres-sion, 4 out of 8 of our data sets were described by aplateau model, but this model did not account forsubstantially more of the total variation in yield thana negative linear model. Additionally, the level of
by guest on February 3, 2016http://jee.oxfordjournals.org/
Dow
nloaded from
12 JOURNALOF ECONOMICENTOMOLOGY Vol. 91, no. 1
- 1991 (1) 1991 (2)~..Cl 2S Atlantic A 25 Atlantic C~-- 20 20 lC
~ x"CS x xx- ~ x xcu 15 15••• x~ x1""'4 10 10 x
·0 xZ S 5
·~ 0 0·~ 0 20 40 60 80 0 20 40 60 80-~ 25 25-= B~ D- 20 - 20 -"CS a
.sbab i- a. a ab iCU 15 ~ a a 15 ~! ! r..• ! a be:
~ I ! e:
! ! ! e:1""'4 10 - 10 -· Threshold- 44 CJ. i "Q -+1Z 5 - 5 - !
·~ 0 0· I
~ 0 20 40 60 80 0 20 40 60 80Defoliation (%) Defoliation (%)
Fig. 1. Relationship between yield of U.S. No.1 grade Atlantic tubers and percentage of defoliation by Coloradopotato beetle during bloom in Washington (A and B) and Carteret counties, North Carolina (C and D), in 1991(experiments 1 and 2, respectively). This relationship was described using linear (-) and nonlinear regression (-) (Aand C), and mean separation analysis (B and D). More than one data point may be hidden in A (n = 20) and in C (II= 55). Yield declined significantly as defoliation increased (A, F = 12.58; df = 1, 18; P = 0.0023; C. F = 25.18; df = 1,53; P = 0.0001). In A, linear and nonlinear regressions were y = 15.69 - 0.12 x (R2 = 0.41), and y = 15.55 if x is $ 1.80,or y = 15.78 - 0.13 x if x> 1.80 (R2 = 0.41), respectively. In C, linear and nonlinear regressions were y = 16.17 - 0.10x (R2 = 0.32), and y = 15.40 if x is $ 13.00, or y = 16.93 - 0.12 x if x> 13.00 (R2 = 0.34), respectively. Means ±SEMfollowed by the same letter were not significantly different (P > 0.05) according to the Fisher protected LSD (SASInstitute 1990) (B and D). Threshold indicates the maximum mean percentage of defoliation not significantly different(P > 0.05) from the nondefoliated control.
defoliation that the plateau model indicated thatpotato could tolerate varied considerably amongexperiments. A negative linear model described 7 of8 data sets. For Atlantic, the average (::!:SEM) slopesof the linear regressions between yield of U.S. No.1 tubers and percentage defoliation during bloomwas -0.12 ::!: 0.01 T/ha per the percentage of de-foliation (n = 5), whereas the slopes of regressionsbetween Superior tuber yield and defoliation duringbloom was -0.15 ::!:0.03 T/ha per the percentage ofdefoliation (n = 2). A negative linear model impliesthat each incremental increase in defoliation (eventhe removal of a single leaf) results in a correspond-ing reduction in tuber yield. Because most plants areable to compensate for herbivory to some extent
(see review by Trumble et al. 1993), a linear modelis likely to be biologically unrealistic and overlyconservative. Perhaps, for this reason, many re-searchers have assumed that potato can tolerateconsiderable defoliation during bloom, and haveused mean separation analyses to determine toler-ance levels (see introduction).
There are limitations associated with the use ofmean separation analyses to describe crop yieldresponse to defoliation, which are also problematic.For example, the biological relationship betweenyield and defoliation cannot be fully understoodusing mean separation procedures, because such anapproach tests only for effects of selected levels ofthe independent variable (defoliation) on the de-
by guest on February 3, 2016http://jee.oxfordjournals.org/
Dow
nloaded from
Ft>l)!'uary 1998 NAULT AND KENNEDY: DESCRIBINC YIELD RESPONSE TO DEFOLIATION 13- 1992 (1) 1992 2=..d 40 Atlantic A40 Atlantic CE=;- 30 >«
x 30 x"0 x x x >¢( x- x OS: x ,& x x x xQJ x xx x.... x x x x ~x x~ x xx x x x 20 x20 x x x x x
X
x x x x,-j x
•0 10 10Z
•l:I.:l 0 0·i:J 0 10 20 30 40 50 0 20 40 60 80-= 40 40..c: B DI-~- 30 8 lab 30 a"t:S ! be aab ab lbc- e e be ~~ • ,.... • , , • , c
~ 20 abc: 20 ab ,,-j
: Threshold- 32.5"· 10 - Threshold- 6'-' 10 ;+--eZ .+--
•l:I.:l 0 0·j:;J 0 10 20 30 40 50 0 20 40 60 80
Defoliation (%) Defoliation (%)Fi~. 2. Rdationship between yield of U.S. No.1 grade Atlantic tubers and defoliation by Colorado potato beetle
during bloom in Wllshington County, North Carolina, in experiments 1 and 2 in 1992. Linear (-) and nonlinearregression (-) (A and C) and mean separation analysis (B and D) were used to describe this relationship. More than1 data point may be hidden in A (n = 68) and in C (n == 38). Yield declined significantly as defoliation increased (A,l<''" 20.80; df = 1, 66; P = 0.0001; C, F = 12.30; df = 1, 36; P = 0.0012). In A, only the linear regression fit the data, y== 26.40 - 0.15 X, R2 = 0,24. In C, linear and nonlinear regressions for Atlantic were y = 24.40 - 0.10 x (R2 == 0.25), andy = 24.05 if x is ~ 6.80, or y == 24.77 - 0.11 x if x > 6.80 (R2 = 0.25), respectively. Means :t SEM followed by the sameletter WI'\"(' not si!!;nificantly different (P > 0.05) according to the Fisher protected LSD (SAS Institute 1990) (B andD). Thrt'shold indicates the maximum mean percentage of defoliation not significantly different (P > 0.05) from thenondt'foliated control.
p£'ndent variable (yield). Second, because means{'paration analysis considers the independent vari-abl£' to be qualitative, rather than quantitative, andignores spacing (e.g., percentage) between levels ofthis variable, the response of the dependent variableto the independent variable cannot be estimatedwith certainty (Swallow 1984, Perry 1986). Finally,tIlt' statistical power of mean separation proceduresfor determining differences among means is oftenweak. For example, 84 replications are needed todetect a 5% difference in yield between 2 meandefoliation classes (e.g., 0 and 10%defoliation), 90%of the time, given a significance level a = 0.05 andu coefficient of variation = 10% (see Sobl and Rohlf
1969), Published evaluations of the relationship be-tween potato yield and defoliation typically havebeen based on 4 to 16 replications and have hadcoefficients of variation ranging from 10 to 34%(Shields and Wyman 1984, Zehnder et al. 1995).These coefficients of variation were similar to thosein our study, Therefore, in the presence of highvariation and limited replication, failure to detect asignificant difference in yield, when a differencetruly exists, leads to the erroneous conclusion thatpotato can tolerate a given level of defoliation.
Categorizing defoliation values into classes,which is necessary before mean separation analysiscan be used, can be a major source of experimental
by guest on February 3, 2016http://jee.oxfordjournals.org/
Dow
nloaded from
JOURNAL OF ECONOMIC ENTOMOLOGY
1993 (2)Atlantic
X c
Vol. 91, no. 1
x
xx Xx
xX X
x
x
x
x9
6
3
15
12
A1993 (1)Atlantic
XX
XX
3
6
9
15
12
QZ
-=..c:l-E-c-14
9-!at",a j
6 -
20 40
D
30
8
!
8
!
10
8
8
oo
6
9
12
15
so
B
40
c
30
c•
2010oo
15
12 -
-=..=-E-c-QZ 3 -
. Threshold- 6"i+-
d
• 3
10 20 30 40
Defoliation (%) Defoliation (%)
oo
I I I I
SOo
o 10 20 30 40
Fig. 3. Relationship between yield of U.S. No.1 grade Atlantic tubers and defoliation by Colorado potato beetleduring bloom in Washington County, North Carolina, in experiments 1 and 2 in 1993. This relationship was describedusing linear (-) and nonlinear regression (-) (A and C), and mean separation analysis (B and D). More than 1 datapoint may be hidden in A (n = 67). Only yield in A declined significantly as defoliation increased (A, F = 35.68; df =1,65; P = 0.0001; C, F = 2.75; df = I, 14; P = 0.1197). In A, linear and nonlinear regressions were y = 8.53 - 0.12x (R2= 0.35), and y = 8.36 in x is :5 2.30, or y = 8.64 - 0.12x if x > 2.30 (R2 = 0.36), respectively. Means ± SEM followedby the same letter were not significantly different (P> 0.05) according to the Fisher protected LSD (SAS Institute 1990)(B and D). Threshold indicates the maximum mean percentage of defoliation not significantly different (P > 0.05) fromthe non defoliated control.
variation. For example, broad defoliation classesoften are assigned to plants (e.g., 1-20, 21- 40, ...81-100%) (Zehnder et al. 1989) before mean sep-aration analyses are used to compare classes. In thisexample, a plant that has 2% defoliation would beassigned the same defoliation class as a plant that has19% defoliation. Because each defoliation class en-compasses a broad range of defoliation levels, thedifference in tuber yield associated with levels ofdefoliation within each defoliation class will appear asrandom variation in yield in the statistical analyses,and will make the detection of small differences inyield between defoliation classes impossible.
Because of the limitations of mean separationprocedures for accurately determining tolerance of
potato to defoliation, we further evaluated the gen-erality of linear and nonlinear models to describethe relationship between yield and defoliation in atotal of 8 data sets in 3 published studies. We se-lected these studies because they included esti-mates of the variance associated with mean tuberyields in undamaged control plots. We subjectedpublished defoliation treatment means to nonlinear(plateau model) and linear regression analysis usingthe procedures mentioned previously. Only datasets in which the model statement was significant(P < 0.05) were analyzed using regression. Slopes ofregression lines that fit to treatment means shouldnot differ substantially from slopes of the regressionlines that would have been obtained had we been
by guest on February 3, 2016http://jee.oxfordjournals.org/
Dow
nloaded from
February 1998 NAULT AND KENNEDY: DESCRIBING YIELD RESPONSE TO DEFOLIATION 15
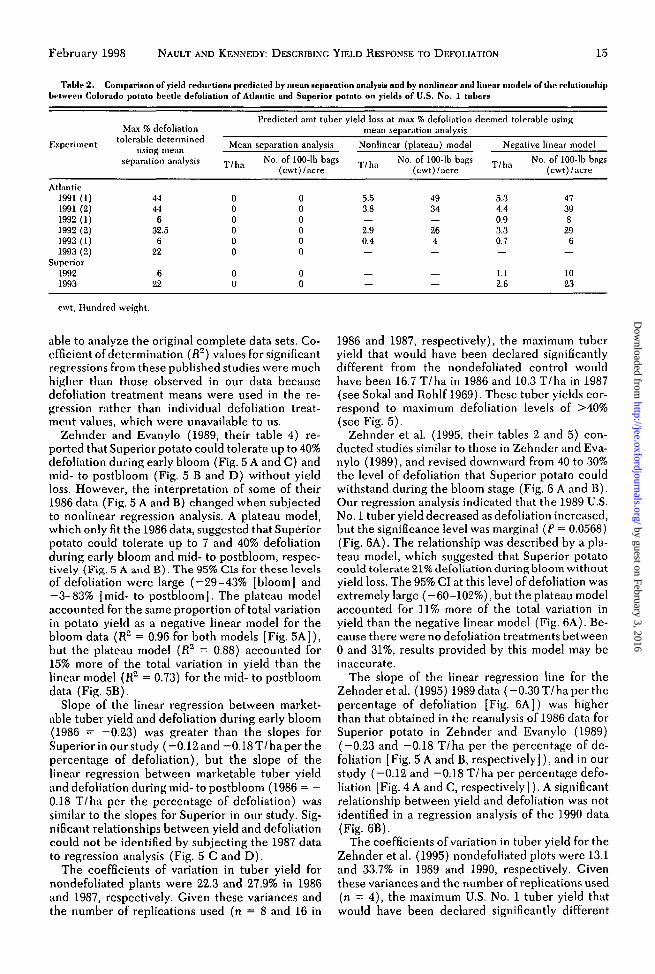
Tobit, 2. Comparison of yield reductions predicted by menn separation analysis and by nonlinear anti linear Illodel~ oflhe relulionshipIwlw••••n Colorado potato beede deroliation or Adantic and Snperior polalo on yields or u.s. No. 1 lnbers
Experiment
Atlantic]991 (])1991 (2)1992 (])1992 (2)1993 (1)1993 (2)
Superior19921993
Max % defoliationtolerable determined
usin~ meanseparation analysis
44446
32.56
22
622
Predicted amt tuber yield loss at max % defoliation deemed tolerable usin!!;mean separation analysis
Mean separation analysis Nonlinear (plateau) model Ne!!;ative linear model
T/ha No. of 100-lb bags T/ha No. of 100-lb ba!,:s T/ha No. of 100-lb ba!!;s(ewt)/aere (ewt)/aere (ewt) laere
0 0 5.5 49 5.3 470 0 3.8 34 4.4 390 0 0.9 80 0 2.9 26 3.3 290 0 0.4 4 0.7 60 0
0 0 1.1 100 0 2.6 23
cwt. Hundred wei!,:ht.
able to analyze the original complete data sets. Co-efficient of determination (R2) values for significantregressions from these published studies were muchhigher than those observed in our data becausedefoliation treatment means were used in the re-gression rather than individual defoliation treat-ment values, which were unavailable to us.
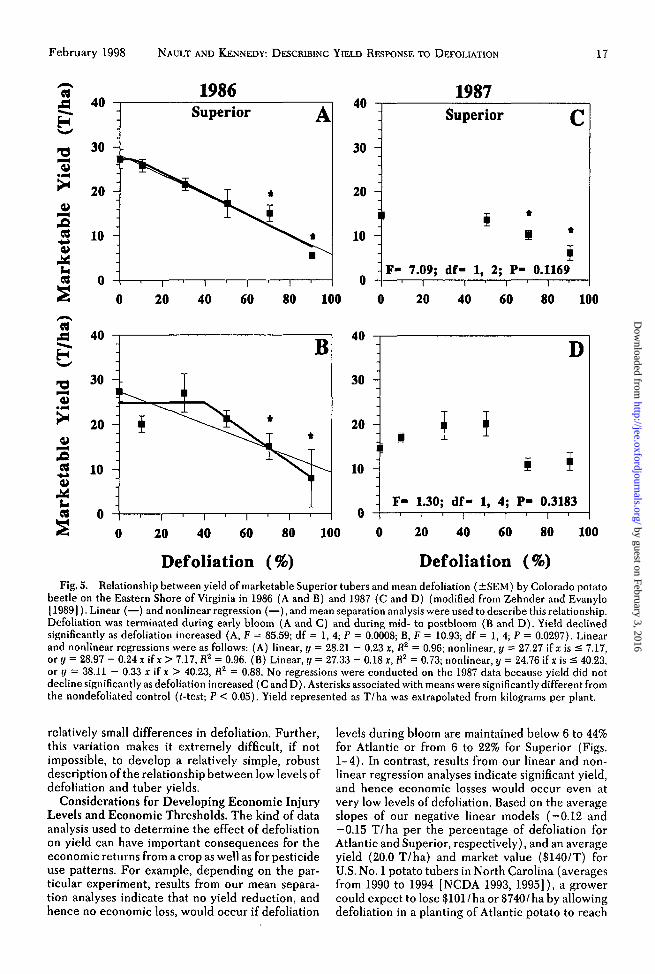
Zehnder and Evanylo (1989, their table 4) re-ported that Superior potato could tolerate up to 40%defoliation during early bloom (Fig. 5 A and C) andmid- to postbloom (Fig. 5 B and D) without yieldloss. However, the interpretation of some of their1986 data (Fig. 5 A and B) changed when subjectedto nonlinear regression analysis. A plateau model,which only fit the 1986 data, suggested that Superiorpotato could tolerate up to 7 and 40% defoliationduring early bloom and mid- to postbloom, respec-tively (Fi~. 5 A and B). The 95% CIs for these levelsof defoliation were large (-29-43% [bloom] and-3- 83% [mid- to postbloom]. The plateau modelaccounted for the same proportion of total variationin potato yield as a negative linear model for thebloom data (R2 = 0.96 for both models [Fig. 5A]),but the plateau model (R2 = 0.88) accounted for15% more of the total variation in yield than thelinear model (R2 = 0.73) for the mid- to postbloomdata (Fig. 5B).
Slope of the linear regression between market-able tuber yield and defoliation during early bloom(1986 = -0.23) was greater than the slopes forSuperior in our study (-0.12 and -0.18 T fhaper thepercentage of defoliation), but the slope of thelinear regression between marketable tuber yieldand defoliation during mid- to postbloom (1986 = -0.18 T f ha per the percentage of defoliation) wassimilar to the slopes for Superior in our study. Sig-nificant relationships between yield and defoliationcould not be identified by subjecting the 1987 datato regression analysis (Fig. 5 C and D).
The coefficients of variation in tuber yield fornondefoliated plants were 22.3 and 27.9% in 1986and 1987, respectively. Given these variances andthe number of replications used (n = 8 and 16 in
1986 and 1987, respectively), the maximum tuberyield that would have been declared significantlydifferent from the nondefoliated control wouldhave been 16.7 Tfha in 1986 and 10.3 Tfha in 1987(see Sokal and Rohlf 1969). These tuber yields cor-respond to maximum defoliation levels of >40%(see Fig. 5).
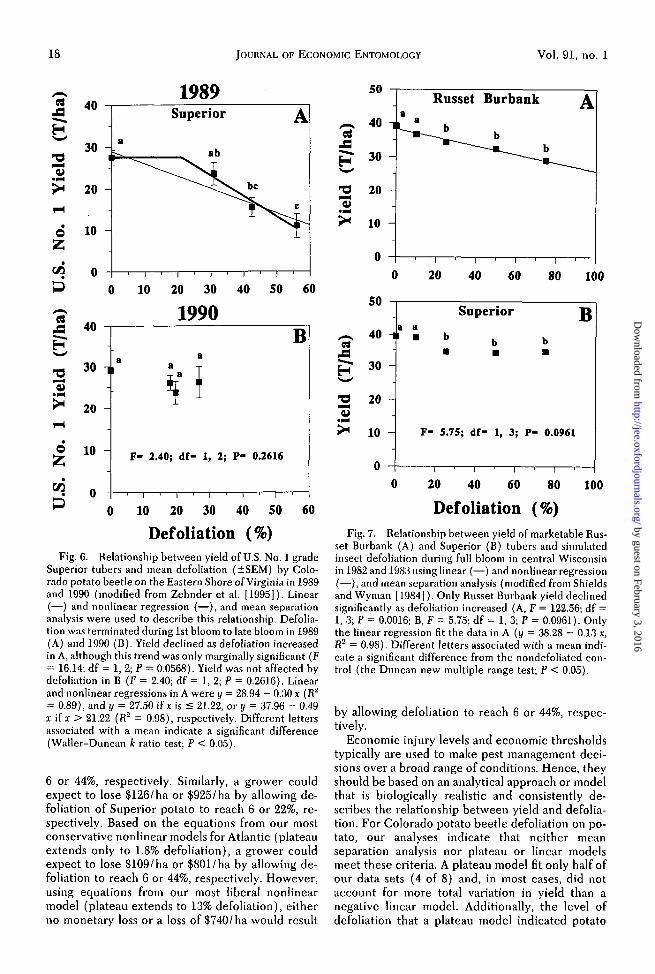
Zehnder et al. (1995, their tables 2 and 5) con-ducted studies similar to those in Zehnder and Eva-nylo (1989), and revised downward from 40 to 30%the level of defoliation that Superior potato couldwithstand during the bloom stage (Fig. 6 A and B).Our regression analysis indicated that the 1989 U.S.No.1 tuber yield decreased as defoliation increased,but the significance level was marginal (P = 0.0568)(Fig. 6A). The relationship was described by a pla-teau model, which suggested that Superior potatocould tolerate 21% defoliation during bloom withoutyield loss. The 95% CI at this level of defoliation wasextremely large (-60-102%), but the plateau modelaccounted for 11% more of the total variation inyield than the negative linear model (Fig. 6A). Be-cause there were no defoliation treatments betweeno and 31%, results provided by this model may beinaccurate.
The slope of the linear regression line for theZehnder et al. (1995) 1989 data (-0.30 T/ ha per thepercentage of defoliation [Fig. 6A]) was higherthan that obtained in the reanalysis of 1986 data forSuperior potato in Zehnder and Evanylo (1989)(-0.23 and -0.18 Tfha per the percentage of de-foliation [Fig. 5 A and B, respectively] ), and in ourstudy (-0.12 and -0.18 T fha per percentage defo-liation [Fig. 4 A and C, respectively]). A significantrelationship between yield and defoliation was notidentified in a regression analysis of the 1990 data(Fig.6B).
The coefficients of variation in tuber yield for theZehnder et al. (1995) non defoliated plots were 13.1and 33.7% in 1989 and 1990, respectively. Giventhese variances and the number of replications used(n = 4), the maximum U.S. No.1 tuber yield thatwould have been declared significantly different
by guest on February 3, 2016http://jee.oxfordjournals.org/
Dow
nloaded from
JOURNAL OF ECONOMIC ENTOMOLOGY16
-~ 30~-:s 20~•••~
+ +
1992+ Superior A 30
20
1993Superior
Vol. 91, no. 1
c
QZ
10 10 +
+
+
+
++
Defoliation (%)
40
40
D
30
aAi:
2010
I
10 20 30Defoliation (%)
a
I
oo
oo
30
20 -
10 _ a
50
50
B
eI
I
40
40
eI
I
30
30
6%
eI
I
20
2010
i
!iii Threshold-!04-!!!
I
labIf bei I!
10
, I
oo
a
oo
30
20 -
10 -.=ZCI3;j
Fig. 4. Relationship between yield of U.S. No.1 grade Superior tubers and defoliation by Colorado potato beetleduring bloom in Washington County, North Carolina, in 1992 and in 1993. Linear (-) and nonlinear regression (-)(A and C), and mean separation analysis (B and D) were used to describe this relationship. More than 1 data point maybe hidden in A (n = 34). Yield declined significantly as defoliation increased (A, F = 38.33; df = 1, 32; P = 0.0001; C,F = 6.91; df = 1,12; P = 0.0221). Only the linear regression fit the data (A, y = 25.02 - 0.18 X, R2 = 0.55; C, y = 8.53 -0.12 X, R2 = 0.37). Means:!: SEM followed by the same letter were not significantly different (P> 0.05) accordinj:!;tothe Fisher protected LSD (SAS Institute 1990) (B and D). Threshold indicates the maximum mean percentage ofdefoliation not significantly different (P> 0.05) from the non defoliated control.
from that of the non defoliated control would havebeen 17.6 and 2.1 T/ ha in 1989 and 1990, respectively(see Sokal and Rohlf 1969).
Shields and Wyman (1984, their tables 1 and 2)reported a threshold of 10% defoliation duringbloom for Russet Burbank and Superior (Fig. 7 Aand B). Our regression analysis indicated that onlya negative linear model described the relationshipbetween tuber yield and defoliation in Russet Bur-bank (Fig. 7A), and the slope of the regression line(-0.13 T Iha per the percentage of defoliation) wassimilar to those in our study. No relationship be-tween yield of Superior tubers and defoliation couldbe identified using regression (Fig. 7B).
The coefficient of variation values in marketabletuber yields for the non defoliated control plots ofRusset Burbank and Superior were 13.2 and 9.6%,
respectively. Given these variances and the numberof replications used (n = 8), the maximum market-able tuber yield that would have been declaredsignificantly different from that of the nondefoli-ated control was 33.9 and 35.7 T/ha for Russet Bur-bank and Superior, respectively (see Sokal andRohlf 1969).
High coefficients of variation in marketable tuberyield from nondefoliated plots coupled with rela-tively low coefficients of determination for signifi-cant regressions of the tuber yield/ defoliation re-lationships indicate that factors other thandefoliation strongly affected tuber yield in our stud-ies and in those reexamined here. These unknownsources of variation, which may vary from year toyear and site to site within a year, are likely to be atleast as important in determining tuber yields as
by guest on February 3, 2016http://jee.oxfordjournals.org/
Dow
nloaded from
February 1998 NAULT AND KENNEDY: DESCRIBING YIELD RESPONSE TO DEFOLIATION 17
-.= 40-E-4'-'
1986Superior A
40 1987Superior c
100
100
D
•
80
80
*!I!
60
60
40
40
20
20
!7.09; dr- 1, 2; P- 0.1169
I I I
F- 1.30; dr- 1, 4; P- 0.3183
o
o
o
10 -
20 -
30 -
o
10
20
30
40
100
100
B
80
80
60
60
40
40
20
20
o
o
o
30
o
10
20
20
30
10
-=-= 40E=4'-''tS-~.-~
Defoliation (%) Defoliation (%)Fig. 5. Relationship between yield of marketable Superior tubers and mean defoliation (±SEM) by Colorado potato
beetle on the Eastern Shore of Virginia in 1986 (A and B) and 1987 (C and D) (modified from Zehnder and Evanylo[1989]). Linear (-) and nonlinear regression (-). and mean separation analysis were used to describe this relationship.Defoliation was terminated during early bloom (A and C) and during mid- to postbloom (B and D). Yield declinedsignificantly as defoliation increased (A, F = 85.59; df = 1,4; P = 0.0008; B, F = 10.93; df = 1,4; P = 0.0297). Linearand nonlinear regressions were as follows; (A) linear, y = 28.21 - 0.23 X, R2 = 0.96; nonlinear, y = 27.27 if x is ~ 7.17,or y = 28.97 - 0.24 x if x> 7.17, R2 = 0.96. (B) Linear, y = 27.33 - 0.18 x, R2 = 0.73; nonlinear, y = 24.76 if x is ~ 40.23,or y = 38.11 - 0.33 x if x > 40.23, R2 = 0.88. No regressions were conducted on the 1987 data because yield did notdecline significantly as defoliation increased (C and D). Asterisks associated with means were significantly different fromthe nondefoliated control (t-test; P < 0.05). Yield represented as T/ha was extrapolated from kilograms per plant.
relatively small differences in defoliation. Further,this variation makes it extremely difficult, if notimpossible, to develop a relatively simple, robustdescription of the relationship between low levels ofdefoliation and tuber yields.
Considerations for Deve]oping Economic InjuryLevels and Economic Thresholds. The kind of dataanalysis used to determine the effect of defoliationon yield can have important consequences for theeconomic returns from a crop as well as for pesticideuse patterns. For example, depending on the par-ticular experiment, results from our mean separa-tion analyses indicate that no yield reduction, andhence no economic loss, would occur if defoliation
levels during bloom are maintained below 6 to 44%for Atlantic or from 6 to 22% for Superior (Figs.1- 4). In contrast, results from our linear and non-linear regression analyses indicate significant yield,and hence economic losses would occur even atvery low levels of defoliation. Based on the averageslopes of our negative linear models (-0.12 and-0.15 T/ha per the percentage of defoliation forAtlantic and Superior, respectively), and an averageyield (20.0 T/ha) and market value ($140/T) forU.S. No.1 potato tubers in North Carolina (averagesfrom 1990 to 1994 [NCDA 1993, 1995]), a growercould expect to lose $101/ha or $740/ ha by allowingdefoliation in a planting of At]antic potato to reach
by guest on February 3, 2016http://jee.oxfordjournals.org/
Dow
nloaded from
18 JOURNAL OF ECONOMIC ENTOMOLOGY Vol. 91, no. 1
10020 40 60 80Defoliation (%)
F- 5.75; dr- 1, 3; P- 0.0961
oo
00 20 40 60 80 100
SOSuperior B
40 8 8• b b b
• • •30
20
10
by allowing defoliation to reach 6 or 44%, respec-tively.
Economic injury levels and economic thresholdstypically are used to make pest management deci-sions over a broad range of conditions. Hence, theyshould be based on an analytical approach or modelthat is biologically realistic and consistently de-scribes the relationship between yield and defolia-tion. For Colorado potato beetle defoliation on po-tato, our analyses indicate that neither meanseparation analysis nor plateau or linear modelsmeet these criteria. A plateau model fit only half ofour data sets (4 of 8) and, in most cases, did notaccount for more total variation in yield than anegative linear model. Additionally, the level ofdefoliation that a plateau model indicated potato
Fig. 7. Relationship between yield of marketable Rus-set Burbank (A) and Superior (B) tubers and simulatedinsect defoliation during full bloom in central Wisconsinin 1982 and 1983 using linear (-) and nonlinear regression(-), and mean separation analysis (modified from Shieldsand Wyman [19841). Only Russet Burbank yield declinedsignificantly as defoliation increased (A, F = 122.56; df =1,3; P = 0.0016; B, F = 5.75; df = 1,3; P = 0.0961). Onlythe linear regression fit the data in A (y = 38.28 - 0.13 x,R2 = 0.98). Different letters associated with a mean indi-cate a significant difference from the nondefoliated con-trol (the Duncan new multiple range test; P < 0.05).
60
1989 50BurbankRusset A
Superior A a40 a-=..c::lab - 30E-4-"t:l 20-~....•
;>c 10
10 20 30 40 SO 601990
B -~a -=¥ ! E:4-"t:l-~....•;>c
F- 2.40; df- 1, 2; P- 0.2616
o+-,--,---.---,--,----,r-.----.-r-rl--.--j
10 20 30 40 50Defoliation (%)
o
40
30 a
20
10
00
40
30 .,a
20 -~
C 10-Z
cz
"t:l-~.....;>c
"t:l-~....•;>c
-=..c::l-E-t-
Fig. 6. Relationship between yield of U.S. No.1 gradeSuperior tubers and mean defoliation (2:SEM) by Colo-rado potato beetle on the Eastern Shore of Virginia in 1989and 1990 (modified from Zehnder et al. [1995]). Linear(-) and nonlinear regression (-), and mean separationanalysis were used to describe this relationship. Defolia-tion was terminated during 1st bloom to late bloom in 1989(A) and 1990 (B). Yield declined as defoliation increasedin A, although this trend was only marginally significant (F= 16.14; df = 1,2; P = 0.0568). Yield was not affected bydefoliation in B (F = 2.40; df = 1,2; P = 0.2616). Linearand nonlinear regressions in A were y = 28.94 - 0.30 x (R2
= 0.89), and y = 27.50 if x is:5 21.22, or y = 37.96 - 0.49x if x> 21.22 (R2 = 0.98), respectively. Different lettersassociated with a mean indicate a significant difference(Waller-Duncan k ratio test; P < 0.05).
6 or 44%, respectively. Similarly, a grower couldexpect to lose $126/ha or $925/ha by allowing de-foliation of Superior potato to reach 6 or 22%, re-spectively. Based on the equations from our mostconservative nonlinear models for Atlantic (plateauextends only to 1.8% defoliation), a grower couldexpect to lose $109/ha or $801lha by allowing de-foliation to reach 6 or 44%, respectively. However,using equations from our most liberal nonlinearmodel (plateau extends to 13% defoliation), eitherno monetary loss or a loss of $740/ha would result
by guest on February 3, 2016http://jee.oxfordjournals.org/
Dow
nloaded from
February 1998 NAULT AND KENNEDY: DESCRIBINC YIELD RESPONSE TO DEFOLIATION 19
could tolerate with no reduction in yield variedconsiderably among experiments. Therefore, theplateau model fails to meet the criterion of consis-tt:>ncy. Although a negative linear model fit the datamore consistently (7 of 8 data sets), it almost cer-tainly overestimates the effects of low levels of de-foliation on yield and therefore is not likely to bebiologically realistic. The extent to which departurefrom biological realism is important in the real worldof pest management decision making depends on anumber of factors including economic, environmen-tal, human health, and insecticide resistance risksassociated with managing a pest to prevent yieldloss, as well as the risk aversion level of the farmerson whose crop the model will be used as a pestmanagement decision aid. Unfortunately, both thehigh variation inherent in potato yields and logis-tical constraints associated with obtaining and ver-ifying a range of defoliation levels sufficiently broadand adequately replicated to provide an adequatedata set are likely to preclude the development of ardatively simple, biologically realistic, robust sta-tistical model describing the effects of defoliationon tuber yields. Therefore, until this situation isresolved, perhaps by an alternative modeling ap-proach, the selection of the most appropriate modelto use in a given situation must depend on a sub-jective weighting of economic consequences andrisk factors llssociated with various pest manage-ment decision criteria and options.
Acknowledgments
We thank C. Brownie (Department of Statistics, NorthCarolina State University) for her statistical advice, and S.Costa, F. Gould, C. Sorenson, J. Van Duyn (Department ofEntomology, North Carolina State University) and severalanonymous reviewers for critiquing earlier versions of themanuscript. We also thank D. Afra, T. Bacheler, C. Berger,B. Bumgarner, V. Covington, M. Etheridge, M. Hanzlik, A.Hilbeck, C. Hookes, P. Follett, N. French II, J. Phillips, andT. Smith for their assistance in the field. This material isbased on work supported by the USDA-ARS and the NorthCarolina Agricultural Research Service under Specific Co-operative Agreement No. 92-34103-6933 from the USDACSRS SRIPM, entitled "Integrated Management of Colo-rado Potato Beetle Using Action Thresholds, Genetic, Mi-crobial and Cultural Controls."
References Cited
Cranshaw, W. S., and E. B. Radcliffe. 1980. Effect of de-foliation on yield of potatoes. J. Econ. Entomo\. 73:131-134.
Dripps, J. E., and Z. Smilowitz. 1989. Growth analysis ofpotato plants damaged by Colorado potato beetle (Co-leoptera: Chrysomelidae) at different plant growthstages. Environ. Entomo!. 18: 854-867.
Entz, M. H., and I" J. LaCroix. 1984. The effect of in-rowspacing and seedtype on the yield and quality of potatocultivar. Am. Potato J. 61: 93-105.
Ferro, D. N., B. J. MOI'wch, and D. Margolies. 1983. Croploss assessment of the Colorado potato beetle (Co-
leoptera: Chrysomelidae) on potatoes in western Mas-sachusetts. J. Econ. Entomo\. 76: 349-356.
Hare, J. D. 1980. Impact of defoliation by Colorado po·tato beetle on potato yields. J. Econ. Entomo\. 73:369-373.
1990. Ecology and management of the Colorado potatobeetle. Annu. Rev. Entomo1. 35: 81-100.
Jones, D. 1984. Use, misuse, and role of multiple-compar-ison procedures in ecological and agricultural ento-mology. Environ. Entomo1. 13: 635-649.
Little, T. M, and F. J. Hills. 1978. Agricultural experimen-tation: design and analysis. Wiley, New York.
Mailloux, G., M. R. Binns, and N. J. Bostanian. 1991. Den-sity yield relationships and economic injury levelmodel for the Colorado potato beetle larvae on pota-toes. Res. Popu\. Eco1. 33: 101-113.
Mailloux, G., N. J. Bostanian, and M. R. Binns. 1995. Dcn-sity-yield relationships for Colorado pot<\to beetleadults on potatoes. Phytoparasitica 23: 101-118.
Nault, B. A., P. A. Follett, F. Gould, and C. G. Kennedy.1995. Assessing compensation for insect damage inmixed plantings of resistant and susceptible potatoes.Am. Potato J. 72: 157-176.
[NCDA] NOI·th Carolina Department of Agriculture.1993. North Carolina agricultural statistics 1993. Re-port No. 176. North Carolina Agricultural Statistics,Raleigh, NC.
1995. North Carolina agricultural statistics 1995. ReportNo. 180. North Carolina Agricultural Statistics, Raleigh,NC.
Pedigo, I" P. 1989. Entomology and pest management.Macmillan, New York.
Pedigo, L. P., and L. G. Higley. 1992. The economic injurylevel concept and environmental quality: a new per-spective. Am. Entomo1. 38: 34-39.
Pedigo, I" P., S. H. Hutchins, and L. G. Higley. 1986.Economic injury levels in theory and practice. Annu.Rev. Entomo1. 31: 341-368.
Perry, J. N. 1986. Multiple-comparison procedures: a dis-senting view. J. Econ. Entomo\. 79: 1149-1155.
Poston, F. 1", L. P. Pedigo, and S. M. Welch. 1983. Eco-nomic injury levels: reality and practicality. Bul\. En-tomo\. Soc. Am. 29: 49-53.
Rex, B. L., W. A. Russell, and H. R. Wolfe. 1987. Thceffect of spacing of seedpieces on yield, quality andeconomic value for processing of shepody potatoes inManitoba. Am. Potato J. 64: 177-189.
SAS Institute. 1990. SASISTAT user's guide, version 6,4th ed. SAS Institute, Cary, NC.
Senanayake, D. G., and N. J. Holliday. 1990. Economicinjury levels for Colorado potato beetle (Coleoptera:Chrysomelidae) on 'Norland' potatoes in Manitoba. J.Econ. Entomo\. 83: 2058-2064.
Shields, E. J., andJ. A. Wyman. 1984. Effect of defoliationat specific growth stages on potato yields. J. Econ.Entomo1. 77: 1194-1199.
Sokal, R. R., and F.J. Rohlf. 1969. Biometry: the principlesand practice of statistics in biological research. Free-man, San Francisco.
Stern, V. M., R. F. Smith, R. van den Bosch, and K. S.Hagan. 1959. The integration of chemical and biolog-ical control of the spotted alfalfa aphid. The integratedcontrol concept. Hilgardia 29: 81-101.
Swallow, W. H. 1984. Those overworked and oft-misusedmean separation procedures-Duncan's, LSD, etc. PlantDis. 68: 919-921.
by guest on February 3, 2016http://jee.oxfordjournals.org/
Dow
nloaded from
20 JOURNAL OF ECONOMIC ENTOMOLOGY Vol. 91, no. 1
Trumble,J. T., D. M. Kolodny-Hirsch, and I. P. Ting. 1993.Plant compensation for arthropod herbivory. Annu.Rev. Entomol. 38: 93-119.
[USDA] United States Department of Agriculture. 1972.United States standards for potatoes. USDA, Washing-ton, DC.
Wellik, M. J., J. E. Siosser, and R. D. Kirby. 1981. Effectsof simulated insect defoliation on potatoes. Am. PotatoJ. 58: 627-632.
Zehnder, G. W., and G. K. Evanylo. 1989. Influence ofextent and timing of Colorado potato beetle (Co-
leoptera: Chrysomelidae) defoliation on potato tuberproduction in eastern Virginia. J. Econ. Entomol. 82:948-953.
Zehnder, G. W., A. M. Vencill, and J. Speese III. 1995.Action thresholds based on plant defoliation for man-agement of Colorado potato beetle (Coleoptera: Chry-somelidae) in potato. J. Econ. Entomol. 88: 155-161.
Received for publication 17 June 1997; accepted 26 Sep-tember 1997.
by guest on February 3, 2016http://jee.oxfordjournals.org/
Dow
nloaded from