black body radiation · 2017-07-13 · characteristic smooth spectrum of varying frequencies,...
TRANSCRIPT
Stephen Mullens Friday AEP Lab
Page 1 of 15
Black Body Radiation Introduction: All objects are able to absorb electromagnetic waves, but those with temperature above absolute zero radiate as well. When incident electromagnetic radiation strikes a body’s surface it is either absorbed or reflected with the likelihood of each outcome dependent upon the objects surface. A Black Body, also known as an ideal emitter is a body which absorbs all energy incident upon it and reradiates this energy with a characteristic smooth spectrum of varying frequencies, dependent on the bodies temperature. The aims of this experiment are to:
• Verify that the detected intensity from the filament lamps falls off as 1/distance². Hence calculate the position of the detector surface inside the detection module.
• To establish the angular distribution of emitted electromagnetic radiation from a filament lamp.
• To calculate a value for the Stefan Boltzmann constant based upon the lamp. Theory: The Inverse Square Law: This law states that the flux of radiation from a point source decreases as the reciprocal of the square of the distance from the source. This can be seen in the surface area of a sphere- 4πr2; if there is a certain amount of energy at a point which radiates in all directions, the intensity will decrease with distance as the energy is essentially spread over the increasing surface. The power at a detector is found by multiplying the power per unit area at that distance by the area of the detector normal to the incident rays. If the source is not a point source then problems can arise due to the power being beamed in specific direction, i.e. the collisions of neutron stars, pulsars etc. The Stefan Boltzmann Law:
4423
54
0 152 TT
chkdF σπλλ ==∫
∞
σ T k h c
The Stefan Boltzmann constant The thermodynamic Temperature of body Boltzmann constant Planck’s constant Speed of light
The total radiation emitted by an object per unit area is the integral of the Planck distribution of emitted wavelengths over all wavelengths. The result showing that the radiation per unit area for a black body is only a function of its temperature.
Stephen Mullens Friday AEP Lab
Page 2 of 15
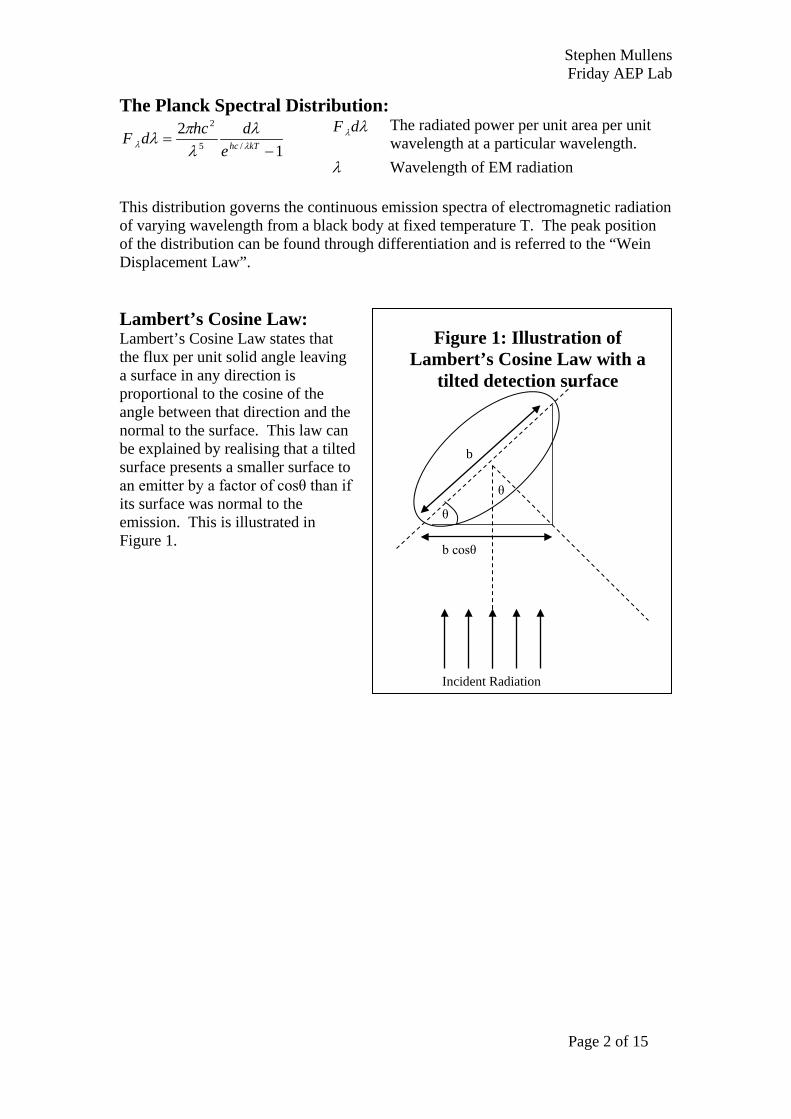
The Planck Spectral Distribution:
12
/5
2
−= kThce
dhcdF λλλ
λπλ
λλdF
The radiated power per unit area per unit wavelength at a particular wavelength.
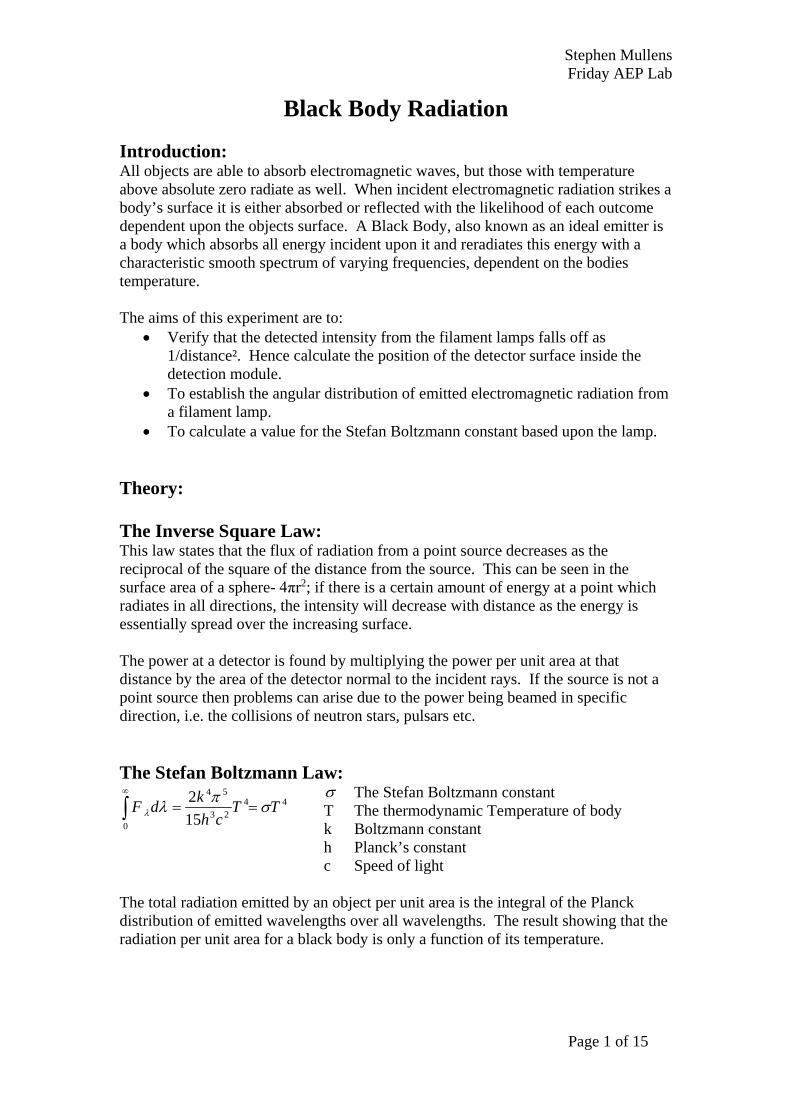
λ Wavelength of EM radiation This distribution governs the continuous emission spectra of electromagnetic radiation of varying wavelength from a black body at fixed temperature T. The peak position of the distribution can be found through differentiation and is referred to the “Wein Displacement Law”. Lambert’s Cosine Law: Lambert’s Cosine Law states that the flux per unit solid angle leaving a surface in any direction is proportional to the cosine of the angle between that direction and the normal to the surface. This law can be explained by realising that a tilted surface presents a smaller surface to an emitter by a factor of cosθ than if its surface was normal to the emission. This is illustrated in Figure 1.
b
θ
b cosθ
θ
Incident Radiation
Figure 1: Illustration of Lambert’s Cosine Law with a
tilted detection surface
Stephen Mullens Friday AEP Lab
Page 3 of 15
Tungsten Halogen Filament Lamps: The chosen source of radiation is a tungsten filament in a halogen environment, which is all encased in glass. The filament is coiled into a cylindrical shape and assumed to have a maximum maintainable temperature of ~2500K. It can not be assumed that this light source can be treated as a blackbody because a blackbody is merely an idealisation; this can easily be shown to be the case by considering high energy gamma radiation which can take over a meter of lead to be fully absorbed, it is therefore unlikely to be absorbed by a thin tungsten filament and would likely just pass through. Stellar objects such as stars do not suffer from penetration effects because their intrinsic size and density makes penetration of radiation from one side to the another very unlikely, combining this with their greater population of different quantum energy states makes their absorption and emission profile characteristic of a black body. It is also important to note that although the star is a good approximation for a black body, the atmosphere surrounding it causes some discrete wavelengths to be absorbed causing some discontinuity in the spectrum. For the purpose of this experiment the power radiated from the lamp is:
)(44enclosurecenclosureenclosureenclosurefilamentfilamenttotal TTKTATAP −++= σεσε
P – Power Emitted A – Surface Area ε - Emissivity of the surface Kc – Conduction constant between filament and surroundings The emission from the lamp is the sum of the emission from the filament, halogen gas and glass casing. In the limit where the temperature of the lamp is significantly larger than the surroundings and the lamp is on for a very short time so that not very much energy can conduct, all but the first term can be ignored. The Emissivity of a material is a dimensionless constant which governs the ratio of energy emitted from a body’s surface and the expected value from Planck’s law. It varies with temperature and wavelength, but for this experiment it will be assumed that it is constant at a value of 0.4 irrespective of the wavelength at 2400K (Kaye And Laby – 16th Edition – page 71) ε =1 for a blackbody – Full absorption ε =0 for a reflector

Stephen Mullens Friday AEP Lab
Page 4 of 15
Angular Distribution of Radiation from the Lamp: The filament lamp consists of a coil of tungsten wire in a cylindrical shape (Figure 2), this means that when it is rotated the intensity in any given direction will vary with time. If considering Lambert’s Cosine Law and assuming that the filament can be modelled as an emitting cylinder with a different power output per unit area from the ends and the curved surfaces, it is possible to model it by: Detected power = |k*cosθ| + |c*sinθ| Where the constants k and c are a measure of the power emitted from the surfaces. The first term governs the power from the curved surface and the second from the ends of the cylinder. The validity of this model is questionable because the filament does not emit over the entire surface area of a cylinder, but the halogen gas which surrounds the filament will be heated to temperatures of the order of that of the filament and this extra emission could essentially “fill” in the gaps between each turn.
θ
90- θ
Detector
Emitting Cylinder (filament model)
Figure 2: Modelling Filament as a Cylinder
Stephen Mullens Friday AEP Lab
Page 5 of 15
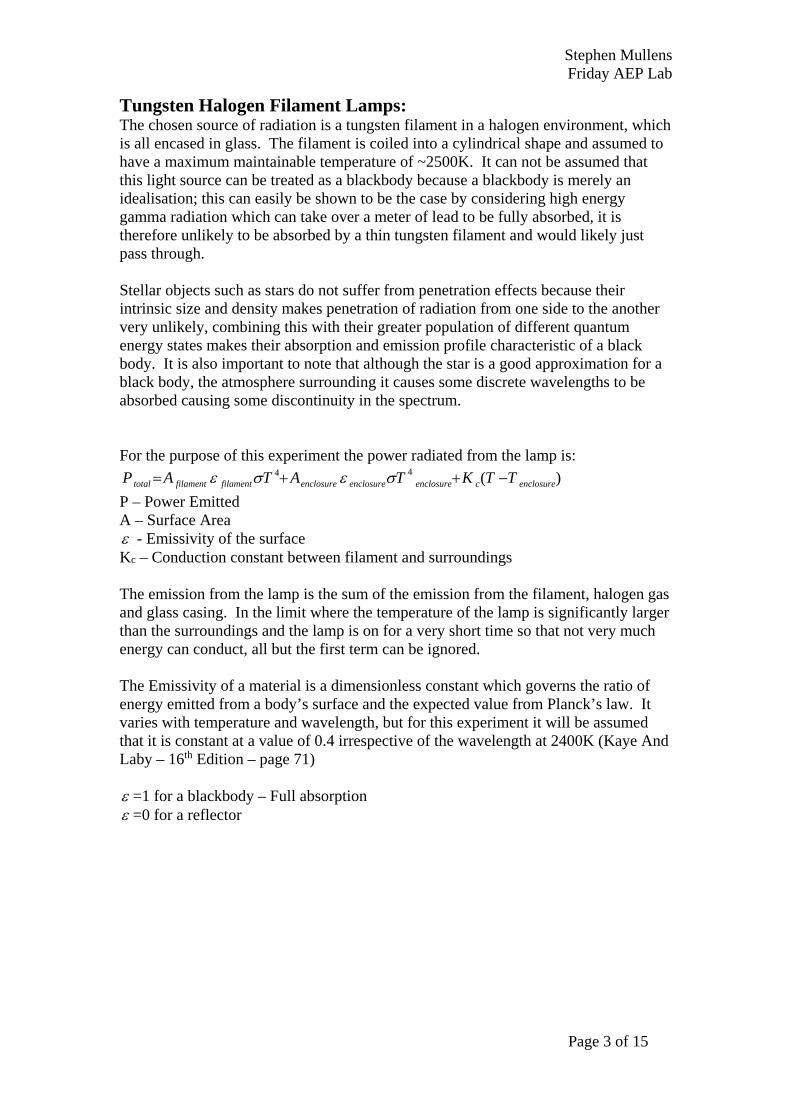
Setup for the Experiments:
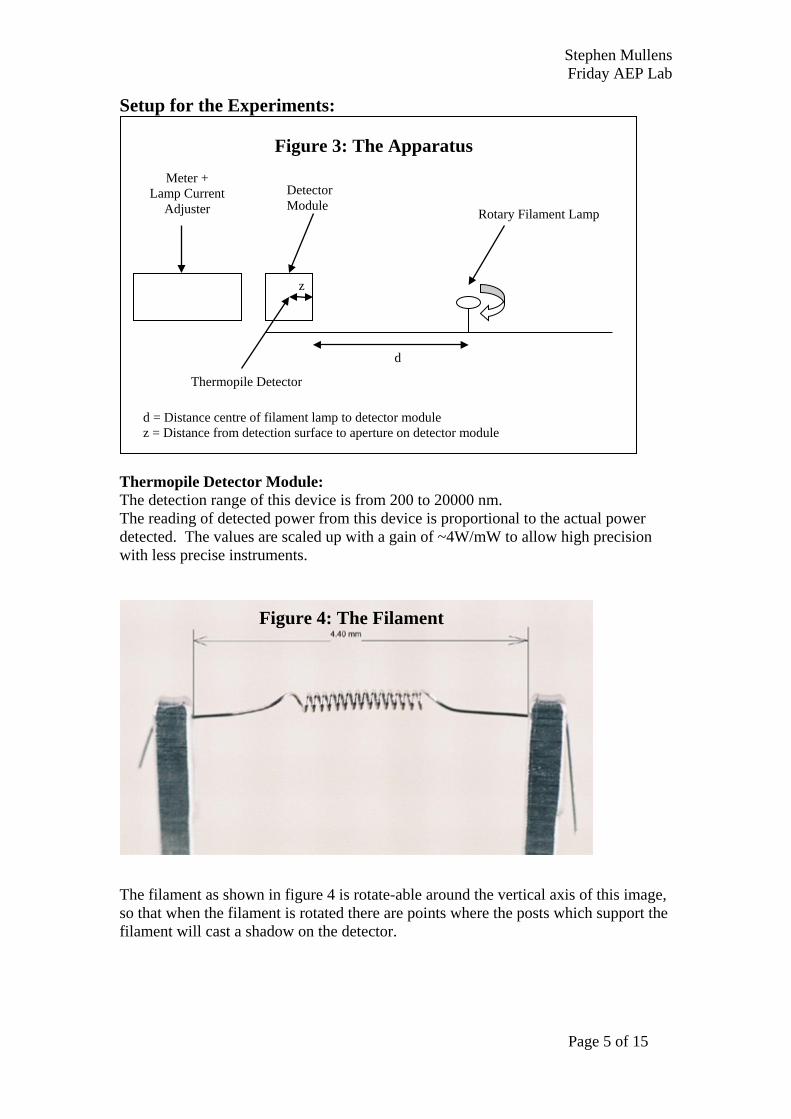
Thermopile Detector Module: The detection range of this device is from 200 to 20000 nm. The reading of detected power from this device is proportional to the actual power detected. The values are scaled up with a gain of ~4W/mW to allow high precision with less precise instruments. Figure 4: The Filament The filament as shown in figure 4 is rotate-able around the vertical axis of this image, so that when the filament is rotated there are points where the posts which support the filament will cast a shadow on the detector.
Rotary Filament Lamp
Detector Module
d
z
Thermopile Detector
Figure 3: The Apparatus Meter +
Lamp Current Adjuster
d = Distance centre of filament lamp to detector module z = Distance from detection surface to aperture on detector module
Stephen Mullens Friday AEP Lab
Page 6 of 15
Experiments: Verification of the point source nature of the lamp: It is necessary to measure the intensity or radiation striking the detector at various distances, at all distances it is of vital importance that the whole lamp is in the viewable cone of the detector. Shiny surfaces in the lab around where the experiment is carried out should be minimised to prevent electromagnetic radiation being reflected back into the detector and causing errors, other factors capable of causing error are varying lighting levels in the lab and warm bodies such as people falling into the detection cone.
• The lamp should is set to a constant current of 650mA and hence a constant power is delivered to the filament whenever the lamp is activated.
• The lamp is rotated such that filament is presenting the largest possible surface to the detector, this will minimise percentage error in intensity variation if the lamp is accidentally rotated by a small angle during the experiment.
• The distance between the front of the detector module and the centre of the lamp is measured. This is the value “d” from Figure 1.
• A reading of the detected power is made. • The lamp is activated for approximately 5 seconds to allow the filament to
heat up and the detector to react to the change in radiation. 5 seconds is sufficient such that the temperature of the enclosure and lamp housing does not rise in temperature significantly via conduction. A reading of detected power is made. The change between the off and on value is the power due to the lamp.
• The distance between source and detector and is altered and power readings taken. The variation of distances is large enough to ensure a change in power of due to the lamp is as large as possible.
Once the data has been collected it can be modelled using curve expert as:
2)tan(tan
offsetcedistConsPower
+=
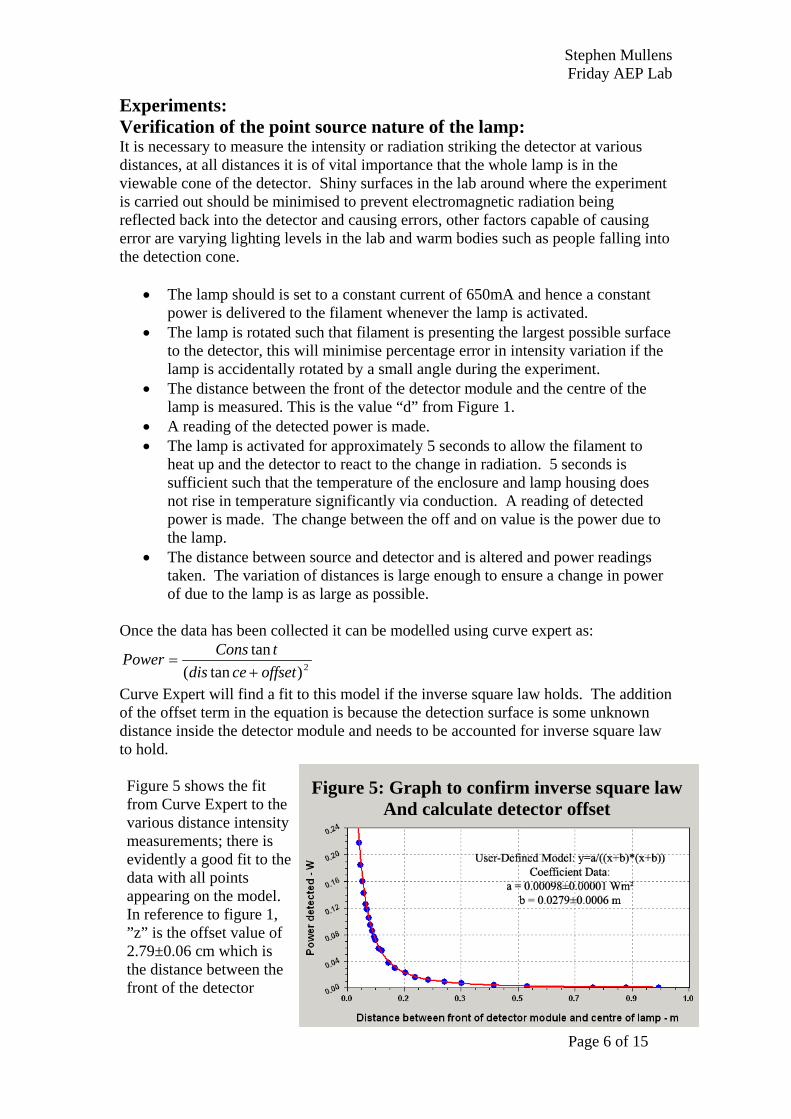
Curve Expert will find a fit to this model if the inverse square law holds. The addition of the offset term in the equation is because the detection surface is some unknown distance inside the detector module and needs to be accounted for inverse square law to hold. Figure 5 shows the fit from Curve Expert to the various distance intensity measurements; there is evidently a good fit to the data with all points appearing on the model. In reference to figure 1, ”z” is the offset value of 2.79±0.06 cm which is the distance between the front of the detector
Figure 5: Graph to confirm inverse square law And calculate detector offset

Stephen Mullens Friday AEP Lab
Page 7 of 15
and the detection surface. This value seems to be realistic when considering the dimensions of the detector module and when looking into it via the detection aperture. The error in this experiment is due to uncertainty in the measurements of distance from the graduated ruler and in position of the centre of the filament.

Stephen Mullens Friday AEP Lab
Page 8 of 15
Measuring the Angular Distribution of Power from the Lamp: It has been theorised that the emission from the filament lamp can be considered as the emission from two independent surfaces. To test this theory and discover how the intensity from the lamp varies with angle it is necessary to rotate the lamp around one of its axis and measure the variation in detected power. The filament does not have spherical symmetry which means that as the lamp is rotated some parts of it will get closer to the detector than others; this effect will be negligible if the lamp is much further away from the detector than the length of the cylinder. This can be seen in figure 6.
With the distance from the lamp to the detector at approximately 10cm, the lamp is rotated through an angle of 360º in 10º steps and power measurements taken for the lamp being off and being on. Variation in the distance from the edge of filament to detector is ~1mm which is ~1% of the total distance; as such the effect of the rotation on the distance is negligible. The lamp is kept on for approximately 5 seconds for each angle to allow the detector reading to settle out but limiting conduction effects warming up the enclosure of the filament. I will assume that the lamp is symmetric such that every 180º the power distribution repeats, this is most likely to be the case for a cylindrically coiled filament. Figure 7 shows how altering the angle from which the lamp is viewed effects the power from a solid angle. It is evident from the data that there should be a double peak for maximum power detected. The mathematical fit has the basis of the fit but lacks the necessary precision; this implies that the assumption of treating the filament as a cylinder with different power outputs at each surface is wrong.
Figure 7: Angular distribution of power from lamp
Figure 6: Rotation effect on distance source to detector
Stephen Mullens Friday AEP Lab
Page 9 of 15
Error estimates were made for all quantities varied or measured by the precision of the equipment and resulted in very small errors, so small that they do not even appear on the computer plot. Figure 7 states that the constants representing the power due to the ends and curved sides are: 0.0303±0.0004 and 0.1699±0.0004 respectively. The model may lack precision but this confirms the obvious fact that the curved sides emit more radiant power than the ends. The two most important factors which were ignored in the model were:
• The effect of the two bars that hold the filament as seen in figure 4 may block out and absorb radiation
• That the glass housing which contains the filament does not interfere with the emitted radiation.
The bars holding the filament will only have a large effect at the two ends of the graph (figure 7) where they will act to reduce the detected power by casting a shadow onto the detector. This could explain why the computer fit predicts a higher detected power at these edges. The glass housing has a different refractive index to that of the halogen gas or air; at the interface between these mediums the direction of the electromagnetic radiation will be forced to vary. The shape of the glass housing may be such that it internally reflects and refracts a significant percentage of the emitted radiation which results in this double peak. To draw any significant conclusions from this experiment it is necessary to repeat the experiment and carry out many more readings at smaller angular intervals, every 2 degrees should give a clearer illustration of the complexities of the effect. Calculating the Stefan Boltzmann Constant: To establish the value of the Stefan Boltzmann constant it is necessary to know the temperature of the filament and the power being radiated.
)(44enclosurecenclosureenclosureenclosurefilamentfilamenttotal TTKTATAP −++= σεσε
The total energy being emitted by the lamp is approximately the input power (ie VI), however there are conduction effects which will be more significant at higher temperatures due to large temperature gradients which take energy from the system. These conduction effects could be minimised by suspending the filament in a vacuum being held in position by the power cables powering it and then the only loss would be due to conduction from the cables and the inherent resistance of the circuit.
Stephen Mullens Friday AEP Lab
Page 10 of 15
Finding the Temperature of the filament: To find the temperature of the filament at any given time, known values of the resistivity of tungsten at specific temperatures can be modelled using curve fit and an equation drawn from the fit.
lRA
=ρ ρ R A
The resistivity of the material The resistance of the object The cross sectional area of the object
IVR =
R V I
Resistance of the lamp The voltage across the lamp The current through the lamp
To find an equation for T from V and I (the measurable quantities):
IV
Al=
ρ
Corresponding values for Temperature can be modelled from the ρ T data. The ratio of l/A for some known values of T and ρ is needed so to eliminate all unknowns. The easiest way to find this ratio is to find the resistance of the filament at zero current and hence at room temperature which is ~300K. The known value of ρ at this temperature is 5.65*10-8 Ωm. (Kaye and Laby – 16th Edition)
RlA ρ=
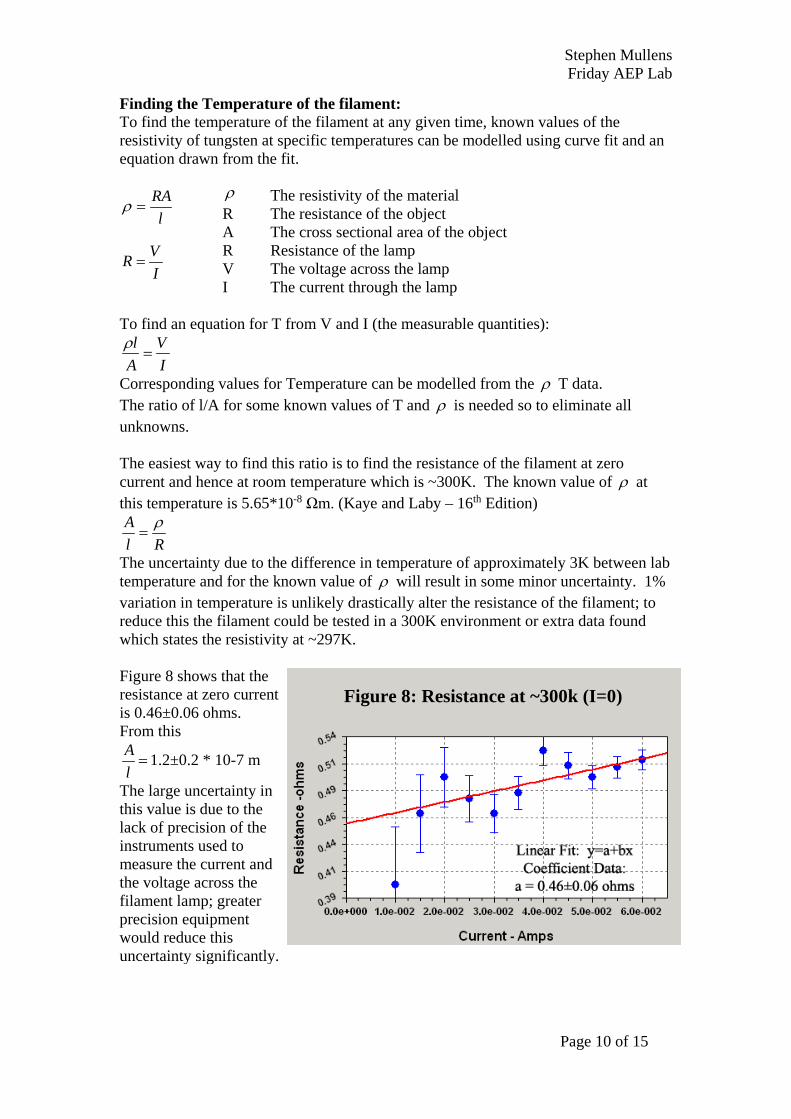
The uncertainty due to the difference in temperature of approximately 3K between lab temperature and for the known value of ρ will result in some minor uncertainty. 1% variation in temperature is unlikely drastically alter the resistance of the filament; to reduce this the filament could be tested in a 300K environment or extra data found which states the resistivity at ~297K. Figure 8 shows that the resistance at zero current is 0.46±0.06 ohms. From this
=lA 1.2±0.2 * 10-7 m
The large uncertainty in this value is due to the lack of precision of the instruments used to measure the current and the voltage across the filament lamp; greater precision equipment would reduce this uncertainty significantly.
Figure 8: Resistance at ~300k (I=0)

Stephen Mullens Friday AEP Lab
Page 11 of 15
The known values of T are plotted against the ρ *l/A. From figure 9 the relation between the resistance due to the lamp and temperature is T=550*R0.82 This model was chosen from the variety of computer fits available because it fit the data with high accuracy and its simplicity makes later calculations easy.
Figure 9: Find the relation between T and
Resistance
Any temperature values calculated using this formula are only valid if they fall within the scope of the data used to create this formula (300K to 3000K). There is significant error on the coefficients in the equation to calculate temperature from the resistance of the lamp and this is due to the following through of error in the zero current resistance of the lamp. Calculating the Stefan Boltzmann Constant: If it is assumed that all the change in power from when the lamp is on to when it is off is due to the filament lamp then.
4TAP filamentfilamenttotal σε= if Tfilament >> Tenclosure lnP =ln |Aε σ | + ln|T4| y =c + mx This means that if I were to plot a graph of log power detected against log Temperature4 then the point of interception on the y axis would lead to a value of the Stefan Boltzmann constant. The data is collected by fixing the lamp at a specific distance from the detector and varying the current through the lamp. For each current, values of V and I should be recorded and used to calculate resistance of the filament and hence temperature. The change in detected power with the lamp on and off should also be recorded and as before the lamp should only be active for a maximum of 5 seconds to prevent excess heating of the enclosure. Currents from 0.4 to 0.85 amps were used to create the required data range and the orientation of the filament was such that it was presenting its largest surface to the detector. Values for the ln|T4| and ln|P| should be calculated and plotted against each other. To calculate errors in log quantities:
2||log||log xerrorxxerrorxError −−+
=

Stephen Mullens Friday AEP Lab
Page 12 of 15
The formula governing the detected change in power and the Stefan Boltzmann constant was only appropriate in the limit where Tfilament >> Tenclosure, i.e. for large Tfilament, the T4 factor for the filament dominates that for the surroundings. As a result of this the lower temperature data will be disregarded (<1500K) because it does not fulfil the require relation as accurately as the higher temperature data. The expected result when plotting is a linear relation between log10|T4| and log10|P| because the powers fall out with the log function.
Figure 10: Confirmation of the Stefan-Boltzmann Law
Figure 10 shows the expected linear relation between detected power and Temperature. The point of interception is stated as -10.1±0.3, the large reduction in error is a result of using the log function. The point of interception = log10 |Aε σ | = -10.1±0.3
From this ε
σA
)3.01.10(10 ±−
=
Where ε is the Emissivity of tungsten which was previously stated as being of the order of 0.4 in the range of wavelengths of most significant intensity. (Kaye and Laby – 16th Edition Page71) A is the surface area of the filament. The radius of the filament metal is ~50*10-6 m Which leads to a surface area of 2.51±0.02 *10-6 m2 This gives the value of the Stefan Boltzmann constant to being of the order of 7.91*10-5 Wm-2K-4 with approximately 13% uncertainty. When the standard value 5.670*10-8 Wm-2K-4
Stephen Mullens Friday AEP Lab
Page 13 of 15
Analysis of Stefan Boltzmann Constant: The calculated value for the Stefan Boltzmann constant is significantly smaller than the established value and this is a consequence of either the gradient on figure 10 being inaccurate or the surface area estimate being unrepresentative of a filament in heated halogen. In terms of the gradients and intercept, the lack of agreement could be due to conduction effects lowering the temperature of the filament and heating the environment. The result of this is more power being needed to produce a given temperature, but at that temperature there is substantial emission from the lamp enclosure which makes the simplification of the total power equation to the reduced form invalid. The calculated surface area of filament may be accurate but the emission from the super heated halogen gas surrounding the filament was never considered except in the cylinder model, this model was used to carry out an analysis of the angular distribution of radiation. Assuming that emission occurs from a cylinder of surface area derived from figure 4 then this will likely result in an increased surface area and slightly improved value for the Stefan Boltzmann constant. I feel that the intercept in figure 10 is the more significant source of error. Another approach to calculate the Stefan Boltzmann constant is to plot T4 against P where the gradient is equal to the Stefan Boltzmann constant multiplied by the surface area of the filament and emissivity pre factors. Errors in T4 terms reinforce each other, therefore relative error in T4 = 4 times the relative error in T1. The result of this is very large errors in T which makes the value of Stefan Boltzmann constant undeterminable. Stefan Boltzmann Constant= 1.1 *10-7 Wm-2K-4 with ~140% error When the standard value 5.670 * 10-8 Wm-2K-4 (Kaye and Laby – 16th Edition) The result of this is a value of the Stefan Boltzmann constant which is numerically about twice the standard value; however the error on this value makes the result meaningless and only useful to establish an upper and lower limit on the possible value. It is probably the case that the error in the zero current resistance was much smaller than the mathematically determined possible error and this is why the result is only of the order of two times the accepted value.
Stephen Mullens Friday AEP Lab
Page 14 of 15
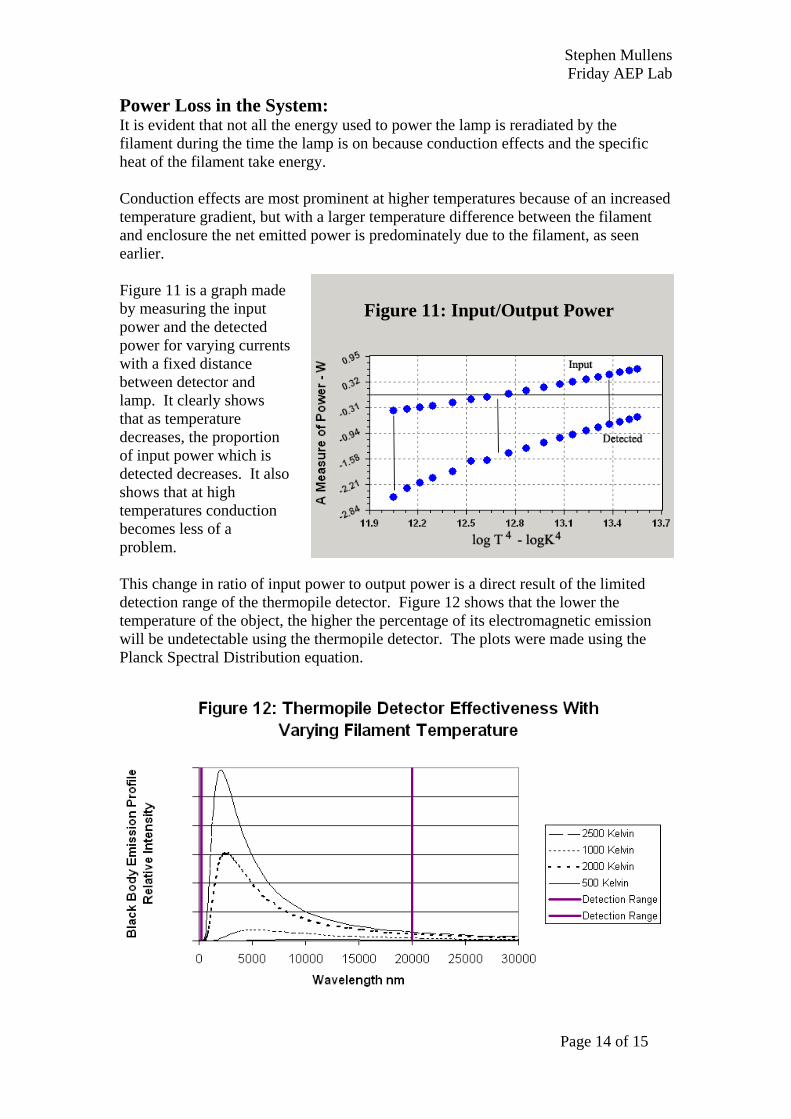
Power Loss in the System: It is evident that not all the energy used to power the lamp is reradiated by the filament during the time the lamp is on because conduction effects and the specific heat of the filament take energy. Conduction effects are most prominent at higher temperatures because of an increased temperature gradient, but with a larger temperature difference between the filament and enclosure the net emitted power is predominately due to the filament, as seen earlier. Figure 11 is a graph made by measuring the input power and the detected power for varying currents with a fixed distance between detector and lamp. It clearly shows that as temperature decreases, the proportion of input power which is detected decreases. It also shows that at high temperatures conduction becomes less of a problem.
Figure 11: Input/Output Power
This change in ratio of input power to output power is a direct result of the limited detection range of the thermopile detector. Figure 12 shows that the lower the temperature of the object, the higher the percentage of its electromagnetic emission will be undetectable using the thermopile detector. The plots were made using the Planck Spectral Distribution equation.

Stephen Mullens Friday AEP Lab
Page 15 of 15
Conclusion: It has been established through the course of these experiments that the power radiated by the tungsten halogen lamp obeys the inverse square law and falls off as the reciprocal of the distance squared. The distribution of power in a 2d plane around the filament has been mapped and modelled with limited precision to a cylinder with emission occurring all over its surface but with less intensity at the ends. A value for the Stefan Boltzmann constant was calculated but underlying systematic errors or large uncertainties have resulted in the final value being either useless or dissimilar to the accepted value. To improve upon this it would be necessary to re-measure the zero current resistance of the filament at 300K and propagate its value rework the maths from there. A further experiment to be carried out could be to investigate the relative intensity of different discrete wavelengths of light and hence determine the temperature of the filament using Planck’s Law. The temperature measured in this method is referred to as the colour temperature of an object and is typically used to calculate the temperature of stellar objects. References: Second year physics laboratory Manual -2003/2004 Background information into experiment Introduction to Statistical Mechanics BM Bowley and M Sanchez Ch8 p160 An Introduction to Modern Astrophysics BW Carroll and DA Oslie Addison Worley p75-78 Blackbody equations and laws Alamo.bu.edu/applet/Spec/applet.html 10/11/2003 Try an interactive blackbody calculator www.lasercomponentsusa.com 10/11/2003 Dexter Thermopile Detectors Tables of Physical and Chemical Constants Kaye and Laby -16th Edition - Longman www.physics.nps.navy.mil/ch02.pdf 12/11/2003 Emissivity / reflection/ transmission background information www.pholonics.com 12/11/2003 Lambert’s cosine law definition