black carbon in snow in the upper himalayan khumbu valley
TRANSCRIPT
HAL Id: insu-01235700https://hal-insu.archives-ouvertes.fr/insu-01235700
Submitted on 17 Feb 2016
HAL is a multi-disciplinary open accessarchive for the deposit and dissemination of sci-entific research documents, whether they are pub-lished or not. The documents may come fromteaching and research institutions in France orabroad, or from public or private research centers.
L’archive ouverte pluridisciplinaire HAL, estdestinée au dépôt et à la diffusion de documentsscientifiques de niveau recherche, publiés ou non,émanant des établissements d’enseignement et derecherche français ou étrangers, des laboratoirespublics ou privés.
Black carbon in snow in the upper Himalayan KhumbuValley, Nepal: observations and modeling of the impact
on snow albedo, melting, and radiative forcingH.-W Jacobi, S Lim, M Ménégoz, P Ginot, P Laj, P Bonasoni, P Stocchi, A
Marinoni, Y Arnaud
To cite this version:H.-W Jacobi, S Lim, M Ménégoz, P Ginot, P Laj, et al.. Black carbon in snow in the upper Hi-malayan Khumbu Valley, Nepal: observations and modeling of the impact on snow albedo, melting,and radiative forcing. The Cryosphere Discussions, Copernicus, 2015, 9, pp.1685-1699. �10.5194/tc-9-1685-2015�. �insu-01235700�
The Cryosphere, 9, 1685–1699, 2015
www.the-cryosphere.net/9/1685/2015/
doi:10.5194/tc-9-1685-2015
© Author(s) 2015. CC Attribution 3.0 License.
Black carbon in snow in the upper Himalayan Khumbu Valley,
Nepal: observations and modeling of the impact on snow albedo,
melting, and radiative forcing
H.-W. Jacobi1,2, S. Lim1,2, M. Ménégoz1,2,*, P. Ginot2,3,4, P. Laj1,2, P. Bonasoni5, P. Stocchi5, A. Marinoni5,6, and
Y. Arnaud7,8
1Laboratoire de Glaciologie et Géophysique de l’Environnement, Univ. Grenoble Alpes, Grenoble, France2Laboratoire de Glaciologie et Géophysique de l’Environnement, CNRS, Grenoble, France3Observatoire des Sciences de l’Univers de Grenoble, Univ. Grenoble Alpes, Grenoble, France4Observatoire des Sciences de l’Univers de Grenoble, IRD, 38000 Grenoble, France5CNR-ISAC-Institute of Atmospheric Sciences and Climate, Bologna, Italy6EV-K2-CNR Committee, Bergamo, Italy7Laboratoire d’étude des Transferts en Hydrologie et Environnement, Univ. Grenoble Alpes, Grenoble, France8Laboratoire d’étude des Transferts en Hydrologie et Environnement, IRD, Grenoble, France*now at: Institut Català de Ciències del Clima - IC3, Barcelona, Spain
Correspondence to: H.-W. Jacobi ([email protected])
Received: 11 July 2014 – Published in The Cryosphere Discuss.: 8 October 2014
Revised: 4 June 2015 – Accepted: 9 July 2015 – Published: 21 August 2015
Abstract. Black carbon (BC) in snow in the Himalayas has
recently attracted considerable interest due to its impact on
snow albedo, snow and glacier melting, regional climate and
water resources. A single particle soot photometer (SP2) in-
strument was used to measure refractory BC (rBC) in a se-
ries of surface snow samples collected in the upper Khumbu
Valley, Nepal between November 2009 and February 2012.
The obtained time series indicates annual cycles with max-
imum rBC concentrations before the onset of the monsoon
season and fast decreases during the monsoon period. De-
tected concentrations ranged from a few up to 70 ppb with
rather large uncertainties due to the handling of the samples.
Detailed modeling of the snowpack, including the detected
range and an estimated upper limit of BC concentrations, was
performed to study the role of BC in the seasonal snowpack.
Simulations were performed for three winter seasons with
the snowpack model Crocus, including a detailed descrip-
tion of the radiative transfer inside the snowpack. While the
standard Crocus model strongly overestimates the height and
the duration of the seasonal snowpack, a better calculation of
the snow albedo with the new radiative transfer scheme en-
hanced the representation of the snow. However, the period
with snow on the ground without BC in the snow was still
overestimated between 37 and 66 days, which was further
diminished by 8 to 15 % and more than 40 % in the pres-
ence of 100 or 300 ppb of BC. Compared to snow without
BC, the albedo is reduced on average by 0.027 and 0.060 in
the presence of 100 and 300 ppb BC. While the impact of in-
creasing BC in the snow on the albedo was largest for clean
snow, the impact on the local radiative forcing is the opposite.
Here, increasing BC caused an even larger impact at higher
BC concentrations. This effect is related to an accelerated
melting of the snowpack caused by a more efficient meta-
morphism of the snow due to an increasing size of the snow
grains with increasing BC concentrations. The melting of the
winter snowpack was shifted by 3 to 10 and 17 to 27 days
during the three winter seasons in the presence of 100 and
300 ppb BC compared to clean snow, while the simulated an-
nual local radiative forcing corresponds to 3 to 4.5 and 10.5
to 13.0 W m−2. An increased sublimation or evaporation of
the snow reduces the simulated radiative forcing, leading to
a net forcing that is lower by 0.5 to 1.5 W m−2, while the
addition of 10 ppm dust causes an increase of the radiative
forcing between 2.5 and 3 W m−2. According to the simula-
Published by Copernicus Publications on behalf of the European Geosciences Union.
1686 H.-W. Jacobi et al.: Black carbon in snow in the upper Himalayan Khumbu Valley
tions, 7.5 ppm of dust has an effect equivalent to 100 ppb of
BC concerning the impact on the melting of the snowpack
and the local radiative forcing.
1 Introduction
Black carbon (BC) constitutes the most important light-
absorbing aerosol in the atmosphere, where it contributes to
the warming of the atmosphere (Bond et al., 2013). It further
affects cloud formation either acting as cloud nuclei or in-
creasing the evaporation rates in cloudy layers. It is formed
during incomplete combustion processes and mainly emit-
ted due to natural and anthropogenic sources like biomass
burning or fossil fuel and biofuel combustion (Bond et al.,
2013). If BC is incorporated in snow, it can lead to further
warming due to its impact on the albedo of snow and ice,
causing an accelerated melting (e.g., Hansen and Nazarenko,
2004; Flanner et al., 2007; Ménégoz et al., 2014). BC is also
a strong pollutant, dangerous for human health and the envi-
ronment, and is considered an important short-lived climate
forcer. Therefore, reductions in BC emissions can potentially
lead to a fast climate response, in particular in regions where
elevated BC concentrations are observed. The global annual
climate forcing of BC in the atmosphere and in the snow re-
mains uncertain with the most recent estimates ranging from
+0.64 (±0.4) to +1.1 (∼±1) W m−2 (Stocker et al., 2013;
Bond et al., 2013).
Since regional warming due to BC can be much stronger
than the global average, the Himalayas have become of great
interest. The extended cryosphere in the high-altitude re-
gions of the Himalayas including numerous glaciers (Kääb
et al., 2012) and large snow-covered regions (Ménégoz et
al., 2013a) is expected to be especially vulnerable because
of high radiation intensities and the vicinity of large anthro-
pogenic BC sources on the Indian subcontinent or in South-
east Asia. Xu et al. (2009) proposed that BC in snow con-
tributes to the retreat of glaciers observed in parts of the Hi-
malayas, while Ramanathan et al. (2007) suggested that BC
transported to the Himalayas contributed to the melting of the
snow. If BC has an impact on the glacier mass balance as well
as on the timing of the run-off formation due to the snow melt
in springtime, this would have implications on the hydrolog-
ical cycle, water resources, hydropower generation, and agri-
culture in the downstream regions, possibly affecting the liv-
ing conditions of a population of more than a billion people
(e.g., Immerzeel et al., 2010). Changes in the cryosphere may
further modify sensible and latent heat fluxes, affecting also
the Asian monsoon (Lau and Kim, 2006; Qian et al., 2011).
Measurements at the Nepal Climate Observatory at Pyra-
mid (NCO-P) carried out since 2006 at 5079 m a.s.l. have
confirmed that aerosols including BC can effectively be
transported from the sources to high-altitude regions of the
Himalayas (Bonasoni et al., 2010; Marinoni et al., 2010).
Ice cores and surface snow samples from different locations
in the Himalayas (Ming et al., 2008; Kaspari et al., 2011;
Ginot et al., 2014) and on the Tibetan Plateau (Ming et al.,
2009; Xu et al., 2009) demonstrated that BC and other ab-
sorbing impurities like dust are efficiently incorporated into
the snow. Based on ice core data, reductions in the snow
albedo were estimated (Ginot et al., 2014), assuming that the
profile of the ice core concentration directly corresponds to
the evolution of the BC concentration in the surface snow
layer. Furthermore, the transport of BC from the source re-
gions and its deposition to the snow was calculated using
different global transport and chemistry models (Flanner et
al., 2007; Kopacz et al., 2011; Ménégoz et al., 2014). These
studies resulted in an estimated annual radiative forcing due
to BC in snow between 7 and 12 W m−2 close to the Mt.
Everest (Kopacz et al., 2011) and between 1 and 4 W m−2
in the snow-covered areas of the Himalayas (Ménégoz et
al, 2014), while peak values in the monthly radiative forc-
ing exceeded 15 to 25 W m−2 for some parts of the Tibetan
Plateau (Flanner et al., 2007; Kopacz et al., 2011; Qian et al.,
2011). However, large uncertainties in the calculated radia-
tive forcing remain because of the low spatial resolution of
the global models used, preventing a precise representation
of the high-altitude regions and the pronounced topography
of the mountain range. These model limitations constrain a
multitude of simulated processes including local-scale flow,
transport of water vapor and aerosols, precipitation, and snow
cover formation and melting (Ménégoz et al., 2013a), which
are crucial in obtaining a correct radiative forcing for BC in
snow. It has been demonstrated that these deficits can cause
an overestimation of the snow cover on the Tibetan Plateau,
producing also a likely positive bias in the estimated radiative
forcing for BC in snow in this region (Ménégoz et al., 2013a,
2014). Moreover, some models generate significantly higher
BC in snow concentrations compared to the few available
observations in the Himalayas and on the Tibetan Plateau
(Flanner et al., 2007; Ménégoz et al., 2014). However, the
limited BC in snow measurements make it difficult to get a
reliable idea of the spatial distribution, seasonal cycle, and in-
terannual variability of BC in snow in this vast and complex
region, greatly diminishing our capability to validate model
results (Qian et al., 2011).
It is well known that BC is not the only absorbing impu-
rity in the snow in the high-altitude region of Tibet and the
Himalayas. High concentrations of dust have been observed
in the atmosphere (e.g., Carrico et al., 2003; Duchi et al.,
2014) and in ice cores (Thompson et al., 2000; Kaspari et al.,
2011; Ginot et al., 2014). Duchi et al. (2014) reported the fre-
quency of dust transport events at NCO-P with a maximum
during the pre-monsoon period causing on average a 10-fold
increase of PM10 in the atmosphere, compared to days with-
out identified dust events. While the absorption of solar radi-
ation due to dust is much less efficient compared to BC, this
is at least partly compensated for by much higher concen-
trations. Ginot et al. (2014) found dust concentrations up to
The Cryosphere, 9, 1685–1699, 2015 www.the-cryosphere.net/9/1685/2015/
H.-W. Jacobi et al.: Black carbon in snow in the upper Himalayan Khumbu Valley 1687
almost 70 ppm and an average concentration throughout all
seasons around 10 ppm in an ice core from the Mera glacier,
which is significantly higher than any observed concentration
of BC or elemental carbon (EC) in snow in this region (Ming
et al., 2008, 2009; Xu et al., 2006; Kaspari et al., 2011; Ginot
et al., 2014).
The presence of absorbers in the snow has multiple im-
pacts on the properties of the snow, which finally contribute
to the radiative forcing (Painter et al., 2007; Flanner et al.,
2007). The first order impact is related to the direct reduction
of the snow albedo due to the incorporation of the absorbers
in the snow. A second order impact is linked to the fact that
the reduction of the albedo leads to a stronger warming of the
snowpack compared to the clean snow, causing a faster meta-
morphism (or snow aging) and, thus, a more efficient grow-
ing of the snow crystals. Since larger snow crystals cause a
reduced albedo, this effect leads to a further reduction of the
albedo of the snowpack. Nevertheless, the forcing related to
changes in the albedo remains small compared to the positive
radiative forcing induced by the earlier exposition of the un-
derlying soil caused by an accelerated melting of the warmer
snow containing BC. To study these multiple impacts of the
absorbing impurities on the processes and properties of the
snow in detail, a detailed physical snowpack model like Cro-
cus with sufficient complexity is needed (Brun et al., 1989,
1992; Vionnet et al., 2012). Crocus is capable of calculat-
ing the internal energy budget of the snowpack, to resolve
temperature gradients inside the snowpack, and to simulate
the metamorphism of the snow. However, the standard model
version does not allow considering absorbing impurities like
BC or dust for the calculation of the albedo.
Here, we report multi-annual measurements of BC in sur-
face snow sampled on the southern slopes of the Himalayas
close to NCO-P. We compare the snow concentrations with
simultaneous atmospheric measurements to investigate the
role of wet and dry deposition. Moreover, we present the
Crocus snowpack model with an upgraded radiative trans-
fer scheme to study the impact of BC and dust in snow.
Forced with 3 years of meteorological observations from
the Pyramid International Laboratory (close to NCO-P) and
with observed BC and dust concentrations, the model was
used to study the impact of the two absorbing impurities
on snow metamorphism, melting, and local radiative forc-
ing. The model results including sensitivities of the melting
and radiative forcing due to the presence of BC and/or dust in
the snow are presented and compared to previous large-scale
model studies.
2 Methods
2.1 Snow sampling
56 samples of surface snow were collected in Nepal dur-
ing the period from 13 November 2009 to 29 February
2012 at three different locations in the Khumbu region
south of the Mount Everest: At NCO-P (27.96◦ N, 86.81◦ E;
5079 m a.s.l.) and on the glaciers Changri Nup (27.98◦ N,
86.76◦ E; 5700 m a.s.l.) and Pokalde (27.93◦ N; 86.83◦ E;
5600 m a.s.l.; Fig. 1). In most cases, snow from the top layer
(≤ 10 cm) was collected and transported to France. Using
field notes, observed precipitation, and snow height at NCO-
P, 51 of the available snow samples were classified into fresh
snow (i.e., snowfall within 24 h before sampling) and old
snow. Five samples remained unclassified.
2.2 Snow sample analysis and handling
The snow samples were analyzed using a Single Parti-
cle Soot Photometer (SP2, Droplet Measurement Technolo-
gies, US) to determine refractory BC (rBC) particles. De-
tails of the analytical procedure are described in Lim et
al. (2014). The SP2 applies a laser-induced incandescence
technique to measure the mass of individual rBC particles
(Schwarz et al., 2006), independent of particle morphology
and light-scattering coating materials (Moteki and Kondo,
2007, 2010). Each rBC particle passes through the laser beam
intracavity, where it absorbs light, reaches a vaporization
temperature, at which it incandesces, and emits visible ther-
mal radiation proportional to the mass of the individual par-
ticles. The SP2 is highly sensitive to rBC particles, but much
less to other absorbing particles like dust. It was calibrated
with fullerene soot (Alfa Aesar Inc., USA), a standard BC
material of known single particle mass aggregating primary
particles with graphitic structure. A new nebulizer (APEX-Q,
Elemental Scientific Inc., Omaha, USA) was used to increase
the efficiency of the transfer of the rBC particles in the snow
into the gas phase. The rBC losses during aerosolization were
determined using eight liquid Aquadag® standards, resulting
in an average efficiency of 56 %, which was applied to all BC
concentrations reported here.
All snow samples melted during transport from the field
sites to France. They were stored at < 5 ◦C until analysis
in April 2012. Before analysis, the samples were sonicated
for 15 min to minimize rBC losses on the container wall.
Five selected samples were reanalyzed almost 2 years later
to evaluate the rBC particle loss during long-term storage of
the samples in liquid form. The samples showed decreases
in detected rBC concentrations between 0 and 80 %, which
is probably related to particles’ attachment on the container
wall and the agglomeration of particles. The loss during stor-
age was not straightforward and seemed to be highly variable
depending on storage time and rBC concentration. Therefore,
all measured concentrations are presented here without any
further correction for potential rBC losses during transport or
storage and should be considered as minimum values.
www.the-cryosphere.net/9/1685/2015/ The Cryosphere, 9, 1685–1699, 2015
1688 H.-W. Jacobi et al.: Black carbon in snow in the upper Himalayan Khumbu Valley
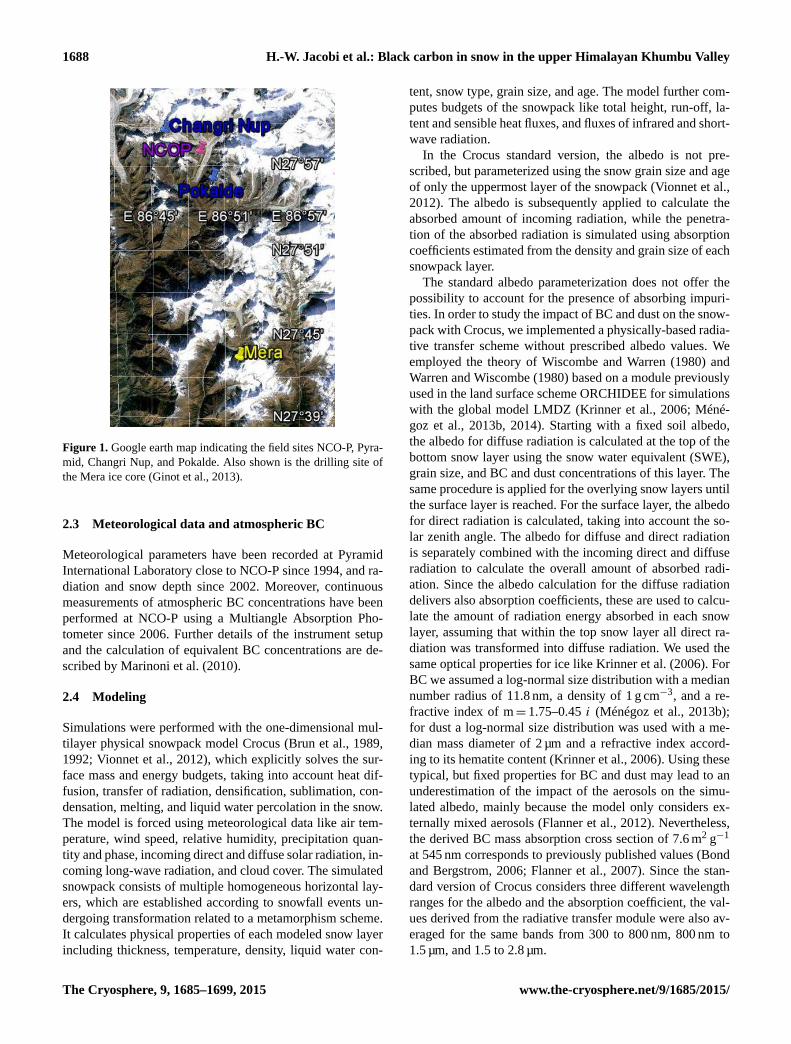
Figure 1. Google earth map indicating the field sites NCO-P, Pyra-
mid, Changri Nup, and Pokalde. Also shown is the drilling site of
the Mera ice core (Ginot et al., 2013).
2.3 Meteorological data and atmospheric BC
Meteorological parameters have been recorded at Pyramid
International Laboratory close to NCO-P since 1994, and ra-
diation and snow depth since 2002. Moreover, continuous
measurements of atmospheric BC concentrations have been
performed at NCO-P using a Multiangle Absorption Pho-
tometer since 2006. Further details of the instrument setup
and the calculation of equivalent BC concentrations are de-
scribed by Marinoni et al. (2010).
2.4 Modeling
Simulations were performed with the one-dimensional mul-
tilayer physical snowpack model Crocus (Brun et al., 1989,
1992; Vionnet et al., 2012), which explicitly solves the sur-
face mass and energy budgets, taking into account heat dif-
fusion, transfer of radiation, densification, sublimation, con-
densation, melting, and liquid water percolation in the snow.
The model is forced using meteorological data like air tem-
perature, wind speed, relative humidity, precipitation quan-
tity and phase, incoming direct and diffuse solar radiation, in-
coming long-wave radiation, and cloud cover. The simulated
snowpack consists of multiple homogeneous horizontal lay-
ers, which are established according to snowfall events un-
dergoing transformation related to a metamorphism scheme.
It calculates physical properties of each modeled snow layer
including thickness, temperature, density, liquid water con-
tent, snow type, grain size, and age. The model further com-
putes budgets of the snowpack like total height, run-off, la-
tent and sensible heat fluxes, and fluxes of infrared and short-
wave radiation.
In the Crocus standard version, the albedo is not pre-
scribed, but parameterized using the snow grain size and age
of only the uppermost layer of the snowpack (Vionnet et al.,
2012). The albedo is subsequently applied to calculate the
absorbed amount of incoming radiation, while the penetra-
tion of the absorbed radiation is simulated using absorption
coefficients estimated from the density and grain size of each
snowpack layer.
The standard albedo parameterization does not offer the
possibility to account for the presence of absorbing impuri-
ties. In order to study the impact of BC and dust on the snow-
pack with Crocus, we implemented a physically-based radia-
tive transfer scheme without prescribed albedo values. We
employed the theory of Wiscombe and Warren (1980) and
Warren and Wiscombe (1980) based on a module previously
used in the land surface scheme ORCHIDEE for simulations
with the global model LMDZ (Krinner et al., 2006; Méné-
goz et al., 2013b, 2014). Starting with a fixed soil albedo,
the albedo for diffuse radiation is calculated at the top of the
bottom snow layer using the snow water equivalent (SWE),
grain size, and BC and dust concentrations of this layer. The
same procedure is applied for the overlying snow layers until
the surface layer is reached. For the surface layer, the albedo
for direct radiation is calculated, taking into account the so-
lar zenith angle. The albedo for diffuse and direct radiation
is separately combined with the incoming direct and diffuse
radiation to calculate the overall amount of absorbed radi-
ation. Since the albedo calculation for the diffuse radiation
delivers also absorption coefficients, these are used to calcu-
late the amount of radiation energy absorbed in each snow
layer, assuming that within the top snow layer all direct ra-
diation was transformed into diffuse radiation. We used the
same optical properties for ice like Krinner et al. (2006). For
BC we assumed a log-normal size distribution with a median
number radius of 11.8 nm, a density of 1 g cm−3, and a re-
fractive index of m= 1.75–0.45 i (Ménégoz et al., 2013b);
for dust a log-normal size distribution was used with a me-
dian mass diameter of 2 µm and a refractive index accord-
ing to its hematite content (Krinner et al., 2006). Using these
typical, but fixed properties for BC and dust may lead to an
underestimation of the impact of the aerosols on the simu-
lated albedo, mainly because the model only considers ex-
ternally mixed aerosols (Flanner et al., 2012). Nevertheless,
the derived BC mass absorption cross section of 7.6 m2 g−1
at 545 nm corresponds to previously published values (Bond
and Bergstrom, 2006; Flanner et al., 2007). Since the stan-
dard version of Crocus considers three different wavelength
ranges for the albedo and the absorption coefficient, the val-
ues derived from the radiative transfer module were also av-
eraged for the same bands from 300 to 800 nm, 800 nm to
1.5 µm, and 1.5 to 2.8 µm.
The Cryosphere, 9, 1685–1699, 2015 www.the-cryosphere.net/9/1685/2015/
H.-W. Jacobi et al.: Black carbon in snow in the upper Himalayan Khumbu Valley 1689
For our simulations we used observations covering the pe-
riod August 2004 to July 2007 obtained at an altitude of
5050 m a.s.l. at Pyramid Laboratory to construct the needed
forcing data. Quality controlled 1 h averages were used for
temperature, wind speed, humidity, and radiation without
further correction. However, it is well known that the ob-
served precipitation significantly underestimates solid pre-
cipitation (Bonasoni et al., 2010; Shrestha et al., 2012). Ac-
cordingly, the observed snow height shows for several in-
stances strong increases, while no simultaneous precipitation
was recorded as already described by Shrestha et al. (2012).
As a result, preliminary simulations with the standard and
upgraded Crocus model with the recorded precipitation did
not lead to the build-up of a significant snowpack. Therefore,
a corrected precipitation data set based on the observed snow
height was constructed and employed for all further snow-
pack simulations. If the snow height showed an increase,
while no precipitation was detected, the increase in snow
height was transformed into accumulation using a density
of fresh snow of 0.08 g cm−3. Using such a density led to
a good agreement of simulated and observed increases in the
snowpack height during the 2004/2005 winter season. Since
the detector of the snowpack height showed regular fluctu-
ations around ±1 cm, only increases in height larger than
1 cm were considered (Shrestha et al., 2012). In addition,
the snow height sensor recorded several peaks with strong
increases in height and subsequent large decreases of sev-
eral tens of cm within hours or days. These peaks were re-
moved after visual inspection of the time series. Finally, the
phase of the precipitation was estimated using observed air
temperatures with only solid precipitation at Tair < 0 ◦C, only
liquid precipitation at Tair >+2 ◦C, and mixed phase precip-
itation with 50 % solid precipitation in the remaining tem-
perature range. A comparison of recorded and corrected time
series of precipitation is shown in the Supplementary mate-
rial (Figs. S1a, b, and c in the Supplement). After applying
the corrections the estimated total annual precipitation cor-
responds to 491.7 mm (41 % solid precipitation), 423.8 mm
(55 % solid precipitation), and 454.8 mm (51 % solid precip-
itation) for the years 2004/2005, 2005/2006, and 2006/2007,
compared to the recorded total precipitation of only 360
(2004/2005), 231 (2005/2006), and 304 mm (2006/2007).
The corrected annual values are in excellent agreement with
an estimated multi-year average of the annual precipitation
of ∼ 450 mm at NCO-P for the period 1994 to 2013 (Salerno
et al., 2015). Due to the uncertainty in the estimated solid
precipitation, the model sensitivity was tested using differing
meteorological forcing data for the year 2004/2005. These
data sets were generated with different thresholds for the
solid, mixed phase, and liquid precipitation varying from 0 to
4 ◦C. They are described in the Supplementary material and
showed maximum and minimum values of solid precipitation
ranging from 30 to 56 % of the total precipitation (Table S1
in the Supplement).
In the Crocus simulations, the fraction of cloud cover is
used to determine the contributions of direct and diffuse radi-
ation to the total incoming radiation. For the simulations, the
cloud cover fraction was set to 0 (denoting clear sky) if the
ratio between observed and theoretical incoming solar radia-
tion was larger than 0.8, to 0.5 (denoting cloudy) if the ratio
was between 0.2 and 0.8, and to 1 (denoting overcast) if the
ratio was below 0.2. Based on these derived cloud fractions,
the observed incoming shortwave radiation was divided into
direct and diffuse radiation using the same parameterizations
as in the Crocus model. As a result the total incoming radi-
ation for the forcing of the model corresponds exactly to the
measured values. The estimated cloud cover only affects the
distribution between direct and diffuse radiation, which has
a slight impact on the calculation of the albedo as described
above.
3 Results and discussion
3.1 BC concentrations in surface snow
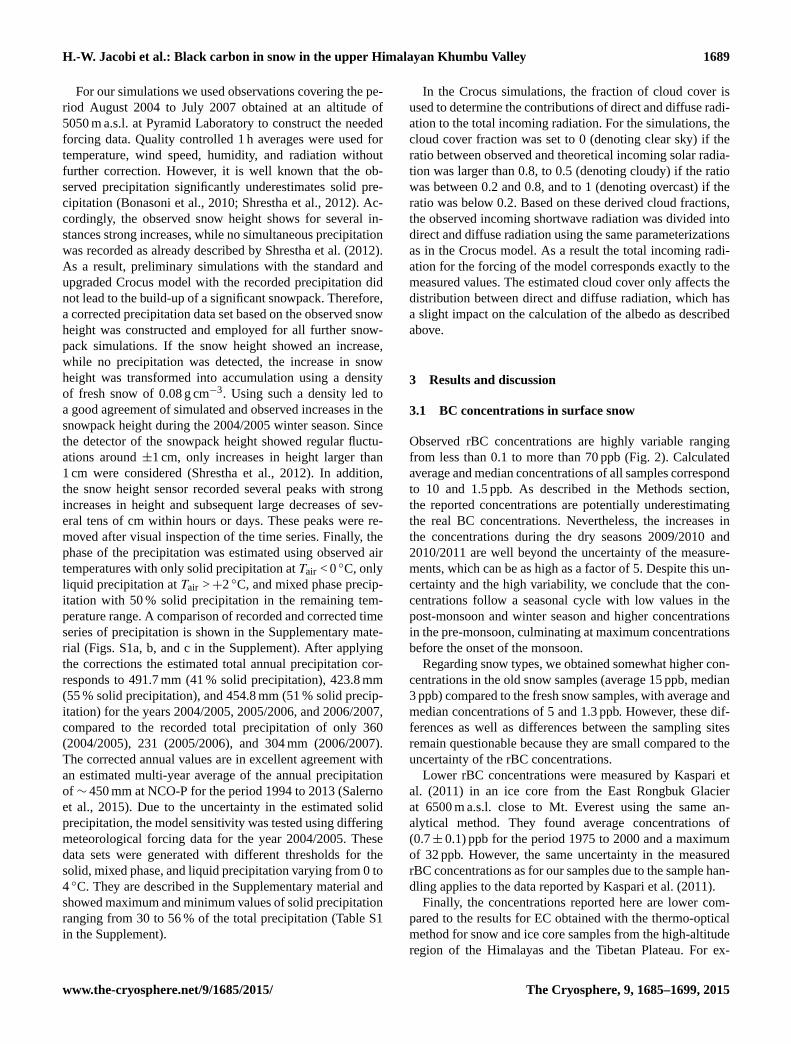
Observed rBC concentrations are highly variable ranging
from less than 0.1 to more than 70 ppb (Fig. 2). Calculated
average and median concentrations of all samples correspond
to 10 and 1.5 ppb. As described in the Methods section,
the reported concentrations are potentially underestimating
the real BC concentrations. Nevertheless, the increases in
the concentrations during the dry seasons 2009/2010 and
2010/2011 are well beyond the uncertainty of the measure-
ments, which can be as high as a factor of 5. Despite this un-
certainty and the high variability, we conclude that the con-
centrations follow a seasonal cycle with low values in the
post-monsoon and winter season and higher concentrations
in the pre-monsoon, culminating at maximum concentrations
before the onset of the monsoon.
Regarding snow types, we obtained somewhat higher con-
centrations in the old snow samples (average 15 ppb, median
3 ppb) compared to the fresh snow samples, with average and
median concentrations of 5 and 1.3 ppb. However, these dif-
ferences as well as differences between the sampling sites
remain questionable because they are small compared to the
uncertainty of the rBC concentrations.
Lower rBC concentrations were measured by Kaspari et
al. (2011) in an ice core from the East Rongbuk Glacier
at 6500 m a.s.l. close to Mt. Everest using the same an-
alytical method. They found average concentrations of
(0.7± 0.1) ppb for the period 1975 to 2000 and a maximum
of 32 ppb. However, the same uncertainty in the measured
rBC concentrations as for our samples due to the sample han-
dling applies to the data reported by Kaspari et al. (2011).
Finally, the concentrations reported here are lower com-
pared to the results for EC obtained with the thermo-optical
method for snow and ice core samples from the high-altitude
region of the Himalayas and the Tibetan Plateau. For ex-
www.the-cryosphere.net/9/1685/2015/ The Cryosphere, 9, 1685–1699, 2015
1690 H.-W. Jacobi et al.: Black carbon in snow in the upper Himalayan Khumbu Valley
Figure 2. Time series of measured BC concentration in surface
snow samples from the Khumbu Valley. The samples were clas-
sified into fresh (blue), old (red), and unknown snow (black). The
symbols on the right show median concentrations for fresh (blue),
old (red), and all snow samples (black). The error bars correspond
to the 25th and 75th percentile. Shaded blue areas indicate the mon-
soon periods 2009, 2010, and 2011 over Nepal according to Tyagi
et al. (2010, 2011) and Tyagi and Pai (2012). The black line corre-
sponds to the BC concentration for the period between 1 September
2009 and 8 November 2010 season determined in the Mera ice core
(Ginot et al., 2013) with the surface snow concentration from 11
November 2010 shown as black squares. The green line shows the
atmospheric BC concentrations measured at NCO-P.
ample, Ming et al. (2008, 2009) reported EC concentrations
between 2 and 981 ppb in surface snow samples from West
China for the period 2004 to 2006 and average concentrations
around 20 ppb in an ice core section covering 1995–2002 ex-
tracted from the East Rongbuk Glacier. Higher EC values
compare well to a comparison of EC and rBC measurements
using the same snow samples from Nepal, leading to an av-
erage EC / rBC ratio of 3.4 (Lim et al., 2014). In contrast,
comparable results were obtained by Xu et al. (2006), who
reported a range of EC concentration between 4 and 80 ppb
in surface and fresh snow samples collected between 2001
and 2004 on various glaciers on the Tibetan Plateau.
The seasonal cycle in the surface snow corresponds well
to the rBC concentration profile measured in an ice core re-
trieved from the Mera glacier at 6376 m a.s.l. (Ginot et al.,
2014). While minimum rBC concentrations were similar,
maximum concentrations in the ice core remained smaller
probably due to lower deposition at higher altitudes. For
comparison, the results of the overlapping period in the ice
core and surface snow samples are shown in Fig. 2. Low con-
centrations of 0.35 ppb were found in the surface snow cor-
responding to the November layer, which is absent in the rest
of the ice core due to efficient erosion during the following
winter season.
The surface snow samples as well as the Mera ice core
reveal the impact of wet and dry deposition responsible for
the incorporation of BC into the snow and strong links with
the seasonal cycle of precipitation and atmospheric BC con-
centrations as recorded at NCO-P (Figs. S1a, b, c, 2). It
seems that wet deposition due to the accumulation of fresh
snow leads to relatively small concentrations of rBC around
1 ppb. However, in the case of snowfall during the pre-
monsoon season, when atmospheric BC concentrations are
high, rBC concentrations in fresh snow can increase to more
than 10 ppb. Additional dry deposition of BC seems to have a
relatively small impact during the winter period and old snow
exposed at the surface contains relatively low BC amounts.
Maximum BC concentrations are reached again in the pre-
monsoon season potentially combining large inputs due to
wet and dry deposition. Yasunari et al. (2013) estimated BC
concentrations in surface snow using deposition velocities
calculated with meteorological measurements at NCO-P and
atmospheric measurements of equivalent BC. Considering
only dry deposition they obtained concentrations between 90
and 130 ppb in old snow for a continuous snowpack until
end of May. The observed rBC maxima are somewhat lower
than these values, possibly because the seasonal snowpack at
NCO-P melts earlier and some of the BC may be lost due to
the handling of the samples.
3.2 Snowpack modeling: standard vs. upgraded model
Although the Crocus model has so far been used in differ-
ent alpine and polar regions (e.g., Jacobi et al., 2010; Brun
et al., 2011; Vionnet et al., 2012), it has to our knowledge
never been applied to simulate the seasonal snowpack in
the Himalayas. Recently, a modified version of the model
was employed to simulate the snow on top of a debris-
covered glacier in the Khumbu Valley (Lejeune et al., 2013).
To examine the performance of the two model versions,
we first compared the results of the standard Crocus model
and the upgraded version including the radiative transfer for
the seasons 2004/2005, 2005/2006, and 2006/2007, apply-
ing the forcing data based on the observations at the Pyra-
mid site. The simulated snowpack heights for the season
2004/2005 are shown in Fig. 3 (for the seasons 2005/2006
and 2006/2007 in the Supplement, Figs. S2a and b). In all
three winter seasons, the standard Crocus model largely over-
estimates the period with snow on the ground (Figs. 3, S2a
and b). For example, Crocus predicts the formation of a con-
tinuous snowpack starting on 14 October 2004 and lasting
until 4 January 2005 due to several small snowfall events in
October and November. However, the snow height records
and albedo measurements show that during this period the
fresh snow regularly melts within a day after precipitation.
The onset of the seasonal winter snowpack at the end of Jan-
uary 2005, corresponding to the longest period with contin-
uous snow on the ground, is well represented by Crocus be-
cause the observed snowpack heights are used to construct
the precipitation time series. In contrast, observed snowpack
heights start to decrease mid-February 2005 and are inter-
rupted only by additional accumulation in mid-March, until
the snow disappears before the end of March 2005. In con-
trast, the winter snowpack remains intact in the Crocus simu-
The Cryosphere, 9, 1685–1699, 2015 www.the-cryosphere.net/9/1685/2015/
H.-W. Jacobi et al.: Black carbon in snow in the upper Himalayan Khumbu Valley 1691
Figure 3. Comparison of observed (black) and simulated snowpack
heights (top) and albedo (bottom) at NCO-P for the winter season
2004/2005. Simulations were performed with the standard crocus
model (red) and with the upgraded model including radiative trans-
fer with constant BC concentrations of 0 (yellow), 100 (blue), and
300 ppb (green). Snowpack heights simulated with the upgraded
model are indistinguishable for the different BC concentrations un-
til late January and after mid-May.
lations until end of May 2005, while it melts completely only
on 10 June 2005. In summary, while the observed total period
with snow on the ground (defined as an observed snow height
> 2 cm) corresponds to 78 days, the standard Crocus model
predicts a period of 238 days with snow on the ground. The
period with snow on the ground is similarly overestimated by
Crocus for the years 2005/2006 and 2006/07 with +91 and
+157 days compared to the observations (Figs. S2a and b).
The positive bias is strongly reduced using the upgraded
Crocus model including the radiative transfer even without
considering any absorbing impurity. During these simula-
tions the snowpack shows a much stronger dynamic with
faster drops in the snow height compared to the standard
model. Moreover, fresh snow in the fall and early winter sea-
son is not conserved for more than 24 h (Figs. 3 and S2a)
and melts in agreement with the observed snow heights
(Fig. S2b). The simulated duration of the snow cover is re-
duced between 54 and 103 days compared to the standard
Crocus model. Nevertheless, the period with snow on the
ground is still overestimated by 57, 37, and 66 days for the
years 2004/2005, 2005/2006, and 2006/2007 relative to the
observations.
The different behavior of the standard and the upgraded
model is related to the calculated albedo and the correspond-
ing energy absorbed by the snowpack. Figure 3 shows a
comparison of the simulated albedo for 2004/2005 together
with observed albedo derived from the ratio of the up- and
downwelling shortwave radiation. A large part of the differ-
ences between observed and simulated albedo concerning all
model results is related to the overestimation of the simu-
lated periods with snow. Apparently, the model delivers high
albedo values for the period when snow is still present, while
the observations correspond to the low values of the soil after
the melting of the snow.
Figure 3 illustrates further differences in the simulated
albedo of the two model versions and the impact of increas-
ing the BC concentrations. In the standard model, the albedo
rises with each precipitation event to values around 0.9 be-
fore it slowly decreases due to the albedo parameterization
related to the aging of the snow. Since only the properties
of the top snow layer are considered in the standard model,
the simulated albedo is not affected by the thickness of the
snowpack and the parameterized albedo is similar regardless
of the snow height. In contrast, the effect of a thin snowpack
is better reproduced by the upgraded model. Here, the SWE
of each snowpack layer is an important variable and leads in
the case of a thin snowpack to strongly reduced albedo values
as can be seen in the cases of snowfall before December 2004
or after June 2005 (Fig. 3). During these events the simulated
albedo remains between 0.2 and 0.7, causing a stronger ab-
sorption of the incoming solar radiation and, thus, a complete
melting of the snow.
In all model versions, the precipitation in late January
leads to the formation of the seasonal winter snowpack
(Fig. 2) with an albedo between 0.6 and 0.9. These albedo
values of the fresh snow are relatively well reproduced by
both model versions (Fig. 3). However, neither model cap-
tures the relatively strong decrease of the albedo to 0.3 until
10 March before a new snowfall event increases the observed
albedo to more than 0.8. In both model versions the overes-
timation of the period with snow on the ground is directly
linked to the positive bias in the simulated albedo. Similar
results are obtained for the years 2005/2006 and 2006/2007
(Figs. S3a and b). A statistical analysis of the comparison
between observed and simulated albedo including bias, root
mean squared errors (RMSE), and correlation coefficients
for all three winter seasons is compiled in the Supplemen-
tary material (Table S2). The results show an improvement
of the simulated albedo using the upgraded Crocus model,
which improves further after increasing the BC concentra-
tions from 0 to 100 or 300 ppb. On average for all three win-
ter seasons, the bias and RMSE are below 0.11 and 0.18 in
the best model runs, while the correlation coefficient is as
high as 0.5. Considering only the first month of each win-
ter season, the bias and RMSE decrease to below 0.01 and
0.09, while the correlation coefficient increases only slightly.
Similarly, Shrestha et al. (2012) simulated a delayed melting
of the snow and overestimated the springtime snow-covered
area in the Dudhkoshi region with a three-layer snow model.
www.the-cryosphere.net/9/1685/2015/ The Cryosphere, 9, 1685–1699, 2015
1692 H.-W. Jacobi et al.: Black carbon in snow in the upper Himalayan Khumbu Valley
They also attributed a large part of the model bias to the used
simplified albedo parameterization. This corresponds well to
results from previous snow model comparisons indicating
that the albedo parameterization is a crucial component for
snow models (Etchevers et al., 2004).
Although an important part of the positive bias in the
albedo is reduced in the presence of absorbing impurities,
strong differences between observed and simulated albedo
remain, especially in the later part of the winter season in-
cluding the melting period. Sensitivity runs with varying
amounts of solid precipitations show only small differences
in the snow-covered periods (Fig. S5 and S6) and in the
simulated albedo. Moroever, the impact on the bias, RMSE,
and correlation coefficients of the simulated albedo remained
negligible (Table S3). Therefore, the uncertainty in the esti-
mated precipitation cannot explain the overestimation of the
snow-covered period and the albedo.
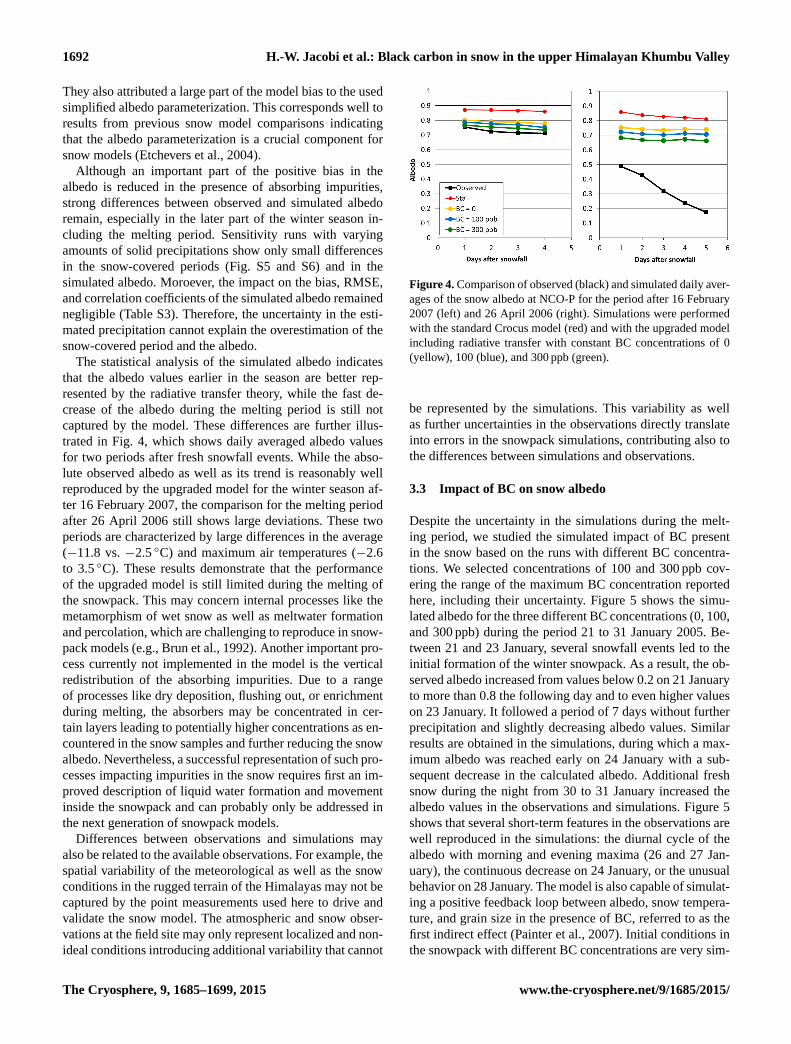
The statistical analysis of the simulated albedo indicates
that the albedo values earlier in the season are better rep-
resented by the radiative transfer theory, while the fast de-
crease of the albedo during the melting period is still not
captured by the model. These differences are further illus-
trated in Fig. 4, which shows daily averaged albedo values
for two periods after fresh snowfall events. While the abso-
lute observed albedo as well as its trend is reasonably well
reproduced by the upgraded model for the winter season af-
ter 16 February 2007, the comparison for the melting period
after 26 April 2006 still shows large deviations. These two
periods are characterized by large differences in the average
(−11.8 vs. −2.5 ◦C) and maximum air temperatures (−2.6
to 3.5 ◦C). These results demonstrate that the performance
of the upgraded model is still limited during the melting of
the snowpack. This may concern internal processes like the
metamorphism of wet snow as well as meltwater formation
and percolation, which are challenging to reproduce in snow-
pack models (e.g., Brun et al., 1992). Another important pro-
cess currently not implemented in the model is the vertical
redistribution of the absorbing impurities. Due to a range
of processes like dry deposition, flushing out, or enrichment
during melting, the absorbers may be concentrated in cer-
tain layers leading to potentially higher concentrations as en-
countered in the snow samples and further reducing the snow
albedo. Nevertheless, a successful representation of such pro-
cesses impacting impurities in the snow requires first an im-
proved description of liquid water formation and movement
inside the snowpack and can probably only be addressed in
the next generation of snowpack models.
Differences between observations and simulations may
also be related to the available observations. For example, the
spatial variability of the meteorological as well as the snow
conditions in the rugged terrain of the Himalayas may not be
captured by the point measurements used here to drive and
validate the snow model. The atmospheric and snow obser-
vations at the field site may only represent localized and non-
ideal conditions introducing additional variability that cannot
Figure 4. Comparison of observed (black) and simulated daily aver-
ages of the snow albedo at NCO-P for the period after 16 February
2007 (left) and 26 April 2006 (right). Simulations were performed
with the standard Crocus model (red) and with the upgraded model
including radiative transfer with constant BC concentrations of 0
(yellow), 100 (blue), and 300 ppb (green).
be represented by the simulations. This variability as well
as further uncertainties in the observations directly translate
into errors in the snowpack simulations, contributing also to
the differences between simulations and observations.
3.3 Impact of BC on snow albedo
Despite the uncertainty in the simulations during the melt-
ing period, we studied the simulated impact of BC present
in the snow based on the runs with different BC concentra-
tions. We selected concentrations of 100 and 300 ppb cov-
ering the range of the maximum BC concentration reported
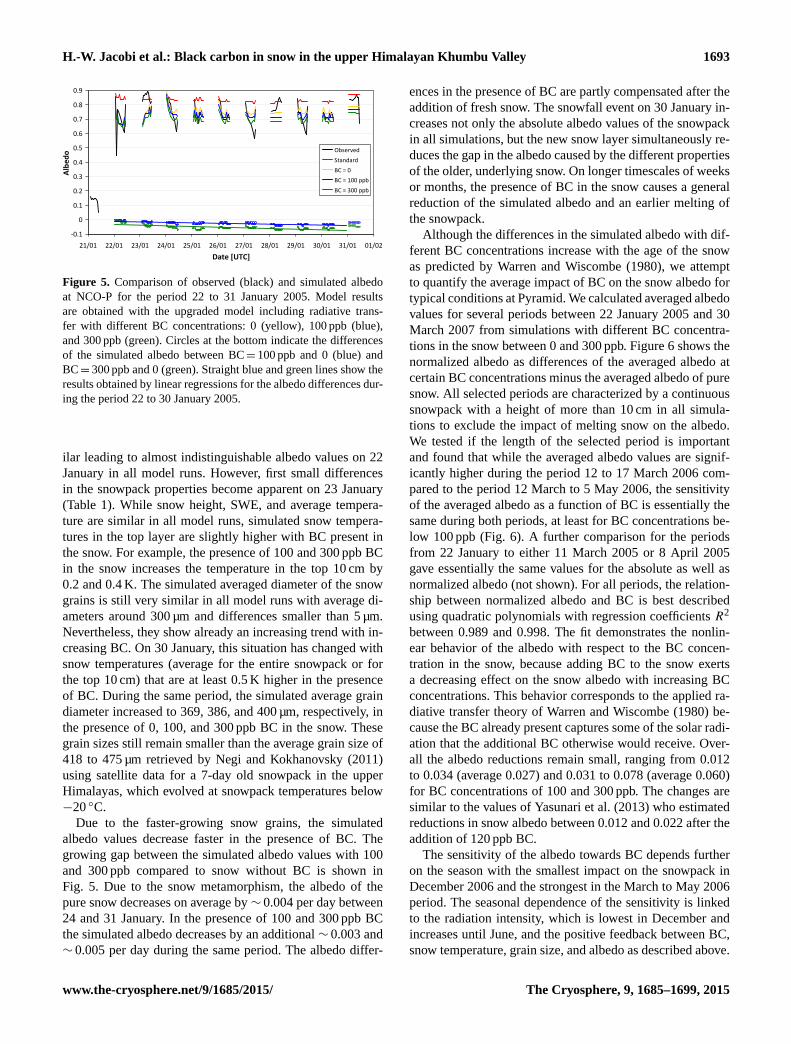
here, including their uncertainty. Figure 5 shows the simu-
lated albedo for the three different BC concentrations (0, 100,
and 300 ppb) during the period 21 to 31 January 2005. Be-
tween 21 and 23 January, several snowfall events led to the
initial formation of the winter snowpack. As a result, the ob-
served albedo increased from values below 0.2 on 21 January
to more than 0.8 the following day and to even higher values
on 23 January. It followed a period of 7 days without further
precipitation and slightly decreasing albedo values. Similar
results are obtained in the simulations, during which a max-
imum albedo was reached early on 24 January with a sub-
sequent decrease in the calculated albedo. Additional fresh
snow during the night from 30 to 31 January increased the
albedo values in the observations and simulations. Figure 5
shows that several short-term features in the observations are
well reproduced in the simulations: the diurnal cycle of the
albedo with morning and evening maxima (26 and 27 Jan-
uary), the continuous decrease on 24 January, or the unusual
behavior on 28 January. The model is also capable of simulat-
ing a positive feedback loop between albedo, snow tempera-
ture, and grain size in the presence of BC, referred to as the
first indirect effect (Painter et al., 2007). Initial conditions in
the snowpack with different BC concentrations are very sim-
The Cryosphere, 9, 1685–1699, 2015 www.the-cryosphere.net/9/1685/2015/
H.-W. Jacobi et al.: Black carbon in snow in the upper Himalayan Khumbu Valley 1693
-0.1
0
0.1
0.2
0.3
0.4
0.5
0.6
0.7
0.8
0.9
21/01 22/01 23/01 24/01 25/01 26/01 27/01 28/01 29/01 30/01 31/01 01/02
Date [UTC]
Alb
ed
o Observed
Standard
BC = 0
BC = 100 ppb
BC = 300 ppb
Figure 5. Comparison of observed (black) and simulated albedo
at NCO-P for the period 22 to 31 January 2005. Model results
are obtained with the upgraded model including radiative trans-
fer with different BC concentrations: 0 (yellow), 100 ppb (blue),
and 300 ppb (green). Circles at the bottom indicate the differences
of the simulated albedo between BC= 100 ppb and 0 (blue) and
BC= 300 ppb and 0 (green). Straight blue and green lines show the
results obtained by linear regressions for the albedo differences dur-
ing the period 22 to 30 January 2005.
ilar leading to almost indistinguishable albedo values on 22
January in all model runs. However, first small differences
in the snowpack properties become apparent on 23 January
(Table 1). While snow height, SWE, and average tempera-
ture are similar in all model runs, simulated snow tempera-
tures in the top layer are slightly higher with BC present in
the snow. For example, the presence of 100 and 300 ppb BC
in the snow increases the temperature in the top 10 cm by
0.2 and 0.4 K. The simulated averaged diameter of the snow
grains is still very similar in all model runs with average di-
ameters around 300 µm and differences smaller than 5 µm.
Nevertheless, they show already an increasing trend with in-
creasing BC. On 30 January, this situation has changed with
snow temperatures (average for the entire snowpack or for
the top 10 cm) that are at least 0.5 K higher in the presence
of BC. During the same period, the simulated average grain
diameter increased to 369, 386, and 400 µm, respectively, in
the presence of 0, 100, and 300 ppb BC in the snow. These
grain sizes still remain smaller than the average grain size of
418 to 475 µm retrieved by Negi and Kokhanovsky (2011)
using satellite data for a 7-day old snowpack in the upper
Himalayas, which evolved at snowpack temperatures below
−20 ◦C.
Due to the faster-growing snow grains, the simulated
albedo values decrease faster in the presence of BC. The
growing gap between the simulated albedo values with 100
and 300 ppb compared to snow without BC is shown in
Fig. 5. Due to the snow metamorphism, the albedo of the
pure snow decreases on average by ∼ 0.004 per day between
24 and 31 January. In the presence of 100 and 300 ppb BC
the simulated albedo decreases by an additional ∼ 0.003 and
∼ 0.005 per day during the same period. The albedo differ-
ences in the presence of BC are partly compensated after the
addition of fresh snow. The snowfall event on 30 January in-
creases not only the absolute albedo values of the snowpack
in all simulations, but the new snow layer simultaneously re-
duces the gap in the albedo caused by the different properties
of the older, underlying snow. On longer timescales of weeks
or months, the presence of BC in the snow causes a general
reduction of the simulated albedo and an earlier melting of
the snowpack.
Although the differences in the simulated albedo with dif-
ferent BC concentrations increase with the age of the snow
as predicted by Warren and Wiscombe (1980), we attempt
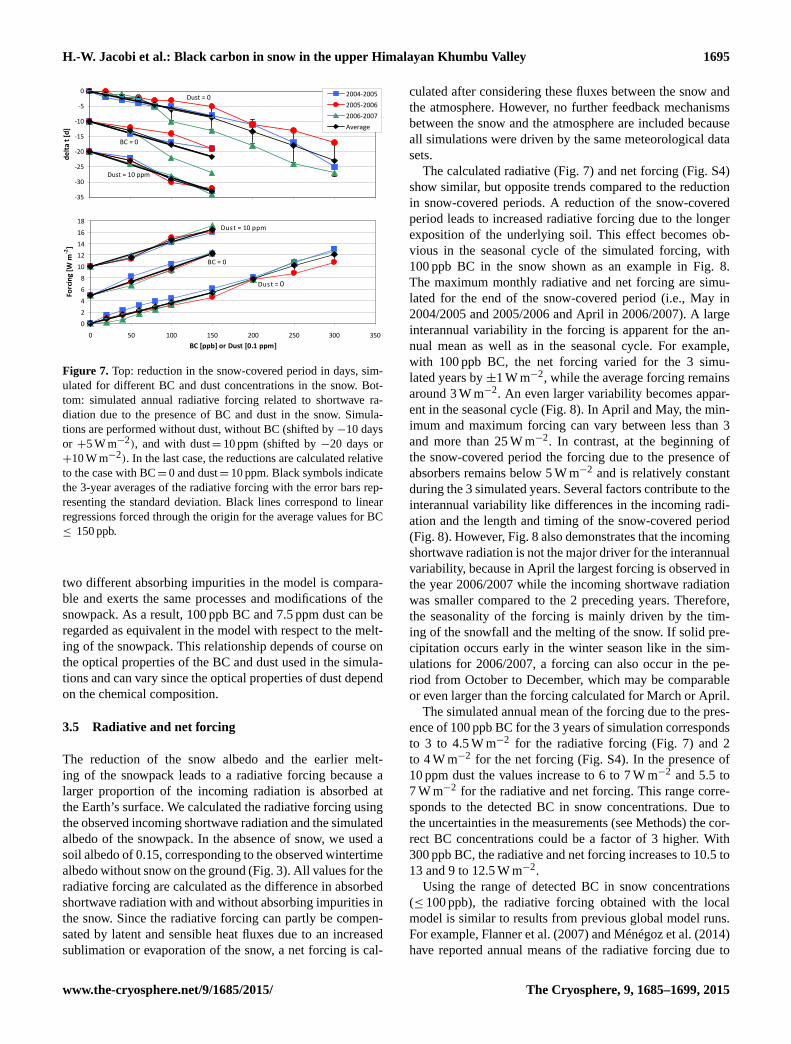
to quantify the average impact of BC on the snow albedo for
typical conditions at Pyramid. We calculated averaged albedo
values for several periods between 22 January 2005 and 30
March 2007 from simulations with different BC concentra-
tions in the snow between 0 and 300 ppb. Figure 6 shows the
normalized albedo as differences of the averaged albedo at
certain BC concentrations minus the averaged albedo of pure
snow. All selected periods are characterized by a continuous
snowpack with a height of more than 10 cm in all simula-
tions to exclude the impact of melting snow on the albedo.
We tested if the length of the selected period is important
and found that while the averaged albedo values are signif-
icantly higher during the period 12 to 17 March 2006 com-
pared to the period 12 March to 5 May 2006, the sensitivity
of the averaged albedo as a function of BC is essentially the
same during both periods, at least for BC concentrations be-
low 100 ppb (Fig. 6). A further comparison for the periods
from 22 January to either 11 March 2005 or 8 April 2005
gave essentially the same values for the absolute as well as
normalized albedo (not shown). For all periods, the relation-
ship between normalized albedo and BC is best described
using quadratic polynomials with regression coefficients R2
between 0.989 and 0.998. The fit demonstrates the nonlin-
ear behavior of the albedo with respect to the BC concen-
tration in the snow, because adding BC to the snow exerts
a decreasing effect on the snow albedo with increasing BC
concentrations. This behavior corresponds to the applied ra-
diative transfer theory of Warren and Wiscombe (1980) be-
cause the BC already present captures some of the solar radi-
ation that the additional BC otherwise would receive. Over-
all the albedo reductions remain small, ranging from 0.012
to 0.034 (average 0.027) and 0.031 to 0.078 (average 0.060)
for BC concentrations of 100 and 300 ppb. The changes are
similar to the values of Yasunari et al. (2013) who estimated
reductions in snow albedo between 0.012 and 0.022 after the
addition of 120 ppb BC.
The sensitivity of the albedo towards BC depends further
on the season with the smallest impact on the snowpack in
December 2006 and the strongest in the March to May 2006
period. The seasonal dependence of the sensitivity is linked
to the radiation intensity, which is lowest in December and
increases until June, and the positive feedback between BC,
snow temperature, grain size, and albedo as described above.
www.the-cryosphere.net/9/1685/2015/ The Cryosphere, 9, 1685–1699, 2015
1694 H.-W. Jacobi et al.: Black carbon in snow in the upper Himalayan Khumbu Valley
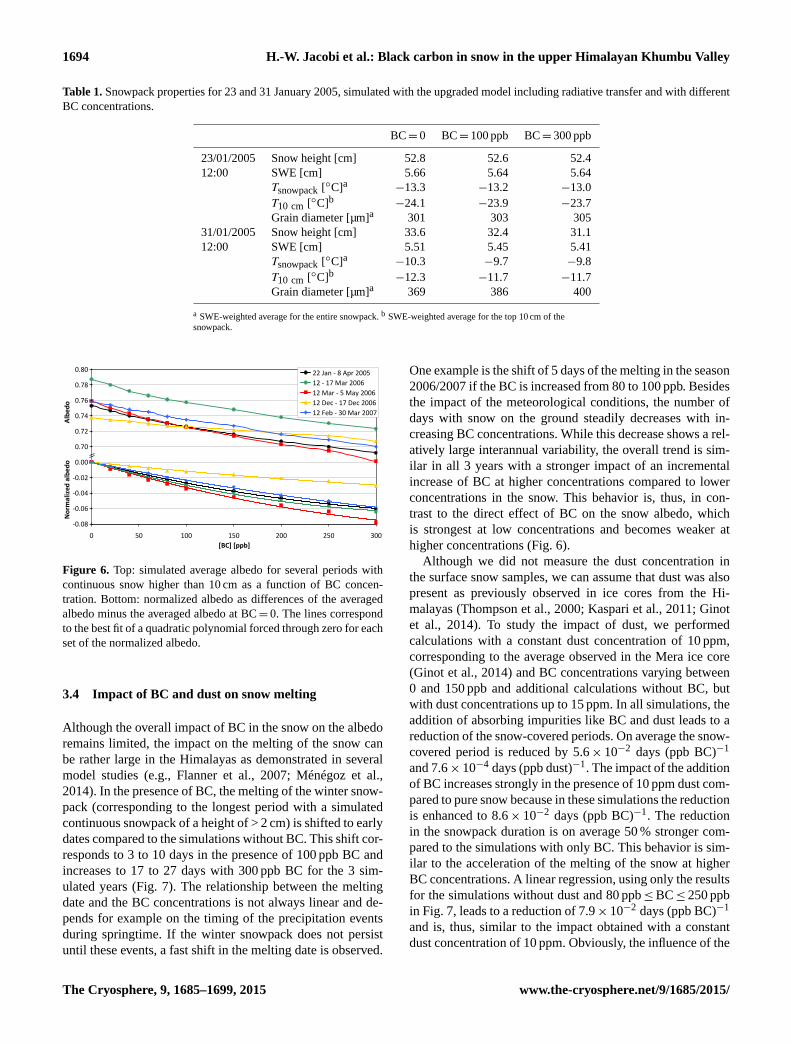
Table 1. Snowpack properties for 23 and 31 January 2005, simulated with the upgraded model including radiative transfer and with different
BC concentrations.
BC= 0 BC= 100 ppb BC= 300 ppb
23/01/2005 Snow height [cm] 52.8 52.6 52.4
12:00 SWE [cm] 5.66 5.64 5.64
Tsnowpack [◦C]a−13.3 −13.2 −13.0
T10 cm [◦C]b−24.1 −23.9 −23.7
Grain diameter [µm]a 301 303 305
31/01/2005 Snow height [cm] 33.6 32.4 31.1
12:00 SWE [cm] 5.51 5.45 5.41
Tsnowpack [◦C]a−10.3 −9.7 −9.8
T10 cm [◦C]b−12.3 −11.7 −11.7
Grain diameter [µm]a 369 386 400
a SWE-weighted average for the entire snowpack. b SWE-weighted average for the top 10 cm of the
snowpack.
0.80
0.78
0.76
0.74
0.72
0.70
0.00
-0.02
-0.04
-0.06
-0.08
0 50 100 150 200 250 300
[BC] [ppb]
No
rma
lize
d a
lbe
do
A
lbe
do
22 Jan - 8 Apr 2005
12 - 17 Mar 2006
12 Mar - 5 May 2006
12 Dec - 17 Dec 2006
12 Feb - 30 Mar 2007
Figure 6. Top: simulated average albedo for several periods with
continuous snow higher than 10 cm as a function of BC concen-
tration. Bottom: normalized albedo as differences of the averaged
albedo minus the averaged albedo at BC= 0. The lines correspond
to the best fit of a quadratic polynomial forced through zero for each
set of the normalized albedo.
3.4 Impact of BC and dust on snow melting
Although the overall impact of BC in the snow on the albedo
remains limited, the impact on the melting of the snow can
be rather large in the Himalayas as demonstrated in several
model studies (e.g., Flanner et al., 2007; Ménégoz et al.,
2014). In the presence of BC, the melting of the winter snow-
pack (corresponding to the longest period with a simulated
continuous snowpack of a height of > 2 cm) is shifted to early
dates compared to the simulations without BC. This shift cor-
responds to 3 to 10 days in the presence of 100 ppb BC and
increases to 17 to 27 days with 300 ppb BC for the 3 sim-
ulated years (Fig. 7). The relationship between the melting
date and the BC concentrations is not always linear and de-
pends for example on the timing of the precipitation events
during springtime. If the winter snowpack does not persist
until these events, a fast shift in the melting date is observed.
One example is the shift of 5 days of the melting in the season
2006/2007 if the BC is increased from 80 to 100 ppb. Besides
the impact of the meteorological conditions, the number of
days with snow on the ground steadily decreases with in-
creasing BC concentrations. While this decrease shows a rel-
atively large interannual variability, the overall trend is sim-
ilar in all 3 years with a stronger impact of an incremental
increase of BC at higher concentrations compared to lower
concentrations in the snow. This behavior is, thus, in con-
trast to the direct effect of BC on the snow albedo, which
is strongest at low concentrations and becomes weaker at
higher concentrations (Fig. 6).
Although we did not measure the dust concentration in
the surface snow samples, we can assume that dust was also
present as previously observed in ice cores from the Hi-
malayas (Thompson et al., 2000; Kaspari et al., 2011; Ginot
et al., 2014). To study the impact of dust, we performed
calculations with a constant dust concentration of 10 ppm,
corresponding to the average observed in the Mera ice core
(Ginot et al., 2014) and BC concentrations varying between
0 and 150 ppb and additional calculations without BC, but
with dust concentrations up to 15 ppm. In all simulations, the
addition of absorbing impurities like BC and dust leads to a
reduction of the snow-covered periods. On average the snow-
covered period is reduced by 5.6× 10⁻² days (ppb BC)−1
and 7.6× 10⁻⁴ days (ppb dust)−1. The impact of the addition
of BC increases strongly in the presence of 10 ppm dust com-
pared to pure snow because in these simulations the reduction
is enhanced to 8.6× 10⁻² days (ppb BC)−1. The reduction
in the snowpack duration is on average 50 % stronger com-
pared to the simulations with only BC. This behavior is sim-
ilar to the acceleration of the melting of the snow at higher
BC concentrations. A linear regression, using only the results
for the simulations without dust and 80 ppb≤BC≤ 250 ppb
in Fig. 7, leads to a reduction of 7.9× 10⁻² days (ppb BC)−1
and is, thus, similar to the impact obtained with a constant
dust concentration of 10 ppm. Obviously, the influence of the
The Cryosphere, 9, 1685–1699, 2015 www.the-cryosphere.net/9/1685/2015/
H.-W. Jacobi et al.: Black carbon in snow in the upper Himalayan Khumbu Valley 1695
-35
-30
-25
-20
-15
-10
-5
0
de
lta
t [
d]
2004-2005
2005-2006
2006-2007
Average
Dust = 0
BC = 0
Dust = 10 ppm
0
2
4
6
8
10
12
14
16
18
0 50 100 150 200 250 300 350
BC [ppb] or Dust [0.1 ppm]
Fo
rcin
g [
W m
-2]
Dus t =
BC = 0
Dust = 10 ppm
0
Figure 7. Top: reduction in the snow-covered period in days, sim-
ulated for different BC and dust concentrations in the snow. Bot-
tom: simulated annual radiative forcing related to shortwave ra-
diation due to the presence of BC and dust in the snow. Simula-
tions are performed without dust, without BC (shifted by −10 days
or +5 W m−2), and with dust= 10 ppm (shifted by −20 days or
+10 W m−2). In the last case, the reductions are calculated relative
to the case with BC= 0 and dust= 10 ppm. Black symbols indicate
the 3-year averages of the radiative forcing with the error bars rep-
resenting the standard deviation. Black lines correspond to linear
regressions forced through the origin for the average values for BC
≤ 150 ppb.
two different absorbing impurities in the model is compara-
ble and exerts the same processes and modifications of the
snowpack. As a result, 100 ppb BC and 7.5 ppm dust can be
regarded as equivalent in the model with respect to the melt-
ing of the snowpack. This relationship depends of course on
the optical properties of the BC and dust used in the simula-
tions and can vary since the optical properties of dust depend
on the chemical composition.
3.5 Radiative and net forcing
The reduction of the snow albedo and the earlier melt-
ing of the snowpack leads to a radiative forcing because a
larger proportion of the incoming radiation is absorbed at
the Earth’s surface. We calculated the radiative forcing using
the observed incoming shortwave radiation and the simulated
albedo of the snowpack. In the absence of snow, we used a
soil albedo of 0.15, corresponding to the observed wintertime
albedo without snow on the ground (Fig. 3). All values for the
radiative forcing are calculated as the difference in absorbed
shortwave radiation with and without absorbing impurities in
the snow. Since the radiative forcing can partly be compen-
sated by latent and sensible heat fluxes due to an increased
sublimation or evaporation of the snow, a net forcing is cal-
culated after considering these fluxes between the snow and
the atmosphere. However, no further feedback mechanisms
between the snow and the atmosphere are included because
all simulations were driven by the same meteorological data
sets.
The calculated radiative (Fig. 7) and net forcing (Fig. S4)
show similar, but opposite trends compared to the reduction
in snow-covered periods. A reduction of the snow-covered
period leads to increased radiative forcing due to the longer
exposition of the underlying soil. This effect becomes ob-
vious in the seasonal cycle of the simulated forcing, with
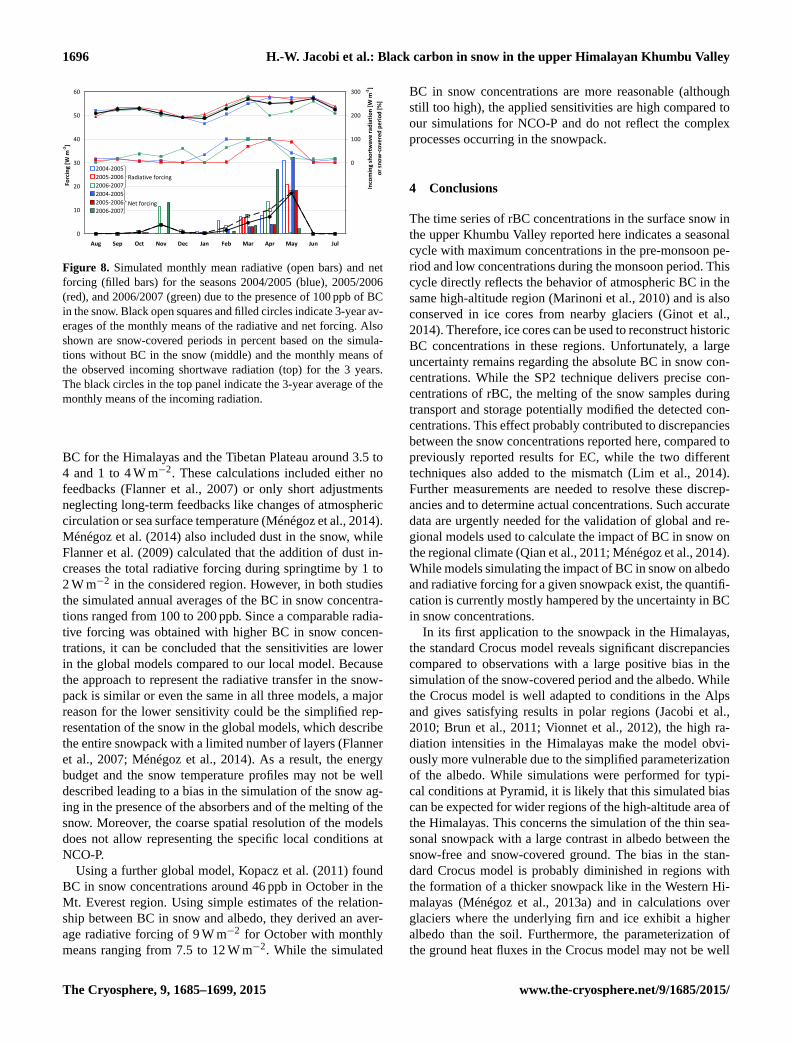
100 ppb BC in the snow shown as an example in Fig. 8.
The maximum monthly radiative and net forcing are simu-
lated for the end of the snow-covered period (i.e., May in
2004/2005 and 2005/2006 and April in 2006/2007). A large
interannual variability in the forcing is apparent for the an-
nual mean as well as in the seasonal cycle. For example,
with 100 ppb BC, the net forcing varied for the 3 simu-
lated years by ±1 W m−2, while the average forcing remains
around 3 W m−2. An even larger variability becomes appar-
ent in the seasonal cycle (Fig. 8). In April and May, the min-
imum and maximum forcing can vary between less than 3
and more than 25 W m−2. In contrast, at the beginning of
the snow-covered period the forcing due to the presence of
absorbers remains below 5 W m−2 and is relatively constant
during the 3 simulated years. Several factors contribute to the
interannual variability like differences in the incoming radi-
ation and the length and timing of the snow-covered period
(Fig. 8). However, Fig. 8 also demonstrates that the incoming
shortwave radiation is not the major driver for the interannual
variability, because in April the largest forcing is observed in
the year 2006/2007 while the incoming shortwave radiation
was smaller compared to the 2 preceding years. Therefore,
the seasonality of the forcing is mainly driven by the tim-
ing of the snowfall and the melting of the snow. If solid pre-
cipitation occurs early in the winter season like in the sim-
ulations for 2006/2007, a forcing can also occur in the pe-
riod from October to December, which may be comparable
or even larger than the forcing calculated for March or April.
The simulated annual mean of the forcing due to the pres-
ence of 100 ppb BC for the 3 years of simulation corresponds
to 3 to 4.5 W m−2 for the radiative forcing (Fig. 7) and 2
to 4 W m−2 for the net forcing (Fig. S4). In the presence of
10 ppm dust the values increase to 6 to 7 W m−2 and 5.5 to
7 W m−2 for the radiative and net forcing. This range corre-
sponds to the detected BC in snow concentrations. Due to
the uncertainties in the measurements (see Methods) the cor-
rect BC concentrations could be a factor of 3 higher. With
300 ppb BC, the radiative and net forcing increases to 10.5 to
13 and 9 to 12.5 W m−2.
Using the range of detected BC in snow concentrations
(≤ 100 ppb), the radiative forcing obtained with the local
model is similar to results from previous global model runs.
For example, Flanner et al. (2007) and Ménégoz et al. (2014)
have reported annual means of the radiative forcing due to
www.the-cryosphere.net/9/1685/2015/ The Cryosphere, 9, 1685–1699, 2015
1696 H.-W. Jacobi et al.: Black carbon in snow in the upper Himalayan Khumbu Valley
0
10
20
30
40
50
60
Aug Sep Oct Nov Dec Jan Feb Mar Apr May Jun Jul
Fo
rcin
g [
W m
-2]
-300
-200
-100
0
100
200
300
Inco
min
g s
ho
rtw
av
e r
ad
iati
on
[W
m-2
]
or
sno
w-c
ov
ere
d p
eri
od
[%
]
2004-2005
2005-2006
2006-2007
2004-2005
2005-2006
2006-2007
Radiative forcing
Net forcing
Figure 8. Simulated monthly mean radiative (open bars) and net
forcing (filled bars) for the seasons 2004/2005 (blue), 2005/2006
(red), and 2006/2007 (green) due to the presence of 100 ppb of BC
in the snow. Black open squares and filled circles indicate 3-year av-
erages of the monthly means of the radiative and net forcing. Also
shown are snow-covered periods in percent based on the simula-
tions without BC in the snow (middle) and the monthly means of
the observed incoming shortwave radiation (top) for the 3 years.
The black circles in the top panel indicate the 3-year average of the
monthly means of the incoming radiation.
BC for the Himalayas and the Tibetan Plateau around 3.5 to
4 and 1 to 4 W m−2. These calculations included either no
feedbacks (Flanner et al., 2007) or only short adjustments
neglecting long-term feedbacks like changes of atmospheric
circulation or sea surface temperature (Ménégoz et al., 2014).
Ménégoz et al. (2014) also included dust in the snow, while
Flanner et al. (2009) calculated that the addition of dust in-
creases the total radiative forcing during springtime by 1 to
2 W m−2 in the considered region. However, in both studies
the simulated annual averages of the BC in snow concentra-
tions ranged from 100 to 200 ppb. Since a comparable radia-
tive forcing was obtained with higher BC in snow concen-
trations, it can be concluded that the sensitivities are lower
in the global models compared to our local model. Because
the approach to represent the radiative transfer in the snow-
pack is similar or even the same in all three models, a major
reason for the lower sensitivity could be the simplified rep-
resentation of the snow in the global models, which describe
the entire snowpack with a limited number of layers (Flanner
et al., 2007; Ménégoz et al., 2014). As a result, the energy
budget and the snow temperature profiles may not be well
described leading to a bias in the simulation of the snow ag-
ing in the presence of the absorbers and of the melting of the
snow. Moreover, the coarse spatial resolution of the models
does not allow representing the specific local conditions at
NCO-P.
Using a further global model, Kopacz et al. (2011) found
BC in snow concentrations around 46 ppb in October in the
Mt. Everest region. Using simple estimates of the relation-
ship between BC in snow and albedo, they derived an aver-
age radiative forcing of 9 W m−2 for October with monthly
means ranging from 7.5 to 12 W m−2. While the simulated
BC in snow concentrations are more reasonable (although
still too high), the applied sensitivities are high compared to
our simulations for NCO-P and do not reflect the complex
processes occurring in the snowpack.
4 Conclusions
The time series of rBC concentrations in the surface snow in
the upper Khumbu Valley reported here indicates a seasonal
cycle with maximum concentrations in the pre-monsoon pe-
riod and low concentrations during the monsoon period. This
cycle directly reflects the behavior of atmospheric BC in the
same high-altitude region (Marinoni et al., 2010) and is also
conserved in ice cores from nearby glaciers (Ginot et al.,
2014). Therefore, ice cores can be used to reconstruct historic
BC concentrations in these regions. Unfortunately, a large
uncertainty remains regarding the absolute BC in snow con-
centrations. While the SP2 technique delivers precise con-
centrations of rBC, the melting of the snow samples during
transport and storage potentially modified the detected con-
centrations. This effect probably contributed to discrepancies
between the snow concentrations reported here, compared to
previously reported results for EC, while the two different
techniques also added to the mismatch (Lim et al., 2014).
Further measurements are needed to resolve these discrep-
ancies and to determine actual concentrations. Such accurate
data are urgently needed for the validation of global and re-
gional models used to calculate the impact of BC in snow on
the regional climate (Qian et al., 2011; Ménégoz et al., 2014).
While models simulating the impact of BC in snow on albedo
and radiative forcing for a given snowpack exist, the quantifi-
cation is currently mostly hampered by the uncertainty in BC
in snow concentrations.
In its first application to the snowpack in the Himalayas,
the standard Crocus model reveals significant discrepancies
compared to observations with a large positive bias in the
simulation of the snow-covered period and the albedo. While
the Crocus model is well adapted to conditions in the Alps
and gives satisfying results in polar regions (Jacobi et al.,
2010; Brun et al., 2011; Vionnet et al., 2012), the high ra-
diation intensities in the Himalayas make the model obvi-
ously more vulnerable due to the simplified parameterization
of the albedo. While simulations were performed for typi-
cal conditions at Pyramid, it is likely that this simulated bias
can be expected for wider regions of the high-altitude area of
the Himalayas. This concerns the simulation of the thin sea-
sonal snowpack with a large contrast in albedo between the
snow-free and snow-covered ground. The bias in the stan-
dard Crocus model is probably diminished in regions with
the formation of a thicker snowpack like in the Western Hi-
malayas (Ménégoz et al., 2013a) and in calculations over
glaciers where the underlying firn and ice exhibit a higher
albedo than the soil. Furthermore, the parameterization of
the ground heat fluxes in the Crocus model may not be well
The Cryosphere, 9, 1685–1699, 2015 www.the-cryosphere.net/9/1685/2015/
H.-W. Jacobi et al.: Black carbon in snow in the upper Himalayan Khumbu Valley 1697
adapted to the conditions of the Himalayas, possibly con-
tributing to the overestimation of the snowpack especially
late and early in the winter season.
The positive bias in the albedo and the snowpack simu-
lations are reduced with the upgraded Crocus model, taking
into account the radiative transfer in the snow. This improve-
ment becomes obvious even in simulations without absorb-
ing impurities. The results are further enhanced if BC in the
snow is considered and varied in a range constraint by sur-
face snow and previous ice cores measurements (Ginot et al.,
2014). Nevertheless, even in these simulations, the albedo of
and the length of the period with the seasonal snowpack re-
main well overestimated. Since the simulations were all per-
formed with constant BC concentrations, any enrichment of
BC at the snow surface or in specific layers due to subli-
mation, dry deposition, melting, and refreezing (Doherty et
al., 2013) is not included. Nevertheless, even in the model
runs with BC concentrations of 300 ppb, which is more than
3-fold the maximum detected BC concentration in the sur-
face snow as well as the ice core from this region (Ginot et
al., 2014), the snowpack is more persistent than observed.
Thus, even if any or all of the post-depositional processes
leads to an enrichment of more than a factor of 3 throughout
the snowpack, differences in the simulations and the obser-
vations would remain. Stronger enrichments of BC in certain
layers, like reported previously for the Mera glacier (Kas-
pari et al., 2014) or in the Arctic (Doherty et al., 2013), ap-
pear unlikely because they should have been detected in our
surface snow samples or in the Mera ice core (Ginot et al.,
2014). Moreover, the observed maxima of BC concentrations
in the snow can easily be explained by dry deposition alone
without invoking any further enrichment processes (Yasunari
et al., 2013). These results do not rule out that higher BC
in snow concentrations are encountered under different con-
ditions like on glaciers or even higher altitudes, where the
snowpack may not melt before April, when the air masses
with the highest concentrations in BC finally arrive at the
high-altitude region (Fig. 2).
A heterogeneous distribution of absorbing compounds
within the snowpack may induce stronger temperature gradi-
ents inside the snowpack, further accelerating the snow meta-
morphism compared to a snowpack with homogeneous con-
centrations as assumed in our simulations. Variable concen-
trations can be caused by processes during the melting of
the snowpack as described above. Since the absorbing com-
pounds are introduced by dry and wet deposition, concen-
tration gradients inside the snowpack can be expected even
in the not-melting snowpack. Moreover, these gradients can
be different for different absorbing compounds. Vertical pro-
files of the absorbing compounds need to be determined to
address this point. Whether it can also have a profound im-
pact on the snowpack simulations remains to be seen and will
be the subject of further studies.
The simulations with the Crocus model reveal further that
dust and probably also other absorbers play a strong role not
only for the snow albedo itself, but also for the impact of
BC. While the impact of a given amount of an absorber on
the snow albedo diminishes in the presence of further impu-
rities, this is the opposite case for the increase of snow-free
days and the radiative forcing. Here, the simulations demon-
strate that the presence of other absorbers like dust even en-
hances the effect of BC. Therefore, the role of dust in the
snow, together with the role of BC, needs to be studied in the
future, and a correct determination of dust and its properties
parallel to the determination of BC in the snow is needed.
Organic absorbers in the snow (Wang et al., 2013) may also
play a role similar to dust and should also be considered in
further studies. In summary, a full characterization of all ab-
sorbing compounds and their different contributions seems
necessary to study the full impact of these compounds on
the snow albedo and further related snow properties and pro-
cesses.
Finally, this study concentrated only on the effect of the
albedo for the snowpack simulations. Other processes pa-
rameterized in the snow model (e.g., turbulent fluxes, ground
heat flux, snow metamorphism, liquid water formation, per-
colation) and uncertainties in the forcing data may also con-
tribute to differences between simulations and observations.
Further detailed observations are needed to improve future
snowpack simulations in this sensitive region. This mainly
concerns direct observations of the total and solid precipita-
tion, which are crucial parameters in snowpack and hydro-
logical modeling for this sensitive region.
The Supplement related to this article is available online
at doi:10.5194/tc-9-1685-2015-supplement.
Acknowledgements. This work was supported by the “Agence
Nationale de la Recherche” under contracts ANR-09-CEP-005-
01/PAPRIKA, ANR-09-CEP-005-02/PAPRIKA, ANR 2011 Blanc
SIMI 5-6 021 04, and by the Investissements d’avenir Labex
OSUG@2020 under grant ANR10 LABX56. The authors thank
EvK2CNR and the Nepalese technical staff of Pyramid Laboratory,
the SHARE (Stations at High Altitude for Research on the Environ-
ment) project, and the Nepal Academy of Science and Technology.
S. Lim acknowledges a government scholarship by the Korean
Ministry of Education and Science Technology.
Edited by: A. Klein
References
Bonasoni, P., Laj, P., Marinoni, A., Sprenger, M., Angelini, F., Ar-
duini, J., Bonafè, U., Calzolari, F., Colombo, T., Decesari, S., Di
Biagio, C., di Sarra, A. G., Evangelisti, F., Duchi, R., Facchini,
MC., Fuzzi, S., Gobbi, G. P., Maione, M., Panday, A., Roccato,
F., Sellegri, K., Venzac, H., Verza, GP., Villani, P., Vuillermoz,
www.the-cryosphere.net/9/1685/2015/ The Cryosphere, 9, 1685–1699, 2015
1698 H.-W. Jacobi et al.: Black carbon in snow in the upper Himalayan Khumbu Valley
E., and Cristofanelli, P.: Atmospheric Brown Clouds in the Hi-
malayas: first two years of continuous observations at the Nepal
Climate Observatory-Pyramid (5079 m), Atmos. Chem. Phys.,
10, 7515–7531, doi:10.5194/acp-10-7515-2010, 2010.
Bond, T. C. and Bergstrom, R. W.: Light absorption by carbona-
ceous particles: An investigative review, Aerosol Sci. Technol.,
40, 27–67, 2006.
Bond, T. C., Doherty, S. J., Fahey, D. W., Forster, P. M., Berntsen,
T., DeAngelo, B. J., Flanner, M. G., Ghan, S., Kärcher, B., Koch,
D., Kinne, S., Kondo, Y., Quinn, P. K., Sarofim, M. C., Schultz,
M. G., Schulz, M., Venkataraman, C., Zhang, H., Zhang, S., Bel-
louin, N., Guttikunda, S. K., Hopke, P. K., Jacobson, M. Z.,
Kaiser, J. W., Klimont, Z., Lohmann, U., Schwarz, J. P., Shin-
dell, D., Storelvmo, T., Warren, S. G., and Zender, C. S.: Bound-
ing the role of black carbon in the climate system: A scientific
assessment, J. Geophys. Res., 118, 1–173, 2013.
Brun, E., Martin, E., Simon, V., Gendre, C., and Coleou, C.: An
energy and mass model of snow cover suitable for operational
avalanche forecasting, J. Glaciol., 35, 333–342, 1989.
Brun, E., David, P., Sudul, M., and Brunot, G.: A numerical model
to simulate snow-cover stratigraphy for operational avalanche
forecasting, J. Glaciol., 38, 13–22, 1992.
Brun, E., Six, D., Picard, G., Vionnet, V., Arnaud, L., Bazile, E.,
Boone, A., Bouchard, A., Genthon, C., Guidard, V., Le Moigne,
P., Rabier, F., and Seity, Y.: Snow/atmosphere coupled simulation
at Dome C, Antarctica, J. Glaciol., 52, 721–736, 2011.
Carrico, C. M., Bergin, M. H., Shrestha, A. B., Dibb, J. E., Gomes,
L., and Harris, J. M.: The importance of carbon and mineral dust
to seasonal aerosol properties in the Nepal Himalaya, Atmos. En-
viron., 37, 2811–2824, 2003.
Doherty, S. J., Grenfell, T. C., Forsström, S., Hegg, D. L., Brandt, R.
E., and Warren, S. G.: Observed vertical redistribution of black
carbon and other insoluble light-absorbing particles in melting
snow, J. Geophys. Res., 118, 5553–5569, 2013.
Duchi, R., Cristofanelli, P., Marinoni, A., Bourcier, L., Laj, P., Cal-
zolari, F., Adhikary, P., Verza, G.-P., Vuillermoz, E., and Bona-
soni, P.: Synoptic-scale dust transport events in the southern Hi-
malayas, Aeolian Res., 13, 51–57, 2014.
Etchevers, P., Martin, E., Brown, R., Fierz, C., Lejeune, Y., Bazile,
E., Boone, A., Dai, Y.-J., Essery, R., Fernandez, A., Gusev, Y.,
Jordan, R., Koren, V., Kowalczyk, E., Nasonova, N. O., Pyles, R.
D., Schlosser, A., Shmakin, A. B., Smirnova, T. G., Strasser, U.,
Verseghy, D., Yamazaki, T., and Yang, Z.-L.: Validation of the
energy budget of an alpine snowpack simulated by several snow
models (SnowMIP project), Ann. Glac., 38, 150–158, 2004.
Flanner, M. G., Zender, C. S., Randerson, J. T., and Rasch,
P. J.: Present-day climate forcing and response from
black carbon in snow, J. Geophys. Res., 112, D11202,
doi:10.1029/2006JD008003, 2007.
Flanner, M. G., Zender, C. S., Hess, P. G., Mahowald, N. M.,
Painter, T. H., Ramanathan, V., and Rasch, P. J.: Springtime
warming and reduced snow cover from carbonaceous particles,
Atmos. Chem. Phys., 9, 2481–2497, doi:10.5194/acp-9-2481-
2009, 2009.
Flanner, M. G., Liu, X., Zhou, C., Penner, J. E., and Jiao, C.:
Enhanced solar energy absorption by internally-mixed black
carbon in snow grains, Atmos. Chem. Phys., 12, 4699–4721,
doi:10.5194/acp-12-4699-2012, 2012.
Ginot, P., Dumont, M., Lim, S., Patris, N., Taupin, J.-D., Wagnon,
P., Gilbert, A., Arnaud, Y., Marinoni, A., Bonasoni, P., and
Laj, P.: A 10 year record of black carbon and dust from a
Mera Peak ice core (Nepal): variability and potential impact on
melting of Himalayan glaciers, The Cryosphere, 8, 1479–1496,
doi:10.5194/tc-8-1479-2014, 2014.
Hansen, J. and Nazarenko, L.: Soot climate forcing via snow and
ice albedos, Proc. Natl. Acad. Sci. 101, 423–428, 2004.
Immerzeel, W. W., van Beek, L. P. H., and Bierkens, M. F. P.: Cli-
mate change will affect the Asian Water Towers, Science, 328,
1382–1385, 2010.
Jacobi, H.-W., Domine, F., Simpson, W. R., Douglas, T. A., and
Sturm, M.: Simulation of the specific surface area of snow using
a one-dimensional physical snowpack model: implementation
and evaluation for subarctic snow in Alaska, The Cryosphere,
4, 35–51, doi:10.5194/tc-4-35-2010, 2010.
Kääb, A., Berthier, E., Nuth, C., Gardelle, J., and Arnaud, Y.: Con-
trasting patterns of early 21st century glacier mass change in the
Himalaya, Nature, 488, 495–498, 2012.
Kaspari, S. D., Schwikowski, M., Gysel, M., Flanner, M. G.,
Kang, S., Hou, S., and Mayewski, P. A.: Recent increase
in black carbon concentrations from a Mt. Everest ice core
spanning 1860–2000 AD, Geophys. Res. Lett., 38, L04703,
doi:10.1029/2010GL046096, 2011.
Kaspari, S., Painter, T. H., Gysel, M., Skiles, S. M., and
Schwikowski, M.: Seasonal and elevational variations of black
carbon and dust in snow and ice in the Solu-Khumbu, Nepal
and estimated radiative forcings, Atmos. Chem. Phys., 14, 8089–
8103, doi:10.5194/acp-14-8089-2014, 2014.
Kopacz, M., Mauzerall, D. L., Wang, J., Leibensperger, E. M.,
Henze, D. K., and Singh, K.: Origin and radiative forcing of
black carbon transported to the Himalayas and Tibetan Plateau,
Atmos. Chem. Phys., 11, 2837–2852, doi:10.5194/acp-11-2837-
2011, 2011.
Krinner, G., Boucher, O., and Balkanski, Y.: Ice-free glacial north-
ern Asia due to dust deposition on snow, Clim. Dyn., 27, 613–
625, 2006.
Lau, K.-M. and Kim, K.-M.: Observational relationships between
aerosol and Asian monsoon rainfall, and circulation, Geophys.
Res. Lett., 33, L21810, doi:10.1029/2006GL027546, 2006.
Lejeune, Y., Bertrand, J.-M., Wagnon, P., and Morin, S.: A physi-
cally based model of the year-round surface energy and mass bal-
ance of debris-covered glaciers, J. Glaciol., 59, 327–344, 2013.
Lim, S., Faïn, X., Zanatta, M., Cozic, J., Jaffrezo, J.-L., Ginot,
P., and Laj, P.: Refractory black carbon mass concentrations in
snow and ice: method evaluation and inter-comparison with ele-
mental carbon measurement, Atmos. Meas. Tech., 7, 3307–3324,
doi:10.5194/amt-7-3307-2014, 2014.
Marinoni, A., Cristofanelli, P., Laj, P., Duchi, R., Calzolari, F.,
Decesari, S., Sellegri, K., Vuillermoz, E., Verza, G. P., Villani, P.,
and Bonasoni, P.: Aerosol mass and black carbon concentrations,
a two year record at NCO-P (5079 m, Southern Himalayas), At-
mos. Chem. Phys., 10, 8551–8562, doi:10.5194/acp-10-8551-
2010, 2010.
Ménégoz, M., Gallée, H., and Jacobi, H. W.: Precipitation and
snow cover in the Himalaya: from reanalysis to regional cli-
mate simulations, Hydrol. Earth Syst. Sci., 17, 3921–3936,
doi:10.5194/hess-17-3921-2013, 2013a.
The Cryosphere, 9, 1685–1699, 2015 www.the-cryosphere.net/9/1685/2015/

H.-W. Jacobi et al.: Black carbon in snow in the upper Himalayan Khumbu Valley 1699
Ménégoz, M., Krinner, G., Balkanski, Y., Cozic, A., Boucher, O.,
and Ciais, P.: Boreal and temperate snow cover variations in-
duced by black carbon emissions in the middle of the 21st cen-
tury, The Cryosphere, 7, 537–554, doi:10.5194/tc-7-537-2013,
2013b.
Ménégoz, M., Krinner, G., Balkanski, Y., Boucher, O., Cozic, A.,
Lim, S., Ginot, P., Laj, P., Gallée, H., Wagnon, P., Marinoni, A.,
and Jacobi, H. W.: Snow cover sensitivity to black carbon depo-
sition in the Himalayas: from atmospheric and ice core measure-
ments to regional climate simulations, Atmos. Chem. Phys., 14,
4237–4249, doi:10.5194/acp-14-4237-2014, 2014.
Ming, J., Cachier, H., Xiao, C., Qin, D., Kang, S., Hou, S., and
Xu, J.: Black carbon record based on a shallow Himalayan ice
core and its climatic implications, Atmos. Chem. Phys., 8, 1343–
1352, doi:10.5194/acp-8-1343-2008, 2008.
Ming, J., Xiao, C., Cachier, H., Qin, D., Qin, X., Li, Z., and Pu, J.:
Black Carbon (BC) in the snow of glaciers in west China and its
potential effects on albedos, Atmos. Res., 92, 114–123, 2009.
Moteki, N. and Kondo, Y.: Effects of mixing state on black car-
bon measurements by laser-induced incandescence, Aerosol Sci.
Technol., 41, 398–417, 2007.
Moteki, N. and Kondo, Y.: Dependence of laser-induced incandes-
cence on physical properties of black carbon aerosols: Measure-
ments and theoretical interpretation, Aerosol Sci. Technol., 44,
663–675, 2010.
Negi, H. S. and Kokhanovsky, A.: Retrieval of snow grain size and
albedo of western Himalayan snow cover using satellite data, The
Cryosphere, 5, 831–847, doi:10.5194/tc-5-831-2011, 2011.
Painter, T. H., Barrett, A. P., Landry, C. C., Neff, J. C., Cassidy, M.
P., Lawrence, C. R., McBride, K. E., and Farmer, G. L.: Impact
of disturbed desert soils on duration of mountain snow cover,
Geophys. Res. Lett., 34, L12502, doi:10.1029/2007GL030284,
2007.
Qian, Y., Flanner, M. G., Leung, L. R., and Wang, W.: Sensitiv-
ity studies on the impacts of Tibetan Plateau snowpack pollu-
tion on the Asian hydrological cycle and monsoon climate, At-
mos. Chem. Phys., 11, 1929–1948, doi:10.5194/acp-11-1929-
2011, 2011.
Ramanathan, V., Li, F., Ramana, M. V., Praveen, P. S., Kim, D., Cor-
rigan, C. E., Nguyen, H., Stone, E. A., Schauer, J. J., Carmichael,
G. R., Adhikary, B., and Yoon, S. C.: Atmospheric brown clouds:
Hemispherical and regional variations in long-range transport,
absorption, and radiative forcing, J. Geophys. Res., 112, D22S21,
doi:10.1029/2006JD008124, 2007.
Salerno, F., Guyennon, N., Thakuri, S., Viviano, G., Romano, E.,
Vuillermoz, E., Cristofanelli, P., Stocchi, P., Agrillo, G., Ma, Y.,
and Tartari, G.: Weak precipitation, warm winters and springs
impact glaciers of south slopes of Mt. Everest (central Himalaya)
in the last 2 decades (1994–2013), The Cryosphere, 9, 1229–
1247, doi:10.5194/tc-9-1229-2015, 2015.
Schwarz, J. P., Gao, R. S., Fahey, D. W., Thomson, D. S., Watts,
L. A., Wilson, J. C., Reeves, J. M., Darbeheshti, M., Baum-
gardner, D. G., Kok, G. L., Chung, S. H., Schulz, M., Hen-
dricks, J., Lauer, A., Kärcher, B., Slowik, J. G., Rosenlof,
K. H., Thompson, T. L., Langford, A. O., Loewenstein, M.,
and Aikin, K. C.: Single-particle measurements of midlatitude
black carbon and light-scattering aerosols from the boundary
layer to the lower stratosphere, J. Geophys. Res., 111, D16207,
doi:10.1029/2006jd007076, 2006.
Shrestha, M., Wang, L., Koike, T., Xue, Y., and Hirabayashi, Y.:
Modeling the spatial distribution of snow cover in the Dudhkoshi
region of the Nepal Himalayas, J. Hydrometeorol., 13, 204–222,
2012.
Stocker, T. F., Qin, D., Plattner, G. K., Tignor, M., Allen, S. K.,
Boschung, J., Nauels, A., Xia, Y., Bex, V., and Midgley, P. M.
(Eds.): Climate Change 2013: The Physical Science Basis. Con-
tribution of Working Group I to the Fifth Assessment Report
of the Intergovernmental Panel on Climate Change, Cambridge
University Press, Cambridge, UK and New York, NY, 1535 pp.,
2013.
Thompson, L. C., Yao, T., Mosley-Thompson, E., Davis, M. E.,
Henderson, K. A., and Lin, P.-N.: A high-resolution millennial
record of the South Asian Monsoon from Himalayan ice cores,
Science, 289, 1916–1929, 2000.
Tyagi, A. and Pai D. S. (Eds.): Monsoon Report 2011, IMD Met
Monograph Synoptic Meteorology No. 01/2012, National Cli-
mate Centre, India Meteorological Department, Pune, India, 178
pp., 2012.
Tyagi, A., Mazumdar, A. B., and Pai D. S. (Eds.): Monsoon Re-
port 2009, IMD Met Monograph Synoptic Meteorology No.
09/2010, National Climate Centre, India Meteorological Depart-
ment, Pune, India, 159 pp., 2010.
Tyagi, A., Mazumdar, A. B., and Pai D. S. (Eds.): Monsoon Re-
port 2010, IMD Met Monograph Synoptic Meteorology No.
10/2011, National Climate Centre, India Meteorological Depart-
ment, Pune, India, 210 pp., 2011.
Vionnet, V., Brun, E., Morin, S., Boone, A., Faroux, S., Le Moigne,
P., Martin, E., and Willemet, J.-M.: The detailed snowpack
scheme Crocus and its implementation in SURFEX v7.2, Geosci.
Model Dev., 5, 773–791, doi:10.5194/gmd-5-773-2012, 2012.
Wang, X., Doherty, S. J., and Huang, J.: Black carbon and other
light-absorbing impurities in snow across Northern China, J.
Geophys. Res., 118, 1471–1492, 2013.
Warren, S. G. and Wiscombe, W. J.: A model for the spectral albedo
of snow. II: Snow containing atmospheric aerosols, J. Atmos.
Sci., 37, 2734–2745, 1980.
Wiscombe, W. J. and Warren, S. G.: A model for the spectral albedo
of snow, I: Pure snow, J. Atmos. Sci., 37, 2712–2733, 1980.
Xu, B., Yao, T., Liu, X., and Wang, N.: Elemental and organic car-
bon measurements with a two-step heating-gas chromatography
system in snow samples from the Tibetan Plateau, Ann. Glaciol.,
43, 257–262, 2006.
Xu, B., Cao, J., Hansen, J., Yao, T., Joswia, D. R., Wang, N., Wu,
G., Wang, M., Zhao, H., Yang, W., Liu, X., and He, J.: Black
soot and the survival of Tibetan glaciers, P. Natl. Acad. Sci., 106,
22114–22118, 2009.
Yasunari, T. J., Tan, Q., Lau, K.-M., Bonasoni, P., Marinoni, A., Laj,
P., Ménégoz, M., Takemura, T., and Chin, M., Estimated range of
black carbon dry deposition and the related snow albedo reduc-
tion over Himalayan glaciers during dry pre-monsoon periods,
Atmos. Environ., 78, 259–267, 2013.
www.the-cryosphere.net/9/1685/2015/ The Cryosphere, 9, 1685–1699, 2015