black & veatch - superfund records collections(epa) contract no. ep-s7-05-06, black & veatch...
TRANSCRIPT

BLACK & VEATCH6601 College Blvd.
Overland Park, KS 66211
Tel: (913) 458-2900
USEPA Region VIIAce Services Site
Mr. Rob WeberUSEPA Region VII901 N. 5th StreetKansas City, Kansas 66101
Black & Veatch Special Projects Corp.
t .i3 ,'
BVSPC Project 044720BVSPC File E . I . 2
May 24, 2006
Subject: EPA Contract No. EP-S7-05-06Task Order # 0075Tenth A u d i t Report
Dear Mr. Weber:
Enclosed are three copies of the report summarizing the tenth audi t of the City of Colby's operation of theAce Services GWTS. Per EPA's usual request request, I am sending a copy directly to Mr. Ashley Allenat KDHE.
Please feel free to cal l me at (913) 458-6506 if you have any questions or need addit ional information.
Sincerely,
BLACK & VEATCH SPECIAL PROJECTS CORP.
Ken WyattSite Manager
KWW
cc: A. Allen (KDHE)G. Felkner
40261945
SUPERFUND RECORDS

II
Prepared for:I /5?' LCu V\ U.S. Environmental Protection Agency
Region 7901 North 5th StreetKansas City, Kansas 66101
I
I
| Long Term Response ActionAudit Report No. 10
I January 12, 2006 through April 11, 2006
I Ace Services SiteColby, Kansas
I_ May 24, 2006
I
I EPA Contract No.: EP-S7-05-06EPA Task Order No.: 0075
- BVSPC Project No.: 044725.01.49
I
I ==========Prepared by:
I ^vj P!:ACK?!,yjATCH Black & Veatch Special Projects Corp.• ^L_^ building a wnrlno' dcf(eience~ r j r* —, worm 6601 College Blvd.
E N E R G Y WATER INFORMATION G O V E R N M E N T / - / - />_ Overland Park, Kansas 66211
Ifrj Professionalgj3J Environmental Engineers, Inc.
I

11
Table of Contents
1• ] o Int roduct ion
2 0 Observations on General System Operation
| 21 Well Field
22 Treatment Plant
• 23 Resin Qiialitv Issues
3 0 Sampling and Record Keeping
4 0 Evaluat ion of System Performance
1
1 Tables
Table 4-1 Selected Flow and Chromium Concentration Data
1_ Figures
Figure 4-1 Gallons Treated vs. Chromium Concentration
1
1
1
1
1
1
IAce Services Site 1 C- 1LIRA Audi t Report No. 10
1-1
2-1
2-2
2-7
2-75
3-1
1..4-1
5-1
044720.01. 4<

1.0 Introduction
As part of Task Order 0075, United States Environmental Protection Agency
(EPA) Contract no. EP-S7-05-06, Black & Veatch Special. Projects Corp. (BVSPC) is to
monitor key plant operations and evaluate the plant operator's conformance to specified
requirements for system operation at the Ace Services Site, Ground Water Treatment
Plant (GWTP) in Colby, Kansas. These evaluations or audits are to occur on a quarterly
basis. The audits include a site visit to observe the City of.Colby operators and obtain
key plant operating data. This report summarizes the findings from the tenth such audit
conducted April 10 through 13, 2005. This report covers the period from January 12,
2006 through April 11, 2006. The results of the first audit are summarized in the Long
Term Response Action Audit Report No. 7, dated November 10, 2003. The results of the
second audit are summarized in Long Term Response Action Audit Report No. 2. dated
March 19, 2004. The results of the third audit are summarized in Lons. Term Response
Action Audit Report No. 3, dated July 2, 2004. The results of the fourth audit are
summarized in Long Term Response Action Audit Report No. 4, dated November 19,
2004. The results of the fifth audit are summarized in Long Term Response Action Audit
Report No. 5_, dated April 22, 2005. The results of the Sixth audit are summarized in
Long Term Response Action Audit Report No. 6, dated June 24, 2005. The results of the
seventh audit are summarized in Long Term Response Action Audit Report No. 7. dated
August 26, 2005. The results of the eighth audit are summarized in Long Term Response
Action Audit Report No. 8, dated November 18, 2006. The results of the ninth audit are
summarized in Long Term Response Action Audit Report No. 9, dated March 3, 2006.
Ace Services Site 1-1 044720.01.49LTRA Audi t Report No. 10

2.0 Observations on General System Operation
During the audit site visit (April 10 through' April 13, 2006), BVSPC
representatives arrived at the GWTP at around 7:00 A.M. each morning and did not leave
the plant until between 5:00 and 6:00 P.M. each evening. This allowed observation of the
city operators throughout the regular staff hours.
The City staffing of the plant was unchanged from the last several audits. Mr. Jim
Helus with the City of Colby Public Works Department is assigned as the full time
operator for the treatment system. Mr. Helus generally arrives at the treatment plant at
8:00 A.M. and spends the majority of the day tending to the plant and well field systems.
Mr. Helus is occasionally supplemented by other city staff on an as needed basis. A
second operator is often at the plant on Wednesdays, to assist with the extra work
associated with collecting, preparing, and shipping the weekly sample splits for off-site
laboratory analysis. Mr. Helus is responsible for system operation Monday through
Friday. Weekend staffing is provided by various other members of the Colby Public
Works Department; however, Mr. Helus remains on-call for plant alarms seven days a
week. It should be noted that during the week of the field audit Mr. Helus was out on
vacation. Mr. Bill Taylor acted as the principal operator during this absence.
As noted in previous audits, the assignment of a single primary operator is
resulting in good follow-through on maintenance, supplies inventory, record keeping, and
problem resolution.
The response to alarms during hours that the plant was not staffed was timely and
has improved from previous audit periods. The auto-dialer is programmed to dial out all
important alarms including tank level alarms. The auto dialer goes through a progression
of phone numbers until a response is obtained. Mr. Helus generally responds to all off-
hours alarms.
The plant, office, storage, and lab areas were clean and very well organized.
Organization of the office files and plant storage room is excellent. The operating staff
continues to express positive attitudes regarding the facility and their jobs. Mr. Helus
remains particularly well engaged in his job as plant operator and his skill levels
Ace Services Site 2-1 044720.01.49LIRA Audi t Report No. 10

IIIIIIIIIIIIIIIIIII
regarding the more complex plant subsystems continue to improve. Mr. Helus, as well as
other plant staff, frequently call BVSPC for advice and assistance as needed.
Specific details of system operation^ including problems noted during the audit,. i
are provided in the following sections of this report.
2.1 Well Field
As discussed in the previous audit reports, several of the extraction wells had been
shut do\vn to prevent drawing 1,2-dichloroethane (1,2-DCA) from the Hi-Plains Co-op
plume into the ground water treatment system (GWTS). A new granular activated carbon
(GAC) treatment system installed by Kansas Department of Health and Environment
(KJDHE) to remove the 1,2-DCA and other volatile organic compounds (VOC) from the
well water prior to entering the GWTP was started on August 24, 2004. Since that date
(including throughout the entire tenth audit period) all wells have been allowed to run
unless a particular well was shut down for some other reason unique to that well.
As discussed in audit reports 8 and 9, the hexavalent chromium concentration at
the east end of the extraction system has fallen well below the cleanup goal of 100
micrograms per liter (ug/L) total chromium. After reviewing the sample data from wells
EX-4s, 4i, 5s and 5i from the October 2005 sampling round, EPA agreed to begin a surge
pumping approach at the east end of the extraction field. Reducing total flow rate from
the well field would extend resin life and save considerable operating cost. The decision
was made to temporarily shut off wells EX-5s and 5i and to reduce flow at EX-4i from
125 gallons per minute (gpm) to 100 gpm. Well EX-4s had been shut off already due to
low water levels. These changes were made on October 28, 2005. The well flows
remained this way throughout the remainder of the ninth audit period and all during the
tenth audit period. A complete sampling round including the extraction wells, monitoring
wells, and residential wells was conducted from April 4 through April 13, 2006. A
complete analysis of the groundwater extraction system performance and chromium
plume status based on these samples wil l be provided in the Long Term Response Action,
Cleanup Status Report Number 6 which should be completed in June 2006. When
Cleanup Status Report # 6 is available, the impact of the flow reductions at well nests
Ace Services Site 2-2 044720.01.49LIRA Audit Report No. 10

IIIIIIIIIIIIIIIIIII
EX-4 and EX-5 will be evaluated and a determination will.be made regarding any needed
changes to extraction well flow rates.
There had been numerous problems at various well locations that prevented
several individual wells from running during part or all of the fifth audit period. These
are discussed in detail in the fifth audit report. Repair and upgrade activities performed at
the end of the fifth audit period corrected all the problems in the well field and returned
all wells to full operation with the exception of wells EX-2s and EX-4s. Both of these
wells were shut down due to insufficient water level in the well. Well EX-2s has been
shut down due to lack of water since the very beginning of long term system operation
and is being used as a source of spare parts for other wells.
Water level probes at wells EX-2i, and EX-2d were reading incorrectly and the
flow meter at well EX-3d was malfunction during part of the tenth audit period; however,
these wells were kept running throughout the tenth audit period with manual
compensation. The flow rates at wells EX-li and EX-ld were increased during the
seventh audit period in response to rapidly rising hexavalent chromium concentrations in
the nearby Ace Recovery Well (ARW). These wells were left at the higher flow rates
throughout the tenth audit period. Individual well flows at the end of the tenth audit
period were as follows:
Well
EX-li
EX-ld
EX-2s
EX-2i
EX-2d
EX-3s
EX-3i
EX-3d
EX-4s
EX-4i
EX-5s
EX-5i
Desicn flow
35gpm
40 gpm
25gpm
100 gpm
1 00 gpm
25 gpm
50 gpm
75 gpm
25 gpm
1 00 gpm
25 gpm
) 00 gpm
Actual flow
70 gpm
70 gpm
0 gpm (well off-low water)
1 00 gpm
100 gpm
20 gpm
50 gpm
75 gpm
0 gpm (well off-low water)
100 gpm
0 gpm (off for low chromium)
0 gpm (off for low chromium)
Ace Services SiteLIRA Audil Report No. 10
2-3 044720.01.49

IIIIIIIIIIIIIIIIIII
PWS-8 125gpm 125gpm
Total flow from the wells was 710 gallons per minute (gpm). Note that this is the
same as for the ninth audit period but is a significant reduction from the 875 gpm at the
end of the eighth audit period. This reduction is due entirely to the planned flow
reduction at well nests EX- 4 and EX-5.
A review of sampling records shows that at the beginning of the tenth audit
period, the hexavalent chromium concentration in the composite ground water entering
the GWTP was approximately 200 ug/L. This decreased gradually to about 170 ug/L by
the end of the tenth audit period.
Problems and anomalies noted regarding operation of the well field are described
below.
1. Flow meter malfunction at well EX-3d. The transmitter on the flow
meter at well EX-3d had stopped functioning during the ninth audit
period. The meter was reading zero flow regardless of the actual flow
from the well. The problem was found to be a loose connection and
was corrected on March 8, 2006, during the tenth audit period.
2. Low water at well EX-5s. It was noted during the sixth audit that the
water level at EX-5s was very low and the well could no longer sustain
the design flow rate of 25 gpm. The flow from well EX-5s was reduced
to 20 gpm during the sixth audit period and then further reduced to 15
gpm at the end of the seventh audit period. It was noted during the
eighth filed audit that the water level at EX-5s when pumping at only
15 gpm is drawn down to only 5 feet above the pump. This may
ultimately result in pump failure from air entrained in the water entering
the pump as has happened at other shallow wells. As noted above, well
EX-5s was shut of on October 28, 2005, as part of a new pulse pumping
scheme. BVSPC recommends that the well pump remain shut off as has
been done at wells EX-4s and 2s until the water level rises enough to
allow pumping without endangering the pump. The existing pump in
well EX-5s cannot be turned down much below 15 gpm without
Ace Services SiteLIRA Audit Report No. 10
2-4 044720.01.49

damaging the pump motor. The semi-annual ground water evaluation
will assess the effect of the shut down of EX-5s.
3. Inaccurate level probe at wells EX-2i. and EX-2d: The level probes at
wells EX-2d and EX-2i have been showing an assumed false low
reading since the eighth audit period. At the time of the tenth field
audit, the level probes were reading 65 feet and 37 feet for wells EX-2d
and EX-2i, respectively. They have been showing these same
approximate readings since the eighth audit. The actual water level in
each well was measured during the tenth audit. Based on the actual
water level the probes should be reading 106 feet for EX-2d and 68'feet
for EX-2i. Erroneo.usly low water level readings generally indicate that
there is condensation in the level probe vent tube. This cannot be
corrected. The probe and lead must be replaced to correct the problem.
Because the level readings have been stable for more than six months
and are high enough to not interfere with pump operation, replacement
of the probes is not scheduled.
4. Dust build-up in the well houses: The new filters installed on the well
house ventilation intakes during the ninth audit period have been very
effective at keep gross amounts of dust out of the well houses.
However a layer of very fine dust has built up on the horizontal surfaces
of the electrical enclosures in the wells houses. These surfaces should
be kept clean so that dust does not interfere with operation of the fiber
optic communication system.
5. Stuck motor operated valves at wells EX-2i and PWS-8: During
inspection of the wells at the time of both the ninth and tenth audits, it
was noted that the motor operated valves at wells EX-2i and PWS-8
were stuck and would not respond to modulating output from the flow
controllers. BVSPC cycled the valves through full range to free them
up and they then began responding properly to position signal input.
Ace Services Site 2-5 044720.01.49LTRA Audi t Report No. 10

IIIIIIIIIIIIIIIIIII
This has been a recurring problem at several wells. The plant operators
need to occasionally cycle all the well flow control valves as part of
routine maintenance to prevent the valves from ceasing in position.
This has been brought up in several earlier audit reports and was listed
as action item 4 in the ninth audit report. If the valves are sticking too
frequently.it may be beneficial to replace the actuators to eliminate the
problem.
6. Malfunctioning flow controller at well EX-4i: The flow controller at
well EX-4i is not outputting the correct positioning signal for the
selected set point when in automatic mode. This unit needs repair or
replacement. This is repeated from the ninth audit report and was listed
as action item 5 in the ninth audit report.
7. Malfunctioning level system at well EX-4s: At the time of the tenth
field audit, the level system at EX-4s was reading 73 feet. Based on
actual water level measurements taken during the tenth field audit, the
system should be reading only 7 feet. Well EX-4s has been shut down
for several periods due to low water in the well. The 7 feet of water in
the well above the pump is not adequate to support any meaningful
pumping. A review of the plant records from the tenth audit period
reveals that the level system at well EX-4s was reading correctly (7
feet) until April 6, 2006, when the reading began to randomly fluctuate
between 56 and 103 feet. The plant operators were instructed to not
record the erroneous readings in the well field status logs. Because well
EX-4s is not in use, BVSPC does not recommend repairing the level
system. It is unlikely that this well will ever be pumped again except
for sampling purposes.
8. Hole in backfill at well EX-l i : There is a hole eroded in the backfill up
against the east side of the EX-li well house foundation on the north
Ace Services Site 2-6 044720.0149LIRA Audi! Report No. 10

IIIIIIIIIIIIIIIIIII
side of the door. This hole should be filled and compacted before the
foundation slab is undermined.
2.2 Treatment Plant
The treatment plant ran continuously throughout the tenth audit period with the
exception of a brief shut down on February 18, 2006, related to cold weather (see item 2
below). The treatment system was operated at near full normal capacity of 700 to 800
gpm throughout the tenth audit period. Table 4-1 provides a day-by-day accounting of
total plant flow throughout the tenth audit period.
As noted in previous audit reports, the GAC system does not appear to have had
any significant impact on the GWTS with the exception of occasional clogging of the bag
filters with carbon fines (particularly when the GAC beds are backwashed) and
elimination of the hexavalent chromium loading to the GWTP for several days when a
fresh GAC bed is brought on line. No fresh GAC was brought on-line during the tenth
audit period.
There were two major upsets during the seventh audit period involving the ion
exchange resin. These events are detailed in section 2.3 of the seventh audit report.
Several investigations and field trials were conducted during the eighth audit period to
determine a permanent resolution to the resin issues. The results of these investigations
are presented in section 2.3 of the eighth audit report. Observations as well as follow up
regarding resin issues are provided in section 2.3 of this tenth audit report.
A significant water hammer when the city water transfer pumps shut off first
appeared at the beginning of the eighth audit period resulting in breakage of several
components in the poly vinyl chloride (PVC) chlorine feed loop piping. This problem
was described in detail in the eighth audit report. This issued continued to be a problem
throughout the ninth audit period and much of the tenth audit period but was finally
resolved by the end of the tenth audit period. Complete details of the final resolution are
provided in item 11 below.
Ace Services Site 2-7 044720.01.49LTRA Audi t Report No. 10

Overall, the GWTP treated approximately 92.1 mill ion gallons during the tenth
audit period averaging about 1,023,389 gallons per day (gpd).
Milestones for resin management activities were as follows.
TRAIN A;
January 12, 2006 - Beginning of tenth audit period. Bed A3 is lead,
Al is lag (Train A has been in this configuration the since December
23,2005).
March 8, 2006 - Beds advanced to put Al in lead and A2 in lag. Note
Bed A3 is the first bed of Dow SAR on train A to be run to saturation.
- March 22, 2006 - New resin is placed in Bed A3 (Dow SAR at
approximately 35% bicarbonate)
April 11, 2006 - End of tenth audit period. Bed Al is lead and A2 is
lag. Bed A3 has fresh resin and is ready to go on-line.
IIIIIIIIIIIIIIII_ The status of the treatment system as of the end of the tenth audit period was both
I trains operating at approximately 355 gpm with Beds Al and Bl in lead and Beds A2 and
— B2 in lag service. Stand-by Beds A3 and B3 had fresh resin. As noted in previous audit
Ace Services Site 2-8 044720.01.49_ LIRA Audi t Report No. 10
TRAIN B:
- January 12, 2006 - Beginning of tenth audit period, Bed B3 is lead, Bl
is lag (Train B has been in this configuration since December 23,
2005).
March 8, 2006 - Beds advanced to put Bl in lead and B2 in lag. Note:
Bed B3 is the first bed of Dow SAR on train B to be run to saturation.
- March 22, 2006 - Resin is replaced in Bed B3 (Dow SAR,
approximately 35% bicarbonate)
- April 11, 2006 - End of tenth audit period. Bed B1 is lead and Bed B2
is lag. Bed B3 has fresh resin and is ready to go on-line.

IIIIIIIIIIIIIIIIIII
reports, the resin service contract with US Filter (USF) has been renewed and required a
switch from Purolite A300 to Dow SAR resin. The resin in beds A2 and B2 were the last
beds to be replaced with the new Dow SAR resin. Beds A3 and B3 were the first beds to
be loaded with Dow SAR. These beds reached saturation and were cycled out of lead
service during the tenth audit period thereby providing the first treatment performance
data for the Dow SAR resin. It was anticipated that the DOW SAR resin would provide
better treatment performance than the Purolite A300 previously used. This was, in fact
the case as can be seen in the data presented in section 4.0 of this report
Problems and anomalies regarding plant operation that were noted or corrected
during the tenth audit period are described below:
1. Resin quality and delivery issues. The virgin resin placed in Bed B2
on January 11, 2006 (just at the end of the ninth audit period) tested low
for bicarbonate conversion. The resin is specified to be delivered at
approximately 30% bicarbonate form to prevent excessive downward
pH shift. The resin placed in Bed B2 tested approximately 19%
bicarbonate form. The lower percentage of bicarbonate could possibly
allow a pH shift to below 6.5 (the lower limit for drinking water) when
the bed was brought on line. BVSPC site manager was on-site to assist
in special precautions taken when this bed was brought on-line on
March 8, 2006, to avoid discharge of water below pH 6.5. Details
regarding this incident are provided in section 2.3 of this tenth audit
report.
2. Frosted tank level transmitter. The treatment plant and the well field
shut down at 5:20 A.M. on February 18, 2006, due to a false hi-hi alarm
in the effluent tank. The outdoor temperature had dropped to 8 degrees
F below zero. The extreme cold caused the formation of frost on the
head of the ultrasonic level transmitter in the top of the effluent tank
resulting in the transmitter falsely indicating an over full tank level. As
the outdoor temperature rose, the transmitter head defrosted and the
Ace Services Site 2-9 044720.01.49LIRA Audit Report No. 10

IIIIIIIIIIIIIIIII00u
systems all restarted at 11:30 A.M. This has occurred several times in
the past during periods of extreme cold. Heat tracing and insulation
were added to influent and effluent tank nozzles through which the
level transmitters are installed more than a year ago in an effort to
mitigate the problem. This reduced the temperature at which the
problem occurs by about 15 degrees. This problem also occurred on
December 8, 2005, during the ninth audit period when outdoor
temperature fell below zero. BVSPC recommends adding additional
turns of heat tape to the nozzles and additional insulation on the nozzles
and flanges to permanently solve this problem.
3. Leaking pressure gaiiRes. The pressure gauge in the backwash system
near the pumps developed a small leak. The gauge was repaired with
silicone sealant. This is at least the fourth instance of leaking pressure
gauges on the process equipment. Two of the previous leaks required
replacement of the gauge. If this trend continues it would be advisable
to replace leaking gauges in the future with an upgraded model.
4. Damaged conductivity meters and probes. As was noted in the fourth
audit report, the conductivity meters on both ion exchange trains were
flashing error and out of range. As noted in the fifth audit report, it was
determined that the conductivity measurement probes were ruined
because they had not been kept wet when the treatment trains are
drained. Plans were made to order new probes plus new hot tap probe
mounts that allow the probes to be pulled while the system is still
operating and under pressure. At the time of the sixth field audit, this
modification had not yet been done, primarily due to delays in acquiring
the new probes and equipment from Pedrotti Controls. By the end of
the seventh audit period, the new probes and pipe fittings had been
received at the plant but not yet installed. This was listed as action item
2 in the fifth, sixth, seventh, eighth and ninth audit reports. When the
Ace Services Site 2-10 044720.01.49LIRA Audi t Report No. 10

111I11I1
I1111111i1
BVSPC site manager was on site to assist with bringing Bed B2 on-line
(see item 1 above), BVSPC provided direct assistance in mounting the
new probes and hardware, wiring the new'probes to the transmitters and
calibrating the transmitters. All work went well and this item is now
resolved.
5. Frequent air compressor cycling. It was noted that the air compressor
for the GWTP was cycling relatively frequently even when there was
no actual air demand from the system. This suggests significant leaks
in the air system. In the past, air leaks had been found in the diaphragm
valves on the process trains, but those leaks were traced to faulty valve
assembly and corrected. The valves were inspected during the tenth
audit and no leaks were found. The plant operators need to undertake a
systematic check of all the fittings and elements of the air system with a
spray bottle of soap solution to find the leaks and correct the problem.
><
6. Broken ion exchange vessel vent piping. While transferring spent
resin out of a vessel it is necessary to vent air pressure out of the bed.
The vent piping coming down the side of the bed is stainless steel.
Short sections of PVC pipe extend the bottom of the vent lines over to
the trench drains. During the resin transfer out of Bed B2 on February
11, 2006, the PVC piping burst due to the pressure pulse caused by the
sudden opening of the vent valve. This has happened several times in
the past so that most of the PVC sections on all six beds have been
patched or repaired. Following the incident on February 11, 2006,
BVSPC recommended the all the PVC sections be replaced with like
sized schedule 40 galvanized piping to permanently resolve this
recurring problem. A bid was acquired from a local plumbing shop for
this work in the amount of $2480.00 for all six beds. This work was
completed during the tenth audit period.
Ace Services Site 2-11 044720.01.49LTRA Audit Report No. 10

I1I111111p1I!IIHIIII
7. Contamination in bag filter alarm gage: The tubing running to the
pressure ports on the photohelic differential pressure gauges that
generate the high pressure alarms for' the1 bag filters are heavily
contaminated with rust. These tubes need to be blown clean to avoid
contaminating and damaging the gage internals.
8. Insulate conduit carrying chlorine tubing: There is a short section of 1-
inch metal conduit between the chlorine shed and the plant through
which the chlorine gas vacuum feed line is run. The conduit needs to
be insulated to protect the tubing from extreme cold. Ideally, insulation
should be applied to the outside of the conduit and the inside left open
so that warm air from the plant and chlorine shed can pass through.
The city operators have left the outside of the conduit un-insulated and
filled the inside with foam caulk. This should be corrected by adding
insulation to the outside of the conduit.
9. Failure of chlorine feeder control: The automated chlorine feeder that
paces chlorine flow to be proportional to water flow failed on March
18, 2006, requiring the city water discharge be temporarily stopped. A
fixed rate flow controller taken out of City of Colby Public Works
inventory was installed on the chlorine bottle later the same day and
city water discharge resumed. This temporary fix is adequate since the
flow from the city water transfer pumps does not vary substantially.
Repair parts for the automated feed were ordered but had not been
received by the end of the tenth audit period.
10. Fractured Chlorine ejector: On March 13, 2006, the chlorine ejector
cracked during a water hammer event (see item 11 below). It is
believed that this ejector had been damaged by exposure to many
violent water hammer events prior to the installation of a bladder style
Ace Services Site 2-12 044720.01.49LIRA Audit Report No. 10

1111II111HIIIHIIDIIDIID
surge arrester in the chlorine loop. Discharge to the city water system
was terminated unt i l a new ejector was installed the next day.
11. Water hammer and related modifications to motor starters and PLC:
The eighth and ninth audit reports describe in detail the water hammer
problem that occurs when the city water transfer pumps TWP-1 and
TWP-2 shut down. The hammer has been severe enough to fracture
piping components, particularly in the PVC piping that makes up the
chlorine feed loop. During the ninth audit period the chlorine loop was
rerouted to inside the GWTP building and a bladder style surge arrester
was added to the chlorine loop to protect those components. The
closing speed of city discharge water isolation valve CV-6 was also
adjusted for the slowest possible closing rate in an attempt to minimize
the severity of the water hammer. These improvements were only
partly successful. The severity of the water hammer was reduced but
the problem was not eliminated. During the tenth audit period the city
operators reported that the water hammer problem persisted but was
now variable ranging from a small bump to a violent hammer on
seemingly random intervals. It was clear that, left unabated, the violent
hammer incidents would eventually do more damage.
BVSPC investigated the capabilities of the soft starters originally
installed with the city water transfer pumps. These soft starters limit
the inrush current and acceleration rate of the transfer pumps on start-up
to assure a smooth pump start and limit the load on the electrical power
supply as the large 100 horsepower motors accelerate to full speed.
This investigation revealed that the soft starters could be programmed
to provide a limited deceleration ramp that should smoothly slow the
pump from full speed to full stop over a period of time up to 30
seconds. If this deceleration ramp worked well it could completely
eliminate any potential for water hammer. In order to allow for a
Ace Services Sile 2-13 044720.01.49LTRA Audi t Report No. 10

1eiiNII0uIIDDD0DIIII
11i1
deceleration ramp on the transfer pumps the entire control scheme for
the pumps and related valves would have to be modified including shut
down sequences, time delays, alarms and valve speeds. This would
require significant alteration to the GWTS PLC ladder logic.
On April 5 and 6, 2006 the BVSPC site manager was at the GWTP to
make the necessary changes and test/tune the deceleration ramps.
BVSPC worked with the City of Colby Technology Director Mr. Mike
Albers and over the phone with a controls subcontractor. Several trials
were required to get the reprogramming and tuning correct but the end
result was successful. The PLC ladder logic was originally
programmed to first close the isolation valve fully (which was speed
controlled to close slowly) and then shut off the pumps when the valve
proved closed. This logic was altered to first shut off the pump, allow
for a delay for the deceleration period and then close the valve. Low
flow alarms and delay timers in the PLC logic were altered as necessary
to allow this new logic to take place.
The nature of the soft starter is such that the current draw during
controlled deceleration is approximately triple normal full load current.
This enormous current has the potential to damage the motors if the
deceleration period is too long or if the pumps have to cycle off too
frequently. As a result, the deceleration ramp should be set for the
shortest effective time. After several tests, the deceleration ramps for
both transfer pumps were set for 12 seconds with a zero torque
threshold. Since there are two redundant pumps which are programmed
to alternate service, each pump only goes through a shutdown twice per
day. The reasonably short duration of the deceleration ramps combined
with the infrequent shut down cycles should avoid any pump damage.
With parameters set as described, the flow reduction from the pumps
was very steady, smoothly dropping to zero flow. This completely
Ace Services Site 2-14 044720.01.49LTRA Audi t Report No. 10

ppIIIIppppppppppppIIpp
eliminated the water hammer and represents a final resolution for this
problem.
Significant changes or upgrades to the treatment plant during the'tenth audit
period included:
1) The addition of hot taps for the conductivity probes and installation of
new conductivity probes and rewiring and calibration of the
conductivity transmitters.
2) Installation of galvanized steel vent piping on all six of the ion
exchange vessels to replace the existing, failure prone PVC piping.
3) Rerouting of the chlorine loop to inside the GWTP including
relocating the chlorine ejector to inside the GWTP. This eliminated
any below ground piping in this loop to allow for easy service and
repair.
4) Installation of a bladder style surge arrester to the chlorine loop to
protect the delicate equipment from shocks.
5) Modification of the PLC ladder and set-up of deceleration ramps
utilizing the existing soft starters on the city water transfer pumps.
This eliminated the water hammer problem during shut down of the
transfer pumps.
Operator follow-through to address problems at the plant has been excellent.
2.3 Resin Quality Issues
Section 2.3 of the seventh and eighth audit reports summarized significant water
quality incidents related to poor resin quality as well as the ultimate resolution for these
problems. In summary, the resin received at the GWTP on two occasions was
inadequately rinsed and leached unacceptable levels of organics into the process water.
Investigations into this problem identified a second problem of excessive downward pH
shift when a fresh resin bed was placed on line until the resin reached equilibrium for
Ace Services Site 2-15 044720.01.49LTRA Audit Report No. 10

11IIIIIIuuIID0fl00IIIIIIIIHH
bicarbonate. Several resin column tests were conducted at the GWTP to determine the
extent of these problems and the most cost effective solution. The details of all of this, . . . ii • " i ' i i •
work are fully explained in section 2.3 of the seventh and eight audit reports.. i
The final solution was a renegotiation of the US Filter resin supply contract to
provide virgin Dow SAR resin in place of the Purolite A300 resin in the original contract.
The new contract also requires very stringent Quality Control (QC) testing to insure that
the resin is free of residual organics. The new QC program requires that each batch of
resin be subjected to a 16 hour hot water soak test with a limit of 10 parts per million
(ppm) total organics (TOC) in the leachate. Additionally each resin tanker composite
sample for the first ten loads of Dow SAR is to be put through the entire Food and Drug
Administration (FDA) testing protocol (21 CFR 173.25) certifying that the resin is fit for
a drinking water application. The first ten full FDA protocols will provide a correlation
between the 16-hour screening test results and the full FDA testing results so that the 16-
hour test can be used alone as the base QC tool. At least four full FDA tests will be
conducted per year to assure the relationship between the two tests is still valid. The final
provision of the new resin service contract requires that the resin be delivered pre-
converted to a minimum of 30% bicarbonate form to eliminate the unacceptable pH shift.
At the time of the tenth field audit, a total of eight beds of resin had been
delivered under the new contract requirements. Every tanker has easily passed the new
QC testing requirements. The Dow resin has proven to be exceptionally clean. The first
beds to be charged with the Dow SAR resin were Beds A3 and B3. These two beds
reached breakthrough during the tenth audit period and were cycled out of service on
March 8, 2006. As anticipated, the Dow resin provided a substantially longer bed service
life to breakthrough than the Purolite resin. As shown in section 4.0 of this tenth audit
report, the Purolite resin had been averaging 29 to 30 million gallons of water treated per
bed since the beginning of the seventh audit period when the resin problems first arose.
The first two beds of Dow SAR resin each treated over 38 million gallons. This is a
25%+ increase in treatment performance over the Purolite resin.
There was a minor problem with resin supply at the beginning of the tenth audit
period. The virgin resin placed in Bed B2 on January 11, 2006 (just at the end of the
ninth audit period) ultimately tested low for bicarbonate conversion. The resin is
Ace Services Site 2-16 044720.01.49LIRA Audi t Report No. 10

11IIIIIIIIIIIIuniinnD0Dnoa
specified to be delivered at approximately 30% bicarbonate form to prevent excessive
downward pH shift. The resin placed in Bed B2 tested approximately 19% bicarbonate
form. The lower percentage bicarbonate could possibly allow a pH shift to below 6.5
(the lower limit for drinking water) when the bed was brought on line. BVSPC site
manager was on-site to assist in special precautions taken when this bed was brought on-
line on March 8, 2006, to avoid discharge of water below pH 6.5. The goal as Bed B2
was brought on-line in the lag position was to keep the pH in the GWTP effluent tank
above 6.5 so that discharge to the city drinking water system could continue
uninterrupted. In order to accomplish this, the high maintain level in the effluent tank
was reset to 85% and low maintain was reset to 70%. This would assure a buffer volume
of at least 175,000 gallons in the effluent tank at a pH of 7.1. Flow was decreased
through Train B to 300 gpm and increased through Train A to 500 gpm. Train A was
discharging water at a pH of 7.1 so the increased flow from Train A relative to Train B
would minimize the pH drop in the combined effluent as Bed B2 was brought on-line.
Bed B2 was then brought on-line and the pH was closely monitored leaving the bed in the
effluent tank. Bed B2 began at a discharge pH of 6.55 and steadily increased over 46 bed
volumes to a pH of 6.91 and was continuing to rise. The effluent tank pH stayed above
7.0 throughout this period. At this time, the water flows were set back to 357 gpm per
train and the beds were advanced on Train A to put Bed A2 in lag position. The pH of the
discharge from Train A was monitored. Bed A2 started at pH 6.8 and began to rise
steadily. No problems were encountered and city water discharge was maintained
throughout. After 10 bed volumes were run through Bed A2, the monitoring was
terminated and the effluent tank high and low maintain levels were set back to the normal
set points.
The one persistent problem with resin supply under the new contract agreement is
that the City of Colby is not receiving the required testing certificates of compliance from
US Filter prior to the resin being delivered to the GWTP.
Ace Services Site 2-17 044720.01.49LTRA Audit Report No. 10

p1NIIUnniinuDoDnniionn
3.0 Sampling and Record Keeping
As part of the audit, the in-plant records kept by the'City operators were reviewed
for completeness and conformity to requirements. During the review, emphasis was
placed on water flow and chromium concentration data that are critical to evaluation of
treatment system performance. The daily records were well organized in notebooks kept
at the plant. The daily records were organized by month and date and were complete and
easy to access. The City operators have continued to enter the flow meter totalizer
readings and sample analysis results in Excel spreadsheets to facilitate trend tracking and
quick data retrieval although not all operators are following through on this task (see item
2 below). The sample record sheets have been expanded to include free chlorine results
now when the discharge to the city water system is active as well as to include total
chromium analysis on the morning influent sample to watch for any trivalent chrome.
The operators have continued to fill out the new GAC system log sheet each day.
This new log sheet records critical flow and pressure data for the new GAC system.
The City operating staff has done an excellent job with the sampling and record
keeping requirements during the tenth audit period. Any significant irregularities that
were noted in the audit and subsequent review of records are described below:
1. Mismatch between on-site and off-site sample results. The hex aval ent
chromium concentration data at the GWTP influent (sample locations
SC-1 and SC-2) are often higher in the off-site laboratory analysis than
those recorded from in-plant analysis. This trend was also noted in the
eighth and ninth audit reports. If this trend continues it may be
necessary to replace the GWTP lab spectrophotometers.
2. Operators not entering data in spreadsheets: It was noted during the
tenth field audit that the substitutes for the main plant operator (Mr. Jim
Helus) are not transferring the daily flow meter readings and sample
results to the appropriate spreadsheets. Mr. Helus has to catch back up
on this data entry task when he returns to the plant from a weekend or
vacation. This is poor practice and should be stopped because it
Ace Services Site 3-1 044720.01.49LIRA Audit Report No. 10

11II0BD11II0DflDI!D0flflfln
introduces significant opportunities for error. All plant operators
should be well trained in how to enter this data in the tracking
spreadsheets and this task should be done'daily without exception.
3. Total chromium concentration below hexavalent in lab samples: A
review of the off-site laboratory sample data (Continental Labs) from
the tenth audit period revels that in most instances, the reported
concentration of hexavalent chromium was notably higher than the
reported concentration of total chromium in the same sample. This is
logically impossible. All forms of chromium should be found in the
total chromium analysis but only hexavalent should be found in the
hexavalent analysis. If all the chromium in the sample was hexavalent,
as is almost certainly the case, the two values should be equal. Some
lab data shows hexavalent concentration as much as 20% higher than
total chromium concentration. There is no way to discern which value
is the more accurate. For consistency, all the data in section 4.0 of this
report and shown on Table 4-1 is the hexavalent concentration reported
by the lab.
4. Changed location of plant effluent sample: The location of the sample
port that was being used for collection of the plant effluent sample
when discharging to the City (sample connection SC-10) was
immediately downstream of the chlorine injection point. At this point
in the discharge piping system, the chlorine has not had sufficient time
to fully mix and disperse. The high chlorine content in the sample was
causing erroneous on-site sample results for hexavalent chromium.
The sample collection location was revised to a port located upstream
of the chlorine injection. This new location was relabeled SC-10.
5. Recording of incorrect well level: As noted in section 2.1 item 7 of this
report the well level system at well EX-4s is malfunctioning. The
Ace Services Site 3-2 044720.01.49LIRA Audi t Report No. 10

1IIIIInioniinDDII0IIDfl00
reading is constantly fluctuating over a wide range. It is known that the
level system readings are incorrect but the operators were recording the
incorrect data on the daily Well Field Status Log with no notation that
it is grossly inaccurate. BVSPC instructed the operators to never
record obviously incorrect information without noting that the reading
is either suspect or known to be invalid. The Well Field Status Log
sheet has section of blank lines at the bottom for notes to be written.
BVSPC instructed the operators to place a notation mark (an "x" or
"*") in the spot where the level data for well EX-4s should go and add
a note in the space provided on the form indicating the reading is
suspect and the fact that it is believed to be incorrect.
There have been no significant changes regarding plant sampling and record
keeping during the tenth audit period with the exception relocating effluent sample point
SC-10 as described in item 3 above.
Ace Services Site 3-3 044720.0149
LTRA Audit Report No. 10
IIIIIIII
IIIIIIIIII1H1HHHH1n
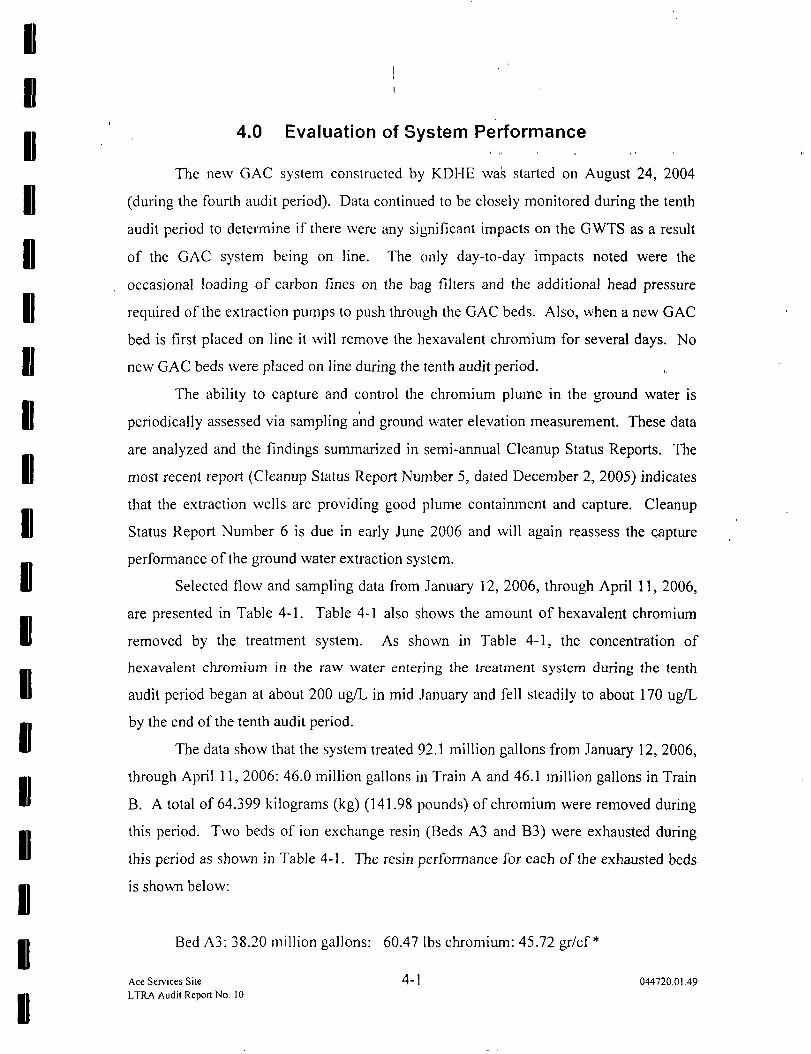
4.0 Evaluation of System Performance
The new GAC system constructed by KDHE was started on August 24, 2004
(during the fourth audit period). Data continued to be closely monitored during the tenth
audit period to determine if there were any significant impacts on the GWTS as a result
of the GAC system being on line. The only day-to-day impacts noted were the
occasional loading of carbon fines on the bag filters and the additional head pressure
required of the extraction pumps to push through the GAC beds. Also, when a new GAC
bed is first placed on line it will remove the hexavalent chromium for several days. No
new GAC beds were placed on line during the tenth audit period.
The ability to capture and control the chromium plume in the ground water is
periodically assessed via sampling and ground water elevation measurement. These data
are analyzed and the findings summarized in semi-annual Cleanup Status Reports. The
most recent report (Cleanup Status Report Number 5, dated December 2, 2005) indicates
that the extraction wells are providing good plume containment and capture. Cleanup
Status Report Number 6 is due in early June 2006 and will again reassess the capture
performance of the ground water extraction system.
Selected flow and sampling data from January 12, 2006, through April 11, 2006,
are presented in Table 4-1. Table 4-1 also shows the amount of hexavalent chromium
removed by the treatment system. As shown in Table 4-1, the concentration of
hexavalent chromium in the raw water entering the treatment system during the tenth
audit period began at about 200 ug/L in mid January and fell steadily to about 170 ug/L
by the end of the tenth audit period.
The data show that the system treated 92.1 million gallons from January 12, 2006,
through April 11, 2006: 46.0 million gallons in Train A and 46.1 million gallons in Train
B. A total of 64.399 kilograms (kg) (141.98 pounds) of chromium were removed during
this period. Two beds of ion exchange resin (Beds A3 and B3) were exhausted during
this period as shown in Table 4-1. The resin performance for each of the exhausted beds
is shown below:
Bed A3: 38.20 million gallons: 60.47 Ibs chromium: 45.72 gr/cf *
Ace Services Site 4-1 044720.01.49LTRA Audit Report No. 10

DIIII0nDUII
0IIDnnoonDoD
Bed B3: 38.32 million gallons: 60.67 Ibs chromium: 45.87 gr/cP
* gr/cf = grams of chromium per cubic foot of resin
The relative performance data from the previous periods are shown below along
with the data for Beds A3 and B3 from this audit period. Data from the early periods are
shown as an average per 600 cubic foot bed of resin.
Performance test: 20.5 million gal: 121.4 gr/cf"
First audit period: 27.0 million gal: 93.6 gr/cf*
Second audit period: 32.5 million gal: 51.2 gr/cf*
Third Audit Period: 32.3 million gal: 41.9 gr/cf*
Fourth Audit period:
BedA3: 31.1 million gal: 71.35gr/cP
BedB2 31.1 million gal: 34.28 gr/cP
Bed B3 33.9 million gal 29.53 gr/cP
Fifth Audit period:
BedAl 25.72 million gal 75.1 gr/cf *
BedBl 25.35 million gal 88.18 gr/cf*
BedA2 40.37 million gal 90.81 gr/cP
BedB2 30.71 million gal 73.06 gr/cf*
Sixth Audit Period:
Bed A3 32.04 million gal: 57.67 gr/cP
Bed B3 35.08 million gal: 63.87 gr/cP
Seventh Audit Period:
BedAl 27.74 million gal 36.14 gr/cf*
Bed Bl 26.75 million gal 34.86 gr/cf *
Bed A2 30.13 million gal 42.62 gr/cf*
Bed B2 30.11 million gal 42.54 gr/cf *
Eighth Audit Period:
Bed A3 29.44 million gal 41.61 gr/cP
Ace Services Site 4-2 044720.01.49LIRA Audit Report No. 10

IIHI!II0HniHUH0II
IInDnu
BedB3 29.11 million gal 41.14gr/cH
Ninth Audit Period
BedAl 30.78 million gal 36.38 gr/cf
BedBl 29.52 million gal 34.50 gr/cf
Bed A2 29.75 million gal 28.08 gr/cf
Bed B2 29.67 million gal 27.98 gr/cf*
Tenth Audit Period
Bed A3 38.20 million gal 45.72 gr/cf
Bed B3 38.32 million gal 45.87 gr/cf
i.* gr/cf = grams of chromium per cubic foot of resin
The chromium holding capacity of the resin is expected to diminish with
diminishing influent hexavalent chromium concentrations due to the lower equilibrium.
This is clearly seen in the data above as well as in Figure 4-1. More gallons of water are
treated with the same 550 to 600 cubic feet of resin but at diminishing resin holding
capacity.
During the entire period of time covered by the second and third audits, the wells
with the highest chromium concentrations were shut down awaiting design and
completion of the GAC system. During that time, chromium concentrations entering the
GWTP were averaging only around 120 to 150 ug/L. Once the GAC system was brought
on line in late August 2004 and all the extraction wells were restarted, the influent
chromium concentrations jumped up to as high a 700 ug/L and have been dropping
steadily since then, but the chromium concentration is still holding above the low levels
seen in the second and third audit periods. The affects of this can be seen in the higher
grams per cubic foot holding capacity of the resin late in the fourth audit period (Bed A3)
and throughout the fifth audit period. Chromium concentration in the influent ground
water continued to drop during the eighth audit period to around 185 ug/L by the end of
the period and remained near that level through much of the ninth and tenth audit periods,
which is only a little higher than the very low levels seen during the second and third
audit periods and very similar to the concentration during the sixth and seventh audit
Ace Services She 4-3 044720.01.49LIRA Audit Report No. 10

pI!
II
II
II
II
0
1)IIIIuD0IIDD0D
periods. Note that the total gallons treated per bed during the sixth audit period are very
similar to the results during the second and third audit periods. Total gallons treated
during the seventh, eighth, and ninth audit periods are substantially lower than during the
second, third and sixth periods even though the influent chromium concentrations were
similar. As noted in section 2.3 of the seventh through tenth audit reports, there were
significant issues regarding the quality and condition of the Purolite A300 resin supplied
to the GWTP during the seventh and eighth audit periods beginning with the beds that
were brought on line on May 25, 2005. Every bed of Purolite resin delivered to the
treatment plant subsequent to that date performed notably poorer than the resin delivered
prior to that date. This can be seen very clearly in Figure 4-1.
The last batches of Purolite A300 (Beds Al, A2, Bl and B2) were cycled out of
service during the ninth audit period. The first batches of Dow SAR (Beds A3 and B3)
were cycled through lead service during the tenth audit period. These first two beds of
Dow resin performed much better than the Purolite resin delivered since May 25, 2005.
The average raw water hexavalent chromium concentration treated by these first two beds
of Dow resin was essentially identical to the average concentration treated by the last four
beds of Purolite resin in the ninth audit period. Compared with those beds, the Dow resin
treated 28% more water and removed 69% more hexavalent chrome. This increase in
performance more than offsets the additional cost of the Dow resin (about 10%) and
nearly offsets the total increase in resin service including the bicarbonate conversion
(36% net increase).
As the hexavalent chromium concentration drops, a point is eventually reached
where the gallons treated by a given amount of resin will no longer increase. This is due
to the presence of other anions in the influent water that take up resin exchange capacity.
The data presented above suggest that a 600 cubic foot volume of Purolite A300 resin
could treat no more than 31 to 34 million gallons of ground water from the Ace Services
site regardless of hexavalent chromium concentration. Bed A2 in the fifth audit period is
an obvious exception, treating over 40 mill ion gallons at a fairly high chromium loading
rate. A possible explanation is that the bed was loaded with more than the usual 600
cubic feet of resin. Each bed has a total volume of 1100 cubic feet and is intended to run
only half full of resin to allow plenty of head space for air bump and backwash
Ace Services Site 4-4 044720.01.49LIRA Audit Report No. 10

pNDIINIIU0U
DDDDIIIIIIIInH
operations. If 650 to 700 cubic feet of resin were loaded into the bed there would be no
indication of the extra resin except a slightly higher pressure drop through the bed. A
review of the pressure drop data during the time that Bed A2 was in lead position does in
fact show a pressure drop that is consistently 20% to 30% greater than the other bed in
the same train. Based on the data, it is very likely that Bed A2 contained 650 to 700
cubic feet of resin during its run in the fifth audit period. This data point is not included
in Figure 4-1 since it is not representative. The Purolite A300 delivered after May 25,
2005, could only treat 27 to 30 million gallons regardless of chromium concentration.
The Dow SAR now being used treated 38 million gallons per bed. Each of these resins
are shown separately in Figure 4-1 so that their relative performance can be easily seen.
Figure 4-1 is a plot of gallons of water treated by an ion exchange bed vs. the
average chromium concentration of the water treated by the bed before significant
chromium breakthrough. This figure very clearly depicts the trends and limits noted
above. As seen in Figure 4-1, the gallons of water treated increases as the chromium
loading decreases in almost a linear relationship. However, once the average chromium
concentration in the GWTP influent water drops below about 300 ug/L, no more increase
in the gallons treated per bed is seen. Prior to May 25, 2005, every bed with an average
chromium influent concentration below 350 ug/L treated between 31 and 35 million
gallons of water with no correlation to chromium concentration. This range dropped to
27 to 30 million gallons per bed of Purolite A300 following May 25, 2005, in the seventh
audit period but increased to 38 million gallons with the switch to Dow SAR resin. This
can be used as planning tool for predicting bed change-outs. Unless the influent
chromium concentrations again rise above 350 ug/L, each bed of Dow SAR resin should
be anticipated to treat 38 +/- 2 million gallons of water. Only two beds of the Dow SAR
resin have been cycled through. Additional data from the upcoming eleventh and twelfth
audit periods will be needed to confirm the 38 million gallon capacity.
Ion exchange is often used as a polishing process in water treatment because it is
very cost efficient compared to other treatment technologies at low contaminant
concentrations. The relatively low concentration of hexavalent chromium seen in the
composite influent groundwater is an excellent application for ion exchange. The total
resin cost including transportation and disposal was 0.172 cents per gallon of water
Ace Services Sile 4-5 044720.01.49LIRA Audit Report No. 10

IIIIIIDU0DnooDflDIIIIIIII
1i
treated for the tenth audit period. This up 9.42% from the .0162 cents per gallon average
cost from the ninth audit period but includes a 36% increase in resin cost from $80.70 per
cubic foot to $109.52 per cubic foot. Only about 10% of this increase is due to the switch
from Purolite A300 to Dow SAR. The majority of the increased cost per cubic foot of
resin is due to universal increase in all resin costs and substantial increases in
transportation costs in addition to the 5% increase for the bicarbonate conversion There
is not sufficient data, at this time to determine the total cost per gallon to treat the
extracted ground water including labor and plant utilities.
Ace Services Site 4-6 044720.01.49LTRA Audit Report No. 10

uuIIDIIDDD0DnDU
IIIIII
IIP1
Table 4-1Selected Flow and Chromium Concentration Data
Ace Services Site , .
Date
12-Jan-0613141516171819202122232425262728293031
Hexavalent ChromiumAt sample location SC-1Hach unit
(ug/L)
Totals for Month
ContinentalLabs (ug/L)
174174174174174174201201201201201201201197197197197197197197
TRAIN AGallonsTreatedx 1000
529514498539509497496532519506513502489536522520483529502529
10264
ChromiumRemoved
(kg)0.3490.3390.3280.3550.3350.3270.3780.4050.3950.3850.3900.3820.3720.4000.3890.3880.3600.3950.3750.3957.442
TRAIN BGallonsTreatedx 1000
530512497538508499496532518506513502488535522520482530503529
10260
ChromiumRemoved
(kg)0.3490.3370.3270.3550.3350.3290.3780.4050.3940.3850.3900.3820.3710.3990.3890.3880.3600.3950.3750.3957.440
RemarksBeds A3 and B3 are lead
I.
11
Ace Services SiteLIRA Audi t R e p o n t f l O 4-7 044720.01.49

IIIIIIIIflDflDBDIIDDHIIII
Table 4-1Selected Flow and Chromium Concentration Data
Ace Services. Site .•
Date
1-Feb-062345678910111213141516171819202122232425262728
Hexavalent ChromiumAt sample location SC-1Hach unit
(ug/L)
Totals for Month
ContinentalLabs (ug/L)
193193193193193193193188188188188188188188191191191191191191191184184184184184184184
TRAIN AGallonsTreatedx 1000
505515509512532495504523515491495523513482558505444482513494514530510523512473535538
14245
ChromiumRemoved
(kg)0.3690.3760.3720.3740.3890.3620.3680.3720.3670.3500.3520.3720.3650.3430.4040.3650.3210.3490.3710.3570.3720.3690.3550.3640.3570.3300.3730.375
10.194
TRAIN, BGallonsTreatedx lOOO
505515509511532495504524
, 512493497524512482558514443482512488513531509524511472533539
14244
ChromiumRemoved
(kg)0.3690.3760.3720.3730.3890.3620.3680.3730.3650.3510.3540.3730.3650.3430.4040.3720.3200.3490.3700.3530.3710.3700.3550.3650.3560.3290.3710.376
10.194
Remarks
11
Ace Services SiteLTRA Audi t Report #10 4-8 044720.01.49

IIIIIIDDDDDDDfl0flDIIIIII
Table 4-1Selected Flow and Chromium Concentration Data
Ace Services Site
Date
1-Mar-062345678g10111213141516171819202122232425262728293031
Hexavalent ChromiumAt sample location SC-1Hach unit
(ug/L)
Totals for Month
ContinentalLabs (ug/L)
185185185185185185185183183183183183183183179179179179179179179180180180180180180180173173173
TRAIN AGallonsTreatedX1000
480540516520460499531511505525515536512489533535526506520525484537530522501514510509494538504
15927
ChromiumRemoved
(kg)0.3360.3780.3620.3640.3220.3500.3720.3540.3500.3640.3570.3710.3550.3390.3610.3630.3570.3430.3520.3560.3280.3660.3610.3560.3420.3500.3480.3470.3240.3520.330
10.910
TRAIN BGallonsTreatedx 1000
480530519519461533530554474517512531508487523531525505517,526484537530523502514510509499529541
15960
ChromiumRemoved
(kg)0.3360.3710.3640.3640.3230.3730.3710.3840.3280.3580.3550.3680.352J0.3380.3550.3600.3560.3420.3500.3570.3280.3660.3610.3570.3420.3500.3480.3470.3270.3470.354
10.932
Remarks
Put beds A1 and B1 in lead'•
1
1Ace Services Site
LIRA Audi l Report #10 4-9 044720.01.49

111IInnn11Dfl0D0II11111
Table 4-1Selected Flow and Chromium Concentration Data
Ace Services Site •
Date
1-Apr-06234567891011
Hexavalent ChromiumAt sample location SC-1Hach unit
(ug/L)
Totals for Month
ContinentalLabs (ug/L)
173173173173171171171171171171171
TRAIN AGallonsTreatedx 1000
506514490524491542504506515507503
5602
ChromiumRemoved
(kg)0.3320.3370.3210.3430.3180.3510.3260.3280.3340.3280.3263.643
TRAIN BGallons,Treatedx 1000
506514490
.524• 491
541505506
, 515507504
5603
ChromiumRemoved
(kg)0.3320.3370.3210.3430.3180.3500.3270.3280.3340.3280.3263.644
Remarks
Ace Services SiteLIRA Audi l Report #10 4-10 044720.01.49

45
40
35
30
CO
I 25
o 20"reO
15
10
Figure 4-1Gallons Treated vs Chromium Concentration
* Purolite A300 through May 25, 2005
• Purolite A300 since May 25, 2005
A Dow SAR
200 400 600 800
Hexavalent Chromium (ug/L)
1000 1200

H1H 5.0 Action Summary
The following is a list of recommended actions or changes to improve system
•I operation or record keeping procedures based on observations made during the tenth
audit. This is a summary list. This list also includes any needed equipment repairs or
•I adjustments identified during this audit. Further details can be found in the body of this
audit report. It is noted that action items 4 and 5 are carried over from the ninth audit
|| report.
|| 1. Insulate the outside of the new conduit with the chlorine line between the
chlorine shed and the GWTP.
02. Add more turns of heat tracing and additional insulation to the influent and
|| effluent tank nozzles through which the level transmitters are mounted.
|| 3. Clean or replace the tubing to the bag filter differential pressure gauges.
II 4. Regularly (suggest weekly) go to each well house and manually cycle the
motor operated flow control valve through full range to keep them from
|| seizing in place.
II 5. Repair or replace the flow controller at well EX-4i.
U 6. Install a new automated chlorine feeder.
• 7. Clean the well houses. Particularly the loose dust.
I
• 9. Enter flow and sample data on the spreadsheets daily
I
I
8. Fill the small backfill hole next to Well EX-1 i.
Ace Services Site 5-1 044720.01.49LIRA Audit Report No. 10

IIIIIIIIIIIIIIIIIII
10. Change practice of recording data known to be inaccurate in plant records
without some form of annotation.
Ace Services Site 5-2 044720.01.49LTRA Audit Repon No. 10