black women in american politicscawp.rutgers.edu/sites/default/files/resources/bw_2017_status...love...
TRANSCRIPT

Few have characterized election 2016 as good for women. Whether because the first female nominee for president was defeated or because women saw little to no gain in representation across levels of office, the dominant gender narrative that emerged from last year’s campaign was hardly positive. But there were some key wins for women of color overall – and Black women in particular. As the numbers below illustrate:
Black women were 3 of the 14 non-incumbent women elected to the U.S. House or Senate in 2016.1 Senator Kamala Harris (D-CA) became the second Black woman to ever serve in the U.S. Senate; Representative Lisa Blunt Rochester (D-DE) was the first woman elected to represent Delaware in Congress; and Representative Val Demings (D-FL) joined Florida’s congressional delegation. Importantly, the two new Black women House members – both of whom won open seats – were elected in non-majority-minority districts, demonstrating opportunities for expanding the sites for Black women’s legislative representation.
Black women nominees for open congressional seats fared better than women overall in 2016; in fact, they have fared better than women overall in all but two election cycles since 2000.
All of the net gain for women in state legislatures from 2016 (24.5%) to 2017 (24.9%) came from women of color, including a net increase among Black women state legislators from 257 (3.5%) to 271 (3.7%).
Two Black women were elected as mayors in the 100 most populous cities in America; they are Catherine Pugh, who became the third consecutive Black woman mayor of Baltimore, MD, and Sharon Weston Broome, elected in Baton Rouge, LA.
But the data presented here also provide important reminders that:
Black women remain severely underrepresented as both candidates and officeholders at the statewide executive level. Only four Black women were general election candidates for statewide elected executive office in the 2016 elections, and none were successful.
Even where their numbers have increased, there is still vast opportunity for growth in the number of Black women running and winning at all levels of office, including outside of majority-minority districts.
1 Unless otherwise noted, these data do not include non-voting delegates.
BLACK WOMEN IN AMERICAN POLITICS: 2017 STATUS UPDATE
CURRENT NUMBERS STATEWIDE ELECTED EXECUTIVE OFFICE
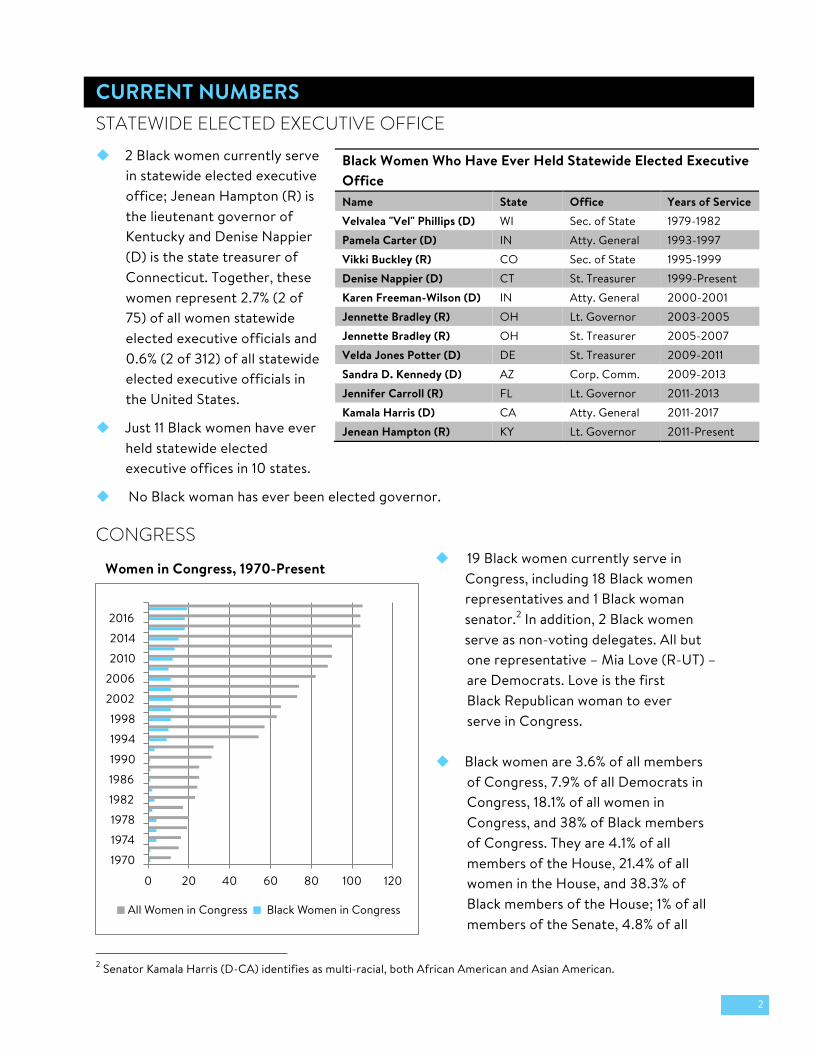
u 2 Black women currently serve in statewide elected executive office; Jenean Hampton (R) is the lieutenant governor of Kentucky and Denise Nappier (D) is the state treasurer of Connecticut. Together, these women represent 2.7% (2 of 75) of all women statewideelected executive officials and 0.6% (2 of 312) of all statewide elected executive officials in the United States.
u Just 11 Black women have ever held statewide elected executive offices in 10 states.
u No Black woman has ever been elected governor.
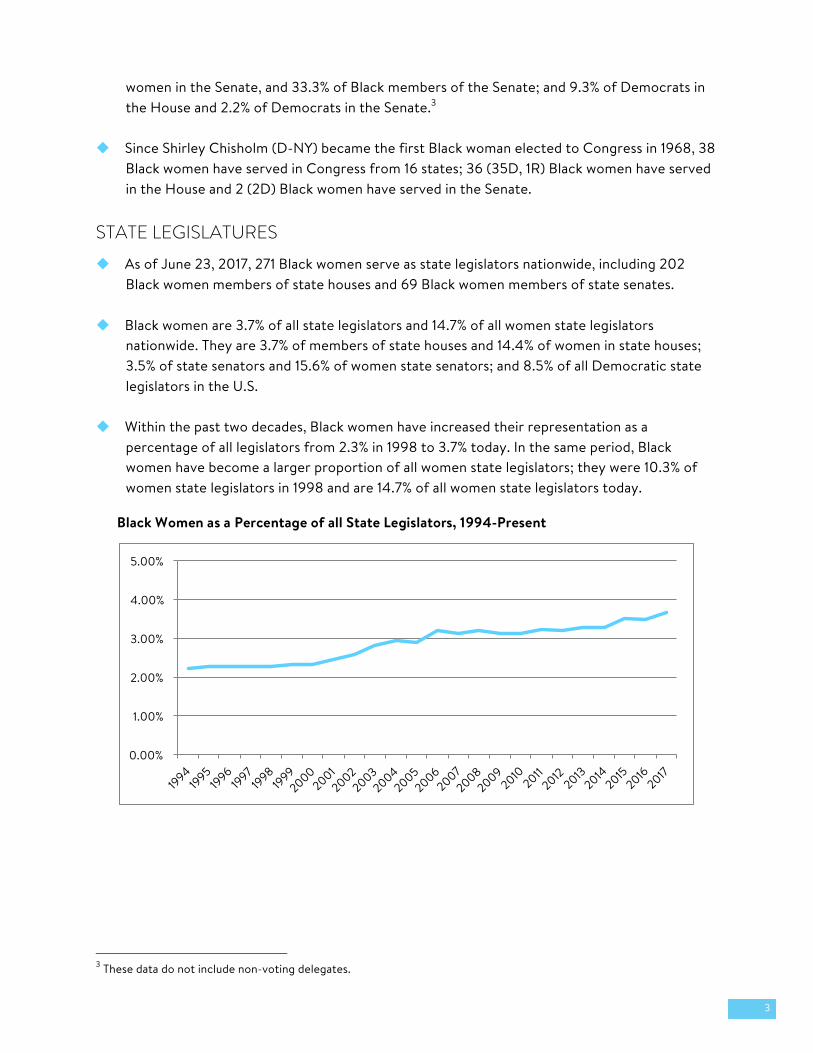
CONGRESS u 19 Black women currently serve in
Congress, including 18 Black women representatives and 1 Black woman
senator.2 In addition, 2 Black women serve as non-voting delegates. All but
one representative – Mia Love (R-UT) – are Democrats. Love is the first Black Republican woman to ever serve in Congress.
u Black women are 3.6% of all members of Congress, 7.9% of all Democrats in Congress, 18.1% of all women in Congress, and 38% of Black members of Congress. They are 4.1% of all members of the House, 21.4% of all women in the House, and 38.3% of Black members of the House; 1% of all members of the Senate, 4.8% of all
2 Senator Kamala Harris (D-CA) identifies as multi-racial, both African American and Asian American.
Black Women Who Have Ever Held Statewide Elected Executive Office Name State Office Years of Service Velvalea "Vel" Phillips (D) WI Sec. of State 1979-1982 Pamela Carter (D) IN Atty. General 1993-1997 Vikki Buckley (R) CO Sec. of State 1995-1999 Denise Nappier (D) CT St. Treasurer 1999-Present Karen Freeman-Wilson (D) IN Atty. General 2000-2001 Jennette Bradley (R) OH Lt. Governor 2003-2005 Jennette Bradley (R) OH St. Treasurer 2005-2007 Velda Jones Potter (D) DE St. Treasurer 2009-2011 Sandra D. Kennedy (D) AZ Corp. Comm. 2009-2013 Jennifer Carroll (R) FL Lt. Governor 2011-2013 Kamala Harris (D) CA Atty. General 2011-2017 Jenean Hampton (R) KY Lt. Governor 2011-Present
Women in Congress, 1970-Present
0 20 40 60 80 100 120
1970
1974
1978
1982
1986
1990
1994
1998
2002
2006
2010
2014
2016
All Women in Congress Black Women in Congress
2
women in the Senate, and 33.3% of Black members of the Senate; and 9.3% of Democrats in the House and 2.2% of Democrats in the Senate.3
u Since Shirley Chisholm (D-NY) became the first Black woman elected to Congress in 1968, 38 Black women have served in Congress from 16 states; 36 (35D, 1R) Black women have served in the House and 2 (2D) Black women have served in the Senate.
STATE LEGISLATURES
u As of June 23, 2017, 271 Black women serve as state legislators nationwide, including 202 Black women members of state houses and 69 Black women members of state senates.
u Black women are 3.7% of all state legislators and 14.7% of all women state legislators nationwide. They are 3.7% of members of state houses and 14.4% of women in state houses; 3.5% of state senators and 15.6% of women state senators; and 8.5% of all Democratic state legislators in the U.S.
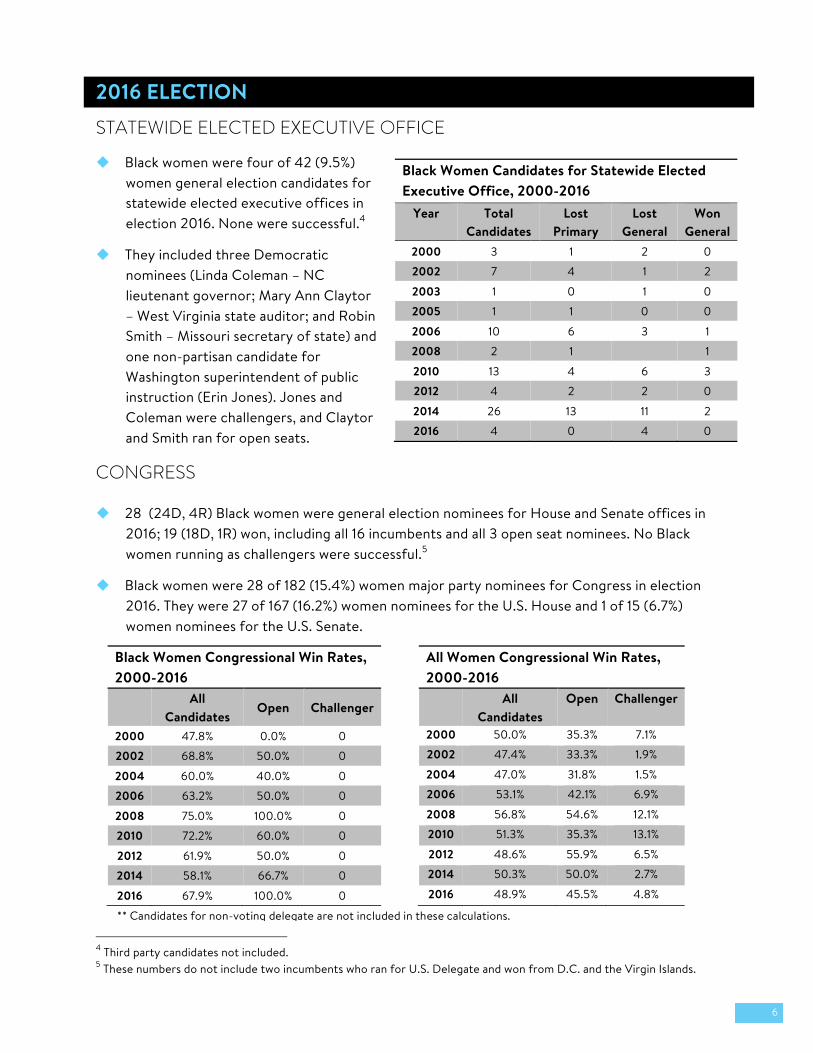
u Within the past two decades, Black women have increased their representation as a percentage of all legislators from 2.3% in 1998 to 3.7% today. In the same period, Black women have become a larger proportion of all women state legislators; they were 10.3% of women state legislators in 1998 and are 14.7% of all women state legislators today.
3 These data do not include non-voting delegates.
Black Women as a Percentage of all State Legislators, 1994-Present
0.00%
1.00%
2.00%
3.00%
4.00%
5.00%
3

MAYORS
Four Black women currently serve as mayors of the 100 most populous cities in the U.S.:
10 black women have been elected mayor in the 100 most populous cities since 2002, with 5 of those women serving simultaneously from January to June 2017.
Before 2002, Lottie Shackelford was the first Black woman to be elected mayor of one of the nation's 100 most populous cities, becoming mayor of Little Rock, AR in 1987.
MURIEL BOWSER
Washington, DC
CATHERINEPUGH
Baltimore, MD
PAULA HICKS-HUDSON
Toledo, OH
SHARON WESTON BROOME
Baton Rouge, LA
4

Black Women in State Legislatures, 2017
State Number of Black Women
Number of Women
Number of Legislators
Percent of Women in State Legislatures
Percent of All State Legislatures
AK 0 18 60 0.0% 0.0% AL 13 21 140 61.9% 9.3% AR 4 25 135 16.0% 3.0% AZ 0 35 90 0.0% 0.0% CA 3 26 120 11.5% 2.5% CO 5 39 100 12.8% 5.0% CT 4 52 187 7.7% 2.1% DE 2 13 62 15.4% 3.2% FL 9 41 160 22.0% 5.6% GA 31 62 236 50.0% 13.1% HI 0 21 76 0.0% 0.0% IA 3 34 150 8.8% 2.0% ID 1 32 105 3.1% 1.0% IL 15 63 177 23.8% 8.5% IN 4 29 150 13.8% 2.7% KS 4 46 165 8.7% 2.4% KY 1 23 138 4.3% 0.7% LA 8 22 144 36.4% 5.6% MA 2 52 200 3.8% 1.0% MD 20 60 188 33.3% 10.6% ME 1 64 186 1.6% 0.5% MI 6 35 148 17.1% 4.1% MN 3 65 201 4.6% 1.5% MO 6 43 197 14.0% 3.0% MS 13 24 174 54.2% 7.5% MT 0 43 150 0.0% 0.0% NC 13 43 170 30.2% 7.6% ND 0 26 141 0.0% 0.0% NE 0 13 49 0.0% 0.0% NH 2 123 424 1.6% 0.5% NJ 9 36 120 25.0% 7.5% NM 2 34 112 5.9% 1.8% NV 4 25 63 16.0% 6.3% NY 19 59 213 32.2% 8.9% OH 10 30 132 33.3% 7.6% OK 2 19 149 10.5% 1.3% OR 2 30 90 6.7% 2.2% PA 8 47 253 17.0% 3.2% RI 2 34 113 5.9% 1.8% SC 7 23 170 30.4% 4.1% SD 0 21 105 0.0% 0.0% TN 7 22 132 31.8% 5.3% TX 9 37 181 24.3% 5.0% UT 1 20 104 5.0% 1.0% VA 11 27 140 40.7% 7.9% VT 1 71 180 1.4% 0.6% WA 1 53 147 1.9% 0.7% WI 2 31 132 6.5% 1.5% WV 1 18 134 5.6% 0.7% WY 0 10 90 0.0% 0.0%
Total 271 1840 7383 14.7% 3.7%
5
2016 ELECTION STATEWIDE ELECTED EXECUTIVE OFFICE
u Black women were four of 42 (9.5%) women general election candidates for statewide elected executive offices in election 2016. None were successful.4
u They included three Democratic nominees (Linda Coleman – NC lieutenant governor; Mary Ann Claytor – West Virginia state auditor; and RobinSmith – Missouri secretary of state) and one non-partisan candidate for Washington superintendent of public instruction (Erin Jones). Jones and Coleman were challengers, and Claytor and Smith ran for open seats.
CONGRESS
u 28 (24D, 4R) Black women were general election nominees for House and Senate offices in 2016; 19 (18D, 1R) won, including all 16 incumbents and all 3 open seat nominees. No Black women running as challengers were successful.5
u Black women were 28 of 182 (15.4%) women major party nominees for Congress in election 2016. They were 27 of 167 (16.2%) women nominees for the U.S. House and 1 of 15 (6.7%) women nominees for the U.S. Senate.
4 Third party candidates not included. 5 These numbers do not include two incumbents who ran for U.S. Delegate and won from D.C. and the Virgin Islands.
Black Women Candidates for Statewide Elected Executive Office, 2000-2016
Year Total Candidates
Lost Primary
Lost General
Won General
2000 3 1 2 0
2002 7 4 1 2
2003 1 0 1 0
2005 1 1 0 0
2006 10 6 3 1
2008 2 1 1
2010 13 4 6 3
2012 4 2 2 0
2014 26 13 11 2
2016 4 0 4 0
All Women Congressional Win Rates, 2000-2016
All Candidates
Open Challenger
2000 50.0% 35.3% 7.1%
2002 47.4% 33.3% 1.9%
2004 47.0% 31.8% 1.5%
2006 53.1% 42.1% 6.9%
2008 56.8% 54.6% 12.1%
2010 51.3% 35.3% 13.1%
2012 48.6% 55.9% 6.5%
2014 50.3% 50.0% 2.7%
2016 48.9% 45.5% 4.8%
Black Women Congressional Win Rates, 2000-2016
All Candidates
Open Challenger
2000 47.8% 0.0% 0
2002 68.8% 50.0% 0
2004 60.0% 40.0% 0
2006 63.2% 50.0% 0
2008 75.0% 100.0% 0
2010 72.2% 60.0% 0
2012 61.9% 50.0% 0
2014 58.1% 66.7% 0
2016 67.9% 100.0% 0
** Candidates for non-voting delegate are not included in these calculations.
6

u Black women were 3 of the 14 non-incumbent women elected to the U.S. House or Senate in 2016. Winners included: Senator Kamala Harris (D-CA), the second Black woman to serve in the U.S. Senate; Representative Lisa Blunt Rochester (D-DE), the first woman to represent Delaware in Congress; and Representative Val Demings (D-FL).
u 15 of 27 (55.6%) Black women House nominees in 2016 were competing in majority-minority districts. Eleven of 18 (61.1%) Black women House winners on Election Day now represent majority-minority districts. Importantly, the two new Black women House members – both of whom won open seats – were elected in non-majority-minority districts.
u While Black women candidates have not fared well as challengers in congressional elections since 2000, their win rates have been higher, on average, than those for women congressional nominees overall. More specifically, Black women nominees for open congressional seats have fared better than women overall in all but two election cycles since 2000.
STATE LEGISLATURE
u 43 non-incumbent Black women, all Democrats, won state legislative seats in election 2016, including 37 state house and 6 state senate candidates. Of the 43 non-incumbent Black women winners of state legislative seats in 2016, 39 won open seats and four defeated incumbents.
u Black women were 10.9% of all women non-incumbent winners and 18.2% of all Democratic women non-incumbent winners of state legislative seats in 2016.
Black Women Non-Incumbent Winners of State Legislative Seats, 2016 Democrats Republicans Total House Senate
Open 39 0 39 34 5
Challenger 4 0 4 3 1
Total 43 0 43 37 6
MAYORS
u In 2016, Black women were elected mayor in two of America’s 100 most populous cities. Catherine Pugh (D) was elected mayor of Baltimore, MD, becoming the third consecutive Black woman to serve as Baltimore’s mayor. Sharon Weston Broome (D) was elected mayor of Baton Rouge, LA, in December 2016. She was sworn in on January 2, 2017.
7

LOOKING AHEAD These data demonstrate that, even with the gains Black women saw at some levels of office in 2016, there is more work to do to ensure that Black women’s representation in elected office reflects their presence in American society. That work includes, but is not limited to:
u Harnessing the energy of Black women engaged in advocacy, community engagement, and public leadership to demand and support Black women candidates for elected office.
u Expanding the sites for recruitment and support of Black women candidates to non-majority-minority districts at the state and federal level, U.S. Senate seats, and statewide elected executive offices .
u Addressing barriers that impede Black women’s entry or success in political institutions, whether they be party gatekeepers, disparities in financial resources, or constrained ideals of what it looks like to be a candidate or officeholder.
Organizations like Higher Heights and the Center for American Women and Politics will continue our work to identify challenges confronting Black women in politics, create environments for Black women to successfully navigate (and disrupt) U.S. political institutions, and foster the support infrastructure necessary to translate Black women’s political engagement and resilience into formal political representation.
8
ABOUT HIGHER HEIGHTS
Higher Heights is the only organization dedicated solely to harnessing Black women’s political power and leadership potential to overcome barriers to political participation and increase Black women’s participation in civic proceses. Higher Heights Leadership Fund, a 501(c)(3), is investing in a long-term strategy to expand and support Black women’s leadership pipeline at all levels and strengthen their civic participation beyond just Election Day. Learn more at www.HigherHeightsLeadershipFund.org
ABOUT THE CENTER FOR AMERICAN WOMEN AND POLITICS (CAWP)
The Center for American Women and Politics (CAWP), a unit of the Eagleton Institute of Politics at Rutgers, The State University of New Jersey, is nationally recognized as the leading source of scholarly research and current data about American women’s political participation. Its mission is to promote greater knowledge and understanding about women’s participation in politics and government and to enhance women’s influence and leadership in public life. CAWP’s education and outreach programs translate research findings into action, addressing women’s under-representation in political leadership with effective, imaginative programs serving a variety of audiences. As the world has watched Americans considering female candidates for the nation’s highest offices, CAWP’s over four decades of analyzing and interpreting women’s participation in American politics have provided a foundation and context for the discussion. Learn more at www.cawp.rutgers.edu
9