black writing ink analysis by direct infusion electrospray
TRANSCRIPT

University of Central Florida University of Central Florida
STARS STARS
Electronic Theses and Dissertations, 2004-2019
2010
Black Writing Ink Analysis By Direct Infusion Electrospray Mass Black Writing Ink Analysis By Direct Infusion Electrospray Mass
Spectroscopy Spectroscopy
Christopher M. Moody University of Central Florida
Part of the Chemistry Commons, and the Forensic Science and Technology Commons
Find similar works at: https://stars.library.ucf.edu/etd
University of Central Florida Libraries http://library.ucf.edu
This Masters Thesis (Open Access) is brought to you for free and open access by STARS. It has been accepted for
inclusion in Electronic Theses and Dissertations, 2004-2019 by an authorized administrator of STARS. For more
information, please contact [email protected].
STARS Citation STARS Citation Moody, Christopher M., "Black Writing Ink Analysis By Direct Infusion Electrospray Mass Spectroscopy" (2010). Electronic Theses and Dissertations, 2004-2019. 1648. https://stars.library.ucf.edu/etd/1648

BLACK WRITING INK ANALYSIS BY DIRECT INFUSION ELECTROSPRAY MASS SPECTROSCOPY
by
CHRISTOPHER M. MOODY B.S.F.S., B.A. University of Central Florida, 2005
A thesis submitted in partial fulfillment of the requirements for the degree of Master of Science in Forensic Science
in the Department of Chemistry in the College of Sciences
at the University of Central Florida Orlando, Florida
Fall Term 2010
Major Professor: Michael E. Sigman

ii
©2010 Christopher M. Moody

iii
ABSTRACT
An optimized method of extraction, an instrumental analysis method and data analysis
was proposed for black writing inks based on direct infusion electrospray-mass spectrometry
(ESI-MS). The sampling and analysis method is both minimally destructive and able to assess
differences in inks from a reference collection of thirty ballpoint, gel, and rollerball inks. The
methanol extracts of ink on paper samples were analyzed with three direct infusion (ESI-MS)
methods. Each method varied scan voltage negative and positive, ESI fragmentor applied voltage
(+120V, +0V, and -120V), and mobile phase additive. Direct infusion ESI-MS analysis,
followed by pair-wise comparisons of the observed ion data in binary form allowed inks to be
distinguished from each other. The photobleaching of the dye Basic Violet 3 (BV3) in ink-on-
paper samples was examined to determine the use of degradation products as a marker of the age
of the writing sample. The extent of photobleaching of BV3 was determined using several
illumination sources. Pair-wise comparison of observed ion data was able to distinguish 29 of 30
ink samples using the combined three instrumental methods. Out of 435 pair-wise comparisons
429 pairs could be discriminated from each other using the combined three methods. This is a
98.6% discrimination with the combined analysis scheme.

iv
To my mother and father:
“Man’s mind, once stretched by a new idea, never regains its original dimensions.”
— Oliver Wendell Holmes

v
ACKNOWLEDGMENTS
The completion of this work has been a long process, and I would like to thank anyone
who has helped me along the way. I would especially like to thank Dr. Michael Sigman and
Mary Williams at NCFS. To my family, real and extended thank you for your patience with me. I
would like to thank Kimberly Painter for allowing me use of a quadruple mass analyzer, and for
reminding me when it was time to eat. Anyone who has read a draft of this work and added any
form of knowledge, love, guidance, constructive criticism or help, I am not sure where to begin
to be able to thank everyone individually. However, the proper place to end is apparent.

vi
TABLE OF CONTENTS
LIST OF FIGURES ........................................................................................................................ x
LIST OF TABLES ....................................................................................................................... xiii
CHAPTER ONE: INTRODUCTION ............................................................................................. 1
Ink ............................................................................................................................................... 3
Forensic Document Examination .............................................................................................. 11
Ink Analysis ........................................................................................................................... 11
Non-Destructive Analysis Methods ...................................................................................... 12
Dichroic Filter Analysis .................................................................................................... 13
Digital Processing Methods .............................................................................................. 13
Gas Chromatography/Mass Spectrometry (GC-MS) Analysis of Inks............................. 14
Liquid Chromatography Mass Spectrometry (LC-MS) Analysis of Dyes ................................ 18
Electrospray Ionization (ESI) ................................................................................................ 18
Linear Quadrupole Mass Analyzers ...................................................................................... 22
LC-MS ESI Direct Infusion Analysis of Inks and Dyes ....................................................... 24
Challenges in Ink Analysis .................................................................................................... 25
Other Ink Analysis Methods .................................................................................................. 26
Thin Layer Chromatography (TLC) Analysis ....................................................................... 27
Chemical Spot Tests .............................................................................................................. 27
CHAPTER TWO: EXPERIMENTAL ......................................................................................... 29

vii
Sample Preparation ................................................................................................................... 29
Instrumental Methods ................................................................................................................ 30
Direct Infusion Electrospray Ionization Mass Spectrometry (ESI-MS) Analysis ................. 30
Instrumental Parameters ........................................................................................................ 30
Extraction Optimization ............................................................................................................ 31
Direct Infusion ESI-MS Optimization ...................................................................................... 32
Spectral Subtraction to Yield “Pure Ink” Spectrum .............................................................. 32
Ink Volatiles Persistence Study ............................................................................................. 33
Effect of Paper on Extraction ................................................................................................ 34
Dye and Vehicle Standards ................................................................................................... 34
Photochemical Experiments ...................................................................................................... 36
Light Exposure Effects .......................................................................................................... 38
Potassium Ferrioxalate Actinometry ..................................................................................... 38
Method Validation of Direct Infusion ESI-MS Ink Analysis ................................................ 40
Analysis of Triplicate Run Data ....................................................................................... 40
Same Manufacturer Multipack Pen Analysis ................................................................... 40
Intersecting and Overlapping Ink Strokes (Deposition Order Determination) ......................... 41
Direct Infusion LC-MS .......................................................................................................... 41
CHAPTER THREE: RESULTS ................................................................................................... 44
Direct Infusion Electrospray Ionization Mass Spectrometry (ESI-MS) Analysis .................... 44
viii
Extraction Optimization ........................................................................................................ 44
Direct Infusion ESI-MS Optimization ................................................................................... 44
Method 1 (+120V) ............................................................................................................ 44
Method 2 (+0 V) ............................................................................................................... 46
Method 3 (-120V) ............................................................................................................. 47
Volatile Persistence Study ................................................................................................ 47
Analysis of Standards ............................................................................................................ 48
Basic and Disperse Type Dye Analysis ............................................................................ 48
Acid and Solvent Type Dye Analysis ............................................................................... 48
Vehicle Analysis .................................................................................................................... 48
Photochemical Experiments ...................................................................................................... 51
Light Exposure Effects .......................................................................................................... 51
Potassium Ferrioxalate Actinometry................................................................................. 53
Method Validation .................................................................................................................... 54
Triplicate Analysis of Reference Pen Collection .................................................................. 54
Multipack Analysis ........................................................................................................... 60
Intersecting and Overlapping Ink Strokes ................................................................................. 61
Pen 5 Only Sample (Figure 34) ............................................................................................. 62
Pen 3 Only Samples (Figure 34) ........................................................................................... 62
Overlapped Areas .................................................................................................................. 62
Sample 1............................................................................................................................ 62

ix
Sample 2............................................................................................................................ 62
CHAPTER FOUR: DISCUSSION ............................................................................................... 66
Direct Infusion ESI-MS Analysis ............................................................................................. 66
Volatile Persistence Study ..................................................................................................... 66
Analysis of Standards ....................................................................................................... 67
Vehicle Analysis ............................................................................................................... 67
Photochemical Experiments ...................................................................................................... 68
Light Exposure Effects .......................................................................................................... 68
Triplicate Analysis of Reference Pen Collection .............................................................. 70
Other Pen Analysis ........................................................................................................... 71
CHAPTER FIVE: CONCLUSIONS AND FUTURE WORKS ................................................... 75
LIST OF REFERENCES .............................................................................................................. 80

x
LIST OF FIGURES
Figure 1: Black ballpoint ink on plain white copy paper, enlarged to show detail, 30-minute
drying time .......................................................................................................................... 6
Figure 2: The same ink line after three days of continual light exposure, with a common desk
lamp..................................................................................................................................... 6
Figure 3: Blue gel ink on white paper ............................................................................................. 8
Figure 4: Black roller ball ink deposited on white paper ................................................................ 8
Figure 5: Electron ionization mass spectra of 2-phenoxyethanol (molecular mass 138.17) ........ 15
Figure 6: Electron ionization mass spectrum of triethanolamine (molecular mass 149.188) ....... 16
Figure 7: 2-Phenoxyethanol molecular structure .......................................................................... 17
Figure 8: Electrospray ionization interface ................................................................................... 19
Figure 9: Electrospray ionization mass spectrum of 2-phenoxyethanol molecule [M+H]=139 ... 20
Figure 10: Electrospray ionization mass spectrum of triethanolamine [M+Na] = 172 m/z ......... 21
Figure 11: Diagram of quadrupole mass analyzer (reprinted with permission) ........................... 23
Figure 12: Molecular structures of selected ink components ....................................................... 24
Figure 13: Close up of a sample after removing enough fibers to perform an extraction ............ 29
Figure 14: Chromatogram showing elements of the subtraction method (analytical run) ........... 32
Figure 15: Subtraction method...................................................................................................... 33
Figure 16: RPR photoreactor spectral output................................................................................ 37
Figure 17: Spectral output profile for GE Helical light bulb at a distance of 12 inches from the
source ................................................................................................................................ 37
Figure 18. Spectral output for GE Helical light bulb at a distance of 7 inches ............................ 37
Figure 19: Potassium ferrioxalate ion ........................................................................................... 39

xi
Figure 20: Pen 3 ink, original depicts an unaltered original writing of the number 3 .................. 42
Figure 21: Pen 5 ink writing over written to change the value of figure 20 from a number 3 to a
number 8 ........................................................................................................................... 42
Figure 22: After sampling, showing the sampling of overlapping ink from pen 3 and pen 5 ...... 43
Figure 23: Concentration of Basic Violet 3 standard vs. integrated peak area ............................. 45
Figure 24: Polyethylene glycol (PEG 400) mass spectrum gathered using Method 2, illustrating
sodium adduct presence the characteristic of spacing 44 m/z units apart [PEG-H+44n] . 47
Figure 25: Change in relative intensities of ions produced during photolysis of pen 1 ink. Total
ion intensity at each exposure time is normalized to 100%. ............................................. 51
Figure 26: Mass spectrum showing time zero (no UV exposure) Pen 1. Photolysis sequence is
BV3 (372 m/z) CV (358 m/z) MV (344 m/z) as methyl groups (15 m/z) are removed
and replaced by hydrogen ................................................................................................. 52
Figure 27: Mass spectrum showing Pen 1 after 5 days (120 Hours of UV exposure) .................. 52
Figure 28: Actinometer exposure time vs. absorbance at 510nm of 1, 10-phenanthroline complex
........................................................................................................................................... 53
Figure 29: Fingerprint spectrum of Pen 13, with combined Methods 1, 2, and 3 ........................ 54
Figure 30: Fingerprint spectrum of Pen 1, with combined Methods 1, 2, and 3 .......................... 55
Figure 31: Ions observed with Method 1 for triplicate analysis ................................................... 56
Figure 32: Ions observed with Method 2 for triplicate analysis ................................................... 57
Figure 32: Ions observed with Method 2 for triplicate analysis (continued) ................................ 58
Figure 33: Ions observed with Method 3 for triplicate analysis ................................................... 58
Figure 33: Ions observed with Method 3 for triplicate analysis (continued) ................................ 59
Figure 34: Pair-wise comparisons of Method 1 results (1 = not discriminated Method 1) .......... 59

xii
Figure 35: Pair-wise comparisons of Method 2 results ................................................................ 60
Figure 36: Comparison of Method 1 results for BC 4-Color Black (A), BC 4-Color Blue (B), Pen
3 (C) and a complied comparison spectrum (D) ............................................................... 61
Figure 37: Results, sampling locations, mass spectra, and observed ions pen 3 only section of
altered document ............................................................................................................... 63
Figure 38: Results, sampling locations, mass spectra, and observed ions overlap sections 1 and 2
........................................................................................................................................... 64
Figure 39: Results, sampling locations, mass spectra, and observed ions of Pen 5 ...................... 65

xiii
LIST OF TABLES
Table 1: List of pens used and their manufactures ......................................................................... 5
Table 2: Pens used in study by number, name and type .............................................................. 10
Table 3: Positive dye standards used with Method 1 .................................................................... 34
Table 4: Negative dye standards used with Method 3 .................................................................. 35
Table 5: Vehicle standards used with Method 2 ........................................................................... 35
Table 6: Colored Pens ................................................................................................................... 41
Table 7: Ions observed with Method 1 analysis............................................................................ 49
Table 8: Ions observed with Method 2 analysis............................................................................ 49
Table 9: Ions observed with Method 3 analysis............................................................................ 50

1
CHAPTER ONE: INTRODUCTION
While personal and business correspondence has changed dramatically in recent years
due to the usage of computers, electronic mail (email), fax machines, e-forms, text messaging,
and digital signatures, the use of a physical written signature as a legal binder is still
commonplace. Despite the advances in correspondence, writing with some form of writing
instrument such as pen, pencil, or marker is still popular. A physical signature written on a
physical document is used to prove or affirm the identity of the signer on such legally important
documents as checks, contracts, bills of sale, insurance policies, wills, and birth/death
certificates. At times, the authenticity of such legal documents comes into question and may
require additional analysis to assess claims associated with such important documents.
The current economic climate has increased the threat, if not the occurrence, of fraud.
Fraud is defined as a crime that involves falsified documentation presented with the intent to
deceive another for profit. White-collar criminals commit crimes of fraud that cost Americans
more dollars than material theft each year. News headlines are full of details regarding fraud-
type white-collar crimes from the Enron scandal to Barnard Madoff’s Ponzi scheme. Other
notable fraud cases involving questioned document evidence include Michael Jackson’s Will and
Howard Hughes’ so-called “Mormon Will.” In these cases, questioned documents (QD)
examination was required to uncover an attempted fraud. A complete QD examination should
include several separate types of analysis; for example, personality traits assessed by handwriting
analysis, signature comparison; trace evidence and ink analysis. The scope of this research is the
detailed ink analysis portion of questioned document examination for the purpose of
differentiating ink extracts using direct infusion ESI-MS analytical methods.
2
Richard Brunelle of the U.S. Bureau of Alcohol, Tobacco, and Firearms (ATF) identifies
the reasons for an ink analysis in a total document examination methodology[1];
1. “To compare two or more ink entries to determine similarities or differences of inks
which can provide information as to whether certain entries could have been added or
altered.”
2. “To determine whether two or more ink entries consist of the same formula ink which
provides a lead concerning whether the entries could have been written with the same
pen.”
3. “To date the ink entries to determine whether documents have been backdated.”
Instrumental methods are objective and independent of analyst experience level, which
stands in sharp contrast to many of the non-instrumental document analysis methods. The
National Academy of Sciences (NAS) report on the forensic sciences suggested that the
Questioned Document Examination Section place less emphasis on methods that rely primarily
on the assumption that an individual’s handwriting is measurably unique [2]. The NAS
concluded that uniform scientific terminology should be adopted for describing, interpreting and
reporting of QD analysis results. The NAS further states that ink analysis was a proven method
of examination, based in analytical chemistry, and has a system in place to describe theory and
practice of operation.
In the DAUBERT v. MERRELL DOW PHARMACEUTICALS, INC., 509 U.S. 579,
The United States Supreme Court said “When faced with a proffer of expert scientific testimony
under Rule 702, the trial judge, pursuant to Rule 104(a), must make a preliminary assessment of
whether the testimony's underlying reasoning or methodology is scientifically valid and properly

3
can be applied to the facts at issue. Many considerations will bear on the inquiry, including
whether the theory or technique in question can be (and has been) tested, whether it has been
subjected to peer review and publication, its known or potential error rate and the existence and
maintenance of standards controlling its operation, and whether it has attracted widespread
acceptance within a relevant scientific community.”[4]
Until quite recently, forensic document examiners preferred to only use non-destructive
(ND) ink analysis methods since document destruction was not considered a workable option.
Non-destructive methods often rely on analysis of optical properties which require the use of
alternate light sources such as ultraviolet, infrared, or oblique lighting. These tests attempt to
exploit optical properties of the ink, paper, and their interactions to visually discriminate ink
formulations without destroying the document. Many of the properties that are used with ND
methods allow an examiner to reach a conclusion that is concentration dependent. Optical ink
analysis methods are subject to interference from interactions of ink, paper, and other chemicals.
The interpretation of “data” from ND methods is subjective in nature and dependent on the
examiner’s experience. The only way a document examiner can acquire experience is on the job
training and casework; there is no educational program specific to the scientific examination of
questioned documents. [5]
Ink
Commonplace colored items include, fabrics, textiles, building materials furniture,
cosmetics, electronics, and writing media and all available in a spectrum of colors. The colors
that we perceive are imparted to these items by synthetic or natural compounds called colorants.
Many compounds that are used as colors in textiles can also be used as ink colorants.

4
Ink used in writing pens is comprised of two basic components: colorant and vehicle. In
general, inks are either colored with organic dyes or insoluble inorganic pigments. The colorant
is then dispersed into what is collectively called the vehicle. As the name implies, the colorant
imparts the color to the ink mixture. In order to achieve a particular color, a manufacturer may
mix two or more pure colorants to create the desired color. The vehicle portion of ink is
comprised of lubricants, flow control agents, polymers, and other ingredients added to
manipulate the ink properties according to the manufacturer’s needs. The solvent, which is in the
vehicle (or is the vehicle), allows the ink mixture to be deposited and flow on the paper surface
in a relatively predictable manner. Some common solvents found in pen inks include but are not
limited to: ethylene glycol, 1,2-propylene glycol, 1,3-butylene glycol, glycerin, phenoxyethylene
glycols, benzyl alcohol, ethylene glycol monomethylether, and diethylene glycol
monomethylether[1]. When one writes with a writing instrument, ink from the pen (inks)
reservoir is deposited on the writing surface so the writing can be read at a later time. The
notable exception is “invisible” ink, which requires a developer such as citric acid and will not
be considered further in this work. Ink is deposited as a thin film on the surface of the paper.
Volatile components diffuse and adsorb at a faster rate than the colored portion, as they are not
intended for permanent inclusion in ink deposits. The nature of the imperfections of mass
manufacturing of pens insures that an ink deposit is never present in a consistent or predictable
manner. As ink begins to dry, the volatile portions begin to vaporize and to disperse into the air
and diffuse into the paper surface. The presence of volatile components in black ballpoint (BP)
inks was examined to assess persistence. It was concluded from mass spectral data that after one
week, no detectable volatiles remained in the samples[2]. Ink may also contain resins and
5
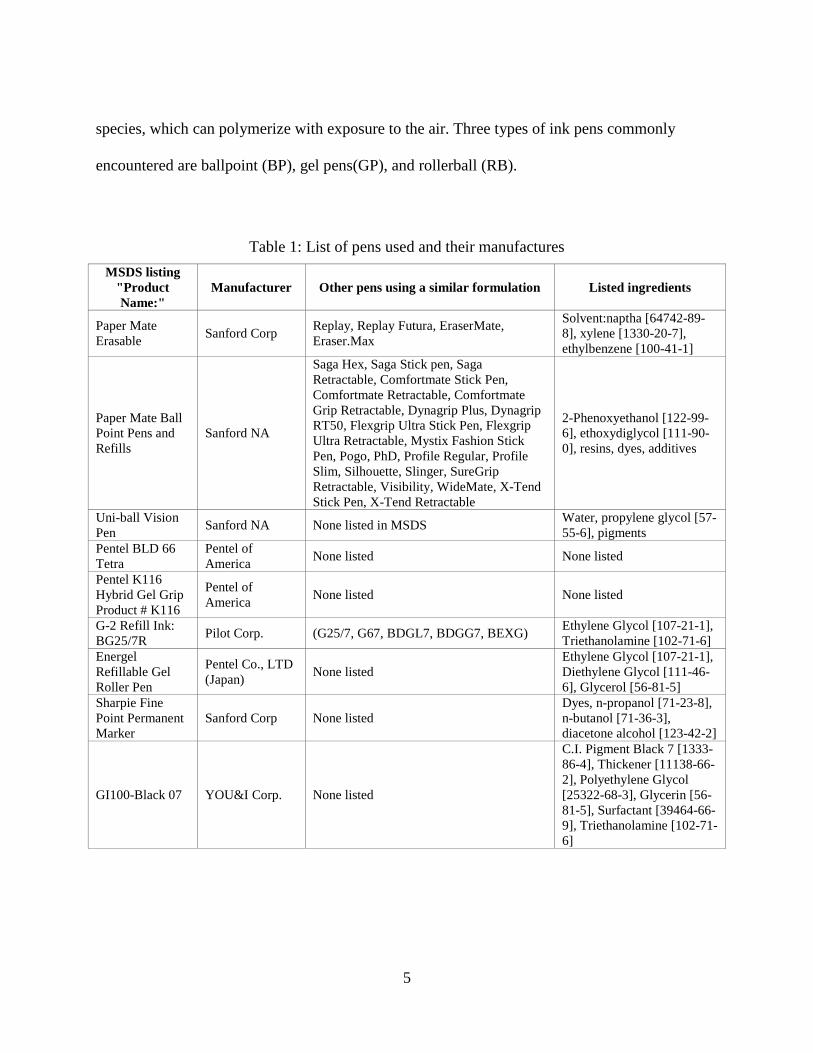
species, which can polymerize with exposure to the air. Three types of ink pens commonly
encountered are ballpoint (BP), gel pens(GP), and rollerball (RB).
Table 1: List of pens used and their manufactures MSDS listing
"Product Name:"
Manufacturer Other pens using a similar formulation Listed ingredients
Paper Mate Erasable Sanford Corp Replay, Replay Futura, EraserMate,
Eraser.Max
Solvent:naptha [64742-89-8], xylene [1330-20-7], ethylbenzene [100-41-1]
Paper Mate Ball Point Pens and Refills
Sanford NA
Saga Hex, Saga Stick pen, Saga Retractable, Comfortmate Stick Pen, Comfortmate Retractable, Comfortmate Grip Retractable, Dynagrip Plus, Dynagrip RT50, Flexgrip Ultra Stick Pen, Flexgrip Ultra Retractable, Mystix Fashion Stick Pen, Pogo, PhD, Profile Regular, Profile Slim, Silhouette, Slinger, SureGrip Retractable, Visibility, WideMate, X-Tend Stick Pen, X-Tend Retractable
2-Phenoxyethanol [122-99-6], ethoxydiglycol [111-90-0], resins, dyes, additives
Uni-ball Vision Pen Sanford NA None listed in MSDS Water, propylene glycol [57-
55-6], pigments Pentel BLD 66 Tetra
Pentel of America None listed None listed
Pentel K116 Hybrid Gel Grip Product # K116
Pentel of America None listed None listed
G-2 Refill Ink: BG25/7R Pilot Corp. (G25/7, G67, BDGL7, BDGG7, BEXG) Ethylene Glycol [107-21-1],
Triethanolamine [102-71-6] Energel Refillable Gel Roller Pen
Pentel Co., LTD (Japan) None listed
Ethylene Glycol [107-21-1], Diethylene Glycol [111-46-6], Glycerol [56-81-5]
Sharpie Fine Point Permanent Marker
Sanford Corp None listed Dyes, n-propanol [71-23-8], n-butanol [71-36-3], diacetone alcohol [123-42-2]
GI100-Black 07 YOU&I Corp. None listed
C.I. Pigment Black 7 [1333-86-4], Thickener [11138-66-2], Polyethylene Glycol [25322-68-3], Glycerin [56-81-5], Surfactant [39464-66-9], Triethanolamine [102-71-6]

6
Figure 1: Black ballpoint ink on plain white copy paper, enlarged to show detail, 30-minute
drying time
Figure 2: The same ink line after three days of continual light exposure, with a common desk
lamp
7
Ballpoint pen inks are the most widely distributed of the commercially available pen inks.
They contain synthetic dyes and a glycol based solvent. Before 1950, ballpoint pens were
produced with an oil-based vehicle, which was later switched to a glycol-based formula that was
reputed to be safer and able to be applied more evenly on the paper. Ballpoint pen inks, which
are cheaply mass-produced, are subject to photobleaching over time. Figures 1 and 2 compare
the same ballpoint ink line before and after 72-hour exposure to a common desk lamp’s output.
Gel pens were developed with insoluble pigments to provide a color that does not fade under
normal conditions[3], as seen with ballpoint inks as in Figure 2 above.
The gel pen, introduced in the U.S. in 1989, typically contains a finely ground insoluble
pigment as the colorant with little or no volatiles, see Figure 3 for a typical gel ink (deposition)
on paper. A blue gel pen was used in the photomicrograph to highlight the deposition
characteristics of a typical gel ink. One black GP ink formulation, U.S. Patent, No. 5,993,098,
contains, carbon black, acrylic resin molecular weight 5000 g/mol, aminomethylpropanol,
alkylphosphates, xanthium gum, glycerin/glycerol, propylene glycol, and deionized water[4]. A
blue rollerball ink pen (see Figure 4) can contain a combination of dyes, pigments and additives
depending on the needs of the manufacturer and the consumer. At present there is no single
analytical scheme that provides an extraction and analysis of differentiation of all of the common
ink classes. A significant portion of the published research on pen ink analysis has been
conducted on BP inks, as they are the oldest of the commercially available ink formulations. The
positive identification of unknown samples may require new methods and even new
instrumentation. The best possible estimation of the composition of a given ink is based on the
type of ink and the knowledge of ink formulations.

8
Figure 3: Blue gel ink on white paper
Figure 4: Black roller ball ink deposited on white paper

9
Since most ink formulations are held as trade secrets, the only published information
concerning possible formulations are the Material Safety Data Sheets (MSDS) provided by the
manufacturer. Compounds identified by MSDS sources found in some popular brands of ink pen
formulations, the listed ingredients and other pens with “similar formulations” can be seen in
Table 1. The listed ingredients identify some compounds used in several pen ink formulations.
The compounds in the list were used to select standards for use with instrumental methods for
comparison to ink sample data, see Table 2 for pens and inks used for this study.

10
Table 2: Pens used in study by number, name and type
Pen Description Type 1 Bic Cristal Ballpoint 2 Mega SRX 500 Ballpoint Ballpoint 3 Cross Ballpoint Pen Refills Med Blk Ballpoint 4 Papermate Med pt Blk Ballpoint 5 Pilot BP-S Med Blk Ballpoint 6 Bic Ultra Round Stic Grip Ballpoint 10 Tul gel retractable fine black Gel 11 inc. Classic gels black Gel 12 Parker Jotter (Gel Refill) Gel 13 PentelEnerGel Liquid ink Gel 14 Zebra Gr8 Gel Gel 15 Uni-ball Signo (207) Gel 16 Rose Art Gel 17 Uni-ball Bold Jet Stream Sport Rollerball 18 Uni-ball Deluxe Fine Rollerball 19 Pentel Tetra Liquid Ink Fine Rollerball 20 Pentel Hybrid Gel Roller K176 Rollerball 21 Bic Z4 Roller Rollerball 22 Uni-ball Vision Micro Rollerball 23 Bic Pro+ Ball Pen Ballpoint 24 Bic 4 Color (Using only black) Ballpoint 25 Pilot BP-X Ballpoint 26 Zebra Ola Med Ballpoint 27 Zebra Z-365 Ballpoint 28 Pilot Easytouch Retractable Ballpoint 29 Zebra Z-grip Med Ballpoint 30 Zebra F-301 compact fine Ballpoint 31 Papermate X-tend BP Ballpoint

11
Forensic Document Examination
Forensic examination of any questioned document will typically include microscopic and
macroscopic examinations before proceeding to any test that consumes or destroys a portion of
the sample. Microscopic examinations can be conducted with a stereomicroscope and a
comparison microscope. The information provided by microscopic examination of a questioned
document can help quickly identify the paper and class of pen used. Forensic document
examiners perform other types of document analysis, such as handwriting analysis and
deciphering hidden (decipherment) or visualization of obliterated writing[5]; however, those
types of analysis are outside the scope of this research.
Ink Analysis
The goal of the QD section is to provide scientifically validated methods of document
analysis. Many QD sections are accepting the new standards and adopting principles that will
help to establish the discipline as more scientifically and legally defensible. Ink analysis is
derived from analytical chemistry, which has accepted and validated methodologies. Analytic
chemistry also provides strategies to implement new and novel analysis schemes. The National
Academy of Sciences defines the objectives of ink analysis as: “An ink examination can have
one of two objectives; class identification, for which the intention is to identify the ink formula
or type based on a reference library of samples of inks, or by comparison of two ink samples to
determine if they share a common origin[8].”
The ultimate goal is to allow potentially fraudulent documents to be investigated with
scientifically based and validated methodologies. An effort to keep documents intact to preserve
their evidential value is considered key; therefore methods of document analysis have

12
traditionally relied on non-destructive methods. Non-destructive methods of ink analysis do not
assess ink formulation or an ink’s chemical composition. In order for a more complete and
scientifically valid method of document examination, some destruction of the document is
required. As long as the amount of sample consumed is relatively small, the integrity and
evidentiary value of the sample is preserved. The additional information provided by destructive
means can help to answer questions posed by Brunelle (page 2).
There are several types of criminal activities that utilize an authentic document. Detection
of these types of crimes may require ink analysis. An insertion is committed by inserting pages
or passages that were never intended for inclusion in the document by the writer. A deletion
involves something erased (or removed) from a document by chemical or physical means[6].
Addition forgeries are made up of items never intended for inclusion in the original document for
example increasing the value of a check by adding extra numerals or manipulating the original
writing in some manner without erasure. Detection of these alterations requires the use of a total
analysis scheme, which begins with the least invasive and ending with those that consume some
of the sample.
Non-Destructive Analysis Methods
The methods used in a forensic document examination can include destructive as well as
non-destructive (ND) methods of analysis. Obviously, ND methods are preferred as they will
leave the document intact and preserve the value of the document as a piece of evidence.
However, a drawback to ND methods can be the limited amount of information and
discrimination provided by some of these methods [7]. One ND method described in ASTM E-
1422, the dichroic filter examination, is mentioned as a comparative technique.

13
Dichroic Filter Analysis
Dichroic filter examination utilizes two dichroic filters, which block the transmission of
one portion of the electromagnetic spectrum, allowing another portion to pass through the filter.
The sample in this type of examination is illuminated with a light that has the red and infrared
portion removed with a band pass filter. The observer views the sample through a green filter [7].
The combination of these filters can accentuate the interactions of the sample with the blue and
green portions of the electromagnetic spectrum. This interaction can create a situation where the
optical properties of a sample will exhibit characteristics that may allow the analyst to conclude
that samples do not have a common origin. Not every sample has unique qualities observable by
dichroic filter examination, thus limiting this method to a preliminary examination before a more
sensitive destructive method is applied. If the analyst could determine the answer to the question
without having to destroy a document, they should work from less to more destructive methods.
Paper typically contains UV brighteners which, when disturbed by erasure, may be evident with
some non-destructive means[6]. A major drawback of the use of dichroic filters is that the
analyst is limited to only a tentative identification of a questioned sample. Individualization and
positive identification of inks is impossible with dichroic filter examinations. Some newer ND
methods utilize an image digitalization device, and image processing software.
Digital Processing Methods
Hammond examined black BP pens by a digital image processing method [8]. The
method uses a flatbed image scanner, followed by analysis with the LAB color mode of
commercially available imaging software. A validation study of 44 pen samples created 990 pen-
pair samples of which 28.5% were undifferentiated by the method [8].

14
When a simple or non-destructive test is not discriminatory or is inconclusive, more
destructive methods such as gas chromatography/mass spectrometer (GC-MS) analysis may be
required to provide more information.
Gas Chromatography/Mass Spectrometry (GC-MS) Analysis of Inks
Many of the non-destructive methods of ink analysis provide results that are subjective in
nature. Other non-destructive methods are based on recognizing an easily identifiable class
feature. For example, determination if a questioned ink sample is an oil-based ink, due to its
solubility in organic solvents[11]. Many types of trace evidence analysis rely extensively on GC-
MS methods. GC-MS analysis is useful with molecules, which are volatile in nature. An
important limitation of this method is that some molecules can degrade at inlet and oven
temperatures commonly used for GC-MS analysis (250-280°C). Analysis of molecules, present
in a sample as salts, is not readily accomplished with GC-MS due to their insolubility in with
organic solvents and the high vaporization temperatures of salts. GC-MS methods are
reproducible, allow for good separation of volatile analyses, and some manipulation of analytical
parameters by variation of column bonded phase composition. Typically, GC-MS analysis passes
a stream of GC eluate into electron ionization (EI) source operated at 70 eV. This process ionizes
neutral analyte molecules and creates characteristic molecular fragmentation patterns[12].
Electron ionization fragmentation patterns exhibited by a molecule during mass analysis
are characteristic of a specific species. However, EI does not impart exactly 70 eV to every
molecule that is ionized, thus there are a range of energies imparted to formerly neutral
molecules[12]. Ionization occurs when energized electrons are created and then interact with
neutral species. The energy transfer between the energized electrons and analyte molecules is not

15
collision induced, rather the transfer occurs as a result of equilibration of a charge gradient[12].
Pure compounds exhibit a characteristic EI mass spectrum, therefore allowing a positive
identification of a compound by mass spectrometry. In EI analysis of controlled substances, a
positive confirmed identification is based upon an EI mass spectrum that contains the
characteristic fragmentation pattern specific to the molecule in question. Figures 5 and 6 are
samples of typical EI spectra. These EI fragmentation patterns can be used as the basis of a
selected ion monitoring (SIM) - chromatographic profile for confirmation with EI-MS, according
to several professional bodies such as the College of American Pathologists. However, a
confirmatory scheme for ink is not as straightforward as for controlled substances. The ASTM E-
1422-05 Standard Guide for Test Methods for Forensic Writing Ink Comparison does not include
a procedure to confirm two ink samples are “identical or the same ink.” The batch-to-batch
variation of inks, in general, only allows the following conclusions; the inks do not have a
common origin (differentiation), the inks are of the same or similar formulations, see Table 2.
Figure 5: Electron ionization mass spectra of 2-phenoxyethanol (molecular mass 138.17)

16
Figure 6: Electron ionization mass spectrum of triethanolamine (molecular mass 149.188)
GC-MS methods were used to identify ballpoint ink volatiles, specifically 2-
phenoxyethanol EI spectra in Figure 5 which has been used to determine the time since
deposition age of ink on paper[13]. The author of the standard guide surmised that the rate of
evaporation of solvent for a heated sample would eventually equal a constant value. The age of
the writing would be equal to the time required for the amount of 2-phenoxethanol, see figure 7,
in an artificially aged sample, to equal the amount found in a sample of unknown age.
Accounting for the loss of 2-phenoxethanol illustrates a common problem in ink analysis as it
relates to questioned document analysis, the effects of aging and other factors on ink
identification and classification.

17
Figure 7: 2-Phenoxyethanol molecular structure
There are a large number of writing instruments available commercially with various ink
formulations, each of which potentially contains an unknown variety of chemical species and
compound classes that must be identified in order for a positive and confirmatory result. Ink, by
its nature, is a complex mixture of ingredients blended to exhibit commercially desirable proper–
ties. Positive identification of compounds with complex EI fragmentation patterns is a difficult
task. Typically, a comparison to a known standard is the preferred method to conclusively
identify an unknown sample. The National Institute for Standards and Technology (NIST) mass
spectral database, a database of greater than 100,000 mass spectra, was generated using mainly
EI methodologies [12]. GC-EI-MS methods have historically been the method of choice for the
analysis of samples of unknown composition. However, the versatility of the liquid
chromatography (LC) and liquid chromatography mass spectrometry (LC-MS) instrumentation
are making their use in forensic trace evidence analysis indispensable and more commonplace.
18
Liquid Chromatography Mass Spectrometry (LC-MS) Analysis of Dyes
Liquid chromatography mass spectrometry (LC-MS) has been utilized in the analysis of
organic molecules of all types as well as inorganic salts, and volatiles. An analytical column is
used in LC analysis to provide chromatographic separation of a sample into its components by
interactions with the stationary phase. After chromatographic separation is completed, the
analytes must be ionized before mass analysis. There are two commonly used atmospheric
pressure ionization methods utilized with LC-MS, electrospray ionization (ESI) and atmospheric
pressure chemical ionization (APCI). Each method has advantages and limitations. APCI
methods were not used in this research and will not be considered further. LC/ESI-MS methods
have been adapted to some forensic analytical schemes, such as identification dyes from
extracted from textile fibers or writing inks [2, 14, and 15]. A very broad range of analytes can
be used with ESI-MS methods.
Electrospray Ionization (ESI)
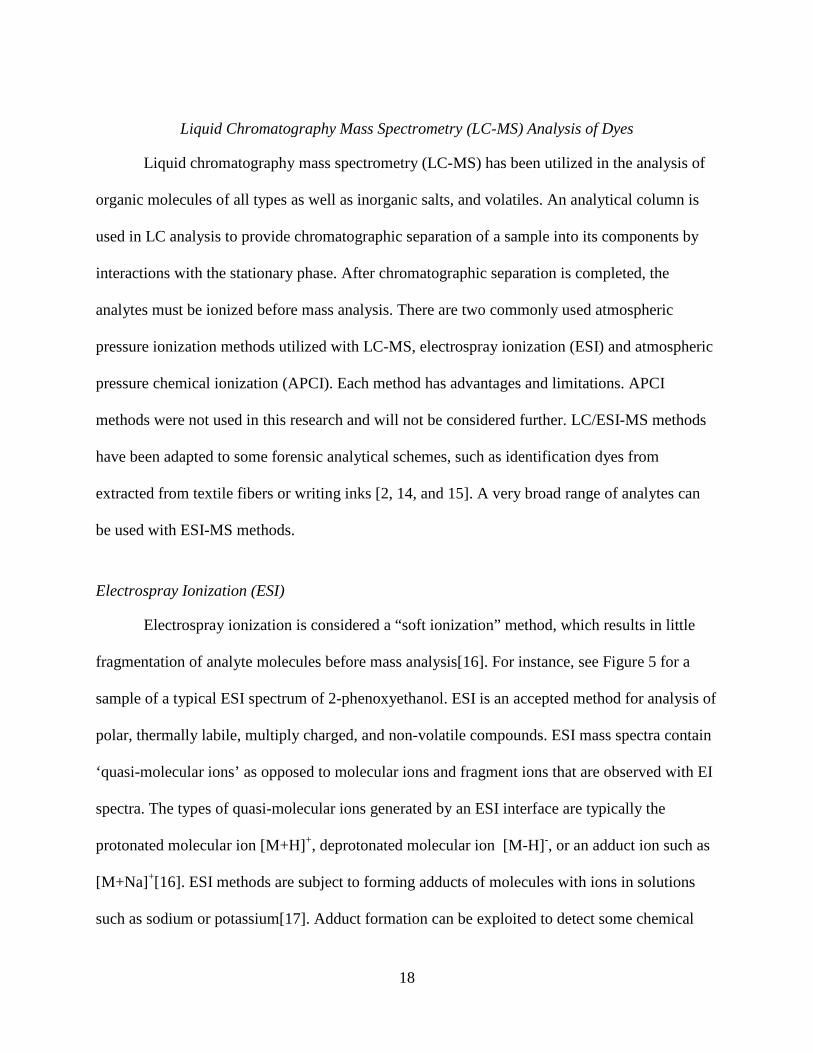
Electrospray ionization is considered a “soft ionization” method, which results in little
fragmentation of analyte molecules before mass analysis[16]. For instance, see Figure 5 for a
sample of a typical ESI spectrum of 2-phenoxyethanol. ESI is an accepted method for analysis of
polar, thermally labile, multiply charged, and non-volatile compounds. ESI mass spectra contain
‘quasi-molecular ions’ as opposed to molecular ions and fragment ions that are observed with EI
spectra. The types of quasi-molecular ions generated by an ESI interface are typically the
protonated molecular ion [M+H]+, deprotonated molecular ion [M-H]-, or an adduct ion such as
[M+Na]+[16]. ESI methods are subject to forming adducts of molecules with ions in solutions
such as sodium or potassium[17]. Adduct formation can be exploited to detect some chemical

19
species, for example some glycols form adduct ions quite readily with sodium. One unique
feature of ESI analysis is the formation and detection of multiply charged ions, where z in the
mass to charge ratio (m/z) is greater than one[16, 18]. Some compounds exhibit multiple adduct
forms for example, [M+(n)Na]n+, which can form visually recognizable patterns. The mass
spectral peaks associated with the compound are spaced 23 m/z units apart in the case of
sodium[12, 18]. Adduct formation is not limited to sodium ions, they can also be formed by
chloride ions or ionized solvent molecules, i.e. triethanolamine adduct [149+Na]+= 172 m/z as
seen in Figure 9.
Figure 8: Electrospray ionization interface

20
Figure 9: Electrospray ionization mass spectrum of 2-phenoxyethanol molecule [M+H]=139

21
Figure 10: Electrospray ionization mass spectrum of triethanolamine [M+Na] = 172 m/z

22
The ESI process begins with the nebulized aerosol of charged droplets (see Figure 8).
Charge is imparted to the mixture as it passes an electric field at the end the electrospray
nebulizer as the liquid is dispersed. The introduction of heated helium drying gas volatilizes the
solvent from the charged aerosol droplets, which results in smaller droplets of high analyte
concentration. The charge of the liquid entering the nebulization chamber and the subsequent
charged droplets depend on the analysis polarity, either positive or negative. The droplet gets
smaller as more solvent is evaporated and carried away with unionized and neutral molecules
(Figure 8). Charge density on the droplet surface eventually becomes so great that the surface
tension of the droplet can no longer contain repulsive forces of the ions, and gas phase ions are
generated (see Figure 8). These gas phase ions are led by gas flow and a potential gradient in a
heated glass capillary to the mass analyzer. ESI allows the analysis of a large number of
compounds across varying chemical classes; however, a pre-nebulization additive could be used
in order to analyze samples that are not ionized by the dissolution process. The addition of an
additive such as ammonium chloride or acetic acid can increase the effectiveness of the
ionization process and elicit an increased instrumental response[19]. ESI interfaces allow the use
of less complicated and less expensive mass analyzers and are commonly encountered with
linear quadrupole type mass analyzers.
Linear Quadrupole Mass Analyzers
The use of ESI allows the detection of ions having single charged or those that are
multiply charged can be introduced into the mass analyzer[12]. A quadrupole mass analyzer,
used in this research, operates by separating ions of differing mass to charge ratio (m/z). This is
accomplished in an electric field applied between the elements in the quadrupole (see Figure 11).

23
The electric field is varied in order to allow only ions of a particular m/z to pass through the
mass analyzer and reach the detector, typically an electron multiplier. Ions that do not meet the
criteria (the selected m/z) are deflected and do not reach the detector. A scan performed with EI
mass analyzers allows many differing m/z ions to be detected. A scan for the m/z range of the
mass analyzer is accomplished by varying the DC voltage to allow ions from a set m/z ratio to
pass thought the quadrupole to the detector.
Figure 11: Diagram of quadrupole mass analyzer (reprinted with permission)
Quadrupole instruments are composed of an introduction system for ions created in the
source, typically a series of skimmers and a capillary. The quadrupole itself is four rods that are
oriented parallel to each other. This creates a channel in the center of the four rods that is the
path that ions of the selected mass (m/z ratio) will pass through, to the mass analyzer (Figure 11).
The application of DC and AC voltages to the rods allows the instrument to filter all but one
mass to charge value at a time.
24
LC-MS ESI Direct Infusion Analysis of Inks and Dyes
Several methods have been described for ESI-MS/MS identification of dyes extracted
from textile fibers and ink dyes in instruments where the analytical column is bypassed and the
mobile phase and sample are directly pumped to the ionization interface [2, 20]. This method is
known as direct infusion ESI-MS. With direct infusion method, no chromatographic separation
of compounds is achieved. However, with use of the proper ESI polarity, mobile phase additive,
and fragmentor voltage, a mass spectrum containing many of the components in an ink sample
can be obtained in a single scan. The method may allow an individual ink sample to form a
unique characteristic signature or ‘fingerprint.’ This fingerprint can be compared to other inks,
and a determination of similarity or difference can be assessed. The signature would include the
colorants, vehicles, and other ink constituents. A LC/ESI-MS method compatible with BP, RB,
and GP inks and based on uniqueness of mass spectral information is presented in this thesis[2].
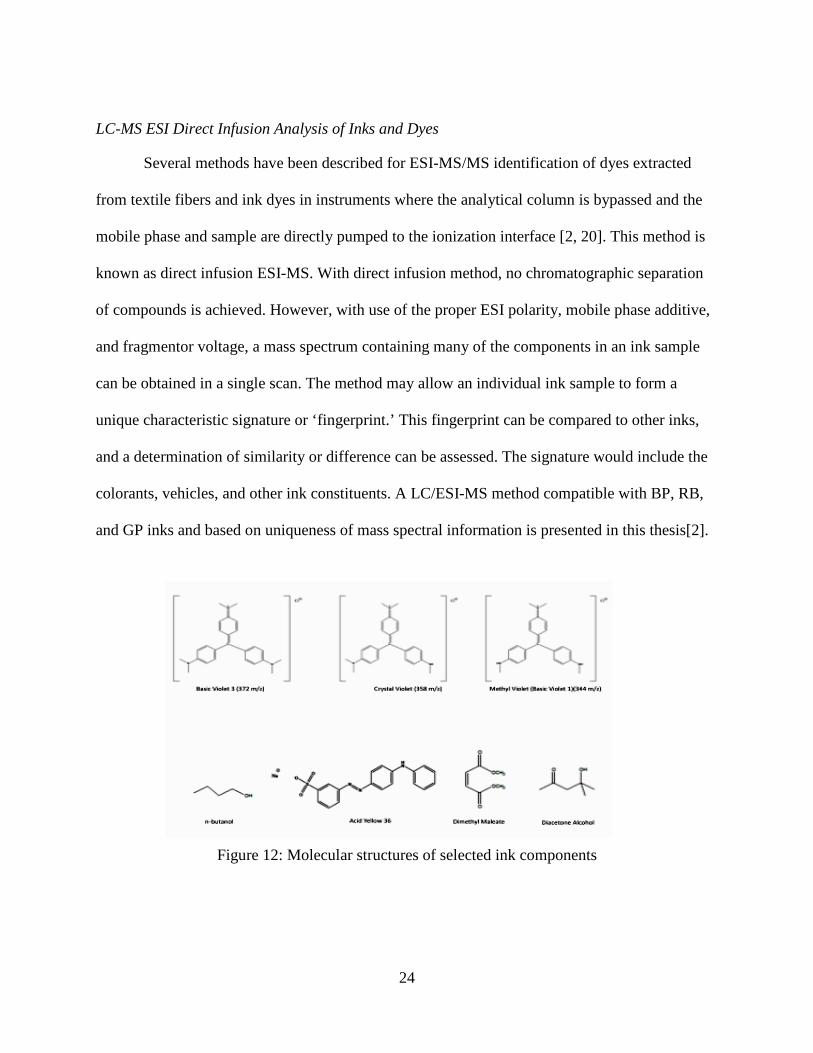
Figure 12: Molecular structures of selected ink components

25
Challenges in Ink Analysis
Among the many challenges of ink analysis is the effect of age upon analytical results.
Immediately after an ink mark is deposited on paper, the volatile solvents act to disperse the
colorants in an even coating on the paper. As time passes, the solvents will eventually no longer
remain as part of the ink mixture on paper. It will be below detectable limits at a point in time
determined by, but not limited to, storage temperature, vapor pressure, humidity, light exposure,
the physical and chemical properties of the mixture of chemicals in the ink, and the length of
time since initial deposition. The bulk (98%) of BP solvent is volatilized and dispersed into the
surroundings within the first two minutes post deposition on paper[21]. Any method used to
detect residual solvents must be sensitive enough to detect these solvents at roughly 1% of total
composition with background and paper interference. One form of age determination known as
bracketing, fixes the earliest date an ink formulation was available, which can be compared to
dates on the document. Others have suggested an aging/dating method that would not rely on
limited trace quantities of volatile components, but rather focusing on a method based on
analysis of the sum of extractable ink components.
One of these aging methods is the determination of degradation of hexamethylpara-
rosanaline or basic violet 3(BV3). BV3 is found in the majority of black and some blue ballpoint
inks as the main synthetic dye. Basic Violet 3 is a triphenylmethane derived dye containing six
methyl groups which are able to undergo demethylations (methyl replacement by hydrogen)
when exposed to sources of light, in visible or ultraviolet wavelength range[22]. The
demethylations occur through a reaction induced by interactions of the dye with photons of
incident light[23]. With mass spectrometric methods, the demethylations of BV3 can be

26
visualized in the ESI mass spectrum as an ion 372 m/z, with a smaller peak at 358 m/z, and
sometimes a peak located at 344 m/z.
However, BV3 as shown in Figure 12 is rarely encountered in a pure form, since there is
nearly always some included basic violet 1 (358 m/z). BV1 is also a degradation product of the
hexamethalyted molecule, and as such, a BV3 sample that has been exposed to light will always
contain some BV1, including the BV3 found in pen inks. The ratios of BV3/CV/BV1from
methanolic extracts of a series of blue BP ink marks stored in controlled conditions and those
subjected to “various places and conditions” [24]. The CV/MV/TPR ratios of the control group
after two years of exposure at room temperature through glass to ambient solar radiation, the
shift towards the doubled demethylated CV form was noted. As a result, there is less of the TPR
form detected when analyzed with High pressure liquid chromatography-UV diode array
detector (HPLC-UV/DAD), to the extent that the treated samples could not be distinguished from
the control samples[24]. Some recent LC-MS ink analysis methods call for tandem mass
spectrometry that require very new or complex ionization techniques. Sophisticated
instrumentation such as this invariably carries a price tag out for reach of many crime labs
operating with reduced budgets. Some other analytical instrumental methods like capillary
electrophoresis have been adapted to ink analysis.
Other Ink Analysis Methods
Some previously described methods of ink analysis used thin layer chromatographic
analysis (TLC). TLC has been used to separate dye components of BP inks, dyes from each
other, as well as some vehicle components from other ink types. A series of other destructive
tests provide the analyst with more information about the questioned ink. Besides wet chemical

27
methods, there are newer available hyphenated instrumental analysis methods including ICP-MS,
CE-MS, and some tandem MS methods have been adapted for ink or dye analysis.
Thin Layer Chromatography (TLC) Analysis
TLC is a standard ink analysis technique used in a significant number of published ink
analysis methods, since the equipment is inexpensive compared to the cost of a MS instrument.
In addition, TLC typically requires little operator training. However, one criticism of TLC
analysis is the consumption of ink lines from the paper. With a blunted 0.5mm-2.0mm biopsy
needle, several (5 to 10) punch sections may be required for one TLC spot sample. More than
one sample per ink maybe needed in order to differentiate exhibits or to make comparisons to
other inks. Libraries of TLC chromatograms are regularly used for the basis of comparison of
known standard ink and unknown ink samples. The discriminating power of TLC methods can
be increased with densitometric and spectrophotometric analysis [9]. The use of chemical spot
tests can also be useful in the total analysis of questioned ink samples and provide class
differentiation.
Chemical Spot Tests
The hypochlorite spot test is one of the quicker methods for an analyst to determine the
class of a questioned ink. The test is performed by treating a portion of the sample that has been
spotted on a TLC plate with sodium hypochlorite. If any movement of the ink spot is noticed
when a 10% sodium hypochlorite (bleach) solution is added, the sample is not a gel ink. Since
gel inks contain insoluble pigments such as carbon black that is not subject to chemical
bleaching [3]. Ballpoint inks will run when organic solvent is applied, for example pyridine. [10]

28
Brew, Hagen, and Egan of the U.S. Federal Bureau of Investigation Laboratory, used
capillary electrophoresis (CE) with ultraviolet visible detection for the analysis of both black and
blue BP ink formulations. The CE/UV methods suffer the same drawbacks as UV methods when
the chromatographic separation was lacking [25]. A matrix-assisted laser desorption/ionization
(MALDI) method with direct sampling from the questioned document has been reported [26].
The MALDI method can detect multiply charged dyes without additives; however, for detection,
the singly charged dye 2-(4-hydroxyphenylazo)benzoic acid (HABA) is added to the MALDI
matrix and diammonium hydrogen citrate (DAHC) is applied to the questioned document for
detection with MALDI-MS [26]. Instrumental requirements of MALDI analysis include newer
time-of-flight mass spectrometers having a high sensitivity and short laser ionization times.
Fluorescent compounds or rare earth elements were added to ink formulations by some
manufactures from 1970 to 1994 at the request of the United States Secret Service [27]. The
addition of these chemicals, referred to as “taggants,” served to help identify and individualize
inks samples provided they were included in the tagging program. However, less than 40% of
ink manufacturers participate and the program was discontinued in 1994 [27]. Inductively
coupled plasma mass spectrometry can be used to detect rare earth elements sometimes used as
taggants [27]
29
CHAPTER TWO: EXPERIMENTAL
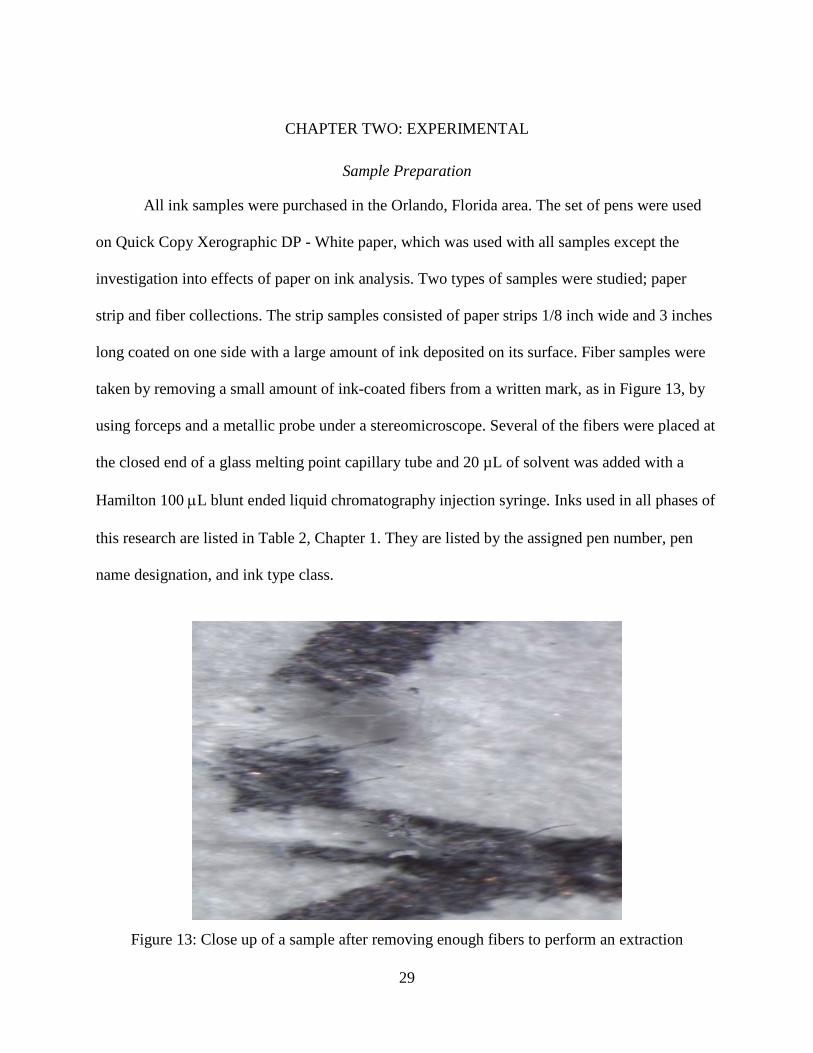
Sample Preparation
All ink samples were purchased in the Orlando, Florida area. The set of pens were used
on Quick Copy Xerographic DP - White paper, which was used with all samples except the
investigation into effects of paper on ink analysis. Two types of samples were studied; paper
strip and fiber collections. The strip samples consisted of paper strips 1/8 inch wide and 3 inches
long coated on one side with a large amount of ink deposited on its surface. Fiber samples were
taken by removing a small amount of ink-coated fibers from a written mark, as in Figure 13, by
using forceps and a metallic probe under a stereomicroscope. Several of the fibers were placed at
the closed end of a glass melting point capillary tube and 20 µL of solvent was added with a
Hamilton 100 µL blunt ended liquid chromatography injection syringe. Inks used in all phases of
this research are listed in Table 2, Chapter 1. They are listed by the assigned pen number, pen
name designation, and ink type class.
Figure 13: Close up of a sample after removing enough fibers to perform an extraction
30
Instrumental Methods
Direct Infusion Electrospray Ionization Mass Spectrometry (ESI-MS) Analysis
An Agilent 1100 series linear quadrupole mass analyzer was used for ESI-MS analysis.
This system was configured to by-pass the chromatography column and uses the instrument’s
binary pump to force mobile phase toward the ESI interface. A Rheodyne manual injection port
with a 5-μL sample loop was used to introduce a sample into solvent flow. A syringe pump was
used to infuse a pre-nebulization additive. The polarity, additive concentration and applied
voltage were varied to optimize a method for mass spectral characterization of ink on paper
samples. Three analytical methods were developed; (Method 1) +120V with 4.1% (vol/vol) trace
grade glacial acetic acid in methanol, (Method 2) +0V with 0.00041% (wt/vol) sodium acetate in
Methanol, and (Method 3) -120V with 4.1% (wt/vol) triethylamine in Methanol.
Instrumental Parameters
The suggested extract volume per ink sample is 20 μL, however a 5-μL sample loop was
used for this research. The sample loop was overfilled in order to limit the variation of injection
volume. Rheodyne Technical Note Number 5, indicates that volumetric precision of the method
of injecting a two- to five-fold volume excess into the manual injector port gives an RSD of
0.2% for volume injected. Sample extracts were introduced into the ESI interface using a
Rheodyne 8125 manual sample injector with a 5-μL sample loop. Mobile phase was supplied by
an Agilent LC binary pump at a flow rate of 200 mL/min. Before introduction into the ESI
interface, a mobile phase additive was also infused with the mobile phase from a screw-drive
type syringe pump introduction system with a rate of 5.0 ML/min. Once the sample was in the
mobile phase flow it is moved into the ESI interface for subsequent mass analysis. The ESI
31
interface was kept at 350 °C, with a 12.1 mL/min flow of nitrogen drying gas at 30 psig. The
fragmentor applied voltage was adjusted from -120V to +120V in order to determine which
setting provided the least fragmentation and the best response for all three ink classes. The mass
filter was set to scan from 50 to 1000 Daltons.
Extraction Optimization
The best universal solvent for extraction of ballpoint, rollerball, and gel inks was
determined by test extractions from ink-coated paper strips. Initially, pens 1–6 and 10-22 on
Table 2, page 9, of the initial 33 pens were extracted and placed into either ethanol, methanol, or
benzyl alcohol, where they were allowed to sit 30 minutes at room temperature in a flame sealed
glass melting point capillary. After 30 minutes the samples with methanol exhibited color change
with more samples than ethanol, or benzyl alcohol. While the dyes contained in ballpoint and
some rollerball inks are quite soluble in alcohols, gel ink colorants are insoluble and required
additional consideration during the method development phase. Sonication of fibers and solvent
for times of zero and thirty minutes showed no effect on ions observed in the sample’s ESI-MS
spectrum. A series of three to four-inch long marks from inks that did not extract with methanol,
ethanol, or benzyl alcohol were deposited on a Whatman #2 ‘qualitative circles’ filter paper and
20 µL of various solvents were spotted on the ink lines. Each of the solvents was observed after
ten minutes for possible movement of ink color. Solvents reportedly used in TLC analysis of inks
were examined for possible use for extraction of gel ink (pens 13, 14, 15, 17, 18, 20, 22)
components, e.g. hypochlorite, ethyl acetate, pyridine, glacial acetic acid, THF, 10% ammonium
hydroxide solution, isopropanol, acetonitrile, DMSO, and DMF. The inks were determined to be

32
soluble for this group of pens [1]. Very pure methanol such as LC-MS grades are reasonably in
cost and can be used across all three ink classes discussed in this research.
Direct Infusion ESI-MS Optimization
Spectral Subtraction to Yield “Pure Ink” Spectrum
Samples were analyzed using a subtraction method. A series of samples were injected in
the following order, a solvent blank (syringe blank), “paper blank”, solvent blank, and methanol
extract of the ink sample. The series of injections were collectively referred to as an ‘analytical
run’ and is the basis for direct comparison of ink spectra to one another. The ion elution profile
shown below was typical of ballpoint ink-on-paper methanol extract, as depicted in figure 14.
Time (Min)
Figure 14: Chromatogram showing elements of the subtraction method (analytical run)
Within the Agilent Chemstation software, the peak corresponding to the ink-on-paper
sample was selected (4 to 5 min) in figure 15. The resultant mass spectrum contains background,
mobile phase, sample, paper, and “pure ink spectrum” components. The mass spectrum
Rel
ativ
e In
tens
ity

33
corresponding to the peak at 1.8 minutes was subtracted from the sample mass spectrum
resulting in the spectrum shown in figure 15B and then the solvent blanks were subtracted
(figure 15A). The remaining spectrum (paper blank, background, and syringe blank subtracted)
is the “pure” spectrum of the ink sample on paper (see Figure 15D). Once this spectrum is
normalized, it is ready for comparison to other ink spectra.
Figure 15: Subtraction method
Ink Volatiles Persistence Study
A representative pen was chosen from each of the three ink classes for a study of drying
time vs. extractable volatiles. With each of pens 2, 13, and 18, lines were drawn on clean white
copy paper and one sample was extracted before it was allowed to completely dry, one sample
was allowed to dry to touch (30 minute dry time), samples were also allowed to dry for 1 hour
and 24 hours. The samples were extracted and analyzed with a sodium acetate additive in
methanol at a +0 V applied fragmentor voltage, the best method for the volatile components.

34
Both strip and fiber samples are used in the assessment of the effect of drying time on extractable
volatiles.
Effect of Paper on Extraction
The effect of paper type on a deposited ink sample’s ESI mass spectrum was examined
by analyzing the ink from one pen on various paper substrates. The ink was deposited on to
twenty differing colors and types of papers and then extracted after a 30 minute drying period.
The mass spectrum of the recovered ink was examined after subtraction of the syringe/solvent
blank and the paper blank from the ink plus paper matrix.
Dye and Vehicle Standards
Dye and vehicle standards were made in filtered LC-MS grade methanol, and
subsequently analyzed with the direct infusion method (see Tables 3, 4, and 5). Standards were
analyzed at +120V with no additive, initially to determine if the molecular ion could be observed
in the standards mass spectrum. The observed ions were recorded for comparison to results from
inks analyzed with the method.
Table 3: Positive dye standards used with Method 1
Dye Name CAS Number Concentration Used Formula Weight Solvent Black 3 4197-25-5 5 ppm 456.55 Basic Red 1 989-38-8 6.5 ppm 479.02 Disperse Orange 25 31482-56-1 5 ppm 323.35 Basic Violet 1 8004-87-3 6.5 ppm 456.17 Solvent Orange 3 495-54-5 5 ppm 212.28 Basic Violet 10 81-88-9 6.5 ppm 479.02 Solvent Red 49 509-34-2 5 ppm 442.55 Basic Blue 7 2390-60-5 5 ppm 514.16 Basic Violet 3 548-62-9 6.5 ppm 407.92
35
Table 4: Negative dye standards used with Method 3
Dye Name CAS Number Concentration used Formula Weight Acid Red 51 568-63-8 5 ppm 879.87 Acid Red 87 17372-42-1 5 ppm 691.88 Solvent Orange 3 495-54-5 5 ppm 212.28 Acid Yellow 3 8004-92-0 5 ppm 477.05 Acid Yellow 36 587-98-4 5 ppm 375.38 Acid Yellow 23 1943-21-0 5 ppm 534.37 Acid Yellow 73 518-47-8 5 ppm 376.28 Acid Green 1 19381-50-1 5 ppm 878.47 Acid Blue 9 3844-45-9 5 ppm 792.86 Acid Blue 92 3861-73-2 5 ppm 695.59 Solvent Blue 38 1328-51-4 5 ppm 734.65
Table 5: Vehicle standards used with Method 2
Vehicle Name CAS Number Concentration used Formula Weight Glycerol 56-81-5 50 ppm 92.09 Dimethyl maleate 624-48-6 50 ppm 144.13 Diethyl phthalate 84-66-2 50 ppm 222.24 2-Phenoxy ethanol 122-99-6 50 ppm 138.16 Ethylene glycol 107-21-1 50 ppm 62.07 1-H Benzotriazole 95-14-7 50 ppm 119.13 Diacetone alcohol 123-42-2 50 ppm 116.16 Diethanolamine 111-42-2 50 ppm 105.14 Dioctyl phthalate 117-81-7 50 ppm 390.56 Benzyl alcohol 100-51-6 600 ppm 108.14 n-Butanol 71-36-3 No dilution 74.12
In order to optimize the analytical method for applicability to all three ink classes, a set of
positive, negative or vehicle standards were injected, together with standards from each ink class
at one voltage setting and one additive concentration. The applied fragmentor voltage was set at
+0V, +60V, or +120V for the positive ion forming dyes in order to determine the acetic acid
additive and fragmentor voltage settings that provided the best instrumental response. For the
anion forming dyes, triethylamine was used and the voltage settings were -0V, -60V, and -120V.

36
Sodium acetate additive was used for ink vehicle detection, and was observed at +0V, +60, and
+120V to determine the best setting to insure minimal molecular fragmentation. Once the
optimal conditions were determined, limits of detection were calculated from calibration curves
of standards at the optimized voltage, additive, and polarity settings.
Photochemical Experiments
The ballpoint pen ink used for photochemical exposure experiments was selected from
the set of BP ink examined because it had the lowest average intensity of the 358 m/z ion relative
to the 372 m/z ion intensity. The lower the initial amount of 358 m/z present in ink 1, as
compared to all of the initial six ballpoint inks, allows for better visualization of the photolysis
via mass spectrometric techniques. Ink from pen 1 was used to create several five inch long pen
marks with the aid of a ruler. A portion of the paper, on a cardboard support, was covered with
aluminum foil to provide unexposed control samples for spectral comparison. The paper was
stapled to the cardboard in each of the four corners. Once the foil was securely fastened, the
sample was suspended three to four inches below the bottom of the Rayonette Photoreactor
(RPR 350). The sample was exposed to a UV light for a given a one, two, three, four, and five
hour time periods with use of a multifunctional timer. The ink was sampled in triplicate at each
time, extracted with solvent and the capillary tube flame-sealed.

37
Figure 16: RPR photoreactor spectral output
Figure 17: Spectral output profile for GE Helical light bulb at a distance of 12 inches from the source
Figure 18: Spectral output for GE Helical light bulb at a distance of 7 inches

38
The extent of degradation of the ink was determined based on the relative peak area
(RPA) of m/z 372, 358, 344, 330, 316, 302, and 288 were as used by Weyermann to evaluate the
degradation process with MALDI analysis methods. With ESI analysis, the presence of an ion at
372 m/z is indicative of BV3, however even “commercially pure” BV3 samples contain some of
the 358 m/z ion and 344 m/z ion as impurities. When one attempts to determine the extent or rate
of BV3 degradation, the sequential loss of methyl fragments to yield ions of 358, 344, 330, 316,
302, and 288 m/z ions.
The extracted ion peak area of 372 m/z ion from the sample divided by the total area of
degradation products from 358 to 288 m/z values were used to, quantify the extent of
degradation [22]. The degradation times for BP inks were determined using direct injection ESI-
MS methodologies. Samples were extracted and analyzed with the direct infusion ESI-method.
The area ratios of all of the products were compared after exposure to a light source.
Light Exposure Effects
Samples of BP ink are known to decompose upon exposure to light. Pen 1 was used to
study the degradation detectable with the ESI-MS method. Samples were exposed to light
sources from seconds to several days and photobleaching effects and exposure related
degradation products to observed. Light sources used were a GE Helical desk lamp with an
energy efficient standard light bulb, and a RPR3500 Rayonette UV photochemical reactor.
Potassium Ferrioxalate Actinometry
The quantum yield of the potassium ferrioxalate (PF) actinometer has been extensively
studied, and has been determined for the absorbance profile range (250-509 nm). This method is
based on the conversion of ferric ion to ferrous ion by light. The ferrous ion concentration is

39
indirectly determined by absorption of the ferrous- (1,10-phenanthroline) complex at 510 nm.
The resulting complexed solution’s absorbance at 510 nm was measured with an Ocean Optics
USB200 UV-Visible spectrophotometer.
Figure 19: Potassium ferrioxalate ion
Potassium ferrioxalate ion, in Figure 19, was synthesized from three volumes of 1.5 M
potassium oxalate and one volume of 1.0 M ferric chloride. The resulting green solid was
recrystallized three times for purification as per the IUPAC actinometry guide[8]. The crystals
were vacuum filtered, dried, and finally weighed. A quartz cuvette was charged with 3 mL of 1.5
M ferrioxalate solution and exposed to UV light from the Rayonette photochemical reactor for
30 seconds, 1, 2 and 4 minute exposures with aid of a countdown timer. After exposure, 1 mL of
PF solution was added to a 10mL volumetric flask, along with buffer and 1,10-phenanthroline
solution. Red darkroom safety light was used to insure that actinometer would not be exposed to
any UV light until it is placed in the photo reactor cell and the timer is engaged. After one hour
of complexation, the absorbance of the complex was recorded at 510 nm with a UV-visible

40
spectrometer. The number of photons per unit time were calculated from the actinometry
experiment, and compared to the UV exposed ink samples. A curve was generated from the
absorbance of the complex at 510 nm and the photon flux was compared to that of the sun.
Method Validation of Direct Infusion ESI-MS Ink Analysis
Analysis of Triplicate Run Data
Triplicate analyses of inks from pens 1-33 were conducted using all three ESI-MS
methods (+120V with acetic acid, +0V with sodium acetate, and -120V with triethanolamine) to
compare previously collected ink data for sample-to-sample variations. All samples were the
fiber type and were extracted into LC-MS grade Optima methanol after 30 minute drying time.
Same Manufacturer Multipack Pen Analysis
A set of pens from the same manufacturer, having the same class with different colors,
were examined by direct infusion ESI-MS and compared to the black ink data. When black ink is
dissolved in solvent, it can take on a dark purple appearance during extraction. Several colors of
ink may contain basic violet 1 and 3, in a lesser concentration than in black ballpoint inks, which
may make identification of a sample more difficult. The typical ESI-MS spectrum of a gel pen
contains vehicle components, which could be the same in all ink colors from a same
manufacturer. Triplicate analysis of pen sets containing purple, black, and blue inks was
compared to the black ink data from ESI-MS method validation experiments. Table 6, shows
manufacturer, ink class, name of pen, and the colors of ink used for direct infusion ESI-MS
methods. Two samples were taken from four-color pens that were collected at the 2009
American Academy of Forensic Sciences Conference in Denver, CO. These pens were given out
as gifts to attendees and were only labeled with advertisements. The four-color pens contained

41
black, blue, red, and green inks of which only the black and blue inks were examined in this
research (see Table 6).
Table 6: Colored Pens
Manufacturer Class Name Colors analyzed Pentel BP Ola Black, Blue, Purple Zebra BP Z-grip Black, Blue, Purple Pilot GP G-2 Gel Black, Purple Signo GP 207 Black, Blue, Purple Pentel BP R.S.V.P Black, Grey, Blue, Purple Bic BP 4-color Black, Blue Unknown BP 4-color Black, Blue Unknown BP 4-color Black, Blue
Intersecting and Overlapping Ink Strokes (Deposition Order Determination)
Direct Infusion LC-MS
An addition was created on white xerographic paper, in the form of “$30.00” (Figure 20)
on a simulated check. This was written with pen 3 and allowed to dry to touch, or 30 minutes,
and then changed to “$80.00” (Figure 21) using pen 5, with the addition of writing to alter the
original writing. When the samples were created, care was taken to insure an overlapping of the
two inks in order to determine if the presence of both inks could be detected. Ink was sampled in
areas that contained only ink 3, only ink 5, and overlapping areas that contained both inks (see
Figure 19). After extraction and direct infusion ESI-MS analysis the resulting data can be
compared to both ink 3 and ink 5 for uniqueness and mass spectra contributions from both inks.

42
Figure 20: Pen 3 ink, original depicts an unaltered original writing of the number 3
Figure 21: Pen 5 ink writing over written to change the value of figure 20 from a number 3 to a number 8

43
Figure 22: After sampling, showing the sampling of overlapping ink from pen 3 and pen 5

44
CHAPTER THREE: RESULTS
Direct Infusion Electrospray Ionization Mass Spectrometry (ESI-MS) Analysis
Extraction Optimization
The best choice of solvent to extract the largest number of the subset of pens 1-22 was
found to be methanol. Pens 7, 8, and 9 were omitted from this study, since the inks were either
felt-tipped pens or erasable ink pens. Methanol exhibited visible extraction of 9 of the subset of
19 (six ballpoint, seven gel, and six rollerball) inks. Absolute ethanol, benzyl alcohol,
acetonitrile, deionized water, and mixed solvent systems only exhibited visible extraction of less
than seven inks, leaving methanol as the best choice solvent for all three ink classes used in the
research. Fisher Optima LC-MS grade cut methanol was used exclusively after two other grades
of methanol exhibited increased sodium adduct formation in the positive mode at 120 V. Sodium
adduct formation was not observed with LC-MS grade Optima methanol. The extraction solvent
and mobile phase in all ESI-MS methods described in this research are 100% LC-MS grade
Optima methanol. The use of methanol as the mobile phase and extraction solvent impedes the
formation of polymers once a sample is extracted.
Direct Infusion ESI-MS Optimization
Method 1 (+120V)
The additive used with Method 1, 4.1% TraceMetal grade glacial acetic acid in filtered
methanol, was introduced at a flow rate of 300 uL/min. The standard used to tune this mode was
Basic Violet 3, which exhibits a large m/z 372 and a much smaller m/z 358 peak in its mass
spectrum. Basic Violet 3 does not require an additive for ionization and detection in the mass
spectrometer. Some potential ink ingredients include molecules that need an additive to assist in

45
ionization, such as Disperse Orange 25. These molecules typically exhibit an [M+H]+ ion using
Method 1, protonation due to the proton being liberated from acetic acid. See Table 7 for some
ions observed with Method 1 for analysis. Figure 23 shows calibration data using Method 1 as
the analytical mode for Basic Violet 3. The standard solutions of BV3 verified for concentrations
via an inline Agilent UV-Vis detector and Ocean Optics USB UV-Vis system. The BV3 standard
solutions were then used with direct infusion ESI Method 1 for comparison with another method
based on a different scientific principal. An estimate of the amount of dye extracted from a
particular sample is possible. The calibration using BV3 and Method 1 is relative since it
depends on sample size and ink type.
Figure 23: Concentration of Basic Violet 3 standard vs. integrated peak area
46
Method 2 (+0 V)
The additive used in Method 2 was 0.00041% reagent grade sodium acetate (0.45 µM) in
filtered methanol. The optimized sodium acetate concentration allowed adduct formation by
many of the ink vehicles and other additives, such as glycols and alcohols. When the
concentration of sodium acetate used exceeded 0.00041%, a large increase in background noise
was observed. Identification of vehicle ions in samples of gel inks was not successful in the
positive mode (+120V with 4.1% glacial acetic acid) or in negative mode (-120 V with 4.1%
triethanolamine). However, with a very dilute sodium acetate additive concentration,
characteristic mass spectral patterns were observed in both ink samples and vehicle standards
that were consistent with the sodium adducts. Sodium adducts tend to exhibit a characteristic
peak pattern which includes peaks spaced m/z 44 units apart. Figure 24 shows the characteristic
pattern for PEG 400 standard, when a minute concentration of sodium acetate is added as the
post column additive.

47
Figure 24: Polyethylene glycol (PEG 400) mass spectrum gathered using Method 2, illustrating sodium adduct presence the characteristic of spacing 44 m/z units apart [PEG-H+44n]
Method 3 (-120V)
Triethylamine (HPLC grade) was used at 4.1% concentration to ionize the Acid and
solvent dye standards. Method 3 allowed several similar ballpoint inks to be distinguished from
each other based only on Basic Violet and presence or absence of the 352 m/z peak.
Deprotonated ions [M-H]- are typically observed with Method 3 with the use of a negative
applied voltage. See Table 9 for some typically encountered ions with this method.
Volatile Persistence Study
The length of time after deposition that volatiles can be extracted from ink-on-paper
samples and subsequently detected with direct infusion ESI-MS analysis has been studied.
Samples consisted of an ink mark drawn on white paper with a pen from each of the three ink
Rel
ativ
e In
tens
ity
m/z200 400 600 800 1000
0
20
40
60
80
100
*MSD1 SPC, time=1.505:2.577 of Y:\CHRISM~1\080808A7.D API-ES, Pos, Scan, 0
Max: 117814MSD1 SPC, time=1.505:2.577 of 080808A7.D, Pos
-MSD1 SPC, time=3.292:3.650 of 080808A7.D, Pos
437
.2
393
.2
481
.2
349
.2
525
.3
569
.3
305
.1
438
.2
482
.2
613
.3
394
.2
526
.3
350
.2
570
.3
657
.3
459
.2 4
36.4
503
.2
614
.3
480
.4

48
categories. The analysis was performed using exclusively Method 2, as volatile/vehicle
components can be observed as their sodium adducts when sodium acetate is added with zero
applied fragmentor voltage. Each ink was sampled at the time of deposition, one hour, one day,
and one week dry times. Results of direct infusion ESI-MS analysis at the deposition time and
six hours after deposition are shown in Figure 27.
Analysis of Standards
Basic and Disperse Type Dye Analysis
Basic and disperse dye standards listed in Table 3 and 4 were examined by direct infusion
ESI-MS analysis. Stock solutions of listed dyes were created in filtered methanol with
concentrations ranging from 5.0 ppm to 6.5 ppm. These standard solutions were analyzed using
(Method 1). The major ions are given in Table 7.
Acid and Solvent Type Dye Analysis
Standard solutions of commonly used acid and disperse type dyes were made in methanol
and analyzed by direct infusion ESI-MS. Method 3 was used with these types of dyes as they
responded best overall to these experimental conditions. Major ions observed can be seen in
Table 9.
Vehicle Analysis
Additives collectively called the ink’s vehicle were diluted with methanol and analyzed
with direct infusion ESI-MS methods. These vehicle ions gave the greatest instrumental response
with Method 2. Table 8 shows major ions observed from the vehicles and tables 7, 8 and 9 show
some selected direct infusion ESI-MS spectra associated with these ions.

49
Table 7: Ions observed with Method 1 analysis
Standard Solution
Molecular Mass
CAS Number
Ion/fragment m/z Limit of Detection
Triethanolamine 149 102-71-6 [M+H]+ 150 4.55 [M+Na]+ 172
Glycerin 92 56-81-5 [M+Na]+ 115 10 [2M-
2H20+Na]+ 171
Ethylene Glycol 62 107-21-1 [M+Na]+ 85 5.67 2-
Phenoxyethanol 138 122-99-6 [M+Na]+ 161 8.41
Diethyl Phthalate 222 117-81-7 [M+Na]+ 245 3.66 327 [2M+Na] 467
Benzotriazole 119 95-14-7 [M+Na]+ 142 5.41
Table 8: Ions observed with Method 2 analysis
Dye Standard Molecular Mass
CAS Number
Ion/Fragment Ion m/z
LOD
Solvent Orange 3 212 495-54-5 [M+H]+ 213 [M-NH2] 196 [M-(N-Ph)]+ 121 [N=N-Ph]+ 105
Disperse Orange 25 323 31482-56-1 [M+H]+ 324 Basic Violet 1 393 8004-87-3 [M-Cl]+ 358 3.0
[M-Cl-CH3+H]+ 344 [M-Cl-2(CH3)+H]+ 330
Basic Violet 3 372 548-62-9 [M-Cl]+ 372 Basic Red 1 478 989-38-8 [M-Cl]+ 443
[M-Cl-CH3CH2+H]+ 415 Basic Violet 10 478 81-88-9 [M-Cl]+ 443
[M-Cl-CH3+H]+ 465 [M-Cl-CH3CH2+H]+ 415
Solvent Black 3 456 4197-25-5 [M+H]+ 457 [M+Na]+ 479 [M-(N=N-Ph)+2H]+ 353
Basic Blue 7 513 2390-60-5 [M-Cl]+ 478 [M-Cl-CH3CH2+H]+ 450

50
Table 9: Ions observed with Method 3 analysis
Standard Solution Molecular Mass
CAS Number Ion/Fragment Ion m/z LOD
Acid Yellow 23 537 1943-21-0 134 198 219 [M-H]- 533
Acid Yellow 73 376 518-47-8 [M-Na]- 353 [M-2Na+H]- 331 407 285
Acid Blue 92 748 3861-73-2 [M-H]- 694 [M-Na]- 314 [M-2Na+H]- 650 [M-3Na+2H]- 628 [M-3Na+H]2- 314 [M-2Na]2- 324 [M-3Na+H]2- -O 298 SO3- 80
Acid Yellow 3 477 8004-92-0 [M-Na]- 454 [M-SO3-Na]- 374 [M-2(SO3-
Na)+H]- 352
Acid Red 87 692 17372-42-1 [M-2Na+H]- 647 [M-2Na-Br+H]- 567
Acid Yellow 36 374 587-98-4 [M+H]+ 374 2.5 [M-Na]- 352
Acid Blue 9 792 3844-45-9 [M-H]- 769 [M-2Na+H]- 747 [M-2Na]2- 373 [NH-CH2-Ph-
SO3]- 185
[CH2-Ph-SO3] 170 [Ph-SO3]- 157
Acid Red 51 879 568-63-8 [M-2Na+H]- 835 [M-Na]- 857
Solvent Orange 3 212 495-54-5 [M-H]- 211 [(N=N-Ph)-H]- 104
Solvent Black 3 456 4197-25-5 [M-H]- 455

51
Photochemical Experiments
Light Exposure Effects
Pen 1 was used to study the effect of exposure to ultraviolet light on pen-on-paper marks.
Exposure to UV radiation is sometimes called “artificial aging,” or UV accelerated aging of an
ink [22]. Pen 1 contains mainly Basic Violet 3 as its colorant, thus the effects of UV exposure on
a system containing all the ink components could be observed. Exposure periods were twenty-
four hours in length, samples were analyzed after each exposure period and analyzed using
Method 1. Method 1 allowed changes in Basic Violet 3 to be observed and compared across all
photolysis periods, Figure 25.
Figure 25: Change in relative intensities of ions produced during photolysis of pen 1 ink. Total
ion intensity at each exposure time is normalized to 100%.

52
Figure 26 shows the mass spectrum of the dye from pen 1, when extracted at t=0, i.e.,
before light exposure. The spectrum contains primarily BV3 (m/z 372). Figure 27 shows the
mass spectrum of the dye from pen 1 after five days of photolysis. The spectrum in figure 27
contains a series of peaks corresponding to the sequential loss of methyl groups from the BV3
molecules.
Figure 26: Mass spectrum showing time zero (no UV exposure) Pen 1. Photolysis sequence is BV3 (372 m/z) CV (358 m/z) MV (344 m/z) as methyl groups (15 m/z) are removed and
replaced by hydrogen
Figure 27: Mass spectrum showing Pen 1 after 5 days (120 Hours of UV exposure)

53
Potassium Ferrioxalate Actinometry
An actinometer solution was also exposed in the same photoreactor as the Pen 1 samples.
After exposure, the potassium ferrioxalate solution was complexed with 1,10-phenanthroline and
the UV absorbance of the complex could be determined. The UV absorbance data collected
allowed the photon flux to be calculated, see Figure 28. The spectral output of the RPR and other
lamps used in this procedure can be seen in Figures 16. The calculated photon flux of the RPR
photoreactor is 5.7x10¹⁴ photons/sec*cm-2 impinging on the ink samples used in this study.
Figure 28: Actinometer exposure time vs. absorbance at 510nm of 1, 10-phenanthroline complex

54
Method Validation
Triplicate Analysis of Reference Pen Collection
The collection of pens was analyzed in triplicate and compared to previously gathered
direct infusion ESI-MS data (Williams et al., Pens 1-12 and 17-22). Eleven more inks were
added to the reference collection and analyzed in triplicate with all three analytical methods.
Table 7, 8, and 9 shows major ions found from the previous research and the eleven pens added
to the collection.
Figure 29: Fingerprint spectrum of Pen 13, with combined Methods 1, 2, and 3

55
Figure 30: Fingerprint spectrum of Pen 1, with combined Methods 1, 2, and 3
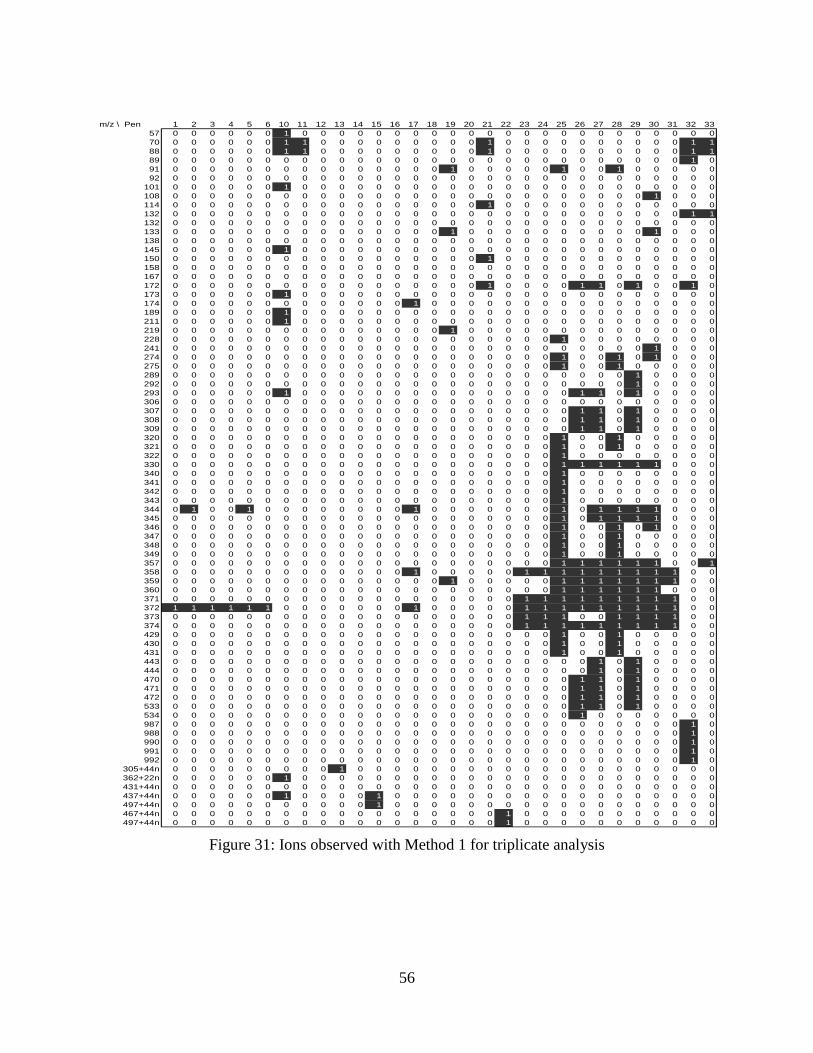
56
m/z \ Pen 1 2 3 4 5 6 10 11 12 13 14 15 16 17 18 19 20 21 22 23 24 25 26 27 28 29 30 31 32 3357 0 0 0 0 0 0 1 0 0 0 0 0 0 0 0 0 0 0 0 0 0 0 0 0 0 0 0 0 0 070 0 0 0 0 0 0 1 1 0 0 0 0 0 0 0 0 0 1 0 0 0 0 0 0 0 0 0 0 1 188 0 0 0 0 0 0 1 1 0 0 0 0 0 0 0 0 0 1 0 0 0 0 0 0 0 0 0 0 1 189 0 0 0 0 0 0 0 0 0 0 0 0 0 0 0 0 0 0 0 0 0 0 0 0 0 0 0 0 1 091 0 0 0 0 0 0 0 0 0 0 0 0 0 0 0 1 0 0 0 0 0 1 0 0 1 0 0 0 0 092 0 0 0 0 0 0 0 0 0 0 0 0 0 0 0 0 0 0 0 0 0 0 0 0 0 0 0 0 0 0
101 0 0 0 0 0 0 1 0 0 0 0 0 0 0 0 0 0 0 0 0 0 0 0 0 0 0 0 0 0 0108 0 0 0 0 0 0 0 0 0 0 0 0 0 0 0 0 0 0 0 0 0 0 0 0 0 0 1 0 0 0114 0 0 0 0 0 0 0 0 0 0 0 0 0 0 0 0 0 1 0 0 0 0 0 0 0 0 0 0 0 0132 0 0 0 0 0 0 0 0 0 0 0 0 0 0 0 0 0 0 0 0 0 0 0 0 0 0 0 0 1 1132 0 0 0 0 0 0 0 0 0 0 0 0 0 0 0 0 0 0 0 0 0 0 0 0 0 0 0 0 0 0133 0 0 0 0 0 0 0 0 0 0 0 0 0 0 0 1 0 0 0 0 0 0 0 0 0 0 1 0 0 0138 0 0 0 0 0 0 0 0 0 0 0 0 0 0 0 0 0 0 0 0 0 0 0 0 0 0 0 0 0 0145 0 0 0 0 0 0 1 0 0 0 0 0 0 0 0 0 0 0 0 0 0 0 0 0 0 0 0 0 0 0150 0 0 0 0 0 0 0 0 0 0 0 0 0 0 0 0 0 1 0 0 0 0 0 0 0 0 0 0 0 0158 0 0 0 0 0 0 0 0 0 0 0 0 0 0 0 0 0 0 0 0 0 0 0 0 0 0 0 0 0 0167 0 0 0 0 0 0 0 0 0 0 0 0 0 0 0 0 0 0 0 0 0 0 0 0 0 0 0 0 0 0172 0 0 0 0 0 0 0 0 0 0 0 0 0 0 0 0 0 1 0 0 0 0 1 1 0 1 0 0 1 0173 0 0 0 0 0 0 1 0 0 0 0 0 0 0 0 0 0 0 0 0 0 0 0 0 0 0 0 0 0 0174 0 0 0 0 0 0 0 0 0 0 0 0 0 1 0 0 0 0 0 0 0 0 0 0 0 0 0 0 0 0189 0 0 0 0 0 0 1 0 0 0 0 0 0 0 0 0 0 0 0 0 0 0 0 0 0 0 0 0 0 0211 0 0 0 0 0 0 1 0 0 0 0 0 0 0 0 0 0 0 0 0 0 0 0 0 0 0 0 0 0 0219 0 0 0 0 0 0 0 0 0 0 0 0 0 0 0 1 0 0 0 0 0 0 0 0 0 0 0 0 0 0228 0 0 0 0 0 0 0 0 0 0 0 0 0 0 0 0 0 0 0 0 0 1 0 0 0 0 0 0 0 0241 0 0 0 0 0 0 0 0 0 0 0 0 0 0 0 0 0 0 0 0 0 0 0 0 0 0 1 0 0 0274 0 0 0 0 0 0 0 0 0 0 0 0 0 0 0 0 0 0 0 0 0 1 0 0 1 0 1 0 0 0275 0 0 0 0 0 0 0 0 0 0 0 0 0 0 0 0 0 0 0 0 0 1 0 0 1 0 0 0 0 0289 0 0 0 0 0 0 0 0 0 0 0 0 0 0 0 0 0 0 0 0 0 0 0 0 0 1 0 0 0 0292 0 0 0 0 0 0 0 0 0 0 0 0 0 0 0 0 0 0 0 0 0 0 0 0 0 1 0 0 0 0293 0 0 0 0 0 0 1 0 0 0 0 0 0 0 0 0 0 0 0 0 0 0 1 1 0 1 0 0 0 0306 0 0 0 0 0 0 0 0 0 0 0 0 0 0 0 0 0 0 0 0 0 0 0 0 0 0 0 0 0 0307 0 0 0 0 0 0 0 0 0 0 0 0 0 0 0 0 0 0 0 0 0 0 1 1 0 1 0 0 0 0308 0 0 0 0 0 0 0 0 0 0 0 0 0 0 0 0 0 0 0 0 0 0 1 1 0 1 0 0 0 0309 0 0 0 0 0 0 0 0 0 0 0 0 0 0 0 0 0 0 0 0 0 0 1 1 0 1 0 0 0 0320 0 0 0 0 0 0 0 0 0 0 0 0 0 0 0 0 0 0 0 0 0 1 0 0 1 0 0 0 0 0321 0 0 0 0 0 0 0 0 0 0 0 0 0 0 0 0 0 0 0 0 0 1 0 0 1 0 0 0 0 0322 0 0 0 0 0 0 0 0 0 0 0 0 0 0 0 0 0 0 0 0 0 1 0 0 0 0 0 0 0 0330 0 0 0 0 0 0 0 0 0 0 0 0 0 0 0 0 0 0 0 0 0 1 1 1 1 1 1 0 0 0340 0 0 0 0 0 0 0 0 0 0 0 0 0 0 0 0 0 0 0 0 0 1 0 0 0 0 0 0 0 0341 0 0 0 0 0 0 0 0 0 0 0 0 0 0 0 0 0 0 0 0 0 1 0 0 0 0 0 0 0 0342 0 0 0 0 0 0 0 0 0 0 0 0 0 0 0 0 0 0 0 0 0 1 0 0 0 0 0 0 0 0343 0 0 0 0 0 0 0 0 0 0 0 0 0 0 0 0 0 0 0 0 0 1 0 0 0 0 0 0 0 0344 0 1 0 0 1 0 0 0 0 0 0 0 0 1 0 0 0 0 0 0 0 1 0 1 1 1 1 0 0 0345 0 0 0 0 0 0 0 0 0 0 0 0 0 0 0 0 0 0 0 0 0 1 0 1 1 1 1 0 0 0346 0 0 0 0 0 0 0 0 0 0 0 0 0 0 0 0 0 0 0 0 0 1 0 0 1 0 1 0 0 0347 0 0 0 0 0 0 0 0 0 0 0 0 0 0 0 0 0 0 0 0 0 1 0 0 1 0 0 0 0 0348 0 0 0 0 0 0 0 0 0 0 0 0 0 0 0 0 0 0 0 0 0 1 0 0 1 0 0 0 0 0349 0 0 0 0 0 0 0 0 0 0 0 0 0 0 0 0 0 0 0 0 0 1 0 0 1 0 0 0 0 0357 0 0 0 0 0 0 0 0 0 0 0 0 0 0 0 0 0 0 0 0 0 1 1 1 1 1 1 0 0 1358 0 0 0 0 0 0 0 0 0 0 0 0 0 1 0 0 0 0 0 1 1 1 1 1 1 1 1 1 0 0359 0 0 0 0 0 0 0 0 0 0 0 0 0 0 0 1 0 0 0 0 0 1 1 1 1 1 1 1 0 0360 0 0 0 0 0 0 0 0 0 0 0 0 0 0 0 0 0 0 0 0 0 1 1 1 1 1 1 0 0 0371 0 0 0 0 0 0 0 0 0 0 0 0 0 0 0 0 0 0 0 1 1 1 1 1 1 1 1 1 0 0372 1 1 1 1 1 1 0 0 0 0 0 0 0 1 0 0 0 0 0 1 1 1 1 1 1 1 1 1 0 0373 0 0 0 0 0 0 0 0 0 0 0 0 0 0 0 0 0 0 0 1 1 1 0 0 1 1 1 1 0 0374 0 0 0 0 0 0 0 0 0 0 0 0 0 0 0 0 0 0 0 1 1 1 1 1 1 1 1 1 0 0429 0 0 0 0 0 0 0 0 0 0 0 0 0 0 0 0 0 0 0 0 0 1 0 0 1 0 0 0 0 0430 0 0 0 0 0 0 0 0 0 0 0 0 0 0 0 0 0 0 0 0 0 1 0 0 1 0 0 0 0 0431 0 0 0 0 0 0 0 0 0 0 0 0 0 0 0 0 0 0 0 0 0 1 0 0 1 0 0 0 0 0443 0 0 0 0 0 0 0 0 0 0 0 0 0 0 0 0 0 0 0 0 0 0 0 1 0 1 0 0 0 0444 0 0 0 0 0 0 0 0 0 0 0 0 0 0 0 0 0 0 0 0 0 0 0 1 0 1 0 0 0 0470 0 0 0 0 0 0 0 0 0 0 0 0 0 0 0 0 0 0 0 0 0 0 1 1 0 1 0 0 0 0471 0 0 0 0 0 0 0 0 0 0 0 0 0 0 0 0 0 0 0 0 0 0 1 1 0 1 0 0 0 0472 0 0 0 0 0 0 0 0 0 0 0 0 0 0 0 0 0 0 0 0 0 0 1 1 0 1 0 0 0 0533 0 0 0 0 0 0 0 0 0 0 0 0 0 0 0 0 0 0 0 0 0 0 1 1 0 1 0 0 0 0534 0 0 0 0 0 0 0 0 0 0 0 0 0 0 0 0 0 0 0 0 0 0 1 0 0 0 0 0 0 0987 0 0 0 0 0 0 0 0 0 0 0 0 0 0 0 0 0 0 0 0 0 0 0 0 0 0 0 0 1 0988 0 0 0 0 0 0 0 0 0 0 0 0 0 0 0 0 0 0 0 0 0 0 0 0 0 0 0 0 1 0990 0 0 0 0 0 0 0 0 0 0 0 0 0 0 0 0 0 0 0 0 0 0 0 0 0 0 0 0 1 0991 0 0 0 0 0 0 0 0 0 0 0 0 0 0 0 0 0 0 0 0 0 0 0 0 0 0 0 0 1 0992 0 0 0 0 0 0 0 0 0 0 0 0 0 0 0 0 0 0 0 0 0 0 0 0 0 0 0 0 1 0
305+44n 0 0 0 0 0 0 0 0 0 1 0 0 0 0 0 0 0 0 0 0 0 0 0 0 0 0 0 0 0 0362+22n 0 0 0 0 0 0 1 0 0 0 0 0 0 0 0 0 0 0 0 0 0 0 0 0 0 0 0 0 0 0431+44n 0 0 0 0 0 0 0 0 0 0 0 0 0 0 0 0 0 0 0 0 0 0 0 0 0 0 0 0 0 0437+44n 0 0 0 0 0 0 1 0 0 0 0 1 0 0 0 0 0 0 0 0 0 0 0 0 0 0 0 0 0 0497+44n 0 0 0 0 0 0 0 0 0 0 0 1 0 0 0 0 0 0 0 0 0 0 0 0 0 0 0 0 0 0467+44n 0 0 0 0 0 0 0 0 0 0 0 0 0 0 0 0 0 0 1 0 0 0 0 0 0 0 0 0 0 0497+44n 0 0 0 0 0 0 0 0 0 0 0 0 0 0 0 0 0 0 1 0 0 0 0 0 0 0 0 0 0 0
Figure 31: Ions observed with Method 1 for triplicate analysis

57
m/z \ Pen 1 2 3 4 5 6 10 11 12 13 14 15 16 17 18 19 20 21 22 23 24 25 26 27 28 29 30 31 32 3379 0 1 0 0 0 0 0 0 0 0 0 0 0 0 0 0 0 0 0 0 0 0 0 0 0 0 0 0 0 081 0 0 0 0 0 0 0 0 0 0 0 0 0 0 0 0 0 0 0 0 0 0 0 0 0 0 0 0 0 083 0 0 0 0 0 1 0 0 0 0 0 0 0 0 0 0 0 0 0 0 0 0 0 0 0 0 0 0 0 088 0 0 0 0 0 0 0 0 0 1 0 0 0 0 0 0 1 0 0 0 0 0 0 0 0 0 0 0 0 090 0 0 0 0 0 0 1 1 1 0 1 1 0 0 1 0 1 0 1 0 0 0 0 0 0 0 0 0 0 095 0 0 0 0 0 0 0 0 0 0 0 0 0 0 0 0 0 0 0 0 0 0 0 0 0 0 0 0 0 0
104 0 0 0 0 0 0 0 0 1 0 0 0 0 0 0 0 0 1 0 0 0 0 0 0 0 0 0 0 0 0105 0 0 0 0 0 0 0 0 1 0 1 0 0 0 0 0 0 0 0 0 0 0 0 0 0 0 0 0 0 0107 0 0 0 0 0 0 0 0 1 0 0 0 0 0 0 0 0 0 0 0 0 0 0 0 0 0 0 0 0 0108 0 0 0 0 0 0 0 0 0 0 0 0 0 0 0 0 0 0 0 0 0 0 0 0 0 0 0 0 0 1118 0 0 0 0 0 0 1 1 1 0 1 1 0 0 1 0 1 0 1 0 0 0 0 0 0 0 0 0 0 0120 0 0 0 0 0 0 0 0 0 0 0 0 0 0 0 0 0 0 0 0 0 0 0 0 0 0 0 0 0 0122 0 0 0 0 0 0 0 0 0 0 0 0 0 0 0 0 0 1 0 1 1 0 0 0 0 0 0 0 0 0127 0 0 0 0 0 1 0 0 0 0 0 0 0 0 0 0 0 0 0 0 0 0 0 0 0 0 0 0 0 0129 0 0 0 0 0 0 0 0 0 0 0 0 0 0 0 0 0 0 0 0 0 0 0 0 0 0 0 0 1 1130 0 0 0 0 0 0 0 0 0 0 0 0 0 0 0 0 0 0 0 0 0 0 0 0 0 0 0 0 1 1131 0 0 0 0 0 0 0 0 0 0 0 0 0 0 0 0 0 0 0 0 0 0 0 0 0 0 0 0 0 0132 0 0 0 0 0 0 0 0 0 0 0 0 0 0 0 0 0 1 0 0 0 0 0 0 0 0 0 0 0 0161 0 0 0 0 0 0 0 0 0 0 0 0 0 0 0 0 0 0 0 0 0 0 0 0 0 0 1 0 0 0169 0 0 0 0 0 0 0 0 0 0 0 1 0 0 0 0 0 0 0 0 0 0 0 0 0 0 0 0 0 0172 0 0 0 0 0 0 0 0 0 0 0 0 0 0 0 0 0 0 0 0 0 0 0 1 0 0 0 0 1 1179 0 0 0 0 0 0 0 0 0 0 0 1 0 0 0 0 0 0 0 0 0 0 1 0 0 1 0 0 0 0184 0 0 0 0 0 0 0 0 0 0 0 0 0 1 0 0 0 0 0 0 0 0 0 0 0 0 0 0 0 0190 0 0 0 0 0 0 0 0 0 0 0 0 0 0 0 0 0 0 0 0 0 0 0 0 0 0 0 0 0 1191 0 0 0 0 0 0 0 0 0 0 0 0 0 0 0 0 0 0 0 0 0 0 0 0 0 0 0 0 0 1192 0 0 0 0 0 0 0 0 0 0 0 0 0 0 0 0 0 0 0 0 0 0 0 0 0 0 0 0 0 1193 0 0 0 0 0 0 0 0 0 0 0 0 0 0 0 0 0 0 0 0 0 0 0 0 0 0 0 0 0 1205 0 0 0 0 0 0 0 0 0 0 0 0 0 0 0 0 0 0 0 0 0 0 0 0 0 0 0 1 0 0216 0 0 0 0 0 0 0 0 0 0 0 0 0 0 0 0 0 0 0 0 0 0 0 0 0 1 0 0 0 0230 0 0 0 0 0 0 0 0 0 0 0 0 0 0 0 0 0 0 0 0 0 0 0 0 0 0 0 0 0 0230 0 0 0 0 0 0 0 0 0 0 0 0 0 0 0 0 0 0 0 0 0 1 0 0 1 0 0 0 0 0231 0 0 0 0 0 0 0 0 0 0 0 0 0 0 0 0 0 0 0 0 0 1 0 0 0 0 0 0 0 0237 0 0 0 0 0 0 0 0 0 0 1 0 0 0 0 0 0 0 0 0 0 0 0 0 0 0 0 0 0 0240 0 0 0 0 0 0 0 0 0 0 0 0 0 0 0 0 0 0 0 0 0 0 0 0 0 0 1 0 0 0241 0 0 0 0 0 0 0 0 0 0 0 0 0 0 0 0 0 0 0 0 0 0 0 0 0 0 1 0 0 0245 0 0 0 0 0 0 0 0 0 0 0 0 0 0 0 0 0 0 0 0 0 0 0 0 0 0 0 0 0 1246 0 0 0 0 0 0 0 0 0 0 0 0 0 0 0 0 0 0 0 0 0 0 0 0 0 0 0 0 0 1248 0 0 0 0 0 0 0 0 0 0 0 0 0 1 0 0 0 0 0 0 0 0 0 0 0 0 0 0 0 0274 0 0 0 0 0 0 0 0 0 0 0 0 0 0 0 0 0 0 0 0 0 0 0 0 1 0 0 0 0 0275 0 0 0 0 0 0 0 0 0 0 0 0 0 0 0 0 0 0 0 0 0 1 0 0 0 0 0 0 0 0280 0 0 0 0 0 0 0 0 0 0 0 0 0 0 0 0 0 0 0 0 0 0 0 0 0 0 0 0 0 1289 0 0 0 0 0 0 0 0 0 0 0 0 0 0 0 0 0 0 0 0 0 0 0 1 0 1 0 0 0 0290 0 0 0 0 0 0 0 0 0 0 0 0 0 0 0 0 0 0 0 0 0 0 0 1 0 0 0 0 0 0291 0 0 0 0 0 0 0 0 0 0 0 0 0 0 0 0 0 0 0 0 0 1 0 0 0 0 0 0 0 0296 0 0 0 0 0 0 0 0 0 0 0 0 0 0 0 0 0 0 0 0 0 0 0 0 1 0 0 0 0 0307 0 0 0 0 0 0 0 0 0 0 0 0 0 0 0 0 0 0 0 0 0 0 1 1 0 1 0 0 0 0308 0 0 0 0 0 0 0 0 0 0 0 0 0 0 0 0 0 0 0 0 0 0 1 1 0 1 0 0 0 0309 0 0 0 0 0 0 0 0 0 0 0 0 0 0 0 0 0 0 0 0 0 0 1 1 0 0 0 0 0 0310 0 0 0 0 0 0 0 0 0 0 0 0 0 0 0 0 0 0 0 0 0 0 1 1 0 0 0 0 0 0320 0 0 0 0 0 0 0 0 0 0 0 0 0 0 0 0 0 0 0 0 0 0 0 0 1 0 0 0 0 0321 0 1 0 0 0 0 0 0 0 0 0 0 0 0 0 0 0 0 0 0 0 0 0 0 1 0 0 0 0 0330 0 0 0 0 0 0 0 0 0 0 0 0 0 0 0 0 0 0 0 0 0 1 0 0 1 1 0 0 0 0332 0 0 0 0 0 0 0 0 0 0 0 0 0 1 0 0 0 0 0 0 0 0 0 0 0 0 1 0 0 0340 0 0 0 0 0 0 0 0 0 0 0 0 0 0 0 0 0 0 0 0 0 0 0 0 0 0 0 0 0 0341 0 0 0 0 0 0 0 0 0 0 0 0 0 0 0 0 0 0 0 0 0 1 0 0 0 0 0 0 0 0342 0 0 0 0 0 0 0 0 0 0 0 0 0 0 0 0 0 0 0 0 0 1 0 0 0 0 0 0 0 0343 0 0 0 0 0 0 0 0 0 0 0 1 0 0 0 0 0 0 0 0 0 1 0 0 0 0 0 0 0 0344 0 0 0 0 0 0 0 0 0 0 0 0 0 0 0 0 0 0 0 0 0 1 0 0 1 1 1 0 0 0345 0 0 0 0 0 0 0 0 0 0 0 0 0 0 0 0 0 0 0 0 0 1 1 1 1 1 1 0 0 0346 0 0 0 0 0 0 0 0 0 0 0 0 0 0 0 0 0 0 0 0 0 1 1 1 0 0 0 0 0 0347 0 0 0 0 0 0 0 0 0 0 0 0 0 0 0 0 0 0 0 0 0 1 0 0 0 0 0 0 0 0348 0 0 0 0 0 0 0 0 0 0 0 0 0 0 0 0 0 0 0 0 0 1 0 0 1 0 0 0 0 0349 0 0 0 0 0 0 0 0 0 0 0 0 0 0 0 0 0 0 0 0 0 1 0 0 1 0 0 0 0 0352 1 0 1 1 0 1 0 0 0 1 0 0 0 0 0 1 1 0 0 0 0 0 0 0 0 0 0 0 0 0356 0 0 0 0 0 0 0 0 0 0 0 0 0 0 0 0 0 0 0 0 0 0 0 0 0 0 0 0 0 1357 0 0 0 0 0 0 0 0 0 0 0 0 0 0 0 0 0 0 0 0 0 0 0 0 1 1 0 0 0 1358 0 0 0 0 0 0 0 0 0 0 0 0 0 0 0 0 0 0 0 1 1 1 0 1 1 1 1 1 0 0359 0 0 0 0 0 0 0 0 0 0 0 0 0 0 0 0 0 0 0 0 0 1 1 1 1 1 1 1 0 0360 0 0 0 0 0 0 0 0 0 0 0 0 0 0 0 0 0 0 0 0 0 1 1 0 0 0 1 0 0 0365 0 0 0 0 0 0 0 0 0 0 0 0 0 0 0 0 0 0 0 0 0 0 0 0 0 0 0 0 0 0372 0 0 0 0 0 0 0 0 0 0 0 0 0 0 0 0 0 0 0 1 1 1 1 1 1 1 1 1 0 0373 0 0 0 0 0 0 0 0 0 0 0 0 0 0 0 0 0 0 0 1 1 1 1 1 1 1 1 1 0 0374 1 0 1 1 0 1 0 0 0 1 0 0 0 0 0 0 1 0 0 1 1 1 1 1 1 1 1 1 0 0377 0 0 0 1 0 0 0 0 0 0 0 0 0 0 0 0 0 0 0 0 0 0 0 0 0 0 0 0 0 0417 0 0 0 0 0 0 0 0 0 0 0 0 0 1 0 0 0 0 0 0 0 0 0 0 0 0 0 0 0 0427 0 0 0 0 0 0 0 0 0 0 0 0 0 0 0 0 0 0 0 0 0 0 0 0 0 0 0 0 0 0428 1 0 0 0 0 0 0 0 0 0 0 0 0 0 0 0 0 0 0 0 0 0 0 0 0 0 0 0 0 0429 0 0 0 0 0 0 0 0 0 0 0 0 0 0 0 0 0 0 0 0 0 0 0 0 1 0 0 0 0 0
Figure 32: Ions observed with Method 2 for triplicate analysis

58
Figure 32: Ions observed with Method 2 for triplicate analysis (continued)
m/z \ Pen 1 2 3 4 5 6 10 11 12 13 14 15 16 17 18 19 20 21 22 23 24 25 26 27 28 29 30 31 32 33
85 0 0 0 0 0 0 0 0 0 1 0 0 0 0 1 0 0 1 0 0 0 0 0 0 0 0 0 0 0 090 0 0 0 0 0 0 0 0 0 0 0 0 0 0 1 0 0 0 0 0 0 0 0 0 0 0 0 0 0 099 0 0 0 0 0 0 0 0 0 0 0 0 0 0 0 0 0 0 1 0 0 0 0 0 0 0 0 0 0 0
108 0 0 0 0 0 0 0 0 0 0 0 0 0 0 0 1 0 0 1 0 0 0 0 0 0 0 0 0 0 0115 0 0 0 0 0 0 0 0 1 1 1 0 0 0 0 1 1 0 1 0 0 0 0 0 0 0 0 0 0 0117 0 0 0 0 0 0 0 0 0 0 0 0 0 0 1 0 0 0 0 0 1 0 0 0 0 0 0 0 0 0120 0 0 0 0 0 0 1 0 0 0 0 0 0 0 0 0 0 0 0 0 0 0 0 0 0 0 0 0 0 0122 1 0 0 0 0 0 0 0 0 0 0 0 0 0 0 0 0 0 0 0 0 0 0 0 0 0 0 0 0 0127 0 0 0 0 0 0 0 0 0 0 0 0 0 0 0 0 0 1 0 0 0 0 0 0 0 0 0 0 0 0129 0 0 0 0 0 0 0 0 1 1 0 1 0 0 0 0 0 0 1 0 0 0 0 0 0 0 0 0 0 0133 0 0 0 0 0 0 0 0 0 0 0 0 0 0 0 1 0 0 0 0 0 0 0 0 0 0 0 0 0 0140 0 0 0 0 0 0 0 0 0 0 0 0 0 0 0 1 1 0 0 0 0 0 0 0 0 0 0 0 0 0142 0 0 0 0 0 0 1 0 0 0 0 0 0 0 0 0 0 0 0 0 0 0 0 0 0 0 0 0 0 0145 0 0 0 0 0 0 0 0 0 0 0 0 0 0 0 1 0 0 0 0 0 0 0 0 0 0 0 0 0 0150 0 0 0 0 0 0 0 1 0 0 0 0 0 0 0 0 0 1 0 0 0 0 0 0 0 0 0 0 0 0154 1 0 0 0 0 0 0 0 0 0 0 0 0 0 0 0 0 0 0 0 0 0 0 0 0 0 0 0 0 0156 0 0 0 0 0 0 0 0 0 0 0 0 0 0 0 0 0 1 1 0 0 0 0 0 0 0 0 0 0 0157 0 0 0 0 0 0 0 0 0 0 0 0 0 0 0 0 0 0 0 0 0 0 0 0 0 0 0 0 0 0161 0 1 0 0 0 0 0 0 0 0 0 0 0 0 0 1 0 0 0 0 0 0 0 0 0 0 0 0 0 0162 0 0 0 0 0 0 0 0 0 0 0 0 0 0 0 0 0 0 0 0 0 1 1 1 1 0 1 0 0 1163 0 0 0 0 0 0 0 0 0 0 0 0 0 0 0 0 0 0 0 0 0 1 1 1 1 0 1 0 0 1164 0 0 0 0 0 0 0 0 0 0 0 0 0 0 0 0 0 0 0 0 0 1 0 1 0 0 1 0 0 0165 0 0 0 0 0 0 0 0 0 0 0 0 0 0 0 0 0 0 0 0 0 1 0 1 0 0 1 0 0 0172 0 0 0 0 0 0 1 1 1 1 1 1 0 0 0 0 0 1 0 0 0 0 0 0 0 0 0 0 0 0173 0 0 0 0 0 0 1 0 0 0 0 0 0 0 0 0 0 0 0 0 0 0 0 0 0 0 0 0 0 0174 0 0 0 0 0 0 1 0 0 0 0 0 0 0 0 0 0 0 0 0 0 0 0 0 0 0 0 0 0 0193 0 0 0 0 0 0 0 0 0 0 0 0 0 0 0 1 0 0 0 0 0 0 0 0 0 0 0 0 0 0196 0 0 0 0 0 0 0 0 0 0 0 0 0 0 0 1 0 0 0 0 0 0 0 0 0 0 0 0 0 0205 1 0 0 0 0 0 0 0 0 0 0 0 0 0 0 0 0 0 0 0 0 0 0 0 0 0 0 0 0 0213 0 1 0 0 0 0 0 0 0 0 0 0 0 0 0 0 0 0 0 0 0 0 0 0 0 0 0 0 0 0216 0 0 0 0 0 0 0 0 0 0 0 0 0 0 0 0 0 1 0 0 0 0 0 0 0 0 0 0 0 0219 0 0 0 0 0 0 0 0 0 0 0 0 0 0 0 0 0 0 1 0 0 0 0 0 0 0 0 0 0 0229 0 1 0 0 0 0 0 0 0 0 0 0 0 0 0 0 0 0 0 0 0 0 0 0 0 0 0 0 0 0230 0 0 0 0 0 0 0 0 0 0 0 0 0 0 0 0 0 0 0 0 0 0 0 0 0 0 0 0 0 0245 0 0 0 0 0 0 0 0 0 0 0 1 0 0 0 0 0 0 0 0 1 0 0 0 0 0 0 0 0 0266 0 0 0 0 0 0 0 0 0 0 0 0 0 0 0 0 0 0 0 0 0 0 0 0 0 0 0 0 0 0266 0 0 0 0 0 0 0 0 0 0 0 0 0 0 0 0 0 0 0 0 0 0 0 0 1 0 0 0 0 1274 0 0 0 0 0 0 0 0 0 0 0 0 0 0 0 0 0 0 0 0 0 0 0 0 0 0 0 0 0 0296 0 0 0 0 0 0 0 0 0 0 0 0 0 0 0 0 0 0 0 0 0 0 0 0 0 0 0 0 0 0326 0 0 0 0 0 0 0 0 0 0 0 0 0 0 0 0 0 0 0 0 0 0 0 0 0 0 0 0 0 0330 0 1 0 0 0 0 0 0 0 0 0 0 0 1 0 0 0 0 0 0 0 0 0 0 0 0 0 0 0 0340 0 0 0 0 0 0 0 0 0 0 0 0 0 1 0 0 0 0 0 0 0 0 0 0 0 0 0 0 0 0342 0 0 0 0 0 0 0 0 0 0 0 0 0 1 0 0 0 0 0 0 0 0 0 0 0 0 0 0 0 0344 0 1 1 1 1 0 0 0 0 0 0 0 0 1 0 0 0 0 0 0 0 0 0 0 0 0 0 0 0 0352 0 0 0 0 0 0 0 0 0 0 0 0 0 0 0 0 0 0 0 1 0 0 0 0 0 1 0 1 0 0353 0 0 0 0 0 0 0 0 0 0 0 0 0 0 0 0 0 0 0 1 0 0 0 0 0 1 0 1 0 0354 0 0 0 0 0 0 0 0 0 0 0 0 0 0 0 0 0 0 0 1 0 0 0 0 0 1 0 1 0 0358 1 1 1 1 1 1 0 0 0 0 0 0 0 1 0 0 0 0 0 0 0 0 0 0 0 0 0 0 0 0
Figure 33: Ions observed with Method 3 for triplicate analysis

59
m/z \ Pen 1 2 3 4 5 6 10 11 12 13 14 15 16 17 18 19 20 21 22 23 24 25 26 27 28 29 30 31 32 33359 0 0 0 0 0 0 0 0 0 0 0 0 0 0 0 1 0 0 0 0 0 0 0 0 0 0 0 0 0 0372 1 1 1 1 1 1 0 0 0 0 0 0 0 1 0 0 0 0 0 0 0 0 0 0 0 0 0 0 0 0398 0 0 0 0 0 0 0 0 0 1 0 0 0 0 0 0 0 0 0 0 0 0 0 0 0 0 0 0 0 0415 0 0 0 0 0 0 0 0 0 0 0 0 0 0 0 1 0 0 0 0 0 1 0 0 0 0 0 0 0 0418 0 0 0 0 0 0 0 0 0 1 0 0 0 0 0 0 0 0 0 0 0 0 0 0 0 0 0 0 0 0427 0 0 0 0 0 0 0 0 0 0 0 0 0 0 0 0 0 0 0 0 0 0 0 1 0 0 1 0 0 0429 0 0 0 0 0 0 0 0 0 0 0 0 0 0 0 1 0 0 0 0 0 0 0 0 0 0 0 0 0 0446 0 0 0 0 0 0 0 0 0 0 0 0 0 0 0 1 0 0 0 0 0 0 0 0 0 0 0 0 0 1448 0 0 0 0 0 0 0 0 0 0 0 0 0 0 0 0 0 0 0 0 0 0 0 0 1 0 0 0 0 1468 0 0 0 0 0 0 0 0 0 0 0 0 0 0 0 0 0 0 0 0 0 0 1 0 0 0 0 0 0 1468 0 0 0 0 0 0 0 0 0 0 0 0 0 0 0 0 0 0 0 0 1 0 0 0 0 0 0 0 0 0469 0 0 0 0 0 0 0 0 0 0 0 0 0 0 0 0 0 0 0 0 0 0 1 0 0 0 0 0 0 1470 0 0 0 0 0 0 0 0 0 0 0 0 0 0 0 0 0 0 0 0 0 0 1 0 0 0 0 0 0 1512 0 0 0 0 0 0 0 0 0 0 0 0 0 0 0 0 0 0 0 0 0 0 0 0 0 0 0 0 0 0513 0 0 0 0 0 0 0 0 0 0 0 0 0 0 0 0 0 0 0 0 1 0 0 0 0 0 0 0 0 0514 0 0 0 0 0 0 0 0 0 0 0 0 0 0 0 0 0 0 0 0 1 0 0 0 0 0 0 0 0 0586 0 0 0 0 0 0 0 0 0 0 0 0 0 0 0 0 0 0 0 0 1 0 0 0 0 0 0 0 0 0374 0 0 0 0 0 0 0 0 0 0 0 0 0 0 0 0 0 0 0 1 0 0 0 0 0 1 0 1 0 0
296+22n 0 0 0 0 0 0 0 1 1 1 1 0 0 0 0 0 0 0 0 0 0 0 0 0 0 0 0 0 0 0305+44n 0 0 0 0 0 0 0 0 0 0 0 0 0 0 0 0 0 0 0 0 0 0 0 0 0 0 0 0 0 0326+22n 0 0 0 0 0 0 0 0 0 0 0 1 0 0 0 0 0 0 1 0 0 0 0 0 0 0 0 0 0 0356+22n 0 0 0 0 0 0 0 0 0 0 0 1 0 0 0 0 0 0 0 0 0 0 0 0 0 0 0 0 0 0415+44n 0 0 0 0 0 0 0 0 0 0 1 1 0 0 0 0 0 0 0 0 0 0 0 0 0 0 0 0 0 0431+44n 0 0 0 0 0 0 0 0 0 1 0 0 0 0 0 0 0 0 0 0 0 0 0 0 0 0 0 0 0 0437+44n 0 0 0 0 0 0 0 0 0 0 0 0 0 0 0 0 0 0 0 0 0 0 0 0 0 0 0 0 0 0467+44n 0 0 0 0 0 0 0 0 0 0 0 0 0 0 0 0 0 0 0 0 0 0 0 0 0 0 0 0 0 0541+44n 0 0 0 0 0 0 0 0 0 0 0 1 0 0 0 0 0 0 0 0 0 0 0 0 0 0 0 0 0 0326+22n 0 0 0 0 0 0 0 0 0 0 0 0 0 0 0 0 0 0 1 0 0 0 0 0 0 0 0 0 0 0403+44n 0 0 0 0 0 0 0 0 0 0 0 0 0 0 0 0 0 0 1 0 0 0 0 0 0 0 0 0 0 0467+44n 0 0 0 0 0 0 0 0 0 0 0 1 0 0 0 0 0 0 1 0 0 0 0 0 0 0 0 0 0 0474+22n 0 0 0 0 0 0 0 0 0 0 0 0 0 0 0 0 0 0 0 0 0 0 0 0 0 0 0 0 0 0488+22n 0 0 0 0 0 0 0 0 0 0 0 0 0 0 0 0 0 0 0 0 0 0 0 0 0 0 0 0 0 0497+44n 0 0 0 0 0 0 0 0 0 0 0 0 0 0 0 0 0 0 1 0 0 0 0 0 0 0 0 0 0 0607+44n 0 0 0 0 0 0 0 0 0 0 0 0 0 0 0 0 0 0 1 0 0 0 0 0 0 0 0 0 0 0
Figure 33: Ions observed with Method 3 for triplicate analysis (continued)
Figure 34: Pair-wise comparisons of Method 1 results (1 = not discriminated Method 1)

60
Figure 35: Pair-wise comparisons of Method 2 results
Out of 435 pair-wise comparisons 429 pairs could be discriminated from each other using
the combined three methods, seen in figures 34 and 35. This is a 98.6% discrimination with the
combined analysis scheme. A number 1 in Figures 34 & 35 means the ions observed using the
described methods indicates an area of non-discrimination with the single method. However,
when the observed ion data from the other two methods are combined, the overall discriminating
power of the direct infusion ESI-MS methods are realized. To visualize the ion data gathered
from the three methods, a fingerprint spectrum is generated from the Method 1, 2, and 3 ions
observed the ink sample’s mass spectrum. Examples of two fingerprint spectra can be seen in
Figures 29 and 30, which use the three combined mass spectra of Pen 1 and Pen 13 ink samples.
Multipack Analysis
Multipacks of pens with various colors close to black were analyzed by the direct
infusion ESI-MS methods. Only gel and ballpoint inks were used, as rollerball inks tend to have
more compositional variation and were excluded from this portion of the study. The list of pens

61
used for this portion and colors can be seen in Table 6. Several of these inks’ mass spectra were
compared to similar black inks’ mass spectra from the reference collection Figure 36.
Figure 36: Comparison of Method 1 results for BC 4-Color Black (A), BC 4-Color Blue (B), Pen 3 (C) and a complied comparison spectrum (D)
Intersecting and Overlapping Ink Strokes
Overlapping strokes made with Pens 3 and 5 were examined with the combined three
direct infusion ESI-MS methods. The “altered” document was sampled as detailed in Figure 22.
Samples were collected from portions that were known to have only Pen 3 ink, known to only
have Pen 5 ink, or known to be a portion of overlap of the two inks.

62
Pen 5 Only Sample (Figure 37)
The Pen 5 only sample’s mass spectrum with Method 1 and 2 consists only of 372 m/z
and 358 m/z ions in 100% and 11% relative abundances, respectively. While the other analysis
mode, Method 3, shows 373 m/z and 352 m/z ions in 7% and 100% relative abundance levels.
Pen 3 Only Samples (Figure 38)
The Pen 3 ink sample’s mass spectrum contained also 372 m/z and 358 m/z ions with
76% and 100% relative abundance values, which is in contrast to the 100:11 ratio seen in Pen 5
Method 1 mass spectra.
The Method 1 spectrum also exhibits 174, 340, 342, 344, and 345 m/z ions, which were
not observed in Pen 5. The Method 2 spectrum of Pen 3 contained 274, 296, 330, 340, and 344
m/z peaks. Method 3 analysis of Pen 3 only sample showed a single peak at 713 m/z with 100%
relative intensity.
Overlapped Areas
Sample 1
Overlap area sample 1 exhibits a spectrum similar to Pen 3 only samples. Sample 1’s
collected spectra have the same ions as Pen 3 and in very similar relative abundance values.
Sample 2
Sample 2, however, is more similar to the Pen 5 only spectra. With Method 1, sample 2,
exhibits a relative abundance of 100% for the 372 m/z ion peak, and a significantly smaller 358
m/z ion peak when analyzed with Method 1 conditions. Sample 2 also exhibits a 713 m/z peak
with Method 3, which is seen in the Pen 3 only samples. The Method 3 analysis of sample 2,

63
does not elicit a 352 m/z peak similar to Pen 5. Method 3 does show a 100% relative intensity
peak for 274 m/z ion, similar to Pen 5 only sample’s Method 3 mass spectrum. Method 1 results
for sample 2 also contain 344 m/z and 147 m/z peaks, similar to Pen 3’s Method 1 results.
Figure 37: Results, sampling locations, mass spectra, and observed ions pen 3 only section of altered document

64
Figure 38: Results, sampling locations, mass spectra, and observed ions overlap sections 1 and 2

65
Figure 39: Results, sampling locations, mass spectra, and observed ions of Pen 5

66
CHAPTER FOUR: DISCUSSION
Direct Infusion ESI-MS Analysis
The use of the three combined direct infusion ESI-MS methods allowed differentiation of
99% of the 435 unique pairwise comparisons of the 30 inks examined in this study. The best way
to differentiate between ink samples is to combine the spectra from each method and compare
the combined spectra from different samples. Additionally, each method has been tuned to
provide the best operating parameters for dye and vehicle detection. Each method has a specific
subset of target molecules, which respond in a similar manner to the instrumental conditions
described.
It is clear, based on the results presented in this thesis, that ESI-MS direct infusion
analysis methods and associated extraction procedures used with Method 1, Method 2, and
Method 3 are able to differentiate a majority of fresh ink samples. The effects of light exposure,
solvent drying, temperature, and issues related to ink composition and storage conditions of the
samples in question can influence sample discrimination.
Volatile Persistence Study
Previous research reported the detection of ink volatiles for an extended period of time
after deposition, and the ability to determine this time interval [21]. Using the direct infusion
ESI-MS method, some of the volatiles were not present in detectable amounts in tested samples;
others were only detectable for less than one week. The previous research analyzed for volatiles
like 2-phenoxyethanol, which are found in many commonly used household products such as
lotion. Using the direct infusion ESI-MS methods described in this work, a majority of volatiles
are not detected after drying periods of a week or less. The importance of volatile identification

67
for gel inks is that there are few analytical instrumental methods which can identify pigments.
Pigments in ink bind to the paper fiber surface and are not meant to be removed; however, the
spectra of the colored gel and some black rollerball inks in this study indicate that there are
identifiable mass spectral peaks that allow some differentiation of inks that only differ in
pigment color.
Analysis of Standards
The instrumental response of some Basic dyes in the positive mode was relatively large,
even without a pre-ionization chamber additive. Typically these dyes are in charged states (i.e.
Hexamethylpararosanaline hydrochloride salt or Basic Violet 3 added to solvents like water or
polyethylene glycol). ESI-MS methods are well suited for detecting and differentiating between
molecules that contain a mixture of charge states, as some dyes are known to be used in a more
than one charge state. While laser desorption-mass spectrometry (LD-MS) is one way to detect
pigment molecules, detection of molecules with a charge of more than one, the instruments are
expensive and not readily available and desorption matrix is required.
Dyes that did not respond using only mobile phase for analysis, showed a general trend of
increased instrumental response when a mobile phase additive was used. The disperse and
solvent type dyes typically did not exhibit a response with the intensity of the basic and acid dye
classes. The addition of acetic acid (Method 1) or triethylamine (Method 2) allowed many of the
lower resonding dyes to be observed with direct infusion ESI-MS methods.
Vehicle Analysis
Vehicle components are volatile and are intended to carry the dye or pigment onto the
writing surface and then aid in binding to the document. Binders typically found in inks include

68
povidone (polyvinyl pyrrolidone), sucrose, and glycerol. The compounds used as binders are
used in other applications as starting materials for polymerization reactions. Manufacturers know
the average drying time of these glycol-based inks and how to manipulate the content and
concentrations of these classes of solvents to achieve market favored products. The concentration
of volatiles presented for analysis can fluctuate based on the time since deposition and storage
conditions. The time since deposition could not be determined by using just the ion ratios of the
hexamethylpararosanaline ion and its degradation products in an ink mass spectrum as the m/z
372 series see Figure 26. Determining the time since deposition by this method would require a
knowledge of the document exposure to different light sources.
Photochemical Experiments
Light Exposure Effects
Analysis of Pen 1 with Method 1, which contains almost exclusively Basic Violet 3 as a
colorant, was exposed to UV radiation in a Rayonette RPR 350 photoreactor for up to five days
(120). The ink sample initially (t=0) contained in its mass spectrum after subtraction, m/z 372
and 358 ions with Method 1 instrumental conditions. As UV exposure continues to five days, the
m/z 372 relative intensity dropped to 50%, 344 and 358 increased to approximately 100%. After
one day of exposure in the photoreactor, ink from Pen 1 began to exhibit a 388 peak. The m/z
388 peak was not observed in any of the tin foil covered control samples. Figure 27 shows the
shifting pattern of degradation products formed by UV exposure. Relative intensity values from
ink samples exposed in the UV photoreactor for periods ranging from zero to five days show the
gradual conversion of Basic Violet 3 to leucocrystal violet, which is more yellow in color and
does not contain methyl groups attached to the three amino groups.

69
The method of differentiating and aging black ballpoint ink samples by the ratio of
methylated vs. non-methylated amino groups on Basic Violet 3 proved to be an unreliable
method. Figures 1 and 2 (chapter 1) show the results for ink that was exposed to a common desk
lamp with an eco-friendly GE Helical light bulb. The ink was almost fully photo-bleached within
72 hours of exposure. The ratio of methylated to non-methylated amino groups in randomly
selected “pure” BV 3 sample is variable. Additionally, use of the ratio of BV3 and degradation
products for time since deposition determination does not take in to account the effects of the
vehicle and the paper itself or other compound on the stability of the 372 m/z series.
Grimm, Siegel, and Allison used UV (λ of 254nm) accelerated artificial aging to assess
dye degradation with LD-MS. A BIC black ballpoint pen was used to compare 6.25 hours of UV
exposure with a 38-month controlled, naturally aged ink sample. The LD-MS experiments
indicate the dye degradation of 6.25 hours shows a similar mass spectrum to the 36-month non-
UV sample [6]. The UV artificial exposure experiments showed the degradation of BV3 to BV1.
Aged sample types showed a similar narrowing of BV3, z/m 372 peak and an almost 50%
increase in relative intensity of the 358 m/z peak corresponding to MV. In addition, both aged
samples exhibited a 25-35% relative intensity 344 m/z peak and a roughly 3-9% relative intensity
peak at 330 m/z from the replacement of three methyl groups by hydrogen seen with LC-MS
methods. The control sample only showed the typical BV3 mass spectrum.
This degradation pattern seen by Grim, was also observed in ballpoint pens after only 24
hours of UV exposure, in this study. However the samples examined with no UV exposure did
not exhibit a change in dye composition. The unexposed samples were on the same sheet of
paper as the UV exposed samples, except they were covered tightly with aluminum foil. The
degradation was caused by the UV exposure, not the heat generated by the photoreactor. The

70
unexposed Pen 1 samples exhibited no change in mass spectrum with sample treatment from 24
to 96 hours. This is observation agrees with Grim’s claim that a ink samples stored in darkness
exhibit a considerably less degradation of dyes and a different mass spectrum than those exposed
to a light source. Unknown variables, including, variable storage conditions and ink-solvent, ink-
paper, ink-ink interactions make an age determination from the mass spectral data, next to
impossible. In this study, the exposure times were controlled and mass spectra were compared
after each exposure period. With casework samples, the analyst has little expectation of knowing
the time of light exposure, time of storage in darkness, or the photon flux of any incident light
that has interacted or not interacted with a sample, especially if the documents are more than a
few months old or older. This study demonstrates that a ballpoint ink on paper sample could be
exposed to UV light in order to create writings that appear aged longer than the actual time since
deposition of the ink on the paper.
The RPR photoreactor used in this study generates a narrow emission centered on 350 nm
(figure 16). This photon flux is enough to photo-fade the samples rapidly. However the action of
the desk lamp, which has a lower photon flux and broader spectral output, approximates the
photo-fading action of sun light. The sun is spectral output reaching the surface depends on the
location of the observer, season, cloud cover, and effects of atmospheric scattering and
refracting. The desk lamp produced the yellowish color of leucocrystal violet in exposed samples
within 72 hours.
Triplicate Analysis of Reference Pen Collection
Direct infusion ESI-MS analysis of inks used by Williams et al. (a subset of all inks used
in this research) were in complete agreement with the mass spectral data for Pens 1-6, and 10-16

71
obtained in this work [2]. The triplicate analysis allows statistical treatment of collected data for
comparisons.
Other Pen Analysis
As seen in Figures 36, 37 and 38, when samples contain areas where two different pens
(i.e. Pen 3 and Pen 5) were used, it is possible to differentiate between the two pens based on the
direct infusion ESI-MS methodology.
Gas chromatographic methods are not compatible with non-volatile ink components,
however, liquid chromatography based methods allows the identification of dyes, salts, solvents,
and some adduct molecules. A mass spectral fingerprint can be obtained using the three direct
infusion ESI-MS methods described in the previous chapter.
Ideally, the forensic scientist would like to be able to identify a sample ink by comparing
an extract mass spectral fingerprint to determine origin of the sample. Data collected using each
method should be considered separate but linked information, as all three methods add data that
can help to differentiate similar inks. Comparison of extracts from different samples is one goal
of the quest for a standardized ink analysis method. This would allow the forensic scientist to
assess the possibility that the two inks share a common origin. This determination can be
affected by degradation and time since deposition.
In order to study the effect of time since deposition, a sample ink line was made on plain
white copy paper and sampled at time intervals of zero minutes, thirty minutes, one hour, twenty-
four hours, and one week after deposition. The three ink samples chosen to study the volatile
component retention behavior of ink-on-paper samples included members from the three
common ink classes. All inks contain some type of solvent to allow the colorant to be transferred

72
from the ink reservoir to the paper. Some solvents used in inks include PEG, benzyl alcohol, and
ethanol. Past research indicated that GC-MS methods were capable of detecting ink volatiles
after a period of months using extraction differences in strong and weak solvents. However, in
the volatile persistence study reported here, a majority, of identified ink components were
observed for less than a week when analyzed with direct infusion ESI-MS methods. The
complexities of ink, its drying, decomposition, and interactions with paper make analysis after 48
hours difficult to interpret.
Some inks in the sample population were indistinguishable by direct infusion ESI-MS
methods. An overall discrimination of 99% of the 435 possible pairwise comparisons among 30
pens was achieved. There are several possible explanations for the failed discriminations, the
inks tested were actually identical inks, the inks were similar but undistinguishable (different
batches or lots) or they are different inks.
Differentiation of inks is possible when they are compared on a similar time frame. Ink
inside of a pen for the most part is not exposed to the environment until it is written on paper. Ink
from the same pen, one sample deposited and extracted within 20 minutes then compared to a
sample deposited 20 years earlier, would look quite different from each other with the direct
infusion ESI-MS methods described. The environmental effects and the massive sample pool of
inks need to be investigated before individualization of aged inks becomes a viable forensic
practice. It was once an accepted or commonly held opinion that the extent of an ink’s time since
deposition could be determined by the presence or absence of a particular volatile molecule by
GC-MS analysis [13, 14].
Determination of the extent of aging with ballpoint inks has also been attempted with LC-
MS techniques like laser desorption ionization mass spectrometry (LDI-MS), MALDI, and

73
others using the noted degradation pattern of Basic Violet 3 [26]. This determination would be
difficult considering that even pure Basic Violet 3 samples contain varying concentrations of
Basic Violet 1. The ratio of BV3:BV1 in a pure sample can be affected anywhere along the
process from synthesis to being mixed with other parts to make ink. As shown in this research,
even a common desk lamp degrades the dyes in a black ballpoint ink in 72 hours to the extent
that no 372 m/z or 358 ions are observed in the samples by mass spectrum. There is still no
reliable way to correlate a sample’s mass spectral signature and account for the plethora of
variables in play once the ink leaves the pen tip and is deposited on paper. Once the line is
written, volatiles enter the vapor phase, dyes can degrade, and other contaminants can be
introduced to the document.
The ratio of BV3:BV1 is unstable and inconsistent, even within a contiguous ink line. In
addition, the potential interferences mentioned present challenges to ink analysis. The ratio of
BV3:BV1 is at best an indication that degradation has occurred in some BV 3 molecules to
remove one methyl group or some BV 1 was initially present.
All black BP inks investigated displayed in their direct infusion ESI-MS spectra some
peaks associated with known dye standards, such as BV 1, BV 3, and some contained Acid
Yellow 36. The Basic dyes contained in BP inks were detectable with no additive in both the
positive and negative operating polarity modes. These dyes that comprise such a substantial
portion of these inks formulations are present in the highest detectable concentrations of all the
components.
Ideally, it should be possible to identify an ink by comparing a sample extract to
determine origin of the sample. After mass spectral analysis, simply coding a number “1” for an
ion’s presence above 3% relative intensity and a number “0” for no presence at or below 3%

74
relative intensity allows a discrimination table, like Figure 31, to be created. Once these table are
created for different samples, they can be used to compare to other inks. The comparison consists
of evaluating the binary code for m/z values where number “1’s” exist. The binary code from
Method 1 is preferred as the starting point of the total evaluation of similarity. The reason for this
is that it provides the most intense signal and can positively identify the dyes and some solvents
components. If a sample matches a previously recorded Method 1 fingerprint, it would next have
its Method 2 generated binary code compared. Method 3 is used similarly, except the value from
the instrumental data that generates a binary code number “1” is 9% relative intensity. Method 3
uses negative applied polarity and typically generates more noise. A sample binary code can also
be compared to standards stored in an online database.

75
CHAPTER FIVE: CONCLUSIONS AND FUTURE WORKS
The most common or top selling 100 inks (in BP, Gel, and RB classes) could be studied
to see if a pattern emerges in their natural aging processes. For instance, the effect of a week’s
worth of sun on most cheaply made ink on a piece of paper when using mass spectral methods
could be investigated and perhaps modeled. Other environmental effects (i.e. temperature,
humidity, etc.) could also be studied. These variables affect the mass spectrum in ways that could
create false negatives. An algorithm should be investigated for fitness as a model for BP ink
aging trends. Gel and RB ink aging also creates issues in identification of their source. The
volatiles in gels are the viscous glycols and are slightly more persistent than ethanol, or IPA. RB
inks can contain dyes, pigments or a combination of the two. The trouble with this is that if we
had a sample that was an RB with Basic Violet 3 as a coloring agent and it also has carbon black
pigments, after some period of exposure to air, paper, and light the BV3 may completely degrade
into smaller molecules like phenol. Without the 372 or 358 m/z peak the method would not
identify BV3’s presence. Once the methyl groups are cleaved a new compound is formed, if BV3
(372 m/z) has one methyl group cleaved it is degraded in to BV 1 (358 m/z) by some
mechanism.
The plastic body of the pen may read “Bic Round Stic,” however the actual portions of
the formulation that are deposited on the paper are even unknown. The variation of the
fingerprint based on composition of the ink at the time of deposition can lead to significant risk
of misinterpretation. There is also the variation of formula known as “batch to batch” variation
due to manufacturer purchase the raw materials from a non-consistent supply source. Ink
formulation chemists would have data on how they mixed their batches, so they can, calculate
costs. For purposes of keeping track of these variations, it would be easier and cheaper for the

76
ink industry to keep records of mass spectral data gathered with use of a method such as the
direct infusion ESI-MS rather than using Rare Earth taggants. Testing for the Rare Earth taggants
may be looking for a single or perhaps, a combination of several chemicals in known
concentrations and known ratios to other ink components. However, ICP-MS is expensive and
typically not used in a majority of forensic labs.
Since the direct infusion ESI-MS methods generate a fingerprint spectrum, an analyst
does not need to know the definitive ID of every single ion or peak above 3% relative abundance
in a sample’s mass spectrum. The mass spectrum of some inks, like gels, can become quite
complex and include adducts, degradation products, and polymers. Tables 7, 8 and 9 compare
ions observed with each ink sample. Among the more vexing challenges presented for analysis
of ink are the aging of ink-on-paper samples.
The results of this study indicate that with the direct infusion ESI-MS method detailed, a
majority of the compounds are not contained within the fibers in detectable amounts soon after
deposition. This appears to contradict previous studies based on a comparison of extraction into a
so-called “weak” solvent like methanol and a “strong” solvent like trichloroethane followed by
subsequent thin layer chromatographic detection procedure.
The most common or top selling 100 inks (in BP, Gel, and RB classes) could be studied
to see if a pattern emerges in their natural aging processes. For instance, the effect of a week’s
worth of sun on most cheaply made ink on a piece of paper when using mass spectral methods
could be investigated and perhaps modeled. Other environmental effects (i.e. temperature,
humidity, etc.) could also be studied. These variables affect the mass spectrum in ways that could
create false negatives. An algorithm should be investigated for fitness as a model for BP ink
aging trends. Gel and RB ink aging also creates issues in identification of their source. The

77
volatiles in gels are the viscous glycols and are slightly more persistent than ethanol, or IPA. RB
inks can contain dyes, pigments or a combination of the two. The trouble with this is that if we
had a sample that was an RB with Basic Violet 3 as a coloring agent and it also has carbon black
pigments, after some period of exposure to air, paper, and light the BV3 may completely degrade
into smaller molecules like phenol. Without the 372 or 358 m/z peak the method would not
identify BV3’s presence. Once the methyl groups are cleaved a new compound is formed, if BV3
(372 m/z) has one methyl group cleaved it is degraded in to BV 1 (358 m/z) by some
mechanism.
Mass spectra collected using direct infusion ESI-MS methods and careful spectral
subtractions to elicit a relatively “pure ink’’ spectrum (Figure 15D) with all three analytical
methods. A proposed method of positive identification is an additive chemical placed in all inks
that is able to form a product at a detectable level. This product should provide a uniform rate of
decay or formation no matter what the storage conditions may be. Perhaps something similar to
povidone in pharmaceuticals, which in preparations such as Betadine releases iodine in a
predictable manner, could be utilized. Polymers that degrade in a well- understood manner with
detectable degradation products or leave a chemical marker in a time correlated concentration.
The use of the rare earth taggants by ICP-MS is not feasible, as rare earth compounds are usually
expensive and the instrumentation is uncommon in a majority of labs. Perhaps an enzyme that
degrades a substrate added to ink only as a marker of age. If the analyst has a clear picture of a
document’s age, this can be taken in to account when the report is issued. An automated online
accessible database could be implemented based on data gathered using this method. The use of
a search algorithm using clustering or another unsupervised pattern recognition technique could
speed up the identification process. Any database created would be a subset of the data range of

78
the mass spectra of every ink. This is not only impossible, but it isn't feasible to even attempt to
do anything other than develop a representative sample of assigned classes of inks.
One area that could be improved with the previously described direct injection ESI-MS
analysis protocol would be to use a mass spectrometer that can switch analysis polarities during
analysis. If the polarity of the instrument could be changed during an analytical run one or more
of those methods could be combined and less samples would be consumed as a result. Use of a
tandem mass spectrometer with direct infusion ESI-MS protocol would help achieve a definitive
identification of ink components.
The way to possibly differentiate these samples further is to add to the database the
sample FTIR. Also, the polarized light behavior of the sample could be coded to create a
comparison score to improve discrimination. The comparison score allows for a quick check of
samples that are close enough to merit further investigation. Ultraviolet spectra from inks may be
a difficult element for a comparison, as they are not specific enough to allow differentiation of
similarly colored inks.
The collaboration of efforts of all groups is vital to the ability to categorize the group of
items called “ink.” A free flow of information, ease of access/use, and simplicity are the best
ways to encourage more participation from groups who are not law enforcement. The effect of
storage conditions might be more easily grasped if one hundred analysts gathered data in a
central location and used standardized methods analysis so the comparisons, deductions,
interpretations, inductions, extrapolations, interpolations are founded on the same scale.
If this methodology is employed on a working basis and the database is maintained and
updated with new data, conclusions based on its results become more reliable. A system of
proficiency testing from remote laboratories with web form input and instant analysis by

79
programs residing on the database server could be implemented. Analysts and laboratories could
become instructed and certified on which ever method is used. Then individual variation due to
the operator technique and, instrumental noise could be limited.

80
LIST OF REFERENCES
1. Saferstein, R., Forensic Science Handbook. 1982, Prentice-Hall: Englewood Cliffs, N.J.
p. v. <1-3 >.
2. Williams, M.R., Moody, M., Arceneaux, L.E., Rinke, C., White, K., Sigman, M.E.,
Analysis of black writing ink by electrospray ionization mass spectrometry. Forensic
Science International. In Press, Corrected Proof.
3. Gernandt, M.N. and J.J. Urlaub, An introduction to the gel pen. Journal of Forensic
Sciences, 1996. 41(3): p. 503-504.
4. Mazzella, W.D. and A. Khanmy-Vital, A study to investigate the evidential value of blue
gel pen inks. Journal of Forensic Sciences, 2003. 48(2): p. 419-424.
5. Hilton, O., Scientific examination of questioned documents. 1993, Boca Raton, FL: CRC
Press. xv, 424 p.
6. El-Din, N.M.S., M.W. Sabaa, and H.R. Hamed, Influence of Three Chemical Erasures on
Different Types of Inks Marked on Several Document Papers: An Analysis of the
Chemical Reactions Occurring on Paper Between Different Liquid Erasures and Writing
Inks. International Journal of Forensic Document Examiners, 1998. 4(2): p. 9.
7. Godown, L., New nondestructive document testing methods. Journal of Criminal Law
and Criminology, 1964. 55: p. 280.
8. Derek, L.H., Validation of LAB Color Mode as a Nondestructive Method to Differentiate
Black Ballpoint Pen Inks*. Journal of Forensic Sciences, 2007. 52(4): p. 967-973.
9. Brunelle, R.L. and K.R. Crawford, Advances in the forensic analysis and dating of
writing ink. 2003, Springfield, Ill.: Charles C Thomas. xix, 215 p.

81
10. Brunelle, R.L. and K.R. Crawford, Advances in the forensic analysis and dating of
writing ink. 2003, Charles C. Thomas, Publisher Ltd.
11. Zlotnick, J.A. and F.P. Smith, Chromatographic and electrophoretic approaches in ink
analysis. Journal of Chromatography B: Biomedical Sciences and Applications, 1999.
733(1-2): p. 265-272.
12. Holmes, J.L., C. Aubry, and P.M. Mayer, Assigning structures to ions in mass
spectrometry. 2007: CRC Press.
13. LaPorte, G.M., et al., The Identification of 2-Phenoxyethanol in Ballpoint Inks Using Gas
Chromatography/Mass Spectrometry-Relevance to Ink Dating. Journal of Forensic
Sciences, 2004. 49(1): p. 155-159.
14. Grim, D.M., J. Siegel, and J. Allison, Does ink age inside of a pen cartridge? Journal of
Forensic Sciences, 2002. 47(6): p. 1294-1297.
15. Ng, L.K., P. Lafontaine, and L. Brazeau, Ballpoint pen inks: characterization by positive
and negative ion-electrospray ionization mass spectrometry for the forensic examination
of writing inks. Journal of Forensic Sciences, 2002. 47(6): p. 1238–1247.
16. Abian, J., The coupling of gas and liquid chromatography with mass spectrometry.
Journal of Mass Spectrometry, 1999. 34: p. 157-168.
17. Herbert, C.G. and R.A.W. Johnstone, Mass spectrometry basics. 2002: CRC.
18. Huang, M., J. Yinon, and M.E. Sigman, Forensic identification of dyes extracted from
textile fibers by liquid chromatography mass spectrometry (LC-MS). Journal of Forensic
Sciences, 2004. 49(2): p. 238-249.
19. Temesl, D. and B. Law, The effect of LC eluent composition on MS responses using
electrospray ionization. LC GC, 1999. 17(7): p. 626-632.

82
20. Lauren, M.P., A.W. Trevor, and W.R. Fawcett, High-Performance Liquid
Chromatography; Ultraviolet; Visible Spectroscopy; Electrospray Ionization Mass
Spectrometry Method for Acrylic and Polyester Forensic Fiber Dye Analysis. Journal of
Forensic Sciences, 2006. 51(4): p. 771-779.
21. Lociciro, S., et al., Dynamic of the ageing of ballpoint pen inks: quantification of
phenoxyethanol by GC-MS. Science & Justice, 2004. 44(3): p. 165-171.
22. Weyermann, C., et al., Evaluation of the Photodegradation of Crystal Violet upon Light
Exposure by Mass Spectrometric and Spectroscopic Methods. Journal of Forensic
Sciences, 2009. 54(2): p. 339-345.
23. Denman, S., et al., Photostability of Crystal Violet (CI 42555). Dyes and Pigments, 1996.
30(1): p. 67-72.
24. Andrasko, J., Changes in composition of ballpoint pen inks on aging in darkness. Journal
of Forensic Sciences, 2002. 47(2): p. 324.
25. Egan, J.M., K.A. Hagan, and J.D. Brewer, Forensic analysis of black ballpoint pen inks
using capillary electrophoresis. Forensic Science Communications, 2005. 7(3).
26. Jamie, D.D. and A. John, The Detection of Multiply Charged Dyes Using Matrix-
Assisted Laser Desorption/Ionization Mass Spectrometry for the Forensic Examination of
Pen Ink Dyes Directly from Paper. Journal of Forensic Sciences, 2007. 52(5): p. 1205-
1211.
27. LaPorte, G.M., et al., An Evaluation of Matching Unknown Writing Inks with the United States
International Ink Library*. Journal of Forensic Sciences, 2006. 51(3): p. 689-692.
28. The National Academies Press. Strengthening Forensic Science in the United States: A Path
Forward. http://www.nap.edu/catalog.php?record_id=12589#toc

83