blaise 2005
DESCRIPTION
lolTRANSCRIPT
69
1. EFFLUENT ASSESSMENT WITH THE PEEP (POTENTIAL ECOTOXIC EFFECTS PROBE)
INDEX
CHRISTIAN BLAISESaint-Lawrence Centre Environment Canada 105 McGill street, Montreal Quebec H2Y 2E7, Canada [email protected]
JEAN-FRANÇOIS FÉRARD Université de Metz, EBSE Campus Bridoux, rue du Général Delestraint 57070 Metz, France [email protected]
1. Objective and scope of the PEEP index
The PEEP index (or PEEP scale) was originally-developed as a simple effects-based hazard assessment scheme to compare the toxic potential of a series of wastewaters discharging to a common receiving aquatic ecosystem. Within the group of point source emissions being investigated, the PEEP index expresses the toxic loading of each as a single numerical value which integrates both its toxic potential (determined with a battery of small-scale bioassays representing different biological levels and types of toxic effects) and its flow. The PEEP index formula with its corresponding units has been formulated such that resulting values generally vary from 0 to 10, thereby simulating a type of “environmental Richter scale” that readily points out effluent samples that are more problematic than others in terms of toxic loading to an aquatic environment (i.e., the higher an effluent’s PEEP index value, the more potentially hazardous it is toward aquatic biota). Hence, the PEEP index is useful as a cost-effective aid to decision-making aimed at environmental protection because it allows prioritizing curative action of wastewaters displaying the highest toxic loadings.
Originally, the PEEP index was designed to assess industrial and municipal effluent toxicity (Section 3). Because the PEEP index formula can accommodate any number and types of bioassays, it could also be applied in other versatile ways (Section 8).
C. Blaise and J.-F. Férard (eds.), Small-scale Freshwater Toxicity Investigations, Vol. 2, 69-87.© 2005 Springer. Printed in the Netherlands.
BLAISE & FÉRARD70
2. Summary of the PEEP index
The PEEP (Potential Ecotoxic Effects Probe) index enables the assessment and comparison of the toxic potential of industrial effluents. It is one example of an integrated bioassay battery approach developed to serve the purposes of environmental management. This effluent assessment index relies on the use of an appropriate suite of multitrophic bioassays (decomposers, primary producers and consumers) allowing the measurement of various types (acute, chronic) and levels (lethal, sublethal) of toxicity. At the time of its conception, this index integrated the results of selected small-scale screening bioassays (Vibrio fischeri Microtox® test, Selenastrum capricornutum growth inhibition microtest, Ceriodaphnia dubialethality and reproduction inhibition tests, Escherichia coli genotoxicity SOS Chromotest), and took into account the persistence of toxicity (meaning that biotests were performed on an effluent before and after a five-day biodegradability procedure), (multi)specificity of toxic impact (number of biological responses affected by an effluent), as well as toxic loading (effluent flow in m3/h). The resulting Potential Ecotoxic Effects Probe (PEEP) index number is reflected by a log10 value that can normally vary from 0 to 10. The structure of the mathematical formula generating PEEP values (illustrated further on) is simple and “user-friendly” in that it can accommodate any number and type of bioassays to fit particular needs.
Table 1. Summary of the PEEP index hazard assessment scheme for effluents.
PEEP index : Potential Ecotoxic Effects Probe index
Purpose
• This index, which integrates bioassays as aids to decision-making, was developed as a management tool to assess and compare the relative toxic hazard of a series of industrial effluents discharging to a common aquatic receiving system. Once PEEP index values have been determined, enlightened decisions can take place to proceed with corrective action on those effluents (or classes thereof) which have been identified as the most potentially harmful to a receiving aquatic system (i.e., those with the highest PEEP values). Application of the PEEP scale can thus contribute cost-effectively to reducing toxic input of industrial pollutants to water bodies.
Principle
• Determination of the toxic loading of each effluent by measuring its toxic potential with an appropriate suite of bioassays 1) taking different levels of biological organization into account, 2) taking persistence of toxicity into account and 3) taking effluent flow into account.
Bioassays employed in effluent studies
• Vibrio fischeri (Microtox® light inhibition test); Escherichia coli (SOS Chromotest); Selenastrum capricornutum (micro-algal growth inhibition assay); Ceriodaphnia dubia acute immobilization test; Ceriodaphnia dubia chronic reproduction test (Costan et al., 1993).
EFFLUENT ASSESSMENT WITH THE PEEP INDEX 71
Table 1 (continued). Summary of the PEEP index hazard assessment scheme for effluents.
PEEP index : Potential Ecotoxic Effects Probe index
Bioassays employed in effluent studies
• Vibrio fischeri (Microtox® light inhibition test); Selenastrum capricornutum(micro-algal growth inhibition assay); Daphnia magna acute immobilization test; Thamnocephalus platyurus (ThamnoToxkit® lethality assay); Hydra attenuata(sub)lethality assay (Kusui and Blaise, 1999).
Determination of effluent hazard potential
• Hazard potential for each effluent, calculated with a mathematical formula integrating the product of effluent toxicity (= summation of toxic units generated by all bioassays) and effluent flow (expressed in m3/h), yields a toxic loading value (= toxic units discharged per cubic meter per hour). The log10 value of the latter is the resulting PEEP index for an effluent.
Notes of interest
• In theory, the PEEP index can vary from 0 to infinity. In practice, it has been shown to produce values ranging from 0 to about 10, thereby simulating a readily-understandable "environmetal Richter scale" indicative of point source industrial toxicity.
• Because of the mathematical formula employed, the PEEP index can be determined from any appropriate number and type of tests depending on laboratory expertise and means.
Documented applications with the PEEP index
• PEEP values were generated for 77 Canadian-based industrial effluents targeted for ecotoxicological studies under two Saint-Lawrence Action Plans (Costan et al., 1993; Kusui and Blaise, 1999).
• PEEP values were generated for 20 industrial effluents discharging into Toyama Bay (Toyama Prefecture, Japan) to identify those possessing the highest toxic loads (Kusui and Blaise, 1999).
3. Historical overview and applications reported with the PEEP index
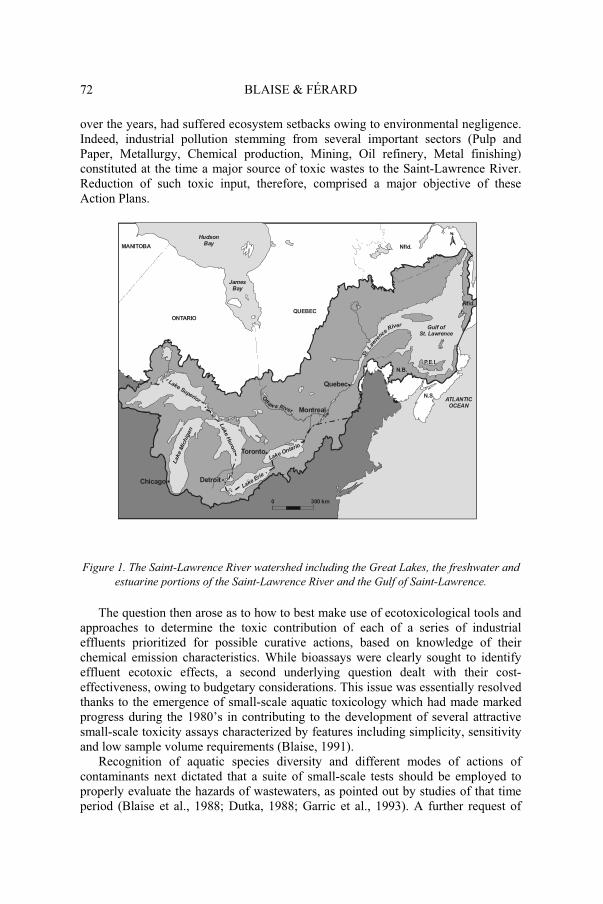
The development of the PEEP index was intimately linked with the Saint-Lawrence River Action Plan (SLAP), initiated in 1988 by the Government of Canada as part of a national commitment to sustain the biodiversity of its major aquatic environments. Originating in the Great Lakes, the 1600 km long Saint-Lawrence River slices through the province of Québec, where its freshwater portion first flows through major industrialized cities (especially the greater Montreal area and Quebec City) and then makes its way toward the Saint-Lawrence estuary, east of Québec City, where it later joins the Gulf of Saint-Lawrence (Fig. 1). During the first two five-year plans running from 1988 to 1998, SLAP’s basic goals were to protect, conserve and restore this economically-significant and biologically-rich fluvial system which,
BLAISE & FÉRARD72
over the years, had suffered ecosystem setbacks owing to environmental negligence. Indeed, industrial pollution stemming from several important sectors (Pulp and Paper, Metallurgy, Chemical production, Mining, Oil refinery, Metal finishing) constituted at the time a major source of toxic wastes to the Saint-Lawrence River. Reduction of such toxic input, therefore, comprised a major objective of these Action Plans.
300 km0
Lake Superior
Lake Ontario
Lake Erie
Lake
Huro
n
Lake
Mic
hig
an
ATLANTICOCEAN
Gulf ofSt. Lawrence
JamesBay
HudsonBay
St.
Law
re
nceRiver
Montreal
Quebec
QUEBEC
N.B.
N.S.
P.E.I.
ONTARIO
MANITOBA
DetroitChicago
Toronto
O
ttaw a River
Nfld.
Nfld.
Figure 1. The Saint-Lawrence River watershed including the Great Lakes, the freshwater and estuarine portions of the Saint-Lawrence River and the Gulf of Saint-Lawrence.
The question then arose as to how to best make use of ecotoxicological tools and approaches to determine the toxic contribution of each of a series of industrial effluents prioritized for possible curative actions, based on knowledge of their chemical emission characteristics. While bioassays were clearly sought to identify effluent ecotoxic effects, a second underlying question dealt with their cost-effectiveness, owing to budgetary considerations. This issue was essentially resolved thanks to the emergence of small-scale aquatic toxicology which had made marked progress during the 1980’s in contributing to the development of several attractive small-scale toxicity assays characterized by features including simplicity, sensitivity and low sample volume requirements (Blaise, 1991).
Recognition of aquatic species diversity and different modes of actions of contaminants next dictated that a suite of small-scale tests should be employed to properly evaluate the hazards of wastewaters, as pointed out by studies of that time period (Blaise et al., 1988; Dutka, 1988; Garric et al., 1993). A further request of
EFFLUENT ASSESSMENT WITH THE PEEP INDEX 73
SLAP environmental managers pleaded for an effluent assessment system that would be user-friendly in that it would unambiguously identify problematic liquid discharges and readily enable decision-making with respect to clean-up actions that should follow. To serve the purposes of environmental management, therefore, what eventually would become the PEEP index had to be both a scientific tool based on sound ecotoxicological principles (Section 5), as well as a simple-to-use and simple-to-interpret managerial tool capable of discriminating effluents based on their toxic loading to the Saint-Lawrence River.
As seen further on in this chapter, individual PEEP index values express a condensed portrait of an effluent’s hazard potential which takes into account several important ecotoxicological notions (toxic intensity and scope in terms of biotic levels impacted, bioavailability, persistence of toxicity and effluent flow). Unlike wastewater investigations limited to chemical characterization, this bioassay-based scale reflects the integrated responses of several representative toxicity tests to all interaction phenomena (antagonistic, additive and/or synergistic effects) that can be present in effluent samples.
Under the first two Saint-Lawrence Action Plans (1988-98), the PEEP index was employed to determine and compare the relative toxicity of 106 priority industrial sites all of which discharged their wastewaters to the Saint-Lawrence River. Several publications have reported on various aspects of this initiative (Costan et al., 1993; Environment Canada, 1996; Blaise, 1996; Blaise et al., 2000). Presented at several scientific venues since 1993, the PEEP index concept has generated interest among the international scientific community. We are aware that it has been employed in Australia, France, Lithuania, Japan and South Africa. In Toyama Prefecture, Japan, PEEP index values were recently determined for 20 industrial sites and sewage plants, whose effluents discharged to Toyama Bay, an important commercial fisheries resource area, to identify those responsible for the highest toxic loadings (Kusui and Blaise, 1999; Kusui, 2002). This index was also employed to assess the toxic loading of wastewaters discharging to the Bogotá River in Columbia (see Chapter 7 of this volume).
4. Advantages of the PEEP index scheme for effluent assessment
Outstanding PEEP index characteristics can be summarized as follows: • The PEEP scale is a cost-effective tool to determine the toxic loading potential of
a series of point source liquid wastes discharging to a common receiving environment, owing to the use of small-scale bioassays.
• The PEEP index formula, is easy to use and interpret, and capable of accommodating any number and types of toxicity tests, thereby enabling its application internationally.
• Application of the PEEP index provides unambiguous capacity to discriminate between effluents having low and high toxic loading potentials.
• Numerical PEEP index values are the log10 expression of an effluent’s toxic loading (= toxic potential of effluent generated with a relevant battery of toxicity tests multiplied by effluent flow) and normally vary between 0 and 10. The PEEP scale can thus be considered as a type of “environmental Richter scale” for
BLAISE & FÉRARD74
wastewaters that describes an effluent’s hazardous potential toward a receiving aquatic ecosystem.
• Because they are readily understandable by environmental managers, industrialists and the general public, PEEP values enable rapid and enlightened decision-making to circumscribe specific effluents which should be targeted for clean-up actions in order to reduce toxic loading to aquatic environments.
5. Description of the PEEP index scheme
While the PEEP index can theoretically be employed to assess the toxic potential of varied liquid media and groups of specific chemical products of interest (Section 8.3), it was originally conceived to appraise that of liquid wastes of point source discharges to aquatic environments. The index is thus described for this purpose in this section.
5.1 EFFLUENT SAMPLES
Samples are taken from the final effluent of each industrial plant investigated with an automatic sampler (e.g., Manning sampler) that collects a set volume of wastewater after a designated time interval (e.g., 400 mL every 15 min). A 24-h sample (in this case, 38,400 mL or 38.4 L) can then be stored in an appropriate glass container (40-L container in this case). If additional volumes are required (e.g., for subsequent biological and chemical analyses), the automatic sampler can be programmed to collect larger effluent quantities after a 24-h time period or sampling can proceed for up to three consecutive days to collect 3 × 40 L samples (as in this example). Composite 24-h or 72-h samples are then truly representative of the liquid emissions of each industrial site being assessed. Ideally, and during the sampling period, effluent flow can be determined on site with a Parshall flume (see glossary) or this information can be obtained directly from plant authorities. For plants having more than one effluent, each composite sample can be combined as a function of flow volume. All samples should be kept in coolers (~ 4ºC) after sampling and during transport and storage. Biological testing should commence as soon as possible afterwards, but no more than 5 days after each composite sample has been prepared.
Prior to toxicity testing, an appropriate volume of each composite sample is vacuum-filtered (0.45 µ membrane) to remove suspended material which would otherwise interfere with the conduct of some of the bioassays employed. In removing particulates from effluent samples, it is important to note that the PEEP scale only evaluates their soluble toxicity. This issue is further discussed in Section 6.3.
5.2 TYPES OF BIOASSAYS EMPLOYED
At the time of its conception, the PEEP index integrated the results of a selection of practical small-scale screening bioassays which included the Vibrio fischeribioluminescence inhibition test, the Selenastrum capricornutum growth inhibition
EFFLUENT ASSESSMENT WITH THE PEEP INDEX 75
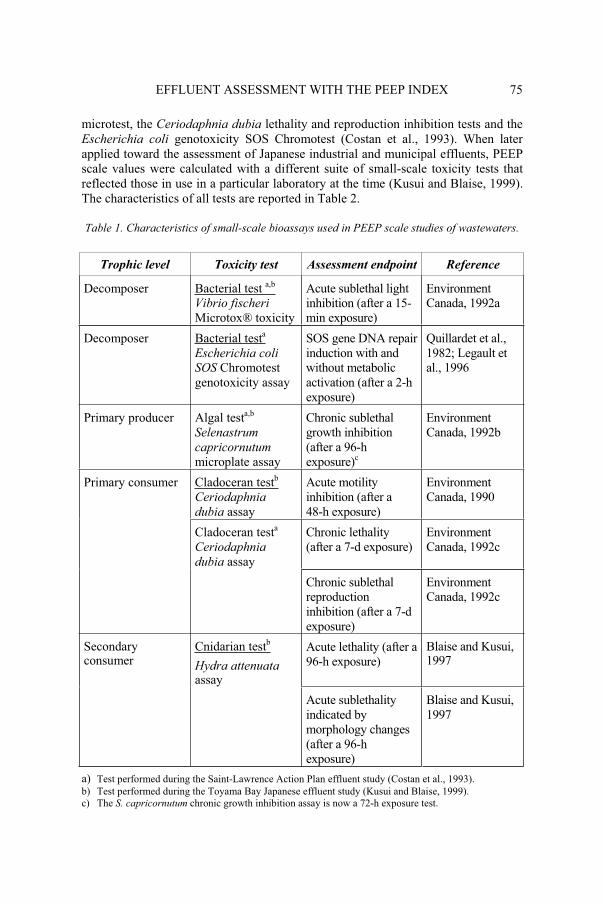
microtest, the Ceriodaphnia dubia lethality and reproduction inhibition tests and the Escherichia coli genotoxicity SOS Chromotest (Costan et al., 1993). When later applied toward the assessment of Japanese industrial and municipal effluents, PEEP scale values were calculated with a different suite of small-scale toxicity tests that reflected those in use in a particular laboratory at the time (Kusui and Blaise, 1999). The characteristics of all tests are reported in Table 2.
Table 1. Characteristics of small-scale bioassays used in PEEP scale studies of wastewaters.
Trophic level Toxicity test Assessment endpoint Reference
Decomposer Bacterial test a,b
Vibrio fischeriMicrotox® toxicity
Acute sublethal light inhibition (after a 15-min exposure)
Environment Canada, 1992a
Decomposer Bacterial testa
Escherichia coli SOS Chromotest genotoxicity assay
SOS gene DNA repair induction with and without metabolic activation (after a 2-h exposure)
Quillardet et al., 1982; Legault et al., 1996
Primary producer Algal testa,b
Selenastrum capricornutum microplate assay
Chronic sublethal growth inhibition (after a 96-h exposure)c
Environment Canada, 1992b
Primary consumer Cladoceran testb
Ceriodaphnia dubia assay
Acute motility inhibition (after a 48-h exposure)
Environment Canada, 1990
Cladoceran testa
Ceriodaphnia dubia assay
Chronic lethality (after a 7-d exposure)
Environment Canada, 1992c
Chronic sublethal reproduction inhibition (after a 7-d exposure)
Environment Canada, 1992c
Secondary consumer
Cnidarian testb
Hydra attenuataassay
Acute lethality (after a 96-h exposure)
Blaise and Kusui, 1997
Acute sublethality indicated by morphology changes (after a 96-h exposure)
Blaise and Kusui, 1997
a) Test performed during the Saint-Lawrence Action Plan effluent study (Costan et al., 1993). b) Test performed during the Toyama Bay Japanese effluent study (Kusui and Blaise, 1999). c) The S. capricornutum chronic growth inhibition assay is now a 72-h exposure test.
BLAISE & FÉRARD76
For both the Saint-Lawrence River Action Plan (Costan et al., 1993) and the Toyama Bay Japanese (Kusui and Blaise, 1999) studies, the two suites of bioassays employed represented three trophic levels (decomposers, primary producers and primary or secondary consumers), and sought to measure both acute and chronic toxicity. Toxicity tests were selected on the basis of practical and scientific criteria including low sample volume requirement, sensitivity, simplicity of undertaking the assay, ease in maintaining laboratory cultures, cost-effectiveness, procedural reliability and/or frequency of use internationally.
5.3 MEASUREMENT ENDPOINTS
Because 50% effect effluent concentrations cannot always be determined owing to several factors (e.g., nonlinear or lack of an apparent concentration-response, effect below 50% in the case of slightly toxic effluents, other confounding factors such as the co-presence of both toxic and stimulatory contaminants), the common measurement endpoint selected for all bioassays employed in the Saint-Lawrence River Action investigation was the (geno)toxic threshold concentration (TC), calculated from NOEC (no observed effect concentration) and LOEC (lowest observed effect concentration) values as indicated in the formula below (U.S. EPA, 1989). A second reason for choosing a TC endpoint over a median effect endpoint is its increased sensitivity over the latter (i.e., a TC endpoint will signal the onset of an adverse effect at a lower effluent concentration than will a EC50 endpoint, for example, which reflects an effluent concentration at which 50% of exposed organisms are affected).
Hence, hypothesis testing (ANOVA analysis followed by multiple comparison analysis) was used to determine NOEC and LOEC values expressed as % v/v of effluent. In order to satisfy statistical analysis requirements enabling NOEC and LOEC determinations, some bioassay protocols were adjusted to make sure that there were at least three replicates per effluent concentration and at least five effluent concentrations tested. TC % effluent values were then determined as follows:
TC = (NOEC × LOEC)1/2 (1)
So that toxic effects of all bioassays could be later integrated in the PEEP scale formula (Section 5.5), TC values were again transformed into toxic unit (TU) values by means of the following formula (Sprague and Ramsay, 1965):
TU = 100% v/v effluent ÷ TC (2)
In the Toyama Bay Japanese effluent study, 20% endpoint effect values (e.g., LC20s for the D. magna assay and IC20s for the S. capricornutum assay), which are close approximations of TC values determined from NOEC and LOEC data (as in the Canadian study), were transformed into TU values and integrated into the PEEP formula. In applying the PEEP index concept to a designated series of wastewaters discharging to a common aquatic environment, it is paramount, of course, to use the same battery of bioassays and to report all of their toxicity responses with the same measurement endpoint and statistical analysis system (i.e., TC values for all effluents
EFFLUENT ASSESSMENT WITH THE PEEP INDEX 77
in the case of the Canadian study and 20% effect responses for all effluents in the case of the Japanese study). Only in this way can it be justified to appraise the relative toxicity contribution of a set of wastewaters on a common comparative basis.
5.4 BIODEGRADABILITY OF EFFLUENT TOXICITY
Persistence of toxicity is an important notion to consider in assessing the hazards of liquid wastes that are discharged to aquatic environments. Clearly, effluents whose toxic components are persistent stand to harm aquatic biota more severely than those that are not. The PEEP index incorporates the notion of “persistence of toxicity” in its wastewater assessment and employs a simple procedure to determine this aspect. Essentially, the selected suite of bioassays is first conducted on the neat effluent sample that has been collected. The same suite of tests is then undertaken on a sub-sample after it has been subjected to a five-day biodegradability test. This test calls for incorporating a micro-volume of buffered solution of inorganic salts to a 1-L volume of effluent, adding a commercial bacterial seed solution, followed by a 5-d room temperature incubation (in darkness) under continuous low-bubbling aeration (Costan et al., 1993). An identical cocktail added to a 1-L sample of deionized water and processed as described was run in parallel and bioassays confirmed its non toxic characteristics. This type of biodegradation step simulates aerobic biological treatment (e.g., biodegradation activities of aquatic microbes) and allows effluent toxicity potential to be determined on pre- and post-biodegradation effluent samples.
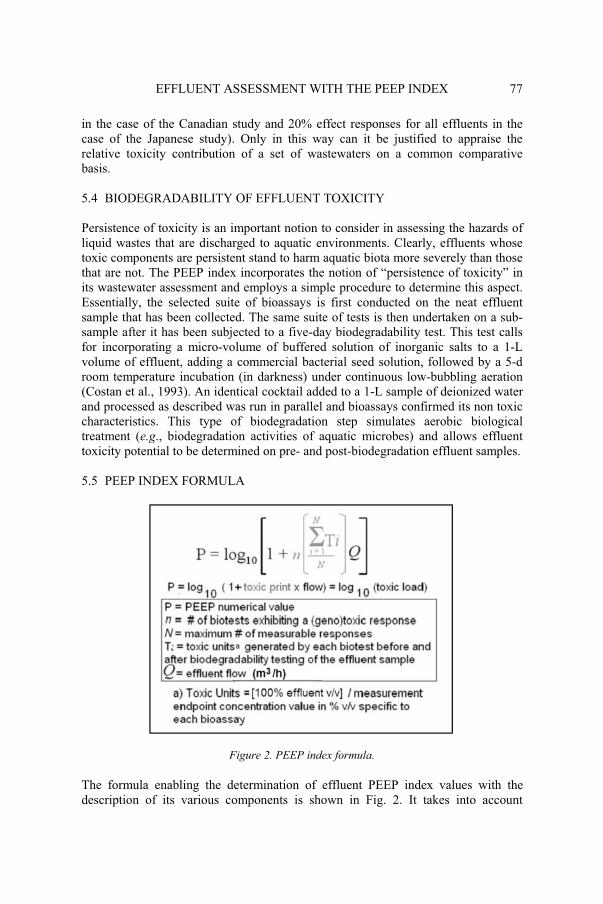
5.5 PEEP INDEX FORMULA
Figure 2. PEEP index formula.
The formula enabling the determination of effluent PEEP index values with the description of its various components is shown in Fig. 2. It takes into account
BLAISE & FÉRARD78
persistence of toxicity (meaning that biotests are performed on an effluent before and after a five-day biodegradability procedure described above), (multi)specificity of toxic impact (number of biological responses affected by an effluent), as well as toxic loading (effluent flow in m3/h). The resulting Potential Ecotoxic Effects Probe (PEEP) index number is reflected by a log10 value that will normally vary from 0 to 10. The structure of the mathematical formula generating PEEP values is simple and "user-friendly" in that it can accommodate any number and type of bioassays to fit particular needs and/or specific laboratory capabilities.
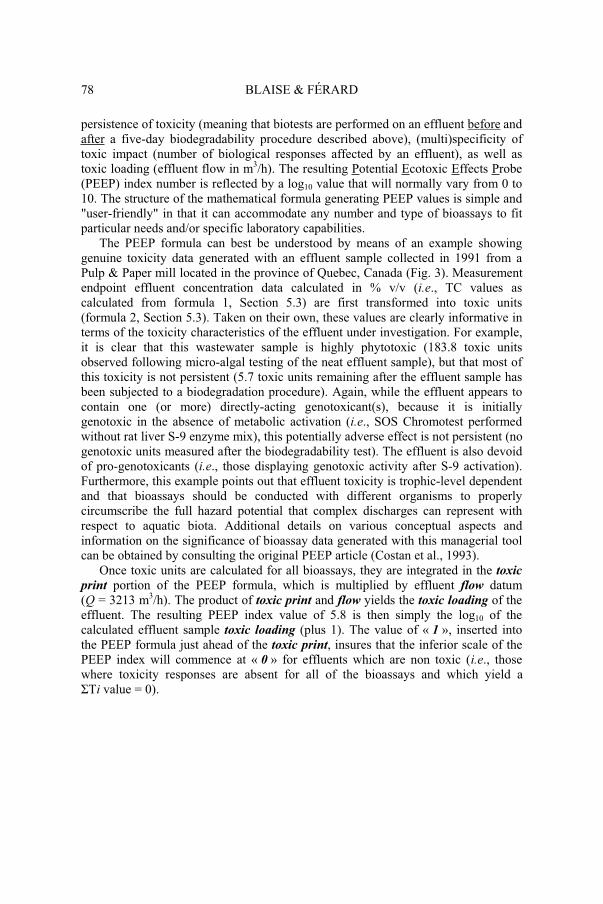
The PEEP formula can best be understood by means of an example showing genuine toxicity data generated with an effluent sample collected in 1991 from a Pulp & Paper mill located in the province of Quebec, Canada (Fig. 3). Measurement endpoint effluent concentration data calculated in % v/v (i.e., TC values as calculated from formula 1, Section 5.3) are first transformed into toxic units (formula 2, Section 5.3). Taken on their own, these values are clearly informative in terms of the toxicity characteristics of the effluent under investigation. For example, it is clear that this wastewater sample is highly phytotoxic (183.8 toxic units observed following micro-algal testing of the neat effluent sample), but that most of this toxicity is not persistent (5.7 toxic units remaining after the effluent sample has been subjected to a biodegradation procedure). Again, while the effluent appears to contain one (or more) directly-acting genotoxicant(s), because it is initially genotoxic in the absence of metabolic activation (i.e., SOS Chromotest performed without rat liver S-9 enzyme mix), this potentially adverse effect is not persistent (no genotoxic units measured after the biodegradability test). The effluent is also devoid of pro-genotoxicants (i.e., those displaying genotoxic activity after S-9 activation). Furthermore, this example points out that effluent toxicity is trophic-level dependent and that bioassays should be conducted with different organisms to properly circumscribe the full hazard potential that complex discharges can represent with respect to aquatic biota. Additional details on various conceptual aspects and information on the significance of bioassay data generated with this managerial tool can be obtained by consulting the original PEEP article (Costan et al., 1993).
Once toxic units are calculated for all bioassays, they are integrated in the toxic
print portion of the PEEP formula, which is multiplied by effluent flow datum (Q = 3213 m3/h). The product of toxic print and flow yields the toxic loading of the effluent. The resulting PEEP index value of 5.8 is then simply the log10 of the calculated effluent sample toxic loading (plus 1). The value of « 1 », inserted into the PEEP formula just ahead of the toxic print, insures that the inferior scale of the PEEP index will commence at « 0 » for effluents which are non toxic (i.e., those where toxicity responses are absent for all of the bioassays and which yield a
Ti value = 0).
EFFLUENT ASSESSMENT WITH THE PEEP INDEX 79
Figure 3. PEEP index calculation for actual toxicity data obtained for a Pulp & Paper effluent.
6. Factors capable of influencing effluent PEEP scale interpretation
6.1 EFFLUENT SAMPLING
Collection of a reliable composite sample of effluent taken over time (Section 5.1) is paramount to ensure that its determined PEEP value will reflect reality. Unless an industrial process discharges wastewaters that are constant in their physical-chemical constituents and flow characteristics, a grab (i.e., instantaneous) sample cannot pretend to be representative of an effluent’s hazard/risk potential in terms of toxic loading. More often than not, and for a variety of reasons, process waters are seldom uniform and show variation over time. Again, grab and/or even composite samples cannot hope to take account of unpredictable discharges that can be accidental (e.g.,uncontrollable slug of pollution released owing to plant technical problem) or illegal (e.g., wilful nocturnal release of contaminated wastes) in nature.
6.2 TYPES AND NUMBERS OF BIOASSAYS
The same types and numbers of bioassays must always be applied to the same series of effluents discharging to a common aquatic environment. Failure to do so invalidates appraising the relative toxicity contribution of each wastewater in relation to others, as one would clearly be comparing “apples and oranges” in such an event. It is also important to employ bioassays (within a designated battery) that are not redundant in the toxicity information they yield (e.g., two bioassays significantly correlated to one another in terms of their effluent measurement
BLAISE & FÉRARD80
endpoint values). While this does not invalidate PEEP results, it would signify that the test battery has likely not been optimally designed in terms of cost-effectiveness and also possibly in terms of circumscribing the full toxic potential of the set of effluents being investigated.
6.3 EFFLUENT TOXICITY POTENTIAL
In applying the PEEP index concept to sets of industrial effluents thus far, wastewater samples have been filtered prior to bio-analysis (see Section 5.1). Hence, only their soluble toxicity potential is taken into consideration. This is certainly a drawback at this time as toxic and genotoxic potential linked to suspended matter of some industrial plant effluents, for example, have been shown to be important (White et al., 1996; Pardos and Blaise, 1999). Particulate toxicity in effluent samples should certainly be addressed in future PEEP applications, as soon as reliable small-scale toxicity tests are developed and available to estimate it. Indeed, the issue of soluble and particulate toxicity is especially relevant in relation to technology-based reduction of hazardous liquid emissions.
7. Application of the PEEP index: a case study
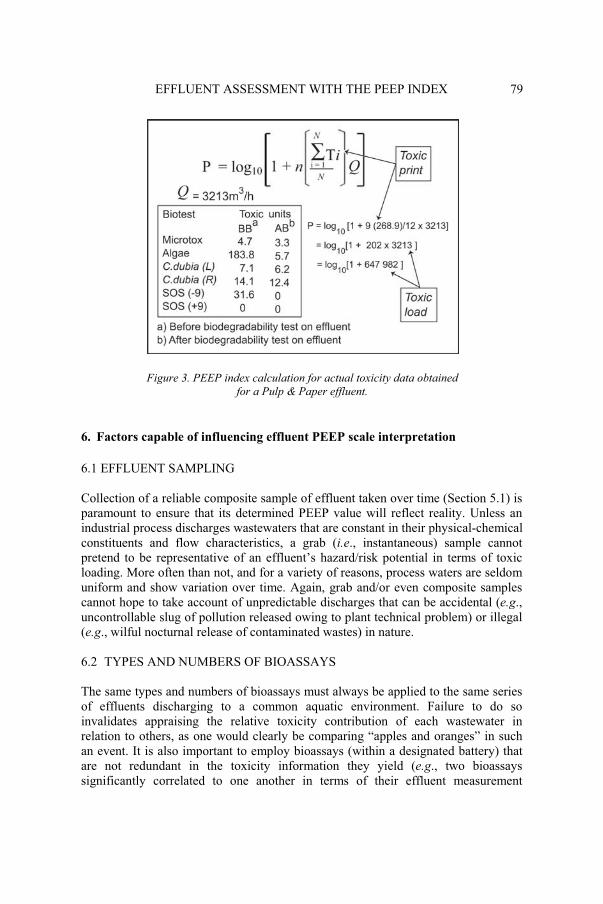
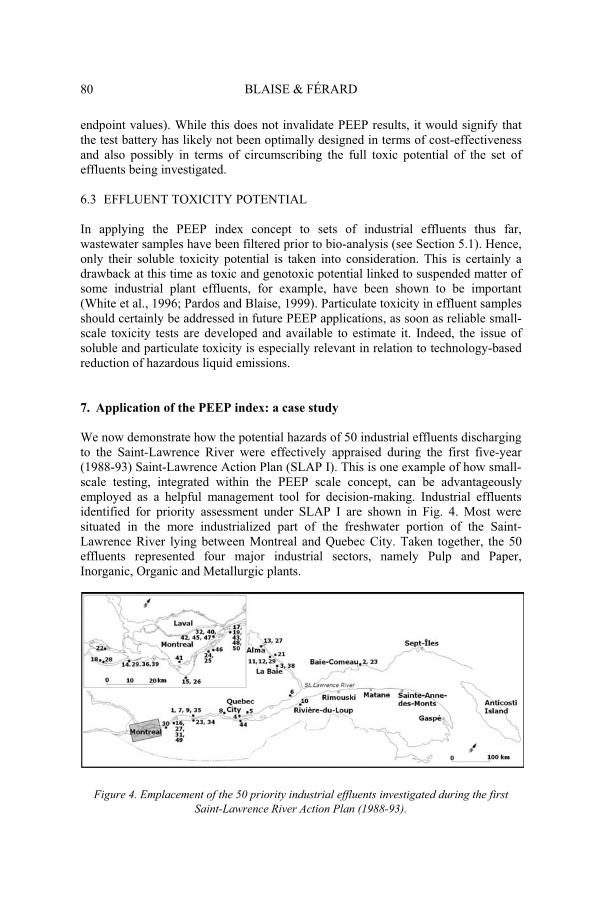
We now demonstrate how the potential hazards of 50 industrial effluents discharging to the Saint-Lawrence River were effectively appraised during the first five-year (1988-93) Saint-Lawrence Action Plan (SLAP I). This is one example of how small-scale testing, integrated within the PEEP scale concept, can be advantageously employed as a helpful management tool for decision-making. Industrial effluents identified for priority assessment under SLAP I are shown in Fig. 4. Most were situated in the more industrialized part of the freshwater portion of the Saint-Lawrence River lying between Montreal and Quebec City. Taken together, the 50 effluents represented four major industrial sectors, namely Pulp and Paper, Inorganic, Organic and Metallurgic plants.
Figure 4. Emplacement of the 50 priority industrial effluents investigated during the first Saint-Lawrence River Action Plan (1988-93).
EFFLUENT ASSESSMENT WITH THE PEEP INDEX 81
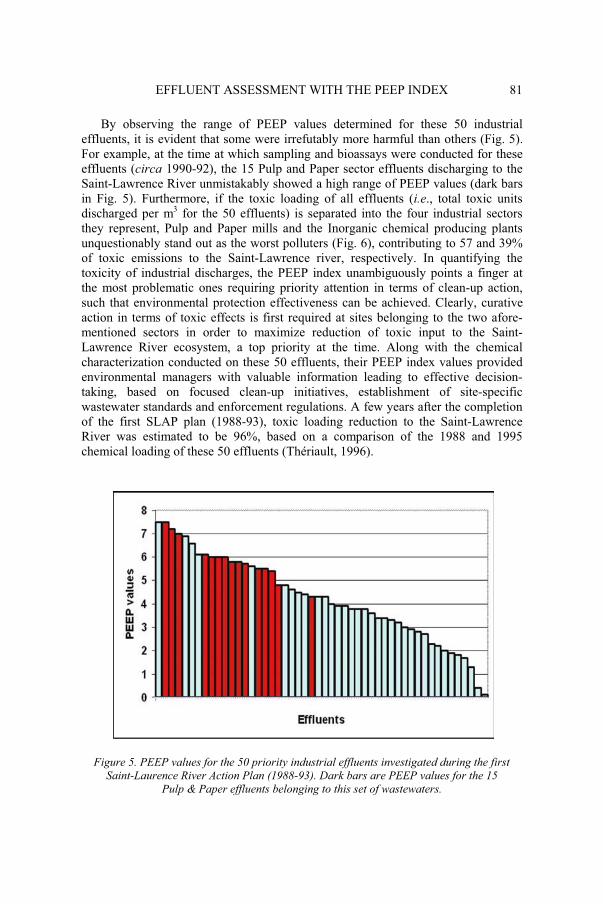
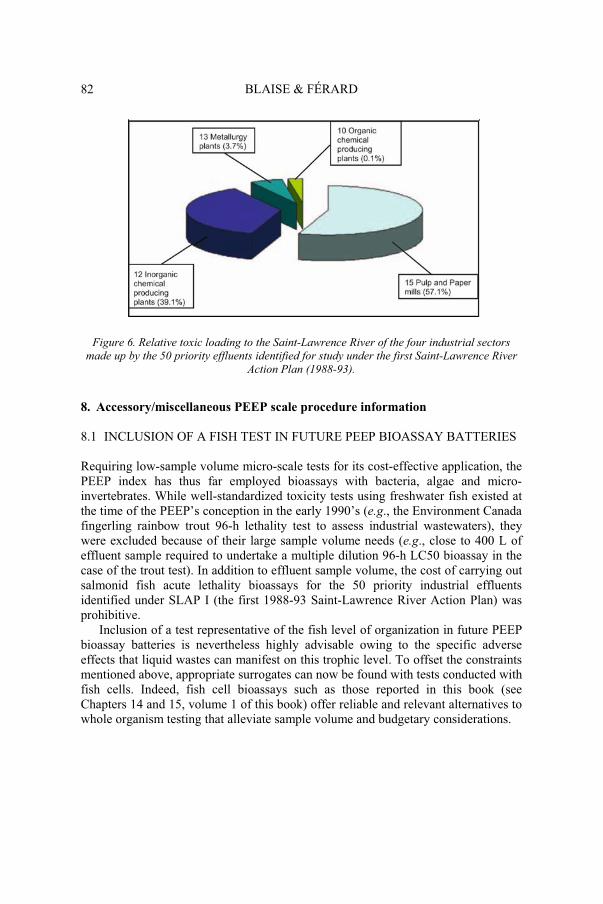
By observing the range of PEEP values determined for these 50 industrial effluents, it is evident that some were irrefutably more harmful than others (Fig. 5). For example, at the time at which sampling and bioassays were conducted for these effluents (circa 1990-92), the 15 Pulp and Paper sector effluents discharging to the Saint-Lawrence River unmistakably showed a high range of PEEP values (dark bars in Fig. 5). Furthermore, if the toxic loading of all effluents (i.e., total toxic units discharged per m3 for the 50 effluents) is separated into the four industrial sectors they represent, Pulp and Paper mills and the Inorganic chemical producing plants unquestionably stand out as the worst polluters (Fig. 6), contributing to 57 and 39% of toxic emissions to the Saint-Lawrence river, respectively. In quantifying the toxicity of industrial discharges, the PEEP index unambiguously points a finger at the most problematic ones requiring priority attention in terms of clean-up action, such that environmental protection effectiveness can be achieved. Clearly, curative action in terms of toxic effects is first required at sites belonging to the two afore-mentioned sectors in order to maximize reduction of toxic input to the Saint-Lawrence River ecosystem, a top priority at the time. Along with the chemical characterization conducted on these 50 effluents, their PEEP index values provided environmental managers with valuable information leading to effective decision-taking, based on focused clean-up initiatives, establishment of site-specific wastewater standards and enforcement regulations. A few years after the completion of the first SLAP plan (1988-93), toxic loading reduction to the Saint-Lawrence River was estimated to be 96%, based on a comparison of the 1988 and 1995 chemical loading of these 50 effluents (Thériault, 1996).
Figure 5. PEEP values for the 50 priority industrial effluents investigated during the first Saint-Laurence River Action Plan (1988-93). Dark bars are PEEP values for the 15
Pulp & Paper effluents belonging to this set of wastewaters.
BLAISE & FÉRARD82
Figure 6. Relative toxic loading to the Saint-Lawrence River of the four industrial sectors made up by the 50 priority effluents identified for study under the first Saint-Lawrence River
Action Plan (1988-93).
8. Accessory/miscellaneous PEEP scale procedure information
8.1 INCLUSION OF A FISH TEST IN FUTURE PEEP BIOASSAY BATTERIES
Requiring low-sample volume micro-scale tests for its cost-effective application, the PEEP index has thus far employed bioassays with bacteria, algae and micro-invertebrates. While well-standardized toxicity tests using freshwater fish existed at the time of the PEEP’s conception in the early 1990’s (e.g., the Environment Canada fingerling rainbow trout 96-h lethality test to assess industrial wastewaters), they were excluded because of their large sample volume needs (e.g., close to 400 L of effluent sample required to undertake a multiple dilution 96-h LC50 bioassay in the case of the trout test). In addition to effluent sample volume, the cost of carrying out salmonid fish acute lethality bioassays for the 50 priority industrial effluents identified under SLAP I (the first 1988-93 Saint-Lawrence River Action Plan) was prohibitive.
Inclusion of a test representative of the fish level of organization in future PEEP bioassay batteries is nevertheless highly advisable owing to the specific adverse effects that liquid wastes can manifest on this trophic level. To offset the constraints mentioned above, appropriate surrogates can now be found with tests conducted with fish cells. Indeed, fish cell bioassays such as those reported in this book (see Chapters 14 and 15, volume 1 of this book) offer reliable and relevant alternatives to whole organism testing that alleviate sample volume and budgetary considerations.
EFFLUENT ASSESSMENT WITH THE PEEP INDEX 83
8.2 REPRODUCIBILITY OF PEEP EFFLUENT VALUES
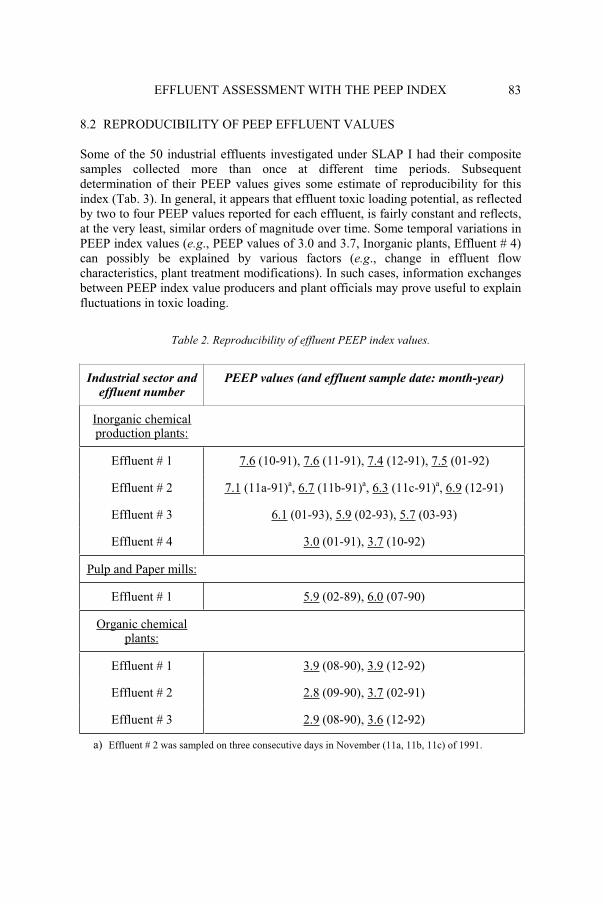
Some of the 50 industrial effluents investigated under SLAP I had their composite samples collected more than once at different time periods. Subsequent determination of their PEEP values gives some estimate of reproducibility for this index (Tab. 3). In general, it appears that effluent toxic loading potential, as reflected by two to four PEEP values reported for each effluent, is fairly constant and reflects, at the very least, similar orders of magnitude over time. Some temporal variations in PEEP index values (e.g., PEEP values of 3.0 and 3.7, Inorganic plants, Effluent # 4) can possibly be explained by various factors (e.g., change in effluent flow characteristics, plant treatment modifications). In such cases, information exchanges between PEEP index value producers and plant officials may prove useful to explain fluctuations in toxic loading.
Table 2. Reproducibility of effluent PEEP index values.
Industrial sector and effluent number
PEEP values (and effluent sample date: month-year)
Inorganic chemical production plants:
Effluent # 1 7.6 (10-91), 7.6 (11-91), 7.4 (12-91), 7.5 (01-92)
Effluent # 2 7.1 (11a-91)a, 6.7 (11b-91)a, 6.3 (11c-91)a, 6.9 (12-91)
Effluent # 3 6.1 (01-93), 5.9 (02-93), 5.7 (03-93)
Effluent # 4 3.0 (01-91), 3.7 (10-92)
Pulp and Paper mills:
Effluent # 1 5.9 (02-89), 6.0 (07-90)
Organic chemical plants:
Effluent # 1 3.9 (08-90), 3.9 (12-92)
Effluent # 2 2.8 (09-90), 3.7 (02-91)
Effluent # 3 2.9 (08-90), 3.6 (12-92)
a) Effluent # 2 was sampled on three consecutive days in November (11a, 11b, 11c) of 1991.
BLAISE & FÉRARD84
8.3 OTHER POSSIBLE USES OF THE PEEP SCALE
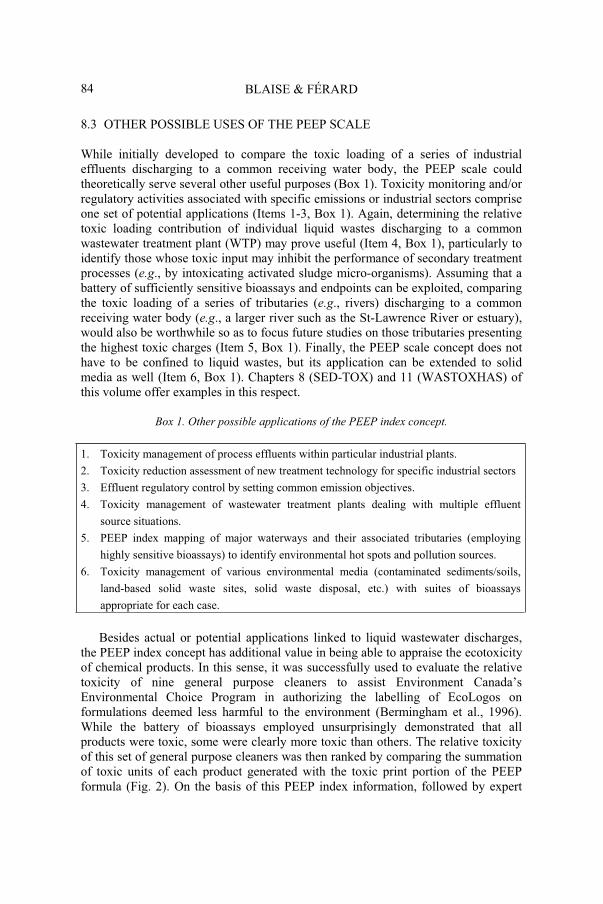
While initially developed to compare the toxic loading of a series of industrial effluents discharging to a common receiving water body, the PEEP scale could theoretically serve several other useful purposes (Box 1). Toxicity monitoring and/or regulatory activities associated with specific emissions or industrial sectors comprise one set of potential applications (Items 1-3, Box 1). Again, determining the relative toxic loading contribution of individual liquid wastes discharging to a common wastewater treatment plant (WTP) may prove useful (Item 4, Box 1), particularly to identify those whose toxic input may inhibit the performance of secondary treatment processes (e.g., by intoxicating activated sludge micro-organisms). Assuming that a battery of sufficiently sensitive bioassays and endpoints can be exploited, comparing the toxic loading of a series of tributaries (e.g., rivers) discharging to a common receiving water body (e.g., a larger river such as the St-Lawrence River or estuary), would also be worthwhile so as to focus future studies on those tributaries presenting the highest toxic charges (Item 5, Box 1). Finally, the PEEP scale concept does not have to be confined to liquid wastes, but its application can be extended to solid media as well (Item 6, Box 1). Chapters 8 (SED-TOX) and 11 (WASTOXHAS) of this volume offer examples in this respect.
Box 1. Other possible applications of the PEEP index concept.
1. Toxicity management of process effluents within particular industrial plants.
2. Toxicity reduction assessment of new treatment technology for specific industrial sectors
3. Effluent regulatory control by setting common emission objectives.
4. Toxicity management of wastewater treatment plants dealing with multiple effluent
source situations.
5. PEEP index mapping of major waterways and their associated tributaries (employing
highly sensitive bioassays) to identify environmental hot spots and pollution sources.
6. Toxicity management of various environmental media (contaminated sediments/soils,
land-based solid waste sites, solid waste disposal, etc.) with suites of bioassays
appropriate for each case.
Besides actual or potential applications linked to liquid wastewater discharges, the PEEP index concept has additional value in being able to appraise the ecotoxicity of chemical products. In this sense, it was successfully used to evaluate the relative toxicity of nine general purpose cleaners to assist Environment Canada’s Environmental Choice Program in authorizing the labelling of EcoLogos on formulations deemed less harmful to the environment (Bermingham et al., 1996). While the battery of bioassays employed unsurprisingly demonstrated that all products were toxic, some were clearly more toxic than others. The relative toxicity of this set of general purpose cleaners was then ranked by comparing the summation of toxic units of each product generated with the toxic print portion of the PEEP formula (Fig. 2). On the basis of this PEEP index information, followed by expert
EFFLUENT ASSESSMENT WITH THE PEEP INDEX 85
judgement considerations, three out of the nine products were recommended as qualifiers for the Ecologo labels.
Finally, a recent study was undertaken to assess the human and environmental hazard of recycled tire crumb as ground covering in playgrounds (Birkholz et al., 2003). Here, the PEEP scale was called upon to estimate hazard associated with aquatic exposure to water-soluble extracts of tire crumbs. Based on an initially-determined PEEP value of 3.2 for projected volumes of tire crumb leachates to the aquatic environment and a documented decrease in toxicity three months after tire crumb cover had been in place, the study concluded that tires recycled in this fashion would not present a significant risk of contamination for either receiving surface or groundwaters.
9. Conclusions/prospects
The PEEP index was originally designed to be a scientifically-sound management tool, integrating bioassays as an aid to decision-making, capable of assessing the relative toxic loading (expressed by a single numerical value) of each of a series of industrial effluents discharging to a common receiving aquatic environment. To be effective, this effluent assessment index is dependent on the use of an appropriate suite of bioassays undertaken at several biological levels (e.g., decomposers, primary producers and consumers) enabling the measurement of various types (acute, chronic) and levels (lethal, sublethal) of toxicity. Its effectiveness in predicting the overall hazard potential of wastewaters was further revealed when the selected panel of bioassays featured non redundancy in toxic responses generated with effluents representative of four different industrial sectors (Costan et al., 1993). The approach is novel in that it combines information on 1) the biodegradability/persistence of effluent toxicity (indicative of its possible fate in receiving waters), 2) the trophic levels targeted by effluent toxicity (indicative of the ecological scope of impact) and on 3) the flow characteristics of the effluent (indicative of toxic loading released to the environment). The integration of these concepts into a PEEP scale or index is clearly an unparalleled attempt to bring together factors of relevant ecotoxicological importance into a simple, practical and useful management tool to literally "peep" into the hazardous potential of industrial effluents via an initial bioanalytical screening strategy. Once PEEP index values have been generated for a designated set of point source pollution emissions, enlightened control efforts can then be directed toward the most problematic ones to optimize toxicity reduction.
Beyond its capability to identify generic toxicity hazards linked to complex liquid media and classes of chemical products (recalled in Section 8.3), the PEEP concept might in future yet unfold in different ways. For one, as the discipline of aquatic toxicology and instrumental technology evolve, so likely will the choice of bioassays based on cost-efficiency and improved sample throughput considerations. For another, PEEP batteries of bioassays might be later designed to focus on specific environmental issues of concern (e.g., genotoxicity, immunotoxicity or endocrine disruption) or designed to target individual trophic levels (e.g., a bioassay battery composed of a suite of phytotoxicity tests and endpoints, if primary producers are deemed of importance in a particular ecosystem). As the demand for improved
BLAISE & FÉRARD86
information on long-term effects of low level of pollutants increases, we can also expect biomarker measurements to complement sensitive bioassays in PEEP scales designed to investigate the potential chronic effects of wastewaters devoid of acute toxicity effects and/or of lotic/lentic receiving systems. What will not change is the genuine usefulness of applying PEEP-based strategies to provide relevant hazard assessment information that should prove to be beneficial for protection and conservation of the aquatic environment.
Acknowledgements
The assistance of François Boudreault and Denise Séguin, Saint-Lawrence Centre, is appreciated for providing assistance in graphics preparation (Figures 1 and 3, respectively). We are also grateful to John Wiley & Sons, Inc. for permission to reproduce Figures 2 and 3 taken from:
• Figure 9 (a, b) on page 3226 of the following publication: Blaise, C., 2002. Use of microscopic algae in toxicity testing, in G. Bitton (ed.), Encyclopedia of Environmental Microbiology, Vol. 6, Wiley Publishers, New York, NY, USA, pp. 3219-3230.
References
Bermingham, N., Costan, G., Blaise, C. and Patenaude, L. (1996) Use of micro-scale aquatic toxicity tests in ecolabelling guidelines for general purpose cleaners, in M. Richardson (ed.), EnvironmentalXenobiotics, Taylor & Francis, 195-212.
Blaise, C., Sergy, G., Wells, P., Bermingham, N. and van Coillie, R. (1988) Biological testing - Development, application and trends in Canadian environmental protection laboratories, ToxicityAssessment 3, 385-406.
Blaise, C. (1991) Microbiotests in aquatic ecotoxicology: characteristics, utility and prospects, Toxicity Assessment 6, 145-155.
Blaise, C. (1996) A micro-scale bioassay approach to industrial effluent assessment and management. Water Report (ISSN 0917-0456), pp. 53-56.
Blaise, C. and Kusui, T. (1997) Acute toxicity assessment of industrial effluents with a microplate-based Hydra attenuata assay, Environmental Toxicology and Water Quality 12, 53-60.
Blaise, C., Gagné, F. and Bombardier, M. (2000) Recent developments in microbiotesting and early millennium prospects, in S. Belkin and S. Gabbay (eds.), Environmental Challenges, Kluwer Academic/Plenum Publishers, pp. 11-23.
Birkholz, D., Belton, K. and Guidotti, T. (2003) Toxicological evaluation for the hazard assessment of tire crumb for use in public playgrounds, Journal of Air & Waste Management Association 53, 903-907.
Costan, G., Bermingham, N., Blaise, C. and Férard, J.F. (1993) Potential ecotoxic effects probe (PEEP): a novel index to assess and compare the toxic potential of industrial effluents, Environmental Toxicology and Water Quality 8, 115-140.
Dutka, B. (1988) Priority setting of hazards in waters and sediments by proposed ranking scheme and battery of tests approach, German Journal of Applied Zoology 75, 303-316.
Environment Canada (1990) Biological test method: reference method for determining acute lethality of effluents to D. magna, Environmental Protection Publications, Environment Canada, Ottawa, EPS Report 1/RM/14, 18 pp.
Environment Canada (1992a) Biological test method: toxicity test using luminescent bacteria (Vibrio fisheri), Environmental Protection Publications, Environment Canada, Ottawa, EPS Report 1/RM/24, 61 pp.
EFFLUENT ASSESSMENT WITH THE PEEP INDEX 87
Environment Canada (1992b) Biological test method: growth inhibition test using the freshwater alga Selenastrum capricornutum, Environmental Protection Publications, Environment Canada, Ottawa, EPS Report 1/RM/25, 41 pp.
Environment Canada (1992c) Biological test method: test of reproduction and survival using the cladoceran Ceriodaphnia dubia, Environmental Protection Publications, Environment Canada, Ottawa, EPS Report 1/RM/21, 71 pp.
Environment Canada (1996) Industrial Plants: highlights of effluent files 1-106, Governments of Canada and Québec, Saint-Lawrence Action Plan Vision 2000, ISBN 0-662-80860-6.
Garric, J, Vindimian, E. and Férard, J.F. (1993) Ecotoxicology and wastewater: some practical applications, Science of The Total Environment Suppl. (Part 2), 1085-1103.
Kusui, T. and Blaise, C. (1999) Ecotoxicological assessment of Japanese industrial effluents using a battery of small-scale toxicity tests, in S.S. Rao (ed.), Impact Assessment of Hazardous Aquatic Contaminants, Ann Arbor Press, Michigan, USA, pp. 161-181.
Kusui, T. (2002) Japanese application of bioassays for environmental management, in The International Conference on Environmental Concerns and Emerging Abatement Technologies 2001: Collection of Short Communications, The Scientific World Journal 2, 537 541.
Legault, R., Blaise, C., Trottier, S. and White, P. (1996) Detecting the genotoxic activity of industrial effluents with the SOS Chromotest microtitration procedure, Environmental Toxicology and Water Quality 11, 151-165.
Pardos, M. and Blaise, C. (1999) Assessment of toxicity and genotoxicity of hydrophobic organic compounds in wastewater, Environmental Toxicology 14, 241-247.
Quillardet, P. Huisman, O., D’Ari, R. and Hofnung, M. (1982) SOS Chromotest, a direct assay of induction of an SOS function in Escherichia coli K-12 to measure genotoxicity, Proceedings ofNational Academy of Science of USA 79, 5971-5975.
Sprague, J.B. and Ramsay, B.A. (1965) Lethal levels of mixed copper-zinc solutions for juvenile salmon,Journal of the Fisheries Research Board of Canada 22, 425-432.
Thériault, F. (1996) La Réduction des rejets liquides toxiques des 50 établissements industriels prioritaires du Plan d'action Saint-Laurent, Rapport-synthèse 1988-1995.- Montréal: Environnement Canada - région de Québec, Direction de la protection de l'environnement; Longueuil : Ministère de l'Environnement et de la Faune du Québec, Direction régionale de la Montérégie, 1996, Saint-Laurent Vision 2000 – volet Protection - 12 pp., tabl. + annexes.
U.S. EPA (U.S. Environmental Protection Agency) (1989) Short-term methods for estimating the chronic toxicity of effluents and receiving waters to freshwater organisms, EPA/600/4-89/001, Office of Research and Development, Cincinnati, OH, 248 pp.
White, P., Rasmussen, J. and Blaise, C. (1996) Sorption of organic genotoxins to particulate matter in industrial effluents, Environmental. Molecular Mutagenesis 27, 140-151.
Abbreviations
EC50
LOECNOEC
Effective concentration at which 50% of exposed organisms are affected Lowest Observed Effect Concentration No Observed Effect Concentration
PEEP Potential Ecotoxic Effects Probe SLAP Saint-Lawrence Action Plan TC Toxic threshold Concentration TU Toxicity Unit.
-