blank portrait word documentwebstore.cwp.nhs.uk/wresreport2018-19.docx · web view2019-10-15 ·...
TRANSCRIPT


Workforce Race Equality Standard 2018-19
The NHS Workforce Race Equality Standard Indicators Workforce IndicatorsFor each of these four workforce indicators, compare the data for White and BME staff1. Percentage of staff in each of the AfC Bands 1-9 and VSM (including executive Board members)
compared with the percentage of staff in the overall workforceNote: Organisations should undertake this calculation separately for nonclinical and for clinical staff
2. Relative likelihood of staff being appointed from shortlisting across all posts3. Relative likelihood of staff entering the formal disciplinary process, as measured by entry into a
formal disciplinary investigation Note: This indicator will be based on data from a two year rolling average of the current year and the previous year
4. Relative likelihood of staff accessing non-mandatory training and CPD
National NHS Staff Survey indicatorsFor each of the four staff survey indicators, compare the outcomes of the responses for White and BME staff.5. KF 25. Percentage of staff experiencing harassment, bullying or abuse from patients, relatives or
the public in last 12 months 6. KF 26. Percentage of staff experiencing harassment, bullying or abuse from staff in last 12
months7. KF 21. Percentage believing that trust provides equal opportunities for career progression or
promotion8. Q217. In the last 12 months have you personally experienced discrimination at work from any of
the following? b) Manager/team leader or other colleagues
Board representation indicatorFor this indicator, compare the difference for White and BME staff9. Percentage difference between the organisations’ Board voting membership and its overall
workforceNote: Only voting members of the Board should be included when considering this indicator

Indicator 1 - Percentage of staff in each of the AfC Bands 1-9 and VSM (including executive Board members) compared with the percentage of staff in the overall workforceClinical or non-clinical BME White Not stated
Clinical Band 1 0.0% 0.0% 0.0%Band 2 0.0% 100.0% 0.0%Band 3 3.0% 95.6% 1.4%Band 4 3.3% 95.6% 1.1%Band 5 2.2% 96.9% 0.9%Band 6 2.1% 95.7% 2.2%Band 7 4.2% 91.5% 4.2%Band 8a 1.0% 97.1% 2.0%Band 8b 16.7% 83.3% 0.0%Band 8c 0.0% 90.0% 10.0%Band 8d 0.0% 100.0% 0.0%Other / Local Pay 2.3% 92.4% 5.3%VSM 0.0% 100.0% 0.0%Medical and Dental 46.7% 52.3% 0.9%of which consultants 47.6% 51.2% 1.2%of which Senior medical manager 50.0% 50.0% 0.0%of which non cons career grades 42.9% 57.1% 0.0%of which trainee grades 46.2% 53.8% 0.0%of which others 0.0% 100.0% 0.0%
Clinical Total 4.6% 93.2% 2.2%Non clinical Band 1 3.2% 94.6% 2.2%
Band 2 3.3% 96.2% 0.5%Band 3 2.3% 97.3% 0.3%Band 4 2.9% 94.9% 2.2%Band 5 1.7% 96.6% 1.7%Band 6 1.4% 95.7% 2.9%Band 7 0.0% 97.6% 2.4%Band 8a 8.7% 87.0% 4.3%Band 8b 0.0% 96.7% 3.3%Band 8c 0.0% 100.0% 0.0%Band 8d 0.0% 0.0% 0.0%Other / Local Pay 0.0% 88.9% 11.1%VSM 0.0% 100.0% 0.0%
Non clinical Total 2.5% 96.1% 1.4%Grand Total 4.0% 94.0% 2.0%

Indicator 2 - Relative likelihood of staff being appointed from shortlisting across all posts
Current Year 2018-19
Shortlisted Appointed Relative Likelihood of Shortlisted/Appointed
White 4544 295 6.49%
BME 378 26 6.88%
Not Stated 150 42 28.00%
I do not wish to disclose 40 4 10.00%
Relative Likelihood of White staff being appointed from shortlisting compared to BME 0.94
Previous Year 2017-18
Shortlisted Appointed Relative Likelihood of Shortlisted/Appointed
White 3111 433 13.92%
BME 264 29 10.98%
Not Stated 43 14 32.56%
I do not wish to disclose 8 2 25.00%
Relative Likelihood of White staff being appointed from shortlisting compared to BME 1.27
The relative likelihood for the current year 2018-19 indicates that BME staff are MORE likely to be appointed when compared to white staff. This is in contrast to the previous year 2017-18 where BME staff were LESS likely to be appointed when compared to white staff

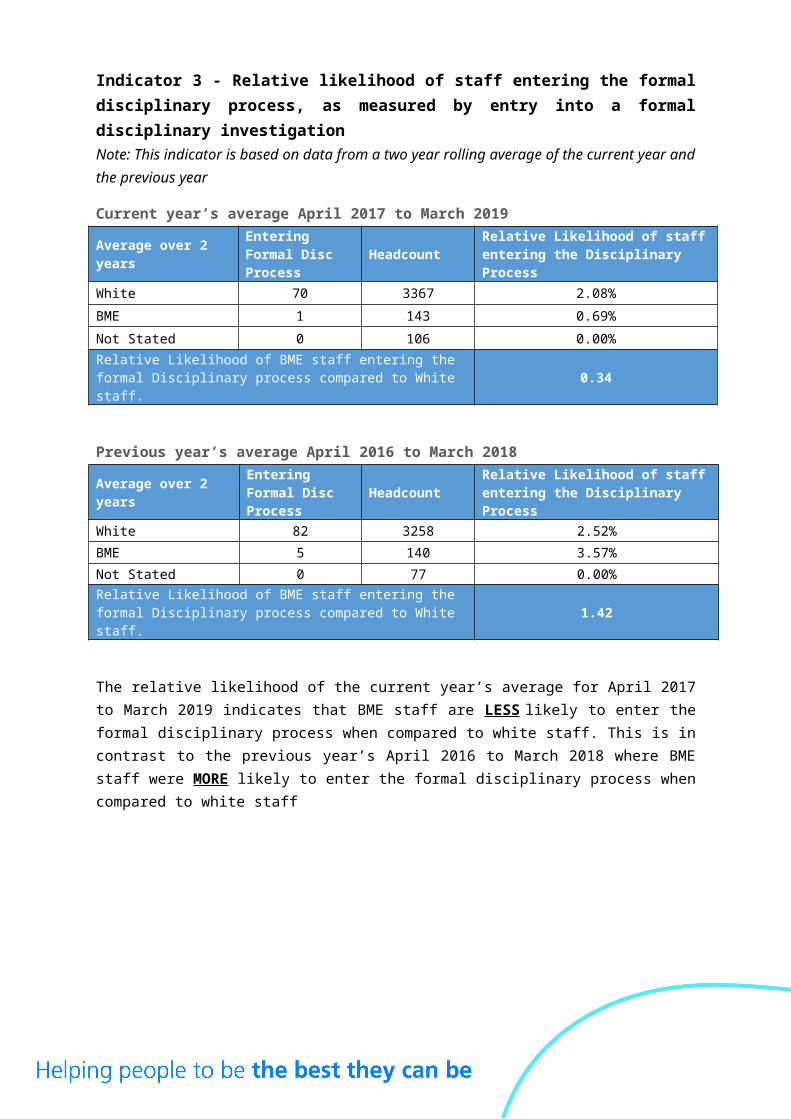
Indicator 3 - Relative likelihood of staff entering the formal disciplinary process, as measured by entry into a formal disciplinary investigationNote: This indicator is based on data from a two year rolling average of the current year and the previous year
Current year’s average April 2017 to March 2019
Average over 2 years Entering Formal Disc Process Headcount Relative Likelihood of staff entering
the Disciplinary Process
White 70 3367 2.08%
BME 1 143 0.69%
Not Stated 0 106 0.00%
Relative Likelihood of BME staff entering the formal Disciplinary process compared to White staff. 0.34
Previous year’s average April 2016 to March 2018
Average over 2 years Entering Formal Disc Process Headcount Relative Likelihood of staff entering
the Disciplinary Process
White 82 3258 2.52%
BME 5 140 3.57%
Not Stated 0 77 0.00%
Relative Likelihood of BME staff entering the formal Disciplinary process compared to White staff. 1.42
The relative likelihood of the current year’s average for April 2017 to March 2019 indicates that BME staff are LESS likely to enter the formal disciplinary process when compared to white staff. This is in contrast to the previous year’s April 2016 to March 2018 where BME staff were MORE likely to enter the formal disciplinary process when compared to white staff

Indicator 4 - Relative likelihood of staff accessing non-mandatory training and CPD
Current Year 2018-19
Accessing non-mand / CPD training Headcount
Relative Likelihood of staff accessing non-mand / CPD training
White 1065 3367 31.63%
BME 53 143 37.06%
Not Stated 26 106 24.52%
Relative Likelihood of White staff accessing non-mand / CPD training. 0.85
Previous Year 2017-18
Accessing non-mand / CPD training Headcount
Relative Likelihood of staff accessing non-mand / CPD training
White 2146 3258 65.86%
BME 117 140 83.57%
Not Stated 42 77 54.54%
Relative Likelihood of White staff accessing non-mand / CPD training. 0.79
The relative likelihood for the current year 2018-19 indicates that BME staff are MORE likely to access non-mandatory training when compared to white staff. This is in keeping to the previous year 2017-18 where BME staff were also MORE likely to access non-mandatory training when compared to white staff.
National NHS Staff Survey indicators
Indicator 5 - KF 25. Percentage of staff experiencing harassment, bullying or abuse from patients, relatives or the public in last 12 months
2018 Survey 2017 Survey 2016 SurveyWhite 24% 24% 27%
BME 31% 42% 40%The results from the latest staff survey indicates that a larger proportion of BME staff have experienced harassment, bullying or abuse from patients, relatives or the public when compared to white staff. This is also the case for the previous 2 years of staff survey results but the percentage is reducing
Indicator 6 - KF 26. Percentage of staff experiencing harassment, bullying or abuse from staff in last 12 months
2018 Survey 2017 Survey 2016 SurveyWhite 13% 17% 16%
BME 9% 17% 15%The results from the latest staff survey indicates a smaller proportion of BME staff have experienced harassment, bullying or abuse from staff when compared to white staff. This is also the case for the previous 2 years of staff survey results.
Indicator 7 - KF 21. Percentage believing that trust provides equal opportunities for career progression or promotion
2018 Survey 2017 Survey 2016 SurveyWhite 90% 90% 91%
BME 82% 90% 97%The results from the latest staff survey indicates that fewer BME staff believe the trust provides equal opportunities for career progression or promotion when compared to white staff. For the previous staff survey in 2017 the figures for both BME and white were the same and in 2016.
The proportion of BME staff that believe the trust provides equal opportunities for career progression has reduced from 97% in 2016 to 82% in 2018.
Indicator 8 - Q217. In the last 12 months, have you personally experienced discrimination at work from any of the following? b) Manager/team leader or other colleagues
2018 Survey 2017 Survey 2016 SurveyWhite 9% 5% 4%
BME 6% 8% 3%

The results from the latest staff survey indicates that fewer BME staff have experience discrimination from their manager when compared to white staff.
Indicator 9 - Percentage difference between the organisations’ Board voting membership and its overall workforce
Current Year 2018-19
Board Member Overall Workforce
Percentage difference between the organisation board voting membership and its overall workforce
White 12 85.71% 3367 93.11% -7.40%
BME 1 7.14% 143 3.95% 3.19%
Not Stated 1 7.14% 106 2.93% 4.21%As at March 2019, the Trust’s Board is made up of 7.14% of BME staff compared with 3.95% of the overall trust. A difference of 3.19%
Previous Year 2017-18
Board Member Overall Workforce
Percentage difference between the organisation board voting membership and its overall workforce
White 12 85.71% 3258 93.76% -8.04%
BME 1 7.14% 140 4.03% 3.11%
Not Stated 1 7.14% 77 2.22% 4.93%
As at March 2018, the Trust’s Board was made up of 7.14% of BME staff compared with 4.03% of the overall trust. A difference of 3.11%