blast parameter optimization study based on a blast crater
TRANSCRIPT

Research ArticleBlast Parameter Optimization Study Based ona Blast Crater Experiment
Xi-liang Zhang,1,2 Hai-bao Yi ,2,3 Hong-haoMa,1,4 and Zhao-wu Shen1
1CAS Key Laboratory of Mechanical Behavior and Design of Materials, University of Science and Technology of China,Anhui, Hefei 230026, China2Sinosteel Maanshan Institute of Mining Research, Co., Ltd., Anhui, Maanshan 243000, China3State Key Laboratory of Safety and Health for Metal Mines, Anhui, Maanshan 243000, China4State Key Laboratory of Fire Science, University of Science and Technology of China, Anhui, Hefei 230026, China
Correspondence should be addressed to Hai-bao Yi; hang [email protected]
Received 16 January 2018; Revised 2 April 2018; Accepted 8 May 2018; Published 5 July 2018
Academic Editor: Elena Dragomirescu
Copyright © 2018 Xi-liang Zhang et al.This is an open access article distributed under the Creative Commons Attribution License,which permits unrestricted use, distribution, and reproduction in any medium, provided the original work is properly cited.
The blasting quality and the rock volume blasted directly affect the cost of mines. A small charge-forward blast crater experimentwas conducted to study the relationships between the rock volume blasted, the explosive unit consumption, the bulk yield, and thedepth ratio. The results showed that the rational resistant line or explosive charge depth should be 0.86 times the optimal resistantline. Based on theoretical analysis of the large spacing of the holes and the small resistance line, the uniformdesignmethodwas usedto conduct the lateral blasting crater tests. The relationship equations among the blasting parameters, the blasting volume, and thebulk yield were obtained by regression analysis. The results illustrated that the rock volume blasted was negatively correlated withthe bulk yield.The contribution rates of the resistance lines and the spacing of the holes to the blasting volume regressionwere 32.4%and 13.9%, respectively, and to the bulk yield regression were 65.0% and 0.256%. The impact of the resistance line on the blastingvolume and the bulk yield was more significant than that of the spacing of the holes. The blasting effect of the rectangular blasthole arrangement was better than that of the square pattern. The blasting technology of large hole spacing and a small resistanceline could achieve a better blasting effect while ensuring a higher rock volume blasted. The economical and reasonable blastingparameters were determined as the hole spacing of a=8.5 m and the resistance line width ofW=5.5 m, with the rock volume blastedof 413.1 m3 and the bulk rate of 0.218%. This method provides an effective method for optimization of the blasting parameters andhas important guiding significance for efficient and economical mining.
1. Introduction
In the mining process, open pits are often faced with theproblem of balancing the blasting quality and the volume ofrock blasted. If the blasting quality is poor, the large blockrate is high, and the block size is not uniform, it will bringdifficulty to the loading and crushing work, resulting in anincrease in production costs. If the blasting quality is goodbut the blasting volume is often low, then the overall cost isstill relatively high.
Therefore, obtaining a better blasting quality, reducing thebulk rate, reducing the unit consumption of explosives, andcontrolling the overall cost are the actual technical problemsthat must be resolved under the condition of ensuring a high
blasting volume. The scientific determination of reasonableblasting parameters is the key to obtaining a good blastingeffect. In the blasting design, the blasting parameters aregenerally selected with reference to the similar conditionsfor the mine; this approach has certain limitations and oftenhas a certain deviation from the actual site. Usually, theblast parameters are not the same, even if the same type ofexplosive is used, because of the different rock characteristics.It is well-known that Livingstone’s blasting crater theory playsan important role in finalizing the blast parameters [1].
Many experts and scholars have conductedmany researchstudies to reduce the blasting cost in the mines; such studiescan be categorized into three types. The first type is blastingcrater theoretical analysis. Mr. W. L. Fourney conducted
HindawiShock and VibrationVolume 2018, Article ID 8031735, 12 pageshttps://doi.org/10.1155/2018/8031735
2 Shock and Vibration
H
h
W
r
R
¦È
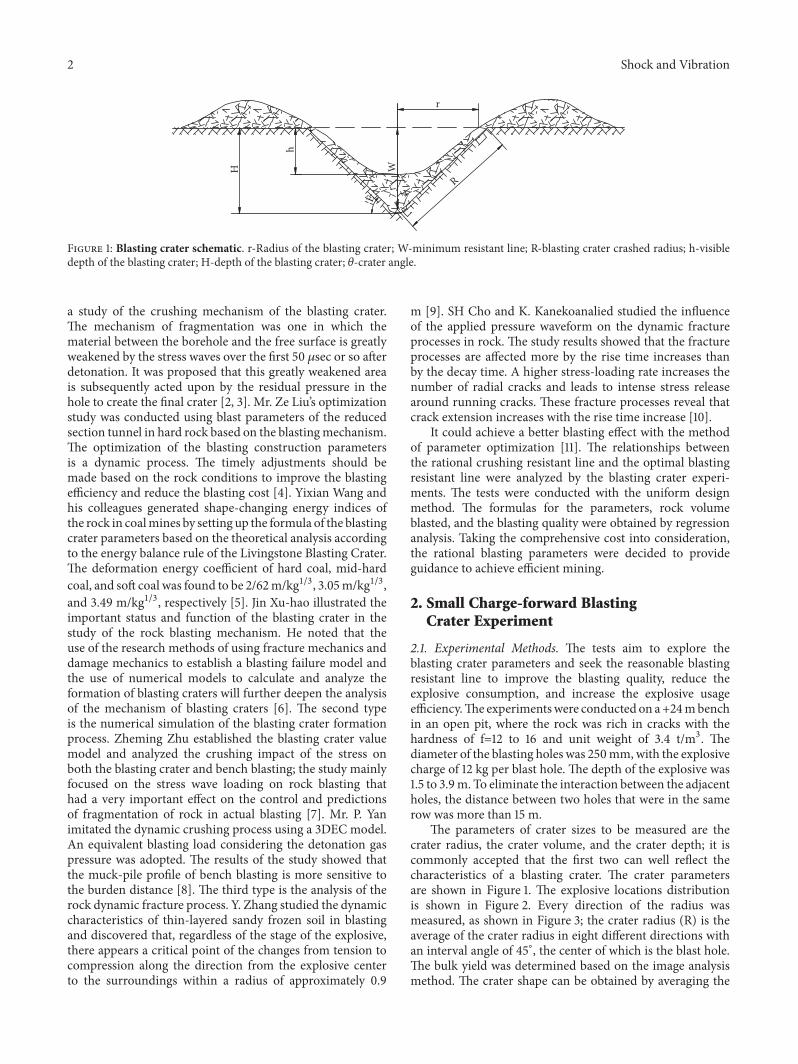
Figure 1: Blasting crater schematic. r-Radius of the blasting crater; W-minimum resistant line; R-blasting crater crashed radius; h-visibledepth of the blasting crater; H-depth of the blasting crater; 𝜃-crater angle.
a study of the crushing mechanism of the blasting crater.The mechanism of fragmentation was one in which thematerial between the borehole and the free surface is greatlyweakened by the stress waves over the first 50 𝜇sec or so afterdetonation. It was proposed that this greatly weakened areais subsequently acted upon by the residual pressure in thehole to create the final crater [2, 3]. Mr. Ze Liu’s optimizationstudy was conducted using blast parameters of the reducedsection tunnel in hard rock based on the blastingmechanism.The optimization of the blasting construction parametersis a dynamic process. The timely adjustments should bemade based on the rock conditions to improve the blastingefficiency and reduce the blasting cost [4]. Yixian Wang andhis colleagues generated shape-changing energy indices ofthe rock in coalmines by setting up the formula of the blastingcrater parameters based on the theoretical analysis accordingto the energy balance rule of the Livingstone Blasting Crater.The deformation energy coefficient of hard coal, mid-hardcoal, and soft coal was found to be 2/62m/kg1/3, 3.05m/kg1/3,and 3.49 m/kg1/3, respectively [5]. Jin Xu-hao illustrated theimportant status and function of the blasting crater in thestudy of the rock blasting mechanism. He noted that theuse of the research methods of using fracture mechanics anddamage mechanics to establish a blasting failure model andthe use of numerical models to calculate and analyze theformation of blasting craters will further deepen the analysisof the mechanism of blasting craters [6]. The second typeis the numerical simulation of the blasting crater formationprocess. Zheming Zhu established the blasting crater valuemodel and analyzed the crushing impact of the stress onboth the blasting crater and bench blasting; the study mainlyfocused on the stress wave loading on rock blasting thathad a very important effect on the control and predictionsof fragmentation of rock in actual blasting [7]. Mr. P. Yanimitated the dynamic crushing process using a 3DEC model.An equivalent blasting load considering the detonation gaspressure was adopted. The results of the study showed thatthe muck-pile profile of bench blasting is more sensitive tothe burden distance [8]. The third type is the analysis of therock dynamic fracture process. Y. Zhang studied the dynamiccharacteristics of thin-layered sandy frozen soil in blastingand discovered that, regardless of the stage of the explosive,there appears a critical point of the changes from tension tocompression along the direction from the explosive centerto the surroundings within a radius of approximately 0.9
m [9]. SH Cho and K. Kanekoanalied studied the influenceof the applied pressure waveform on the dynamic fractureprocesses in rock. The study results showed that the fractureprocesses are affected more by the rise time increases thanby the decay time. A higher stress-loading rate increases thenumber of radial cracks and leads to intense stress releasearound running cracks. These fracture processes reveal thatcrack extension increases with the rise time increase [10].
It could achieve a better blasting effect with the methodof parameter optimization [11]. The relationships betweenthe rational crushing resistant line and the optimal blastingresistant line were analyzed by the blasting crater experi-ments. The tests were conducted with the uniform designmethod. The formulas for the parameters, rock volumeblasted, and the blasting quality were obtained by regressionanalysis. Taking the comprehensive cost into consideration,the rational blasting parameters were decided to provideguidance to achieve efficient mining.
2. Small Charge-forward BlastingCrater Experiment
2.1. Experimental Methods. The tests aim to explore theblasting crater parameters and seek the reasonable blastingresistant line to improve the blasting quality, reduce theexplosive consumption, and increase the explosive usageefficiency.The experimentswere conducted on a+24mbenchin an open pit, where the rock was rich in cracks with thehardness of f=12 to 16 and unit weight of 3.4 t/m3. Thediameter of the blasting holes was 250mm,with the explosivecharge of 12 kg per blast hole. The depth of the explosive was1.5 to 3.9m. To eliminate the interaction between the adjacentholes, the distance between two holes that were in the samerow was more than 15 m.
The parameters of crater sizes to be measured are thecrater radius, the crater volume, and the crater depth; it iscommonly accepted that the first two can well reflect thecharacteristics of a blasting crater. The crater parametersare shown in Figure 1. The explosive locations distributionis shown in Figure 2. Every direction of the radius wasmeasured, as shown in Figure 3; the crater radius (R) is theaverage of the crater radius in eight different directions withan interval angle of 45∘, the center of which is the blast hole.The bulk yield was determined based on the image analysismethod. The crater shape can be obtained by averaging the

Shock and Vibration 3
Table 1: Field experiment results.
No. Explosivedepth L/m
Depthratio△(L/Le)
Crater depthH/m
Crater radiusR/m Crater angle
CratervolumeV/m3
Explosiveconsumption
(kg/m3)Remarks
1 1.5 0.38 1.7 2.0 99.3∘ 7.12 1.692 1.8 0.46 2.0 2.2 95.4∘ 10.14 1.19
3 2.1 0.54 2.4 2.4 90.1∘ 14.46 0.83 Optimal explosivedepth Lj
4 2.5 0.64 2.2 2.0 84.5∘ 9.22 1.325 2.9 0.75 1.9 1.6 80.2∘ 5.09 2.386 3.3 0.84 1.3 1.1 75.1∘ 1.36 9.09
7 3.9 1.00 Max. explosivedepth Le
Figure 2: Distribution of the locations of the explosives.
heights. The volume of the rock blasted was measured by theParabolic Method (i.e., the Simpson Method).
2.2. Experiment Results. The explosive depths were chosenfrom 1.5 m to 3.9 m. Table 1 shows the results of the exper-iment.
The relationship between the characteristics of the craterV/Q (the crater volume blasted by unit explosive charge) andthe depth ratio△ is shown in Figure 4.The relationship curvebetween the unit explosive consumption Q/V and the depthratio is presented in Figure 5.
The maximum explosive charge depth was 3.9 m. Withincreasing depth ratio, the crater volume blasted by unitexplosive V/Q demonstrated a trend of first increasing andthen decreasing.When the explosive depthwas at the optimalvalue of 2.1 m, the value of V/Q reached the maximum of1.21 m3/kg, with the crater volume blasted of 14.46 m3. Withincreasing depth ratio △, the unit explosive consumptionshowed a trend of first decreasing and then increasing. V/Qreached the minimum of 0.83 kg/m3 when the optimalexplosive charge depth was 2.1 m. The bulk yield reachedthe maximum of 0.82% at the explosive depth of 2.1 m (or
Figure 3: Measurement of the crater radius.
0.11
0.42
0.77
1.21
0.85
0.59
0.0
0.2
0.4
0.6
0.8
1.0
1.2
1.4
V/Q
(m3/k
g)
0.4 0.5 0.6 0.7 0.8 0.90.3Depth ratio △
Figure 4: Curve of V/Q versus the depth ratio.

4 Shock and Vibration
9.09
2.381.32
1.691.19
0.83
0
1
2
3
4
5
6
7
8
9
10
Expl
osiv
e con
sum
ptio
n (
)kg
/m3
0.4 0.5 0.6 0.7 0.8 0.90.3Depth ratio △
Figure 5: Curve of the consumption of explosives versus the depthratio.
0.19%
0.23%
0.37%
0.46%
0.82%
0.29%
0.1
0.2
0.3
0.4
0.5
0.6
0.7
0.8
0.9
Bulik
yie
ld (%
)
0.4 0.5 0.6 0.7 0.8 0.90.3Depth ratio △
Figure 6: Curve of the bulk yield versus the depth of the explosives.
at the optimal resistant line), as shown in Figure 6. Whenthe explosive depth was 1.8 m, with the depth ratio 0.46, theunit consumption of explosives reached 1.19 kg/m3, but thecrater volume blasted was high at 10.14 m3. Compared withthe depth of 2.1m, the bulk yield at a depth of 1.8m reduced to0.46%, with the reduction rate of 43.9%.This result illustratedthat reducing the explosive depth or decreasing the resistanceline properly to 1.8 m could still achieve a better blast quality.Here, the ratio of 1.8-m/2.1-m is 0.86.
Obviously, the volume of rock blasted and the blastquality are interassociated and mutually conflicting; thus, itis necessary to balance the relationship between them, asmentioned above. From the perspective of the explosive usageefficiency, the explosive energy implied on the rock crushingis a maximum when the crater volume blasted is the maxi-mum with the minimum unit explosive consumption. Fromthe perspective of the mining operation, the blasting qualitydirectly affects the efficiency of the loading, transportation,and crushing, which requires that the bulk yield should becontrolled and the rational resistant line must be found.
In summary, the depth ratio must be modestly reduced;i.e., the resistant line should be decreased to guarantee thereasonable resistant line and thus modify the blasting qualityin the mining operation. In other words, the optimal blastingquality should be obtained with the premise of achieving arelatively high volume of rock blasted. Based on the analysisabove, the reasonable resistant line or the explosive chargedepth should be 0.86 times the optimal resistant line, fromwhich the advantage of the reduced resistant line can beenjoyed.
3. Theoretical Analysis
3.1. Wave Interference Theory. Research studies have shownthat when a few waves propagate in a medium at the sametime, whether they meet each other or not, they maintainthe original characteristics, including frequency, wavelength,amplitude, and vibration direction. Moreover, they are notaffected by other waves. The vibration of any particle in themeeting area is the synthesis of the vibration caused by eachwave at this point. This rule is called the wave superpositionprinciple or the independent propagation principle of thewave, as shown in Figure 7.
When two waves of the same frequency are superim-posed, the vibrations in some areas are strengthened, thevibrations in some areas are weakened, and the vibration-enhanced area and the vibration-reduced area are separatedfromeach other.This phenomenon is calledwave interference[12–14]. When both wave peaks and (or) both wave troughsof the two waves meet, the vibration is strengthened andthe vibrations at the peaks and troughs are reduced. If thedistance between a certain point to the two wave sources isan integral multiple of the wavelength, then the vibration ofthe point is strengthened; if the difference is an odd multipleof the half wavelength, then the vibration is weakened (seeFigure 8).
Assuming the twowave sources are both simple harmonicvibration, they can be described as follows:
𝑦1 = 𝐴1 cos (𝜔𝑡 + 𝜑1) (1)
𝑦2 = 𝐴2 cos (𝜔𝑡 + 𝜑2) (2)
where A1, A2 are amplitude, 𝜔 is angular frequency, and 𝜑1,𝜑2 are initial phase.If the one wave travels along r1 and the other travels along
r2, meeting at a point P in the same medium (see Figure 9),then the partial vibrations caused by these two waves at pointP are
𝑦1 = 𝐴1 cos(𝜔𝑡 + 𝜑1 − 2𝜋𝑟1𝜆 ) (3)
𝑦2 = 𝐴2 cos(𝜔𝑡 + 𝜑2 − 2𝜋𝑟2𝜆 ) (4)
According to the principle of wave superposition, thecombined vibration at point P is the synthesis of these

Shock and Vibration 5
(a) (b)
(c) (d)
(e)
Figure 7: Wave superposition principle.
Figure 8: Wave interference.
two partial vibrations. The combined vibration equation isexpressed as
𝑦 = 𝑦1 + 𝑦2= 𝐴1 cos(𝜔𝑡 + 𝜙1 − 2𝜋𝑟1𝜆 )
+ 𝐴2 cos(𝜔𝑡 + 𝜙2 − 2𝜋𝑟2𝜆 )(5)
where 𝜆 is wavelength.The combined vibration is still simple harmonic vibration
given by
𝑦 = 𝐴 cos (𝜔𝑡 + 𝜙) (6)
where A is amplitude of the combined vibration and 𝜙 isinitial phase of the combined vibration.
Thus, we have
𝐴 = √𝐴21 + 𝐴22 + 2𝐴1𝐴2 cos(𝜙2 − 𝜙1 − 2𝜋𝑟2 − 𝑟1𝜆 ) (7)
𝜙= arctan 𝐴1 sin (𝜙1 − 2𝜋𝑟1/𝜆) + 𝐴2 sin (𝜙2 − 2𝜋𝑟2/𝜆)𝐴1 cos (𝜙1 − 2𝜋𝑟1/𝜆) + 𝐴2 cos (𝜙2 − 2𝜋𝑟2/𝜆)
(8)
If 𝜙1 = 𝜙2, then set Δs = 𝑟2 − 𝑟1 to express the wavelengthdifference arriving at point P from the two wave sources.
When Δs = 𝑟2 − 𝑟1 = 𝑘𝜆, 𝑘 = 0, ±1, ±2 . . ., A reaches themaximum value, A = A1 + 𝐴2.
When Δs = 𝑟2 − 𝑟1 = (2𝑘 + 1)(𝜆/2), 𝑘 = 0, ±1, ±2..., Areaches the minimum value, A = |A1 − 𝐴2|.3.2. Mechanism of the Large Spacing of Holes and Small Resis-tant Line. The blasting technology of large hole spacing aand small resistant line width W is to enhance the distance

6 Shock and Vibration
Figure 9: Two waves meet at point P.
between two blasting holes that are within the same row andto reduce the distance between two rows under the premiseof keeping the square blasted by each hole constant or slightlyincreased to increase the coefficient of a/W. As shown inFigure 10, with the decrease of resistant line W and increaseof hole spacing a, the two separated blasting craters will beconnected.
It has been proved that this technology is effective inimproving the blasting effect, reducing the unit consumptionof explosives, increasing the amount of detonation, andreducing the blasting cost, as has been well recognized byexperts both at home and abroad.
The blasting mechanism is as follows.(1) The reduction of the resistant line and widening of
the blasting crater angle with the blasting impact index ofn>1 lead to the generation of an arc surface, which creates afavorable crushing condition.(2)The enhanced hole spacing eliminates the stress wave
interaction between adjacent holes and avoids the earlyemission of the blasting gas, thereby prolonging the blastingimpact duration and improving the usage of the blastingenergy.(3)The increase of hole spacing makes the stress reduc-
tion area caused by the interaction between the peak andtrough of the blasting holes’ radiant wave move out ofthe blasting impact area. This approach accomplishes thefollowing: makes full use of the role of explosion stress,increases the uniformity of the block, reduces the bulk rate,and improves the blasting crushing quality.
4. On-Site Lateral Blasting Crater Experiment
4.1. Uniform Design Method. Uniform design is also calledUniform Design Experimentation. Uniform design wasjointly proposed by Professors Fang Kaitai andWang Yuan ofthe Applied Mathematics Institute of the Chinese Academyof Sciences in 1978. Uniform design is an application of the“pseudo-Monte Carlo method” in number theory.
Uniform design is implemented through a set of well-designed tables and only considers the test points evenlydistributed within the test range. The experimental points
Table 2: Evenly designed U5(52) experiment schedule.
No. Holes spacing/m Resistant line/m1 6 5.52 7 6.53 8 54 9 65 10 7
are well balanced and dispersed within the scope of thetest, but they still reflect the main characteristics of thesystem. Uniform design can greatly reduce the number ofexperiments and can achieve the test results by performingat least one test of orthogonal design.
Because the test results do not have the orderly compa-rability of the orthogonal test results, the regression analysismethod is used for the processing of the test results. Usingthe model derived from regression analysis, the importanceof influencing factors can be analyzed. Moreover, the newconditional tests can be estimated, predicted, and optimized.At present, this method has gained international recognitionand has beenwidely used in fields such as aerospace, chemicalengineering, pharmaceuticals, materials, automobiles, andthe environment at home and abroad [15–20].
4.2. Experiment Method. To ensure the high volume of rockblasted with favorable blasting quality, the density of blastingholes must be considered to obtain the optimal combinationof hole spacing and the resistant line. The experiments wereconducted in the Heshangqiao open pit of Nanshan MiningCompany, where the rock hardness is f=8 to 12 and the rockhas good integrity. The diameter of the holes was 200 mm,with the depth of 12.5 m and explosive charge of 180 kgper hole. The rock emulsion explosives used were producedby Maanshan Jiangnan Chemical Co., Ltd. The explosivediameter was 170 mm, with a density of 1.10 g/cm3 ∼ 1.35g/cm3. The detonation speed was ≥3200 m/s.
To reduce the number of experiments performed andreduce the effect on mine production, the uniform designmethod was implemented. Two holes were initiated simulta-neously in each experiment. The program of two factors andfive levels was chosen. The two factors were the hole spacingand the resistant line width.The hole spacing was from 6m to10m, and the resistant line width was from 5m to 7m. A totalof five tests were conducted. Based on the application tableof uniform design, the U5(5
2) test schedule was produced,as shown in Table 2. The blast hole layout is presented inFigure 11.
A picture of the field experiment is shown in Figure 12,and the blasting crushing effect is shown in Figure 13.
4.3. Analysis of the Experimental Results. The experimentalresults are presented in Table 3. The measurement method ofthe crater parameterswas the same as that of the small charge-forward blasting crater experiments.
The choice of regression equation has an important influ-ence on the research results. Through comparative analysis

Shock and Vibration 7
Figure 10: Mechanism of the large hole spacing with a small resistant line (a2 >a1; W2 <W1).
Figure 11: Blast hole layout.
Explosive
Blast hole
Figure 12: Picture of the field experiment.
Bar( Interval 5cm )
Figure 13: Blasting effect.
of each built-in equation, the equation with the highestcoefficient of determination, R2, is chosen as the objectiveequation of this paper under the condition that the regressionequation is significant.(1)The regression equation to be established was
y = b (0) + b (1) ∗ 𝑥 (1) ∧ 2 + b (2) ∗ 𝑥 (2) ∧ 2 (9)
Through the multiple factors regression analysis of theexperiment results, regression coefficients b(i) were
b (0) = −43.6;b (1) = 2.34;b (2) = 9.51.
(10)
Thus, the regression equation for the rock volume blastedwas obtained.
y = −43.6 + 2.34𝑥12 + 9.51𝑥22 (11)
where y is rock volume blasted, m3; x1 is hole spacing, m;and x2 is resistant line, m.
The regression analysis coefficients are shown in Table 4and Figure 14.
The regression formula produced the following signifi-cant results: sample N=5, significance level 𝛼=0.05; test valueFt=82.87; critical value F(0.05,2,2)=19.00; and Ft >F(0.05,2,2).The regression equation was significant.
Sorted by the partial regression quadratic sum, the contri-butions of the resistant line and the hole spacing were 32.4%

8 Shock and Vibration
Table 3: Experiment results.
No. Holes spacinga/m
Resistant lineW/m
Rock volumeblasted Q/m3 Crater angle
Explosiveconsumption
(kg/m3)
BulkYield/%
1 6 5.5 338.3 98∘ 0.532 0.212 7 6.5 463.6 106∘ 0.390 0.333 8 5 350.4 104∘ 0.519 0.184 9 6 467.1 113∘ 0.392 0.255 10 7 670.0 115∘ 0.275 0.42
Table 4: Regression analysis coefficient.
Name 1 2Regression coefficient b(i) b(1)=2.34 b(2)=9.51Standard regression coefficient B(i) B(1)=0.444 B(2)=0.678Partial regression square sum U(i) U(1)=9.79e+3 U(2)=2.28e+4Partial correlation coefficient 𝜌(i) 𝜌(1,2)=0.9593 𝜌(2,1)=0.9819Multiple correlation coefficient R=0.9940 R2=0.9881Regression square sum: U=7.03e+4
Table 5: Regression analysis coefficient.
Name 1 2Regression coefficient b(i) b(1)=2.29e−4 b(2)=9.75e−3Standard regression coefficient B(i) B(1)=5.98e−2 B(2)=0.952Partial regression square sum U(i) U(1)=9.44e−5 U(2)=2.39e−2Partial correlation coefficient 𝜌(i) 𝜌(1, 2)=0.2847 𝜌(2,1)=0.9783Multiple correlation coefficient R=0.9858 R2=0.9717Regression square sum: U=3.68e−2
(U(2)/U) and 13.9% (U(1)/U), respectively. The resistantline’s contribution was larger than that of hole spacing,demonstrating that the resistant line had a greater impact onthe volume of rock blasted.(2) Based on the regression analysis of multiple factors,
the regression equation to be established was
y = b (0) + b (1) ∗ 𝑥 (1) ∧ 2 + b (2) ∗ 𝑥 (2) ∧ 2 (12)
The regression coefficient b(i) was
b (0) = −9.30e−2;b (1) = 2.29e−4;b (2) = 9.75e−3.
(13)
The bulk yield formula was the following:
y = −9.3 × 10⁻² + 2.29 × 10⁻⁴𝑥12 + 9.75 × 10⁻³𝑥22 (14)
where y is rock volume blasted, m3; x1 is hole spacing, m;x2 is resistant line, m.
The regression analysis coefficients are shown in Table 5and Figure 15.
The regression formula produced the following signifi-cant results: sample content N=5; significance level 𝛼=0.05;
test value Ft=34.39; critical value F(0.05,2,2)=19.00; andFt >F(0.05,2,2). This result showed that the regression for-mula is significant.
The contributions of the resistant line and the holespacing (sorted by the partial regression quadratic sum) were65.0% and 0.256%, respectively. The resistant line’s contribu-tion was greater than that of the hole spacing, demonstratingthat the resistant line had a greater impact on the bulk yield.The reduction of the resistant line and increase of the holespacing are beneficial to controlling the bulk yield.
Considering that the resistant line has a greater impacton the volume of rock blasted and the bulk yield than the holespacing, reasonably reducing the resistant line and increasingthe hole spacing at the same time can obtain favorableblasting quality with a high volume of rock blasted. Thus, thetechnology of large hole spacing and a small resistant line isreasonable and practical.
4.4. Determination of the Blasting Parameters. The objectivefunction of total mining cost is
C = C1 + C2 + C3 + C4 + C5 (15)
where C1 is drilling cost, C2 is blast cost, C3 is shovel andloading, C4 is transport cost, and C5 is crushing cost.

Shock and Vibration 9
b(2)=9.51
b(1)=2.34
B(2)=0.678
B(1)=0.444
�휌(1,2)=0.9593U(2)=2.28e+4
U(1)=9.79e+3
�휌(2,1)=0.9819
0
2
4
6
8
10Re
gres
sion
coeffi
cien
t
0.0
0.1
0.2
0.3
0.4
0.5
0.6
0.7
0.8
Stan
dard
regr
essio
n co
effici
ent
0
5000
10000
15000
20000
25000
Part
ial r
egre
ssio
n sq
uare
sum
0.0
0.2
0.4
0.6
0.8
1.0
Part
ial c
orre
latio
n co
effici
ent
Figure 14: Regression analysis coefficient of equation (11).
b(2)=9.75e-3
b(1)=2.29e-4
B(2)=0.952
B(1)=5.98e-2
�휌(1,2)=0.2847
U(2)=2.39e-2
U(1)=9.44e-5
�휌(2,1)=0.9783
0.000
0.002
0.004
0.006
0.008
0.010
0.012
Regr
essio
n co
effici
ent
0.00.10.20.30.40.50.60.70.80.91.01.1
Stan
dard
regr
essio
n co
effici
ent
0.000
0.005
0.010
0.015
0.020
0.025
Part
ial r
egre
ssio
n sq
uare
sum
0.0
0.2
0.4
0.6
0.8
1.0
Part
ial c
orre
latio
n co
effici
ent
Figure 15: Regression analysis coefficient of equation (14).

10 Shock and Vibration
Figure 16: Blasting quality and mining cost.
rock volume blasted bulk yield
393.8m3
0.216%
270
300
330
360
390
420
450
480
510
Rock
vol
ume b
laste
d (m
)3
4.6 4.8 5.0 5.2 5.4 5.6 5.8 6.0 6.2 6.4 6.64.4Resistant line (m)
0.12
0.16
0.20
0.24
0.28
0.32
0.36Bu
lk y
ield
(%)
Figure 17: Curves of the resistance line, blasting volume, and bulkyield (hole spacing a=8 m).
The blasting effect not only reflects the accuracy andrationality of the blasting design parameters and the blastingmethods but also directly affects the subsequent processes,such as shoveling and loading, transportation and crushing,and the total mining cost.
In general, the costs of drilling and blasting increasewith the decrease of blasting quality, and the operating costsof subsequent processes decrease with the improvement ofblasting quality. In theory, there is an “optimum blastingeffect” that makes the total mining cost the lowest (seeFigure 16). On the basis of blasting parameter optimization,the purpose of controlling the comprehensive mining costcan be achieved.
By comparing Figures 17 and 18, under similar hole spac-ing conditions and with the increase of the resistance line,the amounts of blasting volume and bulk yield both increase.To obtain a larger volume of rock blasted, it is appropriateto increase the resistance line. However, to achieve a betterblasting effect and reduce the bulk yield, the resistance lineshould be reduced properly.
413.1m3
rock volume blasted bulk yield
0.218%
270300330360390420450480510540
Rock
vol
ume b
laste
d (m
)3
4.6 4.8 5.0 5.2 5.4 5.6 5.8 6.0 6.2 6.4 6.64.4Resistant line (m)
0.12
0.16
0.20
0.24
0.28
0.32
0.36
Bulk
yie
ld (%
)
Figure 18: Curves of the resistance line, blasting volume, and bulkyield (hole spacing a=8.5 m).
Moreover, if the resistance line is too large, it is difficultto blast the rock, making it not conducive to the formationof a good free surface. Therefore, under the premise ofensuring a higher blasting volume, while the blasting effectis improved, the blasting method of large hole spacing and asmall resistance line is suitable.
According to many years of production practice ofthe Heshangqiao iron mine, comprehensively taking theefficiency of loading/crushing and the total mining costinto consideration, the reasonable and economical blastingparameters are as follows: the hole spacing a=8.5 m andresistant line (distance between rows) W=5.5 m, with theratio a/W=1.55.
Figures 17 and 18 show that, under the condition that thebulk rate remains basically unchanged, when the resistanceline is 5.5 m, the rock volume blasted of a=8.5 m can beincreased from 393.8 m3 of a=8 m to 413.1 m3, representinga 4.9% increase, thus better illustrating the superiority of thedetermined blasting parameters.
4.5. Blasting Quality under the Same Blast Area. Figure 19further verifies the relationships among hole spacing, thevolume of rock blasted and bulk yield, in the case of equalblasting area a×W=46.75 m2 (8.5 m × 5.5 m). In the sameblasting area of 46.75 m2, with the increase of hole spacing,the resistance line decreases correspondingly. Moreover, therock volume blasted and bulk yield simultaneously shows adecreasing trend. The negative correlation between blastingvolume and bulk yield can be obtained.Thus, it is necessary tocomprehensively balance the two relationships above tomakethe best economic benefits for mining production.
4.6. Blasting Quality Comparison with Perfectly Square Pat-terns. The blasting quality and volume of six perfectly squarepatterns were compared, as shown in Table 6 and Figure 20.Here, the hole spacing was equal to the resistance line, a=W.As the hole spacing and the resistance line increase, theblasting volume and the bulk yield increase synchronously.

Shock and Vibration 11
Table 6: The blasting quality of six perfectly square patterns.
Number Holes spacing/m Resistance line/m Blasting area/m2 Rock volume blasted/m3 Bulk yield/%1 4 4 16 146.0 0.0672 5 5 25 252.7 0.1563 6 6 36 383.0 0.2664 6.837 6.837 46.75 510.3 0.3735 7 7 49 537.1 0.3966 8 8 64 714.8 0.546
0.218%
rock volume blastedbulk yield
413.1m3
400
405
410
415
420
425
430
435
Rock
vol
ume b
laste
d (m
)3
8.0 8.1 8.2 8.3 8.4 8.5 8.6 8.7 8.8 8.9 9.0 9.17.9Holes spacing (m)
0.18
0.19
0.20
0.21
0.22
0.23
0.24
0.25
0.26
Bulk
yie
ld (%
)
Figure 19: Curve of the same blasting area of 46.75 m2.
510.3m3
714.8m3
537.1m3
383.0m3
262.7m3
146.0m3
0.373%
0.546%
0.396%
0.266%
0.156%
rock volume blasted bulk yield
0.067%
100
200
300
400
500
600
700
800
Rock
vol
ume b
laste
d (m
)3
0.0
0.1
0.2
0.3
0.4
0.5
0.6
Bulk
yie
ld (%
)
5 6 7 84Holes spacing or Resistance line (m)
Figure 20: The blasting quality of square patterns.
For the perfect square a×W=6.837 m × 6.837 m (area of46.75 m2), the blasting rock volume is 510.3 m3, but the bulkrate reaches 0.373%, which is 71.1% higher than 0.218% ofa×W=8.5 m × 5.5 m, which corresponds to a worse blastingquality.
It can be seen that blasting quality of a rectangle is betterthan that of the square pattern. The rectangle of a×W=8.5 m× 5.5 m had a better blast quality with a large rock volume
blasted. The advantages of large hole spacing with a smallresistance line were proved.
5. Conclusions
(1) The volume of rock blasted and the blast quality areinterassociated and mutually conflicting. To ensure goodblasting quality and reduce the bulk yield, the charge depth orthe resistant line should be reasonably reduced. This rationalresistant line should be 0.86 times the reasonable resistant line(or the optimal charge depth).(2) Uniform design was found to be an effective method
for designing the program of blasting crater experimentsthat can reduce the number of tests, decrease the workloadof blasting parameters optimization, and reduce the laborintensity. R2 of the regression equations for the volume ofrock blasted and the bulk yield were 0.9881 and 0.9717,respectively. The two regression equations are reliable.(3) The contribution rates of the resistance lines and
the spacing of the holes to the blasting volume regressionwere 32.4% and 13.9%, respectively, and to the bulk yieldregression were 65.0% and 0.256%, respectively. The effect ofthe resistance line on the volume of rock blasted and bulk rateis more significant than that of hole spacing. The amount ofblasting is negatively related to the bulk yield.(4) The blasting technology of large hole spacing and a
small resistance line can reduce the bulk yield and improveblasting quality under the condition of ensuring a highblasting volume. The blasting effect of the rectangular blasthole arrangement is better than that of the square pattern.The economically reasonable blasting parameters are definedas a hole spacing of 8.5 m and a resistance line width of5.5 m, with a blasting volume of 413.1 m3 and bulk yield of0.218%. The bulk rate of a perfect square of a×W=6.843 m ×6.837 m (46.75 m2) in the same blasting area reached up to0.373%, which was 71.1% higher than that of an 8.5 m × 5.5 mrectangle.
Data Availability
The data used to support the findings of this study areavailable from the corresponding author upon request.
Conflicts of Interest
The authors declare no conflicts of interest in preparing thisarticle.

12 Shock and Vibration
Acknowledgments
This work was supported by the National Key R&D Programof China (no. 2017YFC0602902), the National Natural Sci-ence Foundation of China (no. 51674229 and no. 51374189),and the Fundamental Research Funds for the Central Univer-sities (no. WK2480000002). The authors acknowledge theirfinancial support of this work.
References
[1] W. Xu-guang, Blasting Manual, Metallurgical Industry Press,Beijing, China, 2010.
[2] W. L. Fourney, R. D. Dick, X. J. Wang, and Y. Wei, “Frag-mentation mechanism in crater blasting,” in Proceedings of theInternational Journal of Rock Mechanics and Mining SciencesGeomechanics Abstracts, vol. 30, pp. 413–429, 1993.
[3] W. L. Fourney, R. D. Dick, and K. R. Y. Simha, “Model study ofcrater blasting,” Rock Mechanics and Rock Engineering, vol. 21,no. 3, pp. 183–205, 1988.
[4] Z. LIU, Z. Chuan-qu, X. Dong-hai, C. Cai-xian, and H. Lei,“Optimized design and practice of blasting parameters for hardrock roadway with small cross-section,” Journal of Mining &Safety Engineering, vol. 24, no. 1, pp. 70–73, 2007 (Chinese).
[5] W. Yi-xian, Y. Yong-qiang, Y. Xiao-lin, and C. Huaibao, “Studyon blasting parameters of coal based on blasting crater test,”Blasting, vol. 27, no. 1, pp. 1–4, 2010 (Chinese).
[6] Y. Zhang and F. Xie, “Theoretical and test study on dynamicucharacteristics of thin-layered sandy frozen soil in blasting,”Journal of Computers, vol. 6, no. 6, pp. 1131–1138, 2011.
[7] Z. Zhe-ming, “Numerical prediction of crater blasting andbench blastisng,” International Journal of Rock Mechanics &Mining Sciences, vol. 46, no. 6, pp. 1088–1096, 2009.
[8] P. Yan, W. Zhou, W. Lu, M. Chen, and C. Zhou, “Simulationof bench blasting considering fragmentation size distribution,”International Journal of Impact Engineering, vol. 90, pp. 132–145,2016.
[9] S. H. Cho and K. Kaneko, “Influence of the applied pressurewaveform on the dynamic fracture processes in rock,” Interna-tional Journal of Rock Mechanics and Mining Sciences, vol. 41,no. 5, pp. 771–784, 2004.
[10] X. H. Jin, “Discussion on blasting crater theory,” Rock & SoilMechanics, vol. 33, pp. 205–208, 2002 (Chinese).
[11] W. Ming-zheng, S. Xiu-zhi, Z. Jian, and Q. Xian-yang, “Multi-planar detection optimization algorithm for the interval charg-ing structure of large-diameter longhole blasting design basedon rock fragmentation aspects,” Engineering Optimization, vol.5, pp. 1–15, 2018.
[12] M. Yamamoto, H. Noda, and K. Kaneko, “Experimental studyon blast vibration control method, which is based upon waveinterference,” Smart Structures & Systems, vol. 59, no. 1, pp. 119–137, 1998.
[13] S. K. Mandal, “Mathematical model to locate interference ofblast waves from multi-hole blasting rounds,” Engineering, vol.4, no. 3, pp. 146–154, 2012.
[14] D. Baratoux and H. J. Melosh, “The formation of shattercones by shock wave interference during impacting,” Earth andPlanetary Science Letters, vol. 216, no. 1-2, pp. 43–54, 2003.
[15] F. Kai-Tai, K. J. L. Dennis, P. Winker, and Y. Zhang, “Uniformdesign: theory and application,”Technometrics, vol. 42, no. 3, pp.237–248, 2000.
[16] Y.-Z. Liang, F. Kai-Tai, and Q.-S. Xu, “Uniform design and itsapplications in chemistry and chemical engineering,” Chemo-metrics Intelligent Laboratory Systems, vol. 58, no. 1, pp. 43–57,2001.
[17] F. Kai-Tai, “The uniform design: Application of number-the-oretic methods in experimental design,” Acta MathematicaeApplicatae Sinica, vol. 3, no. 4, p. 9, 1980.
[18] C.-M. Huang, Y.-J. Lee, D. K. J. Lin, and S-Y. Huang, “Modelselection for support vector machines via uniform design,”Computational Statistics & Data Analysis, vol. 52, no. 1, pp. 335–346, 2007.
[19] J.-P. Wang, Y.-Z. Chen, Y. Wang, S.-J. Yuan, and H.-Q. Yu,“Optimization of the coagulation-flocculation process for pulpmill wastewater treatment using a combination of uniformdesign and response surfacemethodology,”Water Research, vol.45, no. 17, pp. 5633–5640, 2011.
[20] Y. Kuo, T. Yang, B. A. Peters, and I. Chang, “Simulation meta-model development using uniform design and neural networksfor automated material handling systems in semiconductorwafer fabrication,” Simulation Modelling Practice and Theory,vol. 15, no. 8, pp. 1002–1015, 2007.

International Journal of
AerospaceEngineeringHindawiwww.hindawi.com Volume 2018
RoboticsJournal of
Hindawiwww.hindawi.com Volume 2018
Hindawiwww.hindawi.com Volume 2018
Active and Passive Electronic Components
VLSI Design
Hindawiwww.hindawi.com Volume 2018
Hindawiwww.hindawi.com Volume 2018
Shock and Vibration
Hindawiwww.hindawi.com Volume 2018
Civil EngineeringAdvances in
Acoustics and VibrationAdvances in
Hindawiwww.hindawi.com Volume 2018
Hindawiwww.hindawi.com Volume 2018
Electrical and Computer Engineering
Journal of
Advances inOptoElectronics
Hindawiwww.hindawi.com
Volume 2018
Hindawi Publishing Corporation http://www.hindawi.com Volume 2013Hindawiwww.hindawi.com
The Scientific World Journal
Volume 2018
Control Scienceand Engineering
Journal of
Hindawiwww.hindawi.com Volume 2018
Hindawiwww.hindawi.com
Journal ofEngineeringVolume 2018
SensorsJournal of
Hindawiwww.hindawi.com Volume 2018
International Journal of
RotatingMachinery
Hindawiwww.hindawi.com Volume 2018
Modelling &Simulationin EngineeringHindawiwww.hindawi.com Volume 2018
Hindawiwww.hindawi.com Volume 2018
Chemical EngineeringInternational Journal of Antennas and
Propagation
International Journal of
Hindawiwww.hindawi.com Volume 2018
Hindawiwww.hindawi.com Volume 2018
Navigation and Observation
International Journal of
Hindawi
www.hindawi.com Volume 2018
Advances in
Multimedia
Submit your manuscripts atwww.hindawi.com