block 5a dab allocation assistive listening device co ... · pdf file2. objectives the...
TRANSCRIPT

Block 5A DAB Allocation Assistive Listening Device
Co-existence Final Report

This page is intentionally left blank

Contents
Page No.
1. Introduction 4
2. Objectives 5
3. Signal Parameters 5
3.1 Wanted Signal Parameters 5
3.2 Interference Criterion 5
3.3 Unwanted Signal Parameters 6
4. DAB Variation Measurements 6
5. ALD Propagation Measurements 8
6. C/I Protection Ratio Measurements 9
6.1 Equipment Setup 9
6.2 Test Procedure 10
7. Results 11
8. Conclusions 12
Appendix 1 – Predicted Coverage Plots 13
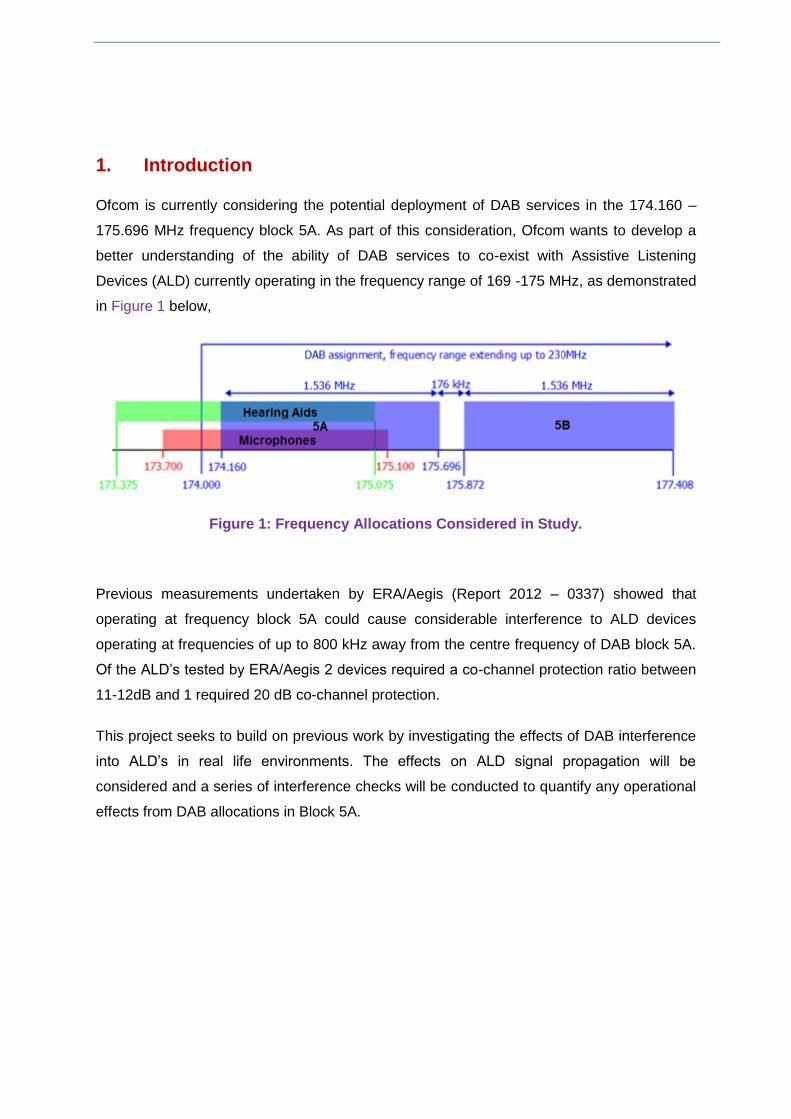
1. Introduction
Ofcom is currently considering the potential deployment of DAB services in the 174.160 –
175.696 MHz frequency block 5A. As part of this consideration, Ofcom wants to develop a
better understanding of the ability of DAB services to co-exist with Assistive Listening
Devices (ALD) currently operating in the frequency range of 169 -175 MHz, as demonstrated
in Figure 1 below,
Figure 1: Frequency Allocations Considered in Study.
Previous measurements undertaken by ERA/Aegis (Report 2012 – 0337) showed that
operating at frequency block 5A could cause considerable interference to ALD devices
operating at frequencies of up to 800 kHz away from the centre frequency of DAB block 5A.
Of the ALD’s tested by ERA/Aegis 2 devices required a co-channel protection ratio between
11-12dB and 1 required 20 dB co-channel protection.
This project seeks to build on previous work by investigating the effects of DAB interference
into ALD’s in real life environments. The effects on ALD signal propagation will be
considered and a series of interference checks will be conducted to quantify any operational
effects from DAB allocations in Block 5A.
2. Objectives
The objectives of the project are to access whether band 5A is available for DAB
multiplexes. This will be done by considering 3 main factors:
DAB variation over test ranges
ALD propagation over test ranges
Confirmation of the ERA/AEGIS C/I protection ratio
3. Signal Parameters
3.1 Wanted Signal Parameters
The wanted signal will be produced via a matched ALD transmitter. This is a mono FM signal
that will be modulated with a 1kHz tone.
3.2 Interference Criterion
Due to the design and operation of ALD’s the effects of interference will be taken
subjectively. The ALD limitations that prohibit a quantitative measurement such as SINAD
are:
Not all ALDs have an audio output connection and if they do they tend to use the
headphone lead as the antenna,
The ALD is designed to operate on a person and a test subject is necessary to re-
create real life operation.
For these reasons the onset of interference for this project is defined as the point at which
the test subject can hear audible interference break through on the ALD when compared to
interference free operation.
It is important to note that the ALD’s are designed to improve the ability of the hard hearing
to understand what is being said and not to act as a radio distribution system. For this
reason the measurement environments will be limited in range and location so that the
device is not being used in a situation where a person would not be expected to reasonably
communicate directly, ie: further than 30 to 40m outside or over the other side of a building
through several walls.
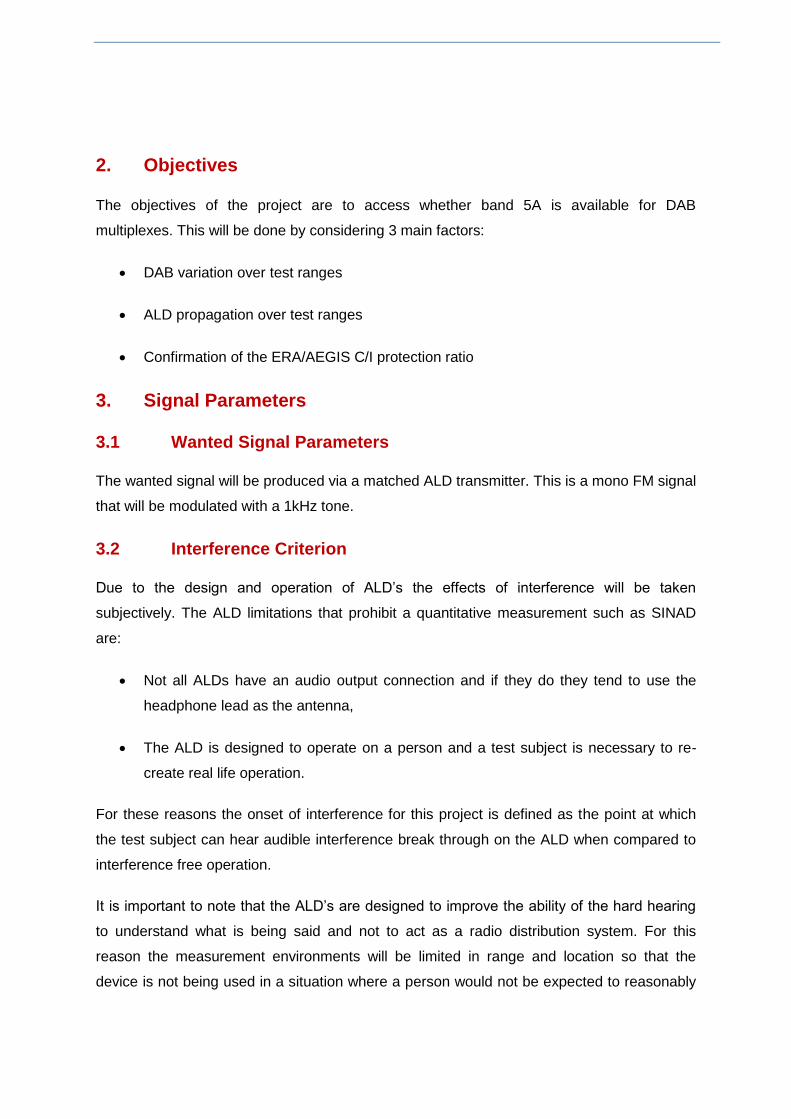
3.3 Unwanted Signal Parameters
The DAB out-of-band emissions have been set to comply with the ‘critical’ mask from EN
300 401, shown below in Figure 2.
Figure 2: EN 300 401 DAB Mask Profile
4. DAB Variation Measurements
Without an operational DAB multiplex being available in Band 5A measurements were made
of signal variation on the multiplexes Digital One (Band 11D – 222.064 MHz) and BBC (Band
12B – 225.648 MHz). The Baldock area is well served by both of these multiplexes. This
aims to give a proxy of signal variation through a building environment of the most
representative available transmission.
Measurements of the BBC and Digital One were carried out around Ofcom’s Baldock
monitoring station. This is a single storey brick built establishment with a variety of room

sizes. These vary from small offices and store rooms through kitchen and conservatory
areas to meeting rooms and large open plan offices. We consider these larger rooms to be
broadly equivalent in size to a classroom. Results for measurements on the BBC multiplex
are shown in Figure 1, below:
Figure 3: DAB Signal Levels for BBC Multiplex
Measurements showed a maximum variation of 16 dB across the measurement range. The
maximum variation observed within the same room was 14 dB.
5m
-63
-70
-73
-68
-72
-63
-72
-69
-73
-76
-71
-77
-66
-75
-71
-75
-72
-74
-69 -66 -68
-73
-63
-74 -69
-74 -69
-67 -68
-68
-78
-71
-76
-71
-68
-79 -74 -74
-70 -69
-75 -75

5. ALD Propagation Measurements
Measurements of the propagation of an ALD transmitter were made in an open field
environment. The measured results have been compared to a representative MUS value to
determine operational range in an interference free environment.
The operational range of the device is shown below, Figure 4, with areas of interference free
audio shown in Green and areas where degradation in audio quality would be expected
highlighted in Red. The Amber region indicates the area that is up to 3 dB above the MUS.
Figure 4: ALD Propagation
The results in Figure 4 show measurements in a 0.5m grid over an area of 20m by 20m (this
area can be seen in the top left region). These measurements indicated that the device was
operating in the expected free space path loss scenario and as such the results were
extrapolated to the maximum operational range. Spot check measurements have been
made to verify the assumption of free space at a range of points covering the extremities of
the test range.
250m
250m
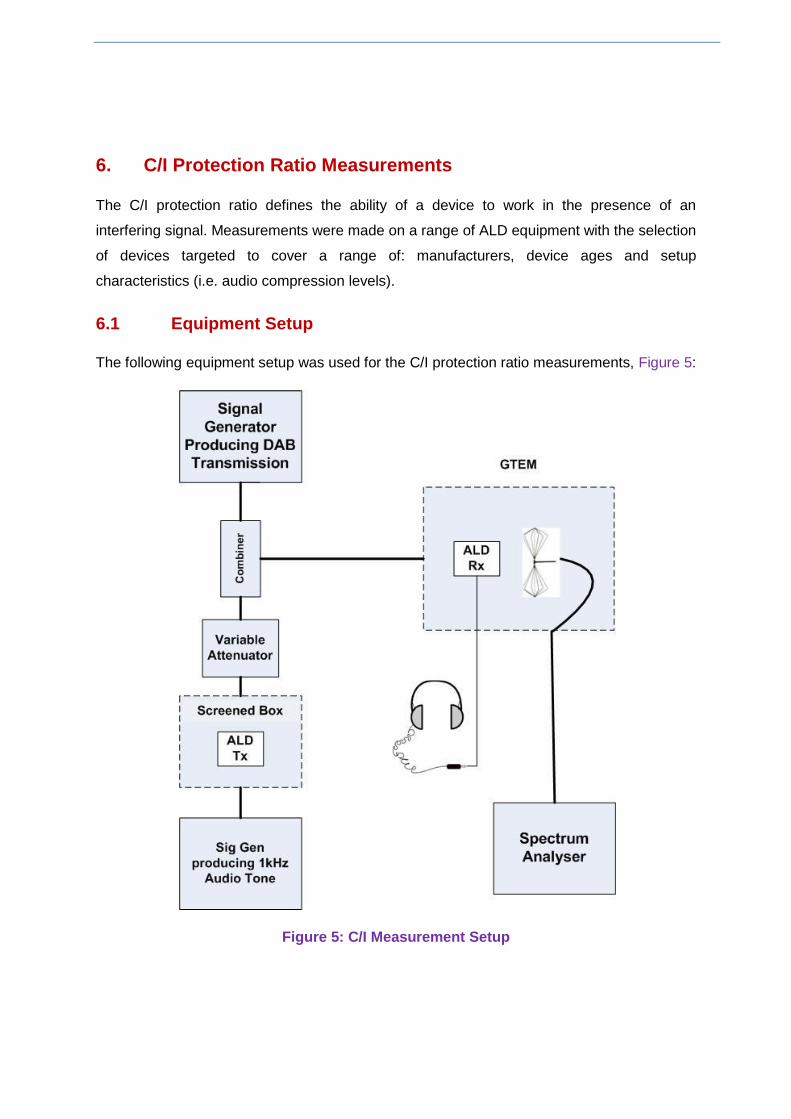
6. C/I Protection Ratio Measurements
The C/I protection ratio defines the ability of a device to work in the presence of an
interfering signal. Measurements were made on a range of ALD equipment with the selection
of devices targeted to cover a range of: manufacturers, device ages and setup
characteristics (i.e. audio compression levels).
6.1 Equipment Setup
The following equipment setup was used for the C/I protection ratio measurements, Figure 5:
Figure 5: C/I Measurement Setup

6.2 Test Procedure
The test procedure for assessing the protection ratios for ALD receivers from DAB
interference is presented below:
1. Set the ALD Tx to the correct channel/frequency offset
2. Set the ALD Rx to the correct channel, this may use the sync function present in
some ALD Tx’s
3. Using the variable attenuator, adjust the ALD level, monitor the audio output to
ensure that interference free audio is received before the introduction of the
unwanted DAB signal
4. Set DAB frequency to required offset
5. Increase DAB signal level until the failure criterion is met (Section 3.2)
6. Turn off ALD and measure the DAB signal level
7. Using the measured values for the wanted and unwanted signals calculate the
C/I protection ratio

7. Results
The measured C/I protection ratios are shown in Figure 6.
Figure 6: C/I Protection Ratio Measurement Results
The results show that for co-channel measurements C/I performance varied between +20
and +27 dB. Co-channel measurement results for an ALD incorporating a very low audio
compression level show an improvement to a C/I to around +4 dB, this result is not being
considered as a typical performance result, although it shows a reduction in audio
compression can significantly improve performance. The ALD incorporating high audio
compression returns the worst co-channel C/I performance of +27 dB.
Measurements in the adjacent channels show an improvement in the C/I. The half bandwidth
of the DAB signal is 768 kHz with adjacent channels being taken as the next ALD channel
after this offset up to the point where the C/I levels out. The worst case returned C/I in this
scenario was +1.3 dB.
For frequency offsets outside of the adjacent channels a failure of the ALD was not possible
due to power limitations on the DAB signal generator. In these cases the ALD was subjected
to the maximum available DAB signal strength and the C/I was taken as a ‘better than’ case.
This is highlighted in Figure 6 by the dashed line. All measurement scenarios for larger
frequency offsets produced a C/I protection ratio of better than -20 dB.
8. Conclusions
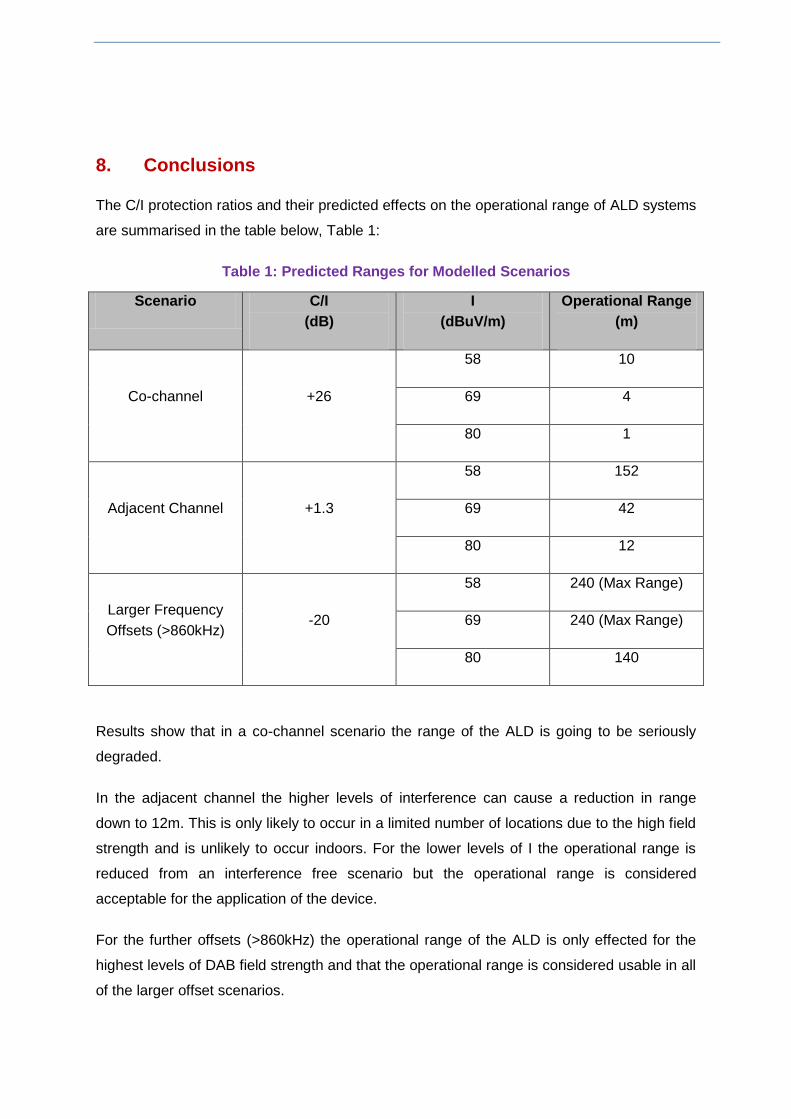
The C/I protection ratios and their predicted effects on the operational range of ALD systems
are summarised in the table below, Table 1:
Table 1: Predicted Ranges for Modelled Scenarios
Scenario C/I
(dB)
I
(dBuV/m)
Operational Range
(m)
Co-channel +26
58 10
69 4
80 1
Adjacent Channel +1.3
58 152
69 42
80 12
Larger Frequency
Offsets (>860kHz) -20
58 240 (Max Range)
69 240 (Max Range)
80 140
Results show that in a co-channel scenario the range of the ALD is going to be seriously
degraded.
In the adjacent channel the higher levels of interference can cause a reduction in range
down to 12m. This is only likely to occur in a limited number of locations due to the high field
strength and is unlikely to occur indoors. For the lower levels of I the operational range is
reduced from an interference free scenario but the operational range is considered
acceptable for the application of the device.
For the further offsets (>860kHz) the operational range of the ALD is only effected for the
highest levels of DAB field strength and that the operational range is considered usable in all
of the larger offset scenarios.

Appendix 1 – Predicted Coverage Plots
Table 2: Predicted Coverage Plots in the Presence of a Co-channel Interferer
Coverage Plot Scenario Details
C/I = +26 dB
I = +58 dBuV/m
Operational Range = 10m
C/I = +26 dB
I = +69 dBuV/m
Operational Range = 4m
C/I = +26 dB
I = +80 dBuV/m
Operational Range = 1m

Table 3: Predicted Coverage Plots in the Presence of an Adjacent Channel Interferer
Coverage Plot Scenario Details
C/I = +1.3 dB
I = +58 dBuV/m
Operational Range = 152m
C/I = +1.3 dB
I = +69 dBuV/m
Operational Range = 42m
C/I = +1.3 dB
I = +80 dBuV/m
Operational Range = 12m

Table 4: Predicted Coverage Plots for Larger Frequency Offsets
Coverage Plot Scenario Details
C/I = -20 dB
I = +58 dBuV/m
Operational Range = 240m (limited by MUS)
C/I = -20 dB
I = +69 dBuV/m
Operational Range = 240m (limited by MUS)
C/I = -20 dB
I = +80 dBuV/m
Operational Range = 140m
Annex One Possible DAB to ALD interference scenario for Suffolk In order to quantify the possible impact of a block 5A local DAB service on assistive listening devices (ALD) a desktop analysis has been carried out for the county of Suffolk. This area has been chosen as it presently has an internationally recorded allocation on this frequency block. This work has been carried out using the ATDI ICSTelecom frequency planning tool used by Ofcom for the service planning of broadcast radio. Since many ALDs are used in a teaching environment and these locations will generally be the ‘hotspots’ for their use, the study is based around a school environment. The three specific scenarios we have considered are intended to model:
a ground floor classroom where a range of up to 10 metres is required,
an average size hall or lecture theatre located on the ground floor but with a range of up to 25 metres and,
an outdoor sports coaching environment where a range of 40 metres is required. While the interference-free range of an ALD might be significantly greater than this, we suggest that this is a reasonable maximum range over which a person with normal hearing would be able to communicate. It approximates to a distance of around half the length of a football pitch.
In many situations, these scenarios can map directly to a social or work setting. Over shorter ALD transmitter-receiver ranges than those studied, we would expect the wanted signal level to increase quickly. However, due the relatively minor change in the distance to the broadcast transmitter, the interfering signal would be expected to remain constant. Assumptions used in the assessment In order to carry out this interference assessment, a number of assumptions have been made about the ALD and the DAB environment within which it is used. ALD signal propagation; It has been assumed that over the short ranges under consideration the ALD signal will propagate in accordance with free-space calculations. This is in line with the measurements made within the main Ofcom report. ALD transmit power: many ALDs can change their transmit powers and in order to assess this, three different powers have been used in these scenarios. These powers are 0.1 mW, 1 mW and the maximum allowed power of 2 mW. The lower power of 0.1 mW is frequently used in order to prolong transmitter battery life. Body / head loss; it is known that the orientation of those wearing the listening device or the transmitter to each other will have an effect on reception and this will change dynamically. Such a situation would be where a teacher wearing a transmitter may turn away from students in order to write on a white board. We would suggest that most communication is face to face where such losses have much less effect and that is assumed in this work. Building penetration loss: for domestic premises a building loss of 8 dB is generally assumed and we have applied this for these scenarios. This value can vary significantly but is considered to be at the lower level of loss. For example recent building construction methods and requirements for insulation have led to metal foil backed insulation and windows with reflective coatings, and these have increased losses dramatically. DAB signal level: the field strength for each transmitter has been calculated across the whole county using ICSTelecom. This calculation takes account of both terrain and the type of ground cover (e.g. buildings, woodland, water, etc.) over which the signal propagates. The signals from all

transmitters have then been power summed at each map pixel in order to derive the total DAB signal level. DAB transmitter network; no service has yet been licensed for the Suffolk county so a theoretical network of 15 transmitters derived primarily from existing broadcast sites has been used. The final network will be different and the effect at specific locations could vary markedly to those shown in these scenarios. However, it will give a reasonable proxy for an actual DAB transmitter network. Height loss; all DAB coverage predictions are carried out to a receiver aerial height of 10 metres above ground. In order to adjust this to 1.5 metres (ground level use where most ALDs will be used) we have applied the 10dB height loss used in broadcasting. For a first floor room the level of incoming DAB interference would be expected to be a few dBs higher. Narrowband fading; under normal operating conditions, narrowband FM devices, such as ALDs, are subject to very small zones of localised fading. These are very difficult to model and no allowance has been made for them. Relationship between ALD devices and DAB Block 5A; the frequency which the ALD is tuned to will fall into one of the three relationships with DAB block 5A which are shown below.
1. Co frequency, where the ALD signal is completely within the DAB block - shown in red. 2. Near adjacent, where the ALD signal as at the edge of the DAB block and some interaction
occurs - shown in yellow. 3. Over 150 kHz from the DAB signal where there is limited impact on the ALD; shown
unshaded. Assistive Listening device channels
Table two, frequency
relationship between ALD
channels and DAB block 5A
Maps of the scenarios The following maps show the coverage of the notional local DAB network and the possible interference zones for ALDs receiving at the edge of the coverage range. The ten maps show the following:
Map One: the noise-limited coverage of the DAB network showing mobile, usable indoor and robust indoor coverage. While this is not an implemented network, it is a realistic one that could be built in order to provide near universal DAB coverage to the county of Suffolk.
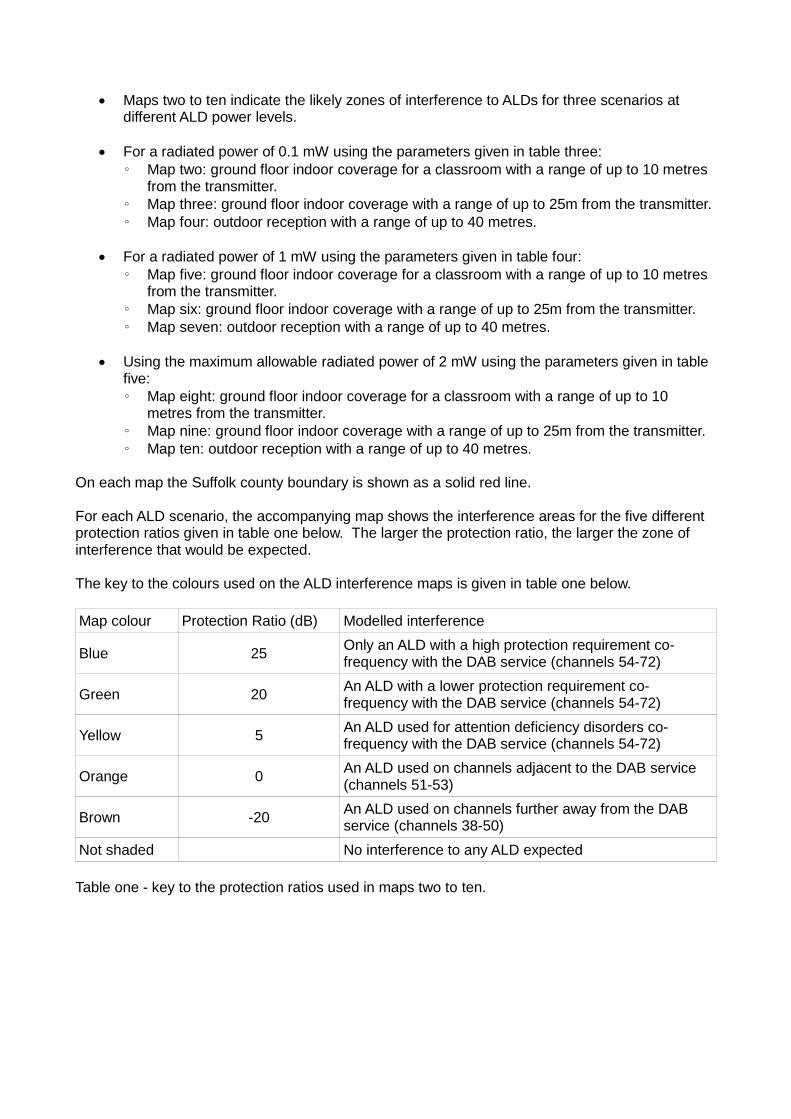
Maps two to ten indicate the likely zones of interference to ALDs for three scenarios at different ALD power levels.
For a radiated power of 0.1 mW using the parameters given in table three:
◦ Map two: ground floor indoor coverage for a classroom with a range of up to 10 metres from the transmitter.
◦ Map three: ground floor indoor coverage with a range of up to 25m from the transmitter.
◦ Map four: outdoor reception with a range of up to 40 metres.
For a radiated power of 1 mW using the parameters given in table four:
◦ Map five: ground floor indoor coverage for a classroom with a range of up to 10 metres from the transmitter.
◦ Map six: ground floor indoor coverage with a range of up to 25m from the transmitter.
◦ Map seven: outdoor reception with a range of up to 40 metres.
Using the maximum allowable radiated power of 2 mW using the parameters given in table five:
◦ Map eight: ground floor indoor coverage for a classroom with a range of up to 10 metres from the transmitter.
◦ Map nine: ground floor indoor coverage with a range of up to 25m from the transmitter.
◦ Map ten: outdoor reception with a range of up to 40 metres.
On each map the Suffolk county boundary is shown as a solid red line. For each ALD scenario, the accompanying map shows the interference areas for the five different protection ratios given in table one below. The larger the protection ratio, the larger the zone of interference that would be expected. The key to the colours used on the ALD interference maps is given in table one below.
Map colour Protection Ratio (dB) Modelled interference
Blue 25 Only an ALD with a high protection requirement co-frequency with the DAB service (channels 54-72)
Green 20 An ALD with a lower protection requirement co-frequency with the DAB service (channels 54-72)
Yellow 5 An ALD used for attention deficiency disorders co-frequency with the DAB service (channels 54-72)
Orange 0 An ALD used on channels adjacent to the DAB service (channels 51-53)
Brown -20 An ALD used on channels further away from the DAB service (channels 38-50)
Not shaded No interference to any ALD expected
Table one - key to the protection ratios used in maps two to ten.

Derivation of maximum DAB signal levels The parameters used to derive the DAB interference field strengths for each of the three ALD power scenarios are given in the three following tables.
Environment
Indoor Outdoor
Building loss (dB)
Range 10 metres Range 25 metres Building
loss (dB)
Range 40 metres
Protection Ratio (dB)
Height adjustment
(dB)
ALD signal level (dB)
Max. DAB
signal level (dB)
ALD signal level (dB)
Max. DAB
signal level (dB)
ALD signal level (dB)
Max. DAB signal
level (dB)
25 -10 -8 77 70 69 62 0 65 50
20 -10 -8 77 75 69 67 0 65 55
5 -10 -8 77 90 69 82 0 65 70
0 -10 -8 77 95 69 87 0 65 75
-20 -10 -8 77 115 69 107 0 65 95
Table three - parameters used in the 0.1 mW scenarios.
Environment
Indoor Outdoor
Building loss (dB)
Range 10 metres Range 25 metres Building
loss (dB)
Range 40 metres
Protection Ratio (dB)
Height adjustment
(dB)
ALD signal level (dB)
Max. DAB
signal level (dB)
ALD signal level (dB)
Max. DAB
signal level (dB)
ALD signal level (dB)
Max. DAB signal
level (dB)
25 -10 -8 87 80 79 72 0 75 60
20 -10 -8 87 85 79 77 0 75 65
5 -10 -8 87 100 79 92 0 75 80
0 -10 -8 87 105 79 97 0 75 85
-20 -10 -8 87 125 79 117 0 75 105
Table four - parameters used in the 1 mW scenarios.
Environment
Indoor Outdoor
Building loss (dB)
Range 10 metres Range 25 metres Building
loss (dB)
Range 40 metres
Protection Ratio (dB)
Height adjustment
(dB)
ALD signal level (dB)
Max. DAB
signal level (dB)
ALD signal level (dB)
Max. DAB
signal level (dB)
ALD signal level (dB)
Max. DAB signal
level (dB)
25 -10 -8 90 83 82 75 0 78 63
20 -10 -8 90 88 82 80 0 78 68
5 -10 -8 90 113 82 95 0 78 83
0 -10 -8 90 118 82 100 0 78 88
-20 -10 -8 90 128 82 120 0 78 108
Table five parameters used in the 2 mW scenarios.

How to read the maps Map One This map shows the coverage of the theoretical DAB network which can be seen to deliver usable DAB coverage over most of the county. As with any radio system, there will be areas where coverage is less than ideal, however, given practical and commercial constraints more extensive coverage may not be achievable. Maps two to ten These maps show the zones where interference is predicted to occur to ALDs at differing protection ratios. For example in the areas shaded green, devices requiring a protection ratio of 20 or 25 dBs may be affected although devices used for attention deficiency disorders or on adjacent channels should be unimpaired. In areas with no shading, all ALDs operating at or within the scenario criteria should be unaffected by the DAB signal. Conclusions These scenarios are based on the results of studies carried out by both ERA/Aegis and Ofcom. They indicate that if the use of the internationally assigned DAB block 5A allocation in Suffolk were to be allowed, there is predicted to be considerable impact on use of 19 of the 35 ALD channels. Three other channels would also be affected to a lesser extent with the remaining 13 being unaffected unless used very close to the broadcast transmitter site. These scenarios also indicate that the impact on some channels would occur beyond the county boundary. This is particularly noticeable where coverage is required outdoors over longer ranges. In general it is not possible to use immediately adjacent ALD channels at the same venue. So at a location where 13 channels are available, only 7 separate ALD services can normally be used. This could be an issue at schools where ‘Sound Field’ systems are deployed in many classrooms, where multiple classes use an ALD or where several frequencies are needed for group work. However, in locations where only a few frequencies are required; for example a church, it is likely that even with block 5A DAB present, enough frequencies would be available to satisfy demand. While actual real block 5A transmission network is yet to be proposed, there would be a need to deliver high DAB field strengths in urban environments in order to deliver the DAB service. Such areas would include Bury St Edmunds, Ipswich & Lowestoft. This means that we would generally expect there to be fewer ALD frequencies available in areas of highest demand.
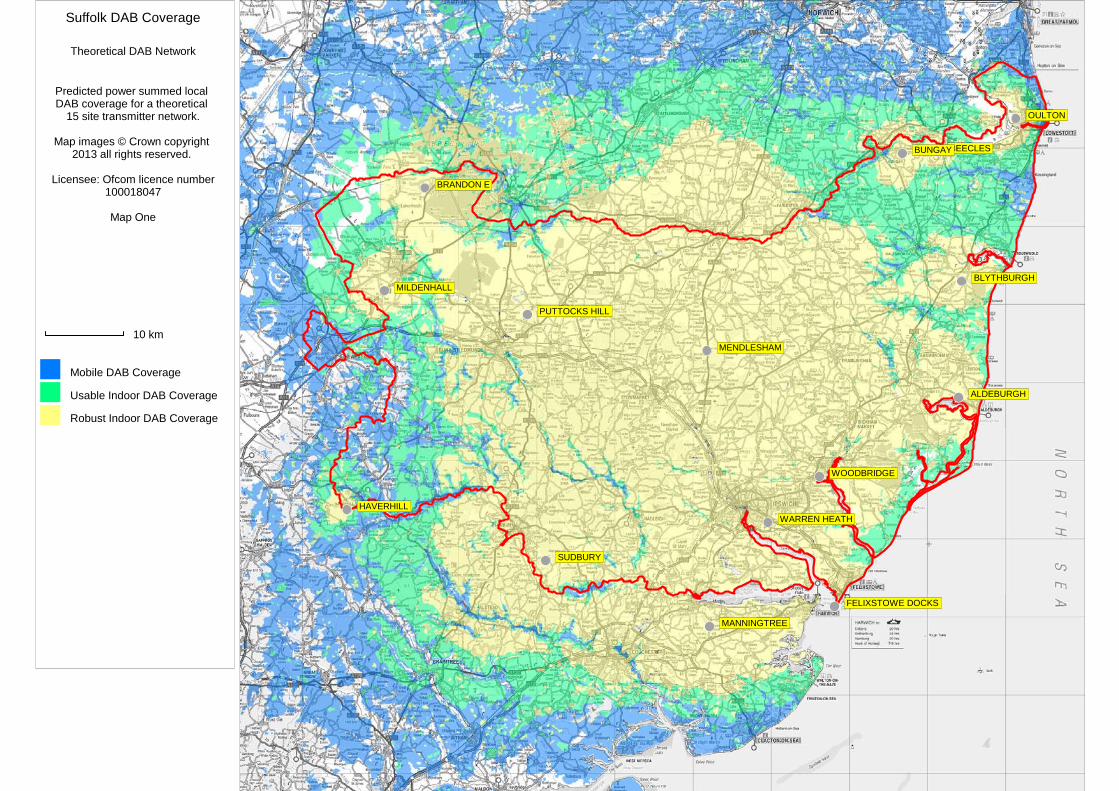
Suffolk DAB Coverage
Theoretical DAB Network
Predicted power summed local DAB coverage for a theoretical
15 site transmitter network.
Map images © Crown copyright 2013 all rights reserved.
Licensee: Ofcom licence number100018047
Map One
10 km
Mobile DAB Coverage
Usable Indoor DAB Coverage
Robust Indoor DAB Coverage
ALDEBURGH
BEECLES
BLYTHBURGH
BRANDON E
BUNGAY
FELIXSTOWE DOCKS
HAVERHILL
MILDENHALL
OULTON
PUTTOCKS HILL
SUDBURY
WARREN HEATH
WOODBRIDGE
MANNINGTREE
MENDLESHAM

Indoor 10 m range scenario
0.1 mW interference zones
Indicative interference areas forALDs used indoors at a range of 10metres from a 0.1 mW transmitter
interfered with by the theoretical DABtransmitter network.
Map images © Crown copyright 2013all rights reserved.
Licensee: Ofcom licence number100018047
Map two
10 km
25 dB Protection Ratio
20 dB Protection Ratio
5 dB Protection Ratio
0 dB Protection Ratio
-20 dB Protection Ratio
ALDEBURGH
BEECLES
BLYTHBURGH
BRANDON E
BUNGAY
FELIXSTOWE DOCKS
HAVERHILL
MILDENHALL
OULTON
PUTTOCKS HILL
SUDBURY
WARREN HEATH
WOODBRIDGE
MANNINGTREE
MENDLESHAM

Indoor 25 m range scenario
0.1 mW interference zones
Indicative interference areas forALDs used indoors at a range of 10metres from a 0.1 mW transmitter
interfered with by the theoretical DABtransmitter network.
Map images © Crown copyright 2013all rights reserved.
Licensee: Ofcom licence number100018047
Map three
10 km
25 dB Protection Ratio
20 dB Protection Ratio
5 dB Protection Ratio
0 dB Protection Ratio
-20 dB Protection Ratio
ALDEBURGH
BEECLES
BLYTHBURGH
BRANDON E
BUNGAY
FELIXSTOWE DOCKS
HAVERHILL
MILDENHALL
OULTON
PUTTOCKS HILL
SUDBURY
WARREN HEATH
WOODBRIDGE
MANNINGTREE
MENDLESHAM

Outdoor 40 m range scenario
0.1 mW interference zones
Indicative interference areas forALDs used outside at a range of 40metres from a 0.1 mW transmitter
interfered with by the theoretical DABtransmitter network.
Map images © Crown copyright 2013all rights reserved.
Licensee: Ofcom licence number100018047
Map four
10 km
25 dB Protection Ratio
20 dB Protection Ratio
5 dB Protection Ratio
0 dB Protection Ratio
-20 dB Protection Ratio
ALDEBURGH
BEECLES
BLYTHBURGH
BRANDON E
BUNGAY
FELIXSTOWE DOCKS
HAVERHILL
MILDENHALL
OULTON
PUTTOCKS HILL
SUDBURY
WARREN HEATH
WOODBRIDGE
MANNINGTREE
MENDLESHAM

Indoor 10 m range scenario
1 mW interference zones
Indicative interference areas forALDs used indoors at a range of 10
metres from a 1 mW transmitterinterfered with by the theoretical DAB
transmitter network.
Map images © Crown copyright 2013all rights reserved.
Licensee: Ofcom licence number100018047
Map five
10 km
25 dB Protection Ratio
20 dB Protection Ratio
5 dB Protection Ratio
0 dB Protection Ratio
-20 dB Protection Ratio
ALDEBURGH
BEECLES
BLYTHBURGH
BRANDON E
BUNGAY
FELIXSTOWE DOCKS
HAVERHILL
MILDENHALL
OULTON
PUTTOCKS HILL
SUDBURY
WARREN HEATH
WOODBRIDGE
MANNINGTREE
MENDLESHAM

Indoor 25 m range scenario
1 mW interference zones
Indicative interference areas forALDs used indoors at a range of 10
metres from a 1 mW transmitterinterfered with by the theoretical DAB
transmitter network.
Map images © Crown copyright 2013all rights reserved.
Licensee: Ofcom licence number100018047
Map six
10 km
25 dB Protection Ratio
20 dB Protection Ratio
5 dB Protection Ratio
0 dB Protection Ratio
-20 dB Protection Ratio
ALDEBURGH
BEECLES
BLYTHBURGH
BRANDON E
BUNGAY
FELIXSTOWE DOCKS
HAVERHILL
MILDENHALL
OULTON
PUTTOCKS HILL
SUDBURY
WARREN HEATH
WOODBRIDGE
MANNINGTREE
MENDLESHAM
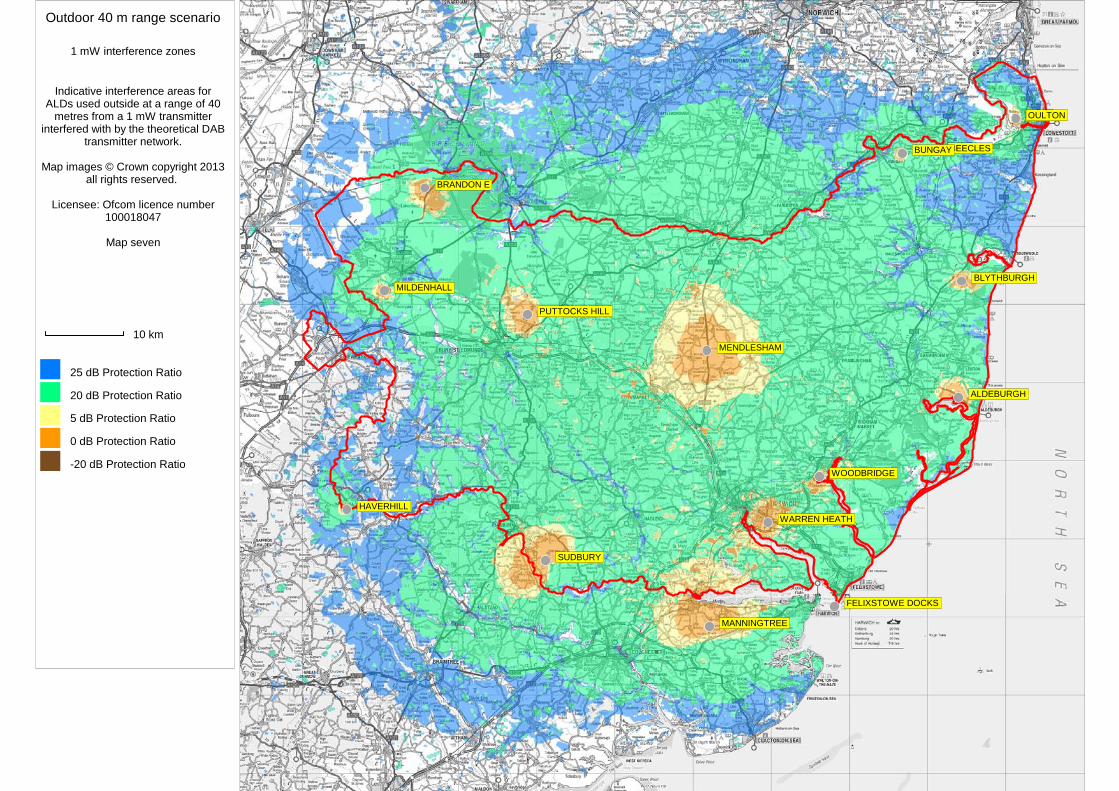
Outdoor 40 m range scenario
1 mW interference zones
Indicative interference areas forALDs used outside at a range of 40
metres from a 1 mW transmitterinterfered with by the theoretical DAB
transmitter network.
Map images © Crown copyright 2013all rights reserved.
Licensee: Ofcom licence number100018047
Map seven
10 km
25 dB Protection Ratio
20 dB Protection Ratio
5 dB Protection Ratio
0 dB Protection Ratio
-20 dB Protection Ratio
ALDEBURGH
BEECLES
BLYTHBURGH
BRANDON E
BUNGAY
FELIXSTOWE DOCKS
HAVERHILL
MILDENHALL
OULTON
PUTTOCKS HILL
SUDBURY
WARREN HEATH
WOODBRIDGE
MANNINGTREE
MENDLESHAM

Indoor 10 m range scenario
2 mW interference zones
Indicative interference areas forALDs used indoors at a range of 10
metres from a 2 mW transmitterinterfered with by the theoretical DAB
transmitter network.
Map images © Crown copyright 2013all rights reserved.
Licensee: Ofcom licence number100018047
Map eight
10 km
25 dB Protection Ratio
20 dB Protection Ratio
5 dB Protection Ratio
0 dB Protection Ratio
-20 dB Protection Ratio
ALDEBURGH
BEECLES
BLYTHBURGH
BRANDON E
BUNGAY
FELIXSTOWE DOCKS
HAVERHILL
MILDENHALL
OULTON
PUTTOCKS HILL
SUDBURY
WARREN HEATH
WOODBRIDGE
MANNINGTREE
MENDLESHAM
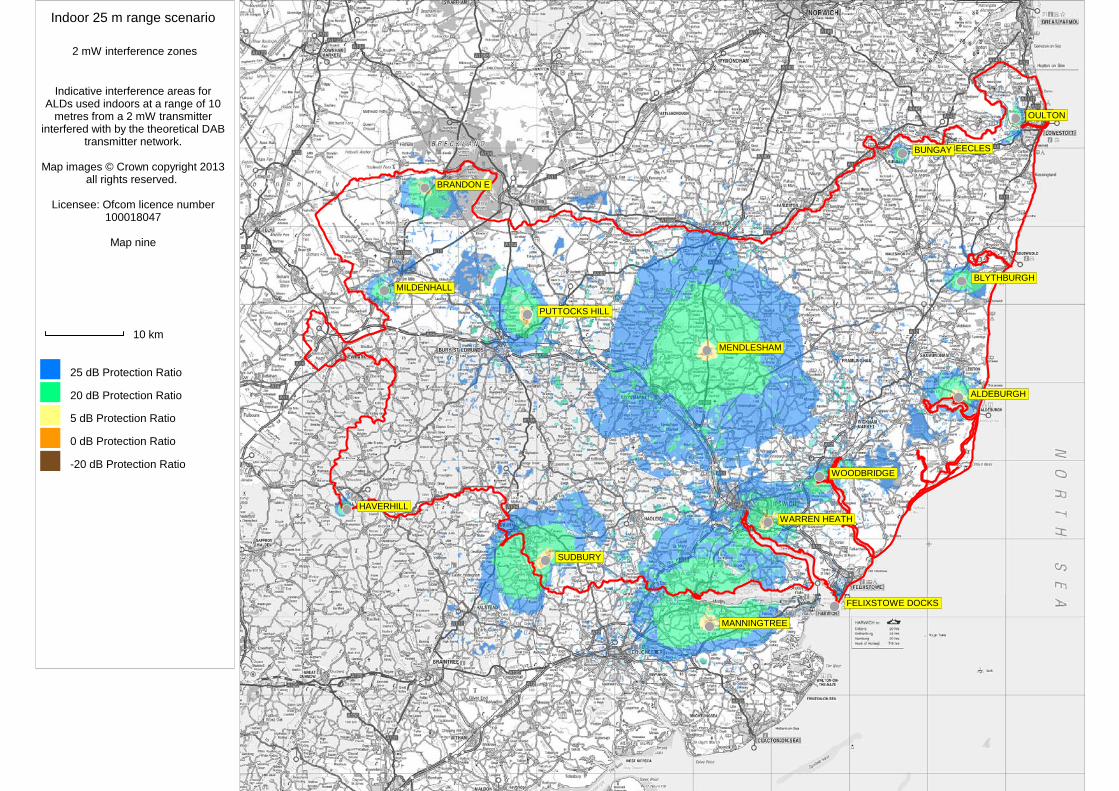
Indoor 25 m range scenario
2 mW interference zones
Indicative interference areas forALDs used indoors at a range of 10
metres from a 2 mW transmitterinterfered with by the theoretical DAB
transmitter network.
Map images © Crown copyright 2013all rights reserved.
Licensee: Ofcom licence number100018047
Map nine
10 km
25 dB Protection Ratio
20 dB Protection Ratio
5 dB Protection Ratio
0 dB Protection Ratio
-20 dB Protection Ratio
ALDEBURGH
BEECLES
BLYTHBURGH
BRANDON E
BUNGAY
FELIXSTOWE DOCKS
HAVERHILL
MILDENHALL
OULTON
PUTTOCKS HILL
SUDBURY
WARREN HEATH
WOODBRIDGE
MANNINGTREE
MENDLESHAM
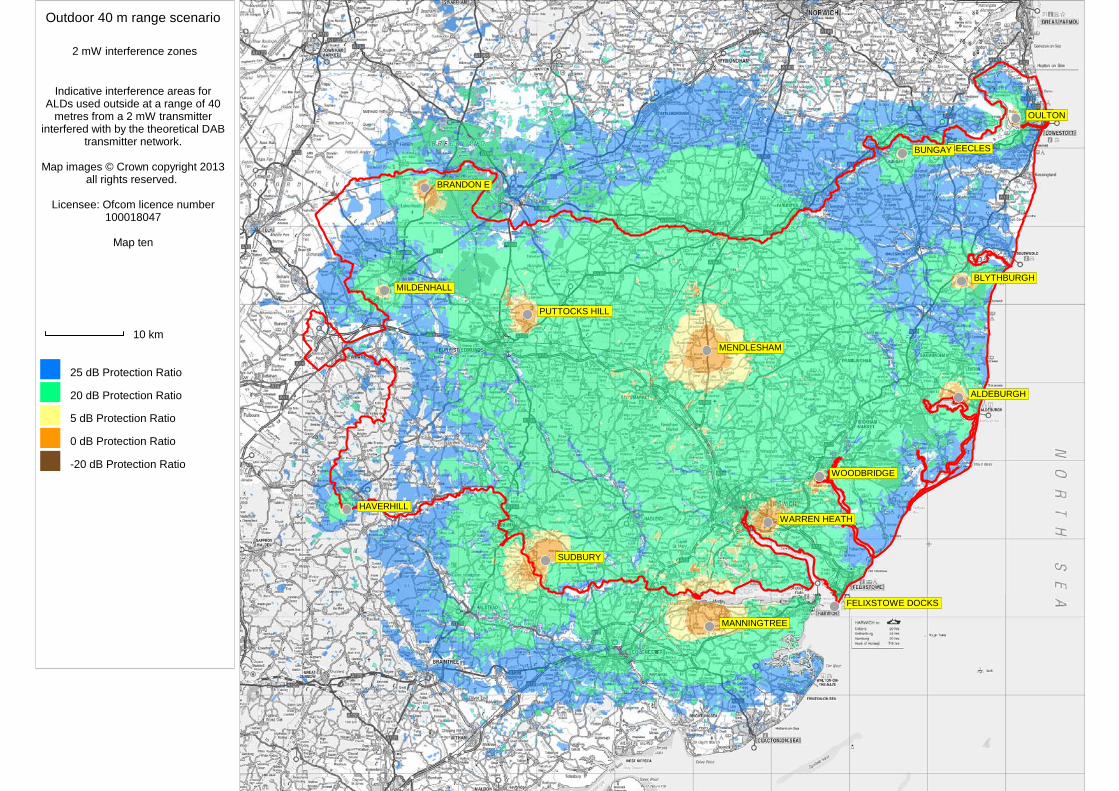
Outdoor 40 m range scenario
2 mW interference zones
Indicative interference areas forALDs used outside at a range of 40
metres from a 2 mW transmitterinterfered with by the theoretical DAB
transmitter network.
Map images © Crown copyright 2013all rights reserved.
Licensee: Ofcom licence number100018047
Map ten
10 km
25 dB Protection Ratio
20 dB Protection Ratio
5 dB Protection Ratio
0 dB Protection Ratio
-20 dB Protection Ratio
ALDEBURGH
BEECLES
BLYTHBURGH
BRANDON E
BUNGAY
FELIXSTOWE DOCKS
HAVERHILL
MILDENHALL
OULTON
PUTTOCKS HILL
SUDBURY
WARREN HEATH
WOODBRIDGE
MANNINGTREE
MENDLESHAM