blood types 1 running head: blood types and self ... typical (2002).pdf · significant correlations...
TRANSCRIPT

Blood Types 1
Running head: Blood Types and Self-fulfillment
Blood-typical Personality Stereotypes and Self-fulfilling Prophecy: A Natural Experiment with Time-series Data of 1978 - 1988
Akira SAKAMOTO Kenji YAMAZAKI Ochanomizu University Yamada-Denki
April, 2002
The address of Akira SAKAMOTO: Department of Psychology, Ochanonizu University 2-1-1 Otsuka, Bunkyo-ku, Tokyo 112-8610, JAPAN Tel +(81)-3-5978-5257 Fax +(81)-3-5978-2559 Email [email protected]

Blood Types 2
Blood-typical Personality Stereotypes and Self-fulfilling Prophecy: A Natural Experiment with Time-series Data of 1978 - 1988
Abstract
A natural experiment was conducted to examine if blood-typical personality stereotypes, which have been widely popular in Japan in recent years, influenced the personalities of Japanese people and also operated as a self-fulfilling prophecy. Data from 32,347 subjects, randomly selected annually from 1978 to 1988, was analyzed. The results showed significant correlations between the blood type and self-reported personality were found only after 1984, in terms of personality aspects of blood types A and B. In 1984, topics related to blood types and personalities were extremely popular in Japan. This indicates that blood-typical personality stereotypes actually influenced the personalities – self-reported personalities, at least – of individuals, and that they also operated as a self-fulfilling prophecy, although the greatness of that influence could be discussed.

Blood Types 3
Blood-typical Personality Stereotypes and Self-fulfillment Prophecy: A Natural Experiment with Time-series Data of 1978-1988
A great many empirical researchers have been interested in self-fulfilling prophecy, or the phenomenon that a belief constructs reality, since Merton (1948) published his classic book on the subject (cf. Snyder & Stukas, 1999; provides the latest comprehensive report on this kind of prophecy). The existence of this kind of prophecy was examined and empirically supported in various fields of study, for example, social psychology (Jones, 1977; Snyder, 1984, 1992), educational psychology (Rosenthal, 1971; Rosenthal & Jacobson, 1968), clinical psychology (Harris, 1994), organizational and industrial psychology (Eden, 1990a, b), personality psychology (Sakamoto, Miura, Sakamoto, & Mori, 2000), psychological methodology (Rosenthal, 1976), sociology (Merton, 1948, 1968), political science (Merton, 1948; Straffin, 1977; Henshel & Johnston, 1987), and economics (Farmer, 1993). The self-fulfilling prophecy generated by social stereotypes has been one of the most often noticed issues in the research area of self-fulfilling prophecy. This is because, in the movement to abolish discrimination between majority and minority social groups, it has been important to argue that observable differences in some aspects of ability between groups, which can lead to the discrimination, are caused by the self-fulfilling prophecy of social stereotypes, and therefore this does not imply that the members of these groups are fundamentally different. In fact, affirmative action was introduced on the assumption that the observable differences in ability originate from the self-fulfilling prophecy of social stereotypes (Blanchard & Crosby, 1989; Wood, 1989). Social psychological studies have obtained evidence that a self-fulfilling prophecy can be generated by stereotypes for such social categories as gender (Skypnek & Snyder, 1982; von Baeyer, Sherk, & Zanna, 1981; Zanna & Pack, 1975), race (Word, Zanna, & Cooper, 1974), and physical appearance (Snyder, Tanke, & Berscheid, 1977), giving support to the theories that prompted social movements such as affirmative action. Blood-typical personality stereotypes – as a category of social stereotypes –– have become widely known in Japan in recent years. To examine if blood-typical personality stereotypes operated as a self-fulfilling prophecy, similar to the other stereotypes, a natural experiment was conducted (Chapman & McCauley, 1993; Jussim & Eccles, 1995; McNulty & Swann, 1994). A natural experiment is a useful study method since it does not

Blood Types 4
have disadvantages such as unreality, experimenter effects, or demand characteristics, which a laboratory experiment often involves (Aronson, Ellsworth, Carlsmith, & Gonzales, 1990). What Are Blood-typical Personality Stereotypes? In 1985, Newsweek published an article discussing blood typical stereotypes: “The Japanese have found a new way to ‘typecast’ people. It’s not astrology; it’s not studying the bumps on people’s heads. It’s blood typing.... There is absolutely no scientific basis for typecasting by blood, of course, but that hasn’t stopped many Japanese from applying it to everything from love affairs to employment interviews.”
(Treen & Hoshiai, 1985) At present, many Japanese people believe that a person’s blood type (one of four blood types that is determined by an ABO system) causes them to have a distinct personality. For example, it is believed that Type-A people are scrupulous, nervous, and serious; Type-B people are cheerful and uncooperative; Type-O people are broad-minded and careless; and Type-AB people have a dual personality (cf. Takuma & Sato, 1994). This hypothesis regarding a correlation between blood types and personality was systematically presented seventy-five years ago by a Japanese academic psychologist (Furukawa, 1927, 1930), but was not supported by empirical research, and eventually was rejected by the Japanese academia in the 1930’s. Nevertheless, recent popular psychologists (e.g. Nomi, 1971; Suzuki, 1974) have published numerous books in which this hypothesis is introduced, and these popular publications have led to the prevalence and acceptance of such blood typing (Ohmura, 1990). Presently, many Japanese people believe in the correlation between blood types and personality and are influenced by the belief. For example, a survey of 1102 Japanese people who were selected using a random sampling method showed that seventy-five percent of the subjects believed in the correlation (NHK Broadcasting Culture Research Institute, 1986). In addition, we can find several companies who use the blood types of employees to judge their aptitude when assigning tasks. In some schools, the blood types of kindergarteners are utilized to determine the best method to teach them (cf. Shirasa & Iguchi, 1993). From these examples, we are able to say that the majority of Japanese

Blood Types 5
people believe in blood-typical personality stereotypes today. However, most of the recent research on this subject has concluded that it is impossible to demonstrate any scientific basis for the correlation between blood types and personality, which is assumed when assigning blood-typical stereotypes (e.g. Ohmura, 1990). Since Furukawa presented his theories, many studies have been conducted in Japan and elsewhere in an attempt to discover whether or not blood typical stereotypes have any scientific basis. During the 1930’s, a multitude of studies were conducted, and no correlation was found, as mentioned above (Ohmura, 1990; Mizoguchi, 1986). Further studies were conducted after the mid-1980’s (cf. Takahira, Sakamoto, Matsuda, Oe, Ohgami, & Mizoguchi, 1995) and the majority of them did not discover a significant correlation between blood types and personality (cf. Ohmura, 1990; Sato & Watanabe, 1992; Shirasa & Iguchi, 1993). Several studies were also conducted in other countries (e.g. Coscarelli, Stepp, & Lyerla, 1989 in the United States; Iwawaki, Eysenck, & Eysenck, 1980 in the United Kingdom; Cattell, Brackenridge, Case, Propert, & Sheehy, 1980 in Australia), but these studies also failed to demonstrate a significant correlation1,2. In addition, it is possible that there may be a biological basis for blood typical stereotypes, but no one has presented such a theory. Thus, there is very little scientific evidence supporting the blood-typical stereotypes theory, although many Japanese people believe in the stereotypes because of the books by popular psychologists. In Japan, blood-typical stereotypes are as commonly accepted as horoscopes in Western countries (Eysenck & Nias, 1982; Tyson, 1982; Crowe, 1990) 3. The Self-fulfilling Prophecy Generated by Blood-typical Stereotypes As we mentioned earlier, many studies have been conducted which show that various social stereotypes operate as a self-fulfilling prophecy. It is therefore likely that blood-typical stereotypes also operate as such a prophecy, as Matsui (1989) suggested. If this is true, as the blood-typical stereotypes spread the personalities of Japanese people will change into what the stereotypes say they are. As a result, correlations between blood types and personalities will become higher. By using data collected between 1978 and 1988, we examined if the correlations between the blood types and personalities actually increased during this period. As mentioned earlier, publications by popular psychologists seem to have been one of the causes for individuals accepting blood-typical stereotypes. Table 1 shows the number

Blood Types 6
of publications and magazine articles issued between 1972 and 1993 regarding blood types and personalities (Mizoguchi, 1994). The number of related publications did not show great changes for the 10 years from the beginning of the 1970’s. However, it had a drastic increase around 1982, and the numbers were the largest in 1984 and 1985. Although the peak is now over, a large number of related publications have still been issued. Between 1978 and 1988, a stable amount of publications with such a topic were issued, although it varied slightly depending on the year. The stereotypes are believed to have spread gradually during this period. Particularly between 1984 and 1985, when the publications were the largest in number, a great number of individuals were thought to be exposed to such stereotypes. Without knowing the stereotypes, the individuals would not be influenced by them. Here, we hypothesized that a large number of individuals were influenced by the stereotypes after the peak publication period, and as a result, the data collected after the peak period would show clear correlations between blood types and personalities. As we will describe in detail later, we used a database to examine this hypothesis. Data was obtained through the use of surveys that were conducted annually during the years 1978-1988. Each survey involved about 3000 subjects, and they were selected from all Japanese through a random sampling method every year. The survey results were stored in this database. Using this data, it is possible to determine the personalities of individuals belonging to each blood group on an annual basis because the blood type and personality of each subject were measured in those surveys. From the data, we obtained four blood-typical personality scores, that is, Type-A-, Type-B-, Type-O-, and Type-AB-personality scores for each subject. The scores indicate how much the subject conforms to the stereotypical personality assigned to the Type-A, Type-B, Type-O, and Type-AB groups respectively. If the hypothesis is supported, as the blood-typical stereotypes spread, subjects in a particular blood type group would increasingly have a higher blood-type personality score for their own blood type than for the blood types that were not theirs. For example, the subjects in the Type-A group would increasingly have a higher Type-A-personality score than the subjects from the other blood-type groups, such as B, O, and AB. To test this hypothesis, we examined if such score changes took place. Note that, hereinafter, the Type-A, B, O, and AB personalities are referred to as Type-I, II, III, and IV personalities to avoid confusions with the Type-A, B, O, and AB groups.

Blood Types 7
The hypothesis that a self-fulfilling prophecy will arise from blood-typical stereotypes is seemingly inconsistent with the results of the studies we mentioned earlier, because the results did not show a significant correlation between blood types and personality, and the correlation should have appeared in Japan in recent years if the hypothesis is true. Such disagreements between the hypothesis and the results seem to be more significant with more recent studies. It is our belief that the reason why even the recent studies have failed to detect any significant correlations is due to the following two methodological problems found in the studies conducted in Japan. We also believe that these problems will not conflict with each other. First, the majority of the previous studies frequently used only one item to measure each personality trait of the subjects. In general, when few items are used for each personality trait, the measurement of the trait is influenced by errors, and therefore, the correlation between the score of the trait and another variable is low. Secondly, in some of the previous studies, personality traits that were believed to vary depending on blood groups were not used as traits whose correlation with blood types was examined. We think that we will be able to detect a significant correlation between blood types and personality, only when we examine whether or not the blood types are correlated with specific personality traits that are believed to vary with blood groups, because the correlation between blood types and personality arises from people’s belief in such links between blood groups and personality, as we mentioned earlier. Our attempt here is to conduct a study free of these problems to confirm that there are significant correlations between blood types and personalities, at least after the peak publication period. At the same time, we will examine if there are in fact no significant correlations between them in the data collected before the peak period. If these are confirmed, it is possible to conclude that blood-typical stereotypes actually influence the personalities of individuals and also operate as a self-fulfilling prophecy.
Method Database We used a database system of survey data, which is administered by JNN Data Bank, a department of Tokyo Broadcasting Corporation, one of the major television networks in Japan. JNN Data Bank conducts a large annual survey, which includes about 3,000

Blood Types 8
people, ages ranging from 13 to 59. The subjects are selected from the population of all Japanese people through a random sampling method every year.4 The data obtained in the surveys are then presented to researchers. In the surveys of 1978 - 1988, the subjects were asked to identify their own blood type, and to answer a set of 24 yes-no questions for the assessment of their personality.5 We can use these surveys to examine how the personalities of individuals have changed, especially whether or not the personalities have changed conforming to the stereotypes for their own blood groups year by year, by analyzing the data of this period. We cannot use the data of the surveys conducted before 1978 and after 1988, because the subjects’ blood type was not a part of the survey before 1978, and the questions used for personality assessment after 1988 are different from those of 1978 - 1988. Although this database was useful, there were also some restrictions. Between 1978 and 1988, the total number of the subjects was 32,347 (12,446 for Type A, 6,852 for Type B, 9,614 for Type O, and 3,435 for Type AB groups). However, we were not able to use the raw score data collected from all 32,347 indivi duals. We were only able to use the data of 440 categories, which were the result of combining elements from four blood type groups (A, B, O, and AB), five age groups (13 - 19, 20 - 29, 30 - 39, 40 - 49, and 50 - 59), and eleven years (1978 to 1988). Available data were only a) the total number of subjects of each category and b) the number of subjects of the category who answered “yes” to each of 24 questions of the personality assessment questionnaire. The main reason for such restrictions was the privacy issue. Blood-typical Personality Scores The 24 questions used for personality assessment in the surveys of 1978 - 1988 are shown in Table 2. The subjects were asked to answer yes or no to each of these items. As we described earlier, we need to know how closely the personality of the subjects follows the stereotype for each blood group every year. Based on the subjects’ responses to those items, we can compute the scores indicating how consistent their personalities are with the stereotypes for the Type-A, Type-B, Type-O, and Type-AB groups (Type-I-, Type-II-, Type-III-, and Type-IV-personality scores). Thus, we first conducted a survey to investigate how consistent the content of these items was with the stereotype for each blood group. We asked 177 female undergraduate students who were studying at Toyo Eiwa Women’s University in Yokohama, Japan to

Blood Types 9
answer whether the content of each item would be consistent with the stereotypes for the Type A, Type B, Type O, and Type AB groups on yes-no scales.6 We show the percentages of the subjects who answered yes in Table 2. We centered these percentages, that is, made the mean of the four percentages of each item zero. The centered percentages are also shown in Table 2. An item with a high centered percentage for a particular blood type is more consistent with the stereotype of that blood group than the other blood groups. For example, Item 11 has a high centered percentage for Type A. This means that this item is more consistent with the stereotype for the Type A group than the stereotypes of the Type B, Type O, and Type AB groups. We used the three items with the highest centered percentages (high percentage items) and the three items with the lowest centered percentages (low percentage items), which appear underlined in Table 2, to obtain the blood-typical personality scores of the subjects who participated in the surveys of JNN Data Bank. A particular blood-typical personality score was the total number of “yes” responses for the three high percentage items and “no” answers for the three low percentage items for that blood group. Since we had access to the data of 440 categories and the data of subjects who answered “yes” to each of the items in the questionnaire as mentioned above, we were able to know the ratio of the subjects who answered “yes” to the high percentage items as well as those who answered “no” to the low percentage items. A summation of these ratios would be equal to an in-category average value of the blood-typical personality score of an individual, which would result from a summation of the number of “yes” responses to the high percentage items and “no” answers to the low percentage items. Hence, we successfully obtained an average blood-typical personality score for each of the categories. All scores were to be distributed in a range of 0 to 6, but for the convenience of score comparisons, each score was standardized in this study. This allowed clear presentation of differences between blood type groups or years in terms of each of the blood-typical personality scores. Note that, the standardization of the scores did not affect the results since the individual blood-typical personality score was analyzed separately in this study. By such a centering procedure, we can obtain blood-typical personality scores that are correspondent with the aspects of stereotypes specific to their own blood type, because this procedure would result in a reduced chance of the same item being used to assess multiple blood-typical personality scores. Without these scores, we would not be able to detect the
influence of blood-typical stereotypes. For example, if the Type-B-personality score is close to

Blood Types 10
not only Type-B stereotypes but Type-O and Type-AB stereotypes, the score of Type-B, O, AB
people could to be heightened by their own stereotypes, and consequently, the differences of
the score between these blood groups would be difficult to be detected, if the influence of
blood-typical stereotypes actually exist. We therefore thought we should use the centering
procedure. Since this procedure would reduce the chance of the same item being used for multiple blood-typical personality scores, it would lead to reduced correlations between the scores. Still, however, some of the same items were used to determine different blood-typical personality scores, and it is possible that the scores correlated to each other. This would likely be due to inherent correlations between blood-type stereotypes7. If correlations did exist, then this would lead to the problem of a multiple test, and this problem needed to be dealt with during the course of the analyses. We then obtained the blood-typical personality scores which would vary with corresponding blood-typical stereotypes. As mentioned earlier, the previous studies did not use the scores that were consistent with the stereotypes. Therefore, the correlations between blood types and personalities may have not been detected. Scores used in this study were free of this problem.
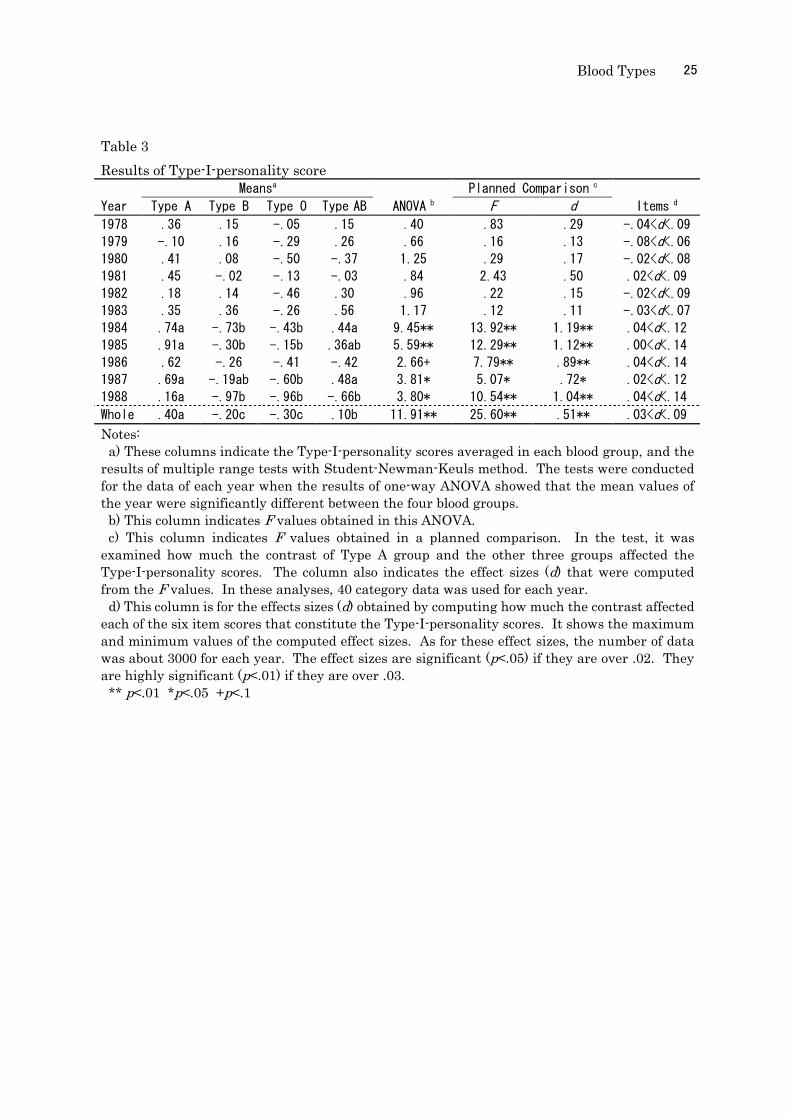
Results We examined the correlations between blood types and the blood-typical personality scores, using the data of the scores in 440 categories. First, F tests were conducted on the entire data or the data from each year to determine if the Type-I-personality scores would differ with blood types, and subsequently, multiple range tests based on the Student-Newman-Keuls method were conducted on the significant results. Furthermore, differences between the Type-A group and other groups were examined by the planned comparison test, and the effect sizes (d) of the contrasts were obtained. The results are shown in Table 3. As expected, significant correlations existed in data collected in 1984 or later. The effect sizes here were calculated based on 440 pieces of data, and not 32,347 pieces of data. Due to the aforementioned restrictions, we were not able to calculate effect sizes based on 32,347 pieces of data. It was, however, possible to calculate the effect sizes of contrast based on these 32,347 pieces of data in terms of the six items comprising the score.8 Table 3 shows the largest and the smallest effect sizes obtained from these six

Blood Types 11
items. Similar analyses were conducted on the remaining scores, specifically Type-II-, Type-III-, and Type-IV-personality scores (Tables 4 to 6). As for the contrasts, the Type-B group and other groups, Type-O group and other groups, and Type-AB group and other groups were compared respectively. As seen in Table 4, effects of the contrasts were significant for the Type-II-personality scores between 1984 and 1985, but no significance was observed in the later data. No significant contrasts were observed in either the Type-III- or Type-IV-personality scores (Tables 5 and 6). As mentioned earlier, the four blood-typical personality scores may be correlated to each other. If they are, there is an issue of the multiple test, and hence, it is necessary to handle the calculations accordingly. According to the Bonferroni method, which is one of the solutions, the probability of judging the significance should be set to one-fourth of 5%, which is 1.25%, since the four variables are dependent. As seen in Tables 3 to 6, the contrast effects obtained from the Type-I-personality scores after the peak publication period were at the level of 1%, excluding the data collected in the year of 1987. Similarly, the contrast effects for the Type-II-personality scores were at the level of 1% in the data collected in the year of 1984. Although these results included the multiple test issues, the effects were still determined to be significant. (On the other hand, significance probabilities for the effects of Type-I-personality scores of 1987 and Type-II-personality scores of 1985 are actually over 1.25%, and therefore, these are not significant.) Besides the analyses mentioned so far, we conducted c2 tests to examine correlations that blood types had with gender (male - female), age (13 - 19, 20 - 29, 30 - 39, 40 - 49, and 50 - 59), and years (1978 - 1988). As for these variables, we can examine the correlations in terms of 32,347 data, like the case of analysis for the items. As the result of analysis, the correlation that the blood types had with gender and age were both significant (c2 (3) = 7.97, n = 32,347, p<.05; c2 (30) = 44.98, n = 32,347, p<.05), and furthermore, the correlation with years was marginally significant (c2 (12) = 19.03, n = 32,347, p<.1). When calculating effect sizes using indices such as d or r, if at least one of the indices included a nominal variable, containing three or more levels, calculations would be generally meaningless. Since gender was a bivariate variable, however, it was possible to calculate the contrast of effect sizes between the Type-A group and other groups, Type-B group and other groups, Type-O group and other groups, and Type-AB group and other groups. The effect sizes (d) were .02, .01, -.02, and -.01, respectively.

Blood Types 12
Discussion
The previous studies showed that there were no correlations between blood types and personalities. Also in this study, no correlations were obtained for the data taken before the boom period (i.e., 1984 to 1985) of blood types and personality related topics. Therefore, the correlations suggested by the stereotypes may not have existed at all in any aspects unless social influences by such stereotypes existed. As for the data taken after the boom period, no correlations were obtained for Type-III- or Type-IV-personality scores. Type-I- and Type-II-personality scores, however, showed correlations. Type-II-personality scores showed correlations only in the data taken during the boom period of 1984 and 1985 (only in the data of 1984 according to the standard of the Bonferroni method) and showed no correlations in the data taken after that period. This may be due to the fact that many individuals were exposed to the blood-typical personality stereotypes as a new concept in this boom period, received related information frequently, and were greatly influenced by the information. Type-I-personality scores obtained from the data taken after the boom period, however, still showed correlations. It can be suspected that the knowledge of blood-typical personality stereotypes obtained during the boom period continued to influence individuals even after the boom was over. In any case, this implies that the blood-typical personality stereotypes operated as a self-fulfilling prophecy for personality aspects of both Type-I- and Type-II-personality scores. The result of Type-I-personality scores supported the hypothesis especially well, regardless of the standard set by the Bonferroni method. Note that some discussion of the results of this study is necessary. First, why did the result of the Type-I-personality score support the hypothesis better than the other types of scores? This may be because the stereotypes related to the Type-A group are better known than the other types of stereotypes, and therefore are well understood by the individuals (Matsui & Kamise, 1994). In fact, the values related to the Type-A group most fluctuated between items in the centered percentages shown in Table 2. When a variance is obtained for each type, the results are .24 for the Type-A group, .16 for the Type-B group, .16 for the Type-O group, and .10 for the Type-AB group. Hence the variance for the Type-A group is the largest. This shows that it is clear which items fit into the Type-A stereotypes and which items do not, implying that the stereotypes for Type-A group are clear. Also,

Blood Types 13
according to Matsui & Kamise (1994), the second best stereotypes that the individuals understand clearly, next to Type-A stereotypes, is for Type-B group. In fact, next to the results of the Type-I-personality scores, the results of the Type-II-personality scores best supported the hypothesis. This also supports the idea that the perceived distinctiveness of the stereotypes has influenced the results of this study. Second, why did gender and age show significant correlations with blood types although blood types do not change with age or gender? Again, we believe these correlations are due to sociopsychological influences of the blood-typical personality stereotypes. For instance, individuals in general may misunderstand about their own blood type, believing that their blood type is what they think is the ideal blood type. Patterns of misunderstanding vary with the gender or age of the individuals, and the contents of self-reports regarding their blood type differed with these categories. In any case, gender showed the significant correlation, but its effect sizes are much smaller than those of personality items. Third, even though there are correlations between the blood types and Type-I-personality scores or Type-II-personality scores, are these correlations significant enough to be realistically meaningful? It is true that these effects are so small that some may think they are not meaningful. Tables 3 and 4 show the effect sizes of Type-I-personality scores and Type-II-personality scores respectively. These values themselves are not small, but note that they are calculated based on the 440 pieces of data. These data are the result of averaging the 32,347 pieces of raw data in each category. Therefore, variance between individual data is eliminated, and hence, the variance among the 440 pieces of data is small. Therefore, the effect sizes of these 440 pieces of data are thought to be overestimated versions of the 32,347 pieces of data. Since we were able to calculate the effect sizes based on 32,347 pieces of data for each item, the results have also been shown in the Tables 3 and 4. The resulting values are, in fact, small. However, we believe we cannot immediately argue that the obtained correlations are realistically unimportant merely due to the size of the effects. The reasons are as follows. First of all, these small-sized effects are obtained for each item. The scale of the single item is the most susceptible to measurement errors, resulting in smaller correlations with other variables. Hence, true correlations may be much larger. Second, Cohen (1988) stated that personality, social, and clinical psychology usually sought small effects because of the influence of uncontrollable extraneous variables. Effect sizes obtained in

Blood Types 14
these fields are generally underestimated and therefore, we could have a view that they should not be simply ignored if they are seemingly small (Cooper, 1998). This will be truer for non-laboratory research like this study. Third, even if the obtained correlations are small, some of the subjects of this study do not know the contents of the stereotypes. If they do not have knowledge of the stereotypes, they should not be influenced by it. As mentioned previously, the correlations in terms of the results of the Type-I-personality scores were in fact larger, but this may be due to the fact that the stereotypes of the Type-A group are the most well known of all the groups. Generally, in experimental studies, all subjects of the experimental group are usually given some kind of stimulus, and the influence of that stimulus is studied. In this study, however, it is important to acknowledge that each blood-typical group includes not only individuals who were given a stimulus such as stereotypes but also individuals who were not given any stimulus, which could lead to the reduction of observed influences of the stereotypes and the effect sizes of correlations between blood types and personality. The last point to be discussed is the self-report scale employed in the survey conducted by the JNN data bank. Is it possible to guarantee that these scales successfully measured the real personalities of the subjects? This issue concerning the difference between a person’s real personality and their personality as measured using a self-report scale has often been investigated in the fields of personality psychology and social psychology. Although some people argue that the two personalities are different from each other (Nisbett & Ross, 1980), other people argue that they are not different (Funder, 1987). In any case, a self-report scale has often been used to measure people’s personality in various fields of psychology, and therefore, many researchers seem to agree that the two personalities are not different. We also believe that they are not different. The Self-fulfilling Prophecy Generated by Blood-typical Stereotypes Thus, we have found that, in terms of Type-I- and Type-II-personality scores, blood-typical personality stereotypes influenced individuals’ personalities – self-reported personalities at least – and also operated as a self-fulfilling prophecy. Although the obtained effects are small, we still believe they should not be ignored. Correlations between blood type and personality have been found for the Type-I-personality in the data taken after the boom period was over, showing that the blood-typical personality stereotypes can have a persistent influence. This has the following two implications.

Blood Types 15
First, popular psychologists have often claimed to discover such correlations as a result of their own research. Academic researchers have frequently pointed out that their research contained methodological problems. Assuming there are no such problems, however, the results of this study show that the correlations can be generated by means of sociopsychological mechanisms, instead of biological mechanisms as the popular psychologists have insisted. Note that, we were unable to find even the smallest correlations in the data taken before the boom period. Second, as mentioned earlier, a number of studies have shown that stereotypes against various social categories, such as gender, race, and physical attractiveness, operate as a self-fulfilling prophecy. These categories, however, usually do have correlations with abilities or personalities, and “scientific rationales” exist to explain the correlations. For instance, experimental studies have shown that there are differences in abilities and personalities, regardless of them being inherent or acquired, between the male and female genders (e.g. Beall & Sternberg, 1993). Such scientific rationales have seldom been provided regarding correlations obtained in Japan between blood types and personalities. With use of a natural experiment, this study has shown that individuals can be influenced even by social stereotypes without such scientific rationales, and these stereotypes can operate as a self-fulfilling prophecy. Future Research This study has presented the above findings, but there still exist two important problems to be solved in the future. First, how has a self-fulfilling prophecy arisen from the blood-typical stereotypes? Previous studies have presented some interpersonal and intrapersonal processes that can underlie the generation of self-fulfilling prophecy (e.g. Darley & Fazio, 1980; Jussim, 1986; Snyder, 1984, 1992). In the future, it will be necessary to examine whether or not these processes actually mediate the generation of the self-fulfilling prophecy of blood-typical stereotypes. Second, why have blood-typical stereotypes generated a self-fulfilling prophecy? It is not necessarily generated in all situations (Snyder, 1992; Jussim, 1993). A number of moderating factors, which influence the generation of the self-fulfilling prophecy, have been found. Generation of the self-fulfilling prophecy in terms of blood-typical personality stereotypes has been presented in this study. If conditions necessary for its generation become clarified in the future, such findings will contribute to theoretical aspects of

Blood Types 16
self-fulfilling prophecy and also to the understanding of the self-fulfilling prophecy in terms of blood-typical personality stereotypes. Blood-typical personality stereotypes are spreading beyond Japan and into other Asian countries. It is our hope that this issue will attract the attention of the Asian social psychology field and that much more research will be conducted by Asian researchers.
Conclusion
As mentioned above, this study still leaves issues yet to be clarified. However, this study has shown that blood-typical personality stereotypes actually influenced individuals’ personalities – self-reported personalities at least – in Japanese society and operated as a self-fulfilling prophecy, even though no scientific evidence for these stereotypes has been presented. Although the greatness of that influence could be discussed, we believe that this study will provide an impressive case to the field of the social stereotypes studies.

Blood Types 17
References Aronson, E., Ellsworth, P. C., Carlsmith, J. M., & Gonzales, M. H. (1990). Methods of research in social psychology (2nd ed.). New York: McGraw-Hill. Beall, A. E., & Sternberg, R. J. (Eds.) (1993). The psychology of gender. New York: Guilford Press. Blanchard, F. A., & Crosby, F. J. (Eds.) (1989). Affirmative action in perspective. New York: Springer-Verlag. Cattell, R. B., Brackenridge, C. J., Case, J., Propert, D. N., & Sheehy, A. J. (1980). The relation of blood types to primary and secondary personality traits. Mankind Quarterly, 21, 35-51. Chapman, G. B., & McCauley, C. (1993). Early career achievements of national science foundation (NSF) graduate applicants: Looking for Pygmalion and Galatea effects on NSF winners. Journal of Applied Psychology, 5, 815-820. Cohen, J. (1988). Statistical power analysis for the behavioral sciences (2nd ed.). New York: Academic Press. Cooper, H. (1998). Synthesizing research: A guide for literature review (3rd ed.). Thousand Oaks, CA: Sage. Coscarelli, W. C., Stepp, S. L., & Lyerla, R. (1989). Relationship of blood type with decision-making style and personality type. The Mankind Quarterly, 29, 307-327. Crowe, R. A. (1990). Astrology and the scientific method. Psychological Reports, 67, 163-191. Darley, J. M., & Fazio, R. H. (1980). Expectancy-confirmation processes arising in the social interaction sequence. American Psychologist, 35, 867-881. Eden, D. (1990a). Industrialization as a self-fulfilling prophecy: The role of expectations in development. International Journal of Psychology, 25, 871-886. Eden, D. (1990b). Pygmalion in management: Productivity as a self-fulfilling prophecy. Lexiongton, MA: Lexington Books. Eysenck, H. J., & Nias, D. K. B. (1982). Astrology: Science or superstition? London: Curtis Brown. Farmer, R. E. A. (1993). The macroeconomics of self-fulfilling prophecies. Cambridge, MA: MIT Press. Funder, D. C. (1987). Errors and mistakes: Evaluating the accuracy of social judgment.

Blood Types 18
Psychological Bulletin, 101, 75-90. Furukawa, T. (1927). A study of temperament and blood-groups. Japanese Journal of Psychology, 2, 612-634. Furukawa, T. (1930). A study of temperament and blood-groups. Journal of Social Psychology, 1, 494-509. Gattaz, W. F. (1981). HLA-B27 as a possible genetic marker of psychoticism. Personality and Individual Difference, 2, 57-60. Glick, P., & Snyder, M. (1986). Self-fulfilling prophecy: The psychology of belief in astrology. Humanist, 46, 20-25. Harris, M. J. (1994). Self-fulfilling prophecies in the clinical context: Review and implications for clinical practices. Applied and Preventive Psychology, 3, 145-158. Henshel, R. L., & Johnston, W. (1987). The emergence of bandwagon effects: A theory. The Sociological Quarterly, 28, 493-511. Iwawaki, S., Eysenck, S. B. G., & Eysenck, H. J. (1980). Japanese and English personality structure: A cross-cultural study. Psychologia, 23, 195-205. Jones, E. E. (1977). Self-fulfilling prophecies: Social, psychological, and physiological effects of expectancies. Hillsdale, NJ: Lawrence Erlbaum Associates. Jussim, L. (1986). Self-fulfilling prophecies: A theoretical and integrative review. Psychological Review, 93, 429-445. Jussim, L. (1993). Accuracy in interpersonal expectations: A reflection-construction analysis of current and classic research. Journal of Personality, 61, 637-668. Jussim, L., & Eccles, J. (1995). Naturally-occurring interpersonal expectancies. In N. Eisenberg (Ed.), Social development (pp. 74-108). Thousand Oaks, CA: Sage. Matsui, Y. (1989, September). Ketsueki gata seikaku gaku ni kansuru toukeiteki kentou [A statistical examination of the theory of blood types and personality]. Paper presented at the 30th annual convention of the Japanese society of social psychology. Tokyo. Matsui, Y., & Kamise, Y. (1994). Functions and structure of blood-group stereotype. Bulletin of University of the Sacred Heart, 82, 91-111. McGuffin, P. (1979). Is schizophrenia an HLA-associated disease? Psychological Medicine, 9, 721-728. McNulty, S. E., & Swann, W. B., Jr. (1994). Identity negotiation in roommate relationships: The self as architect and consequence of social reality. Journal of

Blood Types 19
Personality and Social Psychology, 67, 1012-1023. Merton, R. K. (1948). The self-fulfilling prophecy. Antioch Review, 8, 193-210. Merton, R. K. (1968). The Matthew effect in science. Science, 159, 56-63. Mizoguchi, H. (1986). Takeji Furukawa and the theory of relationship between blood type and temperament. Biological Science, 38, 9-20. Mizoguchi, H. (1994). Ketsueki gata ningen gaku no jouhou hasshin gen [Senders of information on the theory of blood types and personality]. In T. Takuma & T. Sato (Eds.), Ketsueki gata to seikaku [Blood types and personality] (pp. 95-105). Tokyo: Shibun Dou. NHK Broadcasting Culture Research Institute. (1986). “Kagaku gijutsu to seikatsu” chousa [A survey on “scientific technology and live”]. Tokyo: NHK Service Center. Nisbett, R. E., & Ross, L. D. (1980). Human inference: Strategies and shortcomings of social judgment. New York: Prentice-Hall. Nomi, M. (1971). Ketsueki gata de wakaru aisyou [Human relationships that can be understood with blood types]. Tokyo, Japan: Seishun Syuppan. Ohmura, M. (1990). Ketsueki gata to seikaku [Blood types and personality]. Tokyo: Fukumura Syuppan. Rosenthal, R. (1974). On the social psychology of the self-fulfilling prophecy: Further evidence for Pygmalion effects and their mediating mechanisms. New York: MSS Modular. Rosenthal, R. (1976). Experimenter effects in behavioral research: Enlarged edition. New York: Irvington. Rosenthal, R., & Jacobson, L. (1968). Pygmalion in the classroom. New York: Holt, Rinehart, & Winston.
Sakamoto, A., Miura, S., Sakamoto, K., & Mori, T. (2000) Popular psychological tests and self-fulfilling prophecy: An experiment of Japanese female undergraduate students. Asian Journal of Social Psychology, 3, 107-124. Sato, T., & Watanabe, Y. (1992). Psychological studies on blood-typing in Japan. Japanese Psychological Review, 35, 234-268. Shirasa, T., & Iguchi, T. (1993). Ketsueki gata seikaku kenkyu nyuumon [An introduction to research on blood types and personality] Tokyo: Kawashima Shoten. Skypnek, B. J., & Snyder, M. (1982). On the self-perpetuating nature of stereotypes about women and men. Journal of Experimental Social Psychology, 18, 277-291. Snyder, M. (1984). When belief creates reality. In L. Berkowitz (Ed.), Advances in

Blood Types 20
experimental social psychology (Vol. 18, pp. 248-305). Orland, FL: Academic Press. Snyder, M. (1992). Motivational foundations of behavioral confirmation. In M. P. Zanna (Ed.), Advances in experimental social psychology (Vol. 25, pp. 67-114). San Diego: Academic Press. Snyder, M., & Stukas, A. A. (1999). Interpersonal processes: The interplay of cognitive, motivational, and behavioral activities in social interaction. In J. T. Spence (Ed.), Annual Review of Psychology, vol. 50 (pp. 273-303). Palo Alto: Annual Reviews. Snyder, M., Tanke, E. D., & Berscheid, E. (1977). Social perception and interpersonal behavior: On the self-fulfilling nature of social stereotypes. Journal of Personality and Social Psychology, 35, 656-666. Straffin, P. (1977). The bandwagon curve. American Journal of Political Science, 21, 695-710. Suzuki, Y. (1974). Ketsueki gata seikaku gaku [The theory of blood types and personality]. Tokyo, Japan: Sanshin Sya. Takahira, M., Sakamoto, A., Matsuda, E., Oe, T., Ohgami, Y, & Mizoguchi, H. (1995, September). Ketsueki gata to seikaku kennkyuu no meta bunseki [A meta-analysis of the studies on blood types and personality]. Proceedings for the 36th annual convention of the Japanese society of social psychology, Tokyo (pp. 104-105). Takuma, T., & Sato, T. (Eds.) (1994). Ketsueki gata to seikaku [Blood types and personality]. Tokyo: Shibundou. Treen, J., & Hoshiai, Y. (1985, April 1). 'Typecasting': By blood. Newsweek, 105, 50. Tyson, G. A. (1982). Why people perceive horoscopes as being true: A review. Bulletin of the British Psychological Society, 35, 186-188. von Baeyer, C. L., Sherk,D. L., & Zanna, M. P. (1981). Impression management in the job interview: When the female applicant meets the male (chauvinist) interviewer. Personality and Social Psychology Bulletin, 7, 45-52. Woods, G. (1989). Affirmative action. New York: Watts. Word, C. O., Zanna, M. P., & Cooper, J. (1974). The nonverbal mediation of self-fulfilling prophecies in interracial interaction. Journal of Experimental Social Psychology, 10, 109-120. Zanna, M. P., & Pack, S. J. (1975). On the self-fulfilling nature of apparent sex differences in behavior. Journal of Experimental Social Psychology, 11, 584-591.

Blood Types 21
Author Note Akira Sakamoto, Department of Psychology, Ochanomizu University, Tokyo, Japan; Kenji Yamazaki, Yamada-Denki, Tokyo, Japan. We thank Hisanori Watanabe, Yutaka Matsui, Hazime Mizoguchi, Tatsuya Sato, Yoshiyuki Watanabe, and Toshio Yoshida for their assistance on this research project. We were also assisted by Mamiko Murai and Eileen Crandall in the translation of this paper. We thank them, too. Correspondence concerning this article should be addressed to Akira Sakamoto, Department of Psychology, Ochanomizu University, 2-1-1 Otsuka, Bunkyo-ku, Tokyo 112-8610, Japan. Electronic mail may be sent via Internet to [email protected].
Footnotes 1Those studies which were conducted outside Japan do not aim to examine whether blood-typical stereotypes in Japan are true or not, with the exception of Coscarelli, Stepp, & Lyerla (1989). 2Such unrelatedness is found only for the blood types of the ABO system. For example, the blood types of the HLA system are expected to be correlated with people’s various characteristics (McGuffin, 1979; Gattaz, 1981). These differences between blood type systems are yet to be explained. 3We can find a few articles written in English, in which the prevalence of blood-typical stereotypes in Japan is introduced (Coscarelli, Stepp, & Lyerla, 1989; Treen & Hoshiai, 1985). In addition, Furukawa, the first person who presented the hypothesis regarding a correlation between blood types and personality, published a paper in English in an American journal (Furukawa, 1930). 4The population of Japan is approximately 120 million, and a sample group of approximately 3,000 people means 1/40,000 of the entire population. Thus, the probability of one person being selected as a sample twice or more can be considered virtually zero. 5The objective of this survey was to comprehensively investigate a variety of variables such as the life styles or value perceptions of Japanese people. Blood types and personality were only part of such investigation. Therefore, it is believed that the subjects did not expect that the correlations between blood types and personalities were to be the subject of
Blood Types 22
later research. 6We obtained data only from women, but this is not problematic because it was shown that between men and women the content of blood-typical stereotypes doesn’t differ, although as mentioned earlier, the strength of their beliefs does (Matsui & Kamise, 1994). Therefore, we can obtain a general finding even from only women. 7As mentioned earlier, we do not have raw data; therefore, we cannot deny the possibility of existence of correlations between scores by calculating the correlations. We also cannot calculate indices of inter-item correlations of the scales such as Cronbach’s alpha coefficient. 8This is because as to the items, we know the distribution of item scores, that is, the numbers of subjects belonging to the two levels of the items – yes or no – in each of the 440 categories. By adding up these numbers in each blood group, we could compute the total numbers of subjects belonging to those two levels for the blood group. As for the blood-typical personality scores, they had six levels, but we could not know the numbers of subjects belonging to the six levels. This is because those scores are the compositions of scores of the six items. If we know the distribution of scores for each of the items, we cannot know it for the compositions of the items, when we do not have raw data.

Blood Types 23
Table 1 The number of publicized books and magazine articles on blood types and personality
Year Book Article Total
1972 1 2 3
1973 6 4 10
1974 5 7 12
1975 5 7 12
1976 8 7 15
1977 1 8 9
1978 7 8 15
1979 7 7 14
1980 17 4 21
1981 12 9 21
1982 22 17 39
1983 19 24 43
1984 51 66 117
1985 59 28 87
1986 16 13 29
1987 9 28 37
1988 16 9 25
1989 2 6 8
1990 17 12 19
1991 14 20 34
1992 26 1 27
1993 2 0 2
Notes: These values are based on Mizoguchi (1994).

Blood Types 24
Table 2 Percentages of Subjects Answering Yes to the 24 Items. ---------------------------------------------------------------------------
Percentages Centered percentages
--------------- ---------------- A B O AB A B O AB
--------------------------------------------------------------------------- 1 I am ready to keep company with everyone. .42 .76 .88 .48 -.22 .12 .25 -.15
2 I make an effort toward my goal. .86 .45 .53 .68 .23 -.18 -.10 .05
3 I like to be a leader. .35 .56 .63 .40 -.13 .08 .15 -.09
4 I am not particular about things. .16 .77 .80 .51 -.40a .21 .24 -.05
5 I do not know how to refresh myself. .47 .20 .21 .35 .16 -.11 -.10 .04
6 I am serious when I should be so. .90 .47 .54 .63 .27 -.17 -.09 -.01
7 I often tell jokes to make others laugh. .41 .70 .77 .40 -.16 .13 .20 -.17
8 I do not change my idea after I present it. .60 .72 .55 .69 -.04 .08 -.09 .05
9 I am not worried by what I was told. .14 .68 .64 .53 -.36 .18 .15 .03
10 I have a lot of friends. .66 .76 .91 .49 -.05 .06 .20 -.21
11 I am often worried about things. .90 .23 .32 .46 .42 -.24 -.16 -.01
12 I sometimes indulge in fancies. .59 .55 .66 .57 -.01 -.04 .07 -.02
13 I am not good at getting along with others. .41 .23 .11 .45 .11 -.07 -.19 .15
14 I like to have parties in my home. .45 .61 .73 .40 -.10 .06 .19 -.15
15 I am careful when doing something. .93 .24 .32 .58 .41 -.27 -.20 .06
16 I am often moved to tears. .66 .47 .68 .34 .12 -.07 .14 -.19
17 I often change my mind. .37 .80 .59 .63 -.23 .20 -.01 .03
18 I am a good loser. .27 .72 .74 .49 -.29 .17 .19 -.06
19 I am persevering. .84 .34 .47 .52 .29 -.20 -.07 -.02
20 I cannot be quiet and I make merry when I .49 .77 .85 .45 -.16 .13 .21 -.19
am delighted.
21 I am shy. .66 .11 .16 .38 .33 -.22 -.17 .05
22 I sometimes burst into a rage. .69 .58 .58 .66 .06 -.05 -.05 .03
23 I like to think deeply alone more than to .67 .27 .29 .59 .22 -.19 -.17 .13
talk with others.
24 I do not like to visit someone without .81 .37 .50 .54 .25 -.19 -.06 -.01
presents.
--------------------------------------------------------------------------- Notes: a) The high and low percentage items are underlined.
Blood Types 25
Table 3 Results of Type-I-personality score Meansa Planned Comparison c
Year Type A Type B Type O Type AB ANOVA b F d Items d
1978 .36 .15 -.05 .15 .40 .83 .29 -.04<d<.09 1979 -.10 .16 -.29 .26 .66 .16 .13 -.08<d<.06 1980 .41 .08 -.50 -.37 1.25 .29 .17 -.02<d<.08 1981 .45 -.02 -.13 -.03 .84 2.43 .50 .02<d<.09 1982 .18 .14 -.46 .30 .96 .22 .15 -.02<d<.09 1983 .35 .36 -.26 .56 1.17 .12 .11 -.03<d<.07 1984 .74a -.73b -.43b .44a 9.45** 13.92** 1.19** .04<d<.12 1985 .91a -.30b -.15b .36ab 5.59** 12.29** 1.12** .00<d<.14 1986 .62 -.26 -.41 -.42 2.66+ 7.79** .89** .04<d<.14 1987 .69a -.19ab -.60b .48a 3.81* 5.07* .72* .02<d<.12 1988 .16a -.97b -.96b -.66b 3.80* 10.54** 1.04** .04<d<.14
Whole .40a -.20c -.30c .10b 11.91** 25.60** .51** .03<d<.09
Notes: a) These columns indicate the Type-I-personality scores averaged in each blood group, and the results of multiple range tests with Student-Newman-Keuls method. The tests were conducted for the data of each year when the results of one-way ANOVA showed that the mean values of the year were significantly different between the four blood groups. b) This column indicates F values obtained in this ANOVA. c) This column indicates F values obtained in a planned comparison. In the test, it was examined how much the contrast of Type A group and the other three groups affected the Type-I-personality scores. The column also indicates the effect sizes (d) that were computed from the F values. In these analyses, 40 category data was used for each year. d) This column is for the effects sizes (d) obtained by computing how much the contrast affected each of the six item scores that constitute the Type-I-personality scores. It shows the maximum and minimum values of the computed effect sizes. As for these effect sizes, the number of data was about 3000 for each year. The effect sizes are significant (p<.05) if they are over .02. They are highly significant (p<.01) if they are over .03. ** p<.01 *p<.05 +p<.1

Blood Types 26
Table 4 Results of Type-II-personality score Means Planned Comparison
Year Type A Type B Type O Type AB ANOVA F d Items
1978 -.47 -.09 .02 -.24 .57 .18 .14 -.06<d<.06 1979 -.10 -.15 .04 -.31 .20 .01 .03 -.03<d<.05 1980 -.09 .44 -.30 .23 .98 1.67 .41 -.04<d<.11 1981 -.41 -.01 .07 .04 .59 .07 .08 -.01<d<.07 1982 -.20 -.04 .37 -.16 .48 .01 .03 -.03<d<.05 1983 -.35 -.21 .13 -.41 .53 .00 .00 -.04<d<.04 1984 -.63c .65a .27ab -.38bc 5.25** 9.23** .97** .03<d<.09 1985 -.70b .42a .10ab -.19ab 2.69+ 4.17* .65* -.07<d<.12 1986 -.57 .28 .23 .33 2.15 .71 .27 .00<d<.07 1987 -.56b .25ab .60a -.26ab 3.20* .96 .31 .01<d<.06 1988 -.12b .98a .82ab .67ab 2.90* 2.51 .51 .00<d<.11
Whole -.38b .23a .21a -.06a 9.61** 8.11** .29** .00<d<.05
Notes: The notes of Table 3 can be referred to for the explanation of the values described in this table.

Blood Types 27
Table 5 Results of Type-III-personality score Means Planned Comparison
年 Type A Type B Type O Type AB ANOVA F d Items
1978 -.34 -.53 -.10 -.19 .32 .43 .21 -.06<d<.05 1979 -.24 -.16 .06 .02 .21 .27 .17 -.03<d<.07 1980 -.01 .05 -.11 .27 .18 .24 .16 -.07<d<.04 1981 -.03 -.23 .12 .27 .40 .09 .10 -.07<d<.04 1982 -.18 -.03 -.02 -.09 .04 .04 .06 -.02<d<.04 1983 -.28 -.02 -.05 -.24 .15 .11 .11 -.06<d<.09 1984 -.38 .31 .42 -.25 1.87 2.48 .20 -.06<d<.08 1985 -.42b .50a .26ab -.48b 4.69** 2.24 .48 .02<d<.11 1986 -.32 .27 .26 .52 1.74 .10 .48 -.03<d<.08 1987 -.13 .08 .47 -.29 1.10 2.58 .51 .01<d<.10 1988 .15 .59 .58 -.11 1.32 1.15 .34 .00<d<.07
Whole -.20b .08ab .17a -.05ab 2.84* 4.40* .21* .00<d<.03
Notes: The notes of Table 3 can be referred to for the explanation of the values described in this table.

Blood Types 28
Table 6 Results of Type-IV-personality score Means Planned Comparison
年 Type A Type B Type O Type AB ANOVA F d Items
1978 .05 .26 -.02 .14 .13 .01 .03 -.08<d<.07 1979 .10 .11 -.24 -.08 .20 .02 .05 -.01<d<.05 1980 -.09 .12 .07 -.15 .14 .22 .15 -.05<d<.04 1981 .05 .37 -.07 -.41 .75 1.51 .39 -.07<d<.00 1982 .11 .05 -.01 .11 .03 .02 .05 -.01<d<.04 1983 .20 -.05 .07 -.05 .12 .09 .10 -.07<d<.05 1984 .17 -.04 -.13 .34 .49 .95 .31 -.02<d<.07 1985 .28 -.34 -.11 .16 1.25 .60 .25 -.02<d<.04 1986 .20 -.23 -.10 -.40 .61 .92 .31 -.09<d<.03 1987 -.10 .03 -.29 .17 .45 .73 .27 -.02<d<.05 1988 -.07 -.20 -.28 .31 .80 2.15 .47 -.05<d<.00
Whole .08 .01 -.10 .01 .63 .03 .02 -.00<d<.00
Notes: The notes of Table 3 can be referred to for the explanation of the values described in this table.