bloomberg l.p. issue 143 global technical strategy oct 3rd ...3 chart of the week: mexican peso...
TRANSCRIPT

Japanese Yen Mexican Peso USTW$ vs. DXY Index The Aussie Brazilian Real Know Sure Euro Market Recap in Excel: Click here
(Click a title to jump to page)
Contributor Corner
NA: East Coast
Paul Ciana, CMT [email protected]
Jonathan Lin, CMT CFA [email protected]
Greg Bender, CMT [email protected]
Bill Sindel [email protected]
Alex Cole [email protected]
NA: West Coast Geoff Wakeling [email protected]
South America Andre Lapponi [email protected]
Europe Philip Sexton, MSTA [email protected]
Middle East Akshay Chinchalkar [email protected]
Asia/Pac Terry Gaut [email protected]
Sheba Jafari [email protected]
Bloomberg L.P. Global Technical Strategy
Issue 143
Oct 3rd, 2011
CHART<GO> Events
Visit BU<GO> for
events coming to
your area
ATM<GO>
DEMA<GO>
ERLA<GO>
KASE<GO>
RRGR<GO>
TASP<GO>
This Week: FX Markets
Visit CHART<GO> for a new
“Showcase” chart utilizing
many of the statistical indica-
tors recently added to
Bloomberg

2
Chart of the Week: Japanese Yen Bloomberg L.P.
Global Technical Strategy
The Bollinger Bands study with the Bandwidth feature enabled can be useful in determining if a mean reversion or trend following trade should be taken. The above graph of the Japanese Yen depicts a daily candle chart with the 50, 100 and 200 day moving averages and a 60 day (three month) Bollinger band study. Below is the Bollinger Bandwidth with a one year average line drawn on it (red) by using the available tool in the Annotate palette. The Bollinger Bands help us visualize the price volatility of an instrument. In scenarios where the Bandwidth is greater than average and price is trading near the lower band, such as early May and August 2011 (black rectangles), an oppor-tunity may be presenting itself for a retracement to the mean. Currently, the bands are narrowing as represented by the converging upper band and lower band and the declining Bandwidth line. When analyzing Bandwidth historically, it is currently less than the one year average. Therefore price volatility can be considered less than average. In such an environment, trading price in the direction it breaks the Bollin-ger band is more ideal. Such an example was present in early July 2011 (black oval). Since May, the Yen continues to strengthen against the dollar and it has not successfully closed (stayed) above the 60 day moving average. At present, many traders appear to be bullish on the Yen (falling spot rate) at about 77.31 and bearish (rising spot rate) at 76.12. Consistent closes above the 60 day moving average would have to occur to ever take a step closer to thinking bearishly about the Yen.
Paul Ciana, CMT

3
Chart of the Week: Mexican Peso Bloomberg L.P. Global Technical Strategy
The Mexican Peso has experience a relatively wide distribution, between 11.50 to 14.10, since mid 2009. The green ver-tical distribution shows that about 1/3 of this distribution has been between 12.30 - 13.20. The Slow Stochastic Oscillator and the Bloomberg Trendstall have done fairly well at identifying turning points. The Slow Stochastic (bottom panel) helps to identify when price may have rallied or fallen to far to fast when the indica-tor rises above 80 or falls below 20. Market participants describe a security whose Stochastic indicator has reached these levels as overbought or oversold. Since the indicator is comprised of two lines, the %D and %DS, it’s important to observe when the %D crosses the %DS, especially when overbought or oversold to identify a point of entry or exit. To validate these signals from the Slow Stochastic, we can reference the Bloomberg Trendstall study which marks the chart with a triangle to suggesting the trend is pausing and may reverse. The reason the markers appear is because the five day Rate of Change of the Average Directional Movement (ADX) has declined after achieving a value of 15 or greater. The above chart combines three concepts; market distribution, momentum, and directional movement. When used cor-rectly it can help you stay on the right side of the trend.
Andre Lapponi

4
Alternatively, one may want to consider reviewing the Trade Weighted indices published by the Federal Reserve, daily data series posted on a weekly basis. These indices, less lob-sided and covering a broader scope of currencies, may be quite helpful in studying the long-term trends of the U.S. dollar.
The chart above depict the DXY (black bars, right scale) and the 7-constituent Trade Weighted Major Currency Dollar index (USTW$ Index, orange line, left scale) on the upper panel, and the 26-constituent U.S. Trade Weighted Broad Dol-lar index (USTWBROA Index) at the lower panel. (See http://www.federalreserve.gov/Releases/H10/weights/ for compo-nent weight listings.) With only 7 components and a 36.5% weight in Euro, the Major Currency index still resembles the DXY somewhat in price profile. Nevertheless, the less lob-sided index has recently slipped to a historical low while the DXY has held above its 2008 lows. Despite the sharp bounce seen this month, the structural trend of the USTW$ re-mains abysmal at best.
The USTWBROA’s technical profile may be even more alarming. With major trading partners China (19.8%) and Mexico (11.5%) thrown into the mix, this index violated a 26-year uptrend in 2006 and appears to be completing a 15-year top, offering graphic evidence of the dollar’s long slide from its throne of global de facto reserve currency. The technical analysis adage “the bigger the top, the bigger the drop” may suggest a rough road ahead for the greenback for some time to come.
Chart of the Week: USTW$ vs. DXY Bloomberg L.P.
Global Technical Strategy
The most frequently cited index for the U.S. dollar is arguably the DXY (DXY Index). However, the majority of the merely 6-component DXY’s weight lies with the Euro, at 57.6%. (DXY <GO> displays the weightings and daily changes for the components, with a partial screen shot shown at left). As such, the DXY is a presentation of how the U.S. dollar measures versus a few major currencies, and is becoming less representative of the ever increasingly global marketplace.
Jonathan T. Lin, CMT, CFA
5
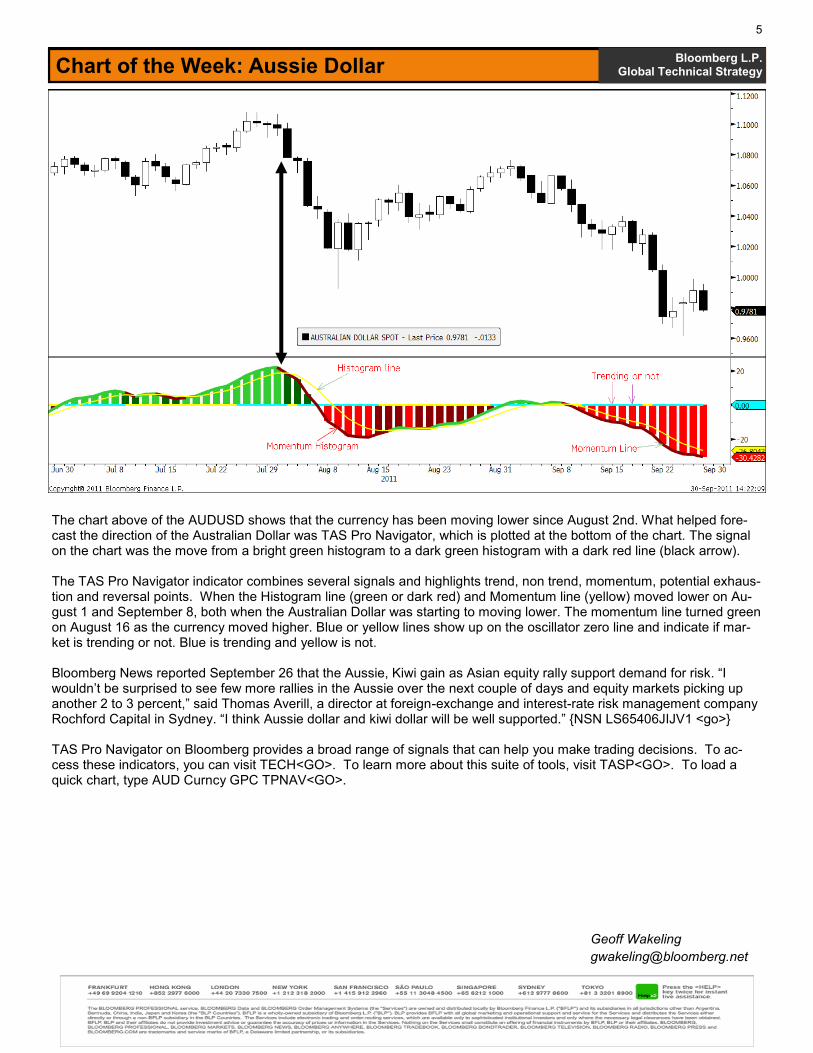
Chart of the Week: Aussie Dollar Bloomberg L.P.
Global Technical Strategy
The chart above of the AUDUSD shows that the currency has been moving lower since August 2nd. What helped fore-cast the direction of the Australian Dollar was TAS Pro Navigator, which is plotted at the bottom of the chart. The signal on the chart was the move from a bright green histogram to a dark green histogram with a dark red line (black arrow). The TAS Pro Navigator indicator combines several signals and highlights trend, non trend, momentum, potential exhaus-tion and reversal points. When the Histogram line (green or dark red) and Momentum line (yellow) moved lower on Au-gust 1 and September 8, both when the Australian Dollar was starting to moving lower. The momentum line turned green on August 16 as the currency moved higher. Blue or yellow lines show up on the oscillator zero line and indicate if mar-ket is trending or not. Blue is trending and yellow is not. Bloomberg News reported September 26 that the Aussie, Kiwi gain as Asian equity rally support demand for risk. “I wouldn’t be surprised to see few more rallies in the Aussie over the next couple of days and equity markets picking up another 2 to 3 percent,” said Thomas Averill, a director at foreign-exchange and interest-rate risk management company Rochford Capital in Sydney. “I think Aussie dollar and kiwi dollar will be well supported.” {NSN LS65406JIJV1 <go>} TAS Pro Navigator on Bloomberg provides a broad range of signals that can help you make trading decisions. To ac-cess these indicators, you can visit TECH<GO>. To learn more about this suite of tools, visit TASP<GO>. To load a quick chart, type AUD Curncy GPC TPNAV<GO>.
Geoff Wakeling

6
New Study: Know Sure Euro Bloomberg L.P.
Global Technical Strategy
Every oscillator has its intricacies that distinguish it from the next. The concept behind Martin Pring’s Know Sure Thing oscillator (KST) is that price trends are dictated by multiple time cycles, and furthermore that trend reversals can be iden-tified when change occurs simultaneously across a multi-time frame logic. By calculation, KST utilizes four rates of change in one indicator panning short, intermediate and long term intervals, with a weighting mechanism that places more influence on longer term cycles.
In the chart above, Euro Sterling forms a long term pattern called the symmetrical triangle, with a series of successively lower peaks and higher troughs. The formation in itself is non directional in so much as an upside breakout would indi-cate a bullish move and a downside breakout a bearish move. The dotted black vertical trendlines overlaying the chart correspond with crossovers on the KST, and identify almost unfailingly price testing the edges of the triangle formation. Also identified in the chart is a 19 week or 95 trade-day cycle, with a larger harmonious 40 week, 190 trade-day cycle. There are obvious peaks and troughs that date back to 2008 and before, which certainly echo the long term cycles of the strengths and weaknesses of the Sterling with respect to its neighboring and recently unstable European economy. Nonetheless, given the close ties between the UK economy and the euro zone, the euro-sterling is a market more or less prone to mean-deviation.
A simple and time tested approach to finding cycles is through the method of smoothing or “de-trending”. Because the KST incorporates four rates of change rather than just one, it proves highly effective in this task. What I also find helpful is changing the moving average type to triangular rather than simple, as it creates a set of weighting factors that are smallest at the ends and pronounced in the center. While no cycle is perfect in its execution, it can give a good roadmap to price direction. Euro-sterling is closely entering an area of synchronized cycles, whereupon both subcycle and pri-mary cycle valleys occur at the same time. Should it rebound from here, we can use the top of the formation as our next price target. But if it breaks lower, we could be seeing an entirely new trajectory.
Sheba Jafari, MSTA

7
Chart of the Week: Brazilian Real Bloomberg L.P. Global Technical Strategy
The above chart depicts the Brazilian Real in black and the S&P 500 in orange. Since early 2009, the S&P500 has
moved significantly higher and the Real lower (strengthening against the USD.) Indeed, the relationship has been pre-
dominantly inverse throughout this three year period. The S&P500 topped and the Real bottomed during Q2 and Q3 of
2011.
More recently, the S&P500’s decline at the end of July 2011 lead the Real’s upward breakout from the one year channel
it was in. The recent collapse of the Real may indicate a flight to quality to US dollar assets. Although there is turmoil in
the US markets some still consider it relatively safe. Since then the S&P500 has found support at the Q2 2010 highs of
~1120 and has entered a range-bound trend with resistance at ~1220. The Real has found resistance at the Q1 and Q2
highs of ~1.9000 and support at ~1.8000.
The S&P500’s relative strength can be seen in the lower panel which shows a 20 day moving average of the S&P500
divided by the MSCI World Index. Such a ratio can help identify which market is leading the other. This ratio has been
trending higher and recently broke to new highs indicating the S&P500 is outperforming the world index. The strength of
the S&P500 compared to the World Index may lead to a retracement (strengthening) in the Real due to the negative cor-
relation between the two markets.
The S&P has been trading in a very volatile range since the second week of August. You can see clear support and re-
sistance at the top and bottom of this range. The index is being held up by support that is being found at the highs of
last summer’s congestion. A significant breakout in either direction could be telling and would greatly impact the direc-
tion of the Real in the short to intermediate term. If the inverse relationship holds, a break to the upside in the S&P
could signal a return to the down trend in the Real (strengthen against the dollar). If the S&P breaks below support we
could see the Real consolidate its recent spike up and continue in that direction (weaken against the dollar).
Alex Cole

8
Price = Green if up on the day, red if down. % Chg (5) = Green if positive over the last five days, red if negative. 50 Day = 50 Day Moving Average of price. Green if its greater than the 200, red if it’s less than the 200. 200 Day = 200 Day Moving Average of price. Green if its below the 50 day, red if its above the 50 day. 5 Day High = The high over the last five trading days including today. Green if it equals the 20 day high. 5 Day Low = The low over the last five trading days including today. Red if it equals the 20 day low. RSI 9 = Nine day Relative Strength Index. Green if its below 30, red if its above 70. ADX Line = Average Directional Movement. Green if ADX is greater than 25 (trending), red if its lower than 20 (range) 2Y High = Two year high. Green if it occurred in last 20 days. 0.382 = 38.2% retracement of two year range. Yellow if price is within 2% of it. 0.5 = 50% retracement of two year range. Yellow if price is within 2% of it. 0.618 = 61.8% retracement of two year range. Yellow if price is within 2% of it.
Below is a recap of the major financial markets with respect to new highs and new lows, moving averages, relative strength index, average directional movement, and Fibonacci.
Key Support and Resistance Levels Bloomberg L.P.
Global Technical Strategy
Paul Ciana, CMT [email protected]
Sym Last Price % Chg (5) 50 Day 200 Day 5d High 5d Low RSI 9 ADX 2Y High 0.382 0.5 0.618 2Y Low
DXY 79.3490 1.1906 75.4933 76.0015 79.3820 77.3060 74.29 38.00 89.6240 83.1575 81.1600 79.1625 72.6960
EUR 1.3238 -2.0764 1.4064 1.4056 1.3690 1.3234 23.82 35.66 1.5144 1.3896 1.3511 1.3125 1.1877
GBP 1.5466 -0.6039 1.6085 1.6131 1.5716 1.5451 33.75 33.00 1.7658 1.6071 1.5581 1.5090 1.3503
JPY 76.6000 -0.3003 76.9962 80.4863 77.2700 76.2700 46.48 11.79 103.2900 92.8461 89.6200 86.3939 75.9500
AUD 0.9556 -2.7052 1.0399 1.0388 0.9986 0.9552 21.90 42.21 1.1081 0.9143 0.8545 0.7947 0.6009
BRL 1.9062 -4.0904 1.6644 1.6369 1.9065 1.7948 74.41 58.47 2.6202 2.2034 2.0746 1.9458 1.5290
CL1 77.34 -3.32 87.01 95.12 84.77 76.85 31.50 30.57 114.83 83.34 73.62 63.89 32.40
NG1 3.61 -4.57 3.95 4.21 3.85 3.59 29.95 19.77 7.36 5.47 4.88 4.30 2.41
GC1 1652.50 3.90 1744.47 1528.63 1676.60 1585.00 40.10 32.79 1920.70 1447.13 1300.85 1154.57 681.00
SI1 30.63 2.42 39.03 36.04 33.59 29.10 30.01 31.25 49.82 34.00 29.11 24.22 8.40
CRY 295.71 -2.34 328.60 341.17 312.26 294.12 25.08 30.43 370.72 305.57 285.44 265.31 200.16
GT2 0.2314 3.7936 0.2276 0.4974 0.2627 0.2247 57.08 22.65 1.9508 1.2603 1.0470 0.8336 0.1431
GT5 0.8637 -3.4127 0.9924 1.6929 1.0112 0.8605 44.49 26.15 3.0735 2.1899 1.9170 1.6441 0.7605
GT10 1.7824 -5.8889 2.1849 3.0042 2.0634 1.7755 35.49 34.92 4.1026 3.1739 2.8870 2.6001 1.6714
GT30 2.7696 -7.2882 3.4729 4.1896 3.1438 2.7586 27.71 38.28 4.8559 3.9594 3.6825 3.4055 2.5090
INDU 10697.12 -2.92 11353 11981 11369.30 10684.29 36.62 23.01 12876 10429 9673 8917 6470
SPX 1106.62 -4.65 1192 1279 1195.86 1104.61 33.00 22.67 1371 1102 1019 936 667
IBOV 51364.22 -4.22 54965 63004 54992.05 51119.99 26.48 19.88 73103 56422 51269 46116 29435