bls_1370-06_1969.pdf
TRANSCRIPT
EMPLOYMENT and EARNINGS
VOL. 16 NO. 6 DECEMBER 1969
In this issue:N e w in fo rm a t io n on la b o r fo rc e n o n p a r t ic ip a n ts
A g e adjustments to occupational employment data
U. S. D E P A R T M E N T O F L A B O R - Bureau of Labor StatisticsDigitized for FRASER http://fraser.stlouisfed.org/ Federal Reserve Bank of St. Louis

EMPLOYMENT and EARNINGS
CURRENT STATISTICS ON
Labor ForceEmploymentUnemploymentHoursEarningsLabor Turnover
In cooperation with the Bureau of Labor Statis tics, the data in this publication are collected by the Bureau of the Census (Department of Commerce), Manpower Administration, State Employment Security Agencies, and State Departments of Labor. A brief description of the cooperative statistical programs of the BLS with these agencies is presented in the Technical Note. The State agencies are listed on the inside back cover.
Subscription price: $7.50 a year ($2.00 additional for foreign mailing). Single issues are 65 cents.
This report may be ordered through the Superintendent of Documents, U.S. Government Printing Office, Washington, D. C. 20402, or any of the BLS Regional Offices.
Use of funds for printing this publication approved by the Director of the Bureau of the Budget (February 14, 1966).
U.S. DEPARTMENT OF LABOR George P. Shultz, Secretary
BUREAU OF LABOR STATISTICS Geoffrey H. Moore, Commissioner
OFFICE OF MANPOWER AND EMPLOYMENT STATISTICS
Harold Goldstein Assistant Commissioner
Digitized for FRASER http://fraser.stlouisfed.org/ Federal Reserve Bank of St. Louis

EMPLOYMENT and EARNINGS
VOL. 16 NO. 6 DECEMBER 1669
Joseph M . F inerty , Ed itor
John E. B regger, A sso c ia te Ed itor
CONTENTSPage
Employment and unemployment developments, November 1969 ................................ 2New data on persons not in the labor fo r c e ................................................................... 4Age adjustments to occupational employment data...................................................... 28Charts.................................................................................................................................. 38Monthly statistical t a b l e s .............................................................................................. 47Technical n o t e ...................................................................................................................... 135
Digitized for FRASER http://fraser.stlouisfed.org/ Federal Reserve Bank of St. Louis

Employment and Unemployment Developments, November 1969
Unemployment dropped sharply in November, while nonfarm employment was virtually unchanged. The overall unemployment rate, which had risen substantially in September and remained about the same in October, fell from 3.9 to 3.4 percent in November, a return to the August level.
Unemployment rates for secondary workers— teenagers, adult women, and part-time workers— were reduced significantly over the month. Among primary breadwinners— adult men, married men, and all full-time workers— rates of unemployment also moved down, but more moderately. Jobless rates for blue-collar and manufacturing workers, however, remained at their October levels.
Nonfarm payroll employment remained virtually unchanged in November, after seasonal adjustment, but would have increased modestly except for a large net rise in the number of manufacturing workers off payrolls because of strikes. (Workers on strike are not counted as employed in the payroll employment series,whereas they are classified as employed-----witha job but not at work---- in the household series.)The slowdown in the pace of payroll employment growth, which began in July, remained evident in November. After a l l o w a n c e for strikes, monthly payroll employment advances have averaged only 80,000 in the June-November period compared to 240,000 in the November 1968 to June 1969 period.
Unemployment
The number of unemployed persons totaled 2.7 million in November. Unemployment usually rises at this time of year, but this November it dropped, as a number of workers unemployed in October either found jobs or left the labor force. After seasonal adjustment, unemployment was down by 360,000 from October, with nearly all of the decline among workers who were either new entrants or re-entrants to the labor force.
The November drop in unemployment was primarily among teenagers, young men (age 20
to 24), and adult women. Jobless rates for teenagers fell from 13.0 to 11.6 percent, for young men from 6.5 to 5.3 percent, and for adult women from 4.0 to 3.5 percent. The over-the- month declines for teenagers and women reduced these unemployment rates to the post-Korean lows of early 1969, while the rate for young men dropped to its mid-summer level.
Jobless rates also moved down for adult men (2.2 percent), married men (1.5 percent), and all full-time workers (3.0 percent), although not to the same extent as for the more marginal workers. The rates of joblessness amongthese primary workers dropped back to their August levels but were somewhat above their post- Korean lows of early 1969.
Rates of unemployment for white workers (3.1 percent) and Negro workers (6.2 percent) were both down over the month. The November rates were about the same as in August but slightly above the rates posted in early 1969.
Despite the declines in jobless rates for most groups of workers, rates for blue-collar workers (4.2 percent) and for persons who had last worked in the manufacturing industry (3.8 percent) were unchanged over the month. These rates have risen gradually since late spring. For workers covered under State unemployment insurance programs, the jobless rate move from 2.2 to 2.4 percent over the month. Their rate has also inched upward since late spring.
Industry Employment
Nonfarm payroll employment was virtually unchanged in November but would have shown a modest gain (about 100,000) except for substantially increased strike activity, particularly in manufacturing. Employment gains were reported in State and local government (50,000) and trade and construction (35,000 each).
Manufacturing employment d e c l i n e d by 175,000 between October and November. Most of this decline was attributable to new strike
2Digitized for FRASER http://fraser.stlouisfed.org/ Federal Reserve Bank of St. Louis

activity in the durable goods industries, primarily in electrical equipment. However, small employment declines were also reported in most other durable goods industries. The nondurable goods industries reported a job gain of 50,000 in November. Nearly all of the increase occurred in the food industry, reflecting the end of a strike and a rise from the artificially low October employment level in this industry which resulted from a late survey week.
Workweek
The workweek for all rank-and-file workers on private nonagricultural payrolls declined seasonally in November. On a seasonally adjusted basis, the average workweek was unchanged at 37.6 hours, after falling 0.2 hour in October. Except for February 1969, when hours of work were affected by unusually bad weather, this was the lowest level reported since late 1968. A decline in average hours in trade offset longer workweeks in other major industry divisions. The average workweek in manufacturing was unchanged over the month, following a 0.3 hour decline to 40.5 hours in the previous month. The manufacturing workweek was at its lowest level in more than 1-1/2 years (with the exception of February 1969).
For the second month, factory overtime declined, edging down over the mo nth by 0.1 hour to 3.4 hours (seasonally adjusted). In the durable goods sector, overtime registered a 0.3 hour drop from October and was at its lowest point in 2 years (with the exception of April 1968). Since September, overtime in durables has declined
by one-half hour. Overtime hours in nondurable goods industries were unchanged in November.
Earnings
Average hourly earnings for production and nonsupervisory workers on private payrolls were unchanged in November at $3.11. Hourly earnings were up 19 cents, or 6.5 percent, from a year ago.
Average weekly earnings fell by 62 cents in November to $116.63, reflecting the seasonal decrease in average weekly hours. Over-the- month declines in construction and trade offset the gains registered in manufacturing and finance, insurance, and real estate. Compared to a year ago, average weekly earnings were up by $7.13 (6.5 percent).
Labor Force and Total Employment
The civilian labor force totaled 81.4 million workers in November, about 2.2 million more than a year ago. On a seasonally adjusted basis, nearly three-fifths of the over-the-year rise occurred between November 1968 and February 1969. Labor force growth in recent months has slowed significantly.
Total employment was 78.7 million, up 2.1 million over the year. Total nonagricultural employment, which rose sharply in late 1968 and early 1969, has shown only moderate growth in the summer and fall of this year. Employment in agriculture has been on an unusually sharp downward trend since February, although it edged up in November.
3
Digitized for FRASER http://fraser.stlouisfed.org/ Federal Reserve Bank of St. Louis
New Data on Persons Not in the Labor Forceby Paul O. Flaim*
Regular publication of new data on persons not in the labor force—that is, those who are neither working nor looking for work—begins with this issue of Employment and Earnings and will continue on a quarterly basis. Presentation of these data is designed to answer such questions as: How many of the persons outside the labor force want work but are prevented from looking for a job because of illness, home responsibilities, or other impediments? How many of them are “discouraged workers,” that is, persons who are willing and able to work but think that any search for a job would be in vain? How many have worked previously, and when and why did they leave their last job? How many intend to seek work in the near future? 1/
The new information on nonparticipants in the labor force is based on data collected for the Bureau of Labor -Statistics by the Bureau of the Census as part of the Current Population Survey (CPS). This nationwide sample survey is conducted monthly in about 50,000 households and provides the basic national labor force and unemployment data. To obtain the new data, a series of special questions on nonparticipation in the labor force—questions 24A through 24E — were added beginning in January 1967. (A portion of the questionnaire showing these questions appears on page 6.)
Because a person’ s reasons for being outside the labor force are not likely to change from 1 month to another, the CPS interviewers ask the special questions in only 1 of the 4 consecutive monthly visits to the household. 2 / Repeating the questions every month would unnecessarily lengthen the interview and may even lead to a reduction in cooperation from some of the respondents.
Since the new data on persons not in the labor force are derived from only one-fourth of the CPS sample (or about 12,500 households), they are subject to somewhat greater sampling
variability than are estimates based on the full sample. It is mainly for this reason that the results are presented on a quarterly average basis. Standard errors for these quarterly data may be approximated by applying a factor of 1.4 to the standard errors of the monthly data from the entire CPS sample, shown in tables B, C, and D of the “Technical Note” in the back of this publication.
Comparability with Other Data
The new quarterly data on the nonparticipants in the labor force are designed to supplement some limited data which always have been available from the CPS and appear monthly in table A-3 of this publication. The data in this table, however, describe only the major activity of the nonparticipants, who are classified as either “ in school,” “keeping house,” “unable to work,” or “other reasons.”
By asking the additional questions, some of the nonparticipants now can be placed in two additional categories which better describe their reasons for being outside the labor force. These two categories are: “retirement or old age” and “think cannot get job.” More importantly, how many of the nonparticipants want jobs and how
*Of the Division of Employment and Unemployment Analysis, Bureau of Labor Statistics.
1/ Some of these new data on the reasons for nonparticipation in the labor force already have been presented and analyzed in a recent Special Labor Force Report. See Paul O. Flaim, “Persons Not in the Labor Force: Who They Are and Why They Don’t Work,” Monthly Labor Review, July 1969, pp. 3-14. A companion report now being prepared will focus on the nonparticipants as a labor force reserve.
2 / A household selected for the CPS sample is visited by interviewers for an initial period of 4 consecutive months. The household is then dropped from the survey for an 8-month interval before being returned to the sample for a second 4-month period.
4Digitized for FRASER http://fraser.stlouisfed.org/ Federal Reserve Bank of St. Louis

many intend to seek work in the future can now be determined. Additional i n f o r m a t i o n also is gathered about their education, previous work experience, and reasons for leaving their last job.
The classification of the nonparticipants on the basis of the data obtained through this special series of questions (24A-D) is carried out as follows: If he states that he wants a job (24C), he is generally classified according to the reasons for not seeking work cited in answer to 24D, with ill health and disability given priority over other reasons. If he does not want a job when interviewed but has worked during the preceding 5 years, the nonparticipant is classified either on the basis of his major activity during the reference week (question 19) or his reasons for leaving his last job (24B), whichever is deemed to describe more accurately his current status. If he neither wants a job when interviewed nor has worked in the preceding 5 years, his classification is based solely on his activity during the reference week.
The classification system for the new data on the nonparticipants is not without some problems and limitations. One such problem arises when persons give more than one reason for not seeking work. When this occurs, they are generally classified according to the reason or impediment which is deemed to be the most serious obstacle to participation. Under this system, ill health and disability are given priority over other reasons. Thus, a woman citing both family responsibilities and poor health as reasons for not seeking work would be placed in the “ ill health, disability” category. Although both conditions may be equally forbidding to her, she could conceivably make some arrangement whereby she could work despite the family needs, but she would generally have much less control over her health conditions.
Because of technical problems arising from separate estimating procedures, the total number of nonparticipants as computed from the one- fourth sample may differ slightly from data derived from the entire CPS. For most demographic groups, these differences are usually very minor.
More important differences between the two series of data arise in the classification of the nonparticipants according to their reasons for not seeking work. These differences are outlined schematically at the end of this article.
The Tables
The new quarterly data on persons not in the labor force will be presented in 10 special tables. In addition to classifying the nonparticipants according to their reasons for being outside the labor force, these tables also will contain information on the job desire of these persons, their previous work experience, and their future jobseeking intentions.
Three of the 10 tables—1, 6, and 9—will present data only for the most recent quarter. The other seven tables will present data for the comparable year-ago quarter as well as for the most recent one. The 10 tables which are published in this issue on pages 10-17 cover the third quarter of 1969, and seven of them also present comparable data for the third quarter of 1968.
In addition to these 10 tables, which will be published on a regular quarterly basis, this issue contains a series of special tables which present historical quarterly data on persons outside the labor force from the first quarter of 196 7 through the second quarter of 1969. Whereas the data in the regular tables are presented by age group as well as by sex and race, the special tables contain no age detail and more limited coverage of other characteristics.
5Digitized for FRASER http://fraser.stlouisfed.org/ Federal Reserve Bank of St. Louis

Portion of Current Population Survey questionnaire showing questions used to obtain data on persons not in labor force
22. (If LK in 19, skip to 22A.)Has . . . been looking for work during the past 4 weeks?
Yes O No O (Go to 24)
19. What wos . . . doing most of LAST WEEK-
Working \ Keeping house ' Going to school >
or something else?
Working (Skip to 20A) . . WK O
With a job but not at work J O
Looking for w o r k ..........LK O
Keeping h ouse ............... H O
Going to school............... S O
Unable to work (Go to 24) U O
Other (Specify).................OT O
\
I. Did . . . do any work at all LAST WEEK, not counting work around the house?
(Note: If form or business operator in kh., ask about unpaid work)
/(Co to
Yes O No O 21)
20A. How mony hours
did . . . work LA ST WEEKot off jobs?
20B. INTER VIEW ER CHECK ITEM
49+ a (Skip to item 23)
1*34 O (Go to 20C)
y / 35-48 O (Go to 20D)
20C. Does . . . U SUALLY work 35hours or more o week at this job?
Yes O What is the reason . . . worked less than 35 hours LAST WEEK?
No O What is the reason . . . USUALLY works less than 35 hours a week?
(Mark the appropriate reason)
Slock w ork.................
Materiol shortage . . . . H .
Plant or machine repair..........
New job storted during week .
Job terminated during week . .
Could find only part-time work
Holiday (Legal or religious) . .
Labor dispute .
Bad weather..
Own illness . .
On vo ca tio n .............. . . . . . . OToo busy with housework,
school, personal bus.,etc. O
Did not wont full-time work . . 0 Full-time work week
under 35 hours. . . . . . . . . O
Other reason (Specify)
(Skip to 23 and enter fob worked at last week)___________________
20D. Did . . . lose any time or take any time off LAST WEEK for ony reason such os illness, holiday or slack work?
Yes O How mony hours did . . . toke off?
(Correct 20A if lost time not already deducted} if 20A reduced below 35, correct 20B and fill 20C; otherwise, skip to 23.)
No O 720E. Did . . . work ony
overtime or at more than one job LAST WEEK?
How mony extro hours did . . . work?
Yes O
(Correct 20A and 20B as necessary if extra hours not already included and skip to 23.)
No O
21. (IfJ in 19, skip to 21 A.)Did . . . have a job or business from which he was temporaril y absent or on layoff LAST WEEK?
/Yes
Jf
(Go toO 22)
21 A . Why wos . . . absent from work LAST WEEK?
Own illness . . . .
On vocation . . . .
Bad weather.. . .
Labor dispute . .New job to begin
within 30 days Temporary layoff i it .2)
(Under 30 days) O I (AskIndefinite layoff . 22C3 ) (30 days or more or O | no def. recall date)
Other (Specify).. Ot
22A. What hos . . . been doing in the lost 4 weeks to find work? (Mark aU method used; do not read list.)
Checked pub.employ.ogency O with—
pvt.employ.agency O
employer directly . O
friends or relatives O
(Ask 22B Placed or answered ads . .
21B. Is . . . getting wages or salary for any of the time off LA ST WEEK? ■
Y e s .......... .. O
N o ................. O
Self employed O
21C. Does . . . usually work 35 hours or more a week at th is job?
Yes
No
(Go to 23 and enter job held last week)
O FFIC E
INDUSTRY
0 O 0 A 0 0 O o o N 0
1 o O B O i o o 0 p o2 0 O c o 2 o o 0 Q 03 o 0 D o 3 o o o R 04 o O E o 4 0 0 o s o5 0 0 F o ■ 5 o o o T o6 o o o G o 6 o o u o7 0 o o H o 7 o o V o8 0 o o J o 8 o o w o9 0 o o K o 9 o o X o
L o Y oM o ; z 0
oNothing (Skip to 2 4 ) .............. Q
Other (Specify in notes, e.g., MDTA, Q union or prof, register, etc.)
22B. Why did . . . start looking for work? Wos it because . . . lost or quit a job
ot that time (pause) or was there some other reason?
Lost j o b ........................ O
Quit job .......................... O
Left s c h o o l................... O
Wanted temporary work O
Other (Specify in notes) 0
22C. 1) How many weeks has . . . been
looking for work?
2) How mony weeks ago did . . .s tart looking for work?
3) How many weeks ago was . . . laid
off?
22D. Hos . . • been looking for fu ll-tim e
or port-time work?
Full O Part O
22E. Is there ony reason why . . . could
not toke a job LAST WEEK?i Already has a job O
Yes O I Temporary illness O
No O j Going to school . O
Other (Specify in O ____________notes)_____
22F . When did . . . lost work at o full-tim e job or business losting 2 consecutive weeks or more?
1964 or later (frite month and year).. 0
(Month and year)Before 1964.................
Nev. worked full-tim e 2 wks. or more O
Never worked ot o i l ............ ............. O
(Enter in 23, last full-time civilian job lasting 2 weeks or more, job from which laid off, or **Never Vorkedt')
23. D ESCRIPTION OF JOB OR BUSINESS
23 A. For whom did . . . work? (Name of company, business, organization or other employer.)
23B. What kind of business or industry is this? (For example: TV and radio mfg., retail shoe store, State Labor Dept., farm.)
23C. What kind of work wos . . . doing? (For example: electrical engineer, stock clerk, typist, farmer.)
23D. Was this person
An employee of PRIVATE Co., bus., or individual for woges, salary or comm P O
A GOVT, employee (Federal, State, or county)........................ .. G O
Self-empl in OWN bus., prof, practice, or form.......... .......................................... 0 O
Working WITHOUT PAY in fam. bus. or fa rm ....................................................... WP 0
NEVER WORKED................................................................................................... NEV O
\ Of *ot a farm> ( v. Is the business ^ Yes
I incorporated? ' No
24. IN TERVIEW ER CHECK ITEM
O Unit not in 1st or 5th month (Endquestions)
O Unit in 1st or 5th month (Ask24A-E)
24A. When did . . . lost work for pay at a regular job or business, either fu ll- or part-time?
Within past 12 months O
1 up-to 2 years ago
2 up to 3 years ago
3 up to 4 years ago
4 up to 5 years ago
5 or more years ago
Never w orked..........
> (Go to 24B)
(Skip to 24C)
24B. Why did . . . leave that job?
Personal, family(Incl. pregnancy) or school . . O
Health........................................... O
Retirement or old age ................. O
Seasonal job com pleted............ OSlack work
or business conditions . . . . O Temporary nonseasonal
job completed........................ OUnsatisfactory work
arrangements (Hours, pay, etc.) O
Other. O24C. Does . . . want a regular job now,
either fu ll- or part-time?
Y e s ...............“ . O |Maybe-it depends / ° D)
(Specify in notes). O )
N o ................................. O I (Co to
Don't know ............... O ( 2*E>
24D.What are the reasons. . . is not looking for work? (Mark each reas on mentioned)
• Believes no work ovoiloble in line of work or area . . . O
• Couldn't find any w o r k .......... O■ Lacks nec. schooling, training,
sk ills or experience.......... O■ Employers think log
young or too o l d ............... O• Other pers. handicap
in finding j o b .................... O• Can’ t arrange
child core . O
■ Family responsib ilities.......... O
■ In school or other training . . . O
■ III health, physical d isability O
• Other (Specify in notes).......... O
■ Don't know................................ O
24E. Does . . . intend to look for work
of any kind in the next 12 months?
Y e s ....................................... O
It depends (Specify in notes) O
N o ....................................... O
Don’ t know ......................... O
(If entry in 24B, describe job in 23)
6Digitized for FRASER http://fraser.stlouisfed.org/ Federal Reserve Bank of St. Louis

PRINCIPAL DIFFERENCES BETWEEN TWO SERIES OF DATA ON NONPARTICIPATION IN LABOR FORCE
Data obtained through regular interview of all nonparticipants
in CPS sample
“Going to school”—Includes all the nonparticipants who report “going to school” as their major activity during the reference week (question 19).
“Unable to work”—This group includes only those persons who are afflicted by a physical or mental ailment or disability which is expected to prevent them from working for at least 6 months.
“Keeping house”—This group includes all those persons (mostly women) who report housekeeping as their major activity during the reference week.
“Other reasons”—This group includes all nonparticipants whose activity during the reference week does not fall within the three categories discussed above. (In the new data obtained from
Data obtained through special series of questions asked of one-fourth of nonparticipants in CPS sample
“In school”—In addition to all the nonparticipants who report “going to school” as their major activity during the reference week (question 19), this group includes a small number of persons who, in response to 24D, give “ in school or other training” as their reason for not seeking work. As a result, the number of “in school” nonparticipants obtained through the additional questions asked of one-fourth of the CPS sample is slightly higher (about 1 percent) than the number obtained through the regular interview of the entire sample.
“Ill health, disability”—This group includes all persons who attribute their nonparticipation in the labor force to ill health or disability, regardless of the intensity or expected duration of the condition afflicting them. Consequently, the number of nonparticipants placed in the “ ill health or disability .category” is about twice as large as the number of nonparticipants classified as “unable to work.”
“Home responsibilities”—This category of nonparticipants is roughly synonymous to the “keeping house” group obtained from the entire CPS sample. However, it excludes those persons who, although having kept house during the reference week, cite an illness or disability as the reasons for leaving their last job or as an obstacle to current work-seeking, or who think that it would be impossible for them to find a job. Because of this, the average number of persons placed in the “home responsibilities” category runs about 6 to 7 percent lower than the number classified as “keeping house.”
“Retirement or old age”—The nonparticipants placed in this category through the additional questions are part of those who fall within the “other reasons” category in data collected from
7Digitized for FRASER http://fraser.stlouisfed.org/ Federal Reserve Bank of St. Louis

Data obtained through regular interview of all nonparticipants
in CPS sample
one-fourth of the CPS sample, this group of nonparticipants is divided roughly into the three groups listed in the opposite column: “Retirement or old age,” “think cannot get job,” and “all other reasons.” )
Data obtained through special series of questions asked of one-fourth of nonparticipants in CPS sample
the entire sample. However, this group does not include all persons who might consider themselves “retired” in terms of having permanently separated themselves from their jobs. As used here, the retirement or old age concept applies, first of all, only to persons 60 years and over who have not worked during the previous 5 years and to persons who, regardless of their age, have left their last job because of “retirement or old age.” Even within these two groups, however, a person is not classified as retired if reported as either wanting a job, keeping house (which allows few women to be classified as retired), or if prevented from seeking work by an illness or disability.
“Think cannot get job”—This category includes all nonparticipants who say they want a job (24C) but add that they think it would be impossible for them to find work (24D). These persons are often referred to as “discouraged workers.”
“All other reasons”—This group includes all the nonparticipants who, even on the basis of their responses to the additional questions, cannot be placed in any of the five categories discussed above.
8Digitized for FRASER http://fraser.stlouisfed.org/ Federal Reserve Bank of St. Louis

Contents of Tables on Persons not in Labor Force
Data for Third Quarter 1969... -------— Pag
Table 1. Labor force status of civilian noninstitutional population by age, sex,and reasons for nonparticipation................................................ 10
Table 2. Reasons for nonparticipation in labor force by age and sex............ 11Table 3. Reasons for nonparticipation in labor force by age, color, and sex.... 12Table 4. Job desii^e of persons not in labor force and reasons for not seeking
work by age and sex................. ........................ ................... 13Table 5. Job desire of persons not in labor force and reasons for not seekingwork by color and sex................................<>.......................... 14
Table 6. Persons not in labor force who desire to work but think they cannotget jobs by age, color, sex, and detailed reason................................ 14
Table 7. Most recent work experience of persons not in labor force and reason for leaving last job for those who worked during previous 12 months by age andsex........................................................................... ... 15
Table 8. Most recent work experience of persons not in labor force and reasons leaving last job for those who worked during previous 12 months by color andsex.............................................................................. 16
Table 9. Industry and occupation of last job for persons not in labor force whoworked during previous 12 months by reasons leaving job......................... 16
Table 10. Work-seeking intentions of persons not in labor force and majorcharacteristics of those who intend to seek work within next 12 months by sexand color............................. 17
Data for F irs t Quarter 1967 Through Second Quarter 1969
Table 1. Labor force status of civilian noninstitutional population by sex andreasons for nonparticipation.................................................... 18
Table 2. Reasons for nonparticipation in labor force by sex..................... 19Table 3. Reasons for nonparticipation in labor force by color and sex........... 20Table 4. Job desire of persons not in labor force and reasons for not seeking
work by sex...................................................................... 21Table 5. Job desire of persons not in labor force and reasons for not seekingwork by color and sex............. ..................................... ........ 22
Table 6. Persons not in labor force who desire to work but think they cannotget jobs by color, sex, and detailed reason.............. 23
Table 7. Most recent work experience of persons not in labor force and reasonfor leaving last job for those who worked during previous 12 months by sex...... 24
Table 8. Most recent work experience of persons not in labor force and reasonfor leaving last job for those who worked during previous 12 months by color.... 25
Table 9. Industry and occupation of last job for persons not in labor force who stopped working during previous 12 months for economic reasons as percentof total who stopped working.................................................... 26
Table 10. Work-seeking intentions of persons not in labor force and majorcharacteristics of those who intend to seek work within next 12 months by color. 27
9
Digitized for FRASER http://fraser.stlouisfed.org/ Federal Reserve Bank of St. Louis

HOUSEHOLD DATAQUARTERLY AVERAGES
10
Table 1. Labor force status of c iv i l ian noninstitut iona l popu la t ion by ag e , sex, an d reasons for n o n p ar t ic ip a t io n3rd quarter, 1969
A g e in y e a r s
L a b o r f o r c e s ta tu s a n d r e a s o n s fo r n o n p a r t ic ip a t io n T o t a l1 6 -1 9 2 0 -2 4 2 5 -3 4 3 5 -4 4 4 5 -5 4 5 5 -5 9 6 0 -6 4 6 5 and
o v e r
Total
C iv i l i a n n o n in s t itu t io n a l p o p u la t io n ( in t h o u s a n d s ) ................................. 134 ,595 14,096 14 ,561 2 3 ,7 11 2 2 ,6 78 22 ,8 66 9 ,7 9 0 8 ,1 9 5 1 8 ,6 99
P e r c e n t d i s t r i b u t i o n ...................................................................................................... 1 0 0 .0 100 .0 1 0 0 .0 1 0 0 .0 1 0 0 .0 1 00 .0 1 0 0 .0 1 0 0 .0 1 0 0 .0
In c iv i l i a n la b o r f o r c e ................................................................................................... 6 1 .0 5 7 .9 7 0 .5 6 8 .7 7 2 .0 7 3 .0 6 8 .8 5 3 .7 1 7 .3
N o t in la b o r f o r c e .......................................................................................................... 3 9 .0 4 2 .1 2 9 .5 3 1 .3 2 8 .0 2 7 .0 3 1 .2 4 6 .3 8 2 .7In s c h o o l ......................................................................................................................... 2 .7 1 8 .1 5 .5 .7 .2 .1 — - - —
I l l h e a lth , d i s a b i l i t y ............................................................................................... 3 .4 .8 1 .1 1 .3 2 .2 3 .8 5 .1 7 .4 8 .3H om e r e s p o n s i b i l i t i e s ........................................................................................... 2 4 .6 6 .4 1 8 .5 2 7 .1 2 3 .6 2 0 .7 2 2 .2 2 9 .9 4 4 .5R e t ir e m e n t , o ld a g e ............................................................................................... 4 .3 - - — — - - .1 .4 6 .7 2 7 .8T h in k c a n n o t g e t j o b ........................................................................................... .4 1 .2 .4 .3 .2 .3 .4 .5 .5A ll o th e r r e a s o n s ...................................................................................................... 3 .6 15 .6 4 .1 1 .9 1 .7 2 .0 3 .0 1 .8 1 .5
Male
C iv i l i a n n o n in s t itu t io n a l p o p u la t io n ( in t h o u s a n d s ) ............................................ 6 2 ,9 9 0 6 ,9 1 3 6 ,4 0 9 1 1 ,3 3 0 10 ,8 78 10 ,9 65 4 ,6 6 5 3 ,8 2 6 8 ,0 0 5
P e r c e n t d i s t r i b u t i o n ...................................................................................................... 1 0 0 .0 1 0 0 .0 1 0 0 .0 1 0 0 .0 1 0 0 .0 1 0 0 .0 1 0 0 .0 1 0 0 .0 1 0 0 .0
In c iv i l i a n la b o r f o r c e ................................................................................................... 8 1 .6 6 6 .2 8 7 .5 9 7 .1 9 6 .9 9 4 .4 8 9 .7 7 5 .5 2 7 .7
N o t in la b o r f o r c e .......................................................................................................... 1 8 .4 3 3 .8 1 2 .5 2 .9 3 .1 5 .6 1 0 .3 2 4 .5 7 2 .3In s c h o o l ......................................................................................................................... 2 .8 17 .2 6 .9 .8 .1 — — - - - -
I l l h e a lth , d i s a b i l i t y ............................................................................................... 3 .6 .9 .9 .9 1 .8 3 .7 5 .6 9 .9 1 0 .1H om e r e s p o n s i b i l i t i e s . ........................................................................................... .3 .4 .1 .1 .1 .1 .2 .5 1 .3R e t ir e m e n t , o ld a g e ................................................................................................... 8 .1 — — — — .1 .8 1 1 .8 5 7 .5T h in k c a n n o t g e t j o b ............................................................................................... .3 1 .1 .2 .1 .1 .1 .1 .5 .7A ll o th e r r e a s o n s ...................................................................................................... 3 .3 14 .2 4 .3 1 .0 1 .0 1 .5 3 .6 1 .8 2 .8
Female
C iv i l i a n n o n in s t itu t io n a l p o p u la t io n ( in t h o u s a n d s ) ................................. 71 ,6 05 7 ,1 8 2 8 ,1 5 2 12 ,381 1 1 ,801 1 1 ,9 00 5 ,1 2 5 4 ,3 6 9 1 0 ,6 94
P e r c e n t d i s t r i b u t i o n ...................................................................................................... 1 0 0 .0 1 0 0 .0 100 .0 1 00 .0 1 0 0 .0 1 0 0 .0 1 0 0 .0 1 0 0 .0 1 0 0 .0
In c iv i l i a n la b o r f o r c e ............................................................................................... 4 2 .9 5 0 .0 5 7 .0 4 2 .7 4 9 .0 5 3 .2 4 9 .8 3 4 .6 9 .5
"Not in la b o r f o r c e .......................................................................................................... 5 7 .1 5 0 .0 4 3 .0 5 7 .3 5 1 .0 4 6 .8 50 .2 6 5 .4 9 0 .5In s c h o o l ......................................................................................................................... 2 .6 1 9 .0 4 .3 .6 .3 .2 .1 - - —
I ll h e a lth , d i s a b i l i t y ............................................................................................... 3 .3 .8 1 .3 1 .7 2 .7 3 .9 4 .7 5 .2 7 .0H om e r e s p o n s i b i l i t i e s ........................................................................................... 4 5 .9 1 2 .1 3 3 .0 5 1 .9 4 5 .3 3 9 .7 4 2 .2 5 5 .7 7 6 .8R e t ir e m e n t , o ld a g e ................................................................................................... 1 .0 — — — — - - — 2 .1 5 .6T h in k c a n n o t g e t j o b ............................................................................................... .5 1 .3 .5 .4 .4 .5 .7 .5 .5A ll o th e r r e a s o n s ...................................................................................................... 3 .8 1 6 .9 3 .9 2 .7 2 .3 2 .4 2 .4 1 .9 .6
Digitized for FRASER http://fraser.stlouisfed.org/ Federal Reserve Bank of St. Louis
HOUSEHOLD DATAQUARTERLY AVERAGES
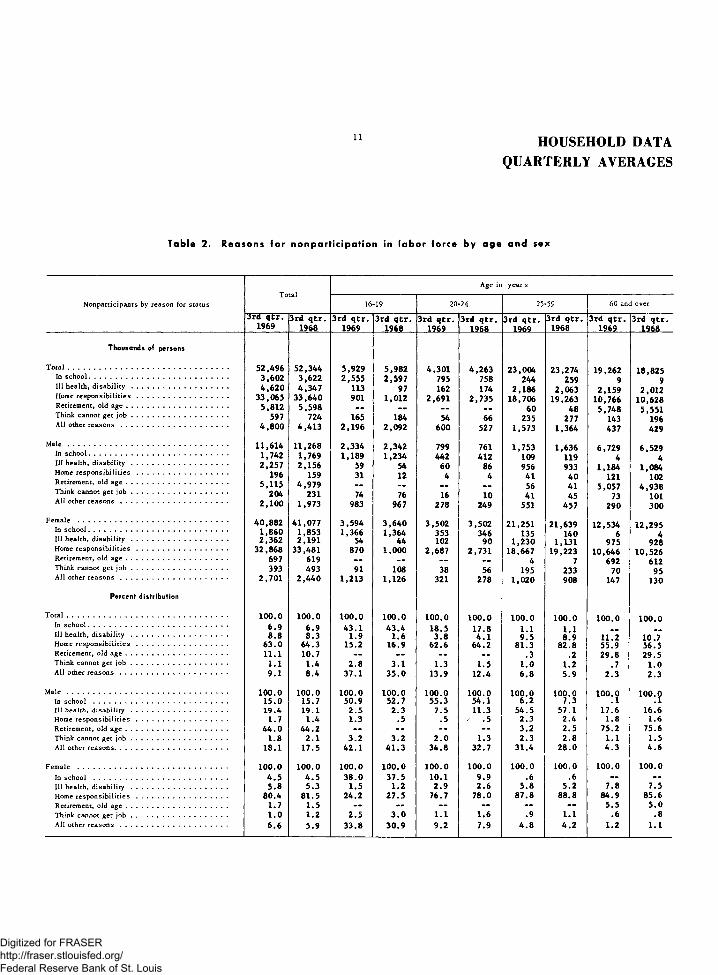
Table 2. Reasons for no n p ar t ic ip a t io n in la b o r force by a g e an d sex
A g e in y e a r s
N o n p a r t ic ip a n ts b y r e a s o n fo r s ta tu s 1 6 -1 9 2 0 -2 4 2 5 -5 9 6 0 and o v e r
3rd q tr . 1969
3rd q tr . 1968
3 rd q tr . 1969
3rd q tr . 1968
3rd q tr . 1969
3rd q tr . 1968
3rd q tr . 1969
3rd q tr . 1968
3rd q tr . 1969
3rd q tr . 1968
Thousands of persons
T o t a l .............................................................................................................. 5 2 ,496 52 ,344 5 ,929 5 ,9 8 2 4 ,3 0 1 4 ,2 6 3 2 3 ,004 23 ,2 74 19,262 18,825In s c h o o l ............................................................................................... 3 ,602 3 ,6 2 2 2 ,5 5 5 2 ,5 9 7 795 758 244 259 9 9I l l h e a lth , d i s a b i l i t y .................................................................. 4 ,6 2 0 4 ,3 4 7 113 97 162 174 2 ,1 8 6 2 ,063 2 ,1 5 9 2 ,012H om e r e s p o n s i b i l i t i e s ............................................................... 33 ,0 65 3 3 ,6 4 0 901 1 ,012 2 ,6 9 1 2 ,7 3 5 18,706 19 ,263 10,766 10,628R e t ir e m e n t , o ld a g e ...................................................................... 5 ,812 5 ,5 9 8 - - — — — 60 48 5 ,748 5 ,551T h in k c a n n o t g e t j o b .................................................................. 597 724 165 184 54 66 235 277 143 196A ll o th e r r e a s o n s ......................................................................... 4 ,8 0 0 4 ,4 1 3 2 ,1 9 6 2 ,0 9 2 600 527 1,573 1 ,364 437 429
M a l e ............................................................................................................. 11 ,614 11,268 2 ,3 3 4 2 ,342 799 761 1 ,753 1 ,636 6 ,7 2 9 6 ,5 2 9In s c h o o l ............................................................................................... 1,742 1 ,769 1 ,189 1 ,234 442 412 109 119 4 4I l l h e a lth , d i s a b i l i t y .................................................................. 2 ,2 5 7 2 ,1 5 6 59 54 60 86 956 933 1 ,184 1,084H om e r e s p o n s i b i l i t i e s .............................................................. 196 159 31 12 4 4 41 40 121 102R e t ir e m e n t , o ld a g e ...................................................................... 5 ,115 4 ,9 7 9 — — — 56 41 5 ,057 4 ,9 3 8T h in k c a n n o t g e t j o b .................................................................. 204 231 74 76 16 10 41 45 73 101A ll o th e r r e a s o n s ......................................................................... 2 ,1 0 0 1 ,973 983 967 278 249 551 457 290 300
F e m a le ....................................................................................................... 4 0 ,8 82 4 1 ,0 77 3 ,5 9 4 3 ,6 4 0 3 ,5 0 2 3 ,5 0 2 21 ,251 21 ,639 12 ,534 12 ,295In s c h o o l ............................................................................................... 1 ,8 6 0 1 ,853 1 ,366 1 ,364 353 346 135 140 6 4I l l h e a lth , d i s a b i l i t y .................................................................. 2 ,3 6 2 2 ,1 9 1 54 44 102 90 1 ,2 3 0 1,131 975 928H om e r e s p o n s i b i l i t i e s .............................................................. 32 ,8 68 3 3 ,481 870 1 ,0 0 0 2 ,6 8 7 2 ,7 3 1 18,667 19,223 10 ,646 10,526R e t ir e m e n t , o ld a g e ...................................................................... 697 619 — — - - . . 4 7 692 612T h in k c a n n o t g e t j o b .................................................................. 393 493 91 108 38 56 195 233 70 95A ll o th e r r e a s o n s ......................................................................... 2 ,7 0 1 2 ,4 4 0 1 ,213 1 ,126 321 278 1 ,0 2 0 908 147 130
Percent distribution
T o t a l .............................................................................................................. 1 0 0 .0 100 .0 1 00 .0 1 00 .0 1 00 .0 1 0 0 .0 1 00 .0 1 00 .0 1 00 .0 1 0 0 .0In s c h o o l ............................................................................................... 6 .9 6 .9 4 3 .1 4 3 .4 1 8 .5 1 7 .8 1 .1 1 .1 _ _I l l h e a lth , d i s a b i l i t y .................................................................. 8 .8 8 .3 1 .9 1 .6 3 .8 4 .1 9 .5 8 .9 11.2 10.7H om e r e s p o n s i b i l i t i e s .............................................................. 6 3 .0 6 4 .3 15.2 16.9 6 2 .6 6 4 .2 8 1 .3 8 2 .8 55 .9 5 6 .5R e t ir e m e n t , o ld a g e ...................................................................... 1 1 .1 1 0 .7 — - - — — .3 .2 2 9 .8 2 9 .5T h in k c a n n o t g e t j o b .................................................................. 1 .1 1 .4 2 .8 3 .1 1 .3 1 .5 1 . 0 1 .2 .7 1 . 0A l l o th e r r e a s o n s ......................................................................... 9 .1 8 .4 3 7 .1 3 5 .0 13 .9 12 .4 6 .8 5 .9 2 .3 2 .3
M a l e .............................................................................................................. 1 0 0 .0 1 00 .0 1 0 0 .0 1 0 0 .0 1 00 .0 1 0 0 .0 1 0 0 .0 1 00 .0 1 00 .0 1 00 .0In s c h o o l ............................................................................................ 1 5 .0 15.7 5 0 .9 5 2 .7 5 5 .3 5 4 .1 6 .2 7 .3 .1 .1Ill health, d i s a b i l i t y .......................................................... 1 9 . 4 1 9 . 1 2 .5 2 .3 7 .5 11 .3 5 4 .5 5 7 .1 1 7 .6 16 .6H om e r e s p o n s i b i l i t i e s ....................................................... 1 .7 1 .4 1 .3 .5 .5 ' .5 2 .3 2 .4 1 . 8 1 . 6R e t ir e m e n t , o ld a g e ............................................................. 4 4 .0 4 4 .2 - - - - — — 3 .2 2 .5 7 5 .2 7 5 .6T h in k c a n n o t g e t j o b .......................................................... 1 .8 2 .1 3 .2 3 .2 2 .0 1 .3 2 .3 2 .8 1 .1 1 .5A ll o th e r r e a s o n s .................................................................... 18 .1 1 7 .5 4 2 .1 4 1 .3 3 4 .8 3 2 .7 3 1 .4 2 8 .0 4 .3 4 .6
F e m a le .......................................................................................... 1 00 .0 1 00 .0 100 ,0 1 0 0 .0 1 0 0 .0 1 0 0 .0 100 .0 100 .0 1 00 .0 1 0 0 .0In s c h o o l ................................................................................ 4 .5 4 .5 3 8 .0 3 7 .5 1 0 .1 9 .9 .6 .6 — —I l l h e a lth , d i s a b i l i t y .......................................................... 5 .8 5 .3 1 .5 1 .2 2 .9 2 .6 5 .8 5 .2 7 .8 7 .5H om e r e s p o n s i b i l i t i e s ....................................................... 8 0 .4 8 1 .5 2 4 .2 2 7 .5 76 .7 7 8 .0 8 7 .8 8 8 .8 8 4 .9 8 5 .6R e t ir e m e n t , o ld a g e ............................................................. 1 .7 1 .5 — — — — — — 5 .5 5 .0T h in k c a n n o t g e t j o b .......................................................... 1 . 0 1 .2 2 .5 3 .0 1 .1 1 .6 .9 1 .1 .6 .8A ll o th e r r e a s o n s ................................................................ 6 .6 5 .9 3 3 .8 3 0 .9 9 .2 7 .9 4 .8 4 .2 1 .2 1 .1
Digitized for FRASER http://fraser.stlouisfed.org/ Federal Reserve Bank of St. Louis

HOUSEHOLD DATAQUARTERLY AVERAGES
12
Tqble 3. Reasons for no np ar t ic ip a t io n in lab o r force by ag e , color, an d sex
N o n p a r t ic ip a n ts b y r e a s o n fo r s ta tu s
T o t a lA g e in y e a r s
16-24 25-59 6 0 and o v e r
3rd qtr . 1969
3rd qtr . 1968
3rd qtr . 1969
3rd qtr . 1968
3rd qtr . 1969
3rd qtr . 1968
3rd qtr . 1969
3rd qtr . 1968
White
M a le ( in t h o u s a n d s ) ................................................................................................................................ 10,226 9 ,951 2,682 2 ,655 1,401 1,324 6 ,144 5 ,973In s c h o o l ...................................................................................................................................................... 1,495 1,523 1,398 1,431 94 87 4 4I l l h e a lth , d i s a b i l i t y ......................................................................................................................... 1,816 1,724 102 106 729 731 986 887H om e r e s p o n s i b i l i t i e s ..................................................................................................................... 181 137 35 12 36 31 111 94R e t ir e m e n t , o ld a g e ......................................................................................................................... 4 ,782 4 ,658 - - - - 54 39 4 ,726 4 ,619T h in k c a n n o t g e t j o b ........................................................................................................................ 160 195 63 59 33 42 65 94A ll o th e r r e a s o n s ................................................................................................................................ 1,793 1,714 1,087 1,047 454 394 254 274
F e m a le ( in t h o u s a n d s ) ............................................................................................................................ 36,991 37,222 6,083 6,195 19,341 19,675 11,567 11,351In s c h o o l .................................................................................................................................................. 1,536 1,588 1,411 1,466 120 118 6 4I l l h e a lth , d i s a b i l i t y ......................................................................................................................... 1,844 1,669 128 109 924 828 791 733H om e r e s p o n s i b i l i t i e s ..................................................................................................................... 30,336 30,870 3 ,141 3 ,311 17,259 17,719 9,935 9,839R e t ir e m e n t , o ld a g e ......................................................................................................................... 640 568 - - - - 2 7 636 561T h in k c a n n o t g e t j o b ......................................................................................................................... 295 386 92 126 140 170 63 90A l l o th e r r e a s o n s ................................................................................................................................ 2,341 2 ,141 1,311 1,182 893 837 136 122
M a le (p e r c e n t d i s t r i b u t i o n ) ................................................................................................................. 100.0 100.0 100 .0 100 .0 100.0 100.0 100.0 100.0In s c h o o l .................................................................................................................................................. 14.6 15 .3 52 .1 53 .9 6 .7 6 .6 .1 .1I ll h e a lth , d i s a b i l i t y ......................................................................................................................... 17.8 17 .3 3 .8 4 . 0 52 .1 55 .2 16 .0 14 .9H om e r e s p o n s i b i l i t i e s ..................................................................................................................... 1.8 1 .4 1 .3 .5 2 .6 2 .3 1.8 1 .6R e t ir e m e n t , o ld a g e ............................................................................................................................ 4 6 .8 46 .8 - - - - 3 .9 2 .9 76 .9 77 .3T h in k c a n n o t g e t j o b ......................................................................................................................... 1 .6 2 .0 2 .3 2 .2 2 .4 3 .2 1 .1 1 .6A ll o th e r r e a s o n s ................................................................................................................................ 17.5 17.2 4 0 .5 39 .4 32 .4 29 .8 4 .1 4 . 6
F e m a le (p e r c e n t d i s t r i b u t i o n ) .......................................................................................................... 100.0 100 .0 100 .0 100.0 100.0 100.0 100.0 100.0In s c h o o l .................................................................................................................................................. 4 .2 4 . 3 23 .2 23 .7 .6 .6 .1 - -
I l l h e a lth , d i s a b i l i t y ......................................................................................................................... 5 .0 4 . 5 2 .1 1 .8 4 . 8 4 . 2 6 .8 6 .5H om e r e s p o n s i b i l i t i e s ..................................................................................................................... 82 .0 82 .9 51 .6 53 .5 89 .2 90 .0 85 .9 86.7R e t ir e m e n t , o ld a g e ......................................................................................................................... 1.7 1 .5 - - - - - - - - 5 .5 4 . 9T h in k c a n n o t g e t j o b ..................................................................................................................... .8 1 . 0 1 .5 2 .0 .7 .9 .5 .8A ll other r e a s o n s ................................................................................................................ 6 .3 5 .8 21 .5 19 .1 4 . 6 4 . 3 1.2 1.1
Negro and other races
M a le ( in t h o u s a n d s ) ..................................................................................................................... ... • 1,387 1,316 452 447 352 312 584 556In s c h o o l .................................................................................................................................................. 247 246 232 214 15 32 - - - -
I ll h e a lth , d i s a b i l i t y ......................................................................................................................... 442 432 17 33 226 202 197 196H om e r e s p o n s i b i l i t i e s ..................................................................................................................... 15 22 - - 5 5 9 11 7R e t ir e m e n t , o ld a g e ............................................................................................................................ 334 321 - - — 2 2 331 319T h in k c a n n o t g e t j o b ......................................................................................................................... 44 36 28 26 8 3 9 7A ll o th e r r e a s o n s ................................................................................................................................ 307 259 175 169 96 64 36 26
F e m a le ( in t h o u s a n d s ) ............................................................................................................................ 3 ,890 3 ,855 1,014 947 1,911 1,964 967 945In s c h o o l .................................................................................................................................................. 324 265 308 243 16 22 - - - -I ll h e a lth , d i s a b i l i t y ......................................................................................................................... 519 522 27 24 307 302 183 195H om e r e s p o n s i b i l i t i e s ..................................................................................................................... 2,532 2 ,611 416 420 1,407 1,505 710 686R e t ir e m e n t , o ld a g e ............................................................................................................................ 57 51 - - - - 2 - - 55 51T h in k ca n n o t g e t j o b ......................................................................................................................... 98 107 36 38 55 64 7 4A ll o th e r r e a s o n s ................................................................................................................................ 360 300 223 221 124 71 11 7
M a le (p e r c e n t d i s t r i b u t i o n ) .................................................................................................................. 100.0 100 .0 100.0 100 .0 100.0 100.0 100.0 100.0In s c h o o l .................................................................................................................................................. 17.8 18.7 51 .3 4 7 .9 4 . 3 10.3 - - - -
I ll h e a lth , d i s a b i l i t y ......................................................................................................................... 31 .8 32 .8 3 .8 7 .4 64.2 64 .7 33.7 35 .3H om e r e s p o n s i b i l i t i e s ..................................................................................................................... 1.1 1.7 - - 1 .1 1 .4 2 .9 1.9 1.3R e t ir e m e n t , o ld a g e ............................................................................................................................ 24 .0 2 4 .4 - - - - .6 .6 56 .7 57 .4T h in k c a n n o t g e t j o b ......................................................................................................................... 3 .2 2 .7 6 .2 5 .8 2 .3 1 . 0 1 .5 1.3A ll o th e r r e a s o n s ................................................................................................................................ 22.1 19 .7 38 .7 37 .8 27.3 20.5 6 .2 4 .7
F e m a le (p e r c e n t d i s t r i b u t i o n ) .......................................................................................................... 100 .0 100.0 100.0 100.0 100.0 100.0 100.0 100 .0In s c h o o l ................................................................................................................................................... 8 .3 6 .9 30 .5 25.7 .8 1 .1 - - - -
I ll h e a lth , d i s a b i l i t y ......................................................................................................................... 13.3 13.5 2 .7 2 .5 16 .1 15 .4 18.9 20 .7H om e r e s p o n s i b i l i t i e s ..................................................................................................................... 65.1 67 .7 4 1 .2 4 4 .4 73 .6 76 .6 73.5 72.7R e t ir e m e n t , o ld a g e ............................................................................................................................. 1.5 1 .3 - - - - .1 - - 5 .7 5 .4T h in k c a n n o t g e t j o b ......................................................................................................................... 2 .5 2 .8 3 .6 4 . 0 2 .9 3 .3 .7 .4A ll o th e r r e a s o n s ................................................................................................................................ 9 .3 7 .8 22 .1 23 .4 6 .5 3 .6 1 .1 .7
Digitized for FRASER http://fraser.stlouisfed.org/ Federal Reserve Bank of St. Louis

13 HOUSEHOLD DATAQUARTERLY AVERAGES
Table 4. Job desire of persons not in la b o r force and reasons for not seeking work by age and sex
Age in years
R easons for not seek in g work 16-19 20-24 25-59 60 andl over
3rd qtr 1969
3rd qtr 1968
3rd qtr 1969
3rd qtr 1968
3rd qtr 1969
3rd qtr 1968
3 rd qtr 1969
3rd qtr 1968
3rd qtr 1969
3rd qtr 1968
Thousands of persons
Total not in labor f o r c e ....................................................................................................... 52 ,496 5 2 ,344 5 ,9 2 9 5,982 4 ,3 0 1 4 ,2 6 3 23 ,0 04 23 ,274 19,262 18,825
Do not want job now .................................................................................................... 4 8 ,1 53 4 8 ,0 99 4 ,9 5 1 5 ,097 3 ,6 9 6 3 ,6 7 9 2 0 ,7 4 0 2 1 ,0 4 0 18 ,764 18,285
Want job now - total .................................................................................................... 4 ,3 4 3 4 ,2 4 5 978 885 605 584 2 ,2 6 4 2 ,2 3 4 499 540In sch oo l ....................................................................................................................... 575 559 421 400 111 113 42 44 2 3Ill health, d i s a b i l i t y ................................................................................................ 678 657 37 25 29 37 430 415 183 179Home re sp o n s ib ilit ie s .......................................................................................... 1 ,426 1,409 98 104 236 237 1 ,051 1 ,0 1 6 42 51Think cannot get j o b ................................................................................................ 597 724 165 184 54 66 235 277 143 196A ll other reasons .................................................................................................... 1,067 896 257 172 175 131 506 482 129 111
M a l e ................................................................................................................................ 1 ,0 7 0 1 ,033 400 385 153 131 284 265 235 256In sch oo l ................................................................................................................ 272 320 201 227 62 72 10 19 — 2Ill health, d i s a b i l i t y .......................................................................................... 301 289 21 14 13 18 163 152 104 107Think cannot get j o b .......................................................................................... 204 231 74 76 16 10 41 45 73 101A ll other re a so n s1 ............................................................................................. 293 193 104 68 62 31 70 49 58 46
F e m a le ............................................................................................................................. 3 ,2 7 1 3 ,2 1 3 579 501 453 454 1,979 1,972 264 284In sch oo l ................................................................................................................ 302 240 220 173 50 40 32 25 2 1Ill health, d i s a b i l i t y .......................................................................................... 376 368 17 12 15 21 266 264 79 72Home r e s p o n s ib i l i t i e s ....................................................................................... 1 ,399 1,392 88 104 233 237 1 ,045 1,007 34 43Think cannot get j o b .......................................................................................... 393 493 91 108 38 56 195 233 70 95A ll other r e a s o n s ................................................................................................ 801 720 163 104 117 100 441 443 79 73
Percent distribution
Want job now — t o t a l .................................................................................................... 1 0 0 .0 100 .0 1 00 .0 1 0 0 .0 1 0 0 .0 1 00 .0 1 0 0 .0 1 0 0 .0 1 0 0 .0 1 00 .0In sch o o l ....................................................................................................................... 13 .2 1 3 .2 4 3 .0 4 5 .2 1 8 .3 19 .3 1 .9 2 .0 .4 .6Ill health, d isa b ility ............................................................................................. 15 .6 1 5 .5 3 .8 2 .8 4 .8 6 .3 1 9 .0 18.6 3 6 .7 33 .1Home r e s p o n s ib i l i t i e s ............................................................................................. 3 2 .8 3 3 .2 1 0 .0 1 1 .8 3 9 .0 4 0 .6 4 6 .4 4 5 .5 8 .4 9 .4Think cannot get j o b ................................................................................................ 13.7 17.1 1 6 .9 2 0 .8 8 .9 11 .3 10 .4 12.4 2 8 .7 3 6 .3A ll other r e a s o n s ............................. .......................................................................... 2 4 .6 2 1 .1 2 6 .3 19 .4 2 8 .9 2 2 .4 2 2 .3 2 1 .6 2 5 .9 2 0 .6
M a l e ................................................................................................................................ 1 0 0 .0 1 00 .0 1 0 0 .0 1 00 .0 1 0 0 .0 1 00 .0 1 00 .0 1 0 0 .0 100 .0 1 00 .0In sch oo l ................................................................................................................ 2 5 .4 3 1 .0 5 0 .3 5 9 .0 4 0 .5 5 5 .0 3 .5 7 .2 — .8Ill health, d i s a b i l i t y .......................................................................................... 2 8 .1 2 8 .0 5 .3 3 .6 8 .5 1 3 .7 5 7 .4 5 7 .4 4 4 .3 4 1 .8Think cannot get j o b .......................................................................................... 19 .1 2 2 .4 18 .5 19.7 1 0 .5 7 .6 14.4 1 7 .0 3 1 .1 3 9 .5A ll other re a s o n s 1 ............................................................................................. 2 7 .4 18 .7 2 6 .0 17.7 4 0 .5 2 3 .7 2 4 .6 18 .5 2 4 .7 1 8 .0
Fem ale ............................................................................. ............................................ 1 00 .0 100 .0 1 0 0 .0 1 00 .0 1 0 0 .0 1 0 0 .0 1 0 0 .0 1 00 .0 100 .0 1 0 0 .0In sch o o l ................................................................................................................. 9 .2 7 .5 3 8 .0 3 4 .5 1 1 .0 8 .8 1 .6 1 .3 .8 .4Ill health, d i s a b i l i t y .......................................................................................... 11 .5 1 1 .5 2 .9 2 .4 3 .3 4 .6 13.4 13.4 2 9 .9 2 5 .4Home r e s p o n s ib i l i t i e s ....................................................................................... 4 2 .8 4 3 .3 15.2 2 0 .8 5 1 .4 5 2 .2 5 2 .8 5 1 .1 12.9 15.1Think cannot get j o b .......................................................................................... 1 2 .0 15.3 1 5 .7 2 1 .6 8 .4 12.3 9 .9 1 1 .8 2 6 .5 3 3 .5A ll other r e a s o n s ................................................................................................ 2 4 .5 2 2 .4 2 8 .2 2 0 .8 2 5 .8 2 2 .0 2 2 .3 2 2 .5 2 9 .9 2 5 .7
^ I n c l ud es sm al l number o f men not s e e k i n g work b e c a u s e o f h om e r e s p o n s i b i l i t i e s .
Digitized for FRASER http://fraser.stlouisfed.org/ Federal Reserve Bank of St. Louis

HOUSEHOLD DATAQUARTERLY AVERAGES
14
Table 5. Job desire of persons not in lab o r force an d reasons for not seeking work by color a n d sex
R e a s o n s fo r n o t s e e k in g w ork
W hite N e g r o an d o th e r r a c e s
M a le F e m a le M a le F e m a le
3 rd qtr 1969
3rd qtr 1968
3 rd qtr 1969
3rd qti 1968
3 rd qtr 1969
3 rd qtr 1968
3rd qtr 1969
3rd qtr 1968
Thousands of persons
T o t a l n o t in la b o r f o r c e ..................................................................................................................................................................... 10 ,226 9 ,9 5 1 36 ,9 91 37 ,2 22 1,387 1 ,316 3 ,8 9 0 3 ,8 5 5
D o n o t w an t j o b n o w ..................................................................................................................................................................... 9 ,3 5 0 9 ,1 1 0 34 ,3 59 34 ,6 75 1,192 1 ,125 3 ,2 5 0 3 ,1 8 9
W ant jo b n o w ................................................................................................................................................................................... 876 841 2 ,6 3 2 2 ,5 4 7 195 191 640 666I a s c h o o l ................................................................................................................................................................................... 224 264 227 174 49 55 75 65I l l h e a lth , d i s a b i l i t y ...................................................................................................................................................... 237 213 272 256 64 76 105 113H om e r e s p o n s i b i l i t i e s 1 .................................................................................................................................................. — - - 1 ,1 6 0 1 ,1 0 6 239 286T h in k c a n n o t g e t j o b ......................................................................................................................................................... 160 195 295 386 44 36 98 107A l l o th e r r e a s o n s ................................................................................................................................................................. 255 169 678 625 38 24 123 95
Percent distribution
W ant jo b n o w ................................................................................................................................................................................... 1 0 0 .0 1 0 0 .0 1 0 0 .0 1 0 0 .0 1 0 0 .0 1 0 0 .0 1 0 0 .0 1 0 0 .0In s c h o o l ....................................................................................................................................................................................... 2 5 .6 3 1 .4 8 .6 6 .8 2 5 .1 2 8 .8 1 1 .7 9 .8I l l h e a lth , d i s a b i l i t y ......................................................................................................................................................... 2 7 .1 2 5 .3 1 0 .3 10 .1 3 2 .8 3 9 .8 16 .4 1 7 .0H om e r e s p o n s i b i l i t i e s ! ...................................................................................................................................................... — — 4 4 .1 *4 3 .4 . . — . 3 7 .3 4 2 .9T h in k c a n n o t g e t j o b .......................................................................................................................................................... 1 8 .3 2 3 .2 1 1 .2 1 5 .2 2 2 .6 1 8 .8 1 5 .3 16 .1A ll o th e r r e a s o n s ................................................................................................................................................................. 2 9 .1 2 0 .1 2 5 .8 2 4 .5 1 9 .5 1 2 .6 1 9 .2 14 .3
ISmall number of men not seeking work becau se of "h om e r e s p o n s ib i l it ie s " are included in " a l l other r e a s o n s ."
Table 6. Persons not in la b o r force who desire to work but th ink th ey cannot get jobs bya g e , color, sex, and d e ta i le d reason
3 rd quarter, 1969
(In th o u s a n d s )
D e t a i l e d r e a s o n fo r n o t s e e k in g w ork T o t a l
A g e in y e a r s C o lo r
1 6 -1 9 2 0 -2 4 2 5 -5 96 0 and
o v e r W hiteN e g r o an d
o th e r r a c e s
597 165 54 235 143 455 142E m p lo y e r s th in k t o o y o u n g o r o l d ..................................................................................................................... 134 34 2 12 86 119 16L a c k s e d u c a t io n o r t r a i n i n g ................................................................................................................................ 98 22 17 53 7 77 21O th e r p e r s o n a l h a n d ic a p ........................................................................................................................................ 52 2 10 27 13 40 11C o u ld n o t f in d j o b .......................................................................................................................................................... 186 75 16 80 15 115 71T h in k s n o j o b a v a i l a b l e ........................................................................................................................................... 128 31 9 66 23 104 24
204 74 16 41 73 160 44E m p lo y e r s th in k t o o y o u n g o r o l d ..................................................................................................................... 69 17 . . — 51 61 9L a c k s e d u c a t io n o r t r a in in g ................................................................................................................................ 15 8 _ _ 7 . . 10 5O th e r p e r s o n a l h a n d ic a p ........................................................................................................................................ 7 — . . 7 - - 7 . .C o u ld n o t fin d j o b ...................................................................................................................................................... 71 33 14 15 10 46 26T h in k s n o jo b a v a i l a b l e ............................................................................................................................................ 40 15 2 12 12 36 4
F e m a le ....................................................................................................................................................................................... 393 91 38 195 70 295 98E m p lo y e r s th in k t o o y o u n g o r o ld .................................................................................................................. 65 17 2 12 33 58 7L a c k s e d u c a t io n o r tr a in in g ................................................................................................................................ 82 14 17 46 7 67 16O th er p e r s o n a l h a n d i c a p ........................................................................................................................................... 44 2 10 19 13 33 11C o u ld n o t f in d j o b ....................................................................................................................................................... 114 42 2 65 6 69 45T h in k s n o j o b a v a i l a b l e ............................................................................................................................................ 88 16 7 54 12 68 20
Digitized for FRASER http://fraser.stlouisfed.org/ Federal Reserve Bank of St. Louis

15 HOUSEHOLD DATAQUARTERLY AVERAGES
Table 7. Most recent work experience of persons not in labor force and reason for leaving last job for
those who w orked during previous 12 months by ag e and sex
A g e in y e a r s
M o st r e c e n t w o rk e x p e r ie n c e a n d r e a s o n le a v in g jo b 1 6 -1 9 2 0 -2 4 2 5 -5 9 6 0 a n d o v e r
3rd qtr 1969
3rd qtr 1968
3rd qtr 1969
3rd qtr 1968
3rd qtr 1969
3rd qtr 1968
3 rd qtr 1969
3rd qtr 1968
3rd qtr 1969
3rd qtr 1969
Total
N o t in la b o r f o r c e ( in t h o u s a n d s ) ............................................................................................... 5 2 ,495 52 ,344 5 ,929 5 ,982 4 ,3 0 0 4 ,2 6 3 23 ,0 04 23 ,2 74 19,261 18,824N e v e r w o r k e d .................................................................................................................................... 9 ,1 4 7 9 ,591 3 ,1 5 0 3 ,3 5 2 742 808 2 ,4 8 6 2 ,6 7 5 2 ,7 6 8 2 ,7 5 5L a s t w o r k e d o v e r 5 y e a r s a g o ............................................................................................... 2 4 ,6 89 24 ,8 05 40 28 335 311 11,884 12,311 1 2 ,4 30 12,156L a s t y o r k e d 1 to 5 y e a r s a g o ............................................................................................... 9 ,2 8 0 8 ,9 6 6 391 364 1 ,383 1 ,431 4 ,7 7 1 4 ,5 8 6 2 ,7 3 6 2 ,586L e f t j o b p r e v io u s 12 m o n t h s ................................................................................................... 9 ,3 7 9 8 ,9 8 2 2 ,3 4 8 2 ,237 1 ,8 4 0 1 ,713 3 ,8 6 3 3 ,704 1 ,328 1 ,328
P e r c e n t d is t r ib u t io n b y r e a s o n ........................................................................................ 1 00 .0 1 00 .0 1 0 0 .0 100 .0 1 0 0 .0 1 0 0 .0 1 0 0 .0 100 .0 1 00 .0 1 0 0 .0S c h o o l , h om e r e s p o n s i b i l i t i e s ..................................................................................... 4 9 .2 4 8 .0 6 3 .5 6 1 .9 7 1 .1 6 9 .3 4 4 .4 4 3 .5 8 .0 9 .5I l l h e a lth , d i s a b i l i t y .......................................................................................................... 10 .7 1 0 .4 2 .0 2 .8 3 .4 5 .1 1 5 .0 1 4 .9 2 3 .5 1 7 .6R e t ir e m e n t , o ld a g e .......................................................................................................... 6 .1 7 .0 .1 — - - .1 .9 1 . 0 4 0 .4 4 4 .2E c o n o m ic r e a s o n s .............................................................................................................. 1 7 .5 1 8 .6 16 .2 2 0 .0 1 0 .6 1 2 .0 2 1 .2 2 1 .6 1 8 .5 16.9
E n d o f s e a s o n a l j o b ................................................................................................... 8 .0 9 .2 8 .2 1 0 .5 5 .3 6 .9 9 .4 10 .6 7 .1 6 .4S la c k w o r k ......................................................................................................................... 3 .4 3 .2 3 .4 3 .2 1 .6 1 . 0 4 .3 4 .3 3 .0 2 .8E n d o f tem p ora ry j o b ............................................................................................... 6 .1 6 .2 4 .5 6 .3 3 .6 4 .1 7 .4 6 .7 8 .3 7 .7
A ll o th e r r e a s o n s .............................................................................................................. 1 6 .5 1 6 .0 18 .3 15.3 14.9 13 .6 1 8 .6 1 9 .0 9 .6 1 1 .9
Male
N ot in la b o r f o r c e ( in t h o u s a n d s ) ............................................................................................... 11 ,6 14 11,267 2 ,3 3 4 2 ,3 4 2 799 761 1 ,752 1 ,636 6 ,7 2 9 6 ,5 2 9N e v e r w o r k e d .................................................................................................................................... 1 ,3 1 4 1 ,4 1 8 1 ,034 1 ,1 2 0 126 148 125 126 29 24L a s t w o r k e d o v e r 5 y e a r s a g o ............................................................................................... 5 ,0 1 5 4 ,9 1 9 20 11 10 21 596 604 4 ,3 9 0 4 ,2 8 4L a s t w o r k e d 1 to 5 y e a r s a g o ................................................................................................... 2 ,3 9 0 2 ,2 7 4 107 133 150 132 535 485 1 ,600 1 ,524L e f t j o b p r e v io u s 12 m o n t h s ................................................................................................... 2 ,8 9 4 2 ,6 5 6 1 ,174 1,079 512 461 499 420 709 696
P e r c e n t d is t r ib u t io n b y r e a s o n ........................................................................................ 1 0 0 .0 1 0 0 .0 1 0 0 .0 1 0 0 .0 1 0 0 .0 1 0 0 .0 1 0 0 .0 1 00 .0 1 0 0 .0 1 00 .0S c h o o l , h om e r e s p o n s i b i l i t i e s .................................................................................... 4 1 .3 3 7 .8 6 3 .6 5 8 .9 6 5 .7 5 9 .4 1 8 .2 1 6 .9 3 .0 3 .3I l l h e a lth , d is a b i l i t y .............................................' ........................................................ 1 4 .2 1 4 .3 2 .0 2 .7 4 .3 7 .6 3 9 .4 4 5 .7 2 3 .7 1 7 .5R e t ir e m e n t , o ld a g e .......................................................................................................... 1 4 .0 1 6 .2 — - - — — 4 .8 4 .0 5 3 .7 5 9 .3E c o n o m ic r e a s o n s .............................................................................................................. 1 4 .3 1 5 .8 1 5 .8 2 0 .9 1 0 .9 1 1 .7 1 4 .8 11 .7 1 3 .9 1 3 .2
E n d o f s e a s o n a l j o b ................................................................................................... 6 .5 7 .7 8 .0 1 0 .3 6 .6 6 .7 6 .4 4 .5 4 .1 6 .0S la c k w o r k ......................................................................................................................... 3 .4 2 .9 4 .3 4 .2 1 .6 — 4 .4 2 .9 2 .8 2 .7E n d o f tem p ora ry j o b ................................................................................................... 4 .3 5 .3 3 .5 6 .4 2 .7 5 .0 4 .0 4 .3 7 .0 4 .4
A l l o th e r r e a s o n s .................................................................................................................. 1 6 .3 1 6 .0 1 8 .6 1 7 .5 1 9 .1 2 1 .3 2 2 .8 2 1 .7 5 .8 6 .7
Female
N o t in la b o r f o r c e ( in t h o u s a n d s ) ............................................................................................... 40 ,8 81 4 1 ,0 76 3 ,5 9 4 3 ,6 4 0 3 ,5 0 2 3 ,5 0 2 2 1 ,251 21 ,638 12 ,533 12 ,295N e v e r w o r k e d ................................................................................................................................ ... . 7 ,833 8 ,1 7 3 2 ,1 1 6 2 ,2 3 2 616 660 2 ,3 6 3 2 ,5 5 0 2 ,7 3 9 2 ,7 3 1L a s t w o r k e d o v e r 5 y e a r s a g o ................................................................................................... 19 ,674 19 ,886 21 18 325 290 11 ,289 11 ,705 8 ,0 3 9 7 ,872L a s t w o r k e d 1 to 5 y e a r s a g o ................................................................................................... 6 ,8 9 0 6 ,6 9 2 284 230 1 ,233 1,299 4 ,2 3 5 4 ,1 0 2 1 ,136 1 ,062L e f t j o b p r e v io u s 12 m on th s ................................................................................................... 6 ,4 8 4 6 ,3 2 6 1 ,174 1 ,1 6 0 1 ,328 1 ,252 3 ,3 6 4 3 ,2 8 2 619 632
P e r c e n t d is t r ib u t io n b y r e a s o n ........................................................................................ 1 0 0 .0 100 .0 1 0 0 .0 1 0 0 .0 1 0 0 .0 1 0 0 .0 1 0 0 .0 1 0 0 .0 1 0 0 .0 1 00 .0S c h o o l , h om e r e s p o n s i b i l i t i e s .................................................................................... 5 2 .8 5 2 .3 6 3 .3 6 4 .9 7 3 .3 72 .9 4 8 .2 4 6 .9 1 3 .7 1 6 .3I ll h e a lth , d i s a b i l i t y .......................................................................................................... 9 .1 8 .8 1 .9 2 .8 3 .0 4 .1 1 1 .3 1 1 .0 2 3 .4 17.6R e t ir e m e n t , o ld a g e .......................................................................................................... 2 .6 3 .1 .2 — — .2 .3 .6 2 5 .2 2 7 .5E c o n o m ic r e a s o n s .............................................................................................................. 1 8 .9 1 9 .8 1 6 .6 1 9 .0 1 0 .4 12 .2 2 2 .1 2 2 .8 2 3 .7 2 0 .9
E n d o f s e a s o n a l j o b ................................................................................................... 8 .7 9 .9 8 .4 1 0 .5 4 .8 7 .0 9 .9 11.4 1 0 .6 6 .6S la c k w ork ..................................................................................................................... 3 .4 3 .3 2 .6 2 .3 1 .7 1 .4 4 .3 4 .5 3 .2 2 .8E n d o f tem p ora ry jo b ................................................................................................ 6 .9 6 .6 5 .5 6 .1 4 .0 3 .8 7 .9 7 .0 9 .8 1 1 .4
A l l o th e r r e a s o n s .................................................................................................................. 16 .6 16.0 1 8 .0 13.3 1 3 .3 1 0 .7 1 8 .0 18 .6 1 4 .0 1 7 .7
Digitized for FRASER http://fraser.stlouisfed.org/ Federal Reserve Bank of St. Louis
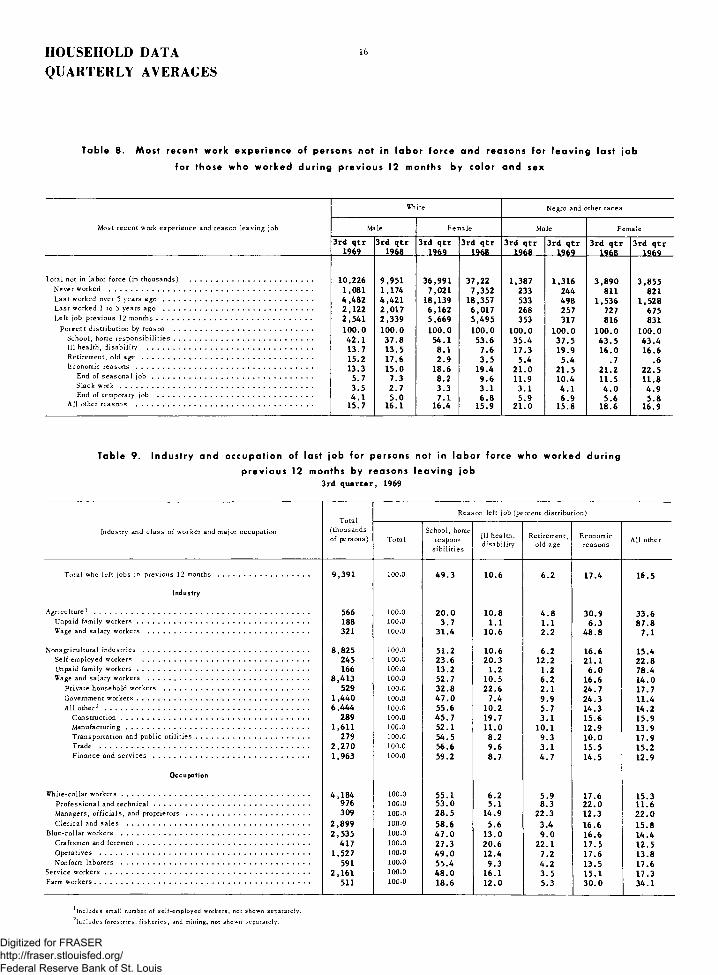
HOUSEHOLD DATAQUARTERLY AVERAGES
16
Table 8. Most recent work exper ience
for those who worked
of persons not in la b o r force and reasons for
during previous 12 months by color and sex
e a v in g last job
Most recent work exp erien ce and reason leav ing job
White Negro and other races
Male Fem ale Male Fem ale
3rd qtr 1969
3 rd qtr 1968
3rd qtr 1969
3rd qtr 1968
3 rd qtr 1968
3rd qtr 1969
3rd qtr 1968
3rd qtr 1969
Total not in labor force (in thousands) .......................................................................... 10,226 9 ,951 36 ,9 91 37 ,2 2 1,387 1 ,316 3 ,8 9 0 3 ,8 5 5N ever worked .......................................................................................................................... 1 ,081 1,174 7 ,021 7 ,352 233 244 811 821L ast worked over 5 years a g o .......................................................................................... 4 ,4 8 2 4 ,4 2 1 18,139 18,357 533 498 1 ,536 1 ,5 2 8L ast worked 1 to 5 years ago .......................................................................................... 2 ,1 2 2 2 ,0 1 7 6 ,1 6 2 6 ,0 1 7 268 257 727 675L eft job previou s 12 m o n th s ............................................................................................. 2 ,5 4 1 2 ,3 3 9 5 ,669 5 ,4 9 5 353 317 816 831
Pereent distribution by reason .................................................................................... 100 .0 100 .0 1 00 .0 100 .0 1 00 .0 1 00 .0 1 0 0 .0 1 00 .0S ch oo l, home r e s p o n s ib i l it i e s .................................................................................... 4 2 .1 3 7 .8 5 4 .1 5 3 .6 3 5 .4 3 7 .5 4 3 .5 4 3 .4Ill health , d isa b ility .................................................................................................... 13.7 1 3 .5 8 .1 7 .6 17 .3 19 .9 1 6 .0 1 6 .6R etirem ent, old age ....................................................................................................... 15.2 17.6 2 .9 3 .5 5 .4 5 .4 .7 .6E conom ic r e a s o n s .......................................................................................................... 13.3 1 5 .0 1 8 .6 19.4 2 1 .0 2 1 .5 2 1 .2 2 2 .5
End of se a so n a l j o b ................................................................................................ 5 .7 7 .3 8 .2 9 .6 11.9 10.4 1 1 .5 1 1 .8Slack w o r k .................................................................................................................... 3 .5 2 .7 3 .3 3 .1 3 .1 4 .1 4 .0 4 .9End of temporary job ............................................................................................. 4 .1 5 .0 7 .1 6 .8 5 .9 6 .9 5 .6 5 .8A ll other reason s .......................................................................................................... 15.7 16.1 16.4 1 5 .9 2 1 .0 1 5 .8 1 8 .6 16 .9
Table 9. Industry and occupation of last job for persons not in la b o r force who worked during
prev ious 12 months by reasons le a v in g job 3 rd quarter, 1969
Industry and c la s s o f w orker and major occupationT ota l
(thousands o f persons)
R eason left job (percent d istribution )
T ota lS ch oo l, home
respon s ib il it ie s
111 health , d isab ility
Retirem ent, old age
E conom icreasons A ll other
T otal who left job s in previous 12 m o n t h s ....................................................... 9 ,391 100.0 4 9 .3 1 0 .6 6 .2 17.4 1 6 .5
Industry
A gricu ltu re1 ................................................................................................................................. 566 100.0 2 0 .0 1 0 .8 4 .8 3 0 .9 3 3 .6Unpaid fam ily w o r k e r s ....................................................................................................... 188 100.0 3 .7 1 .1 1 .1 6 .3 8 7 .8Wage and salary workers ................................................................................................. 321 100.0 3 1 .4 10.6 2 .2 4 8 .8 7 .1
Nonagricultural industries .................................................................................................... 8 ,8 2 5 100.0 51 .2 10.6 6 .2 1 6 .6 15.4Self-em ployed w orkers .................................................................................................... 245 100.0 2 3 .6 2 0 .3 12.2 2 1 .1 2 2 .8Unpaid fam ily w o r k e r s ................................................ ...................................................... 166 100.0 13.2 1 .2 1 .2 6 .0 78 .4Wage and salary w orkers ................................................................................................. 8 ,4 1 3 100.0 52 .7 10 .5 6 .2 16 .6 1 4 .0
Private h ou seh old workers ....................................................................................... 529 100.0 3 2 .8 2 2 .6 2 .1 2 4 .7 17 .7Government w o r k e r s ....................................................................................................... 1 ,440 100.0 4 7 .0 7 .4 9 .9 2 4 .3 11 .4A ll o th er2 ........................................................................................................................... 6 ,4 4 4 100.0 5 5 .6 1 0 .2 5 .7 14.3 14.2
C o n s tr u c t io n ................................................................................................................. 289 100.0 4 5 .7 19.7 3 .1 15.6 1 5 .9M a n u fa c tu r in g .............................................................................................................. 1,611 100.0 5 2 .1 1 1 .0 10.1 1 2 .9 1 3 .9Transportation and p ublic u t i l i t i e s .................................................................... 279 100.0 5 4 .5 8 .2 9 .3 1 0 .0 1 7 .9Trade .............................................................................................................................. 2 ,2 7 0 100.0 5 6 .6 9 .6 3 .1 1 5 .5 15.2F inance and s e r v i c e s .............................................................................................. 1,963 100.0 5 9 .2 8 .7 4 .7 1 4 .5 12 .9
Occupation
W hite-collar w o r k e r s ................................................................................................................. 4 ,1 8 4 100.0 5 5 .1 6 .2 5 .9 17.6 15 .3P ro fession a l and t e c h n i c a l ............................................................................................. 976 100.0 5 3 .0 5 .1 8 .3 2 2 .0 11 .6Managers, o f f ic ia ls , and p r o p r ie t o r s .......................................................................... 309 100.0 2 8 .5 14.9 2 2 .3 1 2 .3 2 2 .0C ler ica l and s a le s .............................................................................................................. 2 ,8 9 9 100.0 5 8 .6 5 .6 3 .4 16 .6 1 5 .8
B lu e-co llar workers ................................................................................................................. 2 ,5 3 5 100.0 4 7 .0 1 3 .0 9 .0 1 6 .6 14 .4Craftsmen and fo r e m e n ....................................................................................................... 417 100.0 2 7 .3 2 0 .6 2 2 .1 1 7 .5 12.5O peratives .............................................................................................................................. 1,527 100.0 4 9 .0 12.4 7 .2 17 .6 1 3 .8Nonfarm laborers ................................................................................................................. 591 100.0 5 5 .4 9 .3 4 .2 13 .5 17.6
S ervice w o r k e r s ........................................................................................................................... 2 ,161 100.0 4 8 .0 1 6 .1 3 .5 15 .1 1 7 .3Farm w o rk e rs ................................................................................................................................. 511 100.0 1 8 .6 1 2 .0 5 .3 3 0 .0 3 4 .1
^Includes small number of self-employed workers, not shown separately. ^Includes forestries, fisheries, and mining, not shown separately.
Digitized for FRASER http://fraser.stlouisfed.org/ Federal Reserve Bank of St. Louis

17 HOUSEHOLD DATAQUARTERLY AVERAGES
Table 10. W o rk -s eek in g in tentions of persons not in la b o r force and major characteristics of those who in tend to seek work within next 12 months by sex and color
W ork-seeking in tentions, most recent work exp erien ce , and major occupation
T otal Male Fem ale
3rd qtr . 1969
3rd qtr . 1968
3rd qtr . 1969
3rd qtr . 1968
3rd qtr . 1969
3rd qtr . 1968
Total
T otal not in labor force (in t h o u s a n d s ) ....................................................................................................... 52,495 52,344 11,614 11,267 40 ,881 41 ,076
Do not intend to seek w o r k .......................................................................................................................... 45 ,103 44 ,753 9,470 9,106 35,633 35,647
Intend to seek work in next 12 m o n th s .................................................................................................... 7,392 7,591 2,144 2,162 5,248 5,430N ever w ork ed .................................................................................................................................................... 1,197 1,293 326 391 871 902L ast worked over 5 years a g o ................................................................................................................. 997 1,162 105 133 891 1,029L a st worked 1 to 5 vears. a g o .......................................................................... «■................................... 1,420 1,385 334 378 1,086 1,008Worked during previous 12 m o n t h s ........................................................................................................ 3,778 3,751 1,378 1,260 2,401 2,491
Percent distribution by occu pation ............................................................................................. 100.0 100.0 100 .0 100.0 100.0 100.0W hite-collar w o r k e r s ................................................................................................................. 39.8 4 0 .4 24 .0 23 .5 4 9 .0 49 .2
P ro fession a l and tech n ica l ....................................................................................................... 9 .8 10 .4 7 .2 9.2 11 .3 11.0M anagerial ................ ............................ ............................ ... .......................................................... 2 .8 2 . 0 4 .5 2 .7 1.8 1.7C lerica l and sa les ................................................................................................................. 27.2 28 .0 12.2 11 .5 35.9 36.5
B lu e-co lla r w o r k e r s ............. ................................................................................................................ 30 .9 29 .1 53 .9 55 .7 17.5 15.3Craftsman and fo re m e n .................................................................................................................... 4 . 4 4 . 0 10 .9 10.8 . 5 . 5O p era tiv es .............................................................................................................................................. 18.2 16 .6 2 1 . 2 20 .9 16 .4 14.3Nonfarm la b o re rs ................................................................................................................................ 8 .3 8 .5 21 .8 24 .0 . 6 . 5
Service w o r k e r s .................................................................................................................................... 25 .7 26.4 16.5 14.9 31 .1 32.3Farm w o r k e r s .......................................................................................................................................... 3 .6 4 .1 5 .6 5 .8 2 .4 3 .2
White
T otal not in labor force (in t h o u s a n d s ) ....................................................................................................... 47,217 47 ,172 10,226 9,951 36,991 37,221
Do not intend to seek work ....................................................................................................................... 41,027 40,931 8 ,354 8 ,135 32,673 32,796
Intend to seek work in next 12 months ................................................ ............................................... 6 ,191 6,241 1,873 1,816 4 ,318 4 ,425N ever worked ................................................................................................................................................. 980 1,047 282 326 698 721L a st worked over 5 years a g o ....................................................................................... ......................... 850 994 90 102 760 892L a st worked 1 to 5 years a g o ................................................................................................................. 1,130 1,106 287 308 843 798Worked during previous 12 months* .................................................................................................... 3 ,231 3 ,094 1,214 1,080 2,017 2,014
Negro and other races
T otal not in labor force (in t h o u s a n d s ) ....................................................................................................... 5,277 5,171 1,387 1,316 3,890 3,855
Do not intend to seek work ....................................................................................................................... 4 ,0 7 6 3 ,821 1,116 970 2 ,960 2,851
Intend to seek work in next 12 months ................................................................................................ 1,201 1,350 271 346 930 1,004Never worked ................................................................................................................................................. 217 246 4 4 65 173 181L ast worked over 5 years a g o ................................................................................................................. 147 168 16 31 131 137L a st worked 1 to 5 years a g o ................................................................................................................. 290 280 47 70 243 210Worked during previous 12 months* .................................................................................................... 547 657 164 180 383 477
^Occupational data not available by color.
3 7 1 - 7 9 3 0 - 69 - 2Digitized for FRASER http://fraser.stlouisfed.org/ Federal Reserve Bank of St. Louis

HOUSEHOLD DATAQUARTERLY AVERAGES
18
Table 1 Labor force status of c iv i l ian noninstitut iona l po pu la t io n by sex a n d reasons for n o np ar t ic ip a t io n
1969 1968 1967
L a b o r f o r c e s ta tu s a n d r e a s o n s fo r n o n p a r t ic ip a t io n
2ndq tr .
1stq tr .
4 thq tr .
3rdq tr .
2ndq tr .
1stq tr .
4 thq tr .
3rdq tr .
2ndq tr .
1stq tr .
Total
C iv i l i a n n o n in s t itu t io n a l p o p u la t io n ( in th o u s a n d s ) . . 134 ,020 133 ,476 132,880 132 ,249 131 ,713 131 ,267 130 ,757 130,165 129 ,527 129 ,043
P e r c e n t d i s t r i b u t i o n ......................................................................... 1 00 .0 100 .0 100 .0 100 .0 100 .0 100 .0 100 .0 1 0 0 .0 100 .0 1 0 0 .0
In c iv i l i a n la b o r f o r c e ...................................................................... 6 0 .1 5 9 .1 5 9 .5 6 0 .4 5 9 .9 5 8 .7 5 9 .7 6 0 .5 5 9 .5 5 8 .6
N o t in la b o r f o r c e ............................................................................. 3 9 .9 4 0 .9 4 0 .5 3 9 .6 4 0 .1 4 1 .3 4 0 .3 3 9 .5 4 0 .5 4 1 .4In s c h o o l ........................................................................................... 5 .4 6 .8 6 .6 2 .7 5 .2 6 .8 6 .3 2 .7 5 .2 6 .5I l l h e a lth , d i s a b i l i t y .................................................................. 3 .3 3 .3 3 .3 3 .3 3 .2 3 .4 3 .3 3 .4 3 .5 3 .7H om e r e s p o n s i b i l i t i e s .............................................................. 2 4 .4 2 4 .4 2 4 .4 2 5 .4 2 5 .1 2 4 .9 2 4 .7 2 5 .3 2 5 .3 2 5 .0R e t ir e m e n t , o ld a g e .................................................................. 4 .3 4 .3 4 .2 4 .2 4 .2 4 .2 4 .0 4 .2 4 .2 4 .1T h in k c a n n o t g e t j o b .............................................................. .4 .5 .4 .5 .5 .5 .5 .6 .5 .6A ll o th e r r e a s o n s ......................................................................... 2 .0 1 .7 1 .6 3 .3 1 .9 1 .6 1 .4 3 .3 1 .8 1 .5
Male
C iv i l i a n n o n in s t itu t io n a l p o p u la t io n ( in t h o u s a n d s ) ................ 62 ,7 58 6 2 ,5 34 62 ,236 61 ,9 21 61 ,701 61 ,535 6 1 ,3 10 6 1 ,035 6 0 ,7 35 6 0 ,5 4 0
P e r c e n t d i s t r i b u t i o n ......................................................................... 100 .0 100 .0 100 .0 1 00 .0 100 .0 100 .0 1 00 .0 100 .0 1 00 .0 1 00 .0
In c iv i l i a n la b o r f o r c e ..................................................................... 8 0 .1 7 8 .6 7 9 .1 8 1 .8 8 0 .6 7 8 .8 7 9 .6 8 2 .2 8 0 .7 7 9 .2
N o t in la b o r f o r c e ............................................................................. 1 9 .9 2 1 .4 2 0 .9 18 .2 1 9 .4 2 1 .2 2 0 .4 17 .8 1 9 .3 2 0 .8In s c h o o l ............................................................................................ 5 .7 7 .4 7 .1 2 .9 5 .4 7 .2 6 .8 2 .8 5 .5 7 .0I l l h e a lth , d i s a b i l i t y .................................................................. 3 .6 3 .4 3 .4 3 .5 3 .3 3 .5 3 .5 3 .4 3 .5 3 .8H om e r e s p o n s i b i l i t i e s .............................................................. .2 .3 .3 .3 .3 .3 .3 .2 .2 .2R e t ir e m e n t , o ld a g e ..................................................................... 8 .2 8 .1 8 .0 8 .0 8 .0 8 .0 7 .9 8 .0 7 .9 7 .8T h in k c a n n o t g e t j o b .................................................................. .2 .3 .3 .4 .3 .4 .3 .5 .3 .4A ll o th e r r e a s o n s ......................................................................... 2 .0 1 .8 1 .7 3 .2 2 .0 1 .8 1 .6 2 .9 1 .9 1 .6
Female
C iv i l i a n n o n in s t itu t io n a l p o p u la t io n ( in th o u s a n d s ) . . 71 ,262 70,942 70,645 70,328 70 ,012 6 9 ,7 33 69 ,4 48 6 9 ,1 30 68 ,7 92 6 8 ,5 03
P e r c e n t d i s t r i b u t i o n ......................................................................... 100 .0 100 .0 100 .0 100 .0 100 .0 100 .0 100 .0 1 00 .0 100 .0 1 00 .0
In c iv i l i a n la b o r f o r c e .................................................................. 4 2 .5 4 1 .9 4 2 .2 4 1 .6 4 1 .7 4 1 .0 4 2 .2 4 1 .3 4 0 .7 4 0 .4
N o t in la b o r f o r c e ............................................................................. 5 7 .5 5 8 .1 5 7 .8 5 8 .4 5 8 .3 5 9 .0 5 7 .8 5 8 .7 5 9 .3 5 9 .6In s c h o o l ............................................................................................... 5 .2 6 .2 6 .1 2 .6 4 .9 6 .3 5 .9 2 .6 5 .0 6 .2I l l h e a lth , d i s a b i l i t y ..................................................................... 3 .0 3 .3 3 .2 3 .1 3 .1 3 .2 3 .2 3 .4 3 .4 3 .6H om e r e s p o n s i b i l i t i e s .................................................................. 4 5 .8 4 5 .7 4 5 .6 4 7 .6 4 6 .9 4 6 .6 4 6 .2 4 7 .5 4 7 .5 4 6 .9R e t ir e m e n t , o ld a g e ......................................................................... 1.0 .9 .8 .9 .8 .7 .6 .8 .9 .8T h in k c a n n o t g e t j o b ..................................................................... .5 .6 .6 .7 .6 .7 .7 .8 .6 .8A ll o th e r r e a s o n s ............................................................................. 2 .1 1 .6 1 .6 3 .5 1 .9 1 .4 1 .3 3 .7 1 .8 1 .4
Digitized for FRASER http://fraser.stlouisfed.org/ Federal Reserve Bank of St. Louis

i9 HOUSEHOLD DATAQUARTERLY AVERAGES
Table 2. Reasons for n o n p ar t ic ip a t io n in la b o r force by sex
1969 1968 1967
N o n p a r t ic ip a n ts b y r e a s o n fo r s ta tu s
2nd 1st 4 th 3rd 2nd 1st 4 th 3rd 2nd 1stq tr . q tr . q tr . q tr . q tr . q tr . q tr . q tr . q tr . ___
Thousands of persons
T o t a l .............................................................................................................. 53 ,5 06 5 4 ,6 03 53 ,821 5 2 ,344 5 2 ,7 94 54 ,198 5 2 ,656 51,451 5 2 ,5 04 53 ,329In s c h o o l ............................................................................................... 7 ,2 9 3 9 ,0 1 1 8 ,7 5 0 3 ,622 6 ,7 8 9 8 ,8 6 8 8 ,2 7 2 3 ,496 6 ,7 7 9 8 ,431I ll h e a lth , d i s a b i l i t y .................................................................. 4 ,3 7 0 4 ,4 4 1 4 ,3 7 7 4 ,3 4 7 4 ,2 4 0 4 ,3 9 8 4 ,3 7 9 4 ,4 5 8 4 ,4 9 1 4 ,7 0 9H om e r e s p o n s i b i l i t i e s .............................................................. 32,762 32 ,583 32,407 33 ,640 33 ,004 32 ,670 32 ,233 32 ,970 32 ,833 32,219R e t ire m e n t , o ld a g e ...................................................................... 5 ,8 0 2 5 ,6 9 3 5 ,561 5 ,5 9 8 5 ,5 3 5 5 ,4 6 7 5 ,207 5 ,402 5 ,4 0 0 5 ,2 4 4T h in k c a n n o t g e t j o b .................................................................. 535 617 573 724 662 709 694 840 628 767A ll o th e r r e a s o n s ......................................................................... 2 ,745 2 ,256 2 ,152 4 ,4 1 3 2 ,5 6 5 2 ,0 8 7 1,872 4 ,2 8 5 2 ,3 7 3 1 ,958
M a l e .............................................................................................................. 12 ,504 13,353 12 ,990 11 ,268 11 ,960 13 ,038 12,485 10 ,863 11,704 12,547In s c h o o l ............................................................................................... 3,581 4 ,6 1 8 4 ,4 4 5 1,769 3 ,349 4 ,4 5 1 4 ,1 8 9 1 ,700 3 ,317 4 ,2 2 1I ll h e a lth , d i s a b i l i t y .................................................................. 2 ,2 3 4 2 ,1 2 4 2 ,1 4 5 2 ,1 5 6 2 ,0 4 4 2 ,131 2 ,1 5 0 2 ,1 0 3 2 ,1 3 8 2 ,2 7 0H om e r e s p o n s i b i l i t i e s .............................................................. 147 187 167 159 196 180 164 145 133 127R e t ir e m e n t , o ld a g e ...................................................................... 5 ,1 2 3 5 ,0 6 9 4 ,9 9 8 4 ,9 7 9 4 ,9 4 2 4 ,9 5 1 4 ,8 1 3 4 ,8 6 8 4 ,7 8 1 4 ,7 2 2T h in k c a n n o t g e t j o b .................................................................. 149 213 177 231 207 235 183 303 188 213A ll o th e r r e a s o n s ......................................................................... 1 ,271 1 ,142 1,057 1 ,973 1 ,222 1 ,089 985 1,745 1 ,147 994
F e m a le ....................................................................................................... 41 ,0 02 4 1 ,2 50 40 ,8 30 41 ,0 77 40 ,8 35 41 ,1 60 40 ,172 4 0 ,5 88 4 0 ,8 00 4 0 ,782In s c h o o l ............................................................................................... 3 ,712 4 ,3 9 4 4 ,3 0 6 1 ,8 5 3 3 ,440 4 ,4 1 6 4 ,0 8 3 1 ,796 3 ,462 4 ,2 1 0I ll h e a lth , d i s a b i l i t y .................................................................. 2 ,1 3 6 2 ,318 2 ,232 2 ,191 2 ,1 9 6 2 ,2 6 6 2 ,228 2 ,3 5 6 2 ,3 5 3 2 ,439H om e r e s p o n s i b i l i t i e s .............................................................. 32 ,615 32 ,396 32,240 33 ,481 32 ,808 32,490 32 ,069 32 ,8 24 32,700 32,092R e t ir e m e n t , o ld a g e ..................................................................... 679 625 562 619 593 515 394 534 619 522T h in k c a n n o t g e t j o b .................................................................. 386 404 396 493 455 474 510 537 440 555A ll o th e r r e a s o n s ......................................................................... 1 ,4 7 4 1 ,1 1 4 1,095 2 ,4 4 0 1 ,343 998 887 2 ,539 1 ,226 964
Percent distribution
T o t a l .............................................................................................................. 100 .0 1 00 .0 100 .0 1 00 .0 100 .0 100 .0 100 .0 100 .0 100 .0 100 .0In s c h o o l ............................................................................................... 1 3 .6 16 .5 1 6 .3 6 .9 1 2 .9 1 6 .4 1 5 .7 6 .8 12 .9 15.8I ll h e a lth , d i s a b i l i t y .................................................................. 8 .2 8 .1 8 .1 8 .3 8 .0 8 .1 8 .3 8 .7 8 .6 8 .8H om e r e s p o n s i b i l i t i e s .............................................................. 6 1 .2 5 9 .7 6 0 .2 6 4 .3 6 2 .5 6 0 .3 6 1 .2 6 4 .1 6 2 .5 6 0 .4R e t ir e m e n t , o ld a g e ...................................................................... 10 .8 1 9 .4 10 .3 1 0 .7 10 .5 10.1 9 .9 10.5 1 0 .3 9 .8T h in k c a n n o t g e t j o b .................................................................. 1.0 1 .1 1 .1 1 .4 1 .3 1 .3 1 .3 1 .6 1 .2 1 .4A ll o th e r r e a s o n s ......................................................................... 5 .1 4 .1 4 .0 8 .4 4 .9 3 .9 3 .6 8 .3 4 .5 3 .7
M a l e .............................................................................................................. 100 .0 1 00 .0 1 00 .0 1 00 .0 100 .0 1 00 .0 100 .0 100 .0 1 00 .0 100 .0In s c h o o l ............................................................................................ 2 8 .6 3 4 .6 34.2 1 5 .7 2 8 .0 34.1 3 3 .6 15 .6 2 8 .3 3 3 .6Ill health, d i s a b i l i t y .......................................................... 1 7 .9 1 5 .9 16.5 19.1 17.1 16 .3 17.2 1 9 .4 1 8 .3 18.1H om e r e s p o n s i b i l i t i e s .............................................................. 1 .2 1 .4 1 .3 1 .4 1 .6 1 .4 1 .3 1 .3 1 .1 1.0R e t ir e m e n t , o ld a g e ...................................................................... 4 1 .0 3 8 .0 38 .5 4 4 .2 4 1 .3 3 8 .0 3 8 .6 4 4 .8 4 0 .8 3 7 .6T h in k c a n n o t g e t j o b .................................................................. 1 .2 1 .6 1 .4 2 .1 1 .7 1 .8 1 .5 2 .8 1 .6 1 .7A ll o th e r r e a s o n s ............................................................................. 1 0 .2 8 .6 8 .1 1 7 .5 1 0 .2 8 .4 7 .9 16.1 9 .8 7 .9
F e m a le ...................................................................................................... 1 0 0 .0 100 .0 100 .0 100.0 , 100 .0 100 .0 1 00 .0 100 .0 100 .0 100 .0In s c h o o l ........................................................................................... 9 .1 1 0 .7 10 .5 4 .5 8 .4 10.7 10 .2 4 .4 8 .5 1 0 .3I l l h e a lth , d i s a b i l i t y .................................................................. 5 .2 5 .6 5 .5 5 .3 5 .4 5 .5 5 .5 5 .8 5 .8 6 .0H om e r e s p o n s i b i l i t i e s .............................................................. 79 .5 7 8 .5 7 9 .0 8 1 .5 8 0 .3 78 .9 7 9 .8 8 0 .9 8 0 .1 7 8 .7R e t ire m e n t , o ld a g e ..................................................................... 1 .7 1 .5 1 .4 1 .5 1 .5 1 .3 1.0 1 .3 1 .5 1 .3T h in k c a n n o t g e t j o b .................................................................. .9 1.0 1.0 1 .2 1 .1 1 .2 1 .3 1 .3 1 .1 1 .4A ll o th e r r e a s o n s ......................................................................... 3 .6 2 .7 2 .7 5 .9 3 .3 2 .4 2 .2 6 .3 3 .0 2 .4
Digitized for FRASER http://fraser.stlouisfed.org/ Federal Reserve Bank of St. Louis

HOUSEHOLD DATAQUARTERLY AVERAGES
20
Table 3. Reasons for no np ar t ic ip a t io n in la b o r force by color an d sex
1969 1968 1967N onparticipants by reason for status
2nd 1st 4 th 3rd 2nd 1st 4 th 3rd 2nd 1stq tr . q tr . q tr . q tr . q tr . q tr . q tr . q tr . q tr . q tr .
White 48 ,0 39 48 ,975 48 ,3 94 4 7 ,1 73 47 ,5 97 4 8 ,7 18 47 ,4 95 46 ,4 74 47 ,4 31 4 8 ,0 38
Male (in thousands) ............................................................. 11 ,0 04 11,742 11,472 9 ,9 5 1 10,591 11 ,510 11,045 9 ,6 4 1 10 ,416 11,099In s c h o o l ................................................................................ 3 ,060 3 ,998 3,865 1 ,523 2 ,8 9 7 3 ,879 3 ,655 1 ,478 2 ,9 0 2 3 ,662Ill health, d isa b ility . . . '............................................. 1 ,825 1 ,782 1 ,7 1 4 1 ,7 2 4 1 ,6 5 1 1 ,780 1,732 1 ,732 1 ,801 1 ,896Home r e s p o n s ib i l i t i e s .................................................... 127 159 152 137 176 159 150 125 119 120R etirem ent, o ld age ....................................................... 4 ,7 9 3 4 ,7 1 2 4 ,6 8 4 4 ,6 5 8 4 ,6 3 9 4 ,5 9 7 4 ,5 2 6 4 ,5 4 4 4 ,4 6 8 4 ,3 9 6Think cannot get j o b ....................................................... 116 163 134 195 160 175 149 234 161 174A ll other r e a s o n s ............................................................. 1 ,0 8 3 927 923 1 ,714 1,067 921 831 1 ,527 966 851
Fem ale (in th o u s a n d s ).......................................................... 37 ,035 37 ,233 36,922 37,222 37 ,006 37 ,208 36 ,450 36 ,833 37 ,015 36,939In sch o o l ............................................................................. 3 ,165 3,779 3,727 1 ,588 2 ,9 5 8 3 ,825 3,545 1,545 2 ,952 3 ,605Ill health, d i s a b i l i t y ....................................................... 1 ,688 1,801 1 ,811 1,669 1,718 1 ,796 1 ,788 1 ,851 1,871 1 ,917Home r e s p o n s ib i l i t i e s .................................................... 30 ,010 2 9 ,856 29,621 30 ,870 30 ,288 29 ,921 29 ,608 30,331 30 ,167 29 ,677R etirem ent, old age ....................................................... 619 562 503 568 537 475 358 499 582 485Think cannot get j o b ....................................................... 304 300 333 386 344 364 401 421 356 409A ll other r e a s o n s ............................................................. 1 ,249 935 928 2 ,1 4 1 1,161 826 750 2 ,186 1 ,086 844
Male (percent d is t r ib u t io n ) ................................................ 1 00 .0 100 .0 100 .0 1 00 .0 100 .0 100 .0 100 .0 100 .0 100 .0 100 .0In sch oo l ............................................................................. 2 7 .8 34.1 3 3 .7 1 5 .3 2 7 .4 3 3 .7 33.1 1 5 .3 2 7 .9 3 3 .0Ill health, d i s a b i l i t y ....................................................... 1 6 .6 1 5 .2 14 .9 1 7 .3 1 5 .6 15.5 1 5 .7 1 8 .0 1 7 .3 17 .1Home r e s p o n s ib i l i t i e s .................................................... 1 .2 1 .4 1 .3 1 .4 1 .7 1 .4 1 .4 1 .3 1 .1 1 .1Retirem ent, o ld a g e .......................................................... 4 3 .6 4 0 .1 4 0 .8 4 6 .8 4 3 .8 3 9 .9 4 1 .0 4 7 .1 4 2 .9 39 .6Think cannot get j o b ....................................................... 1 .1 1 .4 1 .2 2 .0 1 .5 1 .5 1 .3 2 .4 1 .5 1 .6A ll other r e a s o n s ............................................................. 9 .8 7 .9 8 .0 17.2 10.1 8 .0 7 .5 15 .8 9 .3 7 .7
Fem ale (percent d is t r ib u t io n ) .......................................... 100 .0 1 00 .0 100 .0 100 .0 100 .0 100 .0 100 .0 100 .0 1 0 0 .0 100 .0In sch o o l ............................................................................. 8 .5 10.1 10.1 4 .3 8 .0 1 0 .3 9 .7 4 .2 8 .0 9 .8Ill health , d i s a b i l i t y ....................................................... 4 .6 4 .8 4 .9 4 .5 4 .6 4 .8 4 .9 5 .0 5 .1 5 .2Home r e s p o n s ib i l i t i e s ................................................... 8 1 .0 8 0 .2 8 0 .2 8 2 .9 8 1 .8 8 0 .4 8 1 .2 8 2 .3 8 1 .5 8 0 .3Retirem ent, old age ....................................................... 1 .7 1 .5 1 .4 1 .5 1 .5 1 .3 1.0 1 .4 1 .6 1 .3Think cannot get job ................................................... .8 .8 .9 1.0 .9 1.0 1 .1 1 .1 1.0 1 .1A ll other r e a s o n s ............................................................. 3 .4 2 .5 2 .5 5 .8 3 .1 2 .2 2 .1 5 .9 2 .9 2 .3
Negro and other races 5 ,4 6 8 5 ,6 2 8 5 ,426 5 ,171 5 ,1 9 8 5 ,4 8 0 5 ,1 6 2 4 ,9 7 6 5 ,0 7 4 5 ,292
Male (in th ou sa n d s)................................................................. 1 ,500 1 ,611 1,518 1 ,316 1 ,369 1 ,5 2 8 1 ,440 1,222 1 ,288 1 ,449In sch oo l ............................................................................. 520 619 579 246 452 573 534 222 415 560Ill health, d i s a b i l i t y ....................................................... 409 341 431 432 392 352 418 370 338 373Home r e s p o n s ib i l i t i e s .................................................... 20 28 16 22 20 21 14 20 14 8Retirem ent, o ld a g e .......................................................... 330 357 314 321 303 354 286 324 314 326Think cannot get j o b ....................................................... 33 50 43 36 47 60 34 68 27 39A ll other r e a s o n s ............................................................. 189 215 135 259 155 168 154 219 181 144
Fem ale (in th o u s a n d s ).......................................................... 3 ,967 4 ,0 1 7 3,908 3 ,855 3 ,829 3 ,952 3 ,722 3 ,754 3 ,786 3 ,843In sch oo l ............................................................................. 547 615 579 265 482 591 538 251 510 605Ill health, d i s a b i l i t y ....................................................... 448 517 421 522 478 470 440 504 481 522Home r e s p o n s ib i l i t i e s ................................................... 2 ,6 0 5 2 ,5 3 9 2 ,619 2 ,611 2 ,520 2 ,5 6 8 2 ,461 2 ,4 9 3 2 ,5 3 3 2 ,4 1 5Retirem ent, o ld a g e .......................................................... 60 62 60 51 56 40 36 35 36 37Think cannot get j o b ....................................................... 82 105 63 107 111 110 110 117 84 146A ll other r e a s o n s ............................................................. 225 179 167 300 182 172 137 353 141 119
Male (percent d is t r ib u t io n ) ................................................ 100 .0 100 .0 100 .0 100 .0 1 00 .0 100 .0 100 .0 100 .0 100 . Q 100 .0In sch oo l ............................................................................. 3 4 .6 3 8 .4 38.1 1 8 .7 3 3 .0 3 7 .5 37.1 18.2 3 2 .2 3 8 .6Ill health, d i s a b i l i t y ....................................................... 2 7 .2 2 1 .2 2 8 .4 3 2 .8 2 8 .6 2 3 .0 2 9 .0 3 0 .3 2 6 .2 2 5 .7Home r e s p o n s ib i l i t i e s .................................................... 1 .3 1 .7 1 .1 1 .7 1 .5 1 .4 1.0 1 .6 1 .1 .6Retirem ent, old a g e .......................................................... 2 2 .0 2 2 .2 2 0 .7 2 4 .4 2 2 .1 2 3 .2 19.9 2 6 .5 2 4 .4 2 2 .5Think cannot get j o b ....................................................... 2 .2 3 .1 2 .8 2 .7 3 .4 3 .9 2 .4 5 .6 2 .1 2 .7A ll other r e a s o n s ............................................................. 1 2 .6 1 3 .4 8 .9 19.7 1 1 .3 11 .0 10.7 17.9 1 4 .0 9 .9
Fem ale (percent d is t r ib u t io n ) .......................................... 1 00 .0 100 .0 100 .0 1 00 .0 100 .0 100 .0 100 .0 1 00 .0 1 00 .0 100 .0In sch oo l ............................................................................. 1 3 .8 1 5 .3 14.8 6 .9 1 2 .6 1 5 .0 14 .5 6 .7 1 3 .5 1 5 .7Ill health, d i s a b i l i t y ....................................................... 11 .8 12 .9 10.8 13 .5 12 .5 1 1 .9 11 .8 1 3 .4 1 2 .7 1 3 .6Home r e s p o n s ib i l i t i e s .................................................... 6 5 .7 6 3 .2 6 7 .0 6 7 .7 6 5 .8 6 5 .0 6 6 .1 6 6 .4 6 6 .9 6 2 .8Retirem ent, old a g e .......................................................... 1 .5 1 .5 1 .5 1 .3 1 .5 1.0 1.0 .9 1.0 1.0Think cannot get j o b ....................................................... 2 .1 2 .6 1 .6 2 .8 2 .9 2 .8 3 .0 3 .1 2 .2 3 .8A ll other r e a s o n s ............................................................. 5 .7 4 .5 4 .3 7 .8 4 .8 4 .4 3 .7 9 .4 3 .7 3 .1
Digitized for FRASER http://fraser.stlouisfed.org/ Federal Reserve Bank of St. Louis

2 1 HOUSEHOLD DATAQUARTERLY AVERAGES
Table 4. Job desire of persons not in la b o r force and reasons for not seeking work by sex
1969 1968 1967
R eason s for not seek in g work
2nd 1st 4 th 3rd 2nd 1st 4 th 3rd 2nd 1stq tr . q tr . q tr . q tr . q tr . q tr . q tr . q tr . q tr . q tr .
Thousands of persons
T otal not in labor f o r c e ....................................................................................................... 5 3 ,5 06 5 4 ,6 03 53 ,821 52 ,3 44 5 2 ,7 94 5 4 ,198 52 ,656 51 ,451 5 2 ,504 53 ,329
Do not want job now .................................................................................................... 48 ,7 92 5 0 ,1 10 49 ,462 4 8 ,0 98 4 8 ,0 7 4 4 9 ,6 13 4 8 ,3 53 4 6 ,767 47 ,7 23 48 ,303
Want job now — total .................................................................................................... 4 ,7 1 4 4 ,4 9 3 4 ,3 5 9 4 ,2 4 6 4 ,7 2 0 4 ,5 8 5 4 ,3 0 3 4 ,6 8 4 4 ,7 8 1 5 ,0 2 6In sch oo l ....................................................................................................................... 1 ,590 1 ,259 1,028 559 1 ,613 1 ,261 1 ,083 542 1,521 1 ,271Ill health, d i s a b i l i t y ................................................................................................ 519 698 676 657 633 658 696 790 692 894Home resp o n s ib ilit ie s .......................................................................................... 1 ,262 1 ,156 1 ,263 1 ,409 1 ,133 1 ,247 1,141 1,542 1 ,254 1 ,363Think cannot get j o b ................................................................................................ 535 617 573 724 662 709 694 840 628 767A ll other reasons .................................................................................................... 808 763 819 896 681 711 690 970 686 729
M a l e ................................................................................................................................ 1 ,361 1 ,3 3 4 1,219 1 ,033 1 ,512 1 ,338 1 ,267 1,119 1,419 1,438In sch oo l ................................................................................................................ 791 642 571 320 847 651 551 269 730 669Ill health, d i s a b i l i t y .......................................................................................... 219 301 276 289 268 266 352 311 295 369Think cannot get j o b .......................................................................................... 149 213 177 231 207 235 183 303 188 213A ll other re a so n s1 .......................................- ................................................... 202 178 195 193 190 186 181 236 206 187
F e m a le ............................................................................................................................. 3 ,353 3 ,159 3 ,140 3 ,2 1 3 3 ,208 3 ,247 3,036 3 ,565 3,362 3 ,588In sch oo l ................................................................................................................ 799 618 457 240 766 609 532 273 791 602Ill health, d i s a b i l i t y .......................................................................................... 300 396 400 368 364 392 344 479 397 525Home r e s p o n s ib i l i t i e s ....................................................................................... 1,248 1,135 1,238 1,392 1 ,110 1 ,220 1 ,115 1,520 1 ,223 1 ,353Think cannot get j o b .......................................................................................... 386 404 396 493 455 474 510 537 440 555A ll other r e a s o n s ................................................................................................ 620 606 649 720 513 552 535 756 511 553
Percent distribution
Want job now — t o t a l .................................................................................................... 1 00 .0 100 .0 1 00 .0 100 .0 1 00 .0 100 .0 100 .0 100 .0 100 .0 100 .0In sch oo l ....................................................................................................................... 3 3 .7 2 8 .0 2 3 .6 13 .2 3 4 .2 2 7 .5 2 5 .2 1 1 .6 31.8 2 5 .3Ill health, d isa b ility ............................................................................................. 11 .0 1 5 .5 15.5 15.5 1 3 .4 14 .3 16.2 1 6 .9 14.5 17.8Home r e s p o n s ib i l i t i e s ............................................................................................. 2 6 .8 2 5 .7 2 9 .0 3 3 .2 2 4 .0 2 7 .2 2 6 .5 3 2 .9 2 6 .2 27 .1Think cannot get j o b ................................................................................................ 1 1 .3 13.7 13 .1 1 7 .1 1 4 .0 15.5 16.1 17.9 13.1 15.3A ll other r e a s o n s ............................. .......................................................................... 17.1 17.0 18.8 2 1 .1 1 4 .4 15.5 16 .0 20 .7 1.4 .3 14.5
Male ................................................................................................................................ 1 00 .0 1 00 .0 100 .0 1 00 .0 100 .0 100 .0 100 .0 100 .0 100 .0 100 .0In sch oo l ................................................................................................................ 5 8 .1 4 8 .1 4 6 .8 3 1 .0 5 6 .0 4 8 .7 4 3 .5 2 4 .0 5 1 .4 4 6 .5Ill health, d i s a b i l i t y .......................................................................................... 16.1 2 2 .6 2 2 .6 2 8 .0 17.7 19.9 2 7 .8 2 7 .8 2 0 .8 2 5 .7Think cannot get j o b .......................................................................................... 10.9 1 6 .0 14.5 2 2 .4 13.7 1 7 .6 1 4 .4 2 7 .1 13.2 1 4 .8A ll other reasons 1 ............................................................................................. 1 4 .8 1 3 .3 16.0 18 .7 12.6 13 .9 1 4 .3 2 1 .1 1 4 .5 13.0
Fem ale .......................................................................................................................... 100 .0 100 .0 100 .0 100 .0 100 .0 100 .0 100 .0 100 .0 100 .0 100 .0In sch o o l ................................................................................................................. 2 3 .8 19.6 14 .6 7 .5 2 3 .9 18 .8 17 .5 7 .7 2 3 .5 16 .8Ill health , d i s a b i l i t y .......................................................................................... 8 .9 12.5 12.7 1 1 .5 1 1 .3 12.1 1 1 .3 13 .4 11 .8 14.6Home r e s p o n s ib i l i t i e s ....................................................................................... 3 7 .2 35 .9 3 9 .4 4 3 .3 3 4 .6 3 7 .6 3 6 .7 4 2 .6 3 6 .4 3 7 .7Think cannot get j o b .......................................................................................... 11.5 1 2 .8 1 2 .6 1 5 .3 14 .2 14.6 16 .8 15.1 1 3 .1 15.5A ll other r e a s o n s ................................................................................................ 18.5 19.2 2 0 .7 2 2 .4 1 6 .0 17.0 1 7 .6 2 1 .2 15 .2 15 .4
^Includes small number of men not seeking work because of home responsibilities.
Digitized for FRASER http://fraser.stlouisfed.org/ Federal Reserve Bank of St. Louis

HOUSEHOLD DATAQUARTERLY AVERAGES
Table 5. Job desire of persons not in la b o r force a n d reasons for not seeking work by color a n d sex
1969---------------------------------------1
19681---------------------------------------
1967
R e a s o n s for n ot s e e k in g w ork1
2nd 1st 4 th 3rd 2nd 1st 4 th 3rd 2nd 1stq tr . q tr . q tr . q tr . q tr . q tr . q tr . q tr . q tr . q tr .
White
T o t a l n ot in la b o r f o r c e ..................................................................................................................... 4 8 ,039 48 ,9 75 4 8 ,3 9 4 4 7 ,1 7 3 4 7 ,5 97 48 ,7 18 4 7 ,4 95 4 6 ,4 7 4 4 7 ,4 3 1 4 8 ,0 3 8
D o n o t w a n t jo b n ow ................................................................................................................. 4 4 ,3 41 4 5 ,5 12 4 5 ,0 28 4 3 ,7 85 4 3 ,8 3 9 4 5 ,1 65 4 4 ,1 06 4 2 ,7 70 4 3 ,6 4 0 4 4 ,0 5 3
W ant jo b n o w — to ta l ................................................................................................................. 3 ,698 3 ,4 6 3 3 ,3 6 6 3 ,3 8 8 3 ,7 5 8 3 ,5 5 3 3 ,3 8 9 3 ,7 0 4 3 ,7 9 1 3 ,9 8 5In s c h o o l ....................................................................................................................................... 1 ,267 1 ,0 1 3 778 438 1 ,3 2 4 1 ,007 856 422 1 ,215 1 ,035I ll h e a lth , d i s a b i l i t y .............................................................................................................. 392 505 496 469 471 487 503 580 530 660H om e r e s p o n s ib i l i t i e s ...................................................................................................... 944 860 923 1 ,119 882 931 897 1 ,2 3 3 950 1 ,3 6 3T h in k c a n n o t g e t j o b .............................................................................................................. 420 463 467 581 504 539 550 655 517 583A ll o th e r r e a s o n s .................................................................................................................. 675 622 702 781 577 589 584 814 579 643
M a l e .................................................................................................................................................. 1 ,119 1 ,0 6 4 936 841 1 ,240 1 ,080 1 ,016 890 1 ,170 1 ,1 8 0In s c h o o l ................................................................................................................................ 636 513 429 264 702 536 447 207 606 555I l l h e a lth , d i s a b i l i t y ...................................................................................................... 185 235 203 213 216 213 254 241 237 286T h in k c a n n o t g e t j o b ...................................................................................................... 116 163 134 195 160 175 149 234 161 174A ll o th e r r e a s o n s * ............................................ ... .......................................................... 182 153 170 169 162 156 166 208 166 165
F e m a l e .............................................................................................................................................. 2 ,579 2 ,3 9 9 2 ,4 3 0 2 ,5 4 7 2 ,5 1 8 2 ,4 7 3 2 ,3 7 3 2 ,8 1 4 2 ,6 2 1 2 ,8 0 5In s c h o o l ................................................................................................................................ 631 500 349 174 622 471 409 215 609 480I ll h e a lth , d i s a b i l i t y ....................................................................................................... 207 270 293 256 255 274 249 339 293 374H om e r e s p o n s i b i l i t i e s ................................................................................................... 932 841 902 1 ,106 863 910 871 1 ,211 922 1 ,053T h in k c a n n o t g e t j o b ....................................................................................................... 304 300 333 386 344 364 401 421 356 409A ll o th e r r e a s o n s .............................................................................................................. 505 488 553 625 434 454 443 628 441 489
Negro and other races
T o ta l n ot in la b o r f o r c e ..................................................................................................................... 5 ,467 5 ,628 5 ,4 2 6 5 ,1 7 1 5 ,1 9 8 5 ,4 8 0 5 ,1 6 2 4 ,9 7 6 5 ,0 7 4 5 ,2 9 2
D o n o t w a n t jo b n ow ................................................................................................................. 4 ,4 5 2 4 ,5 9 7 4 ,4 3 3 4 ,3 1 4 4 ,2 3 5 4 ,4 4 7 4 ,2 4 9 3 ,9 9 6 4 ,0 8 4 4 ,2 5 2
W ant jo b n ow — to ta l .................................................................................................................. 1 ,015 1 ,031 993 857 963 1,033 913 980 990 1 ,040In sch o o l ....................................................................................................................... 322 246 249 120 289 254 226 120 306 236I ll h e a lth , d i s a b i l i t y .............................................................................................................. 127 193 181 189 162 171 192 210 161 235H om e r e s p o n s ib i l i t i e s ...................................................................................................... 318 296 340 290 250 316 245 309 304 299T h in k c a n n o t g e t j o b .............................................................................................................. 115 155 106 143 158 170 144 185 111 185A ll o th e r r e a s o n s .................................................................................................................. 133 141 117 115 104 122 106 156 108 85
M a l e .................................................................................................................................................. 242 270 282 191 272 259 251 228 249 258In s c h o o l ................................................................................................................................ 155 128 141 55 145 116 103 62 124 114I l l h e a lth , d i s a b i l i t y ...................................................................................................... 34 67 73 76 52 53 98 70 58 83T h in k c a n n o t g e t j o b ...................................................................................................... 33 50 43 36 47 60 34 68 27 39A ll o th e r r e a s o n s * ............................................» .......................................................... 20 25 25 24 28 30 16 28 40 22
F e m a l e .............................................................................................................................................. 773 761 711 666 691 774 662 752 741 782In s c h o o l ................................................................................................................................ 167 118 108 65 144 138 123 58 182 122I ll h e a lth , d i s a b i l i t y ....................................................................................................... 93 126 108 113 110 118 94 140 103 152H om e r e s p o n s i b i l i t i e s ................................................................................................... 316 294 336 286 247 310 243 309 301 299T h in k c a n n o t g e t j o b ....................................................................................................... 82 105 63 107 111 110 110 117 84 146A ll o th e r r e a s o n s .............................................................................................................. 115 118 96 95 79 98 92 128 71 63
Includes small number of men seeking work because of home responsibilities.
Digitized for FRASER http://fraser.stlouisfed.org/ Federal Reserve Bank of St. Louis

23 HOUSEHOLD DATAQUARTERLY AVERAGES
Table 6. Persons not in la b o r force who desire to work but th ink they cannot get jobs bycolor, sex, and d e ta i le d reason
(In t h o u s a n d s )
1969 _____ __________ 11968____________ 1967
D e t a il e d r e a s o n fo r n o t s e e k in g w ork 2nd lat 4 th 3rd 2nd 1st 4 th 3rd 2nd 1stq tr . q tr . q tr . q tr . q tr . q tr . _q tr . q tr . g tr . g tr .
Total
T - M 535 617 573 724 662 709 694 840 628 767E m p lo y e r s th in k t o o y o u n g o r o l d ............................................................................................... 144 137 143 203 156 180 204 224 I f f 236
73 78 56 88 80 72 89 98 69 82O th e r p e r s o n a l h a n d ic a p .................................................................................................................. 40 47 43 66 47 51 52 61 37 46C o u ld n o t f in d j o b .................................................................................................................................... 148 164 135 173 159 178 151 235 135 150T h in k s n o j o b a v a i l a b l e ..................................................................................................................... 130 191 197 194 220 228 198 222 188 254
M a l e ........................................................................................................................................................................ 149 213 177 231 207 235 183 302 188 213E m p lo y e r s th in k t o o y o u n g o r o l d ............................................................................................... 62 71 67 87 78 94 86 115 90 83L a c k s e d u c a t io n o r tr a in in g .......................................................................................................... 11 16 5 30 18 11 11 18 12 16O th er p e r s o n a l h a n d ic a p .................................................................................................................. 10 22 14 22 8 12 20 26 10 16C o u ld n o t f in d j o b ................................................................................................................................ 34 52 45 48 42 47 28 88 37 35T h in k s n o jo b a v a i l a b l e ..................................................................................................................... 31 52 46 44 61 70 38 56 40 62
386 4 0 4 396 493 455 474 510 537 440 555E m p lo y e r s th in k t o o y o u n g o r o ld ...........................................................................................L a c k s e d u c a t io n o r tra in in g ..........................................................................................................
8162
6662
7651
11658
7862
8661
11877
11080
10957
15366
O th er p e r s o n a l h a n d i c a p ..................................................................................................................... 30 25 29 43 39 39 33 35 27 30C o u ld n o t f in d j o b ................................................................................................................................ 113 112 90 125 116 130 123 147 99 114T h in k s n o j o b a v a i l a b l e ..................................................................................................................... 99 139 151 150 159 158 160 166 148 192
Whit*
T o t a l .................................................................................................................................................. 420 463 467 581 COA 583E m p lo y e r s th in k t o o y o u n g o r o l d ...................... 121 121 128 1887361
JU*»133 161
550 655Ortfi
517
L a c k s e d u c a t io n or t r a i n i n g .................................O th er p e r s o n a l h a n d ic a p .................................
5533
109
603885
4436
68OO
49AOU
73a UU
79184
5830
2106840C o u ld n o t fin d i o b ..................................... 94 1 9 A 1 A /.
J l 1 OO
43 53
T h in k s n o j o b a v a i l a b l e ................................. 102 158 1651AU141 166
IZdC176
94159
157165
102143
89176
116 11/. 16179101033
17472111526
E m p lo y e r s th in k t o o y o u n g o r o l d ...............L a c k s e d u c a t io n o r t r a in in g .................................O th er p e r s o n a l h a n d ic a p ..............................C o u ld n o t fin d jo b ............................................T h in k s n o jo b a v a i l a b l e .................................
4798
2626
304
AO J 60 12 17 31 42
300
5958
2834
1957825223635
1606515
32750
1757910
730c n
14973
916219A
23496162657
F e m a le ................................. • t t i t
JU JU 39 29
356105
48
50
409E m p lo y e r s th in k t o o y o u n g o r o ld ................................. 74 6148
J J J6939
JoD110
344 364OO
401 421L a c k s e d u c a t io n o r t r a i n i n g ............................................O th er p e r s o n a l h a n d i c a p ..............................
46258376
4839
oo539 0
39OA
10764
10463
13857
2154
116
28C o u ld n o t fin d j o b ........................................T h in k s n o jo b a v a i l a b l e .................................
66131
84106
A ?
77116
A H
9 2126
2773
1 9 0
27 100 1 9&
2069
2563
Negro and other races
114 126
115 155 106 143 158 170 144 185 111 185E m p lo y e r s th in k t o o y o u n g o r o l d ...................................................................... 23 16 15 16 23 19 24 24 15 26L a c k s e d u c a t io n or t r a i n i n g ...................................................................................................... 17 18 12 15 12 24 16 18 12 13O th er p e r s o n a l h a n d ic a p ................................................................................. 6 9 7 5 14 19 9 8 7 5C o u ld n o t f in d j o b ............................................................................................... 40 79 42 53 54 56 57 78 34 62T h in k s n o io b a v a i l a b l e ................................................................................ 28 33 31 53 54 52 39 56 44 78
33 50 43 36 47 60 34 68 27 39E m p lo y e r s th in k t o o y o u n g o r o l d ......................................................................... 15 11 8 9 13 15 13 19 11 11L a c k s e d u c a t io n o r tr a in in g . ...................................................................... 2 4 6 o 0 *O th er p e r s o n a l h a n d ic a p ........................................................................................... 1 5 6
j
4£5
J
42 2 5
1C o u ld n o t fin d io b .......................................................................................................... 9 21 18 12 15 18 7 31 4 10T h in k s n o io b a v a i l a b l e ...................................................................... 5 10 12 9 11 20 8 16 11 12
F e m a le ................................................................................................................. 82 105 63 107 111 110 110 117 84 146E m p lo y e r s th in k to o y o u n g o r o ld ........................................................................................ 8 5 7 7 10 4 11 5 4 15L a c k s e d u c a t io n o r tra in in g ......................................................................... 15 14 12 9 9 22 13 16 10 8O th er p e r s o n a l h a n d i c a p ...................................................................... 5 4 1 5 10 14 5 8 7 4C o u ld n o t f in d j o b ............................................................................................... 31 58 24 41 39 38 50 47 30 52T h in k s n o io b a v a i l a b l e ...................................................................... 23 23 19 44 43 32 31 40 33 66
Digitized for FRASER http://fraser.stlouisfed.org/ Federal Reserve Bank of St. Louis

HOUSEHOLD DATAQUARTERLY AVERAGES
2 4
Table 7. Most recent work experience of persons not in labor force and
those who w orked during previous 12 months
reason for leaving last job for
by sex
1969 1968 1967
M o s t r e c e n t w o rk e x p e r ie n c e a n d r e a s o n le a v in g jo b
2nd 1st 4 th 3rd 2nd 1st 4 th 3rd 2nd 1stq tr . q tr . q tr . q tr . q tr . q tr . q tr . q tr . q tr . q tr .
Total
N o t in la b o r f o r c e ( in t h o u s a n d s ) ............................................................................................... 53 ,506 54 ,602 5 3 ,8 20 52 ,3 44 52 ,7 94 5 4 ,197 52,656 5 1 ,4 50 5 2 ,5 03 5 3 ,328N e v e r w o r k e d .................................................................................................................................... 9 ,8 7 8 10,011 10,032 9 ,591 10 ,059 10,495 10,156 9 ,817 10 ,294 10,741L a s t w o r k e d o v e r 5 y e a r s a g o ................................................................................................ 24,677 24 ,6 50 24,322 24 ,805 24 ,564 24 ,3 24 23 ,923 24 ,0 89 24 ,1 87 2 4 ,015L a s t y o r k e d 1 to 5 y e a r s a g o ............................................................................................... 9 ,136 9 ,0 0 3 9 ,0 7 3 8 ,9 6 6 8 ,9 7 3 8 ,9 4 1 9 ,0 0 6 9 ,0 9 2 8 ,7 2 1 8 ,5 8 4L e f t j o b p r e v io u s 12 m o n t h s ................................................................................................... 9 ,8 1 5 10,939 10 ,393 8 ,9 8 2 9 ,1 9 8 10,437 9 ,5 7 0 8 ,4 5 2 9 ,301 9 ,9 8 7
P e r c e n t d is t r ib u t io n b y r e a s o n ........................................................................................ 100 .0 100 .0 100 .0 100 .0 100 .0 100 .0 100 .0 1 00 .0 100 .0 1 00 .0S c h o o l , h om e r e s p o n s i b i l i t i e s .................................................................................... 4 6 .8 5 1 .1 5 3 .4 4 8 .0 4 7 .4 5 1 .9 5 5 .4 4 6 .1 4 3 .4 5 1 .2I l l h e a lth , d i s a b i l i t y .......................................................................................................... 9 .6 9 .4 9 .4 1 0 .4 9 .2 8 .1 8 .5 11.1 9 .5 9 .0R e t ir e m e n t , o ld a g e .............................................................. ........................................... 6 .4 5 .4 5 .8 7 .0 6 .2 5 .2 5 .3 5 .3 5 .5 5 .2E c o n o m ic r e a s o n s .............................................................................................................. 15.1 1 8 .3 16.2 18 .6 16 .6 19.7 16.9 1 8 .3 15.6 1 7 .9
E n d o f s e a s o n a l j o b ................................................................................................... 7 .4 1 0 .5 8 .2 9 .2 7 .8 11 .0 9 .3 9 .5 7 .7 1 0 .2S la c k w o r k ......................................................................................................................... 3 .0 2 .9 3 .0 3 .2 3 .3 3 .2 2 .9 3 .4 3 .5 3 .6E n d o f tem p ora ry j o b ............................................................................................... 4 .7 4 .9 5 .0 6 .2 5 .5 5 .5 4 .7 5 .5 4 .4 4 .1
A l l o th e r r e a s o n s .............................................................................................................. 2 2 .1 1 5 .8 15 .2 16 .0 2 0 .6 1 5 .1 1 3 .9 1 9 .1 2 6 .0 1 6 .8
Male
N ot in la b o r f o r c e ( in t h o u s a n d s ) ............................................................................................... 12 ,504 13 ,352 12 ,990 11,267 11,959 13,038 12,485 10 ,863 11 ,703 12 ,547N e v e r w o r k e d ............... ... ................................................................................................................. 1 ,733 1,797 1 ,698 1 ,418 1 ,610 1,738 1,577 1 ,318 1 ,4 5 3 1 ,560L a s t w o r k e d o v e r 5 y e a r s a g o ............................................................................................... 4 ,9 5 5 4 ,8 9 1 4 ,8 0 4 4 ,9 1 9 4 ,8 4 4 4 ,9 3 4 4 ,7 8 8 4 ,8 2 6 4 ,7 6 7 4 ,8 3 4L a s t w o r k e d 1 to 5 y e a r s a g o ................................................................................................... 2 ,4 7 4 2 ,426 2 ,4 7 2 2 ,2 7 4 2 ,417 2 ,4 3 3 2 ,4 1 4 2 ,3 1 0 2 ,2 7 4 2 ,3 5 6L e f t j o b p r e v io u s 12 m o n t h s ................................................................................................... 3 ,3 4 2 4 ,2 3 8 4 ,0 1 7 2 ,6 5 6 3 ,0 8 9 3 ,933 3 ,705 2 ,4 1 0 3 ,209 3 ,797
P e r c e n t d is t r ib u t io n b y r e a s o n ........................................................................................ 100 .0 100 .0 1 00 .0 100 .0 100 .0 100 .0 100 .0 100 .0 100 .0 100 .0S c h o o l , h o m e r e s p o n s i b i l i t i e s .................................................................................... 4 0 .1 4 8 .7 5 2 .4 37 .8 4 0 .8 5 1 .4 5 5 .6 3 7 .9 38 .1 5 0 .3I ll h e a lth , d i s a b i l i t y ...................................................................................................... 12.6 10.1 10.6 1 4 .3 11.1 9 .1 8 .9 16.7 11 .4 10 .2R e t ir e m e n t , o ld a g e .................................................................. . .................................... 13.2 9 .8 9 .9 16.2 1 2 .0 9 .1 9 .6 12 .6 11.5 9 .5E c o n o m ic r e a s o n s .............................................................................................................. 1 0 .2 1 5 .7 13.1 15 .8 1 1 .6 16.5 14.1 1 4 .4 11 .5 1 3 .9
E nd o f s e a s o n a l j o b ................................................................................................... 5 .1 9 .8 7 .4 7 .7 5 .5 9 .8 8 .4 7 .4 6 .1 8 .6S la c k w o r k ......................................................................................................................... 2 .4 2 .5 2 .3 2 .9 2 .9 2 .5 2 .3 2 .7 2 .6 2 .5E n d o f tem p ora ry j o b ................................................................................................... 2 .7 3 .4 3 .4 5 .3 3 .2 4 .1 3 .4 4 .3 2 .7 2 .8
A l l o th e r r e a s o n s ................................................................................................................. 2 4 .0 15 .6 1 4 .0 16.0 2 4 .5 14 .0 11.9 1 8 .3 2 7 .6 1 6 .1
Female
N o t in la b o r f o r c e ( in t h o u s a n d s ) ............................................................................................... 4 1 ,002 4 1 ,2 50 40 ,8 30 41 ,0 76 4 0 ,8 34 4 1 ,159 40 ,1 71 40 ,5 87 4 0 ,8 00 4 0 ,7 81N e v e r w o r k e d ....................................................................................................................................... 8 ,1 4 4 8 ,2 1 4 8 ,3 3 4 8 ,1 7 3 8 ,4 5 0 8 ,7 5 8 8 ,5 7 9 8 ,4 9 9 8 ,8 4 1 9 ,1 8 1L a s t w o r k e d o v e r 5 y e a r s a g o ................................................................................................... 19 ,723 19,759 19,519 19 ,886 19 ,720 19,390 19,134 19,263 19,419 19,182L a s t w o r k e d 1 to 5 y e a r s a g o ................................................................................................... 6 ,661 6 ,5 7 7 6 ,601 6 ,6 9 2 6 ,5 5 6 6 ,5 0 8 6 ,5 9 2 6 ,7 8 2 6 ,4 4 7 6 ,2 2 9L e f t j o b p r e v io u s 12 m on th s ................................................................................................... 6 ,4 7 4 6 ,7 0 1 6 ,3 7 6 6 ,3 2 6 6 ,1 0 9 6 ,5 0 4 5 ,865 6 ,042 6 ,0 9 2 6 ,1 9 0
P e r c e n t d is t r ib u t io n by r e a s o n ........................................................................................ 100 .0 1 00 .0 100 .0 100 .0 100 .0 100 .0 100 .0 100 .0 100 .0 100 .0S c h o o l , h om e r e s p o n s i b i l i t i e s ..................................................................................... 5 0 .2 5 2 .6 5 4 .0 5 2 .3 5 0 .7 5 2 .2 5 5 .3 4 9 .4 4 6 .2 5 1 .7I ll h e a lth , d i s a b i l i t y .......................................................................................................... 8 .0 9 .0 8 .6 8 .8 8 .2 7 .5 8 .3 8 .9 8 .6 8 .2R e t ir e m e n t , o ld a g e .......................................................................................................... 3 .0 2 .6 3 .2 3 .1 3 .2 2 .9 2 .6 2 .4 2 .3 2 .6E c o n o m ic r e a s o n s .............................................................................................................. 1 7 .6 2 0 .0 18.2 19 .8 1 9 .1 2 1 .7 18 .6 1 9 .9 1 7 .7 2 0 .3
E n d o f s e a s o n a l j o b ................................................................................................... 8 .5 1 1 .0 8 .8 9 .9 8 .9 1 1 .6 9 .8 1 0 .3 8 .6 1 1 .1S la c k w ork ..................................................................................................................... 3 .4 3 .1 3 .4 3 .3 3 .5 3 .6 3 .4 3 .6 3 .9 4 .2E n d o f tem p ora ry jo b ................................................................................................ 5 .7 5 .9 6 .0 6 .6 6 .7 6 .4 5 .5 5 .9 5 .2 5 .0
A ll o th e r r e a s o n s .................................................................................................................. 2 1 .2 15 .8 16 .0 16 .0 1 8 .7 15.8 15.2 1 9 .4 2 5 .2 1 7 .2
Digitized for FRASER http://fraser.stlouisfed.org/ Federal Reserve Bank of St. Louis

25 HOUSEHOLD DATAQUARTERLY AVERAGES
Table 8. Most recent work exper ience
for those who worked
of persons not in la b o r force and reasons
during previous 12 months by color
for lea v in g last job
1969 1968 1967M o st r e c e n t w ork e x p e r ie n c e a n d r e a s o n le a v in g jo b
2nd 1st 4 th 3rd 2nd l 8t 4 th 3rd 2nd 1stq tr . q tr . q tr . q tr . q tr . q tr . q tr . q tr . q tr . q tr .
White
N o t in la b o r f o r c e (in t h o u s a n d s ) ............................................................................................... 48 ,0 39 48 ,974 4 8 ,3 94 47 ,1 72 47 ,5 95 4 8 ,717 47 ,494 4 6 ,4 74 4 7 ,4 29 4 8 ,036N e v e r w o r k e d .................................................................................................................................... 8 ,7 1 2 8 ,837 8 ,8 9 5 8 ,5 2 6 9 ,0 1 3 9 ,3 2 5 9 ,0 3 6 8 ,7 7 3 9 ,2 3 9 9 ,5 4 3L a s t w o r k e d o v e r 5 y e a r s a g o ............................................................................................... 22 ,635 22 ,677 2 2 ,339 22 ,778 22 ,607 22 ,329 21 ,999 22 ,223 22,266 22 ,103L a s t f o r k e d 1 to 5 y e a r s a g o ............................................................................................... 8 ,1 6 9 7 ,991 8 ,1 1 6 8 ,0 3 4 7 ,998 7 ,944 8 ,0 9 6 8 ,1 6 6 7 ,8 3 5 7 ,678L e f t j o b p r e v io u s 12 m o n t h s ................................................................................................... 8 ,5 2 3 9 ,4 6 8 9 ,042 7 ,8 3 4 7 ,979 9 ,1 2 0 8 ,3 6 4 7 ,311 8 ,0 9 0 8 ,7 1 3
P e r c e n t d is t r ib u t io n b y r e a s o n ........................................................................................ 100 .0 100 .0 100 .0 100 .0 100 .0 100 .0 1 00 .0 100.0 100 .0 KHK0S c h o o l , h om e r e s p o n s i b i l i t i e s .................................................................................... 4 7 .2 5 2 .4 5 4 .1 4 8 .8 4 9 .3 5 3 .4 5 6 .8 4 7 .6 4 4 .3 52 .1I ll h e a lth , d i s a b i l i t y .......................................................................................................... 8 .9 8 .6 8 .7 9 .4 8 .1 7 .4 7 .7 10.1 8 .7 8 .5R e t ir e m e n t , o ld a g e .......................................................................................................... 7 .0 5 .8 6 .3 7 .7 6 .7 5 .7 5 .7 5 .8 6 .2 5 .7E c o n o m ic r e a s o n s .............................................................................................................. 14 .4 1 7 .3 15 .6 18.1 15.7 1 8 .5 15.9 17.8 1 4 .4 16.9
E n d o f s e a s o n a l j o b ................................................................................................... 6 .7 9 .3 7 .8 8 .9 7 .0 9 .9 8 .5 9 .0 6 .7 9 .1S la c k w ork ......................................................................................................................... 2 .9 2 .9 2 .8 3 .0 3 .2 3 .0 2 .9 3 .3 3 .1 3 .5E nd o f tem p ora ry j o b ............................................................................................... 4 .8 5 .0 5 .0 6 .3 5 .6 5 .5 4 .5 5 .5 4 .5 4 .3
A ll o th e r r e a s o n s .............................................................................................................. 22 .5 15 .9 1 5 .3 1 6 .0 2 0 .2 15.1 13.8 18.6 2 6 .4 16.8
Negro and other races
N ot in la b o r f o r c e ( in t h o u s a n d s ) ............................................................................................... 5 ,4 6 7 5 ,6 2 8 5 ,426 5 ,171 5 ,1 9 8 5 ,4 8 0 5 ,1 6 2 4 ,9 7 6 5 ,0 7 3 5 ,292N e v e r w o r k e d ................................................................................................................................... 1,165 1 ,174 1 ,137 1,065 1 ,046 1,171 1,121 1 ,044 1 ,055 1 ,198L a s t w o r k e d o v e r 5 y e a r s a g o ............................................................................................... 2 ,0 4 3 1,972 1 ,982 2 ,026 1 ,957 1 ,995 1 ,924 1,866 1,922 1 ,913L a s t w o rk e d 1 to 5 y e a r s a g o ................................................................................................... 966 1 ,012 957 932 976 997 911 925 886 906L e f t j o b p r e v io u s 12 m o n t h s ................................................................................................... 1 ,2 9 3 1 ,470 1,351 1 ,1 4 8 1 ,219 1 ,317 1 ,206 1,141 1 ,211 1 ,274
P e r c e n t d is t r ib u t io n by r e a s o n ........................................................................................ 100 .0 100 .0 100 .0 100 .0 100 .0 100 .0 100.0 100 .0 100.0 100 .0S c h o o l , h om e r e s p o n s i b i l i t i e s .................................................................................... 4 4 .1 4 2 .4 4 8 .5 4 1 .8 34.7 4 1 .6 4 5 .4 36.5 37.0 4 4 .3I l l h e a lth , d is a b i l i t y ................................................... ... ............................................... 1 4 .2 1 5 .0 13.8 17.5 1 6 .2 13.2 13 .5 1 7 .9 1 5 .0 12.2R e t ir e m e n t , o ld a g e .......................................................................................................... 2 .8 2 .2 2 .4 1 .9 2 .7 2 .0 2 .2 2 .0 .9 2 .4E c o n o m ic r e a s o n s .............................................................................................................. 1 9 .3 2 5 .4 2 0 .4 2 2 .2 2 2 .7 2 8 .6 2 3 .7 2 1 .5 2 3 .6 2 4 .6
E nd o f s e a s o n a l j o b ................................................................................................... 11.6 18 .5 11.1 11 .4 12.9 18.7 14.7 12.8 14 .9 17 .3S la c k w o r k ........................................................................................................................ 3 .6 3 .0 3 .8 4 .7 4 .2 4 .2 3 .2 3 .5 5 .5 4 .0E n d o f tem p ora ry j o b ...................... ................................ ... ........................................ 4 .2 3 .9 5 .5 6 .1 5 .7 5 .7 5 .9 5 .3 3 .2 3 .4
A ll o th e r r e a s o n s ................................................................................................................. 19 .6 1 4 .9 14 .9 16 .6 2 3 .7 14 .6 15.1 2 2 .1 2 3 .5 16.5
Digitized for FRASER http://fraser.stlouisfed.org/ Federal Reserve Bank of St. Louis

HOUSEHOLD DATAQUARTERLY AVERAGES
Table 9. Industry and occupation of last job for persons not in labor force who stopped working during
previous 12 months for economic reasons as percent of total who stopped working.
In d u stry an d c l a s s o f w o r k e r and m a jo r o c c u p a t io n
1969 1968 ____________196 7
2ndq tr .
1stq tr .
4 thq tr .
3rdq tr .
2ndq tr .
lscq tr .
4 t hq tr .
3rdq tr .
2ndq tr .
1stq tr .
T o t a l w h o le f t j o b s in p r e v io u s 12 m o n t h s ............................................................... 15.1 1 8 .3 16.2 1 8 .6 1 6 .5 ‘19 .6 16 .9 1 8 .2 1 5 .6 1 7 .9
Industry
A g r i c u l t u r e 1 ................................................................................................................................................... 2 6 .7 4 0 .9 3 2 .0 3 1 .1 33 .1 3 9 .3 37 .2 3 1 .7 3 3 .8 3 9 .7U n p a id fa m ily w o r k e r s ...................................................................................................................... 1 .2 9 .3 4 .0 6 .5 8 .2 1 9 .7 12.7 1 3 .0 14 .1 2 7 .0W age a n d s a la r y w o r k e r s .............................................................................................................. 4 4 .2 5 4 .1 4 9 .8 5 0 .6 5 3 .5 5 4 .3 5 1 .7 4 8 .3 5 0 .6 4 5 .9
N o n a g r ic u ltu r a l i n d u s t r i e s .................................................................................................................. 1 4 .2 15 .8 1 4 .7 1 7 .7 15 .2 17 .3 14.9 17 .2 1 3 .8 15 .3S e lf - e m p lo y e d w o r k e r s .................................................................................................................. 1 7 .5 2 2 .2 19.7 2 1 .1 2 1 .4 2 3 .1 1 6 .8 1 9 .4 9 .5 2 1 .5U n p a id fa m ily w o r k e r s ..................................................................................................................... 2 .6 5 .3 3 .4 9 .7 5 .1 9 .1 11 .2 1 0 .0 1 1 .9 9 .3W age a n d s a la r y w o r k e r s .............................................................................................................. 1 4 .4 1 5 .8 1 4 .7 17 .8 1 5 .3 1 7 .4 14 .9 1 7 .3 1 4 .0 1 5 .3
P r iv a te h o u s e h o ld w o r k e r s ................................................................................................... 1 4 .7 1 9 .6 2 1 .8 2 3 .6 2 3 .4 2 0 .5 19.1 2 5 .1 1 8 .5 1 7 .9G o v e rn m e n t w o r k e r s ...................................................................................................................... 1 9 .3 1 7 .4 1 8 .1 2 8 .5 1 7 .8 2 1 .1 17 .1 2 7 .9 1 8 .3 1 4 .0A ll o t h e r 2 ............................................................................................................................................ 1 3 .4 15.2 1 3 .6 1 5 .0 14 .1 1 6 .5 14 .2 1 4 .6 1 2 .8 1 5 .3
C o n s t r u c t i o n ................................................................................................................................. 1 1 .6 1 8 .2 1 7 .2 2 1 .3 1 5 .0 1 7 .8 1 3 .9 1 6 .1 1 4 .6 1 4 .2M a n u f a c t u r in g ............................................................................................................................. 9 .9 1 2 .5 11 .8 1 1 .4 1 3 .3 14.2 12 .9 13 .5 1 2 .3 1 5 .7T r a n s p o r ta t io n and p u b l ic u t i l i t i e s ............................................................................. 1 1 .9 9 .4 1 0 .7 9 .7 7 .5 1 4 .6 7 .0 6 .4 6 .7 2 .6T r a d e ............................................................................................................................................... 1 4 .9 1 9 .6 13 .0 1 5 .0 1 4 .9 1 9 .3 1 4 .0 1 6 .7 1 4 .4 17.1F in a n c e a n d s e r v i c e s ........................................................................................................... 1 5 .1 1 2 .8 1 5 .5 1 8 .1 1 4 .8 1 4 .9 1 6 .4 1 4 .0 1 1 .6 1 4 .7
Occupation
W h ite -c o l la r w o r k e r s ................................................................................................................................. 1 5 .4 16.7 1 4 .4 1 8 .6 1 6 .2 1 8 .3 14.7 1 7 .7 1 4 .4 1 6 .1P r o f e s s i o n a l a n d t e c h n i c a l ........................................................................................................... 1 4 .3 13.2 1 4 .3 2 3 .5 17 .1 1 9 .2 1 4 .9 2 3 .0 1 1 .9 1 0 .6M a n a g e r s , o f f i c i a l s , a n d p r o p r i e t o r s ....................................................... ............................. 1 2 .5 12.5 12 .7 9 .7 9 .4 15.7 1 8 .1 1 1 .9 9 .2 1 5 .0C le r i c a l a n d s a l e s ............................................................................................................................. 1 6 .0 18 .2 14 .5 1 7 .7 16.5 1 8 .2 1 4 .4 16.5 15 .7 1 7 .6
B lu e - c o l la r w o r k e r s ................................................................................................................................. 1 3 .3 17 .1 1 5 .0 1 6 .8 1 5 .3 17 .7 1 5 .3 16 .5 14 .6 1 6 .5C r a fts m e n a n d f o r e m e n ...................................................................................................................... 1 1 .3 19 .3 13 .5 13.2 1 6 .8 1 5 .2 13.1 11 .6 14.7 1 6 .5O p e r a t iv e s ............................................................................................................................................... 14 .5 16 .6 1 4 .2 1 7 .0 1 5 .6 1 8 .7 1 5 .8 1 7 .7 1 5 .1 1 7 .5N on farm la b o r e r s ................................................................................................................................. 1 1 .9 16.7 1 7 .3 1 9 .0 1 3 .5 1 7 .3 1 5 .4 16 .2 1 3 .3 1 4 .5
S e r v ic e w o r k e r s ............................................................................................................................................ 1 3 .4 13.7 1 5 .7 1 7 .8 1 3 .8 1 5 .3 1 5 .3 1 7 .8 1 2 .1 1 2 .9F arm w o r k e r s ................................................................................................................................................... 2 6 .3 4 0 .3 3 1 .5 2 9 .8 3 2 .6 4 1 .1 3 7 .3 3 0 .3 3 3 .2 4 0 .1
Includes small number of self-employed workers, not shown separately. 'Includes forestries, fisheries, and mining, not shown separately.
Digitized for FRASER http://fraser.stlouisfed.org/ Federal Reserve Bank of St. Louis

27 HOUSEHOLD DATAQUARTERLY AVERAGES
Table 10. W o rk -s e e k in g in tentions of persons not in la b o r force and major characteristics of those who in tend to seek work within next 12 months by color
1969 1968 1967W o r k -se e k in g in t e n t io n s , m os t r e c e n t w orke x p e r ie n c e * an d m a jo r o c c u p a t io n
2nd 1st 4 th 3rd 2nd 1st 4 th 3rd 2nd 1stq tr . q tr . q tr . 4 t r . q tr . q tr . q tr . q tr . q tr . q tr .___
Total
T o t a l n o t in la b o r f o r c e ( in t h o u s a n d s ) .......................... 53 ,506 54 ,602 53 ,8 20 52 ,3 44 5 2 ,7 94 54 ,1 97 52 ,656 51 ,450 52 ,5 03 53 ,328
D o n o t in te n d to s e e k w o r k ................................................ 45 ,3 97 44 ,7 18 44 ,3 81 4 4 ,7 53 44 ,8 97 44 ,4 15 43 ,599 4 3 ,8 86 4 4 ,8 23 4 3 ,6 86
In ten d to s e e k w ork in n e x t 12 m o n t h s ...................... 8 ,1 0 9 9 ,8 8 4 9 ,4 3 9 7 ,5 9 1 7 ,897 9 ,7 8 2 9 ,0 5 6 7 ,565 7 ,6 8 0 9 ,6 4 2N e v e r w o r k e d ............................................................................. 1 ,794 1 ,969 1 ,795 1 ,2 9 3 1 ,745 2 ,0 8 5 1 ,761 1 ,370 1 ,780 2 ,057L a s t w o r k e d o v e r 5 y e a r s a g o ..................................... 1 ,032 962 948 1 ,162 1 ,041 1 ,017 985 1 ,204 1 ,050 1 ,146L a s t w o rk e d 1 to 5 y e a rs , a g o ..................................... 1 ,342 1 ,4 9 0 1,505 1,385 1 ,362 1 ,537 1 ,499 1,456 1 ,243 1 ,468W ork ed d u rin g p r e v io u s 12 m o n t h s .......................... 3 ,940 5 ,4 6 4 5 ,191 3 ,751 3 ,748 5 ,1 4 3 4 ,8 1 1 3 ,535 3 ,607 4 ,9 7 1
P e r c e n t d is t r ib u t io n b y o c c u p a t io n ............... 1 00 .0 100 .0 100 .0 100 .0 1 00 .0 1 00 .0 100 .0 100 .0 100 .0 100 .0W h ite -c o l la r w o r k e r s ................................................ 39.5 3 5 .3 3 6 .6 4 0 .4 3 9 .4 3 5 .2 3 6 .4 4 0 .5 3 6 .2 33.5
P r o f e s s i o n a l a n d t e c h n ic a l .......................... 8 .6 7 .8 8 .9 1 0 .4 8 .5 8 .5 9 .2 9 .4 7 .4 6 .6M a n a g e r ia l .................................................................. 2 .1 1 .6 1 .9 2 .0 2 .3 1 .4 1 .6 2 .0 1 .9 1 .5C le r i c a l and s a le s ................................................ 2 8 .8 2 5 .8 2 5 .8 2 8 .0 2 8 .6 2 5 .3 2 5 .7 2 9 .2 2 6 .8 2 5 .4
B lu e - c o l la r w o r k e r s ................................................... 3 1 .1 3 3 .9 3 3 .8 2 9 .1 3 0 .9 3 3 .2 3 3 .2 3 0 .0 3 1 .4 3 4 .8C ra ftsm a n a n d f o r e m e n ......................................... 4 .9 5 .3 5 .8 4 .0 4 .5 5 .2 4 .8 3 .8 4 .4 4 .6O p e r a t iv e s ...................................................................... 17 .0 1 7 .6 1 6 .1 16 .6 1 6 .7 1 6 .5 1 6 .3 18 .0 18 .7 1 8 .4N on farm l a b o r e r s ....................................................... 9 .2 11 .0 1 1 .8 8 .5 9 .8 11.5 12 .1 8 .2 8 .3 11.8
S e r v ic e w o r k e r s ........................................................... 2 3 .5 2 2 .4 2 3 .7 2 6 .4 2 3 .5 2 3 .5 2 3 .5 2 4 .5 2 4 .6 2 2 .2F arm w o r k e r s .................................................................. 6 .0 8 .4 5 .9 4 .1 6 .2 8 .1 6 .9 5 .0 7 .8 9 .5
White
T o t a l n o t in la b o r f o r c e ( in t h o u s a n d s ) .......................... 4 8 ,0 39 4 8 ,9 7 4 4 8 ,3 9 4 47 ,172 47 ,5 95 4 8 ,7 17 4 7 ,4 94 4 6 ,4 74 47 ,429 48 ,036
D o n o t in te n d to s e e k w ork ............................................ 4 1 ,5 02 40 ,985 40 ,6 31 4 0 ,931 4 1 ,0 91 40 ,7 17 39 ,986 40 ,2 57 41 ,135 40 ,1 51
In ten d t o s e e k w ork in n e x t 12 m on th s ................... 6 ,5 3 7 7 ,989 7 ,763 6 ,2 4 1 6 ,505 8 ,0 0 0 7 ,508 6 ,217 6 ,2 9 4 7 ,885N e v e r w o r k e d ......................................................................... 1 ,369 1,550 1 ,450 1 ,047 1,421 1 ,676 1 ,428 1 ,109 1,417 1 ,670L a s t w o rk e d o v e r 5 y e a r s a g o ..................................... 865 809 774 994 893 827 803 1 ,051 902 930L a s t w o rk e d 1 t o 5 y e a r s a g o ..................................... 1 ,076 1 ,123 1 ,173 1 ,106 1 ,097 1 ,190 1,195 1 ,164 994 1 ,134W ork ed d u r in g p r e v io u s 12 m on th s * ...................... 3 ,229 4 ,5 0 6 4 ,3 6 5 3 ,0 9 4 3 ,0 9 3 4 ,3 0 7 4 ,0 8 3 2 ,8 9 3 2 ,981 4 ,1 5 2
Negro and other races
T o t a l n o t in la b o r f o r c e ( in t h o u s a n d s ) .......................... 5 ,4 6 7 5 ,6 2 8 5 ,4 2 6 5 ,1 7 1 5 ,1 9 8 5 ,4 8 0 5 ,1 6 2 4 ,9 7 6 5 ,0 7 3 5 ,2 9 2
D o n o t in te n d to s e e k w ork ............................................ 3 ,896 3 ,733 3 ,750 3 ,821 3 ,806 3 ,699 3 ,6 1 3 3 ,629 3 ,687 3 ,535
In ten d to s e e k w ork in n e x t 12 m on th s ................... 1 ,5 7 1 1 ,895 1 ,676 1 ,350 1 ,392 1 ,781 1 ,548 1 ,348 1 ,386 1 ,757N e v e r w o r k e d ......................................................................... 425 419 346 246 325 408 334 261 363 387L a s t w o rk e d o v e r 5 y e a r s a g o ..................................... 168 153 173 168 148 190 182 153 149 217L a s t w o rk e d 1 to 5 y e a r s a g o ..................................... 267 366 332 280 264 347 305 292 249 334W ork ed d u rin g p r e v io u s 12 m on th s * ...................... 771 958 825 657 656 836 729 642 626 819
^Occupational data not available by color.
Digitized for FRASER http://fraser.stlouisfed.org/ Federal Reserve Bank of St. Louis

Age Adjustments to Occupational Employment Data
The minimum age coverage revision for labor force data from 14 to 16 years in January 1967 prompted a number of immediate adjustments to insure historical comparability. One such adjustment at that time was for occupational employment statistics. Annual average revisions covering the 1958-66 period for the 11 major occupations first appeared in the July 1967 issue of Employment and Earnings, with further breakdowns by sex in the December 1967 issue.
During the last few years, interest in occupational detail by color has greatly increased. The Bureau of Labor Statistics, accordingly, undertook a complete reexamination of the comparability adjustment procedures in order to extend the 16-and-over revisions to color, sex, and more detailed occupations. The nine tables on pages 27-35 present the results of the reexamination.
The adjustment process used to develop these new estimates was considerably more exacting than the earlier one and was facilitated by utilizing all available information pertinent to 14 and 15 year-olds by sex and occupation for the 1958- 66 period. The procedures were actually divided into two separate techniques, one for 1966 and the other for the years 1958-65.
In 1966, the entire set of statistics had been retabulated on a 16-year-and-over basis in order to assist in the analysis of differences due to the age change. Although not precisely comparable to the official estimates for that year because
certain minor estimating procedures could not be used, the availability of these retabulations permitted a differential adjustment of the detailed occupation statistics, which were ratioed to published employment controls by color and sex for 14 and 15 year-olds. When these specially calculated occupational estimates for 14 and 15 year-olds were resubtracted from the original 14-year-and-over data, comparable 16 and over estimates of detailed occupation by sex and color became available.
For years prior to 1966, adjustments were calculated based upon the following four controls: (1) total employment levels for 14-15 year-olds by sex and color for 1958-65, (2) detailed occupation statistics on 14-17 year-olds by sex for the years 1958-65, (3) unpublished data on 14-15 year-olds by the major occupations and sex, covering the 1961-65 period, and (4) the detailed occupational distribution by color from the 1966 calculations. The first of these four ^as the overall control, while the other three were the individual occupation controls.
Because of the more detailed methods, the revised occupation group totals differ somewhat from the earlier estimated annual average occupational data for the 1958-66 period, which have appeared in Employment and Earnings, The Manpower Report of the President, The Handbook of Labor Statistics, and other publications. The new estimates should now be used in lieu of the previously published data. A comparable monthly series on total employment by major occupations will be available in early 1970.
2 8
Digitized for FRASER http://fraser.stlouisfed.org/ Federal Reserve Bank of St. Louis

29 HOUSEHOLD DATA
A l l persons (In th o u s a n d s )
Table 1. Employed persons 16 years and over by occupation, a n nu a l averages, 19 58-6 8
O c c u p a t io n 1968 1967 1966 1965 1964 1963 1962 1961 1960 1959 1958
T ota l................................................................... 7 5 ,9 2 0 7 4 ,3 7 2 7 2 ,8 9 5 7 1 ,0 8 8 6 9 ,3 0 5 6 7 ,7 6 2 6 6 ,7 0 2 6 5 ,7 4 6 6 5 ,7 7 8 6 4 ,6 3 0 6 3 ,0 3 6
White-collar workers............................................... 3 5 ,5 5 1 3 4 ,2 3 2 3 3 ,0 6 8 3 1 ,8 5 2 3 0 ,8 6 1 2 9 ,9 4 9 2 9 ,6 3 4 2 8 ,8 8 8 2 8 ,5 2 2 2 7 ,5 9 3 2 6 ,8 3 7
P r o f e s s i o n a l and t e c h n i c a l .................................... 1 0 ,3 2 5 9 ,8 7 9 9 ,3 1 0 8 ,8 7 2 8 ,5 4 2 8 ,2 5 5 8 ,0 3 0 7 ,6 9 8 7 ,4 6 9 7 ,1 4 0 6 ,9 5 2M e d ic a l and o th e r h e a l t h .................................... 1 ,6 3 5 1 ,5 7 8 1 ,5 0 6 1 ,4 8 3 1 ,4 0 5 1 ,3 5 0 1 ,3 5 4 1 ,3 2 8 1 ,2 9 9 1 ,2 4 0 1 ,2 4 7T e a c h e r s , e x c e p t c o l l e g e .................................... 2 ,2 3 7 2 ,1 5 9 2 ,0 1 9 1 ,8 8 0 1 ,8 7 6 1 ,8 1 6 1 ,7 1 2 1 ,6 4 2 1 ,6 2 0 1 ,5 0 1 1 ,4 9 2O th er p r o f e s s io n a l and t e c h n i c a l ................. 6 ,4 5 3 6 ,1 4 3 5 ,7 8 5 5 ,5 0 9 5 ,2 6 1 5 ,0 8 9 4 ,9 6 4 4 * 7 2 8 4 ,5 5 0 4 ,3 9 9 4 ,2 1 3
M a n a g e rs , o f f i c i a l s , and p r o p r ie to r s .............. 7 ,7 7 6 7 ,4 9 5 7 ,4 0 5 7 ,3 4 0 7 ,4 4 9 7 ,2 9 3 7 ,4 0 8 7 ,1 2 0 7 ,0 6 7 6 ,9 3 6 6 ,7 8 5S a la r ie d w o r k e r s ....................................................... 5 ,5 0 2 5 ,2 8 4 4 ,6 8 6 4 ,4 2 6 4 ,2 9 5 4 ,1 4 8 4 ,0 5 2 3 ,7 5 0 3 ,5 2 4 3 ,4 2 4 3 ,2 5 8S e lf -e m p lo y e d w o rk e rs in r e ta i l t r a d e . . . . 1 ,0 9 9 1 ,0 7 4 1 ,2 6 3 1 ,3 8 9 1 ,4 7 3 1 ,4 4 1 1 ,5 8 3 1 ,6 6 5 1 ,7 6 6 1 ,7 3 3 1 ,7 7 0S e lf -e m p lo y e d w o r k e r s , e x c e p t r e t a i l tra d e 1 ,1 7 6 1 ,1 3 7 1 ,4 5 6 1 ,5 2 5 1 ,6 8 1 1 ,7 0 4 1 ,7 7 3 1 ,7 0 5 1 ,7 7 7 1 ,7 7 9 1 ,7 5 7
C le r i c a l w o r k e r s ............................................................ 1 2 ,8 0 3 1 2 ,3 3 3 1 1 ,8 1 2 1 1 ,1 4 1 1 0 ,6 3 4 1 0 ,2 5 0 1 0 ,0 7 9 9 ,8 3 8 9 ,7 6 2 9 ,3 0 7 9 ,1 1 5S te n o g r a p h e r s , t y p is t s , an d s e c r e t a r i e s . . . 3 ,3 4 7 3 ,1 9 0 3 ,0 8 6 2 ,8 7 8 2 ,7 0 5 2 ,6 2 9 2 ,5 0 7 2 ,4 0 2 2 ,3 8 3 2 ,3 1 9 2 ,2 4 0O th er c l e r i c a l w o r k e r s ......................................... 9 ,4 5 5 9 ,1 4 4 8 ,7 2 6 8 ,2 6 3 7 ,9 2 9 7 ,6 2 1 7 ,5 7 2 7 ,4 3 6 7 ,3 7 9 6 ,9 8 8 6 ,8 7 5
S a le s w o r k e r s .................................................................... 4 ,6 4 7 4 ,5 2 5 4 ,5 4 1 4 ,4 9 9 4 ,2 3 6 4 ,1 5 1 4 ,1 1 7 4 ,2 3 2 4 ,2 2 4 4 ,2 1 0 3 ,9 8 5R e t a i l t r a d e . .................................................................. 2 ,7 8 8 2 ,7 6 1 2 ,7 4 6 2 ,7 3 0 2 ,5 0 4 2 ,4 6 6 2 ,4 1 1 2 ,4 6 9 2 ,4 8 7 2 ,4 7 0 2 ,3 5 8O th er s a le s w o r k e r s ............................................... 1 ,8 5 9 1 ,7 6 5 1 ,7 9 5 1 ,7 6 9 1 ,7 3 3 1 ,6 8 5 1 ,7 0 6 1 ,7 6 3 1 ,7 3 7 1 ,7 4 0 1 ,6 2 7
Blue-collar workers ............................................... 2 7 ,5 2 5 2 7 ,2 6 1 2 6 ,9 5 0 2 6 ,2 4 7 2 5 ,3 3 9 2 4 ,7 7 5 2 4 ,0 5 2 2 3 ,6 8 3 2 4 ,0 5 7 2 3 ,9 9 3 2 3 ,3 4 8
C ra ftsm e n and fo r e m e n ............................................... 1 0 ,0 1 5 9 ,8 4 5 9 ,5 8 9 9 ,2 1 6 8 ,9 7 9 8 ,9 1 5 8 ,6 6 8 8 ,6 1 7 8 ,5 5 4 8 ,5 5 4 8 ,4 6 3C a r p e n t e r s .................................................................... 869 840 853 849 820 813 810 815 832 845 853C o n s tr u c t io n c r a ft s m e n , e x c e p t c a r p e n te r s 1 ,9 0 1 1 ,9 2 3 1 ,9 7 5 1 ,8 3 8 1 ,7 9 0 1 ,7 9 4 1 ,7 0 2 1 ,6 8 8 1 ,7 2 0 1 ,7 2 5 1 ,6 1 9M e c h a n ic s and r e p a ir m e n .................................... 2 ,6 2 8 2 ,5 3 9 2 ,3 9 0 2 ,3 3 5 2 ,2 2 3 2 ,2 0 3 2 ,1 4 3 2 ,1 2 0 2 ,0 1 4 2 ,0 4 3 2 ,0 7 4M eta l c r a ft s m e n , e x c e p t m e c h a n i c s ........... 1 ,2 6 1 1 ,2 6 0 1 ,1 7 9 1 ,1 1 2 1 ,0 9 1 1 ,0 7 9 1 ,0 4 6 1 ,0 2 1 1 ,0 9 0 1 ,0 8 0 1 ,0 4 9O th er c r a fts m e n and k in d re d w o rk e rs . . . . 1 ,9 1 2 1 ,8 5 8 1 ,8 4 7 1 ,8 1 6 1 ,8 3 0 1 ,7 8 3 1 ,7 4 8 1 ,8 2 6 1 ,7 6 1 1 ,7 3 8 1 ,7 0 9F o r e m e n , n ot e ls e w h e r e c l a s s i f i e d ........... 1 ,4 4 4 1 ,4 2 7 1 ,3 4 5 1 ,2 6 6 1 ,2 2 5 1 ,'243 1 ,2 1 9 1 ,1 4 7 1 ,1 3 7 1 ,1 2 3 1 ,1 5 9
O p e r a t i v e s .......................................................................... 1 3 ,9 5 5 1 3 ,8 8 4 1 3 ,8 2 9 1 3 ,3 4 5 1 2 ,8 8 0 1 2 ,4 6 4 1 1 ,9 9 4 1 1 ,7 1 9 1 1 ,9 5 0 1 1 ,8 1 6 1 1 ,4 0 2D r iv e r s and d e liv e r y m e n .................................... 2 ,5 4 7 2 ,5 1 1 2 ,5 6 9 2 ,4 9 7 2 ,5 0 2 2 ,4 3 7 2 ,3 4 3 2 ,3 4 2 2 ,3 6 7 2 ,3 6 8 2 ,2 4 6O th er o p e r a t i v e s ....................................................... 1 1 ,4 0 7 1 1 ,3 7 2 1 1 ,2 6 0 1 0 ,8 4 8 1 0 ,3 7 9 1 0 ,0 2 7 9 ,6 5 1 9 ,3 7 7 9 ,5 8 3 9 ,4 4 8 9 ,1 5 6
D u ra b le g o o d s m a n u f a c t u r in g .................... 4 ,7 1 7 4 ,7 5 1 4 ,6 4 5 4 ,2 9 4 3 ,9 6 3 3 ,8 5 9 3 ,6 0 6 3 ,3 5 4 3 ,4 7 5 3 ,4 8 0 3 ,2 0 2N o n d u ra b le g o o d s m a n u f a c t u r in g ........... 3 ,8 4 9 3 ,7 6 1 3 ,7 7 4 3 ,6 9 2 3 ,5 6 6 3 ,4 5 6 3 ,3 0 7 3 ,3 0 5 3 ,3 4 1 3 ,2 1 1 3 ,2 0 1O th er in d u s t r ie s ................................................. 2 ,8 4 1 2 ,8 6 1 2 ,8 4 1 2 ,8 6 2 2 ,8 5 0 2 ,7 1 2 2 ,7 3 8 2 ,7 1 8 2 ,7 6 7 2 ,7 5 7 2 ,7 5 3
N on farm l a b o r e r s ............................................................ 3 ,5 5 5 3 ,5 3 3 3 ,5 3 2 3 ,6 8 6 3 ,4 8 0 3 ,3 9 6 3 ,3 9 0 3 ,3 4 7 3 ,5 5 3 3 ,6 2 3 3 ,4 8 3C o n s t r u c t i o n ............................................................... 742 732 715 789 773 714 732 739 787 825 794M a n u fa ctu rin g ............................................................ 1 ,0 7 6 1 ,1 0 7 1 ,0 9 5 1 ,0 7 8 1 ,0 1 7 993 1 ,0 0 6 975 1 ,1 2 7 1 ,1 6 8 1 ,0 7 0O th er in d u s t r ie s ....................................................... 1 ,7 3 7 1 ,6 9 4 1 ,7 2 2 1 ,8 1 9 1 ,6 9 0 1 ,6 8 9 1 ,6 5 2 1 ,6 3 3 1 ,6 3 9 1 ,6 3 0 1 ,6 1 9
Service workers........................................................ 9 ,3 8 1 9 ,3 2 5 9 ,2 1 2 8 ,9 3 6 8 ,8 9 3 8 ,6 7 1 8 ,3 8 3 8 ,2 6 1 8 ,0 2 3 7 ,6 9 7 7 ,4 8 7
P r iv a te h o u s e h o ld w o rk e rs .................................... 1 ,7 2 5 1 ,7 6 9 1 ,9 0 4 1 ,9 5 6 2 ,0 4 1 2 ,0 2 9 2 ,0 2 3 2 ,0 3 5 1 ,9 7 3 1 ,9 4 8 1 ,9 6 9
S e r v ic e w o r k e r s , e x c e p t p r iv a te h o u s e h o ld . . 7 ,6 5 6 7 ,5 5 6 7 ,3 0 8 6 ,9 8 0 6 ,8 5 2 6 ,6 4 2 6 ,3 6 0 6 ,2 2 6 6 ,0 5 0 5 ,7 4 9 5 ,5 1 8P r o t e c t iv e s e r v i c e w o r k e r s .............................. 952 954 884 873 889 844 804 774 765 756 739W a ite rs , c o o k s , an d b a r te n d e r s ................... 2 ,0 8 0 2 ,0 6 1 1 ,9 8 1 1 ,9 2 3 1 ,8 8 4 1 ,8 3 9 1 ,7 4 3 1 ,6 8 6 1 ,6 5 3 1 ,6 0 8 1 ,5 1 6O th er s e r v ic e w o rk e rs ......................................... 4 ,6 2 4 4 ,5 4 1 4 ,4 4 3 4 ,1 8 4 4 ,0 7 9 3 ,9 5 9 3 ,8 1 3 3 ,7 6 6 3 ,6 3 2 3 ,3 8 5 3 ,2 6 3
Farm workers............................................................ 3 ,4 6 4 3 ,5 5 4 3 ,6 6 6 4 ,0 5 3 4 ,2 1 2 4 ,3 6 4 4 ,6 3 2 4 ,9 1 3 5 ,1 7 6 5 ,3 4 4 5 ,3 6 1
F a rm ers and farm m a n a g e r s .................................... 1 ,9 2 6 1 ,9 7 0 2 ,0 9 1 2 ,2 3 8 2 ,3 1 3 2 ,3 8 8 2 ,5 8 7 2 ,7 0 6 2 ,7 7 6 3 ,0 1 3 3 ,0 7 9
F arm la b o r e r s an d fo re m e n .................................... 1 ,5 3 8 1 ,5 8 4 1 ,5 7 5 1 ,8 1 5 1 ,8 9 9 1 ,9 7 6 2 ,0 4 5 2 ,2 0 7 2 ,4 0 0 2 ,3 3 1 2 ,2 8 2P a id w o r k e r s ............................................................... 1 ,0 0 0 1 ,0 4 9 1 ,0 1 0 1 ,1 4 7 1 ,2 1 5 1 ,2 8 0 1 ,2 8 1 1 ,3 7 8 1 ,4 7 1 1 ,3 4 6 1 ,3 3 3U n p a id fa m ily w o r k e r s ......................................... 538 536 565 668 684 696 764 829 929 985 949
Digitized for FRASER http://fraser.stlouisfed.org/ Federal Reserve Bank of St. Louis

HOUSEHOLD DATA 30
M a l e(In t h o u s a n d s )
Table 2. Employed persons 16 years and over by occupation, an nu a l averages, 19 58 -6 8
O c c u p a t io n1968 1967 1966 1965 1964 1963 1962 1961 1960 1959 1958
T ota l................................................................... 4 8 ,1 1 4 4 7 ,4 7 9 4 6 ,9 1 9 4 6 ,3 4 0 4 5 ,4 7 4 4 4 ,6 5 7 4 4 ,1 7 7 4 3 ,6 5 6 4 3 ,9 0 4 4 3 ,4 6 6 4 2 ,4 2 3
'White-collar workers............................................... 1 9 ,1 1 7 1 8 ,5 2 7 1 8 ,0 9 4 1 7 ,7 4 6 1 7 ,4 8 0 1 7 ,0 5 9 1 7 ,0 0 8 1 6 ,6 1 7 1 6 ,4 2 3 1 5 ,9 7 4 1 5 ,4 8 5
P r o f e s s i o n a l and t e c h n i c a l •.................................... 6 ,4 4 9 6 ,1 8 3 5 ,8 3 6 5 ,5 9 6 5 ,4 3 5 5 ,3 0 9 5 ,1 7 0 4 ,9 5 2 4 ,7 6 6 4 ,5 8 2 4 ,4 1 6M e d ic a l and o th e r h e a l t h .................................... 635 621 604 592 571 566 572 590 554 522 530T e a c h e r s , e x c e p t c o l l e g e .................................... 668 640 595 552 546 533 512 4 74 45 6 396 376O th er p r o f e s s i o n a l and t e c h n i c a l ................. 5 ,1 4 5 4 ,9 2 3 4 ,6 3 7 4 ,4 5 2 4 ,3 1 8 4 ,2 1 0 4 ,0 8 6 3 ,8 8 8 3 ,7 5 6 3 ,6 6 4 3 ,5 1 0
M a n a g e r s , o f f i c i a l s , and p r o p r i e t o r s .............. 6 ,5 3 5 6 ,3 1 8 6 ,2 3 8 6 ,2 3 0 6 ,3 4 1 6 ,1 8 0 6 ,2 7 5 6 ,0 0 2 5 ,9 6 8 5 ,8 5 8 5 ,7 5 1S a la r ie d w o r k e r s ....................................................... 4 ,6 7 8 4 ,5 1 0 3 ,9 5 8 3 ,7 7 2 3 ,6 5 7 3 ,5 0 5 3 ,4 2 8 3 ,1 7 5 2 ,9 9 6 2 ,9 0 9 2 ,8 0 4S e lf - e m p lo y e d w o r k e r s in r e t a i l t r a d e . . . . 836 814 985 1 ,0 8 3 1 ,1 6 7 1 ,1 4 0 1 ,2 5 1 1 ,2 9 7 1 ,3 8 6 1 ,3 6 7 1 ,3 8 4S e l f - e m p lo y e d w o r k e r s , e x c e p t r e t a i l tra d e 1 ,0 2 1 996 1 ,2 9 5 1 ,3 7 5 1 ,5 1 7 1 ,5 3 5 1 ,5 9 6 1 ,5 3 0 1 ,5 8 6 1 ,5 8 2 1 ,5 6 3
C le r i c a l w o r k e r s ............................................................. 3 ,4 0 9 3 ,4 0 6 3 ,3 4 8 3 ,2 7 9 3 ,1 9 8 3 ,1 1 7 3 ,1 2 8 3 ,1 1 0 3 ,1 4 5 2 ,9 8 5 2 ,9 0 9S te n o g r a p h e r s , t y p i s t s , a n d s e c r e t a r i e s . . . 49 58 51 52 57 61 73 71 66 73 75O th e r c l e r i c a l w o r k e r s ......................................... 3 ,3 5 9 3 ,3 4 9 3 ,2 9 7 3 ,2 2 7 3 ,1 4 1 3 ,0 5 6 3 ,0 5 5 3 ,0 3 9 3 ,0 7 9 2 ,9 1 2 2 ,8 3 4
S a le s w o r k e r s ..................................................................... 2 ,7 2 4 2 ,6 2 2 2 ,6 7 2 2 ,6 4 1 2 ,5 0 6 2 ,4 5 3 2 ,4 3 5 2 ,5 5 3 2 ,5 4 4 2 ,5 4 9 2 ,4 0 9R e t a i l t r a d e . .................................................................. 1 ,0 8 8 1 ,0 6 8 1 ,0 9 2 1 ,0 7 2 974 961 924 1 ,0 0 1 1 ,0 0 6 998 944O th e r s a le s w o r k e r s ............................................... 1 ,6 3 5 1 ,5 5 4 1 ,5 8 0 1 ,5 6 9 1 ,5 3 2 1 ,4 9 2 1 ,5 1 1 1 ,5 5 2 1 ,5 3 8 1 ,5 5 1 1 ,4 6 5
Blue-collar workers ............................................... 2 2 ,8 1 2 2 2 ,6 8 3 2 2 ,5 1 4 2 2 ,1 0 7 2 1 ,3 6 0 2 0 ,9 5 6 2 0 ,3 7 2 2 0 ,0 7 2 2 0 ,4 2 0 2 0 ,4 2 2 1 9 ,8 3 3
C ra fts m e n an d f o r e m e n ............................................... 9 ,6 9 6 9 ,5 6 0 9 ,3 3 4 8 ,9 4 7 8 ,7 3 1 8 ,6 7 5 8 ,4 4 5 8 ,4 0 1 8 ,3 3 2 8 ,3 4 1 8 ,2 3 7C a r p e n t e r s ..................................................................... 868 837 850 848 818 810 808 813 831 844 852C o n s t r u c t io n c r a ft s m e n , e x c e p t c a r p e n te r s 1 ,8 8 8 1 ,9 1 1 1 ,9 6 3 1 ,8 2 5 1 ,7 7 9 1 ,7 8 0 1 ,6 8 7 1 ,6 7 7 1 ,7 0 5 1 ,7 1 2 1 ,6 1 0M e c h a n ic s and r e p a ir m e n .................................... 2 ,6 0 2 2 ,5 1 5 2 ,3 7 7 2 ,3 2 0 2 ,2 0 6 2 ,1 8 7 2 ,1 3 1 2 ,1 0 8 2 ,0 0 0 2 ,0 2 8 2 ,0 5 7M eta l c r a ft s m e n , e x c e p t m e c h a n i c s ........... 1 ,2 4 2 1 ,2 4 3 1 ,1 6 5 1 ,1 0 1 1 ,0 8 1 1 ,0 6 8 1 ,0 3 5 1 ,0 1 4 1 ,0 8 2 1 ,0 7 1 1 ,0 4 2O th er c r a fts m e n an d k in d re d w o r k e r s . . . . 1 ,7 5 9 1 ,7 2 6 1 ,7 1 8 1 ,6 7 7 1 ,7 0 9 1 ,6 6 7 1 ,6 4 5 1 ,7 1 8 1 ,6 5 2 1 ,6 4 9 1 ,6 1 5F o r e m e n , n o t e ls e w h e r e c l a s s i f i e d ........... 1 ,3 3 7 1 ,3 3 1 1 ,2 6 1 1 ,1 7 6 1 ,1 3 8 1 ,1 6 3 1 ,1 3 9 1 ,0 7 1 1 ,0 6 2 1 ,0 3 7 1 ,0 6 1
O p e r a t i v e s .......................................................................... 9 ,6 8 7 9 ,7 0 6 9 ,7 5 6 9 ,5 8 1 9 ,2 3 7 8 ,9 7 4 8 ,6 2 3 8 ,4 0 1 8 ,6 1 7 8 ,5 5 8 8 ,2 1 5D r iv e r s an d d e l iv e r y m e n .................................... 2 ,4 6 9 2 ,4 4 9 2 ,5 1 2 2 ,4 5 3 2 ,4 5 6 2 ,3 9 2 2 ,3 0 1 2 ,3 0 4 2 ,3 3 6 2 ,3 4 1 2 ,2 1 7O th er o p e r a t i v e s ....................................................... 7 ,2 1 8 7 ,2 5 7 7 ,2 4 4 7 ,1 2 8 6 ,7 8 1 6 ,5 8 2 6 ,3 2 2 6 ,0 9 7 6 ,2 8 1 6 ,2 1 7 5 ,9 9 8
D u r a b le g o o d s m a n u f a c t u r in g .................... 3 ,3 8 5 3 ,4 3 8 3 ,4 3 9 3 ,2 8 5 3 ,0 1 3 2 ,9 1 2 2 ,7 1 0 2 ,5 1 8 2 ,6 1 3 2 ,6 2 5 2 ,4 4 1N o n d u ra b le g o o d s m a n u f a c t u r in g ........... 1 ,7 3 3 1 ,7 1 4 1 ,7 2 6 1 ,7 3 6 1 ,6 4 1 1 ,6 3 7 1 ,5 8 8 1 ,5 8 3 1 ,5 9 2 1 ,5 3 9 1 ,5 2 3O th e r i n d u s t r i e s .................................................. 2 ,1 0 0 2 ,1 0 5 2 ,0 7 9 2 ,1 0 7 2 ,1 2 7 2 , 0 3 3 2 ,0 2 4 1 ,9 9 6 2 ,0 7 6 2 ,0 5 3 2 ,0 3 4
N on fa rm l a b o r e r s ............................................................. 3 ,4 2 9 3 ,4 1 7 3 ,4 2 4 3 ,5 7 9 3 ,3 9 2 3 ,3 0 7 3 ,3 0 4 3 ,2 7 0 3 ,4 7 1 3 ,5 2 3 3 ,3 8 1C o n s t r u c t i o n ................................................................ 739 730 712 785 770 712 728 737 784 823 791M a n u f a c t u r in g ............................................................. 1 ,0 0 3 1 ,0 4 1 1 ,0 3 3 1 ,0 2 6 968 950 965 938 1 ,0 8 3 1 ,1 1 0 1 ,0 1 6O th er in d u s t r ie s ....................................................... 1 ,6 8 7 1 ,6 4 7 1 ,6 7 9 1 ,7 6 8 1 ,6 5 4 1 ,6 4 5 1 ,6 1 1 1 ,5 9 5 1 ,6 0 4 1 ,5 9 0 1 ,5 7 4
Service workers........................................................ 3 ,3 0 8 3 ,3 3 4 3 ,3 1 9 3 ,1 9 4 3 ,1 9 9 3 ,0 9 5 2 ,9 8 0 2 ,9 0 6 2 ,8 4 4 2 ,7 3 2 2 ,7 1 1
P r iv a te h o u s e h o ld w o r k e r s .................................... 35 33 43 40 46 4 4 46 44. 30 33 37
S e r v ic e w o r k e r s , e x c e p t p r iv a te h o u s e h o ld . . 3 ,2 7 3 3 ,3 0 1 3 ,2 7 6 3 ,1 5 4 3 ,1 5 3 3 ,0 5 1 2 ,9 3 4 2 ,8 6 2 2 ,8 1 4 2 ,6 9 9 2 ,6 7 4P r o t e c t iv e s e r v i c e w o r k e r s ............................... 902 911 840 832 844 804 765 742 734 723 715W a ite r s , c o o k s , a n d b a r te n d e r s .................... 539 539 572 541 524 504 47 9 47 8 469 45 6 45 3O th er s e r v i c e w o r k e r s .......................................... 1 ,8 3 2 1 ,8 5 3 1 ,8 6 4 1 ,7 8 1 1 ,7 8 5 1 ,7 4 3 1 ,6 9 0 1 ,6 4 2 1 ,6 1 1 1 ,5 2 0 1 ,5 0 6
Farm workers............................................................ 2 ,8 7 8 2 ,9 3 6 2 ,9 9 0 3 ,2 9 5 3 ,4 3 4 3 ,5 4 7 3 ,8 1 7 4 ,0 6 1 4 ,2 1 9 4 ,3 3 5 4 ,3 9 2
F a rm ers and farm m a n a g e r s .................................... 1 ,8 4 4 1 ,8 7 2 1 ,9 6 8 2 ,1 0 7 2 ,1 8 1 2 ,2 5 7 2 ,4 5 6 2 ,5 7 8 2 ,6 6 7 2 ,8 9 4 2 ,9 5 7
F arm la b o r e r s a n d f o r e m e n .................................... 1 ,0 3 4 1 ,0 6 6 1 ,0 2 2 1 ,1 8 8 1 ,2 5 3 1 ,2 9 0 1 ,3 6 1 1 ,4 8 3 1 ,5 5 2 1 ,4 4 1 1 ,4 3 5P a id w o r k e r s ............................................................... 857 876 840 960 1 ,0 1 6 1 ,0 5 1 1 ,0 7 7 1 ,1 6 1 1 ,2 1 7 1 ,0 9 6 1 ,0 9 1U n p a id fa m ily w o r k e r s ......................................... 177 189 182 228 237 239 284 322 335 345 344
Digitized for FRASER http://fraser.stlouisfed.org/ Federal Reserve Bank of St. Louis

31 HOUSEHOLD DATA
Table 3. Employed persons 16 years and over by occupation, annual averages, 19 58 -6 8Female
(In thousands)
O c c u p a t io n 1968 1967 1966 1965 1964 1963 1962 1961 1 960 1959 1958
T otal................................................................... 2 7 ,8 0 7 2 6 ,8 9 3 2 5 ,9 7 6 2 4 ,7 4 8 2 3 ,8 3 1 2 3 ,1 0 5 2 2 ,5 2 5 2 2 ,0 9 0 2 1 ,8 7 4 2 1 ,1 6 4 2 0 ,6 1 3
White-collar workers............................................... 1 6 ,4 3 5 1 5 ,7 0 5 1 4 ,9 7 4 1 4 ,1 0 6 1 3 ,3 8 1 1 2 ,8 9 0 1 2 ,6 2 6 1 2 ,2 7 2 1 2 ,0 9 9 1 1 ,6 1 9 1 1 ,3 5 2
P r o f e s s i o n a l and t e c h n i c a l .................................... 3 ,8 7 7 3 ,6 9 7 3 ,4 7 4 3 ,2 7 6 3 ,1 0 7 2 ,9 4 6 2 ,8 6 0 2 ,7 4 6 2 ,7 0 3 2 ,5 5 8 2 ,5 3 6M e d ic a l and o th e r h e a l t h .................................... 999 958 902 891 834 784 782 738 745 718 717T e a c h e r s , e x c e p t c o l l e g e .................................... 1 ,5 6 9 1 ,5 2 0 1 ,4 2 4 1 ,3 2 8 1 ,3 3 0 1 ,2 8 3 1 ,2 0 0 1 ,1 6 8 1 ,1 6 4 1 ,1 0 5 1 116O th er p r o f e s s io n a l and t e c h n i c a l ................. 1 ,3 0 8 1 ,2 2 1 1 ,1 4 8 1 ,0 5 7 943 879 8 78 8 40 794 735 703
M a n a g e rs , o f f i c i a l s , and p r o p r i e t o r s .............. 1 ,2 4 1 1 ,1 7 7 1 ,1 6 7 1 ,1 1 0 1 ,1 0 8 1 ,1 1 3 1 ,1 3 3 1 ,1 1 8 1 ,0 9 9 1 ,0 7 8 1 ,0 3 4S a la r ie d w o r k e r s ....................................................... 824 775 728 654 638 643 624 575 528 515 4 54S e lf -e m p lo y e d w o rk e rs in r e t a i l t r a d e . . . . 2 63 261 2 78 306 306 301 332 3 68 3 80 366 386S e lf - e m p lo y e d w o r k e r s , e x c e p t r e t a i l tra d e 155 142 161 150 164 169 177 175 191 197 194
C le r i c a l w o r k e r s ............................................................ 9 ,3 9 4 8 ,9 2 8 8 ,4 6 4 7 ,8 6 2 7 ,4 3 6 7 ,1 3 3 6 ,9 5 1 6 ,7 2 8 6 ,6 1 7 6 ,3 2 2 6 ,2 0 6S te n o g r a p h e r s , t y p i s t s , and s e c r e t a r i e s . . . 3 ,2 9 8 3 ,1 3 2 3 ,0 3 5 2 ,8 2 6 2 ,6 4 8 2 ,5 6 8 2 ,4 3 4 2 ,3 3 1 2 ,3 1 7 2 ,2 4 6 2 ,1 6 5O th er c l e r i c a l w o r k e r s ......................................... 6 ,0 9 6 5 ,7 9 5 5 ,4 2 9 5 ,0 3 6 4 ,7 8 8 4 ,5 6 5 4 ,5 1 7 4 ,3 9 7 4 ,3 0 0 4 ,0 7 6 4 ,0 4 1
S a le s w o r k e r s .................................................................... 1 ,9 2 3 1 ,9 0 4 1 ,8 6 9 1 ,8 5 8 1 ,7 3 0 1 ,6 9 8 1 ,6 8 2 1 ,6 8 0 1 ,6 8 0 1 ,6 6 1 1 ,5 7 6R e t a i l t r a d e . .................................................................. 1 ,7 0 0 1 ,6 9 3 1 ,6 5 4 1 ,6 5 8 1 ,5 3 0 1 ,5 0 5 1 ,4 8 7 1 ,4 6 8 1 ,4 8 1 1 ,4 7 2 1 ,4 1 4O th er s a le s w o r k e r s ............................................... 224 211 2 1 5 2 0 0 201 193 195 211 199 189 162
Blue-collar workers ............................................... 4 ,7 1 2 4 ,5 8 0 • 4 ,4 3 6 4 ,1 4 0 3 ,9 8 2 3 ,8 1 9 3 ,6 8 0 3 ,6 1 2 3 ,6 3 7 3 ,5 7 1 3 ,5 1 5
C ra ftsm e n an d fo r e m e n ............................................... 319 286 2 55 269 2 50 2 4 0 223 216 222 213 226C a r p e n t e r s .................................................................... 1 3 3 1 2 3 2 2 1 1 1C o n s t r u c t io n c r a ft s m e n , e x c e p t c a r p e n te r s 13 13 12 13 11 14 15 11 15 13 9M e c h a n ic s and r e p a ir m e n .................................... 26 25 13 15 18 16 12 12 14 15 17M eta l c r a ft s m e n , e x c e p t m e c h a n i c s ........... 19 17 14 11 10 11 11 7 8 9 7O th er c r a fts m e n and k in d re d w o r k e r s . . . . 153 132 129 139 121 116 103 108 109 89 94F o r e m e n , n o t e ls e w h e r e c l a s s i f i e d ........... 107 97 84 90 88 80 8 0 76 75 86 98
O p e r a t i v e s .......................................................................... 4 ,2 6 7 4 ,1 7 8 4 ,0 7 3 3 ,7 6 4 3 ,6 4 3 3 ,4 9 0 3 ,3 7 1 3 ,3 1 8 3 ,3 3 3 3 ,2 5 8 3 ,1 8 7D r iv e r s an d d e l i v e r y m e n .................................... 79 62 57 4 4 46 45 42 38 31 27 29O th er o p e r a t i v e s ....................................................... 4 ,1 8 8 4 ,1 1 6 4 ,0 1 6 3 ,7 2 0 3 ,5 9 8 3 ,4 4 5 3 ,3 2 9 3 ,2 8 0 3 ,3 0 2 3 ,2 3 1 3 ,1 5 8
D u ra b le g o o d s m a n u f a c t u r in g .................... 1 ,3 3 1 1 ,3 1 3 1 ,2 0 6 1 ,0 0 9 9 50 947 896 836 862 8 5 5 761N o n d u ra b le g o o d s m a n u f a c t u r in g ........... 2 ,1 1 7 2 ,0 4 7 2 ,0 4 8 1 ,9 5 6 1 ,9 2 5 1 ,8 1 9 1 ,7 1 9 1 ,7 2 2 1 ,7 4 9 1 ,6 7 2 1 ,6 7 8O th er i n d u s t r i e s ................................................. 7 40 756 762 755 723 679 714 722 691 704 719
N on farm l a b o r e r s ............................................................ 126 117 108 107 88 89 86 77 82 100 102C o n s t r u c t i o n ............................................................... 3 3 3 4 3 2 4 2 3 2 3M a n u f a c t u r in g ............................................................ 73 67 62 52 49 4 3 41 37 44 . 58 54O th er i n d u s t r i e s ....................................................... 50 4 9 43 51 36 44 41 38 35 4 0 4 5
Service workers........................................................ 6 ,0 7 2 5 ,9 9 2 5 ,8 9 3 5 ,7 4 2 5 ,6 9 4 5 ,5 7 6 5 ,4 0 3 5 ,3 5 5 5 ,1 7 9 4 ,9 6 5 4 ,7 7 6
P r iv a te h o u s e h o ld w o r k e r s .................................... 1 ,6 8 9 1 ,7 3 7 1 ,8 6 1 1 ,9 1 6 1 ,9 9 5 1 ,9 8 5 1 ,9 7 7 1 ,9 9 1 1 ,9 4 3 1 ,9 1 5 1 ,9 3 2
S e r v ic e w o r k e r s , e x c e p t p r iv a te h o u s e h o ld . . 4 ,3 8 3 4 ,2 5 5 4 ,0 3 2 3 ,8 2 6 3 ,6 9 9 3 ,5 9 1 3 ,4 2 6 3 ,3 6 4 3 ,2 3 6 3 ,0 5 0 2 ,8 4 4P r o t e c t iv e s e r v i c e w o r k e r s ............................... 50 4 4 44 4 1 4 5 4 0 39 32 31 33 24W a ite r s , c o o k s , a n d b a r te n d e r s ................... 1 ,5 4 1 1 ,5 2 4 1 ,4 0 9 1 ,3 8 2 1 ,3 6 0 1 ,3 3 5 1 ,2 6 4 1 ,2 0 8 1 ,1 8 4 1 ,1 5 2 1 ,0 6 3O th er s e r v i c e w o r k e r s .......................................... 2 ,7 9 2 2 ,6 8 8 2 ,5 7 9 2 ,4 0 3 2 ,2 9 4 2 ,2 1 6 2 ,1 2 3 2 ,1 2 4 2 ,0 2 1 1 ,8 6 5 1 ,7 5 7
Farm workers............................................................ 587 6 18 676 758 778 817 815 8 52 957 1 ,0 0 9 969
F a rm ers and farm m a n a g e r s .................................... 82 98 123 131 132 131 131 128 109 119 122
F arm la b o r e r s a n d fo r e m e n .................................... 505 5 20 553 627 646 686 684 724 848 8 90 847P a id w o r k e r s ............................................................... 144 172 170 187 199 229 204 217 254 2 50 242U n p a id fa m ily w o r k e r s ......................................... 361 348 3 83 4 4 0 447 457 4 8 0 507 594 6 4 0 605
Digitized for FRASER http://fraser.stlouisfed.org/ Federal Reserve Bank of St. Louis
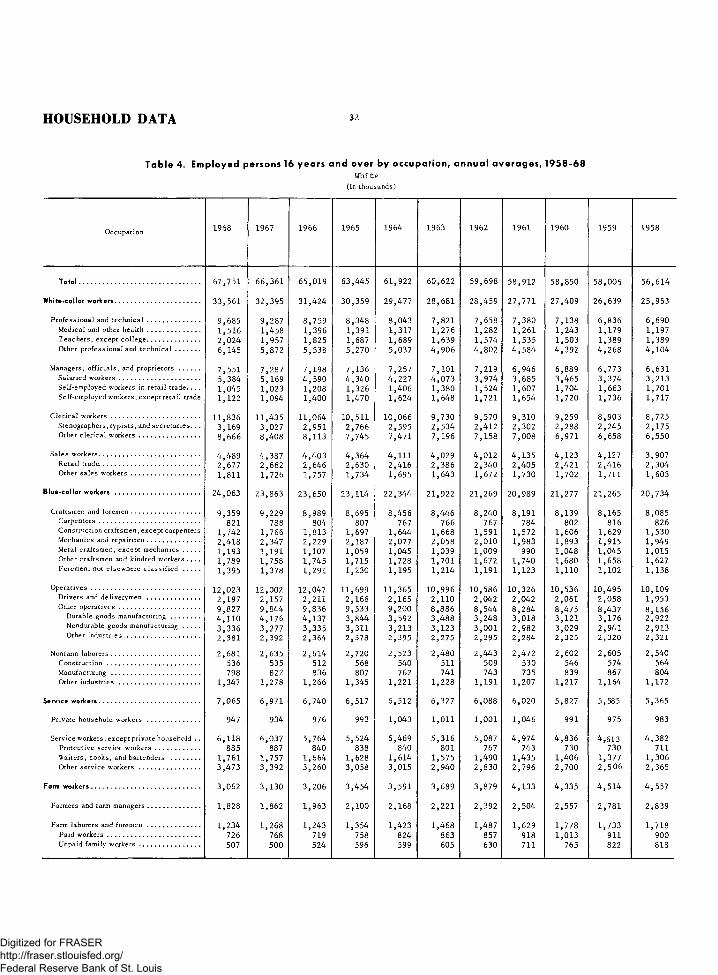
HOUSEHOLD DATA 3 2
White(In t h o u s a n d s )
Table 4. Employed persons 16 years and over by occupation, annual averages , 1958 -6 8
O c c u p a t io n 1968 1967 1966 1965 1964 1963 1962 1961 1960 1959 1958
T ota l................................................................... 6 7 ,7 5 1 6 6 ,3 6 1 6 5 ,0 1 9 6 3 ,4 4 5 6 1 ,9 2 2 6 0 ,6 2 2 5 9 ,6 9 8 5 8 ,9 1 2 5 8 ,8 5 0 5 8 ,0 0 5 5 6 ,6 1 4
White-collar workers............................................... 3 3 ,5 6 1 3 2 ,3 9 5 3 1 ,4 2 4 3 0 ,3 5 9 2 9 ,4 7 7 2 8 ,6 8 1 2 8 ,4 5 9 2 7 ,7 7 1 2 7 ,4 0 9 2 6 ,6 3 9 2 5 ,9 5 3
P r o f e s s i o n a l and t e c h n i c a l .................................... 9 ,6 8 5 9 ,2 8 7 8 ,7 5 9 8 ,3 4 8 8 ,0 4 3 7 ,8 2 1 7 ,6 5 8 7 ,3 8 0 7 ,1 3 8 6 ,8 3 6 6 ,6 9 0M e d ic a l and o th e r h e a l t h .................................... 1 ,5 1 6 1 ,4 5 8 1 ,3 9 6 1 ,3 9 1 1 ,3 1 7 1 ,2 7 6 1 ,2 8 2 1 ,2 6 1 1 ,2 4 3 1 ,1 7 9 1 ,1 9 7T e a c h e r s , e x c e p t c o l l e g e .................................... 2 ,0 2 4 1 ,9 5 7 1 ,8 2 5 1 ,6 8 7 1 ,6 8 9 1 ,6 3 9 1 ,5 7 4 1 ,5 3 5 1 ,5 0 3 1 ,3 8 9 1 ,3 8 9O th er p r o f e s s io n a l and t e c h n i c a l ................. 6 ,1 4 5 5 ,8 7 2 5 ,5 3 8 5 ,2 7 0 5 ,0 3 7 4 ,9 0 6 4 ,8 0 2 4 ,5 8 4 4 ,3 9 2 4 ,2 6 8 4 ,1 0 4
M a n a g e rs , o f f i c i a l s , and p r o p r ie to r s .............. 7 ,5 5 1 7 ,2 8 7 7 ,1 9 8 7 ,1 3 6 7 ,2 5 7 7 ,1 0 1 7 ,2 1 9 6 ,9 4 6 6 ,8 8 9 6 ,7 7 3 6 ,6 3 1S a la r ie d w o r k e r s ....................................................... 5 ,3 8 4 5 ,1 6 9 4 ,5 9 0 4 ,3 4 0 4 ,2 2 7 4 ,0 7 3 3 ,9 7 4 3 ,6 8 5 3 ,4 6 5 3 ,3 7 4 3 ,2 1 3S e lf - e m p lo y e d w o rk e rs in r e t a i l t r a d e . . . . 1 ,0 4 5 1 ,0 2 3 1 ,2 0 8 1 ,3 2 6 1 ,4 0 6 1 ,3 8 0 1 ,5 2 4 1 ,6 0 7 1 ,7 0 4 1 ,6 6 3 1 ,7 0 1S e lf - e m p lo y e d w o r k e r s , e x c e p t r e t a i l tra d e 1 ,1 2 2 1 ,0 9 4 1 ,4 0 0 1 ,4 7 0 1 ,6 2 4 1 ,6 4 8 1 ,7 2 1 1 ,6 5 4 1 ,7 2 0 1 ,7 3 6 1 ,7 1 7
C le r i c a l w o r k e r s ............................................................. 1 1 ,8 3 6 1 1 ,4 3 5 1 1 ,0 6 4 1 0 ,5 1 1 1 0 ,0 6 6 9 ,7 3 0 9 ,5 7 0 9 ,3 1 0 9 ,2 5 9 8 ,9 0 3 8 ,7 2 5S te n o g r a p h e r s , t y p i s t s , an d s e c r e t a r i e s . . . 3 ,1 6 9 3 ,0 2 7 2 ,9 5 1 2 ,7 6 6 2 ,5 9 5 2 ,5 3 4 2 ,4 1 2 2 ,3 0 2 2 ,2 8 8 2 ,2 4 5 2 ,1 7 5O th er c l e r i c a l w o r k e r s .......................................... 8 ,6 6 6 8 ,4 0 8 8 ,1 1 3 7 ,7 4 5 7 ,4 7 1 7 ,1 9 6 7 ,1 5 8 7 ,0 0 8 6 ,9 7 1 6 ,6 5 8 6 ,5 5 0
S a le s w o r k e r s ..................................................................... 4 ,4 8 9 4 ,3 8 7 4 ,4 0 3 4 ,3 6 4 4 ,1 1 1 4 ,0 2 9 4 ,0 1 2 4 ,1 3 5 4 ,1 2 3 4 ,1 2 7 3 ,9 0 7R e t a il t r a d e . .................................................................. 2 ,6 7 7 2 ,6 6 2 2 ,6 4 6 2 ,6 3 0 2 ,4 1 6 2 ,3 8 6 2 ,3 4 0 2 ,4 0 5 2 ,4 2 1 2 ,4 1 6 2 ,3 0 4O th er s a le s w o r k e r s ............................................... 1 ,8 1 1 1 ,7 2 6 1 ,7 5 7 1 ,7 3 4 1 ,6 9 5 1 ,6 4 3 1 ,6 7 2 1 ,7 3 0 1 ,7 0 2 1 ,7 1 1 1 ,6 0 3
Blue-collar workers ............................................... 2 4 ,0 6 3 2 3 ,8 6 3 2 3 ,6 5 0 2 3 ,1 1 4 2 2 ,3 4 4 2 1 ,9 2 2 2 1 ,2 6 9 2 0 ,9 8 9 2 1 ,2 7 7 2 1 ,2 6 5 2 0 ,7 3 4
C ra ftsm e n and fo r e m e n ............................................... 9 ,3 5 9 9 ,2 2 9 8 ,9 8 9 8 ,6 9 5 8 ,4 5 6 8 ,4 4 6 8 ,2 4 0 8 ,1 9 1 8 ,1 3 9 8 ,1 6 5 8 ,0 8 5C a r p e n t e r s ..................................................................... 821 788 804 807 767 766 767 784 802 816 826C o n s tr u c t io n c r a ft s m e n , e x c e p t c a r p e n te r s 1 ,7 4 2 1 ,7 6 6 1 ,8 1 3 1 ,6 9 7 1 ,6 4 4 1 ,6 6 8 1 ,5 9 1 1 ,5 7 2 1 ,6 0 6 1 ,6 2 9 1 ,5 3 0M e c h a n ic s and r e p a ir m e n .................................... 2 ,4 1 8 2 ,3 4 7 2 ,2 2 9 2 ,1 8 7 2 ,0 7 7 2 ,0 5 8 2 ,0 1 0 1 ,9 8 3 1 ,8 9 3 1 ,9 1 5 1 ,9 4 9M eta l c r a ft s m e n , e x c e p t m e c h a n i c s ........... 1 ,1 9 3 1 ,1 9 1 1 ,1 0 7 1 ,0 5 9 1 ,0 4 5 1 ,0 3 9 1 ,0 0 9 990 1 ,0 4 8 1 ,0 4 5 1 ,0 1 5O th er c r a fts m e n and k in d re d w o rk e rs . . . . 1 ,7 8 9 1 ,7 5 8 1 ,7 4 5 1 ,7 1 5 1 ,7 2 8 1 ,7 0 1 1 ,6 7 2 1 ,7 4 0 1 ,6 8 0 1 ,6 5 8 1 ,6 2 7F o r e m e n , n o t e ls e w h e r e c l a s s i f i e d ........... 1 ,3 9 5 1 ,3 7 8 1 ,2 9 1 1 ,2 3 0 1 ,1 9 5 1 ,2 1 4 1 ,1 9 1 1 ,1 2 3 1 ,1 1 0 1 ,1 0 2 1 ,1 3 8
O p e r a t i v e s .......................................................................... 1 2 ,0 2 3 1 2 ,0 0 2 1 2 ,0 4 7 1 1 ,6 9 9 1 1 ,3 6 5 1 0 ,9 9 6 1 0 ,5 8 6 1 0 ,3 2 6 1 0 ,5 3 6 1 0 ,4 9 5 1 0 ,1 0 9D r iv e r s and d e liv e r y m e n .................................... 2 ,1 9 7 2 ,1 5 7 2 ,2 1 1 2 ,1 6 6 2 ,1 6 5 2 ,1 1 0 2 ,0 4 2 2 ,0 4 2 2 ,0 6 1 2 ,0 5 8 1 ,9 5 3O th er o p e r a t i v e s ....................................................... 9 ,8 2 7 9 ,8 4 4 9 ,8 3 6 9 ,5 3 3 9 ,2 0 0 8 ,8 8 6 8 ,5 4 4 8 ,2 8 4 8 ,4 7 5 8 ,4 3 7 8 ,1 5 6
D u r a b le g o o d s m a n u f a c t u r in g .................... 4 ,1 1 0 4 ,1 7 6 4 ,1 3 7 3 ,8 4 4 3 ,5 9 2 3 ,4 8 8 3 ,2 4 8 3 ,0 1 8 3 ,1 2 1 3 ,1 7 6 2 ,9 2 2N o n d u ra b le g o o d s m a n u f a c t u r in g ........... 3 ,3 3 6 3 ,2 7 7 3 ,3 3 5 3 ,3 1 1 3 ,2 1 3 3 ,1 2 3 3 ,0 0 1 2 ,9 8 2 3 ,0 2 9 2 ,9 4 1 2 ,9 1 3O th er in d u s t r ie s .................................................. 2 ,3 8 1 2 ,3 9 2 2 ,3 6 4 2 ,3 7 8 2 ,3 9 5 2 ,2 7 5 2 ,2 9 5 2 ,2 8 4 2 ,3 2 5 2 ,3 2 0 2 ,3 2 1
N on farm l a b o r e r s ............................................................ 2 ,6 8 1 2 ,6 3 5 2 ,6 1 4 2 ,7 2 0 2 ,5 2 3 2 ,4 8 0 2 ,4 4 3 2 ,4 7 2 2 ,6 0 2 2 ,6 0 5 2 ,5 4 0C o n s t r u c t i o n ............................................................... 536 535 512 568 540 511 509 530 546 574 564M a n u fa c tu r in g ............................................................ 798 822 836 807 762 741 743 735 839 867 804O th er in d u s t r ie s ....................................................... 1 ,3 4 7 1 ,2 7 8 1 ,2 6 6 1 ,3 4 5 1 ,2 2 1 1 ,2 2 8 1 ,1 9 1 1 ,2 0 7 1 ,2 1 7 1 ,1 6 4 1 ,1 7 2
Service workers........................................................ 7 ,0 6 5 6 ,9 7 1 6 ,7 4 0 6 ,5 1 7 6 ,5 1 2 6 ,3 2 7 6 ,0 8 8 6 ,0 2 0 5 ,8 2 7 5 ,5 8 5 5 ,3 6 5
P r iv a te h o u s e h o ld w o rk e rs .................................... 947 934 976 993 1 ,0 4 3 1 ,0 1 1 1 ,0 0 1 1 ,0 4 6 991 975 983
S e r v ic e w o r k e r s , e x c e p t p r iv a te h o u s e h o ld . . 6 ,1 1 8 6 ,0 3 7 5 ,7 6 4 5 ,5 2 4 5 ,4 6 9 5 ,3 1 6 5 ,0 8 7 4 ,9 7 4 4 ,8 3 6 4 ,6 1 3 4 ,3 8 2P r o t e c t iv e s e r v ic e w o r k e r s .............................. 885 887 840 838 840 801 767 743 730 730 711W a ite r s , c o o k s , and b a r te n d e r s ................... 1 ,7 6 1 1 ,7 5 7 1 ,6 6 4 1 ,6 2 8 1 ,6 1 4 1 ,5 7 5 1 ,4 9 0 1 ,4 3 5 1 ,4 0 6 1 ,3 7 7 1 ,3 0 6O th er s e r v ic e w o rk e rs ......................................... 3 ,4 7 3 3 ,3 9 2 3 ,2 6 0 3 ,0 5 8 3 ,0 1 5 2 ,9 4 0 2 ,8 3 0 2 ,7 9 6 2 ,7 0 0 2 ,5 0 6 2 ,3 6 5
Farm workers............................................................ 3 ,0 6 2 3 ,1 3 0 3 ,2 0 6 3 ,4 5 4 3 ,5 9 1 3 ,6 8 9 3 ,8 7 9 4 ,1 3 3 4 ,3 3 5 4 ,5 1 4 4 ,5 5 7
F a rm ers and farm m a n a g e r s .................................... 1 ,8 2 8 1 ,8 6 2 1 ,9 6 3 2 ,1 0 0 2 ,1 6 8 2 ,2 2 1 2 ,3 9 2 2 ,5 0 4 2 ,5 5 7 2 ,7 8 1 2 ,8 3 9
Farm la b o r e r s a n d fo re m e n .................................... 1 ,2 3 4 1 ,2 6 8 1 ,2 4 3 1 ,3 5 4 1 ,4 2 3 1 ,4 6 8 1 ,4 8 7 1 ,6 2 9 1 ,7 7 8 1 ,7 3 3 1 ,7 1 8P a id w o r k e r s ............................................................... 726 768 719 758 824 863 857 918 1 ,0 1 3 911 900U n p a id fa m ily w o r k e r s ......................................... 507 500 524 596 599 605 630 711 765 822 818
Digitized for FRASER http://fraser.stlouisfed.org/ Federal Reserve Bank of St. Louis

33 HOUSEHOLD DATA
White - male(In th o u s a n d s )
Table 5. Employed persons 16 years and over by occupation, an nu a l averages, 1958-68
O c c u p a t io n 1968 1967 1966 1965 1964 1963 1962 1961 1 960 1959 1958
T otal................................................................... 4 3 ,4 1 1 4 2 ,8 3 4 4 2 ,3 3 0 4 1 ,8 4 4 4 1 ,1 1 4 4 0 ,4 2 8 4 0 ,0 1 6 3 9 ,5 8 8 3 9 ,7 5 5 3 9 ,4 9 3 3 8 ,5 9 2
White-collar workers............................................... 1 8 ,2 1 8 1 7 ,6 7 3 1 7 ,2 8 8 1 7 ,0 0 4 1 6 ,7 9 2 1 6 ,4 1 0 1 6 ,3 9 7 1 6 ,0 0 9 1 5 ,8 3 3 1 5 ,4 7 3 1 5 ,0 1 8
P r o f e s s i o n a l and t e c h n i c a l .................................... 6 ,1 3 8 5 ,8 9 5 5 ,5 7 0 5 ,3 3 9 5 ,1 8 5 5 ,1 0 1 4 ,9 8 8 4 ,7 8 7 4 ,6 0 6 4 ,4 4 0 4 ,2 9 5M e d ic a l and o th e r h e a l t h .................................... 596 575 565 561 539 538 540 559 534 502 512T e a c h e r s , e x c e p t c o l l e g e .................................... 617 596 547 504 4 9 5 4 8 8 479 447 4 27 3 71 355O th er p r o f e s s io n a l and t e c h n i c a l ................. 4 ,9 2 6 4 ,7 2 5 4 ,4 5 8 4 ,2 7 4 4 ,1 5 1 4 ,0 7 5 3 ,9 6 9 3 ,7 8 1 3 ,6 4 5 3 ,5 1 7 3 ,4 2 8
M a n a g e rs , o f f i c i a l s , and p r o p r i e t o r s .............. 6 ,3 6 4 6 ,1 5 8 6 ,0 8 1 6 ,0 7 5 6 ,1 9 6 6 ,0 3 3 6 ,1 3 1 5 ,8 7 4 5 ,8 4 2 5 ,7 4 8 5 ,6 4 3S a la r ie d w o r k e r s ....................................................... 4 ,5 8 9 4 ,4 1 8 3 ,8 8 5 3 ,7 0 4 3 ,6 0 4 3 ,4 4 6 3 ,3 6 7 3 ,1 2 8 2 ,9 5 2 2 ,8 7 2 2 ,7 7 0S e lf -e m p lo y e d w o rk e rs in r e t a i l t r a d e . . . . 8 00 781 948 1 ,0 4 1 1 ,1 2 3 1 ,1 0 1 1 ,2 1 3 1 ,2 6 1 1 ,3 5 2 1 ,3 2 8 1 ,3 4 4S e lf -e m p lo y e d w o r k e r s , e x c e p t r e ta i l tra d e 975 9 60 1 ,2 4 8 1 ,3 3 0 1 ,4 6 9 1 ,4 8 6 1 ,5 5 1 1 ,4 8 5 1 ,5 3 8 1 ,5 4 8 1 ,5 2 9
C le r i c a l w o r k e r s ............................................................ 3 ,0 7 5 3 ,0 6 7 3 ,0 4 2 3 ,0 2 2 2 ,9 7 2 2 ,8 9 5 2 ,8 9 9 2 ,8 5 2 2 ,9 0 1 2 ,7 8 2 2 ,7 1 0S te n o g r a p h e r s , t y p is t s , an d s e c r e t a r ie s . . . 44 52 46 48 53 54 69 65 61 67 71O th er c l e r i c a l w o r k e r s ......................................... 3 ,0 3 1 3 ,0 1 5 2 ,9 9 6 2 ,9 7 4 2 ,9 1 9 2 ,8 4 1 2 ,8 3 0 2 ,7 8 7 2 ,8 4 0 2 ,7 1 5 2 ,6 3 9
S a le s w o r k e r s .................................................................... 2 ,6 4 1 2 ,5 5 3 2 ,5 9 5 2 ,5 6 8 2 ,4 3 9 2 ,3 8 1 2 ,3 7 9 2 ,4 9 6 2 ,4 8 4 2 , 503 2 ,3 7 0R e t a il t r a d e . .................................................................. 1 ,0 4 3 1 ,0 2 8 1 ,0 4 3 1 ,0 2 7 937 923 897 9 70 971 972 921O th er s a le s w o r k e r s ............................................... 1 ,5 9 8 1 ,5 2 5 1 ,5 5 2 1 ,5 4 1 1 ,5 0 2 1 ,4 5 8 1 ,4 8 2 1 ,5 2 6 1 ,5 1 3 1 ,5 3 1 1 ,4 4 9
Blue-collar workers ............................................... 2 0 ,0 0 5 1 9 ,9 1 0 1 9 ,7 8 2 1 9 ,4 7 8 1 8 ,8 2 1 1 8 ,5 3 3 1 8 ,0 2 7 1 7 ,8 1 9 1 8 ,0 6 9 1 8 ,1 0 1 1 7 ,6 2 9
C ra ftsm e n and fo r e m e n ............................................... 9 ,0 6 7 8 ,9 6 4 8 ,7 5 8 8 ,4 4 9 8 ,2 2 4 8 ,2 2 1 8 ,0 3 5 7 ,9 9 2 7 ,9 3 1 7 ,9 6 4 7 ,8 7 6C a r p e n t e r s .................................................................... 819 786 801 806 765 763 765 782 801 815 825C o n s tr u c t io n c r a ft s m e n , e x c e p t c a r p e n te r s 1 ,7 3 0 1 ,7 5 5 1 ,8 0 2 1 ,6 8 5 1 ,6 3 3 1 ,6 5 5 1 ,5 7 7 1 ,5 6 1 1 ,5 9 1 1 ,6 1 7 1 ,5 2 2M e c h a n ic s and r e p a ir m e n .................................... 2 ,3 9 6 2 ,3 2 5 2 ,2 1 7 2 ,1 7 3 2 ,0 5 9 2 ,0 4 3 1 ,9 9 8 1 ,9 7 3 1 ,8 7 9 1 ,9 0 1 1 ,9 3 3M eta l c r a ft s m e n , e x c e p t m e c h a n i c s ........... 1 ,1 7 7 1 ,1 7 8 1 ,0 9 7 1 ,0 5 0 1 ,0 3 6 1 ,0 2 8 1 ,0 0 0 984 1 ,0 4 1 1 ,0 3 6 1 ,0 0 8O th er c r a fts m e n and k in d re d w o rk e rs . . . . 1 ,6 5 0 1 ,6 3 5 1 ,6 2 6 1 ,5 8 9 1 ,6 1 9 1 ,5 9 3 1 ,5 7 9 1 ,6 4 3 1 ,5 8 0 1 ,5 7 5 1 ,5 4 4F o r e m e n , n o t e ls e w h e r e c l a s s i f i e d ........... 1 ,2 9 4 1 ,2 8 7 1 ,2 1 5 1 ,1 4 6 1 ,1 1 2 1 ,1 3 9 1 ,1 1 6 1 ,0 5 0 1 ,0 3 9 1 ,0 2 0 1 ,0 4 4
O p e r a t i v e s .......................................................................... 8 ,3 6 1 8 ,4 0 0 8 ,4 9 6 8 ,3 9 3 8 ,1 4 5 7 ,9 0 1 7 ,6 1 2 7 ,4 1 3 7 ,6 0 1 7 ,6 1 2 7 ,2 9 3D r iv e r s and d e liv e r y m e n .................................... 2 ,1 2 3 2 ,1 0 2 2 ,1 5 9 2 ,1 2 4 2 ,1 2 4 2 ,0 6 7 2 ,0 0 3 2 ,0 0 6 2 ,0 3 3 2 ,0 3 3 1 ,9 2 6O th er o p e r a t i v e s ....................................................... 6 ,2 3 7 6 ,2 9 8 6 ,3 3 7 6 ,2 6 9 6 ,0 2 1 5 ,8 3 4 5 ,6 0 9 5 ,4 0 7 5 ,5 6 8 5 ,5 7 9 5 ,3 6 7
D u r a b le g o o d s m a n u fa c tu r in g ................... 2 ,9 2 7 2 ,9 8 8 3 ,0 3 1 2 ,9 1 9 2 ,7 0 6 2 ,6 0 7 2 ,4 2 4 2 ,2 4 7 2 ,3 2 2 2 ,3 7 9 2 ,2 1 3N o n d u ra b le g o o d s m a n u f a c t u r in g ........... 1 ,4 8 6 1 ,4 7 9 1 ,5 0 4 1 ,5 3 8 1 ,4 6 9 1 ,4 6 0 1 ,4 3 0 1 ,4 1 9 1 ,4 4 6 1 ,4 0 6 1 ,3 8 4O th er in d u s t r ie s ................................................. 1 ,8 2 4 1 ,8 3 1 1 ,8 0 2 1 ,8 1 2 1 ,8 4 6 1 ,7 6 7 1 ,7 5 5 1 ,7 4 1 1 ,8 0 0 1 ,7 9 4 1 ,7 7 0
N on farm la b o r e r s ............................................................ 2 ,5 7 7 2 ,5 4 6 2 ,5 2 8 2 636 2 ,4 5 2 2 ,4 1 1 2 ,3 8 0 2 ,4 1 4 2 ,5 3 7 2 ,5 2 5 2 ,4 6 0C o n s t r u c t i o n ............................................................... 534 533 509 564 537 509 507 528 544 573 561M a n u fa c tu r in g ............................................................ 736 768 782 763 720 703 707 703 8 00 816 758O th er in d u s t r ie s ....................................................... 1 ,3 0 6 1 ,2 4 5 1 ,2 3 7 1 ,3 0 9 1 ,1 9 5 1 ,1 9 9 1 ,1 6 6 1 ,1 8 3 1 ,1 9 3 1 ,1 3 6 1 ,1 4 1
Service workers........................................................ 2 ,6 2 7 2 ,6 3 9 2 ,6 0 4 2 ,5 0 0 2 ,5 0 9 2 ,4 0 2 2 ,3 1 9 2 ,2 7 0 2 ,2 1 7 2 ,1 5 5 2 ,1 1 6
P r iv a te h o u s e h o ld w o rk e rs .................................... 23 22 29 24 30 25 25 27 16 17 16
S e r v ic e w o r k e r s , e x c e p t p r iv a te h o u s e h o ld . . 2 ,6 0 4 2 ,6 1 7 2 ,5 7 5 2 ,4 7 6 2 ,4 7 9 2 ,3 7 7 2 ,2 9 4 2 ,2 4 3 2 ,2 0 1 2 ,1 3 8 2 ,1 0 0P r o t e c t iv e s e r v ic e w o r k e r s .............................. 8 40 848 801 799 8 0 0 765 733 714 701 700 6 90W a ite r s , c o o k s , an d b a r te n d e r s ................... 4 2 0 4 35 4 57 4 29 4 09 378 372 3 70 362 358 365O th er s e r v i c e w o r k e r s ......................................... 1 ,3 4 3 1 ,3 3 4 1 ,3 1 7 1 ,2 4 8 1 ,2 7 0 1 ,2 3 4 1 ,1 8 9 1 ,1 5 9 1 ,1 3 8 1 ,0 8 0 1 ,0 4 5
Farm workers............................................................ 2 ,5 6 1 2 ,6 1 4 2 ,6 5 5 2 ,8 6 2 2 ,9 9 2 3 ,0 8 1 3 ,2 7 2 3 ,4 9 1 3 ,6 3 7 3 ,7 6 2 3 ,8 2 6
F a rm ers and farm m a n a g e r s .................................... 1 ,7 5 3 1 ,7 7 1 1 ,8 5 7 1 ,9 8 4 2 ,0 5 5 2 ,1 1 2 2 ,2 7 8 2 ,3 9 6 2 ,4 6 6 2 ,6 7 7 2 ,7 3 3
F arm la b o r e r s a n d fo re m e n .................................... 8 08 8 43 798 878 937 969 994 1 ,0 9 5 1 ,1 7 1 1 ,0 8 5 1 ,0 9 3P a id w o r k e r s ............................................................... 642 669 629 678 735 764 769 825 898 807 802U n p a id fa m ily w o r k e r s ......................................... 166 174 169 2 00 202 205 225 2 7 0 273 278 291
3 7 1 - 7 9 3 0 - 69 3Digitized for FRASER http://fraser.stlouisfed.org/ Federal Reserve Bank of St. Louis

HOUSEHOLD DATA 3 4
White - female (In t h o u s a n d s )
Table 6. Employed persons 16 years and over by occupation, annua l averages, 19 58-6 8
O c c u p a t io n 1968 1967 1966 1965 1964 1963 1962 1961 1960 1959 1958
T ota l................................................................... 2 4 ,3 4 0 2 3 ,5 2 8 2 2 ,6 8 9 2 1 ,6 0 1 2 0 ,8 0 8 2 0 ,1 9 4 1 9 ,6 8 2 1 9 ,3 2 4 1 9 ,0 9 5 1 8 ,5 1 2 1 8 ,0 2 2
'White-collar workers............................................... 1 5 ,3 4 2 1 4 ,7 2 3 1 4 ,1 3 6 1 3 ,3 5 5 1 2 ,6 8 5 1 2 ,2 7 1 1 2 ,0 6 2 1 1 ,7 6 2 1 1 ,5 7 6 1 1 ,1 6 6 1 0 ,9 3 5
P r o f e s s i o n a l an d t e c h n i c a l .................................... 3 ,5 4 7 3 ,3 9 2 3 ,1 8 9 3 ,0 0 9 2 ,8 5 8 2 ,7 2 0 2 ,6 7 0 2 ,5 9 3 2 ,5 3 2 2 ,3 9 6 2 ,3 9 5M e d ic a l and o th e r , h e a l t h .................................... 921 883 831 830 778 738 742 702 709 677 685T e a c h e r s , e x c e p t c o l l e g e .................................... 1 ,4 0 7 1 ,3 6 2 1 ,2 7 8 1 ,1 8 3 1 ,1 9 4 1 ,1 5 1 1 ,0 9 5 1 ,0 8 8 1 ,0 7 6 1 ,0 1 8 1 ,0 3 4O th er p r o f e s s io n a l an d t e c h n i c a l ................. 1 ,2 1 9 1 ,1 4 8 1 ,0 8 0 996 886 831 833 803 747 701 676
M a n a g e rs , o f f i c i a l s , and p r o p r i e t o r s .............. 1 ,1 8 7 1 ,1 2 8 1 ,1 1 7 1 ,0 6 1 1 ,0 6 1 1 ,0 6 8 1 ,0 8 8 1 ,0 7 2 1 ,0 4 7 1 ,0 2 5 988S a la r ie d w o r k e r s ....................................................... 795 751 705 636 623 627 607 557 513 502 443S e lf - e m p lo y e d w o r k e r s in r e t a i l t r a d e . . . . 244 243 260 285 283 279 311 346 352 335 357S e l f - e m p lo y e d w o r k e r s , e x c e p t r e t a i l tra d e 148 135 152 140 155 162 170 169 182 188 188
C le r i c a l w o r k e r s ............................................................. 8 ,7 6 1 8 ,3 6 8 8 ,0 2 2 7 ,4 8 9 7 ,0 9 4 6 ,8 3 5 6 ,6 7 1 6 ,4 5 8 6 ,3 5 8 6 ,1 2 1 6 ,0 1 5S te n o g r a p h e r s , t y p i s t s , a n d s e c r e t a r i e s . . . 3 ,1 2 5 2 ,9 7 5 2 ,9 0 5 2 ,7 1 8 2 ,5 4 2 2 ,4 8 0 2 ,3 4 3 2 ,2 3 7 2 ,2 2 7 2 ,1 7 8 2 ,1 0 4O th er c l e r i c a l w o r k e r s .......................................... 5 ,6 3 5 5 ,3 9 3 5 ,1 1 7 4 ,7 7 1 4 ,5 5 2 4 ,3 5 5 4 ,3 2 8 4 ,2 2 1 4 ,1 3 1 3 ,9 4 3 3 ,9 1 1
S a le s w o r k e r s ..................................................................... 1 ,8 4 7 1 ,8 3 5 1 ,8 0 8 1 ,7 9 6 1 ,6 7 2 1 ,6 4 8 1 ,6 3 3 1 ,6 3 9 1 ,6 3 9 1 ,6 2 4 1 ,5 3 7R e t a i l t r a d e . .................................................................. 1 ,6 3 4 1 ,6 3 4 1 ,6 0 3 1 ,6 0 3 1 ,4 7 9 1 ,4 6 3 1 ,4 4 3 1 ,4 3 5 1 ,4 5 0 1 ,4 4 4 1 ,3 8 3O th er s a le s w o r k e r s ............................................... 213 201 205 193 193 185 190 204 189 180 154
Blue-collar w ork ers ............................................... 4 ,0 5 8 3 ,9 5 7 3 ,8 6 8 3 ,6 3 6 3 ,5 2 3 3 ,3 8 9 3 ,2 4 2 3 ,1 7 0 3 ,2 0 8 3 ,1 6 4 3 ,1 0 5
C r a fts m e n a n d fo r e m e n ............................................... 292 265 231 246 232 225 205 199 208 201 209C a r p e n t e r s ..................................................................... 1 3 3 1 2 3 2 2 1 1 1C o n s t r u c t io n c r a ft s m e n , e x c e p t c a r p e n te r s 12 12 11 12 11 13 14 11 15 12 8M e c h a n ic s and r e p a ir m e n .................................... 22 22 12 14 18 15 12 10 14 14 16M eta l c r a ft s m e n , e x c e p t m e c h a n i c s ........... 17 13 10 9 9 11 9 6 7 9 7O th er c r a fts m e n an d k in d re d w o r k e r s . . . . 139 123 119 126 109 108 93 97 100 83 83F o r e m e n , n o t e ls e w h e r e c l a s s i f i e d ........... 101 92 76 84 83 75 73 73 71 82 94
O p e r a t i v e s .......................................................................... 3 ,6 6 2 3 ,6 0 2 3 ,5 5 1 3 ,3 0 6 3 ,2 2 0 3 ,0 9 5 2 ,9 7 4 2 ,9 1 3 2 ,9 3 5 2 ,8 8 3 2 ,8 1 6D r iv e r s an d d e l i v e r y m e n .................................... 74 55 52 42 41 43 39 36 28 25 27O th er o p e r a t i v e s ....................................................... 3 ,5 8 9 3 ,5 4 6 3 ,4 9 9 3 ,2 6 4 3 ,1 7 9 3 ,0 5 2 2 ,9 3 5 2 ,8 7 7 2 ,9 0 7 2 ,8 5 8 2 ,7 8 9
D u r a b le g o o d s m a n u f a c t u r in g .................... 1 ,1 8 2 1 ,1 8 7 1 ,1 0 6 925 886 881 824 771 799 797 709N o n d u r a b le g o o d s m a n u f a c t u r in g ........... 1 ,8 5 0 1 ,7 9 8 1 ,8 3 1 1 ,7 7 3 1 ,7 4 4 1 ,6 6 3 1 ,5 7 1 1 ,5 6 3 1 ,5 8 3 1 ,5 3 5 1 ,5 2 9O th er i n d u s t r i e s .................................................. 557 561 562 566 549 508 540 543 525 526 551
N on fa rm la b o r e r s ............................................................. 104 90 86 84 71 69 63 58 65 80 80C o n s t r u c t i o n ............................................................... 2 2 3 4 3 2 2 2 2 1 3M a n u f a c t u r in g ............................................................. 61 55 54 44 42 38 36 32 39 51 46O th er i n d u s t r i e s ....................................................... 40 34 29 36 26 29 25 24 24 28 31
Service workers........................................................ 4 ,4 3 9 4 ,3 3 2 4 ,1 3 6 4 ,0 1 7 4 ,0 0 3 3 ,9 2 5 3 ,7 6 9 3 ,7 5 0 3 ,6 1 0 3 ,4 3 3 3 ,2 4 9
P r iv a te h o u s e h o ld w o r k e r s .................................... 925 912 947 969 1 ,0 1 3 986 976 1 ,0 1 9 975 958 967
S e r v ic e w o r k e r s , e x c e p t p r iv a te h o u s e h o ld . . 3 ,5 1 4 3 ,4 2 0 3 ,1 8 9 3 ,0 4 8 2 ,9 9 0 2 ,9 3 9 2 ,7 9 3 2 ,7 3 1 2 ,6 3 5 2 ,4 7 5 2 ,2 8 2P r o t e c t iv e s e r v i c e w o r k e r s .............................. 45 39 39 39 40 36 34 29 29 30 21W a ite r s , c o o k s , a n d b a r te n d e r s .................... 1 ,3 4 0 1 ,3 2 4 1 ,2 0 7 1 ,1 9 9 1 ,2 0 5 1 ,1 9 7 1 ,1 1 8 1 ,0 6 5 1 ,0 4 4 1 ,0 1 9 941O th er s e r v i c e w o r k e r s .......................................... 2 ,1 3 0 2 ,0 5 8 1 ,9 4 3 1 ,8 1 0 1 ,7 4 5 1 ,7 0 6 1 ,6 4 1 1 ,6 3 7 1 ,5 6 2 1 ,4 2 6 1 ,3 2 0
Farm workers............................................................ 502 517 551 592 599 608 607 642 698 752 731
F a rm ers a n d farm m a n a g e r s .................................... 76 92 106 116 113 109 114 108 91 104 106
F arm la b o r e r s a n d f o r e m e n .................................... 42 6 42 5 445 476 48 6 499 493 534 607 648 625P a id w o r k e r s ............................................................... 84 99 90 80 89 99 88 93 115 104 98U n p a id fa m ily w o r k e r s .......................................... 342 327 355 396 397 40 0 40 5 44 1 49 2 544 527
Digitized for FRASER http://fraser.stlouisfed.org/ Federal Reserve Bank of St. Louis
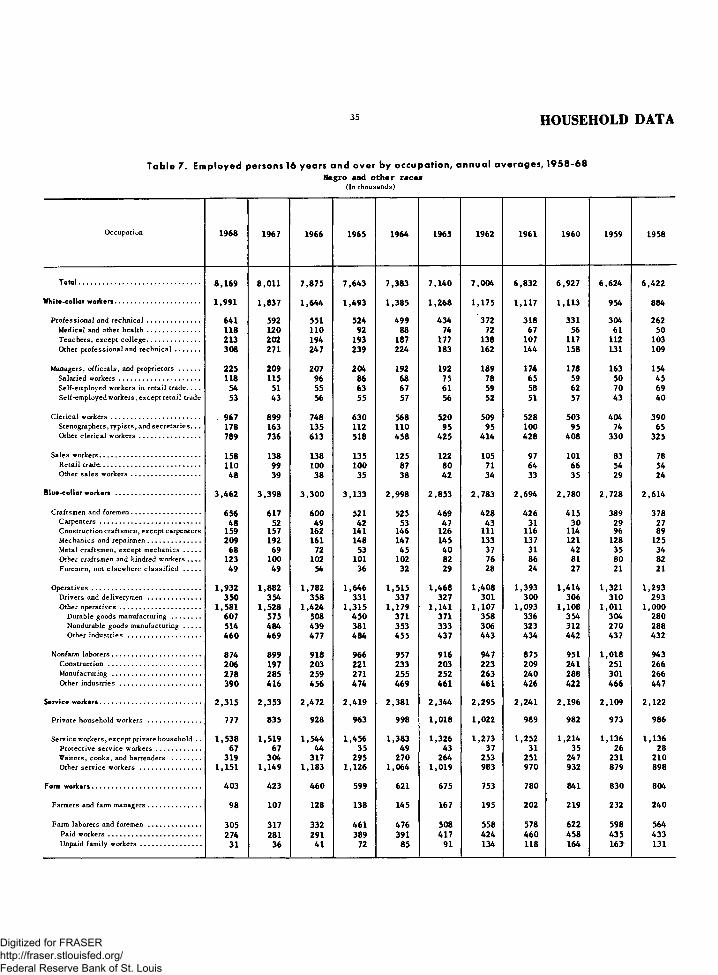
35 HOUSEHOLD DATA
Negro and other races(In t h o u s a n d s )
Table 7. Employed persons 16 years and over by occupation, annual averages, 19 5 8 -6 8
O c c u p a t io n 1968 1967 1966 1965 1964 1963 1962 1961 1 960 1959 1958
T ota l................................................................... 8 ,1 6 9 8 ,0 1 1 7 ,8 7 5 7 ,6 4 3 7 ,3 8 3 7 ,1 4 0 7 ,0 0 4 6 ,8 3 2 6 ,9 2 7 6 ,6 2 4 6 ,4 2 2
White-collar workers............................................... 1 ,9 9 1 1 ,8 3 7 1 ,6 4 4 1 ,4 9 3 1 ,3 8 5 1 ,2 6 8 1 ,1 7 5 1 ,1 1 7 1 ,1 1 3 954 884
P r o f e s s i o n a l and t e c h n i c a l .................................... 6 41 592 551 5 24 4 9 9 4 3 4 372 318 331 304 262M e d ic a l and o th e r h e a l t h .................................... 118 120 110 92 88 74 72 67 56 61 50T e a c h e r s , e x c e p t c o l l e g e .................................... 213 202 194 193 187 177 138 107 117 112 103O th er p r o f e s s io n a l and t e c h n i c a l ................. 3 08 271 2 47 239 224 183 162 144 158 131 109
M a n a g e rs , o f f i c i a l s , and p r o p r i e t o r s .............. 225 2 09 207 2 04 192 192 189 174 178 163 154S a la r ie d w o r k e r s ....................................................... 118 115 96 86 68 75 78 65 59 50 45S e lf - e m p lo y e d w o r k e r s in r e t a i l t r a d e . . . . 54 51 55 63 67 61 59 58 62 70 69S e lf - e m p lo y e d w o r k e r s , e x c e p t r e t a i l tra d e 53 43 56 55 57 56 52 51 57 43 4 0
C le r i c a l w o r k e r s ............................................................. 967 899 748 6 3 0 568 5 20 509 528 503 4 04 3 9 0S te n o g r a p h e r s , t y p i s t s , a n d s e c r e t a r i e s . . . 178 163 135 112 110 95 95 100 95 74 65O th er c l e r i c a l w o r k e r s .......................................... 789 736 613 518 4 58 4 25 4 14 4 28 4 08 3 30 3 25
S a le s w o r k e r s ..................................................................... 158 138 138 135 125 122 105 97 101 83 78R e t a i l t r a d e . .................................................................. 110 99 100 100 87 8 0 71 64 66 54 54O th er s a le s w o r k e r s ............................................... 4 8 39 38 35 38 4 2 34 33 35 29 24
Blue-collar workers ............................................... 3 ,4 6 2 3 ,3 9 8 3 ,3 0 0 3 ,1 3 3 2 ,9 9 8 2 ,8 5 3 2 ,7 8 3 2 ,6 9 4 2 ,7 8 0 2 ,7 2 8 2 ,6 1 4
C ra fts m e n a n d fo r e m e n ............................................... 6 56 6 17 6 0 0 521 525 4 6 9 4 2 8 4 26 4 1 5 389 3 78C a r p e n t e r s .................................................................... 4 8 52 49 4 2 53 4 7 43 31 30 29 27C o n s tr u c t io n c r a ft s m e n , e x c e p t c a r p e n te r s 159 157 162 141 146 126 111 116 114 96 89M e c h a n ic s and r e p a ir m e n .................................... 209 192 161 148 147 145 133 137 121 128 125M eta l c r a ft s m e n , e x c e p t m e c h a n i c s ........... 68 69 72 53 4 5 4 0 37 31 4 2 35 34O th er c r a fts m e n and k in d re d w o r k e r s . . . . 123 100 102 101 102 82 76 86 81 80 82F o r e m e n , n o t e ls e w h e r e c l a s s i f i e d ........... 49 49 54 36 32 29 28 24 27 21 21
O p e r a t i v e s .......................................................................... 1 ,9 3 2 1 ,8 8 2 1 ,7 8 2 1 ,6 4 6 1 ,5 1 5 1 ,4 6 8 1 ,4 0 8 1 ,3 9 3 1 ,4 1 4 1 ,3 2 1 1 ,2 9 3D r iv e r s an d d e l i v e r y m e n .................................... 3 5 0 354 3 58 331 337 327 301 3 00 306 3 10 293O th er o p e r a t i v e s ....................................................... 1 ,5 8 1 1 ,5 2 8 1 ,4 2 4 1 ,3 1 5 1 ,1 7 9 1 ,1 4 1 1 ,1 0 7 1 ,0 9 3 1 ,1 0 8 1 ,0 1 1 1 ,0 0 0
D u r a b le g o o d s m a n u f a c t u r in g .................... 607 5 75 508 4 5 0 371 371 3 58 336 354 304 2 8 0N o n d u ra b le g o o d s m a n u f a c t u r in g ........... 514 4 8 4 4 39 381 353 333 306 323 312 2 7 0 2 88O th er i n d u s t r i e s .................................................. 4 6 0 4 6 9 4 77 4 8 4 4 5 5 4 37 4 43 4 34 4 42 437 432
N on fa rm la b o r e r s ............................................................ 874 8 99 9 18 966 957 9 16 947 8 75 951 1 ,0 1 8 943C o n s t r u c t i o n ............................................................... 206 197 2 03 221 233 203 223 2 09 241 251 266M a n u f a c t u r in g ............................................................ 2 78 285 259 271 2 55 252 263 2 4 0 288 301 266O th er i n d u s t r i e s ....................................................... 3 9 0 4 16 456 4 74 4 69 461 4 61 4 26 4 22 4 6 6 4 47
Service workers........................................................ 2 ,3 1 5 2 ,3 5 3 2 ,4 7 2 2 ,4 1 9 2 ,3 8 1 2 ,3 4 4 2 ,2 9 5 2 ,2 4 1 2 ,1 9 6 2 ,1 0 9 2 ,1 2 2
P r iv a te h o u s e h o ld w o r k e r s .................................... 777 835 9 28 963 998 1 ,0 1 8 1 ,0 2 2 989 982 9 73 9 86
S e r v ic e w o r k e r s , e x c e p t p r iv a te h o u s e h o ld . . 1 ,5 3 8 1 ,5 1 9 1 ,5 4 4 1 ,4 5 6 1 ,3 8 3 1 ,3 2 6 1 ,2 7 3 1 ,2 5 2 1 ,2 1 4 1 ,1 3 6 1 ,1 3 6P r o t e c t iv e s e r v i c e w o r k e r s .............................. 67 67 4 4 3 5 4 9 43 37 31 35 26 28W a ite r s , c o o k s , a n d b a r te n d e r s .................... 3 19 304 317 2 95 2 70 2 64 253 251 247 231 2 10O th er s e r v i c e w o r k e r s ......................................... 1 ,1 5 1 1 ,1 4 9 1 ,1 8 3 1 ,1 2 6 1 ,0 6 4 1 ,0 1 9 983 9 7 0 9 32 879 8 98
Farm workers............................................................ 4 0 3 423 4 6 0 599 621 675 753 780 841 8 30 804
F a rm ers an d farm m a n a g e r s .................................... 9 8 107 128 138 145 167 195 2 02 219 232 2 40
F arm la b o r e r s a n d f o r e m e n .................................... 3 05 317 332 4 61 476 508 558 578 622 598 564P a id w o r k e r s ............................................................... 2 74 281 291 3 89 391 4 1 7 4 24 4 6 0 4 58 4 35 4 33U n p a id fa m ily w o r k e r s ......................................... 31 36 41 72 85 91 134 118 164 1 6 * 131
Digitized for FRASER http://fraser.stlouisfed.org/ Federal Reserve Bank of St. Louis

HOUSEHOLD DATA 36
Negro and other races - m^le (In t h o u s a n d s )
Table 8. Employed persons 16 years and over by occupation, annual averages, 19 5 8 -6 8
O c c u p a t io n 1968 1967 1966 1965 1964 1963 1962 1961 1960 1959 1958
T ota l................................................................... 4 ,7 0 2 4 ,6 4 6 4 ,5 8 8 4 ,4 9 6 4 ,3 5 9 4 ,2 2 9 4 ,1 6 0 4 ,0 6 7 4 ,1 4 8 3 ,9 7 2 3 ,8 3 1
'White-collar workers............................................... 896 856 806 742 688 649 611 608 590 501 467
P r o f e s s i o n a l and t e c h n i c a l .................................... 310 288 266 257 250 208 182 165 160 142 121M e d ic a l and o th e r h e a l t h .................................... 40 46 39 31 32 28 32 31 20 20 18T e a c h e r s , e x c e p t c o l l e g e .................................... 51 44 48 48 51 45 33 27 29 25 21O th er p r o f e s s i o n a l an d t e c h n i c a l ................. 220 198 179 178 167 135 117 107 111 97 82
M a n a g e r s , o f f i c i a l s , and p r o p r i e t o r s .............. 170 160 157 155 145 147 144 128 126 110 108S a la r ie d w o r k e r s ....................................................... 89 92 73 68 53 59 61 47 44 37 34S e lf - e m p lo y e d w o r k e r s in r e t a i l t r a d e . . . . 36 33 37 42 44 39 38 36 34 39 40S e l f - e m p lo y e d w o r k e r s , e x c e p t r e t a i l tra d e 46 36 47 45 48 49 45 45 48 34 34
C le r i c a l w o r k e r s ............................................................. 334 339 306 257 226 222 229 258 244 203 199S te n o g r a p h e r s , t y p i s t s , a n d s e c r e t a r i e s . . . 5 6 5 4 4 7 4 6 5 6 4O th er c l e r i c a l w o r k e r s ......................................... 328 334 301 253 222 215 225 252 239 197 195
S a le s w o r k e r s ..................................................................... 82 69 77 73 67 72 56 57 60 46 39R e t a i l t r a d e . .................................................................. 45 40 49 45 37 38 27 31 35 26 23O th e r s a le s w o r k e r s ............................................... 37 29 28 28 30 34 29 26 25 20 16
Blue-collar workers ............................................... 2 ,8 0 8 2 ,7 7 4 2 ,7 3 2 2 ,6 2 9 2 ,5 3 9 2 ,4 2 3 2 ,3 4 5 2 ,2 5 3 2 ,3 5 1 2 ,3 2 1 2 ,2 0 4
C ra ftsm e n a n d fo r e m e n ............................................... 629 596 576 498 507 45 4 41 0 40 9 40 1 377 361C a r p e n t e r s ..................................................................... 48 51 49 42 53 47 43 31 30 29 27C o n s tr u c t io n c r a ft s m e n , e x c e p t c a r p e n te r s 157 156 161 140 146 125 110 116 114 95 88M e c h a n ic s and r e p a ir m e n .................................... 206 190 160 147 147 144 133 135 121 127 124M eta l c r a ft s m e n , e x c e p t m e c h a n i c s ........... 65 65 68 51 45 40 35 30 41 35 34O th er c r a fts m e n and k in d re d w o r k e r s . . . . 110 91 92 88 90 74 66 75 72 74 71F o r e m e n , n o t e ls e w h e r e c l a s s i f i e d ........... 43 44 46 30 26 24 23 21 23 17 17
O p e r a t i v e s .......................................................................... 1 ,3 2 7 1 ,3 0 6 1 ,2 6 0 1 ,1 8 8 1 ,0 9 2 1 ,0 7 3 1 ,0 1 1 988 1 ,0 1 6 946 922D r iv e r s and d e l i v e r y m e n .................................... 346 347 353 329 332 325 298 298 303 308 291O th er o p e r a t i v e s ....................................................... 981 959 907 859 760 748 713 690 713 638 631
D u r a b le g o o d s m a n u f a c t u r in g .................... 458 45 0 408 366 307 305 286 271 291 246 228N o n d u ra b le g o o d s m a n u f a c t u r in g ........... 247 235 222 198 172 177 158 164 146 133 139O th er in d u s t r ie s .................................................. 276 274 277 295 281 266 269 255 276 259 264
N on fa rm l a b o r e r s ............................................................. 852 872 896 943 940 896 924 856 934 998 921C o n s t r u c t i o n ............................................................... 205 197 203 221 233 203 221 209 240 250 230M a n u f a c t u r in g ............................................................. 267 273 251 263 248 247 258 235 283 294 258O th er in d u s t r ie s ....................................................... 380 402 442 459 459 446 44 5 412 411 454 433
Service workers........................................................ 682 695 715 694 690 693 661 636 627 577 595
P r iv a te h o u s e h o ld w o r k e r s .................................... 13 11 14 16 16 19 21 17 14 16 21
S e r v ic e w o r k e r s , e x c e p t p r iv a te h o u s e h o ld . . 669 684 701 678 674 674 640 619 613 561 574P r o t e c t iv e s e r v i c e w o r k e r s ............................... 61 63 39 33 44 39 32 28 33 23 25W a ite rs , c o o k s , and b a r te n d e r s .................... 119 104 115 112 115 126 107 108 107 98 88O th er s e r v i c e w o r k e r s ......................................... 489 519 547 533 515 509 501 483 473 44 0 46 1
Farm workers............................................................ 317 322 335 433 442 46 6 545 570 582 573 566
F a rm ers an d farm m a n a g e r s .................................... 92 100 111 123 126 145 178 182 201 217 224
F arm la b o r e r s a n d fo re m e n .................................... 225 222 224 310 316 321 367 388 381 356 342P a id w o r k e r s ............................................................... 214 207 211 282 281 287 308 336 319 289 289U n p a id fa m ily w o r k e r s .......................................... 11 15 13 28 35 34 59 52 62 67 53
Digitized for FRASER http://fraser.stlouisfed.org/ Federal Reserve Bank of St. Louis

37 HOUSEHOLD DATA
Negro and other races - female(In th o u s a n d s )
Table 9. Employed persons 16 years and over by occupation, an nual-averages, 19 58 -6 8
O c c u p a t io n 1968 1967 1966 1965 1964 1963 1962 1961 1 960 1959 1958
T ota l................................................................... 3 ,4 6 7 3 ,3 6 6 3 ,2 8 7 3 ,1 4 7 3 ,0 2 4 2 ,9 1 1 2 ,8 4 4 2 ,7 6 5 2 ,7 7 9 2 ,6 5 2 2 ,5 9 1
'White-collar workers............................................... 1 ,0 9 4 983 838 751 697 619 564 509 523 4 53 417
P r o f e s s i o n a l and t e c h n i c a l .................................... 3 3 0 305 2 85 267 249 226 190 153 171 162 141M e d ic a l and o th e r h e a l t h .................................... 79 75 71 61 56 46 4 0 36 36 41 32T e a c h e r s , e x c e p t c o l l e g e .................................... 163 158 146 145 136 132 105 8 0 88 87 82O th er p r o f e s s io n a l and t e c h n i c a l ................. 9 0 73 68 61 57 4 8 4 5 37 4 7 34 27
M a n a g e rs , o f f i c i a l s , and p r o p r i e t o r s .............. 55 49 50 49 47 45 4 5 46 52 53 4 6S a la r ie d w o r k e r s ....................................................... 29 24 23 18 15 16 17 18 15 13 11S e lf -e m p lo y e d w o rk e rs in r e t a i l t r a d e . . . . 19 18 18 21 23 22 21 22 28 31 29S e lf - e m p lo y e d w o r k e r s , e x c e p t r e t a i l tra d e 7 7 9 10 9 7 7 6 9 9 6
C le r i c a l w o r k e r s .............. ............................................. 633 560 4 42 373 342 2 98 2 8 0 2 70 259 201 191S te n o g r a p h e r s , t y p i s t s , an d s e c r e t a r ie s . . . 173 157 130 108 106 88 91 94 9 0 68 61O th er c l e r i c a l w o r k e r s ......................................... 4 6 0 4 02 312 265 236 2 10 189 176 169 133 130
S a le s w o r k e r s .................................................................... 76 69 61 62 58 50 4 9 4 0 41 37 39R e t a il t r a d e . .................................................................. 66 59 51 55 50 42 44 33 31 28 31O th er s a le s w o r k e r s ............................................... 11 10 10 7 8 8 5 7 10 9 8
Blue-collar workers ............................................... 654 625 568 504 4 59 4 3 0 4 38 4 41 4 29 4 07 4 1 0
C ra ftsm e n and fo r e m e n ............................................... 27 21 24 23 18 15 18 17 14 12 17C a r p e n t e r s .................................................................... . . — - - - - . . — - - - - - - - - —C o n s t r u c t io n c r a ft s m e n , e x c e p t c a r p e n te r s 2 1 1 1 — 1 1 . . . . 1 1M e c h a n ic s and r e p a ir m e n .................................... 3 3 1 1 — 1 - - 2 — 1 1M eta l c r a ft s m e n , e x c e p t m e c h a n i c s ........... 2 4 4 2 — — 2 1 1 — - -O th er c r a fts m e n and k in d re d w o rk e rs . . . . 14 9 10 13 12 8 10 11 9 6 11F o r e m e n , n o t e ls e w h e r e c l a s s i f i e d ........... 6 5 8 6 6 5 5 3 4 4 4
O p e r a t i v e s .......................................................................... 605 577 522 4 58 423 3 95 397 4 05 398 375 371D r iv e r s and d e l i v e r y m e n .................................... 5 7 5 2 5 2 3 2 3 2 2O th er o p e r a t i v e s ....................................................... 6 0 0 570 517 4 56 4 1 9 3 93 394 403 3 95 373 369
D u r a b le g o o d s m a n u f a c t u r in g .................... 149 126 100 84 64 66 72 65 63 58 52N o n d u ra b le g o o d s m a n u f a c t u r in g ........... 267 249 217 183 181 156 148 159 166 137 149O th er in d u s t r ie s .................................................. 184 195 2 00 189 174 171 174 179 166 178 168
N on fa rm l a b o r e r s ............................................................ 22 27 22 23 17 2 0 23 19 17 2 0 22C o n s t r u c t i o n ............................................................... — 1 . . — — - - 2 - - 1 1 —
M a n u fa c tu r in g ...................... ..................................... 11 12 8 8 7 5 5 5 5 7 8O th er in d u s t r ie s ....................................................... 10 15 14 15 10 15 16 14 11 12 14
Service workers........................................................ 1 ,6 3 4 1 ,6 5 9 1 ,7 5 7 1 ,7 2 5 1 ,6 9 1 1 ,6 5 1 1 ,6 3 4 1 ,6 0 5 1 ,5 6 9 1 ,5 3 2 1 ,5 2 7
P r iv a te h o u s e h o ld w o rk e rs .................................... 765 824 914 947 982 999 1 ,0 0 1 972 968 957 965
S e r v ic e w o r k e r s , e x c e p t p r iv a te h o u s e h o ld . . 8 69 835 843 778 709 652 633 633 601 575 562P r o t e c t iv e s e r v i c e w o r k e r s .............................. 6 5 5 2 5 4 5 3 2 3 3W a ite r s , c o o k s , a n d b a r te n d e r s ................... 201 2 0 0 202 183 155 138 146 143 140 133 122O th er s e r v i c e w o r k e r s ........................................ 663 6 3 0 636 593 549 5 10 4 82 4 87 459 4 39 4 37
Farm workers............................................................ 85 102 125 166 179 2 09 208 2 10 259 257 238
F a rm ers and farm m a n a g e r s .................................... 6 7 17 15 19 22 17 20 18 15 16
F arm la b o r e r s a n d fo re m e n .................................... 79 95 108 151 1 60 187 191 190 241 242 222P a id w o r k e r s ............................................................... 60 73 8 0 107 110 130 116 124 139 146 144U n p a id fa m ily w o r k e r s ......................................... 19 21 28 44 50 57 75 66 102 96 78
Digitized for FRASER http://fraser.stlouisfed.org/ Federal Reserve Bank of St. Louis

LABOR FORCE AND EMPLOYMENT1957 to date
(Seasonally adjusted)MILLIONS MILLIONS
Chart 1.
MAJOR UNEMPLOYMENT INDICATORS1953 to date
1953 1955 1957 1959 1961 1963 19651966 1967 1968 1969 1970
Quarterly averages Monthly data
* Series revised beginning 1963 to reflect whether unemployed persons sought full-or part-time jobs
38Digitized for FRASER http://fraser.stlouisfed.org/ Federal Reserve Bank of St. Louis

Chart 3.PAYROLL EMPLOYMENT IN GOODS-PRODUCING INDUSTRIES
1957 to date(Seasonally adjusted)
1967 1968 1969 1970Monthly data
‘ Includes self-employed and unpaid family workers.
Note: Data for 2 most recent months are preliminary.
PAYROLL EMPLOYMENT IN SERVICE-PRODUCING INDUSTRIES1957 to date
m il l io n s (Seasonally adjusted) M|LL|0NS
39Digitized for FRASER http://fraser.stlouisfed.org/ Federal Reserve Bank of St. Louis

UNEMPLOYMENT RATES BY AGE AND SEXChart 5 .
1953 to date
1953 1955 1957 1959 1961 1963 1965 1966 1967 1968 1969 1970Quarterly averages Monthly data
Chart 6.
TOTAL UNEMPLOYMENT BY DURATION1953 to date
MILLIONS
DURATION OF UNEMPLOYMENT AS A PERCENT OF THE TOTAL
1953 1955 1957 1959 1961 1963 1965 1966
PERCENT 80
60
40
20
01967 1968 1969 1970
A
V '-A
l l l l l l l l l l l l l l l l l l l l l l l l l l l l l l l l l l l l l l l l l l l l
Quarterly averages Monthly !data
40Digitized for FRASER http://fraser.stlouisfed.org/ Federal Reserve Bank of St. Louis

HOURS OF WORK IN TOTAL PRIVATE NONAGRICULTURAL ESTABLISHMENTS, MANUFACTURING, AND TRADE
OVERTIME HOURS IN MANUFACTURING
1 1 1 1 I I I I 1111 111111111111 1111111111 1 1 111 111 111111
1957 1959 1961 1963 1965 1966 1967 1968 1969 1970Quarterly averages Monthly data
*lncludes eating and drinking establishments, not previously available.
Note: Data for 2 most recent months are preliminary.
Chart 8.
AVERAGE WEEKLY EARNINGS IN TOTAL PRIVATE NONAGRICULTURAL ESTABLISHMENTS, MANUFACTURING, AND TRADE
d o l l a r s 1957 to date
1967 1968 1969 1970Monthly data
* Includes eating and drinking establishments, not previously available.
Note: Data for 2 most recent months are preliminary.
41Digitized for FRASER http://fraser.stlouisfed.org/ Federal Reserve Bank of St. Louis

C hart 9.
EMPLOYMENT IN NONFARM OCCUPATIONS1958 to date
(Seasonally adjusted quarterly averages)MILLIONS WHITE-COLLAR WORKERS MILLIONS
MILLIONS BLUE-COLLAR AND SERVICE WORKERS MILLIONS
42Digitized for FRASER http://fraser.stlouisfed.org/ Federal Reserve Bank of St. Louis

Chart 10. PERSONS AT WORK IN NONAGRICULTURAL INDUSTRIES BY FULL- AND PART-TIME STATUS
1957 to date(Seasonally adjusted quarterly averages)
MILLIONS FULL-TIME SCHEDULES MILLIONS
MILLIONS PART-TIME SCHEDULES MILLIONS
1957 1958 1959 1960 1961 1962 1963 1964 1965 1966 1967 1968 1969 1970
43Digitized for FRASER http://fraser.stlouisfed.org/ Federal Reserve Bank of St. Louis
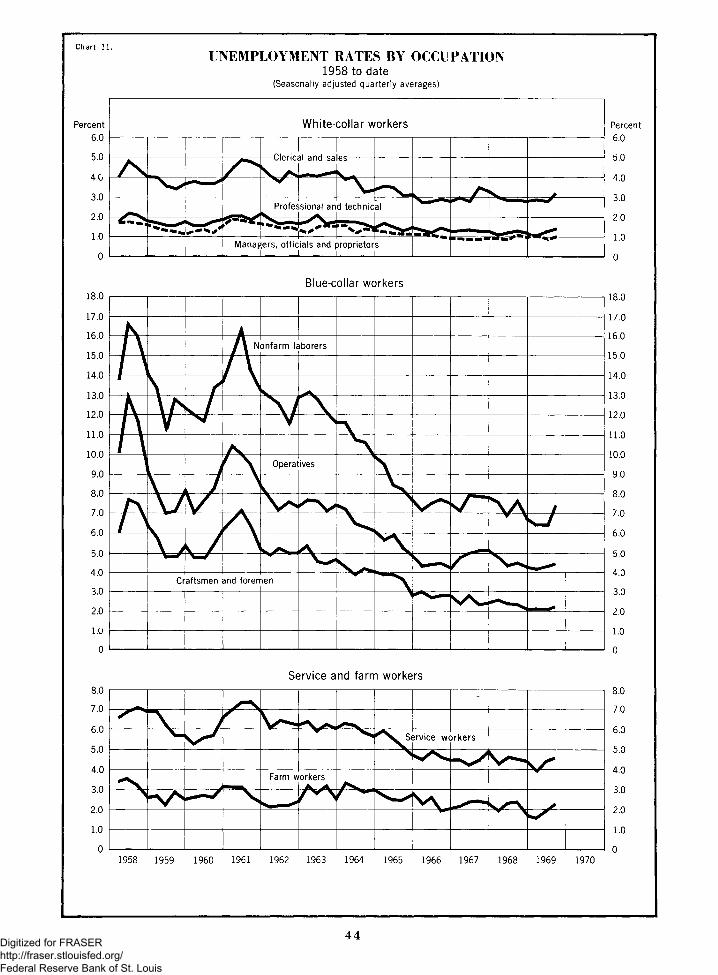
Chart 11.
UNEMPLOYMENT RATES BY OCCUPATION1958 to date
(Seasonally adjusted quarterly averages)
Percent6.0
5 . 0
4.0
3.0
2.0
1.0
0
Blue-collar workers18.0
17.0
16.0
15.0
14.0
13.0
12.0
11.0
10.0
9.0
8.0
7.0
6.0
5.0
4.0
3.0
2.0
1.0
0
1958 1959 1960 1961 1962 1963 1964 1965 1966 1967 1968 1969 1970
8.0
7.0
6.0
5.0
4.0
3.0
2.0
1.0
0
44Digitized for FRASER http://fraser.stlouisfed.org/ Federal Reserve Bank of St. Louis

UNEMPLOYMENT RATES BY COLOR1957 to date
Chart 12.
RATIO OF NEGRO TO WHITE UNEMPLOYMENT RATE
1957 1958 1959 1960 1961 1962 1963 1964 1965 1966 1967 1968 1969 1970
45Digitized for FRASER http://fraser.stlouisfed.org/ Federal Reserve Bank of St. Louis
For Facts a n d A n a ly s is in a R a p id ly C h a n g in g Labor W o rld . . .
AnnualSubscription % ^ O O Domestic
$ 1 1 2 5 Foreign
(Make check or money order payable to Superintendent of Documents)
The Unique and Authoritative
Monthly Labor Review■ The only periodical that covers the entire labor fie ld , the REVIEW keeps you up to date on ■ Prices and the cost of living ■ Employment and Manpower ■ Productivity■ Technological Changes ■ Conciliation and Arbitration■ Wages and Salaries ■ Industrial Safety ■ Trade Union Developments ■ Contract Clause Analysis ■ Industrial Relations ■ Labor Conditions Abroad.
■ Each 120-page issue contains special articles from leading experts ■ over 30 pages of BLS statistics ■ Plus the largest book review department of any journal of its type.
■ Accurate ■ Useful■ Complete ■ Objective
Subscribe Now to the MONTHLY LABOR REVIEWOrder from
Superintendent of Documents or Any regional office of the Government Printing Office Bureau of Labor StatisticsWashington, D .C . 20402 U.S. Department of Labor
Digitized for FRASER http://fraser.stlouisfed.org/ Federal Reserve Bank of St. Louis

MONTHLY TABLES
Employment Status Pa9eA- 1: Employment status of the noninstitutional population, 1929 to date .................................. 49A- 2: Employment status of the noninstitutional population 16 years and over by sex, 1947
to date .................................................................................................................................... ^0A- 3: Employment status of the noninstitutional population by sex, age, and color ................... 51A- 4: Labor force by sex, age, and color........................................................................................... 53A- 5: Employment status of persons 16-21 years of age in the noninstitutional population by
color and sex........................................................................................................................... 55A- 6 : Employment status of the noninstitutional population 16 years and over by sex, age,
and c o lo r ............................................................................................................................... 53A- 7: Full- and part-time status of the civilian labor force by age and sex..................................... 56
Characteristics of the UnemployedA- 8 : Unemployed persons by sex and age ....................................................................................... 57A- 9: Unemployed persons by marital status, sex, age, and color.................................................. 57A-10: Unemployed persons by occupation of last job and sex ........................................................ 58A-11: Unemployed persons by industry of last job and sex.............................................................. 58A-12: Unemployed persons by reason for unemployment, sex, age, and color................................ 59A-13: Unemployed persons by reason for unemployment, duration, sex, and age......................... 59A-14: Unemployed persons by duration of unemployment.............................................................. 60A-15: Unemployed persons by duration, sex, age, color, and marital status.................................... 60A-16: Unemployed persons by duration, occupation, and industry of last job ............................. 61
Characteristics of the EmployedA-17: Employed persons by sex and age ........................................................................................... 61A-18: Employed persons by occupation group, sex, and age ..................................................... 62A-19: Employed persons by major occupation group, sex, and color ............................................ 63A-20: Employed persons by class of worker, sex, and age................................................................ 64A-21: Employed persons with a job but not at work by reason, pay status, and sex ..................... 65A-22: Persons at work by type of industry and hours of work......................................................... 65A-23: Persons at work 1-34 hours by usual status and reason working part-time........................... 66A-24: Nonagricultural workers by industry and full- or part-time status....................................... 66A-25: Persons at work in nonagricultural industries by full- or part-time status, sex,age,color,
and marital status ................................................................................................................ 67A-26: Persons at work in nonfarm occupations by full- or part-time status and sex ..................... 69
Characteristics of 14 and 15 Year-oldsA-27: Employment status of 14-15 year-olds by sex and co lo r........................................................ 71A-28: Employed 14-15 year-olds by sex, class of worker, and major occupation group............. 71
Seasonally Adjusted Employment and Unemployment DataA-29: Employment status of the noninstitutional population by sex and age, seasonally
adjusted ................................................................................................................................. 72A-30: Full- and part-time status of the civilian labor force by sex and age, seasonally adjusted . . 72A-31: Employment status by color, sex, and age, seasonally adjusted............................................. 7 3A-32: Major unemployment indicators, seasonally adjusted............................................................ 74A-33: Unemployed persons by duration of unemployment, seasonally adjusted ......................... 7 5A-34: Rates of unemployment by age and sex, seasonally adjusted.................................................. 75A-35: Employed persons by age and sex, seasonally adjusted ....................................................... 7 5A-36: Employed persons by major occupation group, seasonally adjusted ................................... 7 5
HOUSEHOLD DATA
47
Digitized for FRASER http://fraser.stlouisfed.org/ Federal Reserve Bank of St. Louis

MONTHLY TABLES (Continued)
ESTABLISHMENT DATA
Employment-NationalB-1: Employees on nonagricultural payrolls, by industry division, 1919 to d a te ........................... 77B-2: Employees on nonagricultural payrolls, by industry................................................................... 78B-3: Women employees on nonagricultural payrolls, by industry1B-4: Indexes of employment on nonagricultural payrolls, by industry division, 1919 to date,
monthly data seasonally adjusted ............................................................................................ 86B-5: Employees on nonagricultural payrolls, by industry, seasonally adjusted............................... 87B-6 : Production workers in industrial and construction activities, seasonally adjusted.................. 88
Employment—State and AreaB-7: Employees on nonagricultural payrolls for States and selected areas, by industry
division........................................................................................................................................ 90
Hours and Earnings—NationalC-1: Gross hours and earnings of production or nonsupervisory workers on private
nonagricultural payrolls, 1947 to date...................................................................................... 101C-2: Gross hours and earnings of production or nonsupervisory workers on private
nonagricultural payrolls, by industry......................................... 1 0 2C-3: Employment, hours, and indexes of earnings in the Executive Branch of the Federal
Government................................................................................................................................. 114C-4: Average hourly earnings excluding overtime of production workers on manufacturing
payrolls, by industry.................................................................................................................. 114C-5: Gross and spendable average weekly earnings of production or nonsupervisory workers on
private nonagricultural payrolls, in current and 1957-59 dollars.......................................... 115C-6 : Indexes of aggregate weekly man-hours and payrolls in industrial and construction
activities ...................................................................................................................................... 115C-7: Average weekly hours of production or nonsupervisory workers on private nonagri
cultural payrolls, seasonally adjusted ...................................................................................... 116C-8 : Indexes of aggregate weekly man-hours in industrial and construction activities,
seasonal ly adjusted....................................................................................................................... 117C-9: Output per man-hour, hourly compensation, and unit labor costs, private economy,
seasonally adjusted .................................................................................................................... 118
Hours and Earnings—State and AreaC-10: Gross hours and earnings of production workers on manufacturing payrolls, by State and
selected areas ............................................................................................................................. 119
Labor Turnover—NationalD-1: Labor turnover rates in manufacturing, 1958 to date................................................................. 123D-2: Labor turnover rates, by industry................................................................................................. 124D-3: Labor turnover rates in manufacturing, 1958 to date, seasonally adjusted.............................. 129
Labor Turnover—State and AreaD-4: Labor turnover rates in manufacturing for selected States and areas .................... 130
UNEMPLOYMENT INSURANCE DATA
E-1: Insured unemployment under State programs.......................................................•.................. 1 3 3E-2: Insured unemployment in 150 major labor areas....................................................................... 134
^Quarterly data included in February, May, August, and November issues.
48
Digitized for FRASER http://fraser.stlouisfed.org/ Federal Reserve Bank of St. Louis
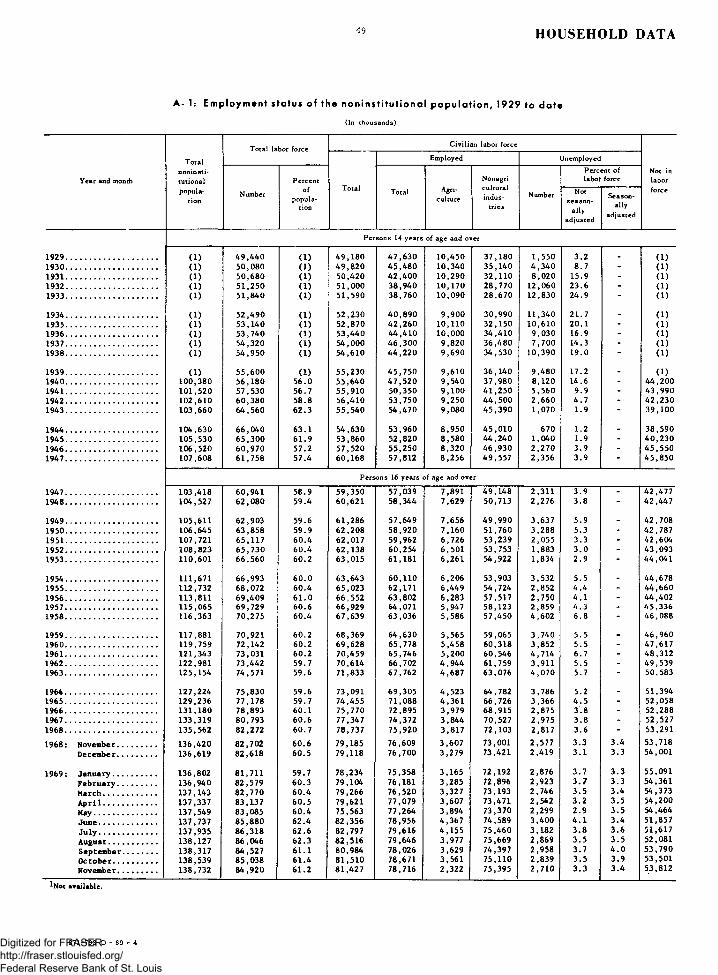
4 9 HOUSEHOLD DATA
A- 1: Empl oy ment status of the nonins t i t u t i ona l p o p u l a t i o n , 1929 to d a t e
(In t h o u s a n d s )
Year and month
Totalnoninstitutionalpopula
tion
Total labor force Civilian labor force
Total
Employed Unemployed
Number
Percentof
population
Total Agriculture
Nonagri-culturalindus
triesNumber
Percent of labor force
Not in labor
Notseason
allyadjusted
Seasonally
adjusted
force
Persons 14 years of age and over
1 9 2 9 ................................................... ( 1 ) 4 9 ,4 4 0 ( 1 ) 4 9 ,1 8 0 4 7 ,6 3 0 1 0 ,4 5 0 3 7 ,1 8 0 1 ,5 5 0 3 .2 _ ( 1 )1 9 3 0 ................................................... ( 1 ) 5 0 ,0 8 0 ( 1 ) 4 9 ,8 2 0 4 5 ,4 8 0 1 0 ,3 4 0 3 5 ,1 4 0 4 ,3 4 0 8 .7 - ( 1 )1 9 3 1 ................................................... ( 1 ) 5 0 ,6 8 0 ( 1 ) 5 0 ,4 2 0 4 2 ,4 0 0 1 0 ,2 9 0 3 2 ,1 1 0 8 ,0 2 0 1 5 .9 - ( 1 )1 9 3 2 ................................................... ( 1 ) 5 1 ,2 5 0 ( 1 ) 5 1 ,0 0 0 3 8 ,9 4 0 1 0 ,1 7 0 2 8 ,7 7 0 1 2 ,0 6 0 2 3 .6 - ( 1 )1 9 3 3 ................................................... ( 1 ) 5 1 ,8 4 0 ( 1 ) 5 1 ,5 9 0 3 8 ,7 6 0 1 0 ,0 9 0 2 8 ,6 7 0 1 2 ,8 3 0 2 4 .9 - ( 1 )
1 9 3 4 ................................................... ( 1 ) 5 2 ,4 9 0 ( 1 ) 5 2 ,2 3 0 4 0 ,8 9 0 9 ,9 0 0 3 0 ,9 9 0 1 1 ,3 4 0 2 1 .7 _ ( 1 )1 9 3 5 ................................................... ( 1 ) 5 3 ,1 4 0 ( 1 ) 5 2 ,8 7 0 4 2 ,2 6 0 1 0 ,1 1 0 3 2 ,1 5 0 1 0 ,6 1 0 2 0 .1 - ( 1 )1 9 3 6 ................................................... ( 1 ) 5 3 ,7 4 0 ( 1 ) 5 3 ,4 4 0 4 4 ,4 1 0 1 0 ,0 0 0 3 4 ,4 1 0 9 ,0 3 0 1 6 .9 - ( 1 )1 9 3 7 ................................................... ( 1 ) 5 4 ,3 2 0 ( 1 ) 5 4 ,0 0 0 4 6 ,3 0 0 9 ,8 2 0 3 6 ,4 8 0 7 ,7 0 0 1 4 .3 - ( 1 )1 9 3 8 ................................................... ( 1 ) 5 4 ,9 5 0 ( 1 ) 5 4 ,6 1 0 4 4 ,2 2 0 9 ,6 9 0 3 4 ,5 3 0 1 0 ,3 9 0 1 9 .0 ( 1 )
1 9 3 9 ................................................... ( 1 ) 5 5 ,6 0 0 ( 1 ) 5 5 ,2 3 0 4 5 ,7 5 0 9 ,6 1 0 3 6 ,1 4 0 9 ,4 8 0 1 7 .2 - ( 1 )1 9 4 0 ................................................... 1 0 0 ,3 8 0 5 6 ,1 8 0 5 6 .0 5 5 ,6 4 0 4 7 ,5 2 0 9 ,5 4 0 3 7 ,9 8 0 8 ,1 2 0 1 4 .6 - 4 4 ,2 0 01 9 4 1 ................................................... 1 0 1 ,5 2 0 5 7 ,5 3 0 5 6 .7 5 5 ,9 1 0 5 0 ,3 5 0 9 ,1 0 0 4 1 ,2 5 0 5 ,5 6 0 9 .9 - 4 3 ,9 9 01 9 4 2 ................................................... 1 0 2 ,6 1 0 6 0 ,3 8 0 5 8 .8 5 6 ,4 1 0 5 3 ,7 5 0 9 ,2 5 0 4 4 ,5 0 0 2 ,6 6 0 4 .7 - 4 2 ,2 3 01 9 4 3 ................................................... 1 0 3 ,6 6 0 6 4 ,5 6 0 6 2 .3 5 5 ,5 4 0 5 4 ,4 7 0 9 ,0 8 0 4 5 ,3 9 0 1 ,0 7 0 1 .9 - 3 9 ,1 0 0
1 9 4 4 ................................................... 1 0 4 ,6 3 0 6 6 ,0 4 0 6 3 .1 5 4 ,6 3 0 5 3 ,9 6 0 8 ,9 5 0 4 5 ,0 1 0 670 1 .2 _ 3 8 ,5 9 01 9 4 5 ................................................... 1 0 5 ,5 3 0 6 5 ,3 0 0 6 1 .9 5 3 ,8 6 0 5 2 ,8 2 0 8 ,5 8 0 4 4 ,2 4 0 1 ,0 4 0 1 .9 - 4 0 ,2 3 01 9 4 6 ................................................... 1 0 6 ,5 2 0 6 0 ,9 7 0 5 7 .2 5 7 ,5 2 0 5 5 ,2 5 0 8 ,3 2 0 4 6 ,9 3 0 2 ,2 7 0 3 .9 - 4 5 ,5 5 01 9 4 7 ................................................... 1 0 7 ,6 0 8 6 1 ,7 5 8 5 7 .4 6 0 ,1 6 8 5 7 ,8 1 2 8 ,2 5 6 4 9 ,5 5 7 2 ,3 5 6 3 .9 4 5 ,8 5 0
Persons 16 years of age and over
1 9 4 7 ................................................... 1 0 3 ,4 1 8 6 0 ,9 4 1 5 8 .9 5 9 ,3 5 0 5 7 ,0 3 9 7 ,8 9 1 4 9 ,1 4 8 2 ,3 1 1 3 .9 - 4 2 ,4 7 71 9 4 8 ................................................... 1 0 4 ,5 2 7 6 2 ,0 8 0 5 9 .4 6 0 ,6 2 1 5 8 ,3 4 4 7 ,6 2 9 5 0 ,7 1 3 2 ,2 7 6 3 .8 - 4 2 ,4 4 7
1 9 4 9 ................................................... 1 0 5 ,6 1 1 6 2 ,9 0 3 5 9 .6 6 1 ,2 8 6 5 7 ,6 4 9 7 ,6 5 6 4 9 ,9 9 0 3 ,6 3 7 5 .9 - 4 2 ,7 0 81 9 5 0 ................................................... 1 0 6 ,6 4 5 6 3 ,8 5 8 5 9 .9 6 2 ,2 0 8 5 8 ,9 2 0 7 ,1 6 0 5 1 ,7 6 0 3 ,2 8 8 5 .3 - 4 2 ,7 8 71 9 5 1 ................................................... 1 0 7 ,7 2 1 6 5 ,1 1 7 6 0 .4 6 2 ,0 1 7 5 9 ,9 6 2 6 ,7 2 6 5 3 ,2 3 9 2 ,0 5 5 3 .3 - 4 2 ,6 0 41 9 5 2 ................ .................................. 1 0 8 ,8 2 3 6 5 ,7 3 0 6 0 .4 6 2 ,1 3 8 6 0 ,2 5 4 6 ,5 0 1 5 3 ,7 5 3 1 ,8 8 3 3 .0 - 4 3 ,0 9 31 9 5 3 ................................................... 1 1 0 ,6 0 1 6 6 ,5 6 0 6 0 .2 6 3 ,0 1 5 6 1 ,1 8 1 6 ,2 6 1 5 4 ,9 2 2 1 ,8 3 4 2 .9 - 4 4 ,0 4 1
1 9 5 4 ................................................... 1 1 1 ,6 7 1 6 6 ,9 9 3 6 0 .0 6 3 ,6 4 3 6 0 ,1 1 0 6 ,2 0 6 5 3 ,9 0 3 3 ,5 3 2 5 . 5 _ 4 4 ,6 7 81 9 5 5 ................................................... 1 1 2 ,7 3 2 6 8 ,0 7 2 6 0 .4 6 5 ,0 2 3 6 2 ,1 7 1 6 ,4 4 9 5 4 ,7 2 4 2 ,8 5 2 4 .4 - 4 4 ,6 6 01 9 5 6 ................................................... 1 1 3 ,8 1 1 6 9 ,4 0 9 6 1 .0 6 6 ,5 5 2 6 3 ,8 0 2 6 ,2 8 3 5 7 ,5 1 7 2 ,7 5 0 4 .1 - 4 4 ,4 0 21 9 5 7 ................................................... 1 1 5 ,0 6 5 6 9 ,7 2 9 6 0 .6 6 6 ,9 2 9 6 4 ,0 7 1 5 ,9 4 7 5 8 ,1 2 3 2 ,8 5 9 4 .3 - 4 5 ,3 3 61 9 5 8 ................................................... 1 1 6 ,3 6 3 7 0 ,2 7 5 6 0 .4 6 7 ,6 3 9 6 3 ,0 3 6 5 ,5 8 6 5 7 ,4 5 0 4 ,6 0 2 6 .8 - 4 6 ,0 8 8
1 9 5 9 ................................................... 1 1 7 ,8 8 1 7 0 ,9 2 1 6 0 .2 6 8 ,3 6 9 6 4 ,6 3 0 5 ,5 6 5 5 9 ,0 6 5 3 ,7 4 0 5 . 5 . 4 6 ,9 6 01 9 6 0 ................................................... 1 1 9 ,7 5 9 7 2 ,1 4 2 6 0 .2 6 9 ,6 2 8 6 5 ,7 7 8 5 ,4 5 8 6 0 ,3 1 8 3 ,8 5 2 5 . 5 - 4 7 ,6 1 71 9 6 1 ................................................... 1 2 1 ,3 4 3 7 3 ,0 3 1 6 0 .2 7 0 ,4 5 9 6 5 ,7 4 6 5 ,2 0 0 6 0 ,5 4 6 4 ,7 1 4 6 .7 - 4 8 ,3 1 21 9 6 2 ................................................... 1 2 2 ,9 8 1 7 3 ,4 4 2 5 9 .7 7 0 ,6 1 4 6 6 ,7 0 2 4 ,9 4 4 6 1 ,7 5 9 3 ,9 1 1 5 . 5 - 4 9 ,5 3 91 9 6 3 ................................................... 1 2 5 ,1 5 4 7 4 ,5 7 1 5 9 .6 7 1 ,8 3 3 6 7 ,7 6 2 4 ,6 8 7 6 3 ,0 7 6 4 ,0 7 0 5 .7 - 5 0 ,5 8 3
1 9 6 4 ................................................... 1 2 7 ,2 2 4 7 5 ,8 3 0 5 9 .6 7 3 ,0 9 1 6 9 ,3 0 5 4 ,5 2 3 6 4 ,7 8 2 3 ,7 8 6 5 .2 - 5 1 ,3 9 41 9 6 5 ................................................... 1 2 9 ,2 3 6 7 7 ,1 7 8 5 9 .7 7 4 ,4 5 5 7 1 ,0 8 8 4 ,3 6 1 6 6 ,7 2 6 3 ,3 6 6 4 .5 - 5 2 ,0 5 81 9 6 6 ................................................... 1 3 1 ,1 8 0 7 8 ,8 9 3 6 0 .1 7 5 ,7 7 0 7 2 ,8 9 5 3 ,9 7 9 6 8 ,9 1 5 2 ,8 7 5 3 .8 - 5 2 ,2 8 81 9 6 7 ................................................... 1 3 3 ,3 1 9 8 0 ,7 9 3 6 0 .6 7 7 ,3 4 7 7 4 ,3 7 2 3 ,8 4 4 7 0 ,5 2 7 2 ,9 7 5 3 .8 - 5 2 ,5 2 71 9 6 8 ................................................... 1 3 5 ,5 6 2 8 2 ,2 7 2 6 0 .7 7 8 ,7 3 7 7 5 ,9 2 0 3 ,8 1 7 7 2 ,1 0 3 2 ,8 1 7 3 .6 - 5 3 ,2 9 1
1 9 6 8 : November...................... 1 3 6 ,4 2 0 8 2 ,7 0 2 6 0 .6 7 9 ,1 8 5 7 6 ,6 0 9 3 ,6 0 7 7 3 ,0 0 1 2 ,5 7 7 3 .3 3 .4 5 3 ,7 1 8December...................... 1 3 6 ,6 1 9 8 2 ,6 1 8 6 0 .5 7 9 ,1 1 8 7 6 ,7 0 0 3 ,2 7 9 7 3 ,4 2 1 2 ,4 1 9 3 .1 3 .3 5 4 ,0 0 1
1 9 6 9 : January........................ 1 3 6 ,8 0 2 8 1 ,7 1 1 5 9 .7 7 8 ,2 3 4 7 5 ,3 5 8 3 ,1 6 5 7 2 ,1 9 2 2 ,8 7 6 3 .7 3 .3 5 5 ,0 9 1February....... 1 3 6 ,9 4 0 8 2 ,5 7 9 6 0 .3 7 9 ,1 0 4 7 6 ,1 8 1 3 ,2 8 5 7 2 ,8 9 6 2 ,9 2 3 3 . 7 3 .3 5 4 ,3 6 1March.......... 1 3 7 ,1 4 3 8 2 ,7 7 0 6 0 .4 7 9 ,2 6 6 7 6 ,5 2 0 3 ,3 2 7 7 3 ,1 9 3 2 ,7 4 6 3 .5 3 .4 5 4 ,3 7 3April.......... 1 3 7 ,3 3 7 8 3 ,1 3 7 6 0 .5 7 9 ,6 2 1 7 7 ,0 7 9 3 ,6 0 7 7 3 ,4 7 1 2 ,5 4 2 3 .2 3 .5 5 4 ,2 0 0May............ 1 3 7 ,5 4 9 8 3 ,0 8 5 6 0 .4 7 5 ,5 6 3 7 7 ,2 6 4 3 ,8 9 4 7 3 ,3 7 0 2 ,2 9 9 2 .9 3 .5 5 4 ,4 6 4June........... 1 3 7 ,7 3 7 8 5 ,8 8 0 6 2 .4 8 2 ,3 5 6 7 8 ,9 5 6 4 ,3 6 7 7 4 ,5 8 9 3 ,4 0 0 4 .1 3 .4 5 1 ,8 5 7July........... 1 3 7 ,9 3 5 8 6 ,3 1 8 6 2 .6 8 2 ,7 9 7 7 9 ,6 1 6 4 ,1 5 5 7 5 ,4 6 0 3 ,1 8 2 3 .8 3 .6 5 1 ,6 1 7August........................... 1 3 8 ,1 2 7 8 6 ,0 4 6 6 2 .3 8 2 ,5 1 6 7 9 ,6 4 6 3 ,9 7 7 7 5 ,6 6 9 2 ,8 6 9 3 .5 3 .5 5 2 ,0 8 1September...... 1 3 8 ,3 1 7 8 4 ,5 2 7 6 1 .1 8 0 ,9 8 4 7 8 ,0 2 6 3 ,6 2 9 7 4 ,3 9 7 2 ,9 5 8 3 .7 4 . 0 5 3 ,7 9 0October........ 1 3 8 ,5 3 9 8 5 ,0 3 8 6 1 .4 8 1 ,5 1 0 7 8 ,6 7 1 3 ,5 6 1 7 5 ,1 1 0 2 ,8 3 9 3 .5 3 .9 5 3 ,5 0 1November....... 1 3 8 ,7 3 2 8 4 ,9 2 0 6 1 .2 8 1 ,4 2 7 7 8 ,7 1 6 2 ,3 2 2 7 5 ,3 9 5 2 ,7 1 0 3.3 3 .4 5 3 ,8 1 2
iNoc available.
3 7 1 - 7 9 3 0 - 6 9 - 4Digitized for FRASER http://fraser.stlouisfed.org/ Federal Reserve Bank of St. Louis

HOUSEHOLD DATA 5 0
A- 2: E mp loy men t status of the no n i n s t i t u t i o na l p o pu l a t i o n 16 y e a r s a n d ov e r by sex, 19 47 to d a t e
(In thousands)
Civilian labor force 1
Totalnoninstitutionalpopula
tion
Employed UnemployedYear, month, nnd sex
Percent Nonagri-Percent of labor force Not in
laborNumber of
population
Total Agriculture
culturalindustries
Number Notseason
allyadjusted
Season - ally
adjusted
force
MALE1947........................................ 50,968 44,258 86.8 42,686 40,994 6,643 34,351 1,692 4 .0 6,7101948........................................ 51,439 44,729 87.0 43,286 41,726 6,358 35,368 1,559 3.6 - 6,7101949........................................ 51,922 45,097 86.9 43,498 40,926 6,342 34,584 2,572 5.9 - 6,8251950........................................ 52,352 45,446 86.8 43,819 41,580 6,001 35,578 2,239 5.1 - 6,9061951........................................ 52,788 46,063 87.3 43,001 41,780 5,533 36,248 1,221 2.8 - 6,7251952........................................ 53,248 46,416 87.2 42,869 41,684 5,389 36,294 1,185 2.8 - 6,8321953........................................ 54,248 47,131 86.9 43,633 42,431 5,253 37,178 1,202 2.8 - 7,1171954........................................ 54,706 47,275 86.4 43,965 41,620 5,200 36,418 2,344 5.3 - 7,4311955........................................ 55,122 47,488 86.2 44,475 42,621 5,265 37,357 1,854 4.2 - 7,6341956........................................ 55,547 47,914 86.3 45,091 43,380 5,039 38,340 1,711 3.8 - 7,6331957........................................ 56,082 47,964 85.5 45,197 43,357 4,824 38,532 1,841 4.1 - 8,1181958........................................ 56,640 48,126 85.0 45,521 42,423 4,596 37,827 3,098 6.8 - 8,5141959........................................ 57,312 48,405 84.5 45,886 43,466 4,532 38,934 2,420 5.3 . 8,9071960........................................ 58,144 48,870 84.0 46,388 43,904 4,472 39,431 2,486 5.4 - 9,2741961............................ , ......... 58,826 49,193 83.6 46,653 43,656 4,298 39,359 2,997 6.4 - 9,6331962........................................ 59,626 49,395 82.8 46,600 44,177 4,069 40,108 2,423 5.2 - 10,2311963........................................ 60,627 49,835 82.2 47,129 44,657 3,809 40,849 2,472 5.2 - 10,7921964........................................ 61,556 50,387 81.9 47,679 45,474 3,691 41,782 2,205 4.6 - 11,1691965........................................ 62,473 50,946 81.5 48,255 46,340 3,547 42,792 1,914 4.0 - 11,5271966........................................ 63,351 51,560 81.4 48,471 46,919 3,243 43,675 1,551 3.2 - 11,7921967........................................ 64,316 52,398 81.5 48,987 47,479 3,164 44,315 1,508 3.1 - 11,9191968........................................ 65,345 53,030 81.2 49,533 48,114 3,157 44)957 1,419 2.9 - 12,315
1968: November.................. 65,738 52,678 80.1 49,198 47,969 2,962 44,007 1,229 2.5 2.7 13,060
1969: May............................ 66,241 53,139 . 80.2 49,657 48,543 3,154 45,388 1,114 2.2 2.7 13,102June.......................... 66,325 55,001 82.9 51,517 49,937 3,442 46,495 1,580 3.1 2.7 11,324July.......................... 66,395 55,501 83.6 52,020 50,412 3,322 47,090 1,608 3.1 3.0 10,894August...................... 66,482 55,306 83.2 51,815 50,522 3,223 47,299 1,293 2.5 2.7 11,176September................ 66,569 53,797 80.8 , 50,294 48,973 2,988 45,985 1,321 2.6 3.2 12,771October.................... 66,671 53,654 80.5 50,166 48,857 2,891 45,966 1,309 2.6 3.2 13,017November.................. 66,757 53,521 80.2 ' 50,067 48,739 2,722 46,017 1,329 2.7 2.9 13,236
FEMALE1947........................................ 52,450 16,683 31.8 16,664 16,045 1,248 14,797 619 3.7 35,7671948........................................ 53,088 17,351 32.7 17,335 16,618 1,271 15,347 717 4.1 - 35,7371949........................................ 53,689 17,806 33.2 17,788 16,723 1,314 15,409 1,065 6.0 - 35,8831950........................................ 54,293 18,412 33.9 18,389 17,340 1,159 16,182 1,049 5.7 - 35,8811951........................................ 54,933 19,054 34.7 19,016 18,182 1,193 16,990 834 4.4 - 35,8791952........................................ 55,575 19,314 34.8 19,269 18,570 1,112 17,459 698 3.6 - 36,2611953........................................ 56,353 19,429 34.5 19,382 18,750 1,008 17,744 632 3.3 - 36,9241954........................................ 56,965 19,718 34.6 19,678 18,490 1,006 17,486 1,188 6.0 - 37,2471955........................................ 57,610 20,584 35.7 20,548 19,550 1,184 18,367 998 4.9 - 37,0261956........................................ 58,264 21,495 36.9 21,461 20,422 1,244 19,177 1,039 4.8 - 36,7691957........................................ 58,983 21,765 36.9 21,732 20,714 1,123 19,591 1,018 4.7 - 37,2181958........................................ 59,723 22,149 37.1 22,118 20,613 990 19,623 1,504 6.8 - 37,5741959........................................ 60,569 22,516 37.2 22,483 21,164 1,033 20,131 1,320 5.9 - 38,0531960........................................ 61,615 23,272 37.8 23,240 21,874 986 20,887 1,366 5.9 - 38,3431961........................................ 62,517 23,838 38.1 23,806 22,090 902 21,187 1,717 7.2 - 38,6791962........................................ 63,355 24,047 38.0 24,014 22,525 875 21,651 1,488 6.2 - 39,3081963........................................ 64,527 24,736 38.3 24,704 23,105 878 22,227 1,598 6.5 - 39,7911964........................................ 65,668 25,443 38.7 25,412 23,831 832 23,000 1,581 6.2 - 40,2251965........................................ 66,763 26,232 39.3 26,200 24,748 814 23,934 1,452 5.5 - 40,5311966........................................ 67,829 27,333 40.3 27,299 25,976 736 25,240 1,324 4.8 - 40,4961967........................................ 69,003 28,395 41.2 28,360 26,893 680 26,212 1,468 5.2 - 40,6081968........................................ 70,217 29,242 41.6 29,204 27,807 660 27,147 1,397 4.8 " 40,976
1968: November.................... 70,683 30,024 42.5 29,987 28,639 645 27,994 1,347 4.5 4.3 40,658
1969: May.............................. 71,309 29,946 42.0 29,907 28,721 740 27,982 1,185 4 .0 4.8 41,362June............................ 71,412 30,879 43.2 30,839 29,019 925 28,094 1,819 5.9 4.7 40,533July............................ 71,540 30,817 43.1 30,778 29,204 834 28,370 1,574 5.1 4.6 40,722August........................ 71,644 30,740 42.9 30,701 29,124 754 28,370 1,577 5.1 4.9 40,905September..................f e S S S C r . : : : : : : - . : : :
71,74971,868
30,730 31,384
42.843.7
30,69131,345
29,05329,814
642670
28,41229,144
1,6381,530
5.34.9
5.35.0
41,01940,484
____7-L.976 31,399 43.6 31,359 29,978 600 29,378 1,381 4.4 4.3 40,577
Digitized for FRASER http://fraser.stlouisfed.org/ Federal Reserve Bank of St. Louis
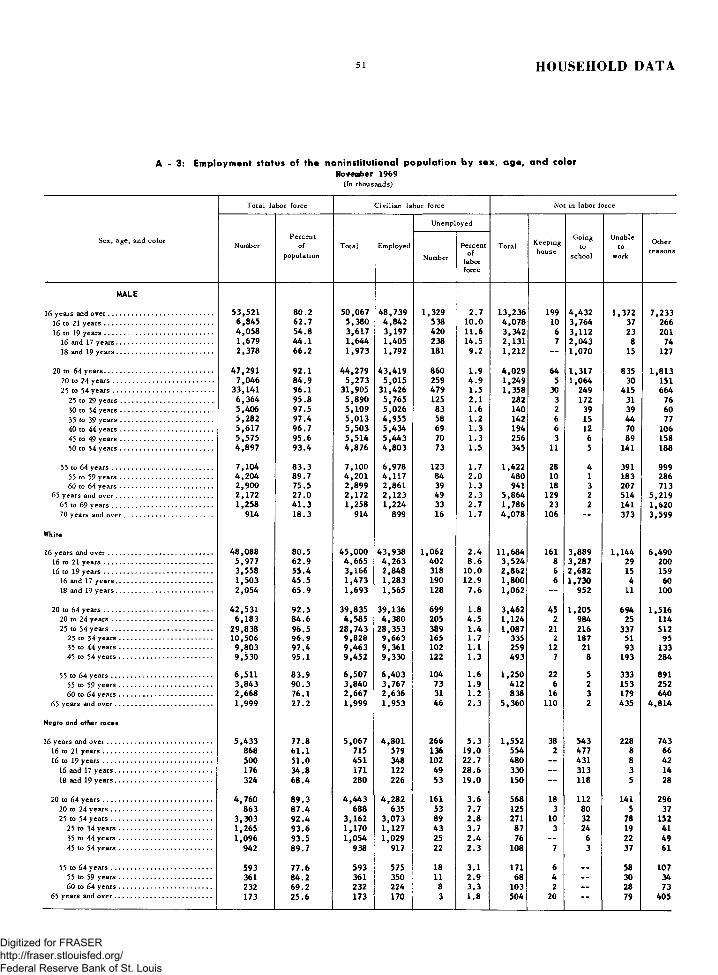
51 HOUSEHOLD DATA
A - 3: Employment status of the noninstitutional population by sex, age, and colorNovember 1969
(In th o u s a n d s )
S e x , a g e , a n d c o l o r
T o t a l la b o r f o r c e C iv i l i a n la b o r f o r c e N ot in la b o r f o r c e
N u m berP e r c e n t
o f
p o p u la t io nT o t a l E m p lo y e d
U n e m p lo y e d
T o t a l K e e p in gh o u s e
G o in gto
s c h o o l
U n a b leto
w ork
O th e rr e a s o n s
N um ber
P e r c e n to f
la b o rfo r c e
MALE
16 y e a r s an d o v e r ....................................................................... 5 3 ,5 2 1 8 0 .2 5 0 ,0 6 7 4 8 ,7 3 9 1 ,3 2 9 2 .7 1 3 ,2 3 6 199 4 ,4 3 2 1 ,3 7 2 7 ,2 3 316 to 21 y e a r s .......................................................................... 6 ,8 4 5 6 2 .7 5 ,3 8 0 4 ,8 4 2 5 38 1 0 .0 4 ,0 7 8 10 3 ,7 6 4 37 26616 to 19 y e a r s .......................................................................... 4 ,0 5 8 5 4 .8 3 ,6 1 7 3 ,1 9 7 4 20 1 1 .6 3 ,3 4 2 6 3 ,1 1 2 23 201
16 an d 17 y e a r s .................................................................. 1 ,6 7 9 4 4 .1 1 ,6 4 4 1 ,4 0 5 238 1 4 .5 2 ,1 3 1 7 2 ,0 4 3 8 7418 an d 19 y e a r s .................................................................. 2 ,3 7 8 6 6 .2 1 ,9 7 3 1 ,7 9 2 181 9 .2 1 ,2 1 2 — 1 ,0 7 0 15 127
2 0 to 6 4 y e a r s .......................................................................... 4 7 ,2 9 1 9 2 .1 4 4 ,2 7 9 4 3 ,4 1 9 8 60 1 .9 4 ,0 2 9 64 1 ,3 1 7 8 35 1 ,8 1 320 to 2 4 y e a r s ..................................................................... 7 ,0 4 6 8 4 .9 5 ,2 7 3 5 ,0 1 5 259 4 .9 1 ,2 4 9 5 1 ,0 6 4 30 15125 to 5 4 y e a r s ..................................................................... 3 3 ,1 4 1 9 6 .1 3 1 ,9 0 5 3 1 ,4 2 6 4 79 1 .5 1 ,3 5 8 30 249 4 15 6 64
25 to 29 y e a r s ............................................................... 6 ,3 6 4 9 5 .8 5 ,8 9 0 5 ,7 6 5 125 2 .1 282 3 172 31 7630 to 3 4 y e a r s ............................................................... 5 ,4 0 6 9 7 .5 5 ,1 0 9 5 ,0 2 6 83 1 .6 140 2 39 39 6035 to 39 y e a r s ............................................................... 5 ,2 8 2 9 7 .4 5 ,0 1 3 4 ,9 5 5 58 1 .2 142 6 15 4 4 774 0 to 4 4 y e a r s ............................................................... 5 ,6 1 7 9 6 .7 5 ,5 0 3 5 ,4 3 4 69 1 .3 194 6 12 70 1064 5 to 49 y e a r s ............................................................... 5 ,5 7 5 9 5 .6 5 ,5 1 4 5 ,4 4 3 70 1 .3 256 3 6 89 15850 to 5 4 y e a r s ............................................................... 4 ,8 9 7 9 3 .4 4 ,8 7 6 4 ,8 0 3 73 1 .5 345 11 5 141 188
55 to 6 4 y e a r s .................................................................... 7 ,1 0 4 8 3 .3 7 ,1 0 0 6 ,9 7 8 123 1 .7 1 ,4 2 2 28 4 391 99955 to 59 y e a r s ............................................................... 4 ,2 0 4 8 9 .7 4 ,2 0 1 4 ,1 1 7 84 2 .0 480 10 1 183 2866 0 to 6 4 y e a r s ............................................................... 2 ,9 0 0 7 5 .5 2 ,8 9 9 2 ,8 6 1 39 1 .3 941 18 3 207 713
6 5 y e a r s a n d o v e r .................................................................. 2 ,1 7 2 2 7 .0 2 ,1 7 2 2 ,1 2 3 49 2 .3 5 ,8 6 4 129 2 514 5 ,2 1 96 5 to 6 9 y e a r s .................................................................... 1 ,2 5 8 4 1 .3 1 ,2 5 8 1 ,2 2 4 33 2 .7 1 ,7 8 6 23 2 141 1 ,6 2 07 0 y e a r s an d o v e r ............................................................ 914 1 8 .3 914 899 16 1 .7 4 ,0 7 8 106 — 373 3 ,5 9 9
White
16 y e a r s and o v e r ....................................................................... 4 8 ,0 8 8 8 0 .5 4 5 ,0 0 0 4 3 ,9 3 8 1 ,0 6 2 2 .4 1 1 ,6 8 4 161 3 ,8 8 9 1 ,1 4 4 6 ,4 9 016 to 21 y e a r s .......................................................................... 5 ,9 7 7 6 2 .9 4 ,6 6 5 4 ,2 6 3 4 02 8 .6 3 ,5 2 4 8 3 ,2 8 7 29 20016 to 19 y e a r s .......................................................................... 3 ,5 5 8 5 5 .4 3 ,1 6 6 2 ,8 4 8 318 1 0 .0 2 ,8 6 2 6 2 ,6 8 2 15 159
16 a n d 17 y e a r s .................................................................. 1 ,5 0 3 4 5 .5 1 ,4 7 3 1 ,2 8 3 190 1 2 .9 1 ,8 0 0 6 1 ,7 3 0 4 6018 a n d 19 y e a r s .................................................................. 2 ,0 5 4 6 5 .9 1 ,6 9 3 1 ,5 6 5 128 7 .6 1 ,0 6 2 — 952 11 100
20 to 6 4 y e a r s .......................................................................... 4 2 ,5 3 1 9 2 .5 3 9 ,8 3 5 3 9 ,1 3 6 6 99 1 .8 3 ,4 6 2 45 1 ,2 0 5 694 1 ,5 1 62 0 to 2 4 y e a r s ..................................................................... 6 ,1 8 3 8 4 .6 4 ,5 8 5 4 ,3 8 0 205 4 .5 1 ,1 2 4 2 984 25 11425 to 5 4 y e a r s ..................................................................... 2 9 ,8 3 8 9 6 .5 2 8 ,7 4 3 2 8 ,3 5 3 389 1 .4 1 ,0 8 7 21 216 337 512
25 to 34 y e a r s ........................................................ 1 0 ,5 0 6 9 6 .9 9 ,8 2 8 9 ,6 6 3 165 1 .7 335 2 187 51 9535 to 4 4 y e a r s ............................................................... 9 ,8 0 3 9 7 .4 9 ,4 6 3 9 ,3 6 1 102 1 .1 259 12 21 93 13345 to 5 4 y e a r s ............................................................... 9 ,5 3 0 9 5 .1 9 ,4 5 2 9 ,3 3 0 122 1 .3 4 9 3 7 8 193 284
55 to 6 4 y e a r s ..................................................................... 6 ,5 1 1 8 3 .9 6 ,5 0 7 6 ,4 0 3 104 1 .6 1 ,2 5 0 22 5 333 89155 to 59 y e a r s ............................................................... 3 ,8 4 3 9 0 .3 3 ,8 4 0 3 ,7 6 7 73 1 .9 4 12 6 2 153 2526 0 to 6 4 y e a r s ............................................................... 2 ,6 6 8 7 6 .1 2 ,6 6 7 2 ,6 3 6 31 1 .2 8 38 16 3 179 640
6 5 y e a r s an d o v e r .................................................................. 1 ,9 9 9 2 7 .2 1 ,9 9 9 1 ,9 5 3 46 2 .3 5 ,3 6 0 110 2 4 35 4 ,8 1 4
Negro and other races
16 y e a r s an d o v e r ....................................................................... 5 ,4 3 3 7 7 .8 5 ,0 6 7 4 ,8 0 1 266 5 .3 1 ,5 5 2 38 543 228 74316 to 21 y e a r s .......................................................................... 868 6 1 .1 715 579 136 1 9 .0 554 2 4 77 8 6616 to 19 y e a r s .......................................................................... 500 5 1 .0 4 51 348 102 2 2 .7 480 — 4 31 8 42
16 a n d 17 y e a r s .................................................................. 176 3 4 .8 171 122 49 2 8 .6 330 — 313 3 1418 an d 19 y e a r s .................................................................. 324 6 8 .4 280 226 53 1 9 .0 150 — 118 5 28
20 to 6 4 y e a r s .......................................................................... 4 ,7 6 0 8 9 .3 4 ,4 4 3 4 ,2 8 2 161 3 .6 568 18 112 141 29620 to 2 4 y e a r s ..................................................................... 8 63 8 7 .4 688 635 53 7 .7 125 3 80 5 3725 to 54 y e a r s ..................................................................... 3 ,3 0 3 9 2 .4 3 ,1 6 2 3 ,0 7 3 89 2 .8 271 10 32 78 152
25 to 34 y e a r s ............................................................... 1 ,2 6 5 9 3 .6 1 ,1 7 0 1 ,1 2 7 4 3 3 .7 87 3 24 19 4135 to 4 4 y e a r s ............................................................... 1 ,0 9 6 9 3 .5 1 ,0 5 4 1 ,0 2 9 25 2 .4 76 - - 6 22 4 945 to 5 4 y e a r s ............................................................... 942 8 9 .7 938 917 22 2 .3 108 7 3 37 61
55 to 6 4 y e a r s ..................................................................... 593 7 7 .6 5 93 575 18 3 .1 171 6 58 10755 to 59 y e a r s ............................................................... 361 8 4 .2 361 350 11 2 .9 68 4 — 30 346 0 to 6 4 y e a r s ............................................................... 232 6 9 .2 232 224 8 3 .3 103 2 - - 28 73
65 y e a r s an d o v e r .................................................................. 173 2 5 .6 173 170 3 1 .8 5 04 20 — 79 4 05
Digitized for FRASER http://fraser.stlouisfed.org/ Federal Reserve Bank of St. Louis

HOUSEHOLD DATA 5 2
A- 3:November 1969
(In thousands)
Emp loy men t status of the n o ni ns t i t u t i ona l p o pu l a t i o n by sex, age, and c o l o r - - Co n t i n ue d
Sex, age, and co lo r
T otal labor force C iv ilian labor fo rce Not in labor fo rce
NumberP ercen t
o fpopulation
T ota l E m ployed
Unem ployed
T ota lK eeping
house
G oingto
sch o o l
U nableto
work
OtherreasonsNumber
P ercentof
laborforce
FEMALE
16 years and o v e r ................................................................. 3 1 ,3 9 9 4 3 .6 3 1 ,3 5 9 2 9 ,9 7 8 1 ,3 8 1 4 . 4 4 0 ,5 7 7 3 4 ,2 5 2 4 ,0 8 1 815 1 ,4 2 916 to 21 y e a r s .................................................................... 5 ,2 1 5 4 8 .6 5 ,1 9 4 4 ,6 8 3 511 9 .8 5 ,5 1 0 1 ,6 0 1 3 ,7 1 4 18 17716 to 19 y e a r s ................................................................... 3 ,1 8 1 4 3 .9 3 ,1 7 1 2 ,7 8 3 388 1 2 .2 4 ,0 6 4 722 3 ,2 0 7 10 126
16 and 17 y e a r s ............................................................ 1 ,2 8 8 3 4 .6 1 ,2 8 8 1 ,0 7 9 209 1 6 .2 2 ,4 3 6 194 2 ,1 9 3 2 4718 and 19 y e a r s ............................................................ 1 ,8 9 3 5 3 .8 1 ,8 8 3 1 ,7 0 5 179 9 .5 1 ,6 2 8 528 1 ,0 1 4 8 78
20 to 64 y e a r s .................................................................... 2 7 ,1 5 7 5 0 .3 2 7 ,1 2 7 2 6 ,1 4 8 979 3 .6 2 6 ,8 1 2 2 5 ,0 5 8 869 286 59920 to 24 y e a r s ............................................................... 4 ,7 5 3 5 7 .6 4 ,7 3 5 4 ,4 6 2 273 5 .8 3 ,5 0 4 2 ,7 1 6 675 23 8925 to 54 y e a r s ............................................................... 1 8 ,3 2 2 5 0 .7 1 8 ,3 1 2 1 7 ,6 9 4 617 3 .4 1 7 ,8 5 0 1 7 ,1 8 7 187 147 329
25 to 29 y e a r s .......................................................... 2 ,9 8 8 4 4 .3 2 ,9 8 3 2 ,8 4 7 136 4 .6 3 ,7 6 2 3 ,6 2 6 65 21 5030 to 34 y e a r s .......................................................... 2 ,5 8 3 4 5 .1 2 ,5 8 1 2 ,4 6 5 116 4 .5 3 ,1 3 8 3 ,0 3 6 45 19 3835 to 39 y e a r s .......................................................... 2 ,8 0 8 4 9 .8 2 ,8 0 6 2 ,7 0 2 104 3 .7 2 ,8 2 8 2 ,7 4 2 33 12 4140 to 44 y e a r s .......................................................... 3 ,3 1 1 5 4 .0 3 ,3 0 9 3 ,2 0 2 108 3 .3 2 ,8 2 2 2 ,7 1 6 27 25 5445 to 49 y e a r s .......................................................... 3 ,5 2 8 5 6 .3 3 ,5 2 7 3 ,4 4 2 84 2 .4 2 ,7 3 4 2 ,6 1 7 10 31 7550 to 54 y e a r s .......................................................... 3 ,1 0 6 5 4 .8 3 ,1 0 6 3 ,0 3 6 69 2 .2 2 ,5 6 6 2 ,4 5 0 7 38 71
55 to 64 y e a r s ............................................................... 4 ,0 8 1 4 2 .8 4 ,0 8 1 3 ,9 9 3 89 2 .2 5 ,4 5 9 5 ,1 5 6 6 116 18155 to 59 y e a r s .......................................................... 2 ,5 3 9 4 9 .3 2 ,5 3 8 2 ,4 7 2 66 2 .6 2 ,6 0 9 2 ,4 7 3 4 50 8260 to 64 y e a r s .......................................................... 1 ,5 4 3 3 5 .1 1 ,5 4 3 1 ,5 2 0 22 1 .5 2 ,8 4 9 2 ,6 8 2 3 66 98
65 years and o v e r ............................................................ 1 ,0 6 1 9 .9 1 ,0 6 1 1 ,0 4 6 15 1 .4 9 ,7 0 0 8 ,4 7 1 6 519 70465 to 69 y e a r s ............................................................... 626 1 7 .0 626 6 12 14 2 .2 3 ,0 4 6 2 ,8 1 2 - - 62 17170 years and o v e r ....................................................... 436 6 .1 436 4 34 2 .4 6 ,6 5 5 5 ,6 6 0 5 4 57 533
White
16 years and o v e r ................................................................. 2 7 ,3 6 7 4 2 .8 2 7 ,3 3 2 2 6 ,2 3 5 1 ,0 9 8 4 .0 3 6 ,6 4 3 3 1 ,2 5 5 3 ,4 8 7 650 1 ,2 5 116 to 21 y e a r s ................................................................... 4 ,6 0 0 4 9 .7 4 ,5 8 2 4 ,1 9 7 385 8 .4 4 ,6 5 7 1 ,3 3 4 3 ,1 6 9 12 14216 to 19 y e a r s ................................................................... 2 ,8 3 2 4 5 .4 2 ,8 2 4 2 ,5 2 4 299 1 0 .6 3 ,4 0 6 577 2 ,7 2 5 7 98
16 and 17 y e a r s ............................................................ 1 ,1 6 4 3 6 .3 1 ,1 6 4 1 ,0 0 0 164 1 4 .1 2 ,0 4 2 156 1 ,8 4 2 2 4118 and 19 y e a r s ............................................................ 1 ,6 6 8 5 5 .0 1 ,6 5 9 1 ,5 2 4 135 8 .1 1 ,3 6 4 420 8 83 5 57
20 to 64 y e a rs ..................................................................... 2 3 ,5 5 4 4 9 .2 2 3 ,5 2 7 2 2 ,7 4 5 782 3 .3 2 4 ,2 9 7 2 2 ,8 1 7 756 226 49720 to 24 y e a r s ............................................................... 4 ,1 0 4 5 6 .9 4 ,0 8 8 3 ,8 8 7 201 4 .9 3 ,1 0 4 2 ,4 2 6 590 15 7325 to 54 y e a r s ............................................................... 1 5 ,7 8 6 4 9 .4 1 5 ,7 7 6 1 5 ,2 7 6 500 3 .2 1 6 ,1 9 2 1 5 ,6 3 6 160 120 276
25 to 34 y e a r s .......................................................... 4 ,7 0 8 4 3 .1 4 ,7 0 2 4 ,5 0 3 199 4 .2 6 ,2 2 3 6 ,0 2 9 90 35 6935 to 44 y e a r s .......................................................... 5 ,2 4 5 5 0 .7 5 ,2 4 1 5 ,0 7 0 171 3 .3 5 ,1 0 0 4 ,9 3 7 53 29 8145 to 54 y e a r s .......................................................... 5 ,8 3 3 5 4 .5 5 ,8 3 2 5 ,7 0 2 130 2 .2 4 ,8 6 9 4 ,6 7 1 17 56 125
55 to 64 y e a r s ............................................................... 3 ,6 6 4 4 2 .3 3 ,6 6 4 3 ,5 8 3 81 2 .2 5 ,0 0 1 4 ,7 5 5 6 91 14955 to 59 y e a r s .......................................................... 2 ,2 7 1 4 8 .8 2 ,2 7 1 2 ,2 1 0 61 2 .7 2 ,3 8 3 2 ,2 7 2 4 41 6660 to 64 y e a r s .......................................................... 1 ,3 9 3 3 4 .7 1 ,3 9 3 1 ,3 7 3 20 1 .4 2 ,6 1 8 2 ,4 8 4 3 49 83
65 years and o v e r ............................................................ 981 9 .9 981 965 16 1 .6 8 ,9 4 0 7 ,8 6 1 6 4 17 657
Negro and other races
16 years and o v e r ................................................................. 4 ,0 3 2 5 0 .6 4 ,0 2 7 3 ,7 4 3 284 7 .1 3 ,9 3 4 2 ,9 9 6 594 165 17816 to 21 y e a r s .................................................................... 615 4 1 .9 613 4 86 126 2 0 .6 8 53 267 545 5 3516 to 19 y e a r s .................................................................... 349 3 4 .6 347 259 88 2 5 .5 658 145 482 3 28
16 and 17 y e a r s ............................................................. 124 2 3 .9 124 79 45 3 6 .4 394 37 351 - - 618 and 19 y e a r s ............................................................ 225 4 6 .0 224 180 43 1 9 .4 264 108 131 4 22
20 to 64 y e a r s .................................................................... 3 ,6 0 3 5 8 .9 3 ,6 0 0 3 ,4 0 3 195 5 .4 2 ,5 1 5 2 ,2 4 0 113 60 10220 to 24 y e a r s ............................................................... 649 6 1 .9 647 575 71 1 1 .0 4 00 290 85 8 1725 to 54 years ............................................................ 2 ,5 3 7 6 0 .5 2 ,5 3 6 2 ,4 1 8 117 4 .6 1 ,6 5 8 1 ,5 5 0 27 28 53
25 to 34 y e a r s .......................................................... 862 5 6 .0 861 809 53 6 .1 677 6 33 21 5 1935 to 44 y e a r s .......................................................... 8 74 6 1 .4 8 74 833 40 4 .6 551 521 7 9 1445 to 54 y e a r s .......................................................... 800 6 5 .0 8 00 777 24 3 .0 4 30 397 — 13 20
55 to 64 y e a r s ............................................................... 4 17 4 7 .7 4 17 410 8 1 .9 457 4 00 . . 25 3255 to 59 y e a r s .......................................................... 267 5 4 .2 267 262 5 2 .0 226 202 - - 8 1660 to 64 y e a r s .......................................................... 150 3 9 .4 150 148 3 1 .7 231 199 - - 17 16
65 years and o v e r ............................................................ 80 9 .5 80 81 760 611 102 48
Digitized for FRASER http://fraser.stlouisfed.org/ Federal Reserve Bank of St. Louis

5 3 HOUSEHOLD DATA
A - 4: Labor force by sex, age, ancf color
S e x , a g e , a n d c o l o r
T o t a l la b o r f o r c e C iv i l i a n la b o r f o r c e
T h o u s a n d s o f p e r s o n s P a r t ic ip a t io n ra te T h o u s a n d s o f p e r s o n s P a r t ic ip a t i o n ra te
N o v .
1 9 6 9N o v .1 9 6 8
N o v .
1 9 6 9N o v .1 9 6 8
N o v .1 9 6 9
N o v .1 9 6 8
N o v ,1 9 6 9
N o v .1 9 6 8
MALE
16 y e a r s and o v e r .............................................................................................................................. 5 3 , 5 2 1 5 2 , 6 7 8 8 0 . 2 8 0 . 1 5 0 , 0 6 7 4 9 , 1 9 8 7 9 . 1 7 9 . 0
16 to 19 y e a r s ................................................................................................................................. 4 , 0 5 8 3 , 7 9 2 5 4 . 8 5 2 . 3 3 , 6 1 7 3 , 3 6 7 5 2 . 0 4 9 . 3
16 an d 17 y e a r s ......................................................................................................................... 1 , 6 7 9 1 , 5 1 2 4 4 . 1 4 0 . 8 1 , 6 4 4 1 , 4 8 6 4 3 . 5 4 0 . 4
18 a n d 19 y e a r s ......................................................................................................................... 2 , 3 7 8 2 , 2 8 0 6 6 . 2 6 4 . 3 1 , 9 7 3 1 , 8 8 0 6 2 . 0 5 9 . 8
2 0 to 24 y e a r s ................................................................................................................................. 7 , 0 4 6 6 , 7 6 5 8 4 . 9 8 4 . 8 5 , 2 7 3 4 , 9 8 0 8 0 . 8 8 0 . 4
25 to 5 4 y e a r s ................................................................................................................................. 3 3 , 1 4 1 3 2 , 9 0 4 9 6 . 1 9 6 . 2 3 1 , 9 0 5 3 1 , 6 3 9 9 5 . 9 9 6 . 1
25 to 34 y e a r s ............................................................................................................................ 1 1 , 7 7 1 1 1 , 4 7 4 9 6 . 5 9 6 . 7 1 0 , 9 9 9 1 0 , 6 9 7 9 6 . 3 9 6 . 5
35 to 4 4 y e a r s ............................................................................................................................ 1 0 , 8 9 9 1 1 , 0 2 8 9 7 . 0 9 7 . 0 1 0 , 5 1 6 1 0 , 6 3 2 9 6 . 9 9 6 . 8
45 to 5 4 y e a r s ............................................................................................................................ 1 0 , 4 7 2 1 0 , 4 0 3 9 4 . 6 9 5 . 0 1 0 , 3 9 0 1 0 , 3 1 0 9 4 . 5 9 4 . 9
55 to 6 4 y e a r s ................................................................................................................................. 7 , 1 0 4 7 , 0 4 9 8 3 . 3 8 4 . 0 7 , 1 0 0 7 , 0 4 5 8 3 . 3 8 4 . 0
55 to 59 y e a r s ............................................................................................................................ 4 , 2 0 4 4 , 1 4 0 8 9 . 7 8 9 . 9 4 , 2 0 1 4 , 1 3 6 8 9 . 7 8 9 . 86 0 to 6 4 y e a r s ........................................................................................................................... 2 , 9 0 0 2 , 9 0 9 7 5 . 5 7 7 . 0 2 , 8 9 9 2 , 9 0 9 7 5 . 5 7 7 . 0
65 y e a r s and o v e r ......................................................................................................................... 2 , 1 7 2 2 , 1 6 8 2 7 . 0 2 7 . 3 2 , 1 7 2 2 , 1 6 8 2 7 . 0 2 7 . 3
White
16 y e a r s and o v e r .........................................................................................................................1 . 4 8 , 0 8 8 4 7 , 3 8 0 8 0 . 5 8 0 . 4 4 5 , 0 0 0 4 4 , 2 6 4 7 9 . 4 7 9 . 316 to 19 y e a r s ................................................................................................................................. 3 , 5 5 8 3 , 3 4 7 5 5 . 4 5 3 . 1 3 , 1 6 6 2 , 9 6 0 5 2 . 5 5 0 . 1
16 a n d 17 y e a r s ......................................................................................................................... 1 , 5 0 3 1 , 3 4 7 4 5 . 5 4 1 . 9 1 , 4 7 3 1 , 3 2 3 4 5 . 0 4 1 . 518 and 19 y e a r s ......................................................................................................................... 2 , 0 5 4 2 , 0 0 0 6 5 . 9 6 4 . 9 1 , 6 9 3 1 , 6 3 7 6 1 . 5 6 0 ’ . 2
20 to 2 4 y e a r s ................................................................................................................................. 6 , 1 8 3 5 , 9 5 2 8 4 . 6 8 4 . 4 4 , 5 8 5 4 , 3 4 0 8 0 . 3 7 9 . 825 to 5 4 y e a r s ................................................................................................................................. 2 9 , 8 3 8 2 9 , 6 2 4 9 6 . 5 9 6 . 6 2 8 , 7 4 3 2 8 , 5 1 0 9 6 . 4 9 6 . 5
25 to 34 y e a r s ........................................................................................................................... 1 0 , 5 0 6 1 0 , 2 4 4 9 6 . 9 9 7 . 0 9 , 8 2 8 9 , 5 6 6 9 6 . 7 9 6 . 835 to 4 4 y e a r s ........................................................................................................................... 9 , 8 0 3 9 , 9 2 5 9 7 . 4 9 7 . 3 9 , 4 6 3 9 , 5 7 5 9 7 . 3 9 7 . 245 to 5 4 y e a r s ........................................................................................................................... 9 , 5 3 0 9 , 4 5 5 9 5 . 1 9 5 . 4 9 , 4 5 2 9 , 3 7 0 9 5 . 0 9 5 . 3
55 to 6 4 y e a r s ................................................................................................................................. 6 , 5 1 1 6 , 4 6 3 8 3 . 9 8 4 . 7 6 , 5 0 7 6 , 4 6 0 8 3 . 9 8 4 . 755 to 59 y e a r s ........................................................................................................................... 3 , 8 4 3 3 , 7 8 9 9 0 . 3 9 0 . 5 3 , 8 4 0 3 , 7 8 6 9 0 . 3 9 0 . 56 0 to 6 4 y e a r s ........................................................................................................................... 2 , 6 6 8 2 , 6 7 4 7 6 . 1 7 7 . 6 2 , 6 6 7 2 , 6 7 4 7 6 . 1 7 7 . 6
65 y e a r s an d o v e r ......................................................................................................................... 1 , 9 9 9 1 , 9 9 4 2 7 . 2 2 7 . 4 1 , 9 9 9 1 , 9 9 4 2 7 . 2 2 7 . 4
Negro and other races
16 y e a r s an d o v e r .............................................................................................................................. 5 , 4 3 3 5 , 2 9 7 7 7 . 8 7 7 . 7 5 , 0 6 7 4 , 9 3 4 7 6 . 6 7 6 . 5
16 to 19 y e a r s ................................................................................................................................. 5 0 0 4 4 5 5 1 . 0 4 6 . 8 4 5 1 4 0 7 4 8 . 4 4 4 . 6
16 an d 17 y e a r s ......................................................................................................................... 1 7 6 1 6 5 3 4 . 8 3 3 . 8 1 7 1 1 6 3 3 4 . 1 3 3 . 5
18 and 19 y e a r s ......................................................................................................................... 3 2 4 2 8 0 6 8 . 4 6 0 . 6 2 8 0 2 4 3 6 5 . 1 5 7 . 2
20 to 24 y e a r s ................................................................................................................................. 8 6 3 8 1 3 8 7 . 4 8 7 . 5 6 8 8 6 4 0 8 4 . 6 8 4 . 6
25 to 5 4 y e a r s ................................................................................................................................. 3 , 3 0 3 3 , 2 8 0 9 2 . 4 9 3 . 2 3 , 1 6 2 3 , 1 2 9 9 2 . 1 9 3 . 0
25 to 3 4 y e a r s ............................................................................................................................ 1 , 2 6 5 1 , 2 3 0 9 3 . 6 9 4 . 5 1 , 1 7 0 1 , 1 3 1 9 3 . 1 9 4 . 0
35 to 4 4 y e a r s ............................................................................................................................ 1 , 0 9 6 1 , 1 0 3 9 3 . 5 9 3 . 6 1 , 0 5 4 1 , 0 5 7 9 3 . 3 9 3 . 4
45 to 54 y e a r s ........................................................................................................................... 9 4 2 9 4 8 8 9 . 7 9 1 . 1 9 3 8 9 4 0 8 9 . 7 9 1 . 0
55 to 6 4 y e a r s ................................................................................................................................. 5 9 3 5 8 6 7 7 . 6 7 7 . 6 5 9 3 5 8 5 7 7 . 6 7 7 . 655 to 59 y e a r s ............................................................................................................. 3 6 1 3 5 1 8 4 . 2 8 3 . 2 3 6 1 3 5 0 8 4 . 2 8 3 . 2
6 0 to 6 4 y e a r s ............................................................................................................................ 2 3 2 2 3 5 6 9 . 2 7 0 . 5 2 3 2 2 3 5 6 9 . 2 7 0 . 5
65 y e a r s an d o v e r ......................................................................................................................... 1 7 3 1 7 4 2 5 . 6 2 6 . 4 1 7 3 1 7 4 2 5 . 6 2 6 . 4
Digitized for FRASER http://fraser.stlouisfed.org/ Federal Reserve Bank of St. Louis

HOUSEHOLD DATA 5 4
A- 4: L a bo r force by sex, a ge , and c o l o r - - C o n t i n u e d
S e x , a g e , a n d c o l o r
T o t a l la b o r f o r c e C iv i l i a n la b o r f o r c e
T h o u s a n d s o f p e r s o n s P a r t ic ip a t io n ra te T h o u s a n d s o f p e r s o n s P a r t ic ip a t i o n r a te
Nov.1 9 6 9
Nov.1 9 6 8
NOV.1 9 6 9
Nov.1 9 6 8
NOV.1 9 6 9
Nov.1 9 6 8
Nov.1 9 6 9
Nov.1 9 6 8
F E M A L E
16 y e a r s a n d o v e r ............................................................................................................................... 3 1 , 3 9 9 3 0 , 0 2 4 4 3 . 6 4 2 . 5 3 1 , 3 5 9 2 9 , 9 8 7 4 3 . 6 4 2 . 4
16 t o 19 y e a r s .................................................................................................................................. 3 , 1 8 1 2 , 8 5 7 4 3 . 9 4 0 . 4 3 , 1 7 1 2 , 8 4 8 4 3 . 8 4 0 . 3
16 a n d 17 y e a r s ......................................................................................................................... 1 , 2 8 8 1 , 0 8 3 3 4 . 6 3 0 . 0 1 , 2 8 8 1 , 0 8 2 3 4 . 6 3 0 . 0
18 and 19 y e a r s ......................................................................................................................... 1 , 8 9 3 1 , 7 7 5 5 3 . 8 5 1 . 2 1 , 8 8 3 1 , 7 6 5 5 3 . 6 5 1 . 1
20 to 24 y e a r s ................................................................................................................................. 4 , 7 5 3 4 , 4 2 2 5 7 . 6 5 5 . 9 4 , 7 3 5 4 , 4 0 5 5 7 . 5 5 5 . 8
25 to 5 4 y e a r s ................................................................................................................................. 1 8 , 3 2 2 1 7 , 6 6 9 5 0 . 7 4 9 . 3 1 8 , 3 1 2 1 6 , 6 5 8 5 0 . 6 4 9 . 3
25 t o 3 4 y e a r s ............................................................................................................................ 5 , 5 7 0 5 , 3 7 2 4 4 . 7 4 4 . 3 5 , 5 6 4 5 , 3 6 6 4 4 . 6 4 4 . 3
35 t o 4 4 y e a r s ............................................................................................................................ 6 , 1 1 9 6 , 0 3 4 5 2 . 0 5 0 . 6 6 , 1 1 5 6 , 0 3 0 5 2 . 0 5 0 . 6
45 t o 5 4 y e a r s ............................................................................................................................ 6 , 6 3 4 6 , 2 6 3 5 5 . 6 5 3 . 2 6 , 6 3 2 6 , 2 6 2 5 5 . 6 5 3 . 2
55 to 6 4 y e a r s .................................................................................................................................. 4 , 0 8 1 4 , 0 1 9 4 2 . 8 4 3 . 0 4 , 0 8 1 4 , 0 1 9 4 2 . 8 4 3 . 0
55 to 59 y e a r s ............................................................................................................................ 2 , 5 3 9 2 , 4 4 8 4 9 . 3 4 8 . 5 2 , 5 3 8 2 , 4 4 8 4 9 . 3 4 8 . 5
6 0 to 6 4 y e a r s ............................................................................................................................ 1 , 5 4 3 1 , 5 7 1 3 5 . 1 3 6 . 5 1 , 5 4 3 1 , 5 7 1 3 5 . 1 3 6 . 5
6 5 y e a r s a n d o v e r ......................................................................................................................... 1 , 0 6 1 1 , 0 5 7 9 . 9 1 0 . 0 1 , 0 6 1 1 , 0 5 7 9 . 9 1 0 . 0
W hite
16 y e a r s a n d o v e r ................................................................................................... . ................. 2 7 , 3 6 7 2 6 , 1 9 1 4 2 . 8 4 1 . 6 2 7 , 3 3 2 2 6 , 1 5 7 4 2 . 7 4 1 . 6
16 to 19 y e a r s ................................................................................................................................. 2 , 8 3 2 2 , 5 5 1 4 5 . 4 4 1 . 8 2 , 8 2 4 2 , 5 4 3 4 5 . 3 4 1 . 7
16 a n d 17 y e a r s ...................................................................................................................... 1 , 1 6 4 9 9 5 3 6 . 3 3 2 . 0 1 , 1 6 4 9 9 5 3 6 . 3 3 2 . 0
18 a n d 19 y e a r s ......................................................................................................................... 1 , 6 6 8 1 , 5 5 7 5 5 . 0 5 2 . 0 1 , 6 5 9 1 , 5 4 8 5 4 . 9 5 1 . 920 to 24 y e a r s ................................................................................................................................. 4 , 1 0 4 3 , 8 3 6 5 6 . 9 5 5 . 4 4 , 0 8 8 3 , 8 2 1 5 6 . 8 5 5 . 325 t o 5 4 y e a r s ................................................................................................................................. 1 5 , 7 8 6 1 5 , 2 3 7 4 9 . 4 4 8 . 1 1 5 , 7 7 6 1 5 , 2 2 7 4 9 . 3 4 8 . 0
25 t o 3 4 y e a r s ............................................................................................................................ 4 , 7 0 8 4 , 5 4 4 4 3 . 1 4 2 . 7 4 , 7 0 2 4 , 5 3 9 4 3 . 0 4 2 . 735 to 4 4 y e a r s ............................................................................................................................ 5 , 2 4 5 5 , 1 6 4 5 0 . 7 4 9 . 1 5 , 2 4 1 5 , 1 6 1 5 0 . 7 4 9 . 14 5 t o 54 y e a r s ............................................................................................................................ 5 , 8 3 3 5 , 5 2 9 5 4 . 5 5 2 . 3 5 , 8 3 2 5 , 5 2 7 5 4 . 5 5 2 . 3
55 t o 6 4 y e a r s ................................................................................................................................. 3 , 6 6 4 3 , 6 1 2 4 2 . 3 4 2 . 5 3 , 6 6 4 3 , 6 1 2 4 2 . 3 4 2 . 555 to 59 y e a r s ............................................................................................................................ 2 , 2 7 1 2 , 1 9 7 4 8 . 8 4 8 . 1 2 , 2 7 1 2 , 1 9 7 4 8 . 8 4 8 . 16 0 to 6 4 y e a r s ............................................................................................................................ 1 , 3 9 3 1 , 4 1 5 3 4 . 7 3 6 . 0 1 , 3 9 3 1 , 4 1 5 3 4 . 7 3 6 . 0
6 5 y e a r s a n d o v e r ......................................................................................................................... 9 8 1 9 5 5 9 . 9 9 . 8 9 8 1 9 5 5 9 . 9 9 . 8
N e g ro and o th e r r a c e s
16 y e a r s and o v e r ............................................................................................................................... 4 , 0 3 2 3 , 8 3 3 5 0 . 6 4 9 . 5 4 , 0 2 7 3 , 8 2 9 5 0 . 6 4 9 . 516 to 19 y e a r s ................................................................................................................................. 3 4 9 3 0 6 3 4 . 6 3 1 . 4 3 4 7 3 0 5 3 4 . 5 3 1 . 3
16 and 17 y e a r s ......................................................................................................................... 1 2 4 8 8 2 3 . 9 1 7 . 6 1 2 4 8 8 2 3 . 9 1 7 . 618 a n d 19 y e a r s ......................................................................................................................... 2 2 5 2 1 8 4 6 . 0 4 5 . 9 2 2 4 2 1 7 4 5 . 9 4 5 . 8
2 0 to 2 4 y e a r s ................................................................................................................................. 6 4 9 5 8 6 6 1 . 9 5 9 . 8 6 4 7 5 8 4 6 1 . 8 5 9 . 725 to 5 4 y e a r s ................................................................................................................................. 2 , 5 3 7 2 , 4 3 2 6 0 . 5 5 9 . 1 2 , 5 3 6 2 , 4 3 1 6 0 . 5 5 9 . 1
25 to 3 4 y e a r s ............................................................................................................................ 8 6 2 8 2 8 5 6 . 0 5 5 . 5 8 6 1 8 2 7 5 6 . 0 5 5 . 535 to 4 4 y e a r s ............................................................................................................................ 8 7 4 8 7 0 6 1 . 4 6 1 . 1 8 7 4 8 7 0 6 1 . 3 6 1 . 145 to 54 y e a r s ............................................................................................................................ 8 0 0 7 3 4 6 5 . 0 6 1 . 0 8 0 0 7 3 4 6 5 . 0 6 1 . 0
55 to 6 4 y e a r s ............................................................................................................................... 4 1 7 4 0 7 4 7 . 7 4 7 . 8 4 1 7 4 0 7 4 7 . 7 4 7 . 855 to 59 y e a r s ............................................................................................................................ 2 6 7 2 5 1 5 4 . 2 5 2 . 4 2 6 7 2 5 1 5 4 . 2 5 2 . 46 0 t o 6 4 y e a r s ............................................................................................................................ 1 5 0 1 5 6 3 9 . 4 4 1 . 8 1 5 0 1 5 6 3 9 . 4 4 1 . 8
6 5 y e a r s a n d o v e r ......................................................................................................................... 8 0 1 0 2 9 . 5 1 2 . 4 8 0 1 0 2 9 . 5 1 2 . 4
Digitized for FRASER http://fraser.stlouisfed.org/ Federal Reserve Bank of St. Louis

5 5 HOUSEHOLD DATA
November 1 9 6 9(In t h o u s a n d s )
A- 5: E m p l oy m en t status of persons 16-21 y e a rs of a g e in the n o ni ns t i t u t i ona l p o p u l a t i o n by co lor a nd sex
T o t a l W hite N e g r o a n d o th e r r a c e sE m p loym en t s ta tu s B oth
s e x e s M a le F e m a le B o th .s e x e s M a le F e m a le
B oths e x e s M a le F e m a le
T o t a l n o n in s t itu t io n a l p o p u la t io n ....................................................... 2 1 , 6 4 9 1 0 , 9 2 3 1 0 , 7 2 6 1 8 , 7 5 8 9 , 5 0 1 9 , 2 5 7 2 , 8 9 0 1 , 4 2 2 1 , 4 6 9
T o t a l la b o r f o r c e .......................................................................................... 1 2 , 0 6 1 6 , 8 4 5 5 , 2 1 5 1 0 , 5 7 7 5 , 9 7 7 4 , 6 0 0 1 , 4 8 3 8 6 8 6 1 5
P e r c e n t o f p o p u la t io n ................................................................................ 5 5 . 7 6 2 . 7 4 8 . 6 5 6 . 4 6 2 . 9 4 9 . 7 5 1 . 3 6 1 . 1 4 1 . 9
1 0 , 5 7 4 5 , 3 8 0 5 , 1 9 4 9 , 2 4 7 4 , 6 6 5 4 , 5 8 2 1 , 3 2 7 7 1 5 6 1 3
E m p lo y e d ........................................................................................................ 9 , 5 2 5 4 , 8 4 2 4 , 6 8 3 8 , 4 6 0 4 , 2 6 3 4 , 1 9 7 1 , 0 6 5 5 7 9 4 8 6
3 8 8 3 4 0 4 8 3 4 3 3 0 2 4 1 4 5 3 8 8
N o n a g r ic u ltu r a l i n d u s t r i e s .......................................................... 9 , 1 3 7 4 , 5 0 2 4 , 6 3 5 8 , 1 1 7 3 , 9 6 1 4 , 1 5 6 1 , 0 2 0 5 4 1 4 7 9
1 , 0 4 9 5 3 8 5 1 1 7 8 7 4 0 2 3 8 5 2 6 2 1 3 6 1 2 6
P e r c e n t o f la b o r f o r c e .................................................................... 9 . 9 1 0 . 0 9 . 8 8 . 5 8 . 6 8 . 4 1 9 . 7 1 9 . 0 2 0 . 6
L o o k in g fo r fu l l - t im e w o r k .......................................................... 5 2 6 2 6 2 2 6 3 3 6 1 1 7 7 1 8 5 1 6 4 8 5 7 9
L o o k in g fo r p a r t-t im e w o r k .......................................................... 5 2 3 2 7 6 2 4 8 4 2 6 2 2 5 2 0 0 9 8 5 0 4 7
N ot in la b o r f o r c e ....................................................................................... 9 , 5 8 8 4 , 0 7 8 5 , 5 1 0 8 , 1 8 1 3 , 5 2 4 4 , 6 5 7 1 , 4 0 7 5 5 4 8 5 3
M a jor a c t iv i t y : g o in g to s c h o o l3 3 5 1 8 7 1 4 7C iv i l i a n la b o r f o r c e ..................................................................................... 3 , 8 6 5 2 , 1 9 6 1 , 6 6 8 3 , 5 3 0 2 , 0 0 9 1 , 5 2 1
E m p l o y e d .....................................................................................................A g r i c u l t u r e .............................................................................................N o n a g r ic u ltu r a l in d u s t r i e s ..........................................................
3 , 3 5 6 1 , 9 1 6 1 , 4 4 0 3 , 1 1 7 1 , 7 7 6 1 , 3 4 1 2 3 9 1 4 0 9 9
1 8 5 1 6 8 1 8 1 6 6 1 5 3 1 3 1 9 1 5 4
3 , 1 7 1 1 , 7 4 8 1 , 4 2 2 2 , 9 5 1 1 , 6 2 3 1 , 3 2 8 2 2 0 1 2 5 9 5
U n e m p lo y e d .................................................................................................. 5 0 8 2 8 0 2 2 8 4 1 3 2 3 3 1 8 0 9 5 4 7 4 8
P e r c e n t o f la b o r f o r c e .................................................................... 1 3 . 1 1 2 . 7 1 3 . 7 1 1 . 7 1 1 . 6 1 1 . 8 2 8 . 5 2 5 . 2 3 2 . 8
L o o k in g fo r fu ll -t im e w o r k .......................................................... 2 0 1 4 6 1 8 1 6 3 2 - - 3
L o o k in g fo r p a r t-t im e w o r k ........................................................ 4 8 8 2 6 5 2 2 2 3 9 5 2 1 7 1 7 7 9 3 4 8 4 5
N ot in la b o r f o r c e ........................................................................................ 7 , 4 7 8 3 , 7 6 4 3 , 7 1 4 6 , 4 5 7 3 , 2 8 7 3 , 1 6 9 1 , 0 2 2 4 7 7 5 4 5
M a jor a c t iv i t y : o th e r4 6 5C iv i l i a n la b o r f o r c e ..................................................................................... 6 , 7 1 0 3 , 1 8 4 3 , 5 2 6 5 , 7 1 7 2 , 6 5 6 3 , 0 6 1 9 9 3 5 2 7
E m p lo y e d ........................................................................................................ 6 , 1 6 9 2 , 9 2 6 3 , 2 4 3 5 , 3 4 3 2 , 4 8 7 2 , 8 5 6 8 2 6 4 3 9 3 8 7
A g r i c u l t u r e ............................................................................................. 2 0 3 1 7 2 3 1 1 7 7 1 4 9 2 7 2 6 2 3 3
N o n a g r ic u ltu r a l i n d u s t r i e s ...................................... .................. 5 , 9 6 6 2 , 7 5 4 3 , 2 1 3 5 , 1 6 6 2 , 3 3 8 2 , 8 2 9 8 0 0 4 1 6 3 8 4
U n e m p lo y e d ................................................................................................ 5 4 1 2 5 8 2 8 3 3 7 4 1 6 9 2 0 5 1 6 6 8 8 7 8
P e r c e n t o f la b o r f o r c e ..................................................................... 8 . 1 8 . 1 8 . 0 6 . 5 6 . 4 6 . 7 1 6 . 8 1 6 . 8 1 6 . 8
L o o k in g fo r fu ll - t im e w o r k .......................................................... 5 0 5 2 4 8 2 5 8 3 4 3 1 6 1 ♦ 1 8 2 1 6 2 8 6 7 6
L o o k in g fo r p a r t-t im e w o r k .......................................................... 3 5 1 0 2 5 3 1 8 2 3 4 2 2
N ot in la b o r f o r c e ....................................................................................... 2 , 1 1 0 3 1 4 1 , 7 9 6 1 , 7 2 5 2 3 7 1 , 4 8 8 3 8 5 7 7 3 0 8
A- 6: E m p lo y m e n t status o f the n o n in s t i tu t io n a l p o p u la t io n 16 y e a rs an d o v er by sex, a g e , a n d c o lo r(In thousands)
E m p loym en t s ta tu s an d c o l o rT o t a l M en , 20 y e a r s
a n d o v e rW om en ,
an d <20 y e a r s o v e r
B oth1 6 -1 9
s e x e s ,y e a r s
NOV._____im _______
Nov.1 9 6 8
NOV.1 9 6 9
Nov.1 9 6 8
NOV.1 9 6 9
NOV.1 9 6 8
Nov.1 9 6 9
Nov.1 9 6 8
T o ta l
T o ta l n o n in s t itu t io n a l p o p u l a t i o n ......................................................... 1 3 8 , 7 3 2 1 3 6 , 4 2 0 5 9 , 3 5 7 5 8 , 4 8 9 6 4 , 7 3 0 6 3 , 6 0 7 1 4 , 6 4 5 1 4 , 3 2 4
T o t a l la b o r f o r c e .......................................................................................... 8 4 , 9 2 0 8 2 , 7 0 2 4 9 , 4 6 3 4 8 , 8 8 6 2 8 , 2 1 8 2 7 , 1 6 7 7 , 2 3 9 6 , 6 4 9
P e r c e n t o f p o p u l a t i o n ............................................................................... 6 1 . 2 6 0 . 6 8 3 . 3 8 3 . 6 4 3 . 6 4 2 . 7 4 9 . 4 4 6 . 4
C iv i l i a n la b o r f o r c e .................................................................................. 8 1 , 4 2 7 7 9 , 1 8 5 4 6 , 4 5 1 4 5 , 8 3 2 2 8 , 1 8 8 2 7 , 1 3 9 6 , 7 8 8 6 , 2 1 4
E m p lo y e d ..................................................................................................... 7 8 , 7 1 6 7 6 , 6 0 9 4 5 , 5 4 2 4 4 , 9 8 7 2 7 , 1 9 4 2 6 , 1 8 3 5 , 9 8 0 5 , 4 3 8
A g r i c u l t u r e ............................................................................................ 3 , 3 2 2 3 , 6 0 7 2 , 4 4 7 2 , 7 1 7 5 6 5 6 2 4 3 1 0 2 6 6
N o n a g r ic u ltu r a l i n d u s t r i e s ......................................................... 7 5 , 3 9 5 7 3 , 0 0 1 4 3 , 0 9 4 4 2 , 2 7 1 2 6 , 6 3 0 2 5 , 5 5 8 5 , 6 7 0 5 , 1 7 2U n e m p lo y e d . ............................................................................................. 2 , 7 1 0 2 , 5 7 7 9 0 9 8 4 4 9 9 4 9 5 6 8 0 7 7 7 6
P e r c e n t o f la b o r f o r c e .......................................................................... 3 . 3 3 . 3 2.0 1 . 8 3 . 5 3 . 5 1 1 . 9 1 2 . 5
N o t in la b o r f o r c e ....................................................................................... 5 3 , 8 1 2 5 3 , 7 1 8 9 , 8 9 3 9 , 6 0 3 3 6 , 5 1 2 3 6 , 4 4 0 7 , 4 0 7 7 , 6 7 5
W h ite
T o t a l n o n in s t itu t io n a l p o p u l a t i o n ......................................................... 1 2 3 , 7 8 1 1 2 1 , 8 6 4 5 3 , 3 5 2 5 2 , 6 2 5 5 7 , 7 7 2 5 6 , 8 3 9 1 2 , 6 5 8 1 2 , 4 0 0
T o t a l la b o r f o r c e .......................................................................................... 7 5 , 4 5 5 7 3 , 5 7 1 4 4 , 5 3 0 4 4 , 0 3 3 2 4 , 5 3 5 2 3 , 6 4 0 6 , 3 9 0 5 , 8 9 8
P e r c e n t o f p o p u la t io n ................................................................................ 6 1 . 0 6 0 . 4 8 3 . 5 8 3 . 7 4 2 . 5 4 1 . 6 5 0 . 5 4 7 . 6
C iv i l i a n la b o r f o r c e .................................................................................. 7 2 , 3 3 2 7 0 , 4 2 1 4 1 , 8 3 4 4 1 , 3 0 4 2 4 , 5 0 8 2 3 , 6 1 4 5 , 9 9 0 5 , 5 0 3
E m p l o y e d ..................................................................................................... 7 0 , 1 7 2 6 8 , 4 0 1 4 1 , 0 8 9 4 0 , 6 1 6 2 3 , 7 1 0 2 2 , 8 6 2 5 , 3 7 3 4 , 9 2 3
A g r i c u l t u r e ............................................................................................. 2 , 9 9 4 3 , 2 7 4 2 , 2 0 5 2 , 4 6 0 5 1 9 5 7 1 2 7 1 2 4 3N o n a g r ic u ltu r a l i n d u s t r i e s ......................................................... 6 7 , 1 7 8 6 5 , 1 2 7 3 8 , 8 8 4 3 8 , 1 5 6 2 3 , 1 9 2 2 2 , 2 9 2 5 , 1 0 2 4 , 6 7 9
U n e m p lo y e d ................................................................................................ 2 , 1 6 0 2,020 7 4 5 6 8 8 7 9 8 7 5 2 6 1 7 5 8 0
P e r c e n t o f la b o r f o r c e ........................................................................ 3 . 0 2 . 9 1 . 8 1 . 7 3 . 3 3 . 2 1 0 . 3 1 0 . 5
N ot in la b o r f o r c e ........................................................................................ 4 8 , 3 2 7 4 8 , 2 9 3 8 , 8 2 2 8 , 5 9 2 3 3 , 2 3 7 3 3 , 2 0 0 6 , 2 6 8 6 , 5 0 1
N e g r o a n d o th e r r a c e s
T o t a l n o n in s t itu t io n a l p o p u l a t i o n ......................................................... 1 4 , 9 5 1 1 4 , 5 5 6 6 , 0 0 5 5 , 8 6 4 6 , 9 5 8 6 , 7 6 8 1 , 9 8 8 1 , 9 2 4
T o t a l la b o r f o r c e .......................................................................................... 9 , 4 6 5 9 , 1 3 1 4 , 9 3 3 4 , 8 5 3 3 , 6 8 3 3 , 5 2 7 8 4 9 7 5 0
P e r c e n t o f p o p u l a t i o n ............................................................................... 6 3 . 3 6 2 . 7 8 2 . 2 8 2 . 8 5 2 . 9 5 2 . 1 4 2 . 7 3 9 . 0
C iv i l i a n la b o r f o r c e .................................................................................. 9 , 0 9 4 8 , 7 6 4 4 , 6 1 6 4 , 5 2 8 3 , 6 8 0 3 , 5 2 4 7 9 8 7 1 2
E m p lo y e d ..................................................................................................... 8 , 5 4 4 8 , 2 0 7 4 , 4 5 2 4 , 3 7 1 3 , 4 8 4 3 , 3 2 0 6 0 8 5 1 6
A g r i c u l t u r e ............................................................................................. 3 2 8 3 3 3 2 4 2 2 5 6 4 6 5 4 4 0 2 3N o n a g r ic u ltu r a l in d u s t r i e s ......................................................... 8 , 2 1 6 7 , 8 7 4 4 , 2 1 0 4 , 1 1 5 3 , 4 3 8 3 , 2 6 7 5 6 8 4 9 3
U n e m p lo y e d ............................................................................ .. 5 5 0 5 5 7 1 6 4 1 5 7 1 9 5 2 0 4 1 9 1 1 9 6P e r c e n t o f la b o r f o r c e ................................................. ........................... 6 . 1 6 . 4 3 . 6 3 . 5 5 . 3 5 . 8 2 3 . 9 2 7 . 5
N ot in la b o r f o r c e .............................. .. ...................................................... 5 , 4 8 6 5 , 4 2 5 1 , 0 7 2 1 , 0 1 1 3 , 2 7 5 3 , 2 4 1 1 , 1 3 9 1 , 1 7 4
Digitized for FRASER http://fraser.stlouisfed.org/ Federal Reserve Bank of St. Louis

HOUSEHOLD DATA 56
A- 7: Ful l - a n d p a r t - t i m e status of the c i v i l i a n l a b o r f o r ce by a g e and sex
November 1969(In t h o u s a n d s )
A g e an d s e x
F u ll - t im e la b o r f o r c e P a rt-t im e la b o r f o r c e
T o r a l
E m p lo y e d U n e m p lo y e d ( lo o k in g fo r
fu ll - t im e w ork )
T o t a l
E m p lo y e d on v o lu n ta ry
pa rt t im e !
U n e m p lo y e d ( lo o k in g for
p a r t-t im e w ork )F u l l tim e
s c h e d u le s *
P art tim e for
e c o n o m ic r e a s o n s
N um berP e r c e n t o f
fu ll - t im e la b o r f o r c e
N um berP e r c e n t o f p a r t-t im e
la b o r f o r c e
T O T A L
16 y e a r s and o v e r ........................................................................... 6 9 , 2 9 6 6 5 , 5 1 7 1 , 9 1 6 1 , 8 6 4 2 . 7 1 2 , 1 3 1 1 1 , 2 8 4 8 4 7 7 . 0
16 to 21 y e a r s ............................................................................. 6 , 0 2 1 5 , 1 5 4 3 4 1 5 2 6 8 . 7 4 , 5 5 3 4 , 0 3 0 5 2 3 1 1 . 5
16 to 19 y e a r s ............................................................................. 3 , 0 3 9 2 , 4 5 3 2 4 5 3 4 1 1 1 . 2 3 , 7 4 9 3 , 2 8 2 4 6 6 1 2 . 4
16 and 17 y e a r s ..................................................................... 5 2 7 3 3 5 7 5 1 1 7 2 2 . 2 2 , 4 0 5 2 , 0 7 4 3 3 1 1 3 . 8
18 and 19 y e a r s ..................................................................... 2 , 5 1 3 2 , 1 1 8 1 7 0 2 2 5 8 . 9 1 , 3 4 4 1 , 2 0 8 1 3 5 1 0 . 1
20 y e a r s and o v e r ..................................................................... 6 6 , 2 5 7 6 3 , 0 6 4 1 , 6 7 0 1 , 5 2 2 2 . 3 8 , 3 8 2 8 , 0 0 2 3 8 0 4 . 5
20 to 24 y e a r s ........................................................................ 8 , 5 3 8 7 , 8 9 3 2 2 1 4 2 4 5 . 0 1 , 4 7 0 1 , 3 6 3 1 0 7 7 . 3
25 y e a r s a n d o v e r ................................................................ 5 7 , 7 1 9 5 5 , 1 7 1 1 , 4 4 9 1 , 0 9 8 1 . 9 6 , 9 1 2 6 , 6 3 9 2 7 3 3 . 9
25 to 54 y e a r s .................................................................. 4 5 , 7 4 6 4 3 , 8 2 5 1 , 0 2 5 8 9 6 2 . 0 4 , 4 7 0 4 , 2 7 0 2 0 0 4 . 5
55 y e a r s and o v e r .......................................................... 1 1 , 9 7 2 1 1 , 3 4 6 4 2 5 2 0 2 1 . 7 2 , 4 4 2 2 , 3 6 9 7 3 3 . 0
M A L E
16 y e a r s and o v e r ........................................................................... 4 5 , 7 9 8 4 3 , 8 4 8 9 6 7 9 8 4 2 . 1 4 , 2 6 9 3 , 9 2 4 3 4 5 8 . 1
16 to 21 y e a r s ............................................................................. 2 , 9 3 5 2 , 5 0 7 1 6 6 2 6 2 8 . 9 2 , 4 4 5 2 , 1 6 9 2 7 6 1 1 . 3
16 to 19 y e a r s ............................................................................. 1 , 5 6 0 1 , 2 5 9 1 2 8 1 7 3 1 1 . 1 2 , 0 5 6 1 , 8 1 0 2 4 6 1 2 . 0
20 y e a r s and o v e r ..................................................................... 4 4 , 2 3 8 4 2 , 5 8 9 8 3 9 8 1 0 1 . 8 2 , 2 1 3 2 , 1 1 4 9 9 4 . 5
2 0 to 24 y e a r s ........................................................................ 4 , 5 7 8 4 , 2 6 2 1 0 8 2 0 7 4 . 5 6 9 5 6 4 4 5 1 7 . 4
25 y e a r s a n d o v e r ................................................................ 3 9 , 6 6 0 3 8 , 3 2 7 7 3 1 6 0 3 1 . 5 1 , 5 1 8 1 , 4 7 0 4 8 3 . 2
25 to 54 y e a r s .................................................................. 3 1 , 4 1 7 3 0 , 4 8 3 4 7 0 4 6 4 1 . 5 4 8 6 4 7 3 1 5 3 . 1
55 y e a r s an d o v e r .......................................................... 8 , 2 4 3 7 , 8 4 4 2 6 0 1 3 9 1 . 7 1 , 0 2 9 9 9 6 3 3 3 . 2
F E M A L E
16 y e a r s an d o v e r ........................................................................... 2 3 , 4 9 8 2 1 , 6 6 9 9 4 9 8 8 0 3 . 7 7 , 8 6 2 7 , 3 6 0 5 0 1 6 . 4
16 to 21 y e a r s ............................................................................. 3 , 0 8 6 2 , 6 4 7 1 7 5 2 6 3 8 . 5 2 , 1 0 8 1 , 8 6 1 2 4 8 1 1 . 7
16 to 19 y e a r s ............................................................................. 1 , 4 7 9 1 , 1 9 4 1 1 7 1 6 8 1 1 . 4 1 , 6 9 2 1 , 4 7 3 2 2 0 1 3 . 0
20 y e a r s and o v e r ..................................................................... 2 2 , 0 1 9 2 0 , 4 7 5 8 3 2 7 1 2 3 . 2 6 , 1 7 0 5 , 8 8 8 2 8 2 4 . 6
20 to 24 y e a r s ........................................................................ 3 , 9 6 0 3 , 6 3 0 1 1 3 2 1 7 5 . 5 7 7 4 7 1 8 5 6 7 . 2
25 y e a r s and o v e r ................................................................ 1 8 , 0 5 9 1 6 , 8 4 5 7 1 9 4 9 5 2 . 7 5 , 3 9 6 5 , 1 7 0 2 2 6 4 . 2
25 to 54 y e a r s .................................................................. 1 4 , 3 3 0 1 3 , 3 4 4 5 5 5 4 3 2 3 . 0 3 , 9 8 1 3 , 7 9 6 1 8 5 4 . 6
55 y e a r s an d o v e r .......................................................... 3 , 7 2 8 3 , 5 0 2 1 6 3 6 3 1 . 7 1 , 4 1 4 1 , 3 7 3 4 1 2 . 9
Digitized for FRASER http://fraser.stlouisfed.org/ Federal Reserve Bank of St. Louis

57 HOUSEHOLD DATA
A- 8: U n e m p l o y e d persons by sex a nd a g e
A g e
M a le F e m a le
T h o u s a n d s o f p e r s o n s
U n em p loy m en tr a te s
T h o u s a n d s o f p e r s o n s
U n em p lo y m e n tr a te s
Nov.1 9 6 9
Nov.1 9 6 8
Nov.1 9 6 9
Nov.1 9 6 8
Nov.1 9 6 9
Nov.1 9 6 8
N o v .1 9 6 9
Nov.1 9 6 8
T o t a l , 16 y e a r s and o v e r ......................................................... 1 , 3 2 9 1 , 2 2 9 2 . 7 2 . 5 1 , 3 8 1 1 , 3 4 7 4 . 4 4 . 5
16 t o 19 y e a r s ............................................................................. 4 2 0 3 8 5 1 1 . 6 1 1 . 4 3 8 8 3 9 1 1 2 . 2 1 3 . 716 and 17 y e a r s .................................................................... 2 3 8 2 1 2 1 4 . 5 1 4 . 3 2 0 9 1 6 6 1 6 . 2 1 5 . 318 and 19 y e a r s .................................................................... 1 8 1 1 7 3 9 . 2 9 . 2 1 7 9 2 2 5 9 . 5 1 2 . 8
2 0 y e a r s and o v e r .................................................................... 9 0 9 8 4 4 2 . 0 1 . 8 9 9 4 9 5 6 3 . 5 3 . 52 0 t o 2 4 y e a r s ....................................................................... 2 5 9 2 2 0 4 . 9 4 . 4 2 7 3 2 7 5 5 . 8 6 . 225 y e a r s and o v e r ............................................................... 6 5 0 6 2 4 1 . 6 1 . 5 7 2 1 6 8 2 3 . 1 3 . 0
25 t o 34 y e a r s .................................................................. 2 0 8 1 6 1 1 . 9 1 . 5 2 5 2 2 1 9 4 . 5 4 . 135 t o 4 4 y e a r s .................................................................. 1 2 7 1 3 6 1 . 2 1 . 3 2 1 1 2 0 2 3 . 5 3 . 345 t o 5 4 y e a r s .................................................................. 1 4 3 1 5 6 1 . 4 1 . 5 1 5 4 1 3 2 2 . 3 2 . 155 to 6 4 y e a r s .................................................................. 1 2 3 1 1 5 1 . 7 1 . 6 8 9 8 9 2 . 2 2 . 2
55 t o 5 9 y e a r s ............................................................ 8 4 6 7 2 . 0 1 . 6 6 6 5 4 2 . 6 2 . 26 0 t o 6 4 y e a r s ............................................................ 3 9 4 8 1 . 3 1 . 7 2 2 3 6 1 . 5 2 . 3
65 y e a r s and o v e r .......................................................... 4 9 5 6 2 . 3 2 . 6 1 5 4 0 1 . 4 3 . 8
H o u s e h o ld h e a d , 16 y e a r s and o v e r ................................. 6 1 6 6 0 2 1 . 5 1 . 5 1 9 9 2 2 4 3 . 1 3 . 616 to 24 y e a r s ............................................................................. 9 0 7 0 2 . 9 2 . 3 3 4 2 8 5 . 1 5 . 125 t o 54 y e a r s ............................................................................. 3 6 4 3 7 0 1 . 2 1 . 3 1 1 4 1 2 4 3 . 1 3 . 555 y e a r s an d o v e r .................................................................... 1 6 1 1 6 2 1 . 8 1 . 8 5 0 7 2 2 . 3 3 . 3
A- 9: U n e m p lo y e d pe rs ons by m a r i t a l s ta tu s , sex, a g e , a n d co lor
M arita l s ta tu s , a g e , and c o l o r
M a le F e m a le
T h o u s a n d s o f p e r s o n s
U n em p loy m en tr a te s
T h o u s a n d s o f p e r s o n s
U n em p loy m en tr a te s
Nov.1969
Nov.1968
Nov.1969
Nov.1968
Nov.1969
Nov.1968
Nov.1969
Nov.1968
T o t a l , 16 y e a r s and o v e r .......................................................................... 1,329 1,229 2.7 2.5 1,381 1,347 4.4 4.5
M a rried , s p o u s e p r e s e n t ....................................................... .. ........................... 535 546 1.4 1.4 723 648 3.9 3.7W id o w e d , d iv o r c e d , o r s e p a r a t e d .................................................................. 95 99 3.6 3.8 213 243 3.6 4.3S in g le (n e v e r m a r r ie d ) ........................................................................................... 699 584 8.1 7.2 446 456 6.4 6.9
T o t a l , 20 to 6 4 y e a r s o f a g e .................................................................. 860 788 1.9 1.8 979 916 3.6 3.5M a rried , s p o u s e p r e s e n t ..................................................................................... 485 481 1.3 1.3 662 579 3.7 3.4W id ow ed , d iv o r c e d , o r s e p a r a t e d .................................................................. 83 89 3.6 3.9 184 202 3.6 4.0S in g le (n e v e r m a r r ie d ) .......................................................................................... 291 219 5.6 4.5 132 136 3.2 3.4
W h ite , 16 y e a r s and o v e r ............................................................................... 1,062 972 2.4 2.2 1,098 1,048 4.0 4.0M a rried , s p o u s e p r e s e n t ..................................................................................... 459 466 1.3 1.3 618 547 3.7 3.5W id o w e d , d iv o r c e d , o r s e p a r a t e d .................................................................. 71 68 3.4 3.4 149 171 3.2 3.8S in g le (n e v e r m a r r ie d ) .......................................................................................... 532 438 7.1 6.2 331 331 5.4 5.7
W hite, 20 to 6 4 y e a r s o f a g e ..................................................................... 699 639 1.8 1.6 782 716 3.3 3.2
M a rried , s p o u s e p r e s e n t ..................................................................................... 414 414 1.2 1.2 567 493 3.6 3.2W id o w e d , d iv o r c e d , o r s e p a r a t e d .................................................................. 61 59 3.3 3.4 121 135 3.0 3.4S in g le (n e v e r m a r r ie d ) .......................................................................................... 224 166 5.0 3.9 94 88 2.6 2.5
N e g r o a n d o th e r r a c e s , 16 y e a r s a n d o v e r ...................................... 266 257 5.3 5.2 284 299 7.1 7.8
M a rried , s p o u s e p r e s e n t ..................................................................................... 76 80 2.2 2.4 106 101 5.2 5.4W id o w e d , d iv o r c e d , or s e p a r a t e d .................................................................. 24 31 4.3 5.5 64 72 5.6 6.2S in g le (n e v e r m a r r ie d ) .......................................................................................... 167 146 14.5 13.9 114 126 13.3 15.8
N e g r o a n d o th e r r a c e s , 20 to 6 4 y e a r s o f a g e .............................. 161 150 3.6 3.4 195 200 5.4 5.8
M a rried , s p o u s e p r e s e n t ..................................................................................... 72 66 2.2 2.1 95 86 4.8 4.8W id ow ed , d iv o r c e d , o r s e p a r a t e d .................................................................. 23 31 4.5 6.0 62 67 5.7 6.2S in g le (n e v e r m a r r ie d ) .......................................................................................... 67 53 9.4 8.1 38 47 7.0 8.8
Digitized for FRASER http://fraser.stlouisfed.org/ Federal Reserve Bank of St. Louis

HOUSEHOLD DATA 58
A -10 : U n e m p l o y e d p er sons by o c c u p a t i o n o f l a s t j o b a n d sex
O c c u p a t io n
T h o u s a n d s Unemployment ratesor p e r s o n s
T o ta l Male Female
Nov.1969
Hov.1968
Nov.1969
Nov.1968
Nov.1969
Nov.1968
Nov.1969
Nov.1968
T o t a l ................................................................................................................... 2,710 2,577 3.3 3.3 2.7 2.5 4.4 4.5
W h ite -c o l la r w o r k e r s ................................................................................................ 784 709 2.0 1.9 1.1 1.1 3.0 2.9P r o f e s s i o n a l and t e c h n i c a l .......................................................................... 116 108 1.0 1.0 .9 1.0 1.3 1.0M a n a g e rs , o f f i c i a l s , and p r o p r i e t o r s .................................................... 76 74 .9 .9 .7 .7 1.9 2.2C le r i c a l w o r k e r s .................................................................................................. 479 401 3.4 3.0 2.4 1.8 3.7 3.4S a le s w o r k e r s ........................................................................................................ 113 126 2.3 2.6 1.2 1.2 3.6 4.3
B lu e - c o l la r w o r k e r s ............................................................................................... 1,142 1,025 3.9 3.6 3.4 3.2 6.2 5.5C ra ftsm e n and fo r e m e n ..................................................................................... 204 213 1.9 2.0 1.9 2.0 2.0 2.2
C a r p e n te r s and o th e r c o n s t r u c t io n c r a f t s m e n ............................ 103 96 3.5 3.3 3.4 3.3 (1)A ll o t h e r ............................................................................................................. 101 117 1.3 1.6 1.3 1.5 1.4 2.3
O p e r a t iv e s ................................................................................................................ 671 563 4.4 3.9 3.5 3.1 6.4 5.6D r iv e r s a n d d e l i v e r y m e n ........... .............................................................. 65 68 2.4 2.6 2.5 2.7 1.1 (1)A ll o th e r ................................................................................................................ 606 495 4.9 4.2 3.8 3.2 6.5 5.7
N on farm la b o r e r s .................................................................................................. 267 249 6.9 6.7 6.8 6.5 9.2 11.9C o n s tr u c t io n la b o r e r s .................................................................................. 78 91 9.6 11.1 9.4 11.2 (1) (1)A ll o t h e r ............................................................................................................ 189 158 6.2 5.5 6.1 5.2 7.8 12.4
S e r v ic e w o rk e rs . ........................................................................................................ 391 418 3.9 4.2 3.7 3.5 4.0 4.6P r iv a te h o u s e h o ld ......................................... .. ................................................... 58 57 3.3 3.1 (1) 3.6 3.3 3.1A ll o th e r ..................................................................................................................... 333 361 4.0 4.5 3.7 3.5 4.3 5.2
F a rm ers and farm la b o r e r s .................................................................................. 53 49 1.8 1.5 1.7 .9 2.3 4.4
N o p r e v io u s w ork e x p e r i e n c e .......................................................................... 339 375 _ __ _ _
16 to 19 y e a r s ........................................................................................................ 276 297 — - - - - - - ___ _20 to 24 y e a r s .............. , ...................................................................................... 35 53 — — - - — _ _ _25 y e a r s and o v e r ................................................................................................
l ... . " ____ ................................. ...— 7 7 729 26 — — - - - - 1 —
Percent not shown where base is less chan 100,000
A - 11: U n e m p lo y e d p e rs o n s by in d u s t r y o f la s t jo b a n d sex
In d u s try T o t a l M a le F e m a le
Nov.1969
Nov.1968
Nov.1969
Nov.1968
Nov.1969
Nov.1968
Nov.1969
Nov.1968
T o t a l ' . ..................................................................................................................... 100.0 100.0 3.3 3.3 2.7 2.5 4.4 4.5
P r iv a te w a g e and s a la r y w o r k e r s .................................................................. 75.2 73.4 3.4 3.3 2.8 2.6 4.4 4.4M in in g ........................................................................................................................... .5 .6 2.9 3.0 3.2 2.9 - - (1)
7.2 8.5 5.2 6.1 5.2 6.2 5.1 3.5
M a n u f a c t u r in g ........................................................................................................ 27.7 24.6 3.5 3.0 2.6 2.3 5.6 4.8D u ra b le g o o d s ..................................................................................... ............. 15.7 13.7 3.4 2.8 2.6 2.4 5.9 4.6
P rim ary m e ta l i n d u s t r i e s .................................................................... 1.0 2.2 2.2 4.6 1.9 4.6 5.1 (1)F a b r ic a t e d m e ta l p r o d u c t s .................................................................. 1.8 1.5 2.8 2.3 2.1 1.6 5.5 4.5M a c h in e r y ........................................................................................................ 2.3 1.4 2.7 1.7 2.4 1.4 3.9 3.5E le c t r i c a l e q u ip m e n t ................................................................................ 3.0 2.6 3.8 3.3 2.3 2.0 6.0 5.2M otor v e h i c l e s an d e q u ip m e n t .......................................................... 1.4 .6 3.1 1.4 2.7 1.2 6.6 4.0A ll o th e r t r a n s p o r ta t io n e q u ip m e n t ............................................... 2.4 1.4 4.9 2.5 3.5 2.4 13.0 3.3O th er d u r a b le g o o d s i n d u s t r i e s ....................................................... 3.8 3.9 3.9 3.7 3.4 3.2 5.1 4.7
N o n d u ra b le g o o d s ........................................................................................... 12.0 10.9 3.7 3.3 2.6 2.2 5.4 5.0F o o d and k in d re d p r o d u c t s .................................................................. 2.8 3.0 4.2 4.3 3.5 3.2 6.1 7.2T e x t i l e m il l p r o d u c t s ............................................................................. 1.7 1.1 4.7 2.6 3.5 1.4 5.9 4.0A p p a r e l and o th e r f in i s h e d t e x t i l e p r o d u c t s ......................... 3.2 2.8 6.1 5.2 9.0 3.9 5.4 5.5O th er n o n d u ra b le g o o d s i n d u s t r i e s ............................................... 4.2 4.0 2.6 2.4 1.5 1.7 4.8 4.1
T r a n s p o r ta t io n and p u b lic u t i l i t i e s .......................................................... 4.0 3.5 2.3 2.1 2.1 1.7 2.7 3.2R a il r o a d s a n d r a ilw a y e x p r e s s ............................................................ .3 .3 1.1 1.3 .9 1.4 (1) (1)O th er t r a n s p o r t a t i o n ..................................................................................... 2.4 1.9 3.2 2.6 3.1 2.6 3.9 2.5C o m m u n ic a t io n a n d o th e r p u b l ic u t i l i t i e s .................................... 1.3 1.2 1.7 1.8 1.4 .6 2.1 3.6
W h o le s a le an d r e t a i l t r a d e ............................................................................. 18.2 19.0 3.7 3.8 2.8 2.3 4.9 5.8F in a n c e , in s u r a n c e , and r e a l e s t a t e ....................................................... 2.4 3.1 1.8 2.4 1.4 1.4 2.3 3.4S e r v ic e in d u s t r i e s ................................................................................................ 15.2 14.1 3.4 3.1 2.8 2.7 3.8 3.4
P r o f e s s i o n a l s e r v i c e s .................................................................................. 4.1 4.2 1.9 2.0 1.3 1.5 2.2 2.2A ll o th e r s e r v i c e in d u s t r ie s .................................................................. 11.1 9.9 4.9 4.2 4.0 3.6 5.5 4.6
2.4 2.6 6.0 5.3 5.7 3.2 7.4 15.1A l l oth er c l a s s e s o f w o r k e r s ............................................................................. 9.8 9.4 1.3 1.2 .9 1.0 1.9 1.6N o p r e v io u s w o rk e x p e r i e n c e ............................................................................. 12.5
I__________14.6 “ *
U n em p loy m en t r a t e s '
Digitized for FRASER http://fraser.stlouisfed.org/ Federal Reserve Bank of St. Louis

5 9 HOUSEHOLD DATA
A-12: Unemployed persons by reason for unemployment , sfex, age , a nd color
Reason for unemployment
Totalunemployed
Male, 20 years and over
Female, 20 years and over
Both sexes, 16 to 19 years
White N egro and other ra ces
Nov.1969
Nov.1968
Nov.1969
Nov.1968
Nov.1969
Nov.1968
Nov.1969
Nov.1968
Nov.1969
Nov.1968
Nov.1969
Nov.1968
Unemployment level
Total unemployed, in thousands................ 2,710 2,577 909 844 994 956 807 776 2,160 2,020 550 557Lost last j o b ........................................... 939 866 524 502 309 270 106 114 759 666 180 220Left last job ............................................. 421 415 141 139 183 170 97 106 345 341 76 74Reentered labor force ............................. 1,011 900 226 182 457 458 328 260 779 722 232 178Never worked before................................ 339 375 18 20 45 58 276 297 276 291 63 84
Total unemployed, percent distribution . . 100.0 100.0 100.0 100.0 100.0 100.0 100.0 100.0 100.0 100.0 100.0 100.0Lost last job............................................. 34.6 34.3 57.6 59.5 31*1 28.2 13.2 14.7 35.1 33.0 32.7 39.5Left last job ............................................. 15.5 16.1 15.5 16.5 18.4 17.8 12.0 13.6 16.0 16.9 13.7 13.3Reentered labor force ............................. 37.3 34.9 24.9 21.6 46.0 47.9 40.6 33.5 36.1 35.7 42.1 32.1Never worked before................................ 12.5 14.6 2.0 2.4 4.6 6.1 34.2 38.3 12.8 14.4 11.4 15.1
Unemployment rate
Total unemployment rate............................. 3.3 3.3 2.0 1.8 3.5 3.5 11.9 12.5 3.0 2.9 6.1 6.4]ob-loser rate1........................................... 1.2 1.1 1.2 1.1 1.1 1 . 0 1.6 1.8 1.1 .9 1.9 2.5Job-leaver rate1........................................ .5 .5 .3 .3 .6 .6 1.4 1.7 .5 .5 .8 .8Reentrant ra te '........................................ 1.2 1.1 .5 .4 1.6 1.7 4.8 4.2 1.1 1 . 0 2.5 2.0New entrant rate1..................................... .4 .5 — .2 .2 4.1 4.8 .4 .4 .7 1 . 0
'Unemployment rates are calculated as a percent of the civilian labor force.
A-13: Unemployed persons by reason for unemployment , durat ion, sex, and ageNovember 1969
(Percent distribution)
Reason, sex, and age
Total unemployed Duration of unemployment
Thousands of persons Percent Less than
5 weeks5 to 14 weeks
15 weeks and over
15 to 26 weeks
27 weeks and over
Total, 16 years and over . . . . 2,710 100.0 57.4 30.7 11.9 7.3 4.6Lost last job ........................... 939 100.0 55.4 29.3 15.3 9.9 5.4Left last jo b ........................... 421 100.0 57.7 31.6 10.7 6.4 4.3Reentered labor fo r ce ........... 1,011 100.0 60.1 31.3 8.7 4.8 3.9Never worked before............. 339 100.0 54.1 32.2 13.6 9.2 4.4
Male, 20 years and ov e r ........... 909 100.0 53.7 30.5 15.7 9.0 6.7Lost last job ........................... 524 100.0 54.2 29.0 16.8 10.7 6.1Left last jo b ........................... 141 100.0 56.3 29.6 14.0 7.0 7.0Reentered labor fo r c e ........... 226 100.0 52.9 33.9 13.2 6.6 6.6Never worked before.............. 18 100.0 (1) (1) (1) (1) (1)
Female, 20 years and over . . . 994 100.0 59.9 29.4 10.6 6.1 4.5Lost last job ........................... 309 100.0 53.4 30.4 16.2 10.4 5.8Left last job 183 100.0 50.8 39.3 9.8 7.1 2.7Reentered labor fo r ce ........... 457 100.0 69.1 24.1 6.8 2.6 4.2Never worked before.............. 45 100.0 (1) (1) (1) (1) (1)
Both sexes, 16 to 19 years . . . 807 100.0 58.3 32.5 9.2 6.8 2.4Lost last job ........................... 106 100.0 67.6 26.9 5.5 4.6 .9Left last jo b ........................... 97 100.0 (1) (1) (1) (1) (1)Reentered labor fo r c e ........... 328 100.0 52.9 39.4 7.6 6.1 1.5Never worked before............. 276 100.0 56.0 31.0 12.9 9.7 3.2
'Percent not shown where base is less than 100,000.
Digitized for FRASER http://fraser.stlouisfed.org/ Federal Reserve Bank of St. Louis

HOUSEHOLD DATA 6 0
A-14: U n e m p l o y e d p e rs ons by d u r a t i o n o f u n e m p l o y m e n t
T otal H ousehold head
Duration o f unemployment Thousands P ercen t d istribution Thousands P ercen t d istribution
Nov. Nov. Nov. Nov. Nov. Nov. Nov. Nov.1969 1968 1969 1968 1969 1968 1969 1968
T o ta l............................................................................................................... 2,710 2,577 100.0 100.0 815 826 100.0 100.0
L e s s than 5 w eeks ....................................................................................... 1,555 1,567 57.4 60.8 430 495 52.8 59.95 to 14 w e e k s ................................................................................................. 833 718 30.7 27.9 247 222 30.3 26.8
5 to 10 w e e k s ............................................................................................ 652 527 24.1 20.5 201 155 24.7 18.811 to 14 w e e k s ......................................................................................... 181 192 6.7 7.5 46 66 5.6 8.0
15 w eeks and o v e r ....................................................................................... 322 292 11.9 11.3 138 110 16.9 13.315 to 26 w e e k s ......................................................................................... 198 179 7.3 6.9 72 53 8.8 6.427 w eeks and o v e r ............................. .................................................... 124 112 4.6 4.3 66 56 8.1 6.8
Average (m ean) d u ra t io n .......................................................................... 7.8 7.9 - 9.7 9.7 -
A-15: U n e m p l o y e d p e rs o n s by d u r a t i o n , sex, a g e , co lo r , a n d m a r i t a l s t atus
November 1969
Thousands o f persons
S ex, age , c o lo r , and marital statusT otal
L e s s than
5 w eeks5 to 14 w eeks
15 to 26 w eeks
27 w eeks and over .
L e s s than 5 w eeks as a percent o f unem ployed
in group
15 w eeks and over as a percent o f unem ployed
in group
N o v .1969
N o v .1968
N o v .1969
N o v .1968
T o ta l .................................................................................................. 2 ,7 1 0 1 ,5 5 5 8 33 198 124 5 7 .4 6 0 .8 1 1 .9 1 1 .316 to 21 y e a r s ................................................................................... 1 ,0 4 9 607 352 70 19 5 7 .8 6 3 .0 8 .6 8 .316 to 19 years .................................................................................. 807 471 263 55 18 5 8 .3 6 1 .6 9 .1 8 .120 to 24 years .................................................................................. 531 310 182 26 14 5 8 .4 6 5 .5 7 .4 8 .025 to 44 years .................................................................................. 798 4 84 225 45 45 6 0 .7 6 0 .6 1 1 .3 1 2 .045 years and ov er ............................................................................. 573 290 164 73 46 5 0 .7 5 6 .0 2 0 .8 1 7 .4
M ale.................................................................................................... 1 ,3 2 9 739 407 115 67 5 5 .6 5 8 .7 1 3 .7 1 1 .116 to 21 years .................................................................................. 538 317 173 41 8 5 8 .9 6 0 .5 9 .0 6 .516 to 19 years .................................................................................. 4 20 251 129 33 7 5 9 .7 6 0 .7 9 .5 6 .820 to 24 years .................................................................................. 259 153 85 16 5 5 9 .0 6 0 .4 8 .2 7 .325 to 44 years .................................................................................. 335 194 97 22 21 5 7 .9 6 3 .3 1 2 .8 9 .445 years and ov er ............................................................................. 315 142 95 44 34 4 5 .0 5 1 .1 2 4 .8 2 0 .4
F e m a le .............................................................................................. 1 ,3 8 1 816 426 83 56 5 9 .0 6 2 .7 1 0 .1 1 1 .516 to 21 years .................................................................................. 511 290 180 30 12 5 6 .7 6 5 .3 8 .1 9 .916 to 19 years .................................................................................. 388 220 134 22 12 5 6 .8 6 2 .5 8 .7 9 .520 to 24 years .................................................................................. 273 157 97 10 8 5 7 .8 6 9 .7 6 .7 8 .525 to 44 years .................................................................................. 463 290 127 23 25 6 2 .6 5 8 .7 1 0 .4 1 4 .045 years and over............................................................................. 258 149 69 28 12 5 7 .6 6 2 .3 1 5 .8 1 3 .7
White: T o t a l ......................................................................................... 2 ,1 6 0 1 ,2 6 7 649 150 94 5 8 .6 6 2 .1 1 1 .3 1 1 .2M a le ................. ' . ....................................................................... 1 ,0 6 2 593 319 91 59 5 5 .9 6 0 .9 1 4 .1 1 1 .2F e m a le ....................................................................................... 1 ,0 9 8 673 330 60 35 6 1 .4 6 3 .2 8 .6 - 1 1 .3
Negro and other races: T o t a l ........................................................ 550 288 184 48 30 5 2 .4 5 6 .2 1 4 .2 1 1 .6Male ....................................................... 266 146 88 24 8 5 4 .8 5 0 .5 , 1 2 .3 1 0 .9F e m a le ................................................... 284 142 96 23 22 5 0 .1 6 1 .2 1 5 .9 1 2 .2
Male: Married, w ife p r e s e n t .......................................................... 535 286 160 49 40 5 3 .4 5 9 .4 1 6 .6 1 3 .6W idowed, d ivorced , or s ep a ra ted .................................... 95 53 22 12 7 ( 1 ) ( 1 ) ( 1 ) ( 1 )Single (never married) ........................................................ 699 401 224 54 20 5 7 .3 5 8 .2 1 0 .6 7 .8
Female: Married, husband p re se n t .............................................. 723 4 63 196 39 25 6 4 .0 6 4 .6 8 .9 1 0 .9W idowed, d iv orced , or separated............................... 213 116 63 19 15 5 4 .4 6 5 .9 1 6 .0 8 .6Single (never m a r r ie d ) ................................................... 446 237 167 25 16 5 3 .2 5 8 .4 9 .3 1 3 .9
^Percent not shown where base is less than 100,000.
Digitized for FRASER http://fraser.stlouisfed.org/ Federal Reserve Bank of St. Louis

61 HOUSEHOLD DATA
A -16: U n e m p l o y e d p e rs o ns by d u r a t i o n , o c c u p a t i o n , a n d i n d u s t r y o f l a s t j obNovember 1969
O ccu pation and industry
T housands o f persons L e s s than 5 w eeks as a percent o f
unem ployed in group
15 w eeks and over as a percent
o f unem ployed in group
T otalL e s s than 5 w eeks
*> to 14 w eeks
15 to 26 w eeks
27 w eeks and over
Nov.1969
Nov.1968
Nov.1969
Nov.1968
OCCUPATION
W hite-collar w ork ers ........................................................................ 784 435 249 56 45 55.4 57.7 12.8 13.2P ro fession a l and m a n a g er ia l.................................................. 192 93 57 25 16 48.4 51.6 21.4 16.5C lerica l w o r k e r s .......................................................................... 479 270 160 28 20 56.4 60.7 10.2 12.5S ales w orkers.................................................................................. 113 72 31 3 8 63.1 57.0 9.2 10.2
B lu e-co lla r w orkers.......................................................................... 1,142 690 321 82 48 60.4 62.4 11.4 10.9Craftsmen and forem en .............................................................. 204 134 47 19 4 65.7 67.7 11.4 11.2O p e r a t iv e s ...................................................................................... 671 399 186 51 36 59.4 58.5 12.8 12.4Nonfarm la b o re rs .......................................................................... 267 157 88 12 9 59.0 66.6 8.0 7.1
Service w ork ers ................................................................................. 391 211 139 26 15 54.0 60.1 10.4 8.9INDUSTRY 1
A g ricu ltu re ........................................................................................... 72 50 16 4 1 (2) (2) (2) (2)C onstruction ......................................................................................... 211 130 60 9 12 61.6 72.7 9.9 9.5M anufacturing...................................................................................... 752 424 215 69 44 56.3 56.0 15.1 13.4
Durable g o o d s ............................................................................... 428 237 119 45 28 55.3 57.3 16.9 11.8Nondurable g o o d s ........................................................................ 324 187 96 24 17 57.7 54.4 12.7 15.5
Transportation and pu b lic u t il it ie s ........................................... 115 65 41 6 2 56.9 (2) 7.6 (2)W holesale and retail tra d e ............................................................ 497 278 177 28 14 55.9 62.6 8.6 9.4F inance and serv ice in d u stries .................................................. 580 344 173 39 23 59.3 59.5 10.7 9.9P u b lic adm inistration ................................................................... 99 48 34 11 6 (2) (2) (2) (2)
No previous work ex p er ien ce ....................................................... 339 183 109 31 15 54.0 60.0 13.7 12.6* Includes wage and salary workers only.*Percent not shown where base is less than 100,000.
A-17: E m p l o y e d p e r s o n s by sex a n d a g e(In t h o u s a n d s )
Age and type o f industryTotal Male Fem ale
Nov.1969
Nov.1968
Nov.1969
Nov.1968
Nov.1969
Nov.1968
All in dustries............................................................................................................. 7 8 ,7 1 6 7 6 ,6 0 9 4 8 ,7 3 9 4 7 ,9 6 9 2 9 ,9 7 8 2 8 ,6 3 916 to 19 y e a r s ................................................................................................................. 5 ,9 8 0 5 ,4 3 8 3 ,1 9 7 2 ,9 8 2 2 ,7 8 3 2 ,4 5 7
16 and 17 y e a r s .......................................................................................................... 2 ,4 8 4 2 ,1 9 1 1 ,4 0 5 1 ,2 7 4 1 ,0 7 9 91618 and 19 y e a r s .......................................................................................................... 3 ,4 9 7 3 ,2 4 8 1 ,7 9 2 1 ,7 0 7 1 ,7 0 5 1 ,5 4 0
20 to 24 y e a r s ................................................................................................................. 9 ,4 7 7 8 ,8 9 0 5 ,0 1 5 4 ,7 5 9 4 ,4 6 2 4 ,1 3 025 to 54 y e a r s ................................................................................................................. 4 9 ,1 2 1 4 8 ,2 9 1 3 1 ,4 2 6 3 1 ,1 8 6 1 7 ,6 9 4 1 7 ,1 0 5
25 to 34 y e a r s ............................................................................................................ 1 6 ,1 0 2 1 5 ,6 8 3 1 0 ,7 9 0 1 0 ,5 3 6 5 ,3 1 2 5 ,1 4 735 to 44 y e a r s ............................................................................................................ 1 6 ,2 9 3 1 6 ,3 2 5 1 0 ,3 8 9 1 0 ,4 9 6 5 ,9 0 4 5 ,8 2 945 to 54 y e a r s ............................................................................................................ 1 6 ,7 2 5 1 6 ,2 8 3 1 0 ,2 4 7 1 0 ,1 5 4 6 ,4 7 9 6 ,1 2 9
55 to 64 y e a r s ................................................................................................................. 1 0 ,9 7 0 1 0 ,8 6 0 6 ,9 7 8 6 ,9 3 0 3 ,9 9 3 3 ,9 3 055 to 59 y e a r s ............................................................................................................ 6 ,5 8 9 6 ,4 6 4 4 ,1 1 7 4 ,0 6 9 2 ,4 7 2 2 ,3 9 460 to 64 y e a r s ............................................................................................................ 4 ,3 8 1 4 ,3 9 6 2 ,8 6 1 2 ,8 6 0 1 ,520 1,536
65 years and over .......................................................................................................... 3 ,1 6 8 3 ,1 3 0 2 ,1 2 3 2 ,1 1 2 1 ,0 4 6 1 ,0 1 7
Nonagricultural industries .................................................................................... 7 5 ,3 9 5 7 3 ,0 0 1 4 6 ,0 1 7 4 5 ,0 0 7 2 9 ,3 7 8 2 7 ,9 9 416 to 19 y e a r s ................................................................... ............................................ 5 ,6 7 0 5 ,1 7 2 2 ,9 2 2 2 ,7 3 6 2 ,7 4 8 2 ,4 3 6
16 and 17 y e a r s .......................................................................................................... 2 ,2 9 6 2 ,0 5 3 1 ,2 4 0 1 ,1 4 7 1 ,0 5 5 90618 and 19 y e a r s .......................................................................................................... 3 ,3 7 5 3 ,1 1 9 1 ,6 8 2 1 ,5 8 9 1 ,6 9 3 1 ,5 3 0
20 to 24 y e a r s ................................................................................................................. 9 ,2 7 9 8 ,6 6 5 4 ,8 5 0 4 ,5 7 9 4 ,4 2 9 4 ,0 8 625 to 54 y e a r s ................................................................................................................. 4 7 ,4 1 3 4 6 ,3 8 0 3 0 ,1 1 7 2 9 ,6 9 4 1 7 ,2 9 6 1 6 ,6 8 6
25 to 34 y e a r s ............................................................................................................ 1 5 ,6 5 5 1 5 ,1 6 7 1 0 ,4 4 6 1 0 ,1 3 7 5 ,2 1 0 5 ,0 3 035 to 44 y e a r s ............................................................................................................. 1 5 ,7 0 9 1 5 ,6 9 3 9 ,9 5 3 1 0 ,0 0 2 5 ,7 5 6 5 ,6 9 045 to 54 y e a r s ............................................................................................................ 1 6 ,0 4 9 1 5 ,5 2 1 9 ,7 1 9 9 ,5 5 5 6 ,3 3 0 5 ,9 6 6
55 to 64 y e a r s ................................................................................................................. 1 0 ,3 0 6 1 0 ,1 2 7 6 ,4 0 7 6 ,3 1 9 3 ,8 9 9 3 ,8 0 855 to 59 y e a r s ............................................................................................................ 6 ,2 4 6 6 ,0 7 8 3 ,8 2 8 3 ,7 6 0 2 ,4 1 8 2 ,3 1 860 to 64 y e a r s ............................................................................................................ 4 ,0 6 0 4 ,0 4 9 2 ,5 7 9 2 ,5 5 9 1 ,4 8 1 1 ,4 9 0
65 years and over .......................................................................................................... 2 ,7 2 6 2 ,6 5 7 1 ,7 2 0 1 ,6 7 9 1 ,0 0 5 978
Agriculture .................................................................................................................. 3 ,3 2 2 3 ,6 0 7 2 ,7 2 2 2 ,9 6 2 6 0 0 64516 to 19 y e a r s ................................................................................................................. 3 1 0 266 275 245 35 21
16 and 17 y e a r s .......................................................................................................... 188 138 165 127 23 1118 and 19 y e a r s .......................................................................................................... 122 128 110 118 12 10
20 to 24 y e a r s ................................................................................................................. 198 224 165 180 33 4 425 to 54 y e a r s ................................................................................................................. 1 ,7 0 7 1 ,9 1 1 1 ,3 0 9 1 ,4 9 3 398 4 19
25 to 34 y e a r s ............................................................................................................ 447 516 345 399 102 11735 to 44 y e a r s ............................................................................................................ 584 632 4 37 4 9 4 147 13845 to 54 y e a r s ............................................................................................................ 676 762 528 6 0 0 148 163
55 to 64 y e a r s ................................................................................................................. 664 733 570 611 94 12255 to 59 y e a r s ............................................................................................................ 344 386 289 309 54 7660 to 64 y e a r s ............................................................................................................ 321 347 281 301 39 46
65 years and o v e r .......................................................................................................... 443 4 73 402 433 41 39
Digitized for FRASER http://fraser.stlouisfed.org/ Federal Reserve Bank of St. Louis

HOUSEHOLD DATA 6 2
A-18: E m p l o y e d p e r s on s by o c c u p a t i o n g r o u p , s e x , a n d a g e
(In t h o u s a n d s )
O c c u p a t io n
T o t a lM a le , 20 y e a r s
a n d o v e rF e m a le , 20 y e a r s
and o v e rM a le ,
1 6 -1 9 y e a r sF e m a le ,
1 6 -1 9 y e a r s
Nov.1969
Nov.1968
Nov.1969
Nov.1968
Nov.1969
Nov.1968
Nov.1969
Nov.1968
Nov.1969
Nov.1968
T ota l................................................................... 78,716 76,609 45,542 44,987 27,194 26,183 3,197 2,982 2,783 2,457
'White-collar workers............................................... 37,777 36,244 19,145 18,696 16,324 15,579 686 594 1,622 1,375
P r o f e s s i o n a l and t e c h n i c a l .................................... 11,148 10,793 6,795 6,604 4,166 4,002 106 88 81 99M e d ic a l and o th e r h e a l t h .................................... 1,686 1,697 656 638 1,004 1,014 3 4 24 40T e a c h e r s , e x c e p t c o l l e g e .................................... 2,538 2,451 786 748 1,740 1,693 4 - - 9 10O th er p r o f e s s i o n a l an d t e c h n i c a l ................. 6,923 6,645 5,353 5,218 1,423 1,295 100 84 49 49
M a n a g e r s , o f f i c i a l s , and p r o p r i e t o r s .............. 8,123 7,813 6,794 6,530 1,276 1,257 41 17 13 8S a la r ie d w o r k e r s ....................................................... 5,875 5,506 4,927 4,660 901 822 38 16 10 8S e lf - e m p lo y e d w o r k e r s in r e t a i l t r a d e . . . . 1,041 1,112 812 838 228 273 - - 1 2 - -
S e lf - e m p lo y e d w o r k e r s , e x c e p t r e t a i l tra d e 1,207 1,195 1,055 1,032 147 162 3 - - 2 —
C le r i c a l w o r k e r s ............................................................. 13,598 12,879 3,062 3,075 9,036 8,567 292 274 1,208 963S te n o g r a p h e r s , t y p i s t s , a n d s e c r e t a r i e s . . . 3,505 3,331 50 44 3,115 3,010 1 4 339 273O th er c l e r i c a l w o r k e r s ......................................... 10,093 9,548 3,012 3,031 5,921 5,556 291 270 869 690
S a le s w o r k e r s ..................................................................... 4,907 4,758 2,495 2,487 1,846 1,753 247 215 319 305R e t a i l t r a d e . .................................................................. 3,067 2,897 916 902 1,644 1,535 204 170 303 290O th e r s a le s w o r k e r s ............................................... 1,840 1,862 1,579 1,585 202 218 43 44 16 15
Blue-collar workers ............................................... 28,337 27,626 21,447 21,033 4,846 4,625 1,759 1,697 286 270
C ra ftsm e n an d fo r e m e n ............................................... 10,320 10,201 9,701 9,629 334 343 267 217 19 11C a r p e n t e r s ..................................................................... 925 913 905 891 1 1 18 21 - - —C o n s t r u c t io n c r a ft s m e n , e x c e p t c a r p e n te r s 1,957 1,884 1,895 1,836 11 15 52 34 — - -M e c h a n ic s and r e p a ir m e n .................................... 2,707 2,659 2,553 2,536 31 28 118 90 5 3M eta l c r a ft s m e n , e x c e p t m e c h a n i c s ........... 1,260 1,269 1,217 1,230 22 20 20 16 1 1O th er c r a fts m e n and k in d re d w o r k e r s . . . . 1,936 1,968 1,724 1,738 149 175 50 50 14 5F o r e m e n , n o t e ls e w h e r e c l a s s i f i e d ........... 1,537 1,509 1,408 1,398 119 102 8 6 1 3
O p e r a t i v e s .......................................................................... 14,433 13,980 9,022 8,795 4,403 4,170 774 762 233 253D r iv e r s an d d e l i v e r y m e n .................................... 2,594 2,563 2,339 2,347 129 89 121 121 4 6O th e r o p e r a t i v e s ....................................................... 11,840 11,417 6,684 6,448 4,274 4,082 654 640 230 247
D u r a b le g o o d s m a n u f a c t u r in g .................... 4,943 4,681 3,297 3,096 1,411 1,334 164 173 72 78N o n d u r a b le g o o d s m a n u f a c t u r in g ........... 3,955 3,888 1,609 1,602 2,107 2,049 119 117 121 120O th er i n d u s t r i e s .................................................. 2,942 2,848 1,778 1,750 756 699 371 350 37 49
N on fa rm l a b o r e r s ............................................................. 3,584 3,445 2,723 2,609 108 112 718 718 34 6C o n s t r u c t i o n ............................................................... 742 729 661 632 1 5 79 93 — - -M a n u f a c t u r in g ............................................................. 1,080 1,037 894 839 65 66 112 133 9 - -O th er i n d u s t r i e s ....................................................... 1,762 1,679 1,168 1,139 42 41 527 492 25 7
Service workers........................................................ 9,629 9,502 2,711 2,803 5,556 5,434 511 470 852 796
P r iv a te h o u s e h o ld w o r k e r s .................................... 1,714 1,764 34 28 1,353 1,396 9 15 318 326
S e r v ic e w o r k e r s , e x c e p t p r iv a te h o u s e h o ld . . 7,915 7,738 2,677 2,775 4,203 4,039 501 455 534 470P r o t e c t iv e s e r v i c e w o r k e r s ............................... 924 909 863 850 48 44 10 9 3 6W a ite r s , c o o k s , a n d b a r te n d e r s ................... 2,172 2,054 412 437 1,358 1,298 136 104 266 215O th er s e r v i c e w o r k e r s ......................................... 4,819 4,775 1,402 1,488 2,797 2,697 355 342 265 248
Farm workers............................................................ 2,973 3,236 2,239 2,455 468 545 242 221 24 15
F a rm ers an d farm m a n a g e r s .................................... 1,726 1,854 1,656 1,770 62 74 8 9 - 2
F arm la b o r e r s a n d f o r e m e n .................................... 1,247 1,383 584 686 407 471 234 212 23 14P a id w o r k e r s ............................................................... 768 887 542 646 92 117 126 114 8 9U n p a id fa m ily w o r k e r s .......................................... 479 496 41 39 314 354 108 98 15 4
Digitized for FRASER http://fraser.stlouisfed.org/ Federal Reserve Bank of St. Louis

6 3 HOUSEHOLD DATA
A-19: E m p l o y e d pe rs o ns by m a j o r o c c u p a t i o n g r o u p , s e x , a n d c o lo r
(P e r c e n t d is t r ib u t io n )
O c c u p a t io n g ro u p and c o l o r
T o ta l M a le F e m a le
Nov.1969
Nov.1968
Nov.1969
Nov.1968
Nov.1969
Nov.1968
Total
T o t a l e m p lo y e d ( t h o u s a n d s ) ................................................................................................ 78,716 76,609 48,739 47,969 29,978 28,639P e r c e n t .............................................................................................................................................. 1 0 0 .0 1 0 0 .0 1 0 0 .0 1 0 0 .0 1 0 0 .0 1 0 0 .0
W h ite -c o l la r w o r k e r s ........................................................................................................................... 48.0 47.3 40.7 40.2 59.9 59.2P r o f e s s i o n a l an d t e c h n i c a l ........................................................................................................ 14.2 14.1 14.2 14.0 14.2 14.3M a n a g e rs , o f f i c i a l s , and p r o p r i e t o r s .................................................................................. 10.3 10.2 14.0 13.6 4.3 4.4C le r i c a l w o r k e r s ................................................................................................................................ 17.3 16.8 6.9 7.0 34.2 33.3S a le s w o r k e r s ..................................................................................................................................... 6.2 6.2 5.6 5.6 7.2 7.2
B lu e - c o l la r w o r k e r s ............................................................................................................................. 36.0 36.1 47.6 47.4 17.1 17.1C ra fts m e n a n d fo r e m e n ................................................................................................................... 13.1 13.3 20.5 20.5 1.2 1.2O p e r a t iv e s .............................................................................................................................................. 18.3 18.2 20.1 19.9 15.5 15.4N on fa rm la b o r e r s ............................................................................................................................. 4.6 4.5 7.1 6.9 .5 .4
S e r v ic e w o r k e r s ........................................................................................................................................ 12.2 12.4 6.6 6.8 21.4 21.8P r iv a te h o u s e h o ld w o r k e r s ........................................................................................................ 2.2 2.3 .1 .1 5.6 6.0O th er s e r v i c e w o r k e r s ................................................................................................................... 10.1 10.1 6.5 6.7 15.8 15.7
F arm w o r k e r s .............................................................................................................................................. 3.8 4.2 5.1 5.6 1.6 2.0F a rm ers an d farm m a n a g e r s ..................................................................................................... 2.2 2.4 3.4 3.7 .2 .3Farm la b o r e r s and fo r e m e n ........................................................................................................ 1.6 1.8 1.7 1.9 1.4 1.7
White
T o t a l e m p lo y e d ( t h o u s a n d s ) ................................................................................................ 70,172 68,401 43,938 43,292 26,235 25,109P e r c e n t .............................................................................................................................................. 1 0 0 .0 1 0 0 .0 1 0 0 .0 1 0 0 .0 1 0 0 .0 1 0 0 .0
W h ite -c o l la r w o r k e r s ............................................................................................................................. 50.6 50.0 42.9 42.4 63.3 63.1P r o f e s s i o n a l an d t e c h n i c a l ........................................................................................................ 14.8 14.8 14.9 14.7 14.7 15.0M a n a g e rs , o f f i c i a l s , and p r o p r i e t o r s .................................................................................. 11.2 11.1 15.1 14.7 4.7 4.8C le r i c a l w o r k e r s ................................................................................................................................ 17.8 17.4 6.8 7.0 36.1 35.3S a le s w o r k e r s ..................................................................................................................................... 6.7 6.7 6.1 6.0 7.8 7.9
B lu e - c o l la r w o r k e r s ............................................................................................................................. 35.1 35.1 46.2 45.9 16.6 16.6C ra ftsm e n an d fo r e m e n .................................................................................................................. 13.6 13.9 21.0 21.2 1.2 1.2O p e r a t iv e s ............................................................................................................................................. 17.6 17.5 19.2 19.0 14.9 15.0N on farm l a b o r e r s ............................................................................................................................. 3.9 3.8 6.0 5.7 .5 .4
S e r v ic e w o r k e r s ........................................................................................................................................ 10.5 10.5 5.8 6.0 18.3 18.3P r iv a t e h o u s e h o ld w o r k e r s ........................................................................................................ 1.4 1.4 .1 .1 3.7 3.8O th er s e r v ic e w o r k e r s .................................................................................................................. 9.1 9.1 5.8 5.9 14.7 14.5
Farm w o r k e r s .............................................................................................................................................. 3.8 4.3 5.1 5.6 1.7 2.0F a rm e rs and farm m a n a g e r s ........................................................................................................ 2.4 2.6 3.6 4 .0 .2 .3Farm la b o r e r s an d forem en ....................................................................................................... 1.5 1.7 1.5 1.7 1.5 1.8
Negro and other races
T o t a l e m p lo y e d ( t h o u s a n d s ) ................................................................................................ 8,544 8,207 4,801 4,677 3,743 3,530P e r c e n t .............................................................................................................................................. 1 0 0 .0 1 0 0 .0 1 0 0 .0 1 0 0 .0 1 0 0 .0 1 0 0 .0
W h ite -c o l la r w o r k e r s ............................................................................................................................. 27.0 24.8 20.3 19.7 35.5 31.5P r o f e s s i o n a l a n d t e c h n i c a l ........................................................................................................ 8.6 7.9 7.1 6.9 10.6 9.3M a n a g e rs , o f f i c i a l s , an d p r o p r i e t o r s .................................................................................. 3.0 2.8 4.0 3.7 1.7 1.6C le r i c a l w o rk e rs ............................................................................................................................. 13.1 12.1 7.4 7.2 20.5 18.5S a le s w o r k e r s ...................................................................................................................................... 2.2 1.9 1.7 1.8 2.9 2.1
B lu e - c o l la r w o r k e r s .............................................................................................................................. 43.2 43.7 60.9 60.9 20.5 20.8C ra fts m e n a n d f o r e m e n ................................................................................................................ 9.0 8.8 15.5 14.6 .8 1.2O p e r a t iv e s ........................................................................................................................................... 24.4 24.3 28.4 28.4 19.2 18.9N on farm l a b o r e r s - ............................................................................................................................. 9.8 10.5 17.0 17.9 .5 .8
S e r v ic e w o r k e r s ...................................................................................................................................... 26.5 28.1 13.8 14.3 42.8 46.2P r iv a te h o u s e h o ld w o r k e r s . ....................................................................................................... 8.5 9.5 .3 .3 19.0 21.7O th e r s e r v ic e w o r k e r s .................................................................................................................. 18.0 18.6 13.5 14.0 23.8 24.6
F arm w o r k e r s ........................................................................................................................................... 3.4 3.5 5.0 5.1 1.2 1.4F a rm ers a n d farm m a n a g e r s ..................................................................................................... .9 .9 1.5 1.5 (1) .1Farm la b o r e r s an d f o r e m e n ........................................................................................................... 2.5 2.6 3.5 3.6 1.2 1.3
^Percent less than 0.05
Digitized for FRASER http://fraser.stlouisfed.org/ Federal Reserve Bank of St. Louis
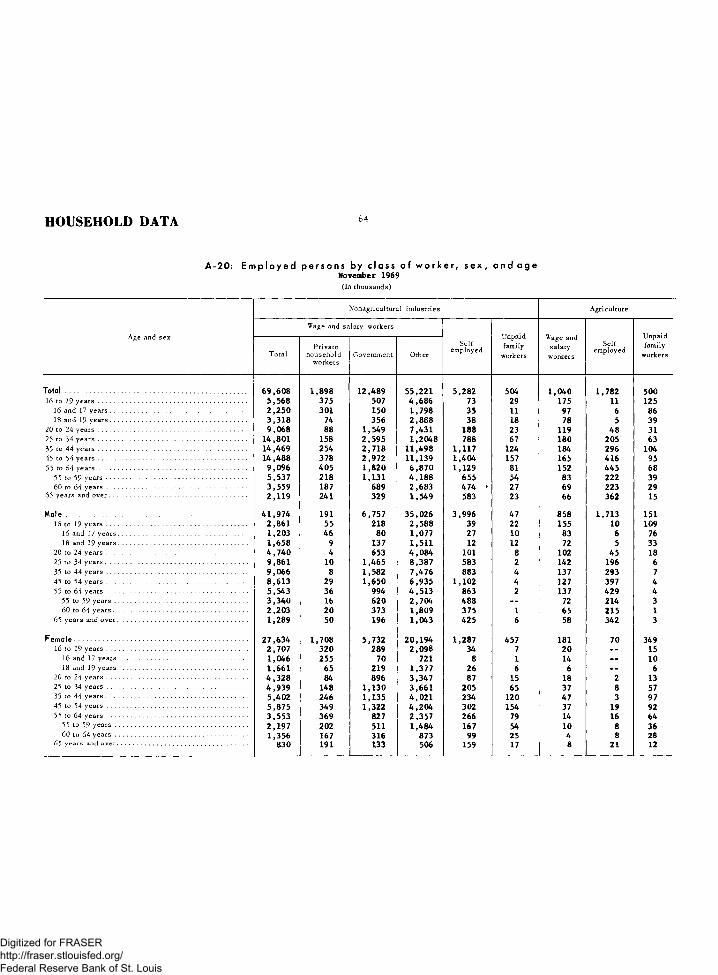
HOUSEHOLD DATA 6 4
A-20 : E m p l o y e d p e r s o n s by class of w o r k e r , s e x , a n d a g e November 1969
(In thousands)
A ge and sex
Nonagricultural industries A griculture
Wage and salary workers
S elfem ployed
Unpaidfamily
workers
Wage and salary workers
S elfem ployed
Unpaidfam ily
w orkersT ota lPrivate
h ouseholdworkers
Government Other
69,608 1,898 12,489 55,221 5,282 504 1,040 1,782 50016 to 19 y e a r s ......................................................................................... 5,568 375 507 4,686 73 29 175 11 125
16 and 17 y e a r s .................................................................................. 2,250 301 150 1,798 35 11 97 6 8618 and 19 y e a r s .................................................................................. 3,318 74 356 2,888 38 18 78 5 39
20 to 24 y e a r s ......................................................................................... 9,068 88 1,549 7,431 188 23 119 48 3125 to 34 y e a r s ......................................................................................... 14,801 158 2,595 1,2048 788 67 180 205 6335 to 44 y e a r s ......................................................................................... 14,469 254 2,718 11,498 1,117 124 184 296 10445 to 54 y e a r s ......................................................................................... 14,488 378 2,972 11,139 1,404 157 165 416 9555 to 64 y e a rs ........................................................................................... 9,096 405 1,820 6,870 1,129 81 152 445 68
55 to 59 y e a r s .................................................................................... 5,537 218 1,131 4,188 655 54 83 222 3960 to 64 y e a r s .................................................................................... 3,559 187 689 2,683 474 * 27 69 223 29
65 years and o v e r ................................................................................... 2,119 241 329 1,549 583 23 66 362 15
M a l e ............................................................................................................. 41,974 191 6,757 35,026 3,996 47 858 1,713 15116 to 19 years .................................................................................... 2,861 55 218 2,588 39 22 155 10 109
16 and 17 y e a r s ............................................................................. 1,203 46 80 1,077 27 10 83 6 7618 and 19 years ............................................................................. 1,658 9 137 1,511 12 12 72 5 33
20 to 24 years .................................................................................... 4,740 4 653 4,084 101 8 102 45 1825 to 34 y e a r s ..................................................................................... 9,861 10 1,465 8,387 583 2 142 196 635 to 44 y e a r s .................................................................................... 9,066 8 1,582 7,476 883 4 137 293 745 to 54 y e a r s .................................................................................... 8,613 29 1,650 6,935 1,102 4 127 397 455 to 64 y e a r s .................................................................................... 5,543 36 994 4,513 863 2 137 429 4
55 to 59 years ................................................................................ 3,340 16 620 2,704 488 - - 72 214 360 to 64 y e a r s ................................................................................. 2,203 20 373 1,809 375 1 65 215 1
65 years and o v e r .............................................................................. 1,289 50 196 1,043 425 6 58 342 3
F e m a l e ........................................................................................................ 27,634 1,708 5,732 20,194 1,287 457 181 70 34916 to 19 years .................................................................................... 2,707 320 289 2,098 34 7 20 - - 15
16 and 17 years ........................................................................... 1,046 255 70 721 8 1 14 — 1018 and 19 years ........................................................................... 1,661 65 219 1,377 26 6 6 - - 6
20 to 24 years .................................................................................... 4,328 84 896 3,347 87 15 18 2 1325 to 34 years .................................................................................... 4,939 148 1,130 3,661 205 65 37 8 5735 to 44 years ..................................................................................... 5,402 246 1,135 4,021 234 120 47 3 9745 to 54 y e a r s .................................................................................... 5,875 349 1,322 4,204 302 154 37 19 9255 to 64 years .................................................................................. 3,553 369 827 2,357 266 79 14 16 64
55 to 59 y e a r s ............................................................................... 2,197 202 511 1,484 167 54 10 8 3660 to 64 y e a r s ............................................................................... 1,356 167 316 873 99 25 4 8 28
65 years and o v e r .............................................................................. 830 191 133 506 159 17 8 21 12
Digitized for FRASER http://fraser.stlouisfed.org/ Federal Reserve Bank of St. Louis

65 HOUSEHOLD DATA
A-21: E m p l o y e d p e r s o n s w i t h a j ob but not at w o r k by r e a s o n , p a y s t a tu s , a n d sex
(In thousands)
R eason not working
A ll industries Nonagricultural industries
Nov.1969
Nov.1968
T otal Wage and salary workers^
Nov.1969
Nov.1968
2P aid absen ce 2Unpaid absen ce
Nov.1969
Nov.1968
Nov.1969
Nov.1968
2 ,914 2 ,730 2 ,795 2 ,5 8 4 1,111 1 ,030 1 ,364 1,238V a ca t io n ............................................................................................................ 811 698 795 679 598 538 134 71I lln e s s ................................................................................................................. 1 ,298 1 ,310 1,258 1,259 414 412 701 719Bad w eather..................................................................................................... 79 104 49 68 - - - - - - - -Industrial d isp u te ......................................................................................... 174 109 174 109 - - - - - - - -A ll other rea son s ........................................................................................... 554 509 520 469 99 81 530 448
M ale.................................................................................................. 1,919 1 ,692 1,806 1,556 796 720 798 656V a c a t io n ............................................................................................................ 575 515 560 496 441 408 73 47I lln e s s ................................................................................................................. 832 759 794 707 288 251 419 386A ll other rea son s ........................................................................................... 512 418 452 353 67 61 306 223
F e m a le ........................................................................................... 995 1,039 989 1,028 315 310 567 582V a c a t io n ............................................................................................................ 236 183 235 184 158 130 61 25I lln e s s ................................................................................................................. 465 551 464 552 126 161 282 333A ll other rea son s ........................................................................................... 294 305 290 292 31 20 224 224
^ E x c l u d e s p r i v a t e h o u s e h o l d .
P a y s t a t u s n o t a v a i l a b l e s e p a r a t e l y f o r b a d w e a t h e r a n d i n d u s t r i a l d i s p u t e ; t h e s e c a t e g o r i e s a r e i n c l u d e d i n a l l o t h e r r e a s o n s .
A-22: P e rs on s at w o r k by t y p e of i n d u s t r y a n d hours of w o r k
November 1969
Hours o f work
Thousands o f p erson s Percent distribution
Allindustries
Nonagricultural
industries
A griculture
Allindustries
Nonagricultural
industriesAgriculture
T ota l at w o r k .................................................................................................................................... 7 5 ,8 0 2 7 2 ,5 9 9 3 ,2 0 3 1 0 0 .0 1 0 0 .0 1 0 0 .0
1 -34 hours .................................................................................................................... .. 2 1 ,6 5 2 2 0 ,6 3 3 1 ,0 1 8 2 8 .6 2 8 .4 3 1 .81 -4 hours ............................................................................. 740 699 40 1 .0 1 .0 1 .25-14 hours ......................................................................................................................................... 3 ,7 2 1 3 ,4 8 8 233 4 .9 4 .8 7 .315-29 hours ........................................................................ ....................... 8 ,7 3 6 8 ,1 7 5 561 1 1 .5 1 1 .3 1 7 .530-34 hours ................................................................. ........................................ ................................... 8 ,4 5 5 8 ,2 7 1 184 1 1 .2 1 1 .4 5 .7
35 hours and over ...................... ............................................................................................................... 5 4 ,1 5 0 5 1 ,9 6 5 2 ,1 8 4 7 1 .4 7 1 .6 6 8 .235-39 hours .................................. ............................................................................................................ 4 ,7 0 5 4 ,5 6 6 138 6 .2 6 .3 4 .340 h o u rs ................. ............................ ..................................... ............................................ .................. 2 7 ,6 4 7 2 7 ,3 0 2 345 3 6 .5 3 7 .6 1 0 .841 h ou rs a n d o v e r ............................................... .. ............................................................................ .. ................... 2 1 ,7 9 8 2 0 ,0 9 7 1 ,7 0 1 2 8 .8 2 7 .7 5 3 .1
41 to 48 h o u r s .............................. ...................... ........................................................................... .. ................ 9 ,0 4 1 8 ,7 6 5 276 1 1 .9 1 2 .1 8 .649 to 59 h o u rs .............................. .. ............. ....................................................................................................... 6 ,6 8 2 6 ,3 1 3 368 8 .8 8 .7 1 1 .560 h ou rs a n d o v e r ............................................................................................................................................. 6 ,0 7 5 5 ,0 1 9 1 ,0 5 7 8 .0 6 .9 3 3 .0
A v e r a g e h o u r s , to ta l a t w o r k . ........................................................................................ .................................... 3 8 .9 3 8 .5 4 5 .8 - - — —
A v e r a g e h o u r s , w o r k e r s on fu ll - t im e s c h e d u l e s ..................................................................................... 4 3 .0 4 2 .5 5 5 .1 * ~
371-793 ODigitized for FRASER http://fraser.stlouisfed.org/ Federal Reserve Bank of St. Louis

HOUSEHOLD DATA 66
November 1969(In t h o u s a n d s )
A - 2 3 : P e rs on s a t w o r k 1 - 3 4 hour s by u s ua l s t a t us a n d r e a s o n w o r k i n g p a r t - t i m e
A ll in d u s t r ie s N o n a g r ic u ltu r a l in d u s t r ie s
R e a s o n s w ork in g p a rt tim eT o t a l
U s u a lly w ork
fu l l tim e
U s u a lly w ork
pa rt tim eT o t a l
U s u a lly w ork
f u l l tim e
U s u a lly w ork
p a rt tim e
T o t a l ....................................................................................................................................................... 21 ,652 9 ,977 11 ,675 20 ,633 9 ,6 3 0 11,003
E c o n o m ic r e a s o n s ................................................................................................................................. 1 ,916 1 ,080 836 1,679 937 742
S la c k w o r k .............................................................................................................................................. ' 1,056 758 298 882 630 252M a te r ia l s h o r t a g e s o r r e p a ir s t o p la n t and e q u ip m e n t ............................................ 71 71 — 68 68 - ■
N e w jo b s ta r te d d u r in g w e e k ..................................................................................................... 168 168 - - 158 158 —
J o b te rm in a te d d u r in g w e e k ........................................................................................................ 83 83 — 81 81C o u ld fin d o n ly p a r t -t im e w o r k ................................................................................................ 538 538 490 490
O th e r r e a s o n s ............................................................................................................................................ 19,736 8 ,897 10 ,839 18,953 8 ,692 10,261D o e s n o t w a n t, o r u n a v a ila b le fo r , fu l l - t im e w o r k .................................................... 8 ,6 7 0 — 8 ,6 7 0 8 ,2 5 5 - - 8 ,2 5 5V a c a t i o n ................................................................................................................................................... 459 459 — 450 450 - -
I l l n e s s ........................................................................................................................................................ 1 ,628 1 ,378 250 1,547 1 ,350 197B a d w e a t h e r .......................................................................................................................................... 473 473 - - 373 373 —
In d u s tr ia l d i s p u t e .............................................................................................................................. 33 33 — 33 33 - -
L e g a l o r r e l i g i o u s h o l i d a y ........................................................................................................... 5 ,451 5 ,451 — 5 ,435 5 ,435 - -
F u ll t im e fo r th is j o b ...................................................................................................................... 1 ,334 — 1 ,334 1 ,298 — 1 ,298A ll o th e r r e a s o n s .............................................................................................................................. 1,688 1 ,103 585 1,564 1,053 511
A v e r a g e h o u r s :17 .9E c o n o m ic r e a s o n s .............................................................................................................................. 2 0 .8 2 3 .2 17 .7 2 1 .0 2 3 .4
O th e r r e a s o n s ...................................................................................................................................... 22 .7 2 8 .6 17 .8 22 .8 2 8 .8 17 .7
W ork ed 30 to 3 4 h o u r s :485 364 121
E c o n o m ic r e a s o n s .............................................................................................................................. 532 403 129O th e r r e a s o n s ...................................................................................................................................... 7 ,923 6 ,353 1 ,570 7 ,786 6 ,2 8 0 1,506
A - 24 : Nonagr icul tura l workers by industry and ful l - or par t - t ime statusNovember 1969
In d u s try
P e r c e n t d is tr ib u t io n
A v e r a g e h o u r s , t o ta l
a t w ork
A v e r a g e h o u rs ,
w o rk e rs on fu ll -t im e
s c h e d u le s
T o ta la t
w ork
On part tim e fo r e c o n o m ic
r e a s o n s
Onv o lu n ta ry pa rt tim e
O n fu l l - t im e s c h e d u le s
T o ta l 4 0 h o u r s o r l e s s
41 to 48 h o u rs
4 9 h ou rs o r m ore
T o ta l — ................................................................................................ 100 .0 2 .6 14 .9 8 2 .4 5 4 .7 12 .1 15 .6 38 .5 4 2 .5
W age and s a la r y w o r k e r s ....................................................................... 100 .0 2 .2 13 .9 8 3 .8 5 8 .1 12 .2 13 .5 3 8 .1 4 1 .9
C o n s t r u c t i o n ............................................................................................. 100 .0 5 .0 4 .4 9 0 .6 6 7 .5 11 .2 11 .9 3 8 .1 4 0 .0
M a n u fa c t u r in g ........................................................................................... 100 .0 2 .2 3 .2 9 4 .6 65 .7 16 .1 12 .8 4 0 .8 4 1 .9D u ra b le g o o d s .................................................................................. 100 .0 1 .2 2 .2 96 .7 6 5 .9 17 .1 13 .7 4 1 .4 -4 2 .1N o n d u ra b le g o o d s ............................................................................. 1 00 .0 3 .7 4 .6 91 .7 6 5 .4 14 .8 11 .5 3 9 .9 4 1 .6
T r a n s p o r ta t io n a n d p u b l ic u t i l i t i e s ......................................... 100 .0 1 .5 7 .3 9 1 .2 6 5 .1 1 1 .0 15 .1 4 0 .2 4 2 .1W h o le s a le and r e ta i l t r a d e ............................................................ 100 .0 2 .1 25 .7 7 2 .1 4 1 .9 13 .6 16 .6 3 7 .0 4 4 .0F in a n c e , in s u r a n c e , a n d r e a l e s t a t e ....................................... 100 .0 1 .1 9 .4 8 9 .6 6 7 .1 10 .2 12 .3 3 8 .4 4 0 .6
S e r v ic e i n d u s t r i e s ................................................................................ 100 .0 2 .5 2 5 .0 7 2 .5 5 0 .5 8 .9 13 .1 3 5 .3 4 2 .3P r iv a te h o u s e h o l d s ....................................................................... 100 .0 9 .6 5 5 .3 3 5 .1 2 3 .5 6 .0 5 .6 23 .9 4 3 .3A ll o th e r s e r v i c e ............................................................................. 100 .0 1 .6 2 1 .4 7 7 .0 53 .7 9 .3 1 4 .0 36 .6 4 2 .2
P u b l i c a d m in is tr a t io n ....................................................................... 100 .0 .7 6 .0 93 .3 7 6 .4 7 .0 9 .9 36 .9 3 8 .3
S e lf -e m p lo y e d w o r k e r s ............................................................................. 1 00 .0 3 .4 14 .5 8 2 .0 2 9 .0 10 .5 4 2 .5 4 4 .9 5 1 .0U n p a id fa m ily w o r k e r s ............................................................................. 1 00 .0 1 .6 3 9 .1 59 .3 2 7 .2 7 .1 2 5 .0 38 .3 4 9 .1
—^Mining not shown separately but Included in totals.
Digitized for FRASER http://fraser.stlouisfed.org/ Federal Reserve Bank of St. Louis
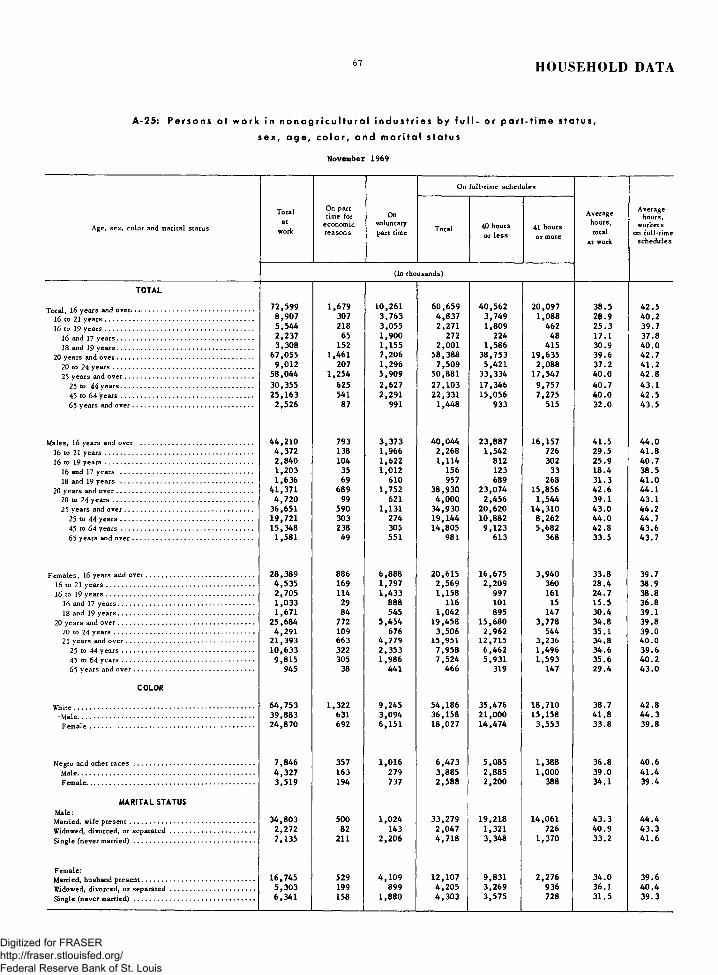
6 7 HOUSEHOLD DATA
A-25: P e r s on s a t w o r k in n o n a g r i c u l t u r a l i n d u s t r i e s by f u l l - or p a r t - t i m e s t a t u s ,
sex , a g e , c o l o r , a n d m a r i t a l s t a tus
November 1969
A g e , s e x , c o l o r and m a r ita l s ta tu s
TOTAL
Total, 16 years and over.................16 to 21 y e a rs ...............................16 to 19 y e a rs ...............................
16 and 17 years.........................18 and 19 years.........................
20 years and o v e r .........................20 to 2 4 y e a rs ...........................25 years and o v e r ....................
25 to 4 4 years.......................45 to 6 4 y e a rs ......................65 years and o v e r ................
M a le s , 16 y e a r s a n d o v e r16 to 21 y e a r s ...................16 to 19 y e a r s ...................
16 and 17 y e a r s . . . . 18 and 19 y e a r s
20 y e a r s a n d o v e r ...........20 to 2 4 y e a r s ..............25 y e a r s and o v e r . . .
25 to 4 4 y e a r s -------45 to 6 4 y e a r s . . . . 6 5 y e a r s an d o v e r .
F e m a le s , 16 y e a r s a n d o v e r16 to 21 y e a r s .........................16 to 19 y e a r s .........................
16 and 17 y e a r s .................18 an d 19 y e a r s .................
20 y e a r s an d o v e r .................20 to 2 4 y e a r s ....................25 y e a r s and o v e r ...........
25 to 4 4 y e a r s ..............45 to 6 4 y e a r s ..............6 5 y e a r s a n d o v e r . . .
COLOR
W h ite . . . . • M a le .. .
F e m a le
Negro and other racesMale.............................Female........................
MARITAL STATUSM a le :M a rried , w i fe p r e s e n t .......................................W id o w e d , d iv o r c e d , o r s e p a r a t e d ...........
S in g le (n e v e r m a r r i e d ) ....................................
F e m a le :M a rried , h u s b a n d p r e s e n t .................W id o w e d , d iv o r c e d , o r s e p a r a te d S in g le ( n e v e r m a r r i e d ) ......................
Totalat
work
On part time for
economic reasons
Onvoluntary part time
On full-time schedules
Average hours, total
at work
Average hours,
workers on full-time
schedulesTotal 40 hours
or less41 hours or more
(In thousands)
7 2 ,5 9 9 1 ,6 7 9 1 0 ,2 6 1 6 0 ,6 5 9 4 0 ,5 6 2 2 0 ,0 9 7 3 8 .5 4 2 .58 ,9 0 7 307 3 ,7 6 3 4 ,8 3 7 3 ,7 4 9 1 ,0 8 8 2 8 .9 4 0 .25 ,5 4 4 218 3 ,0 5 5 2 ,2 7 1 1 ,8 0 9 462 2 5 .3 3 9 .72 ,2 3 7 65 1 ,9 0 0 272 224 48 1 7 .1 3 7 .83 ,3 0 8 152 1 ,1 5 5 2 ,0 0 1 1 ,5 8 6 4 15 3 0 .9 4 0 .0
6 7 ,0 5 5 1 ,4 6 1 7 ,2 0 6 5 8 ,3 8 8 3 8 ,7 5 3 1 9 ,6 3 5 3 9 .6 4 2 .79 ,0 1 2 207 1 ,2 9 6 7 ,5 0 9 5 ,4 2 1 2 ,0 8 8 3 7 .2 4 1 .2
5 8 ,0 4 4 1 ,2 5 4 5 ,9 0 9 5 0 ,8 8 1 3 3 ,3 3 4 1 7 ,5 4 7 4 0 .0 4 2 .83 0 ,3 5 5 625 2 ,6 2 7 2 7 ,1 0 3 1 7 ,3 4 6 9 ,7 5 7 4 0 .7 4 3 .12 5 ,1 6 3 541 2 ,2 9 1 2 2 ,3 3 1 1 5 ,0 5 6 7 ,2 7 5 4 0 .0 4 2 .5
2 ,5 2 6 87 991 1 ,4 4 8 9 33 515 3 2 .0 4 3 .5
4 4 ,2 1 0 793 3 ,3 7 3 4 0 ,0 4 4 2 3 ,8 8 7 1 6 ,1 5 7 4 1 .5 4 4 .04 ,3 7 2 138 1 ,9 6 6 2 ,2 6 8 1 ,5 4 2 726 2 9 .5 4 1 .82 ,8 4 0 104 1 ,6 2 2 1 ,1 1 4 812 302 2 5 .9 4 0 .71 ,2 0 3 35 1 ,0 1 2 156 123 33 1 8 .4 3 8 .51 ,6 3 6 69 610 957 689 268 3 1 .3 4 1 .0
4 1 ,3 7 1 689 1 ,7 5 2 3 8 ,9 3 0 2 3 ,0 7 4 1 5 ,8 5 6 4 2 .6 4 4 .14 ,7 2 0 99 621 4 ,0 0 0 2 ,4 5 6 1 ,5 4 4 3 9 .1 4 3 .1
3 6 ,6 5 1 590 1 ,1 3 1 3 4 ,9 3 0 2 0 ,6 2 0 1 4 ,3 1 0 4 3 .0 4 4 .21 9 ,7 2 1 303 2 74 1 9 ,1 4 4 1 0 ,8 8 2 8 ,2 6 2 4 4 .0 4 4 .71 5 ,3 4 8 238 305 1 4 ,8 0 5 9 ,1 2 3 5 ,6 8 2 4 2 .8 4 3 .6
1 ,5 8 1 49 551 981 613 368 3 3 .5 4 3 .7
2 8 ,3 8 9 8 86 6 ,8 8 8 2 0 ,6 1 5 1 6 ,6 7 5 3 ,9 4 0 3 3 .8 3 9 .74 ,5 3 5 169 1 ,7 9 7 2 ,5 6 9 2 ,2 0 9 360 2 8 .4 3 8 .92 ,7 0 5 114 1 ,4 3 3 1 ,1 5 8 9 97 161 2 4 .7 3 8 .81 ,0 3 3 29 8 88 116 101 15 1 5 .5 3 6 .81 ,6 7 1 84 545 1 ,0 4 2 895 147 3 0 .4 3 9 .1
2 5 ,6 8 4 772 5 ,4 5 4 1 9 ,4 5 8 1 5 ,6 8 0 3 ,7 7 8 3 4 .8 3 9 .84 ,2 9 1 109 676 3 ,5 0 6 2 ,9 6 2 544 3 5 .1 3 9 .0
2 1 ,3 9 3 663 4 ,7 7 9 1 5 ,9 5 1 1 2 ,7 1 5 3 ,2 3 6 3 4 .8 4 0 .01 0 ,6 3 3 322 2 ,3 5 3 7 ,9 5 8 6 ,4 6 2 1 ,4 9 6 3 4 .6 3 9 .6
9 ,8 1 5 305 1 ,9 8 6 7 ,5 2 4 5 ,9 3 1 1 ,5 9 3 3 5 .6 4 0 .2945 38 441 466 319 147 2 9 .4 4 3 .0
6 4 ,7 5 3 1 ,3 2 2 9 ,2 4 5 5 4 ,1 8 6 3 5 ,4 7 6 1 8 ,7 1 0 3 8 .7 4 2 .83 9 ,8 8 3 631 3 ,0 9 4 3 6 ,1 5 8 2 1 ,0 0 0 1 5 ,1 5 8 4 1 .8 4 4 .32 4 ,8 7 0 692 6 ,1 5 1 1 8 ,0 2 7 1 4 ,4 7 4 3 ,5 5 3 3 3 .8 3 9 .8
7 ,8 4 6 357 1 ,0 1 6 6 ,4 7 3 5 ,0 8 5 1 ,3 8 8 3 6 .8 4 0 .64 ,3 2 7 163 279 3 ,8 8 5 2 ,8 8 5 1 ,0 0 0 3 9 .0 4 1 .43 ,5 1 9 194 737 2 ,5 8 8 2 ,2 0 0 388 3 4 .1 3 9 .4
3 4 ,8 0 3 500 1 ,0 2 4 3 3 ,2 7 9 1 9 ,2 1 8 1 4 ,0 6 1 4 3 .3 4 4 .42 ,2 7 2 82 143 2 ,0 4 7 1 ,3 2 1 726 4 0 .9 4 3 .37 ,1 3 5 211 2 ,2 0 6 4 ,7 1 8 3 ,3 4 8 1 ,3 7 0 3 3 .2 4 1 .6
1 6 ,7 4 5 5 29 4 ,1 0 9 1 2 ,1 0 7 9 ,8 3 1 2 ,2 7 6 3 4 .0 3 9 .65 ,3 0 3 199 899 4 ,2 0 5 3 ,2 6 9 936 3 6 .1 4 0 .46 ,3 4 1 158 1 ,8 8 0 4 ,3 0 3 3 ,5 7 5 728 3 1 .5 3 9 .3
Digitized for FRASER http://fraser.stlouisfed.org/ Federal Reserve Bank of St. Louis

HOUSEHOLD DATA 6 8
A - 2 5 : Persons at w o rk in n o n a g r i c u l t u r a l i ndust r i es by ful l - or p a r t - t i m e status,
sex, ag e , color , an d m a r i t a l s t a t u s - - C o n t i n u e d November 1969
A g e , s e x , c o l o r an d m a rita l s ta tu s
T o t a la t
w ork
O n p a rt tim e fo r
e c o n o m ic r e a s o n s
Onv o lu n ta rypa rt tim e T o t a l
O n fu l l - t im e s c h e d u l e s
40 h o u rs 41 h o u rso r l e s s o r m ore
( P e r c e n t d is t r ib u t io n )
TOTAL
T o t a l , 16 y e a r s and o v e r .16 to 21 y e a r s .................16 to 19 y e a r s .................
16 an d 17 y e a r s . . . . 18 and 19 y e a r s . . . .
20 y e a r s an d o v e r . . . .20 to 2 4 y e a r s ...........25 y e a r s an d o v e r . .
25 to 4 4 y e a r s . . . 45 to 6 4 y e a r s . . . 6 5 y e a r s a n d o v e r
M a le s , 16 y e a r s a n d o v e r16 to 21 y e a r s ...................16 an d 19 y e a r s .................
16 an d 17 y e a r s ...........18 an d 19 y e a r s ...........
20 y e a r s a n d o v e r ...........20 to 2 4 y e a r s ..............25 y e a r s an d o v e r . . .
25 to 4 4 y e a r s 45 to 6 4 y e a r s 6 5 y e a r s a n d o v e r .
F e m a le s , 16 y e a r s an d o v e r16 to 21 y e a r s .........................16 to 19 y e a r s .........................
16 an d 17 y e a r s .................18 and 19 y e a r s .................
20 y e a r s and o v e r .................20 to 2 4 y e a r s ...................25 y e a r s an d o v e r ...........
25 to 4 4 y e a r s ..............45 to 6 4 y e a r s ..............6 5 y e a r s and o v e r . . .
COLOR
W hite . . . M a le . . . F e m a le
N e g r o a n d o th e r r a c e sM a le ....................................F e m a l e ............................
MARITAL STATUSM a le :M a rried , w ife p r e s e n t ......................................W id o w e d , d iv o r c e d , o r s e p a r a t e d ...........S in g le ( n e v e r m a r r i e d ) ....................................
F e m a le :M a rried , h u s b a n d p r e s e n t ................W id ow ed , d iv o r c e d , o r s e p a r a te d S in g le (n e v e r m a r r i e d ) ......................
100.0 2.3 14.1 83.6 55.9 27.7100.0 3.4 42.2 54.3 42.1 12.2100.0 3.9 55.1 40.9 32.6 8.3100.0 2.9 84.9 12.1 10.0 2.1100.0 4.6 34.9 60.4 47.9 12.5100.0 2.2 10.7 87.1 57.8 29.3100.0 2.3 14.4 83.4 60.2 23.2100.0 2.2 10.2 87.6 57.4 30.2100.0 2.1 8.7 89.2 57.1 32.1100.0 2.1 9.1 88.7 59.8 28.9100.0 3.4 39.2 57.3 36.9 20.4
100.0 1.8 7.6 90.5 54.0 36.5100.0 3.2 45.0 51.9 35.3 16.6100.0 3.7 57.1 39.2 28.6 10.6100.0 2.9 84.1 12.9 10.2 2.7100.0 4.2 37.3 58.5 42.1 16.4100.0 1.7 4.2 94.1 55.8 38.3100.0 2.1 13.2 84.7 52.0 32.7100.0 1.6 3.1 95.3 56.3 39.0100.0 1.5 1.4 97.1 55.2 41.9100.0 1.6 2.0 96.4 59.4 37.0100.0 3.1 34.9 62.1 38.8 23.3
100.0 3.1 24.3 72.6 58.7 13.9100.0 3.7 39.6 56.6 48.7 7.9100.0 4.2 53.0 42.9 36.9 6.0100.0 2.8 86.0 11.3 9.8 1.5100.0 5.0 32.6 62.4 53.6 8.8100.0 3.0 21.2 75.7 61.0 14.7100.0 2.5 15.8 81.7 69.0 12.7100.0 3.1 22.3 74.5 59.4 15.1100.0 3.0 22.1 74.9 60.8 14.1100.0 3.1 20.2 76.6 60.4 16.2100.0 4.0 46.7 49.4 33.8 15.6
100.0 2.0 14.3 83.7 54.8 28.9100.0 1.6 7.8 90.7 52.7 38.0100.0 2.8 24.7 72.5 58.2 14.3
100.0 4.6 12.9 82.5 64.8 17.7100.0 3.8 6.4 89.8 66.7 23.1100.0 5.5 20.9 73.5 62.5 11.0
100.0 1.4 2.9 95.6 55.2 40.4100.0 3.6 6.3 90.1 58.1 32.0100.0 3.0 30.9 66.1 46.9 19.2
100.0 3.2 24.5 72.3 58.7 13.6100.0 3.8 17.0 79.3 61.6 17.7100.0 2.5 29.6 67.9 56.4 11.5
Digitized for FRASER http://fraser.stlouisfed.org/ Federal Reserve Bank of St. Louis

69 HOUSEHOLD DATA
A-26: P er s on s at w o r k in n o n f a r m o c c u p a t i o n s by f u l l - or p a r t - t i m e s t a t us a n d sex
November 1 9 6 9
O ccupation group and sex
T otalat
work
On part time for
econ om ic reasons
On voluntary part time
On full-tim<? s c h e d u le s
A v e r a g e h o u r s , w o r k e r s
on fu ll - t im e s c h e d u l e s
T otal 40 h ou rs o r le s s
41 to 48h ou rs
49 h o u rs o r m ore
A v e r a g e h o u r s ,
to ta l at w ork
( T h o u s a n d s o f p e r s o n s )
TOTAL
W h it e - c o l la r w o r k e r s .................................................................... 3 6 , 6 5 8 4 1 5 5 , 2 8 2 3 0 , 9 6 1 2 0 , 1 9 3 3 , 9 0 3 6 , 8 6 5 3 9 . 1 4 3 . 0
P r o f e s s i o n a l a n d t e c h n i c a l ............................................... 1 0 , 8 5 3 7 9 1 , 3 3 6 9 , 4 3 8 6 , 0 1 1 1 , 2 4 7 2 , 1 8 0 3 9 . 5 4 3 . 0
M a n a g e r s , o f f i c i a l s , and p r o p r ie t o r s ........................... 7 , 8 3 4 8 4 2 9 7 7 , 4 5 3 3 , 1 8 1 1 , 0 9 1 3 , 1 8 1 4 7 . 0 4 8 . 4
1 3 , 2 1 5 1 5 7 2 , 3 2 9 1 0 , 7 2 9 9 , 0 6 1 1 , 0 6 7 6 0 1 3 5 . 1 3 8 . 9
S a le s w o r k e r s ............................................................................... 4 , 7 5 6 9 6 1 , 3 1 9 3 , 3 4 1 1 , 9 3 9 4 9 8 9 0 4 3 6 . 5 4 4 . 2
B lu e - c o l la r w o r k e r s ....................................................................... 2 7 , 0 0 7 9 3 5 1 , 9 0 6 2 4 , 1 6 6 1 6 , 4 8 1 4 , 0 1 3 3 , 6 7 2 3 9 . 6 4 1 . 9
C ra fts m e n and fo r e m e n .......................................................... 9 , 8 2 3 2 0 9 3 2 4 9 , 2 9 0 6 , 0 8 9 1 , 6 2 4 1 , 5 7 7 4 0 . 9 4 2 . 1
O p e r a t i v e s ..................................................................................... 1 3 , 7 4 4 5 2 3 9 5 6 1 2 , 2 6 5 8 , 4 1 3 2 , 0 1 5 1 , 8 3 7 3 9 . 8 4 2 . 2
N on farm la b o r e r s ....................................................................... 3 , 4 4 0 2 0 2 6 2 5 2 , 6 1 3 1 , 9 8 1 3 7 4 2 5 8 3 4 . 7 4 0 . 2
S e r v ic e w o r k e r s ............................................................................... 9 , 2 6 9 3 4 7 3 , 1 4 4 5 , 7 7 8 4 , 0 2 3 8 7 7 8 7 8 3 3 . 1 4 2 . 8
P r iv a te h o u s e h o ld .................................................................... 1 , 6 6 8 1 5 4 9 4 2 5 7 2 3 8 5 1 0 0 8 7 2 4 . 0 4 3 . 3
O th er s e r v ic e w o r k e r s . ............................................ .. 7 , 6 0 1 1 9 3 2 , 2 0 2 5 , 2 0 6 3 , 6 3 6 7 7 8 7 9 2 3 5 . 1 4 2 . 8
MALE
W h ite -c o l la r w o r k e r s ..................................................................... 1 9 , 2 4 9 1 5 4 1 , 2 8 6 1 7 , 8 0 9 9 , 3 9 3 2 , 6 9 2 5 , 7 2 4 4 3 . 5 4 5 . 6
P r o f e s s i o n a l and t e c h n ic a l ............................................... 6 , 7 1 3 3 1 4 5 7 6 , 2 2 5 3 , 6 5 9 8 6 3 1 , 7 0 3 4 2 . 3 4 4 . 3
M a n a g e rs , o f f i c i a l s , and p r o p r ie to r s ......................... 6 , 5 8 9 7 1 1 4 4 6 , 3 7 4 2 , 5 2 0 9 6 7 2 , 8 8 7 4 8 . 0 4 9 . 0
C le r i c a l w o r k e r s ....................................................................... 3 , 2 5 5 2 0 3 3 9 2 , 8 9 6 2 , 0 9 0 4 6 4 3 4 2 3 8 . 3 4 0 . 9
S a le s w o r k e r s ............................................................................. 2 , 6 9 2 3 2 3 4 6 2 , 3 1 4 1 , 1 2 2 3 9 9 7 9 3 4 1 . 9 4 5 . 9
B lu e - c o l la r w o r k e r s ..................................................................... 2 2 , 1 0 7 6 0 6 1 , 4 4 2 2 0 , 0 5 9 1 3 , 1 2 2 3 , 4 4 4 3 , 4 9 3 4 0 . 3 4 2 . 5
C ra ftsm e n and f o r e m e n .......................................................... 9 , 4 8 7 2 0 2 2 8 2 9 , 0 0 3 5 , 8 5 6 1 , 5 8 7 1 , 5 6 0 4 1 . 1 4 2 . 2
O p e r a t i v e s ..................................................................................... 9 , 3 1 9 2 1 2 5 6 9 8 , 5 3 8 5 , 3 5 6 1 , 4 9 8 1 , 6 8 4 4 1 . 5 4 3 . 4
N on fa rm la b o r e r s ....................................................................... 3 , 3 0 1 1 9 2 5 9 1 2 , 5 1 8 1 , 9 1 0 3 5 9 2 4 9 3 4 . 8 4 0 . 2
S e r v ic e w o r k e r s ............................................................................... 3 , 0 8 1 4 4 6 7 1 2 , 3 6 6 1 , 4 7 2 3 9 4 5 0 0 3 8 . 1 4 4 . 7
P r iv a te h o u s e h o ld .................................................................... 4 1 1 2 1 1 9 1 0 4 5 3 0 . 0 4 9 . 9
O th er s e r v ic e w o r k e r s .......................................................... 3 , 0 4 1 4 3 6 5 0 2 , 3 4 8 1 , 4 6 2 3 9 0 4 9 6 3 8 . 2 4 4 . 6
FEMALE
W h it e -c o l la r w o r k e r s .................................................................... 1 7 , 4 0 9 2 6 1 3 , 9 9 6 1 3 , 1 5 2 1 0 , 8 0 1 1 , 2 1 0 1 , 1 4 1 3 4 . 3 3 9 . 4
P r o f e s s i o n a l and t e c h n i c a l ............................................... 4 , 1 4 0 4 7 8 8 0 3 , 2 1 3 2 , 3 5 1 3 8 4 4 7 8 3 5 . 0 4 0 . 3
M a n a g e rs , o f f i c i a l s , and p r o p r i e t o r s ......................... 1 , 2 4 5 1 3 1 5 3 1 , 0 7 9 6 6 1 1 2 4 2 9 4 4 1 . 8 4 5 . 0
C le r i c a l w o r k e r s ........................... ........................................... 9 , 9 6 0 1 3 7 1 , 9 9 0 7 , 8 3 3 6 , 9 7 1 6 0 3 2 5 9 3 4 . 0 3 8 . 1
S a le s w o r k e r s ............................................................................. 2 , 0 6 5 6 3 9 7 3 1 , 0 2 9 8 1 9 9 9 1 1 1 2 9 . 4 4 0 . 2
B lu e - c o l la r w o r k e r s ....................................................................... 4 , 9 0 0 3 2 9 4 6 3 4 , 1 0 8 3 , 3 5 9 5 6 9 1 8 0 3 6 . 4 3 9 . 3
C ra ftsm e n and fo r e m e n .......................................................... 3 3 6 7 4 2 2 8 7 2 3 3 3 7 1 7 3 7 . 0 3 8 . 9
O p e r a t i v e s ..................................................................................... 4 , 4 2 5 3 1 1 3 8 7 3 , 7 2 7 3 , 0 5 7 5 1 7 1 5 3 3 6 . 4 3 9 . 3
N on fa rm l a b o r e r s ....................................................................... 1 3 9 1 1 3 4 9 4 6 9 1 5 1 0 3 2 . 4 4 0 . 5
S e r v ic e w o r k e r s ................................................................................ 6 , 1 8 8 3 0 3 2 , 4 7 3 3 , 4 1 2 2 , 5 5 1 4 8 3 3 7 8 3 0 . 7 4 1 . 6
P r iv a te h o u s e h o ld ..................................................................... 1 , 6 2 7 1 5 3 9 2 0 5 5 4 3 7 6 9 6 8 2 2 3 . 9 4 3 . 1
O th e r s e r v i c e w o r k e r s .......................................................... 4 , 5 6 0 1 5 0 1 , 5 5 2 2 , 8 5 8 2 , 1 7 5 3 8 7 2 9 6 3 3 . 1 4 1 . 3
Digitized for FRASER http://fraser.stlouisfed.org/ Federal Reserve Bank of St. Louis

HOUSEHOLD DATA 7 0
A-26: Persons at w o r k in n o n f a r m o c c u p at i o ns by f u l l - or p a r t - t i m e status a n d s e x - - C o n t i n u e d
November 1969
O c c u p a t io n g r o u p a n d s e x
T o t a lat
w ork
O n part t im e fo r
e c o n o m ic r e a s o n s
O n v o lu n ta r y p a rt tim e
O n fu l l - t im e s c h e d u le s
T o t a l4 0 h o u rs o r l e s s
41 to 4 8 h o u r s
4 9 h o u rs o r m ore
(P e r c e n t d is t r ib u t io n )
TOTAL
W h ite -c o l la r w o r k e r s ..................................................................... 1 0 0 . 0 1 . 1 1 4 . 4 8 4 . 4 5 5 . 1 1 0 . 6 1 8 . 7P r o f e s s i o n a l a n d t e c h n i c a l ............................................... 1 0 0 . 0 . 7 1 2 . 3 8 4 . 0 5 5 . 4 1 1 . 5 2 0 . 1M a n a g e rs , o f f i c i a l s , a n d p r o p r i e t o r s ......................... 1 0 0 . 0 1 . 1 3 . 8 9 5 . 1 4 0 . 6 1 3 . 9 4 0 . 6C le r i c a l w o r k e r s ....................................................................... 1 0 0 . 0 1 . 2 1 7 . 6 8 1 . 2 6 8 . 6 8 . 1 4 . 5S a le s w o r k e r s 1 0 0 . 0 2 . 0 2 7 . 7 7 0 . 3 4 0 . 8 1 0 . 5 1 9 . 0
B lu e - c o l la r w o r k e r s ....................................................................... 1 0 0 . 0 3 . 5 7 . 1 8 9 . 5 6 1 . 0 1 4 . 9 1 3 . 6
C r a fts m e n an d fo r e m e n .......................................................... 1 0 0 . 0 2 . 1 3 . 3 9 4 . 6 6 2 . 0 1 6 . 5 1 6 . 1
O p e r a t i v e s ..................................................................................... 1 0 0 . 0 3 . 8 7 . 0 8 9 . 3 6 1 . 2 1 4 . 7 1 3 . 4
N on farm l a b o r e r s ....................................................................... 1 0 0 . 0 5 . 9 1 8 . 2 7 6 . 0 5 7 . 6 1 0 . 9 7 . 5
S e r v ic e w o r k e r s ................................................................................ 1 0 0 . 0 3 . 7 3 3 . 9 6 2 . 4 4 3 . 4 9 . 5 9 . 5P r iv a te h o u s e h o ld ..................................................................... 1 0 0 . 0 9 . 2 5 6 . 5 3 4 . 3 2 3 . 1 6 . 0 5 . 2
O th er s e r v i c e w o r k e r s ............................................................ 1 0 0 . 0 2 . 5 2 9 . 0 6 8 . 4 4 7 . 8 1 0 . 2 1 0 . 4
MALE
W h ite -c o l la r w o r k e r s ..................................................................... 1 0 0 . 0 . 8 6 . 7 9 2 . 5 4 8 . 8 1 4 . 0 2 9 . 7
P r o f e s s i o n a l a n d t e c h n i c a l ............................................... 1 0 0 . 0 . 5 6 . 8 9 2 . 8 5 4 . 5 1 2 . 9 2 5 . 4M a n a g e r s , o f f i c i a l s , a n d p r o p r i e t o r s ......................... 1 0 0 . 0 1 . 1 2 . 2 9 6 . 7 3 8 . 2 1 4 . 7 4 3 . 8C le r i c a l w o r k e r s ....................................................................... 1 0 0 . 0 . 6 1 0 . 4 8 9 . 0 6 4 . 2 1 4 . 3 1 0 . 5S a le s w o r k e r s ............................................................................. 1 0 0 . 0 1 . 2 1 2 . 9 8 9 . 0 4 1 . 7 1 4 . 8 2 9 . 5
B lu e - c o l la r w o r k e r s ....................................................................... 1 0 0 . 0 2 . 7 6 . 5 9 0 . 8 5 9 . 4 1 5 . 6 1 5 . 8
C r a fts m e n a n d f o r e m e n .......................................................... 1 0 0 . 0 2 . 1 3 . 0 9 4 . 8 6 1 . 7 1 6 . 7 1 6 . 4
O p e r a t i v e s ..................................................................................... 1 0 0 . 0 2 . 3 6 . 1 9 1 . 7 5 7 . 5 1 6 . 1 1 8 . 1N on farm la b o r e r s ....................................................................... 1 0 0 . 0 5 . 8 1 7 . 9 7 6 . 3 5 7 . 9 1 0 . 9 7 . 5
S e r v ic e w o r k e r s ............................................................................... 1 0 0 . 0 1 . 4 2 1 . 8 7 6 . 8 4 7 . 8 1 2 . 8 1 6 . 2
P r iv a te h o u s e h o ld .................................................................. 1 0 0 . 0 2 . 4 5 1 . 2 4 6 . 4 2 4 . 4 9 . 8 1 2 . 2
O th e r s e r v i c e w o r k e r s ............................................................. 1 0 0 . 0 1 . 4 2 1 . 4 7 7 . 2 4 8 . 1 1 2 . 8 1 6 . 3
FEMALE
W h ite -c o l la r w o r k e r s .................................................................... 1 0 0 . 0 1 . 5 2 3 . 0 7 5 . 6 6 2 . 0 7 . 0 6 . 6P r o f e s s i o n a l a n d t e c h n i c a l ............................................... 1 0 0 . 0 1 . 1 2 1 . 3 7 7 . 6 5 6 . 8 9 . 3 1 1 . 5M a n a g e rs , o f f i c i a l s , a n d p r o p r i e t o r s ......................... 1 0 0 . 0 1.0 1 2 . 3 8 6 . 7 5 3 . 1 1 0 . 0 2 3 . 6C le r i c a l w o r k e r s ....................................................................... 1 0 0 . 0 1 . 4 2 0 . 0 7 8 . 7 7 0 . 0 6 . 1 2 . 6S a le s w o r k e r s ............................................................................. 1 0 0 . 0 3 . 1 4 7 . 1 4 9 . 9 3 9 . 7 4 . 8 5 . 4
B lu e - c o l la r w o r k e r s .................................................................... 1 0 0 . 0 6 . 7 9 . 4 8 3 . 9 6 8 . 6 1 1 . 6 3 . 7C ra ftsm e n an d f o r e m e n ......................................................... 1 0 0 . 0 2 . 1 1 2 . 5 8 5 . 4 6 9 . 3 1 1 . 0 5 . 1O p e r a t i v e s ..................................................................................... 1 0 0 . 0 7 . 0 8 . 7 8 4 . 3 6 9 . 1 1 1 . 7 3 . 5N on farm la b o r e r s ....................................................................... 1 0 0 . 0 7 . 9 2 4 . 5 6 7 . 6 4 9 . 6 1 0 . 8 7 . 2
S e r v ic e w o r k e r s ............................................................................... 1 0 0 . 0 4 . 9 4 0 . 0 5 5 . 1 4 1 . 2 7 . 8 6 . 1P r iv a te h o u s e h o l d .................................................................... 1 0 0 . 0 9 . 4 5 6 . 5 3 4 . 0 2 3 . 1 5 . 9 5 . 0
O th er s e r v i c e w o r k e r s ......................................................... 1 0 0 . 0 3 . 3 3 4 . 0 6 2 . 7 4 7 . 7 8 . 5 6 . 5
Digitized for FRASER http://fraser.stlouisfed.org/ Federal Reserve Bank of St. Louis

71 HOUSEHOLD DATA
A - 2 7: E m p lo y m e n t s t a tu s o f 14- 15 y e a r - o l d s by sex a n d c o lo r
November 1969
(In th o u s a n d s )
Employment status
T otal White N egro and other races
Bothsex es
Male Fem ale Bothsex es
Male Fem ale Bothse x e s Male Fem ale
C iv ilian noninstitutional popu lation .............................................. 7 ,8 9 8 4 ,0 0 3 3 ,8 9 5 6 ,7 9 0 3 ,4 5 2 3 ,3 3 7 1 ,1 0 8 550 558
C iv ilian labor fo r ce ........................................................................... 1 ,1 9 0 662 528 1 ,1 0 1 609 493 89 53 35E m p lo y e d ......................................................................................... 1 ,0 7 2 592 4 80 1 ,0 0 7 553 45 4 65 39 26
A g ricu ltu re .................................................................................. 123 102 20 119 102 17 3 - - 3N onagricultural in d u s tr ie s ................................................... 949 49 0 4 60 888 451 437 62 39 23
U n em p loy ed .................................................................................... 118 70 48 94 56 39 24 14 9
Not in labor f o r c e ............................................................................. 6 ,7 0 8 3 ,3 4 1 3 ,3 6 7 5 ,6 8 9 2 ,8 4 4 2 ,8 4 5 1 ,0 2 0 497 523K eeping h o u s e ............................................................................... 56 12 45 52 12 4 0 4 - - 4G oing to s c h o o l ............................................................................. 6 ,5 6 6 3 ,2 7 7 3 ,2 8 9 5 ,5 6 5 2 ,7 9 1 2 ,7 7 4 1 ,0 0 1 486 515U nable to work............................................................................... 8 4 4 8 4 3 1 - - 1A ll other rea son s ........................................................................... 78 48 30 63 36 27 15 12 3
A -28 : Employed 14- 15 y e a r -o ld s by sex, class of worker, an d m ajor occupation group
November 1969
C h aracteristics
T housands o f person s Percent d istribution
Bothse x e s Male Fem ale Both
sexes Male Fem ale
CLASS OF WORKER1 ,0 7 2 592 4 8 0 1 0 0 .0 1 0 0 .0 1 0 0 .0
Nonagricultural in d u stries ............................................................................. 949 49 0 46 0 8 8 .5 8 2 .6 9 5 .8Wage and salary w ork ers ........................................................................... 870 415 45 5 8 1 .2 7 0 .0 9 4 .8
Private hou seh old w o rk e rs ................................................................. 411 71 340 3 8 .3 1 2 .0 7 0 .8Government w ork ers ............................................................................... 43 21 22 4 . 0 3 .5 4 . 6Other wage and salary w orkers.......................................................... 416 323 93 3 8 .8 5 4 .5 1 9 .4
S elf-em ployed w ork ers ............................................................................... 77 73 5 7 .2 1 2 .3 1 .0Unpaid fam ily w ork ers ............................................................................... 2 2 — . 2 . 3 - -
A gricu lture............................................................................................................ 123 102 20 1 1 .5 1 7 .4 4 .2Wage and salary w ork ers ........................................................................... 45 40 5 4 .2 6 .7 1 .0S elf-em ployed w ork ers ................................................................................ 5 3 2 .5 .5 .4Unpaid fam ily w ork ers ............................................................................... 73 60 13 6 .8 1 0 .1 2 .7
OCCUPATION1 ,0 7 2 592 48 0 1 0 0 .0 1 0 0 .0 1 0 0 .0
W hite-collar w orkers......................................................................................... 244 201 43 2 2 .7 3 4 .0 9 .0P ro fession a l and te c h n ic a l ...................................................................... 13 8 4 1 .2 1 .4 .8Managers, o f f ic ia ls , and p r o p r ie to r s ................................................... 1 1 - - .1 .2 - -C lerica l w ork ers ............................................................................................ 37 15 22 3 .4 2 .5 4 . 6S ales w o r k e r s ................................................................................................. 193 177 17 1 8 .0 2 9 .9 3 .5
B lu e-co lla r w o r k e r s ......................................................................................... 207 186 21 1 9 .4 3 1 .5 4 . 4Craftsmen and forem en ................................................................................ 3 3 - - .3 .5O p e ra tiv e s ........................................................................................................ 73 61 11 6 .8 1 0 .3 2 .3Nonfarm la b orers ............................................................................................ 132 122 10 1 2 .3 2 0 .6 2 .1
S ervice w orkers................................................................................................... 506 109 397 4 7 .2 1 8 .4 8 2 .7Private h ou seh old w o r k e r s ...................................................................... 356 17 339 3 3 .2 2 .9 7 0 .6Other serv ice w o r k e r s ................................................................................ 150 92 58 1 4 .0 1 5 .6 1 2 .1
Farm w orkers....................................................................................................... 115 95 20 1 0 .7 1 6 .1 4 . 0Farmers and farm m anagers...................................................................... 5 3 1 .5 .5 .2Farm laborers and fo re m e n ...................................................................... 110 92 18 1 0 .3 1 5 .6 3 .7
Digitized for FRASER http://fraser.stlouisfed.org/ Federal Reserve Bank of St. Louis

HOUSEHOLD DATASEASONALLY ADJUSTED
72
A -2 9 : Employment status of the no ninstitut iona l p o p u la t io n by sex an d age , seasonal ly ad jus ted(In thousands)
Employment status, sex , and age
1969 1968
Nov. Oct. Sept. Aug. July June May Apr. Mar. Feb. Jan. Dec. Nov.
Total
T ota l labor fo rce ....................................................... 84,788 85,014 84,902 84,584 84,277 83,957 83,593 83,966 83,999 83,831 83,351 82,868 82,559C iv ilian labor force ................................................ 81,295 81,486 81,359 81,054 80,756 80,433 80,071 80,450 80,495 80,356 79,874 79,368 79,042
E m p loyed .................................................................... 78,497 78,325 78,127 78,187 77,874 77,671 77,265 77,605 77,767 77,729 77,229 76,765 76,388A g r ic u ltu r e .......................................................... 3,429 3,332 3,458 3,634 3,551 3,705 3,805 3,664 3,732 3,881 3,752 3,842 3,706N onagricultural in d u stries............................. 75,068 74,993 74,669 74,553 74,323 73,966 73,460 73,941 74,035 73,848 73,477 72,923 72,682
On part time for econ om ic reason s . . . 1,827 1,931 1,982 2,001 1,795 1,874 1,688 1,670 1,801 1,638 1,605 1,673 1,711U sually work fu ll t im e .......................... 981 1,012 1,091 1,065 881 1,030 862 858 979 870 805 872 852U sually work part time ....................... 846 919 891 936 914 844 826 812 822 768 800 801 859
U n e m p lo y e d ............................................................. 2,798 3,161 3,232 2,867 2,882 2,762 2,806 2,845 2,728 2,627 2,645 2,603 2,654Men, 20 years and over
T ota l labor f o r c e ....................................................... 49,502 49,595 49,624 49,552 49,389 49,304 49,267 49,286 49,378 49,336 49,189 49,132 48,926C iv ilian labor f o r c e ................................................... 46,489 46,552 46,568 46,507 46,322 46,206 46,171 46,195 46,297 46,280 46,131 46,093 45,871
E m p loyed .................................................................... 45,487 45,424 45,442 45,551 45,293 45,260 45,227 45,285 45,422 45,422 45,231 45,254 44,940A g r ic u ltu r e .......................................................... 2,479 2,531 2,570 2,693 2,646 2,676 2,731 2,681 2,706 2,732 2,680 2,763 2,753N onagricultural i n d u s t r ie s .......................... 43,008 42,893 42,872 42,858 42,647 42,584 42,496 42,604 42,716 42,690 42,551 42,491 42,187
U n e m p lo y e d ............................................................. 1,002 1,128 1,126 956 1,029 946 944 910 875 858 900 839 931Women, 20 years and over
C iv ilian 1 abor f o r c e ................................................ 27,660 27,817 27,686 27,677 27,511 27,262 27,049 27,205 27,189 27,230 26,950 26,737 26,630E m p loyed .................................................................... 26,695 26,711 26,519 26,622 26,505 26,251 26,046 26,169 26,228 26,264 25,999 25,802 25,702
A g r ic u ltu r e .......................................................... 562 514 511 578 540 617 627 609 638 731 691 722 621N onagricultural in d u s t r ie s .......................... 26,133 26,197 26,008 26,044 25,965 25,634 25,419 25,560 25,590 25,533 25,308 25,080 25,081
U n e m p lo y e d ............................................................. 965 1,106 1,167 1,055 1,006 1,011 1,003 1,036 961 966 951 935 928Both sexes, 16-19 years
C iv ilian labor f o r c e .................................................... 7,146 7,117 7,105 6,870 6,923 6,965 6,851 7,050 7,009 6,846 6,793 6,538 6,541Em ployed ................................................................ 6,315 6,190 6,166 6,014 6,076 6,160 5,992 6,151 6,117 6,043 5,999 5,709 5,746
A g r ic u ltu r e .......................................................... 388 287 377 363 365 412 447 374 388 418 381 357 332N onagricultural i n d u s t r ie s .......................... 5,927 5,903 5,789 5,651 5,711 5,748 5,545 5,777 5,729 5,625 5,618 5,352 5,414
U n e m p lo y e d ............................................................. 831 927 939 856 847 805 859 899 892 803 794 829 795
NOTE:tota ls .
B e c a u s e o f the in d e p e n d e n t s e a s o n a l a d ju s tm e n t o f th e v a r io u s s e r i e s , d e t a i l fo r th e h o u s e h o ld d a ta sh ow n in ta b le s A -2 9 th rou gh A -3 6 w i l l n o t n e c e s s a r i l y ad d to
A -3 0 : Full- and p a rt - t im e status of the civ i l ian la b o r force by sex an d age, seasonally ad jus ted(Numbers in thousands)
F ull- and part-time employment status, sex , and age
1969 1968
Nov. Oct. Sept. Aug. July June May Apr. Mar. Feb. Jan. Dec. Nov.
Full time
T ota l, 16 years and over:C iv ilian labor f o r c e ............................................. 70,161 70,153 70,271 70,108 69,818 69,434 69,177 69,389 69,332 69,427 67,918 68,809 68,556
E m p lo y e d ............................................................. 68,022 67,896 67,914 67,948 67,653 67,269 67,042 67,167 67,287 67,390 65,860 66,902 66,548U n em ployed .......................................................... 2,139 2,257 2,357 2,160 2,165 2,165 2,136 2,222 2,045 2,037 2,058 1,907 2,008Unemployment r a t e .......................................... 3.0 3.2 3.4 3.1 3.1 3.1 3.1 3.2 2.9 2.9 3.0 2.8 2.9
Men, 20 years and over:C iv ilian labor f o r c e ............................................. 44,367 44,415 44,470 44,306 44,201 44,129 44,090 44,093 44,166 44,218 43,177 44,064 43,870
E m p lo y e d ............................................................. 43,452 43,426 43,481 43,472 43,303 43,255 43,246 43,251 43,376 43,465 42,367 43,319 43,030U nem ployed ....................................................... 915 989 989 834 898 874 844 842 790 753 810 745 840Unemployment r a t e .......................................... 2.1 2.2 2.2 1.9 2.0 2.0 1.9 1.9 1.8 1.7 1.9 1.7 1.9
Women, 20 years and over:C iv ilian labor f o r c e ............................................. 21,954 21,911 21,852 21,992 21,781 21,558 21,489 21,562 21,527 21,523 21,139 21,201 21,126
E m p lo y e d ............................................................. 21,197 21,104 20,992 21,125 20,984 20,722 20,681 20,710 20,726 20,735 20,423 20,460 20,378Unem ployed ....................................................... 757 807 860 867 797 836 808 852 801 788 716 741 748Unemployment r a t e .......................................... 3.4 3.7 3.9 3.9 3.7 3.9 3.8 4.0 3.7 3.7 3.4 3.5 3.5
Part time
T ota l, 16 years and over:C iv ilian labor f o r c e ............................................. 11,206 11,285 11,066 10,978 10,885 10,914 10,764 10,984 10,994 10,815 11,075 10,681 10,566
E m p lo y e d ............................................................. 10,517 10,507 10,296 10,236 10,185 10,342 10,078 10,232 10,322 10,187 10,403 9,953 9,895U n em ployed .......................................................... 689 778 770 742 700 572 686 661 672 628 672 728 671Unemployment r a t e .......................................... 6.1 6.9 7.0 6.8 6.4 5.2 6.4 6.0 6.1 5.8 6.1 6.8 6.4NOTE: Persons on part-time schedules for economic reasons are included in the full-time employed category; unemployed persons are allocated by whether seeking full- or
Dart-time work.
Digitized for FRASER http://fraser.stlouisfed.org/ Federal Reserve Bank of St. Louis

7 3 HOUSEHOLD DATASEASONALLY ADJUSTED
A-31: Employment status by color, sex, and age , seasonally ad justed(In thousands)
1969 1968C h aracteristics
Nov. Oct. Sept. Aug. July June May Apr. Mar. Feb. Jan. Dec. Nov.
White
T ota l:C iv ilian labor f o r c e ................................................................. 72,368 72,368 72,288 71,837 71,657 71,437 71,137 71,589 71,688 71,475 71,101 70,669 70,444
E m p lo y e d ............................................................................... 70,108 69,848 69,690 69,548 69,350 69,275 68,915 69,366 69,494 69,376 68,984 68,584 68,332U n e m p lo y e d .......................................................................... 2,260 2,520 2,598 2,289 2,307 2,162 2,222 2,223 2,194 2,099 2,117 2,088 2,112Unemployment rate.............................................................. 3.1 3.5 3.6 3.2 3.2 3.0 3.1 3.1 3.1 2.9 3.0 3.0 3.0
M ales, 20 years and over:C ivilian labor f o r c e ................................................................. 41,920 41,925 41,972 41,876 41,704 41,614 41,547 41,674 41,765 41,749 41,601 41,618 41,384
Em ployed.................................................................................. 41,089 40,981 41,044 41,093 40,850 40,835 40,759 40,938 41,029 41,038 40,878 40,943 40,616U n e m p lo y e d ........................................................................... 831 944 928 783 854 779 788 736 736 711 723 675 768Unemployment rate ............................................................ 2.0 2.3 2.2 1.9 2.0 1.9 1.9 1.8 1.8 1.7 1.7 1.6 1.9
F em ales, 20 years and over:C ivilian labor force ............................................................... 24,110 24,150 24,003 23,953 23,866 23,686 23,530 23,656 23,681 23,656 23,466 23,208 23,230
E m p lo y e d ............................................................................... 23,314 23,285 23,093 23,112 23,084 22,885 22,750 22,877 22,936 22,879 22,683 22,476 22,480U n e m p lo y e d ........................................................................... 796 865 910 841 782 801 780 779 745 777 783 732 750Unemployment rate ............................................................ 3.3 3.6 3.8 3.5 3.3 3.4 3.3 3.3 3.1 3.3 3.3 3.2 3.2
Both se x e s , 16 to 19 years:C iv ilian labor fo r c e ................................................................. 6,338 6,293 6,313 6,008 6,087 6,137 6,060 6,259 6,242 6,070 6,034 5,843 5,830
E m ployed................................................................................. 5,705 5,582 5,553 5,343 5,416 5,555 5,406 5,551 5,529 5,459 5,423 5,162 5,236U n e m p lo y e d .......................................................................... 633 711 760 665 671 582 654 708 713 611 611 681 594Unemployment rate ............................................................ 10.0 11.3 12.0 11.1 11.0 9.5 10.8 H . 3 11.4 10.1 10.1 11.7 10.2
Negro and other races
T ota l:C iv ilian labor f o r c e ................................................................. 9,015 8,957 8,910 9,114 8,928 8,879 8,790 8,892 8,952 8,946 8,942 8,855 8,689
E m p lo y e d ............................................................................... 8,453 8,340 8,300 8,520 8,353 8,255 8,221 8,276 8,416 8,435 8,402 8,323 8,120U n e m p lo y e d .......................................................................... 562 617 609 594 575 624 569 616 536 511 540 532 569Unemployment rate ............................................................ 6.2 6.9 6.8 6.5 6.4 7.0 6.5 6.9 6.01 5.7 6.0 6.0 6.5
M ales, 20 years and over:C iv ilian labor f o r c e ................................................................. 4,597 4,585 4,594 4,626 4,574 4,567 4,551 4,516 4,566 4,563 4,559 4,544 4,509
Em ployed .......................................................................... 4,421 4,394 4,401 4,456 4,402 4,384 4,395 4,347 4,422 4,417 4,384 4,387 4,341U n e m p lo y e d .......................................................................... 176 191 193 170 172 183 156 169 144 146 175 157 168Unemployment rate ............................................................ 3.8 4.2 4.2 3.7 3.8 4.0 3.4 3.7 3.2 3.2 3.8 3.5 3.7
F em ales, 20 years and over:C ivilian labor f o r c e ................................................................. 3,596 3,568 3,562 3,658 3,555 3,526 3,469 3,579 3,559 3,583 3,561 3,534 3,445
E m p lo y e d ............................................................................... 3,402 3,360 3,326 3,422 3,330 3,310 3,270 3,320 3,346 3,394 3,384 3,330 3,242U n e m p lo y e d .......................................................................... 194 208 236 236 225 216 199 259 213 189 177 204 203Unemployment rate ............................................................ 5.4 5.8 6.6 6.5 6.3 6.1 5.7 7.2 6.0 5.3 5.0 5.8 5.9
Both s e x e s , 16 to 19 years:C ivilian labor force .............................................................. 822 804 754 830 799 786 770 797 827 800 822 777 735
E m p lo y e d ............................................................................... 630 586 573 642 621 561 556 609 648 624 634 606 537U n e m p lo y e d .......................................................................... 192 218 180 188 178 225 214 188 179 176 188 171 198Unemployment rate ............................................................ 23.4 27.1 23.9 22.7 22.3 28.6 27.8 23.6 21.6 22.0 22.9 22.0 26.9
Digitized for FRASER http://fraser.stlouisfed.org/ Federal Reserve Bank of St. Louis

HOUSEHOLD DATA SEASONALLY ADJUSTED
7 4 HOUSEHOLD DATASEASONALLY ADJUSTED
A -3 2 : M a jo r unem ploym ent indicators, seasonally adjusted
(Unemployment rates)
1969 1968
S e lected ca tegories Nov. Oct. Sept. Aug. July June May Apr. Mar. Feb. Jan. Dec. Mov.
T ota l (a ll c iv ilia n w o rk e rs )............................................................. 3.4 3.9 4 .0 3.5 3.6 3.4 3.5 3.5 3.4 3.3 3.3 3.3 3.4Men, 20 years and o v e r ................................................................ 2.2 2.4 2.4 2.1 2.2 2.0 2.0 2.0 1.9 1.9 2.0 1.8 2.0Women, 20 years and o v e r ............................................................. 3.5 4 .0 4.2 3.8 3.7 3.7 3.7 3.8 3.5 3.5 3.5 3.5 3.5Both s e x e s , 16-19 y e a rs ................................................................ 11.6 13.0 13.2 12.5 12.2 11.6 12.5 12.8 12.7 11.7 11.7 12.7 12.2
W h ite ....................................................................................................... 3.1 3.5 3.6 3.2 3.2 3.0 3.1 3.1 3.1 2.9 3.0 3.0 3.0N egro and other r a c e s ................................................................... 6.2 6.9 6.8 6.5 6.4 7.0 6.5 6.9 6.0 5.7 6.0 6.0 6.5
Married m en ............................................................................................. 1.5 1.7 1.7 1.5 1.6 1.5 1.5 1.5 1.4 1.4 1.4 1.4 1.6Full-tim e w o r k e r s ................................................................................ 3.0 3.2 3.4 3.1 3.1 3.1 3.1 3.2 2.9 2.8 2.9 1:1 3.0Part-time w o r k e r s ................................................................................ 6-1 6.9 7.0 6.8 6.4 5.2 6.4 6.0 6.1 5.8 6.1 6.4Unem ployed 15 w eeks and o v e r1 ................................................ .5 .5 .5 .5 .5 .5 .5 .5 .4 .4 .4 .4 .4State insured2. ....................................................................................... 2.4 2.2 2.2 2.1 2.2 2.1 2.0 2.1 2.1 2.2 2.1 2.0 2.2Labor fo rce time l o s t ^ ....................................................................... 4.0 4.4 4.4 4.1 4.1 3.9 3.5 3.7 3.7 3.6 3.6 3.6 3.8
Occupation
W hite-collar w o r k e r s .......................................................................... 2.1 2.4 2.2 2.2 2.2 2.1 1.9 1.8 2.0 1.9 1.9 1.9 2.0P ro fession a l and te c h n ic a l .......................................................... 1.2 1.7 1.5 1.3 1.5 1.3 1.4 1.1 1.2 1.1 .9 1.1 1.1Managers, o f f ic ia ls , and p ro p r ie to rs ...................................... 1.0 .9 1.1 1.0 .8 1.0 .9 .8 .9 .9 1.1 .9 1.0C ler ica l w orkers................................................................................ 3.5 3.3 3.3 3.3 3.2 3.0 2.8 2.4 3.1 2.7 3.0 2.7 3.1S ales w o r k e r s ................................................................................... 2.2 3.6 2.8 2.9 3.3 2.9 2.6 3.3 2.9 3.3 2.6 2.9 2.5
B lu e -co lla r w ork ers ............................................................................. 4.2 4.3 4.4 3.8 3 8 3 7 3.8 4.1 3.7 3.6 3.8 3.6 3.9Craftsm en and forem en................................................................... 2.2 2.4 2.6 2.2 1.9 1.9 2.4 2.2 2.2 2.1 2.1 1.9 2.3O p e r a t iv e s .......................................................................................... 4.9 5.0 4.8 4 1 4.2 4.3 4.0 4.6 3.9 4.2 4.2 4.2 4.3Nonfarm laborers ............................................................................. 7.0 6.8 7.7 6.9 7.5 5.9 6.4 6.8 7.0 5.5 6.6 6.1 6.8
S ervice w o r k e r s .................................................................................... 3.9 4.4 4.9 4.5 4.3 4.5 4.2 4.5 3.8 3.8 4.2 4.2 4.2
Farm w ork ers .......................................................................................... 1.5 1.8 2.0 2.0 2.9 2.0 1.7 1.9 2.1 1.1 1.5 1.7 1.3
Industry
P rivate w age and salary w orkers4 ............................................. 3.6 3.8 4 .0 3.6 3.6 3.5 3.5 3.6 3.4 3.3 3.4 3.3 3.4
C o n stru c tio n ....................................................................................... 5.6 7.3 7.6 7.4 5.7 5.0 5.5 6.2 6.2 5.5 5.5 5.4 6.5M anufacturing.................................................................................... 3.8 3.7 3.7 2.9 3.2 3.3 3.1 3.2 3.1 2.9 3.2 2.8 3.2
Durable g o o d s ................................................................................ 3.7 3.3 3.3 2.3 3.2 3.3 2.9 3.0 2.7 2.4 2.7 2.6 3.1Nondurable g o o d s .......................................................................... 3.8 4.2 4.4 3.8 3.2 3.3 3.4 3.4 3.7 3.6 3.9 3.3 3.3
Transportation and p u b lic u t i l it ie s .......................................... 2.4 2.8 2.0 2.0 1.9 1.9 2.8 2.3 2.4 1.8 1.8 1.6 2.1W holesale and reta il t r a d e .......................................................... 3.9 4.3 4.7 4.4 4.1 4.2 3.9 4.2 3.8 3.9 3.8 4.1 3.9Finance and se rv ice in d u s tr ie s ................................................ 3.1 3.2 3.5 3.5 3.7 3.2 3.4 3.3 2.9 3.1 3.1 3.2 3.0
Government w age and salary w orkers.......................................... 2.1 2.5 1.9 1.9 1.9 1.8 1.7 1.6 1.6 1.7 1.8 1.7 1.8
Agricultural w age and salary w o r k e r s ................................ ... . 5.0 6.6 7.4 7.0 9.1 5.5 4.9 5.7 5.9 4.1 5.8 5.7 4.5
^Unemployment rate calculated as a percent of civilian labor force.^Insured unemployment under State programs as a percent of average covered employment.^Man-hours lost by the unemployed and persons on part time for economic reasons as a percent of potentially available labor force man-hours. ^Includes mining, not shown separately.
Digitized for FRASER http://fraser.stlouisfed.org/ Federal Reserve Bank of St. Louis

75 HOUSEHOLD DATASEASONALLY ADJUSTED
A -33: Unemployed persons by duration of unemployment, seasonally adjusted
(In t h o u s a n d s )
D u ra tio n o f u n e m p lo y m e n t
1 9 6 9 1 9 6 8
Nov. Oct. Sept. Aug. July June May Apr. Mar. Feb. Jan. Dec. Nov.
L e s s th an 5 w e e k s ................................................................................... 1 , 5 6 4 1 , 8 5 7 1 , 8 1 8 1 , 6 3 6 1 , 6 7 7 1 , 5 9 1 1 , 7 7 7 1 , 7 2 4 1 , 6 4 6 1 , 4 3 6 1 , 4 7 6 1 , 3 6 3 1 , 5 7 65 t o 14 w e e k s .............................................................................................. 9 1 0 9 4 8 1 , 0 0 0 8 6 1 8 3 0 8 1 3 6 2 9 7 3 7 7 5 7 8 2 9 7 4 1 8 2 5 7 8 515 w e e k s a n d o v e r ................................................................................... 3 8 4 3 7 0 3 8 9 3 8 2 4 1 9 3 8 3 4 0 9 3 9 3 3 5 5 3 4 6 3 1 6 3 2 2 3 4 8
15 t o 2 6 w e e k s ................................................................................... 2 4 4 2 4 0 2 3 3 2 4 4 2 4 4 2 5 8 2 7 8 2 5 4 2 3 7 2 3 7 1 9 3 1 7 7 2 2 12 7 w e e k s a n d o v e r ............................................................................. 1 4 0 1 3 0 1 5 6 1 3 8 1 7 5 1 2 5 1 3 1 1 3 9 1 1 8 1 0 9 1 2 3 1 4 5 1 2 7
A -34: Ratos of unemployment by age and sex, seasonally adjusted
A g e a n d s e x
1 9 6 9 1 9 6 8
N o v . O c t . S e p t . A u g . J u l y J u n e M a y A p r . M a r . F e b . J a n . D e c . N o v .
Total, 16 y e a r s a n d o v e r .................................................................. 3 . 4 3 . 9 4 . 0 3 . 5 3 . 6 3 . 4 3 . 5 3 . 5 3 . 4 3 . 3 3 . 3 3 . 3 3 . 4
16 t o 19 y e a r s ........................................................................................ 1 1 . 6 1 3 . 0 1 3 . 2 1 2 . 5 1 2 . 2 1 1 . 6 1 2 . 5 1 2 . 8 1 2 . 7 1 1 . 7 1 1 . 7 1 2 . 7 1 2 . 21 6 an d 17 y e a r s .......................................................................... .... 1 4 . 2 1 6 . 8 1 6 . 7 1 6 . 1 1 4 . 7 1 3 . 4 1 3 . 8 1 4 . 5 1 4 . 0 1 3 . 1 1 3 . 5 1 5 . 0 1 3 . 718 an d 19 y e a r s ................................................................................ 9 . 0 1 0 . 6 1 0 . 8 9 . 9 1 0 . 4 1 0 . 0 1 1 . 8 1 1 . 5 1 1 . 6 1 1 . 1 1 0 . 5 1 0 . 9 1 0 . 5
2 0 to 2 4 y e a r s .......................................................................................... 5 . 9 6 . 5 6 . 7 5 . 4 5 . 9 5 . 3 5 . 4 5 . 7 5 . 3 5 . 5 5 . 2 5 . 3 5 . 925 y e a r s an d o v e r ................................................................................ 2 . 2 2 . 4 2 . 5 2 . 3 2 . 3 2 . 2 2 . 2 2 . 2 2 . 1 2 . 1 2 . 1 2 . 0 2 . 1
2 5 t o 5 4 y e a r s .................................................................................. 2 . 4 2 . 4 2 . 5 2 . 4 2 . 3 2 . 3 2 . 3 2 . 3 2 . 2 2 . 0 2 . 2 2 . 0 2 . 255 y e a r s a n d o v e r .......................................................................... 2 . 0 2 . 4 2 . 3 2 . 0 2 . 1 2 . 0 1 . 7 2 . 0 1 . 9 2 . 0 1 . 9 2 . 1 2 . 1
Moles, 16 y e a r s a n d o v e r .................................................................. 2 . 9 3 . 2 3 . 2 2 . 7 3 . 0 2 . 7 2 . 7 2 . 7 2 . 6 2 . 6 2 . 7 2 . 6 2 . 7
1 6 t o 19 y e a r s ........................................................................................ 1 1 . 5 1 2 . 2 1 2 . 1 1 1 . 1 1 2 . 0 1 0 . 4 1 1 . 0 1 1 . 4 1 1 . 5 1 1 . 0 1 1 . 8 1 1 . 6 1 1 . 31 6 a n d 17 y e a r s ............................................................................... 1 4 . 0 1 5 . 1 1 5 . 0 1 5 . 7 1 4 . 7 1 2 . 7 1 3 . 9 1 2 . 6 1 2 . 9 1 2 . 5 1 3 . 2 1 4 . 2 1 3 . 71 8 a n d 1 9 y e a r s ................................................................................ 8 . 6 1 0 . 0 9 . 6 7 . 6 1 0 . 0 8 . 3 8 . 8 1 0 . 4 1 0 . 2 9 . 5 1 0 . 6 9 . 5 8 . 6
2 0 to 24 y e a r s ......................................................................................... 5 . 3 6 . 5 6 . 3 4 . 5 5 . 5 4 . 8 4 . 8 4 . 7 4 . 5 4 . 9 5 . 0 4 . 2 4 . 725 y e a r s a n d o v e r ................................................................................ 1 . 8 1 . 9 1 . 9 1 . 7 1 . 8 1 . 6 1 . 7 1 . 6 1 . 6 1 . 5 1 . 6 1 . 5 1 . 7
25 t o 54 y e a r s ................................................................................... 1 . 8 1 . 8 1 . 8 1 . 7 1 . 7 1 . 6 1 . 8 1 . 6 1 . 5 1 . 4 1 . 5 1 . 4 1 . 755 y e a r s an d o v e r .......................................................................... 2 . 0 2 . 2 2 . 0 2 . 0 2 . 0 1 . 8 1 . 6 1 . 7 1 . 8 1 . 7 1 . 9 1 . 9 2 . 0
Females, 16 y e a r s a n d o v e r ............................................................. 4 . 3 5 . 0 5 . 3 4 . 9 4 . 6 4 . 7 4 . 8 4 . 9 4 . 6 4 . 5 4 . 3 4 . 5 4 . 4
1 6 t o 19 y e a r s ................... .................................................................... 1 1 . 8 1 4 . 0 1 4 . 6 1 4 . 1 1 2 . 5 1 2 . 9 1 4 . 5 1 4 . 5 1 4 . 3 1 2 . 7 1 1 . 6 1 4 . 1 1 3 . 31 6 and 17 y e a r s ............................................................................. 1 4 . 5 1 9 . 0 1 9 . 2 1 6 . 7 1 4 . 8 1 4 . 3 1 3 . 5 1 6 . 9 1 5 . 6 1 3 . 9 1 4 . 0 1 6 . 2 1 3 . 71 8 and 1 9 y e a r s ............................................................................. 9 . 5 1 1 . 2 1 2 . 1 1 2 . 3 1 0 . 8 1 1 . 9 1 5 . 2 1 2 . 7 1 3 . 3 1 3 . 0 1 0 . 4 1 2 . 6 1 2 . 8
2 0 t o 2 4 y e a r s ........................................................................................ 6 . 6 6 . 5 7 . 1 6 . 4 6 . 3 5 . 9 6 . 1 6 . 8 6 . 3 6 . 1 5 . 5 6 . 5 7 . 225 y e a r s an d o v e r ................................................................................ 3 . 0 3 . 4 3 . 5 3 . 3 3 . 2 3 . 3 3 . 1 3 . 2 3 . 0 3 . 1 3 . 2 2 . 9 2 . 9
25 t o 5 4 y e a r s ................................................................................... 3 . 4 3 . 6 3 . 7 3 . 6 3 . 5 3 . 6 3 . 4 3 . 6 3 . 3 3 . 2 3 . 4 3 . 1 3 . 155 y e a r s a n d o v e r ........................................................................... 2 . 0 2 . 6 2 . 7 2 . 1 2 . 3 2 . 3 1 . 8 2 . 4 1 . 9 2 . 5 1 . 9 2 . 4 2 . 5
Digitized for FRASER http://fraser.stlouisfed.org/ Federal Reserve Bank of St. Louis

HOUSEHOLD DATA 76 HOUSEHOLD DATASEASONALLY ADJUSTED SEASONALLY ADJUSTED
A -3 5 : Employed persons by ag e and sex, seasonally ad jus ted
(In th o u s a n d s )
1969 1968
A g e and s e x
Nov. O c t . Sept. Aug. July June May Apr. Mar. Feb. Jan. Dec. Nov.
T o ta l
16 y e a r s a n d o v e r ................................................................................. 78,497 78,325 78,127 78,187 77,874 77,671 77,265 77,605 77,767 77,729 77,229 76,765 76,388
16 to 19 y e a r s .................................................................................. 6,315 6,190 6,166 6,014 6,076 6,160 5,992 6,151 6,117 6,043 5,999 5,709 5,74616 a n d 17 y e a r s .......................................................................... 2,687 2,612 2,601 2,457 2,509 2,548 2,512 2,652 2,660 2,570 2,524 2,394 2,37318 a n d 19 y e a r s .......................................................................... 3,642 3,568 3,546 3,526 3,509 3,594 3,443 3,518 3,533 3,492 3,527 3,364 3,387
2 0 to 2 4 y e a r s .................................................................................. 9,496 9,430 9,408 9,493 9,365 9,384 9,176 9,237 9,222 9,165 9,026 8,955 8,91425 y e a r s a n d o v e r .......................................................................... 62,741 62,713 62,538 62,671 62,387 62,096 62,101 62,203 62,416 62,552 62,217 62,121 61,777
25 to 5 4 y e a r s ............................................................................. 48,626 48,533 48,416 48,471 48,259 48,047 48,056 48,106 48,326 48,466 48,366 48,127 47,81155 y e a r s a n d o v e r ..........................................................*• • • • 14,081 14,086 14,089 14,156 14,022 13,954 13,992 14,131 14,160 14,113 13,973 14,016 13,931
M a le
49,022 48,825 48,939 48,864 48,638 48,653 48,609 48,766 48,919 48,875 48,686 48,579 48,235
16 to 19 y e a r s .................................................................................. 3,535 3,401 3,497 3,313 3,345 3,393 3,382 3,481 3,497 3,453 3,455 3,325 3,29516 a n d 17 y e a r s .......................................................................... 1,593 1,528 1,588 1,445 1,482 1,496 1,472 1,559 1,608 1,557 1,532 1,463 1,44418 a n d 19 y e a r s .......................................................................... 1,956 1,887 1,908 1,850 1,822 1,894 1,874 1,923 1,937 1,919 1,950 1,890 1,864
20 to 24 y e a r s .................................................................................. 5,087 5,055 5,074 5,125 5,037 5,061 5,005 4,977 4,923 4,887 4,814 4,921 4,83025 y e a r s a n d o v e r .......................................................................... 40,386 40,369 40,373 40,429 40,236 40,191 40,215 40,298 40,494 40,568 40,407 40,356 40,091
25 to 54 y e a r s ............................................................................. 31,322 31,273 31,267 31,336 31,263 31,207 31,185 31,216 31,393 31,466 31,422 31,339 31,08355 y e a r s a n d o v e r ..................................................................... 9,068 9,069 9,091 9,068 8,954 8,936 9,003 9,084 9,127 9,111 9,063 9,040 9,010
F e m a le
16 y e a r s a n d o v e r ................... ........................................................... 29,475 29,500 29,188 29,323 29,236 29,018 28,656 28,839 28,848 28,854 28,543 28,186 28,153
16 to 19 y e a r s .................................................................................. 2,708 2,789 2,669 2,701 2,731 2,767 2,610 2,670 2,620 2,590 2,544 2,384 2,45116 a n d 17 y e a r s .......................................................................... 1,094 1,084 1,013 1,012 1,027 1,052 1,040 1,093 1,052 1,013 992 931 92918 a n d 19 y e a r s .......................................................................... 1,686 1,681 1,638 1,676 1,687 1,70C 1,569 1,595 1,596 1,573 1,577 1,474 1,523
20 to 2 4 y e a r s .................................................................................. 4,409 4,375 4,334 4,368 4,328 4,323 4,171 4,260 4,299 4,278 4,212 4,034 4,0842 5 y e a r s an d o v e r .......................................................................... 22,355 22,344 22,165 22,242 22,151 21,905 21,886 21,905 21,922 21,984 21,810 21,765 21,686
25 to 5 4 y e a r s ............................................................................. 17,304 17,260 17,149 17,135 16,996 16,84( 16,871 16,890 16,933 17,000 16,944 16,788 16,72855 y e a r s and o v e r ..................................................................... 5,013 5,017 4,998 5,088 5,068 5,018 4,989 5,047 5,033 5,002 4,911 4,976 4,921
A -3 6 : Employed persons by m ajor occupation group, seasonally ad justed
(In th o u s a n d s )
O c c u p a t io n g rou p
1969 1968
Nov. O c t . Sept. Aug. July June May Apr. Mar. Feb. Jan. Dec. Nov.
W h it e - c o l la r w o r k e r s ............................................................................. 37,514 37,436 37,099 36,975 36,802 36,920 36,722 36,458 36,346 36,179 36,125 35,869 35,990P r o f e s s i o n a l a n d t e c h n i c a l ....................................................... 10,897 10,882 10,730 10,677 10,889 10,811 10,756 10,759 10,714 10,521 10,648 10,477 10,550M a n a g e r s , o f f i c i a l s , a n d p r o p r i e t o r s ................................. 8,205 8,086 8,102 7,958 7,915 7,908 8,044 8,003 7,855 7,773 7,855 7,813 7,892C le r i c a l w o r k e r s ................................................................................ 13,544 13,751 13,573 13,594 13,282 13,433 13,279 13,120 13,152 13,268 13,055 12,940 12,828S a le s w o r k e r s ........................................................................................ 4,868 4,717 4,694 4,746 4,716 4,768 4,643 4,576 4,625 4,617 4,567 4,639 4,720
B lu e - c o l la r w o r k e r s ................................................................................ 28,334 28,366 28,499 28,489 28,347 28,032 27,603 27,990 28,220 28,395 28,151 28,051 27,622C r a fts m e n a n d fo r e m e n .................................................................. 10,258 10,195 10,093 10,179 10,160 10,085 9,957 10,019 10,211 10,460 10,330 10,306 10,140O p e r a t i v e s ............................................................................................. 14,347 14,550 14,706 14,617 14,560 14,260 14,050 14,199 14,345 14,327 14,206 14,114 13,397N on fa rm la b o r e r s ................................................................................ 3,729 3,621 3,700 3,693 3,627 3,687 3,596 3,772 3,664 3,608 3,615 3,631 3,585
S e r v ic e w o r k e r s ........................................................................................ 9,574 9,514 9,505 9,447 9,448 9,372 9,353 9,673 9,703 9,605 9,418 9,453 9,445F a rm e rs a n d farm l a b o r e r s ............................................................... 3,077 2,992 3,170 3,282 3,235 3,438 3,522 3,381 3,436 3,591 3,411 3,421 3,350
Digitized for FRASER http://fraser.stlouisfed.org/ Federal Reserve Bank of St. Louis

B-l: Employees on nonagricultural payrolls, by industry division1919 to date
77 ESTABLISHMENT DATAHISTORICAL EMPLOYMENT
(In thousands)
Year and month TOTAL MiningContractconstruc
tion
Manufacturing
Transportation and
public utilities
Wholesale and retail trade Finance, insurance, and real estate
Services
Government
Total Wholesaletrade
Retailtrade
Total Federal State and local
1 9 1 9 ........................... 2 7 ,0 8 8 1 ,1 3 3 1 ,0 2 1 1 0 ,6 5 9 3 , 7 U 4 ,5 1 4 - _ 1 ,1 1 1 2 ,2 6 3 2 ,6 7 6 - -1 9 2 0 ........................... 2 7 ,3 5 0 1 ,2 3 9 8 18 1 0 ,6 5 8 3 ,9 9 8 M 6 7 - - 1 ,1 7 5 2 ,3 6 2 2 ,6 0 3 - -1 9 2 1 ........................... 2*4-, 382 9 6 2 1 ,0 1 2 8 ,2 5 7 3 ,4 5 9 4 ,5 8 9 - - 1 ,1 6 3 2 ,4 1 2 2 ,5 2 8 - -1 9 2 2 ........................... 2 5 ,8 2 7 9 29 1 ,1 8 5 9,120 3 ,5 0 5 4 ,9 0 3 - - 1 ,1 4 4 2 ,5 0 3 2 ,5 3 8 - -1 9 2 3 ........................... 2 8 ,3 9 4 1,212 1 ,2 2 9 1 0 ,3 0 0 3 ,8 8 2 5 ,2 9 0 - 1 ,1 9 0 2 ,6 8 4 2 ,6 0 7 - -
1 9 2 4 ........................... 28,0*40 1,101 1 ,3 2 1 9 ,6 7 1 3 ,8 0 7 5 ,4 0 7 _ _ 1 ,2 3 1 2 ,7 8 2 2 ,7 2 0 _ _1 9 2 5 ........................... 2 8 ,7 7 8 1 ,0 8 9 1 ,1 1 6 9 ,9 3 9 3 ,8 2 6 5 ,5 7 6 - - 1 ,2 3 3 2 ,8 6 9 2 ,8 0 0 _ _1 9 2 6 ........................... 2 9 ,8 1 9 1 ,1 8 5 1 ,5 5 5 1 0 ,1 5 6 3 ,9 4 2 5 ,7 8 4 - - 1 ,3 0 5 3 ,0 4 6 2 ,8 4 6 - -1 9 2 7 ........................... 2 9 ,9 7 6 1,111 1 ,6 0 8 10,001 3 ,8 9 5 5 ,9 0 8 - - 1 ,3 6 7 3 ,1 6 8 2 ,9 1 5 - -1 9 2 8 ........................... 3 0 ,0 0 0 1 ,0 5 0 1 ,6 0 6 9 ,9 4 7 3,828 5 ,8 7 4 - " 1 ,4 3 5 3 ,2 6 5 2 ,9 9 5 "
1 9 2 9 ........................... 3 1 ,3 3 9 1 ,0 8 7 1 ,4 9 7 1 0 ,7 0 2 3 ,9 1 6 6 ,1 2 3 _ _ 1 ,5 0 9 3 ,4 4 0 3 ,0 6 5 533 2 ,5 3 21 9 3 0 ........................... 2 9 , *4-2*4 1 ,0 0 9 1 ,3 7 2 9 ,5 6 2 3 ,6 8 5 5 ,7 9 7 - - 1 ,4 7 5 3 ,3 7 6 3 ,1 4 8 526 2 ,6 2 21 9 3 1 ........................... 26,6*49 8 7 3 1,211 8 ,1 7 0 3 ,2 5 4 5 ,2 8 4 - - 1 ,4 0 7 3 ,1 8 3 3 ,2 6 4 560 2 ,7 0 41 9 3 2 ........................... 2 3 ,6 2 8 7 31 970 6 ,9 3 1 2,816 4 ,6 8 3 - - 1 ,3 4 1 2 ,9 3 1 3 ,2 2 5 559 2,6661 9 3 3 ........................... 2 3 , 7 H 7l l 8 0 9 7 ,3 9 7 2 ,6 7 2 4 ,7 5 5 “ 1 ,2 9 5 2 ,8 7 3 3 ,1 6 6 565 2 ,6 0 1
1 9 3 ^ ........................... 2 5 ,9 5 3 8 8 3 8 62 8 ,5 0 1 2 ,7 5 0 5 ,2 8 1 _ _ 1 ,3 1 9 3 ,0 5 8 3 ,2 9 9 6 52 2 ,6 4 71 9 3 5 ........................... 2 7 ,0 5 3 8 9 7 912 9 ,0 6 9 2 ,7 8 6 5 ,4 3 1 - - 1 ,3 3 5 3 ,1 4 2 3 ,4 8 1 753 2 ,7 2 81 9 3 6 ........................... 29,082 916 1 ,1 4 5 9 ,8 2 7 2 ,9 7 3 5 ,8 0 9 - - 1 ,3 8 8 3 ,3 2 6 3 ,6 6 8 826 2 ,8 4 21 9 3 7 ........................... 3 1 ,0 2 6 1 ,0 1 5 1,112 1 0 ,7 9 4 3 ,1 3 4 6 ,2 6 5 - - 1 ,4 3 2 3 ,5 1 8 3 ,7 5 6 8 3 3 2 ,9 2 31 9 3 8 ........................... 2 9 ,2 0 9 8 91 1 ,0 5 5 9,110 2 ,8 6 3 6 ,1 7 9 " 1 ,4 2 5 3 ,4 7 3 3 ,8 8 3 8 29 3 ,0 5 4
1 9 3 9 ........................... 3 0 ,6 1 8 8 51 1 ,1 5 0 1 0 ,2 7 8 2 ,9 3 6 6 ,4 2 6 1 ,6 8 4 4 ,7 4 2 1 ,4 6 2 3 ,5 1 7 3 ,9 9 5 9 05 3 ,0 9 01 9 4 0 ........................... 3 2 ,3 7 6 925 1 ,2 9 4 1 0 ,9 8 5 3 ,0 3 8 6 ,7 5 0 1 ,7 5 4 4 ,9 9 6 1 ,5 0 2 3 ,6 8 1 4 ,2 0 2 9 96 3 ,2 0 61 9 H ........................... 3 6 ,5 5 4 9 57 1 ,7 9 0 1 3 ,1 9 2 3 ,2 7 4 7,210 1 ,8 7 3 5 ,3 3 8 1 ,5 4 9 3 ,9 2 1 4 ,6 6 0 1,3*10 3 ,3 2 019*4-2........................... *40,125 9 92 2 ,1 7 0 1 5 ,2 8 0 3 ,4 6 0 7 ,1 1 8 1 ,8 2 1 5 ,2 9 7 1 ,5 3 8 4 ,0 8 4 5 ,4 8 3 2 ,2 1 3 3 ,2 7 01 9 ^ 3 ........................... *42, *452 925 1 ,5 6 7 1 7 ,6 0 2 3 ,6 4 7 6 ,9 8 2 1 ,7 4 1 5 ,2 4 1 1 ,5 0 2 4 ,1 4 8 6 ,0 8 0 2 ,9 0 5 3,17**
1 9 4 4 ........................... *41,883 8 92 1 ,0 9 1 1 7 ,3 2 8 3 ,8 2 9 7 ,0 5 8 1 ,7 6 2 5 ,2 9 6 1 ,4 7 6 4 ,1 6 3 6 ,0 4 3 2,928 3 ,1 1 619*4-5........................... *40,391 8 36 1 ,1 3 2 1 5 ,5 2 4 3 ,9 0 6 7 ,3 1 4 1 ,8 6 2 5 ,4 5 2 1 ,4 9 7 4 ,2 4 1 5 ,9 4 4 2,808 3 ,1 3 719*4-6........................... *41,67*4 8 6 2 1 ,6 6 1 1 4 ,7 0 3 4 ,0 6 1 8 ,3 7 6 2 ,1 9 0 6 ,1 8 6 1 ,6 9 7 4 ,7 1 9 5 ,5 9 5 2,2 5 k 3 , 3 k l1 9 4 7 ...................... .. *43,881 9 55 1 ,9 8 2 1 5 ,5 4 5 4 ,1 6 6 8 ,9 5 5 2 ,3 6 1 6 ,5 9 5 1 ,7 5 4 5 ,0 5 0 5 ,4 7 4 1,892 3 ,5 8 21 9 4 8 ........................... *4*4,891 9 9 l 2 ,1 6 9 1 5 ,5 8 2 4 ,1 8 9 9 ,2 7 2 2 ,4 8 9 6 ,7 8 3 1 ,8 2 9 5 ,2 0 6 5 ,6 5 0 1 ,8 6 3 3 ,7 8 7
1 9 1 9 ........................... *43,778 9 30 2 ,1 6 5 1 4 ,4 4 1 4 ,0 0 1 9 ,2 6 4 2 ,4 8 7 6 ,7 7 8 1 ,8 5 7 5 ,2 6 4 5 ,8 5 6 1,908 3 ,9 k 81 9 5 0 ........................... *45,222 9 01 2 ,3 3 3 1 5 ,2 4 1 4 ,0 3 4 9 ,3 8 6 2 ,5 1 8 6,868 1 ,9 1 9 5 ,3 8 2 6 ,0 2 6 1,928 k ,0 9 81 9 5 1 ........................... *47,8*49 9 2 9 2 ,6 0 3 1 6 ,3 9 3 4 ,2 2 6 9,7*1-2 2 ,6 0 6 7 ,1 3 6 1 ,9 9 1 5 ,5 7 6 6 ,3 8 9 2 ,3 0 2 k ,0 8 71 9 5 2 ........................... *48,825 8 9 8 2 ,6 3 1 1 6 ,6 3 2 4 ,2 4 8 1 0 ,0 0 4 2 ,6 8 7 7 ,3 1 7 2 ,0 6 9 5 ,7 3 0 6 ,6 0 9 2 ,4 2 0 k , l 8 81 9 5 3 ........................... 5 0 ,2 3 2 866 2 ,6 2 3 1 7 ,5 4 9 4 ,2 9 0 1 0 ,2 4 7 2 ,7 2 7 7 ,5 2 0 2 ,1 4 6 5 ,8 6 7 6 ,6 4 5 2 ,3 0 5 k ,3 k 0
1 9 5 k ........................... *49,022 7 91 2 ,6 1 2 1 6 ,3 1 4 4 ,0 8 4 1 0 ,2 3 5 2 ,7 3 9 7 ,4 9 6 2 ,2 3 4 6,002 6 ,7 5 1 2 ,1 8 8 k ,5 6 31 9 5 5 ........................... 5 0 ,6 7 5 7 92 2,802 16,882 4 , l 4 l 1 0 ,5 3 5 2 ,7 9 6 7 ,7 4 0 2,3 3 5 6 ,2 7 4 6 ,9 1 4 2 ,1 8 7 k ,7 2 71 9 5 6 ........................... 5 2 , *408 8 2 2 2 ,9 9 9 1 7 ,2 4 3 4 ,2 4 4 1 0 ,8 5 8 2 ,8 8 4 7 ,9 7 4 2 ,4 2 9 6 ,5 3 6 7 ,2 7 7 2 ,2 0 9 5 ,0 6 91 9 5 7 ........................... 52,89*4 8 28 2 ,9 2 3 1 7 ,1 7 4 4 ,2 4 1 10,886 2 ,8 9 3 7 ,9 9 2 2 ,4 7 7 6 ,7 4 9 7 ,6 1 6 2 ,2 1 7 5 ,3 9 91 9 5 8 ........................... 5 1 ,3 6 3 751 2 ,7 7 8 1 5 ,9 4 5 3 ,9 7 6 1 0 ,7 5 0 2 ,8 4 8 7 ,9 0 2 2 ,5 1 9 6 ,8 0 6 7 ,8 3 9 ' 2 ,1 9 1 5,6 k 8
1 9 5 9 ........................... 5 3 ,3 1 3 7 3 2 2 ,9 6 0 1 6 ,6 7 5 4 ,0 1 1 1 1 ,1 2 7 2 ,9 4 6 8,182 2 ,5 9 4 7 ,1 3 0 8 ,0 8 3 2 ,2 3 3 5 ,8 5 0I 9 6 0 ........................... 51,23*+ 7 12 2 ,8 8 5 1 6 ,7 9 6 4 ,0 0 4 1 1 ,3 9 1 3 ,0 0 4 8 ,3 8 8 2 ,6 6 9 7 ,4 2 3 8 ,3 5 3 2 ,2 7 0 6 ,0 8 31 9 6 1 ........................... 51,0*42 6 72 2 ,8 1 6 1 6 ,3 2 6 3 ,9 0 3 1 1 ,3 3 7 2 ,9 9 3 8 ,3 4 4 2 ,7 3 1 7 ,6 6 4 8 ,5 9 4 2 ,2 7 9 6 ,3 1 51 9 6 2 ........................... 5 5 ,5 9 6 650 2 ,9 0 2 1 6 ,8 5 3 3 ,9 0 6 1 1 ,5 6 6 3 ,0 5 6 8 ,5 1 1 2 ,8 0 0 8 ,0 2 8 8 ,8 9 0 2 ,3 4 0 6 ,5 5 01 9 6 3 ........................... 5 6 ,7 0 2 635 2 ,9 6 3 1 6 ,9 9 5 3 ,9 0 3 1 1 ,7 7 8 3 ,1 0 4 8 ,6 7 5 2 ,8 7 7 8 ,3 2 5 9 ,2 2 5 2 ,3 5 8 6,868196*+............................ 5 8 , 331 6 3 I 3 ,0 5 0 1 7 ,2 7 4 3 ,9 5 1 12,160 3 ,1 8 9 8 ,9 7 1 2 ,9 5 7 8 ,7 0 9 9 ,5 9 6 2 ,3 4 8 7,2 k 81 9 6 5 ........................... 6 0 ,8 1 5 6 32 3 ,1 8 6 18,062 4 ,0 3 6 1 2 ,7 1 6 3 ,3 1 2 9 ,4 o 4 3 ,0 2 3 9 ,0 8 7 1 0 ,0 7 4 2 ,3 7 8 7 ,6 9 61 9 6 6 ........................... 6 3 ,9 5 5 6 27 3 ,2 7 5 1 9 ,2 1 4 4 ,1 5 1 1 3 ,2 4 5 3 ,4 3 7 9 ,8 0 8 3,100 9 ,5 5 1 1 0 ,7 9 2 2 ,5 6 4 8 ,2 2 71 9 6 7 ........................... 6 5 ,8 5 7 6 1 3 3 ,2 0 8 1 9 ,4 4 7 4 ,2 6 1 1 3 ,6 0 6 3 ,5 2 5 10,081 3 ,2 2 5 1 0 ,0 9 9 1 1 ,3 9 8 2 ,7 1 9 8 ,6 7 91 9 6 8 ............................ 6 7 ,8 6 0 610 3 ,2 6 7 1 9 ,7 6 8 4 ,3 1 3 1 4 ,0 8 1 3 ,6 1 8 1 0 ,4 6 4 3 ,3 8 3 1 0 ,5 9 2 1 1 ,8 4 6 2 ,7 3 7 9 ,1 0 91 9 6 8 : November. 69,218 6 21 3 ,3 7 9 2 0 ,0 3 6 4 ,3 7 3 1 4 ,5 3 6 3 ,7 0 2 1 0 ,8 3 4 3 ,4 3 9 1 0 ,7 5 5 1 2 ,1 0 9 2 ,7 0 3 9 ,k o 6
December. 6 9 ,8 0 5 6 19 3 , 2 I 7 20,008 4 ,3 7 0 1 5 ,1 1 3 3 ,7 1 5 1 1 ,3 9 8 3 ,4 4 9 1 0 ,7 7 3 1 2 ,2 2 6 2 ,7 6 9 9 ,k 5 71 9 6 9 : J a n u a ry .. 6 8 ,1 9 6 6 11 3,021 1 9 ,8 0 3 4 ,2 8 8 1 4 ,1 8 9 3 ,6 7 1 1 0 ,5 1 8 3 ,4 4 8 1 0 ,6 9 3 1 2 ,1 4 0 2 ,7 3 5 9 ,k 0 5
Febru ary. 6 8 ,1 0 3 610 2 ,9 9 9 1 9 ,8 9 1 4 ,3 0 3 1 ^ ,0 9 7 3,666 1 0 ,4 3 1 3 ,4 6 7 1 0 ,7 9 2 1 2 ,2 4 4 2 ,7 3 9 9 ,5 0 5M arch .••. 6 8 ,8 9 1 610 3 ,0 7 7 1 9 ,9 7 8 4 ,3 4 6 1 4 ,2 0 1 3 ,6 7 8 1 0 ,5 2 3 3 ,4 9 0 1 0 ,9 1 3 1 2 ,2 7 9 2 ,7 3 7 9 ,5 k 2A p r i l . . . . 69,162 6 19 3 ,2 5 5 1 9 ,9 5 2 4 ,4 0 3 1 4 ,3 9 8 3,688 1 0 ,7 1 0 3 ,5 1 7 1 1 ,0 4 4 1 2 ,2 7 4 2 ,7 4 7 9 ,5 2 7May.............. 6 9 ,9 2 9 62! 3, l o ! 1 9 ,9 8 2 4 ,4 3 1 1 4 ,5 1 7 3 ,7 0 9 1 0 ,8 0 8 3 ,5 3 4 1 1 ,1 3 1 1 2 ,3 0 6 2 ,7 4 0 9 ,5 6 6June........... „ - 7 0 ,9 8 0 6 38 3 ,6 0 1 2 0 ,3 3 6 4 ,5 1 2 1 4 ,7 1 7 3 ,7 9 3 1 0 ,9 2 4 3 ,5 8 5 1 1 ,2 4 3 1 2 ,3 4 8 2 ,8 3 2 9 ,5 1 6J u ly ........... 7 0 ,3 1 7 615 3 ,6 8 1 2 0 ,1 1 4 4 ,5 2 8 1 4 ,6 6 2 3,818 1 0 ,8 4 4 3 ,6 2 9 1 1 ,2 6 6 11,822 2 ,8 4 1 8 ,9 8 1A u g u s t . . • 7 0 ,6 0 7 617 3 ,7 0 7 2 0 ,4 3 5 4 ,5 3 3 1 4 ,6 6 0 3,821 1 0 ,8 3 9 ^ 642 1 1 ,2 5 3 1 1 ,7 3 0 2 ,8 0 4 8*926September 70,811 6 39 3 ,6 6 3 2 0 ,4 2 1 4 ,5 2 9 1 4 ,7 0 2 3 ,8 0 6 1 0 ,8 9 6 3 ,5 9 7 1 1 ,1 8 3 1 2 ,0 8 0 2 ,7 3 3 9 ,3 k 7O c to b e r . . 7 1 ,1 8 8 6 33 3 ,6 2 0 2 0 ,3 3 8 4 ,5 0 8 1 4 ,8 6 5 3 ,§ 3 5 1 1 ,0 3 0 3 ,5 9 0 1 1 ,2 4 6 1 2 ,3 8 8 2 ,7 1 5 9 ,6 7 3November. 7 1 ,2 1 1 6 29 3 ,5 2 1 20,121 4 ,5 1 2 15,118 3 ,8 4 3 1 1 ,2 7 5 3 ,5 9 7 11,211 1 2 ,5 0 5 2,712 9 ,7 9 3
NOTE: Data include Alaska and Hawaii beginning 1959- This inclusion has resulted in an increase of 212,000 (0.4 percent) in the nonagricultural total for the March 1959 benchmark month. Data for the 2 most recent months are preliminary.
Digitized for FRASER http://fraser.stlouisfed.org/ Federal Reserve Bank of St. Louis

ESTABLISHMENT DATAEMPLOYMENT
78
B-2: Employees on nonogricultural p a yro lls , by industry
(In t h o u s a n d s )
S ICC O D E In d u stry
A l l e m p lo y e e s P r o d u c t io n w o r k e r s 1N ov.1969
O ct.1969
Sept.1969
N ov.1968
O ct.1968
N ov.1969
O ct.1969
Sept.1969
N ov.1968
O ct.1968
-TO TAL ................................................................. 71,214 71,188 70,814 69, 248 68,960
- PR IVATE S E C T O R ......................................... 58,709 58,800 58,734 57,139 56,923 48,648 48,748 48,718 47,464 47,247
- M IN IN G ................................................................. 629 633 639 621 574 481 484 490 474 431
10 M E T A L M I N I N G ................................................................... 93. 2 94. 4 88. 1 88. 0 75. 2 76. 3 70. 9 70. 7101 Iron o r e s ................................................................................. _ 25. 3 26. 3 24. 3 24. 4 20. 7 21. 5 19. 8 1 9 .9102 C o p p e r o r e s ................................. ....................................... - 38. 1 38. 1 34. 9 34. 6 - 30. 5 30. 5 27. 7 27. 4
1 1 ,1 2 C O A L M I N I N G ...................................................................... 137. 7 137. 3 136. 1 9 0 .4 119. 5 119. 3 117. 3 75. 712 B itu m in o u s c o a l a n d l i g n i t e m i n i n g . ...............
-131. 3 131. 0 129. 8 84. 1
-113. 8 113. 7 1 11 .9 70. 3
13 O IL A N D G A S E X T R A C T I O N .................................. 280. 8 284. 7 278. 7 276. 8 189. 2 192. 8 188. 8 187. 31 3 1 ,2 C ru d e p e tr o le u m a n d n a tu r a l g a s f i e l d s . . . 141. 3 144. 3 146. 0 146. 2 72. 1 74. 4 7 5 .9 76. 31 3 8 O i l a n d g a s f i e l d s e r v i c e s ..................................... ~ 139. 5 140 .4 132. 7 130. 6
-117. 1 118 .4 112. 9 1 1 1 . 0
14 N O N M E T A L L IC M IN E R A L S , E X C E P T F U E L S 121. 3 122. 6 118. 2 119. 0 100. 2 101 .4 96. 7 9 7 .4142 C r u s h e d a n d b r o k e n s t o n e ......................................... _ 43. 3 43. 6 41. 1 41. 6 _ 36. 8 37. 0 34. 5 35. 11 4 4 S a n d a n d g r a v e l - 40. 2 40. 9 39. 0 39. 7 - - - - -
- CONTRACT CO NSTRUCTION...................... 3,521 3, 620 3, 663 3 ,3 7 9 3 ,5 0 3 2 ,9 8 6 3 ,0 8 4 3, 126 2 ,861 2 ,9 8 5
15 G E N E R A L B U IL D IN G C O N T R A C T O R S . . . . - 1 ,0 6 2 .6 1 ,0 6 4 . 4, 1 ,0 1 6 . 8 1 ,0 4 7 . 1 - 908. 9 913. 1 867. 1 8 9 6 .9
16 H E A V Y C O N S T R U C T IO N C O N T R A C T O R S . . 836. 2 862. 6 7 11 .4 773. 9 725. 3 751 .0 614. 4 674. 9161 H ig h w a y a n d s t r e e t c o n s t r u c t i o n .......................... _ 377. 1 394. 8 328. 3 377. 7 3 3 8 .4 355. 4 2 9 0 .4 339. 81 6 2 H e a v y c o n s t r u c t i o n , n e c ......................................... - 459. 1 467. 8 383. 1 396. 2 - 386. 9 395. 6 324. 0 335. 1
17 S P E C IA L T R A D E C O N T R A C T O R S ................... 1 ,7 2 1 .2 1 ,7 3 6 . 2 1 ,6 5 0 .7 1 ,6 8 1 .5 1 ,4 4 9 . 8 1 ,4 6 2 .0 1 ,3 7 9 .9 1 ,4 1 3 . 0171 P lu m b in g , h e a t in g , a ir c o n d i t i o n i n g ............... _ 4 0 8 .4 4 0 2 .0 3 9 9 .8 404. 1 331 .3 324. 7 3 23 .5 328. 31 7 2 P a in t in g , p a p e r h a n g in g , d e c o r a t in g . . . . . . __ 135 .4 138. 6 131. 5 141. 6 120. 5 123. 9 116. 1 126. 1173 E le c t r i c a l w o r k ............................................................... 286. 7 288. 5 275. 1 273. 7 232. 2 234. 2 221. 1 220. 9174 M a s o n r y , s t o n e w o r k , a n d p la s t e r in g ................... 238. 5 241. 7 235. 2 243. 9 217. 3 220 .3 213. 3 221. 61 7 6 R o o f in g a n d s h e e t m e ta l w o r k ................... ... -
125. 8 126. 0 115. 7 118. 9-
104. 7 105. 6 95. 1 9 8 .0
- M ANUFACTURING ........................................................... 20,121 20,338 20,421 20,036 20,019 14,702 14,918 14,997 14,741 14,731
1 9 ,2 4 ,2 5 , D U R A B L E G O O D S ................................................ 11,789 11,993 12,014 11,776 11,704 8 ,5 3 2 8,737 8,755 8,586 8,5213 2 -3 9
2 0 -2 3 , N O N D U R A B L E G O O D S ..................................... 8,332 8, 345 8,407 8,260 8,315 6, 170 6,181 6,242 6,155 6,21026-31
Durable Goods
19 O R D N A N C E A N D A C C E S S O R IE S .......................... 308. 8 308. 1 315. 1 349. 5 334. 2 170. 5 170. 1 174. 1 1 97 .9 184. 51 92 A m m u n itio n , e x c e p t f o r s m a ll a r m s ................... 228. 5 2 2 9 .4 233. 8 262. 0 247. 0 119. 6 120. 6 123. 5 141. 7 128. 31 9 2 5 C o m p le t e g u id e d m i s s i l e s ..................................... _ 132. 1 134. 6 153. 2 153. 6 41. 7 43. 1 5 1 .4 51. 11 9 2 9 A m m u n itio n , e x c . f o r s m a ll a r m s , n e c . . . - 97. 3 9 9 .2 108. 8 93. 4
- 7 8 .9 8 0 .4 90. 3 77. 2
24 L U M B E R A N D W O O D P R O D U C T S ....................... 5 82 .5 5 9 3 .4 605. 3 598. 5 605. 0 502. 8 513. 6 5 2 6 .0 519. 0 524. 1241 L o g g in g c a m p s & lo g g in g c o n t r a c t o r s . . . . 7 6 .9 81. 1 83. 9 77. 6 81. 22 4 2 S a w m ills a n d p la n in g m i l l s ..................................... 224. 1 228. 7 232. 2 231. 0 233. 4 203. 2 207. 6 211. 6 2 0 9 .9 2 l2 . 02 4 2 1 S a w m ills a n d p la n in g m i l l s , g e n e r a l . . . . 191. 3 194 .4 192. 7 195. 6 173. 9 1 77 .5 175. 3 177. 8243 M i 11 w o r k , p ly w o o d & r e la t e d p r o d u c t s . . . . 1*57. 1 158. 5 162. 5 167. 3 169 .0 130. 7 132. 2 136. 5 141. 1 141. 5
2431 M i 11 w o r k ..............................................................................~
6 9 .0 71. 1 73. 1 73. 5 55. 5 57. 8 5 9 .6 59. 82 4 3 2 V e n e e r a n d p l y w o o d ................................................ 70. 1 7 1 .3 75. 1 76. 2 6 2 .9 64. 2 68. 0 68. 12 4 4 W ood en c o n t a i n e r s ........................................................ 36. 7 36. 9 37. 7 37. 9 37. 3 7 2 . 6 32. 8 33. 6 33. 6 3 3 .22 4 4 1 ,2 W o o d e n b o x e s , s h o o k , a n d c r a t e s ................... 28. 3 29. 1 2 9 .4 28. 9 _ 25. 1 2 5 .9 26. 0 25. 72 4 9 M is c e l l a n e o u s w o o d p r o d u c t s .............................. 87. 7 88. 2 89. 0 84. 7 84. 1 73. 6 74. 3 75. 2 71. 5 71. 0
S e e f o o t n o t e s a t e n d o f t a b le . N O T E : D a ta f o r th e 2 m o s t r e c e n t m on th s a r e p r e lim in a r y .
Digitized for FRASER http://fraser.stlouisfed.org/ Federal Reserve Bank of St. Louis

79 ESTABLISHMENT DATAEMPLOYMENT
B-2: Employees on nonagricultural payrolls, by industry—Continued
(In thousands)
S ICA l l e m p lo y e e s P r o d u c t io n w o r k e r s'
C o d eIn d u stry Nov.
1969Oct.1969
Sept.1969
Nov.1968
Oct.1968
Nov.1969
Oct.1969
Sept.1969
Nov.1968
Oct.1968
25
Durable G o o d s ’ -C on tin u ed
FURNITURE AND FIXTURES............ 489. 4 497. 0 495. 9 490. 3 485. 3 406. 0 413. 4 412. 1 406. 4 402. 0251 H o u s e h o ld fu r n itu r e ....................................................... (*) 349. 5 348. 1 347. 1 343. 5 (*) 298. 5 297. 0 296. 3 293. 12511 W ood h o u s e h o ld f u r n i t u r e ..................................... — 179. 6 180. 4 181. 4 179. 4 — 159. 1 159. 7 160. 2 158. 62512 U p h o ls te r e d h o u s e h o ld fu r n itu r e ....................... _ 91. 2 90. 7 89. 6 88. 7 _ 76. 2 75. 9 75. 2 74. 32515 M a ttr e s s e s a n d b e d s p r i n g s .................................. - 39. 5 40. 0 39. 0 39. 0 — 30. 9 31. 3 30. 6 30. 6252 O f f i c e f u r n i t u r e ............................................................... - 40. 6 40. 3 36. 6 35. 9 — 32. 1 31. 8 28. 6 27. 9254 P a r t it io n s a n d f i x t u r e s . . . ..................................... - 54. 0 54. 7 51. 6 51. 3 — 41. 7 42. 5 39. 1 38. 7253,9 O th er fu rn itu re an d f i x t u r e s ..................................... 52. 0 52. 9 52. 8 55. 0 54. 6 39. 8 41. 1 40. 8 42. 4 42. 3
32 S T O N E , C L A Y , A N D G L A S S P R O D U C T S . . . 667. 6 669. 8 674. 2 654. 9 655. 7 535. 2 537. 5 542. 2 527. 6 527. 8321 F la t g l a s s ............................................................................. — 26. 3 26. 6 27. 2 27. 0 — 19. 8 20. 2 21. 0 20. 7322 G la s s an d g l a s s w a r e , p r e s s e d o r b lo w n . . . 133. 9 133. 6 134. 2 131. 2 131. 4 117. 6 117. 6 118. 1 116. 8 117. 13221 G la s s c o n t a in e r s ........................................ .................. — 75. 7 76. 4 73. 7 73. 7 — 67. 9 68. 7 68. 3 68. 53229 P r e s s e d an d b lo w n g l a s s , n e ........................... 57.9 57. 8 57. 5 57. 7 _ 49. 7 49. 4 48. 5 48. 6324 C e m e n t , h y d r a u l i c ........................................................... 36. 0 36. 0 35. 4 34. 9 35. 2 27. 6 27. 6 27. 1 26. 8 27. 0325 S tru ctu ra l c la y p r o d u c t s ............................................ 63. 0 63. 2 64. 4 64. 9 64. 5 51. 5 51. 9 53. 0 53. 9 53. 53251 B r ic k and s tr u c tu ra l c la y t i l e .............................. _ 28. 7 29. 1 29. 7 29. 3 __ 25. 1 25. 6 26. 2 25. 7326 P o t te r y and r e la te d p r o d u c t s .................................. __ 46. 3 46. 0 44. 5 44. 2 _ 39. 2 38. 9 38. 0 37. 7327 C o n c r e t e , g y p s u m , an d p la s t e r p r o d u c t s . . . 190. 2 191. 9 194. 8 185. 1 187. 1 148. 8 150. 8 153. 6 144. 4 146. 0328,9 O th er s t o n e a n d n o n m e t a ll ic m in e r a l p r o d u c ts 142. 1 141. 7 142. 4 138. 0 137. 4 106. 3 105. 9 106. 9 103. 2 102. 53291 A b r a s iv e p r o d u c t s ....................................................... - 28. 0 27. 8 27. 4 27. 3 — 19. 2 19. 2 18. 8 18. 7
33 P R I M A R Y M E T A L I N D U S T R I E S .......................... 1, 356. 6 1, 358. 0 1,365. 5 1, 280. 1 1,270. 5 1,084.6 1,085.4 1,092. 7 1,014. 7 1,003. 5331 B la s t fu r n a c e a n d b a s i c s t e e l p r o d u c ts . . . (*) 649. 1 653. 7 590. 1 586. 0 (*) 517. 8 522. 3 462. 9 457. 63312 B la s t fu r n a c e s a n d s t e e l m i l l s .......................... __ 568. 8 573. 2 513. 6 510. 0 _ 455. 8 460. 0 405. 0 400. 3332 Iron a n d s t e e l f o u n d r i e s ............................................ 238. 9 235. 9 236. 6 224. 3 223. 2 201. 8 198. 8 199. 2 187. 6 ‘ 186. 33321 G ra y iron f o u n d r i e s ............... ... __ 148. 1 148. 3 142. 2 140. 2 _ 126. 9 127. 0 121. 2 119. 33322 M a lle a b le iron fo u n d r ie s ..................................... ... _ 23. 8 24. 2 23. 1 22. 9 _ 19. 9 20. 2 19. 3 19. 23323333,4
S te e l f o u n d r ie s ................................................ ...
N on fe r r o u s m e t a l s ........................................................... "87. 964. 0 87. 8
64. 1 88. 2
59. 0 86. 1
60. 1 86. 0 68. 1
52. 0 67. 9
52. 0 68. 3
47. 1 67. 3
47. 8 66. 9
3334 P rim a ry a lu m in u m ....................................................... __ 28. 0 28. 1 27. 0 26. 8 _ 22. 8 23. 0 22. 4 22. 2335 N o n fe r r o u s r o l l in g a n d d r a w in g ...................... 216. 4 218. 5 219. 2 212. 9 210. 8 163. 4 165. 2 165. 9 160. 6 158.43351 C o p p e r r o l l in g a n d d r a w in g .................................. ___ 44. 3 45. 0 43. 5 44. 1 _ 33. 5 33. 9 32. 9 33. 23352 A lu m in u m r o l l in g a n d d r a w i n g .......................... _ 69. 8 70. 0 71. 5 70. 1 _ 51. 8 52. 0 54. 0 52. 63357 N o n fe r r o u s w ir e d ra w in g a n d in s u la t in g . . __ 79. 8 79. 7 76. 9 75. 9 _ 62. 4 62. 5 59. 5 58. 6336 N o n fe r r o u s f o u n d r i e s .................................................... 92. 0 90. 7 91. 9 91. 2 89. 9 76. 6 75. 3 76. 5 76. 3 75. 13361 A lu m in u m c a s t i n g s .................................................... _ 46. 4 47. 1 46. 4 44. 6 _ 39. 2 39. 8 39. 6 37. 93362,9 O th er n o n fe r r o u s c a s t i n g s ..................................... 44. 3 44. 8 44. 8 45. 3 — 36. 1 36. 7 36. 7 37. 2339 M is c e l la n e o u s prim ary m e ta l p r o d u c ts . . . . 77. 2 76. 0 75. 9 75. 5 74. 6 61. 8 60. 4 60. 5 60. 0 59. 23391 Iron a n d s t e e l f o r g i n g s ............................................ *— 51. 2 51.4 50. 7 50. 5 — 41. 0 41. 2 40. 9 40. 7
34 F A B R I C A T E D M E T A L P R O D U C T S ...................... 1,464. 2 1,468. 3 1,472. 5 1,434. 3 1,421. 8 1, 124. 1 1, 129. 4 1, 134. 2 1, 110. 1 1, 100. 7341 M e ta l c a n s ............................................................................. 66. 3 68. 1 70. 1 67. 7 67. 8 55. 3 57. 0 59. 1 57. 9 58. 2342 C u t le r y , h a n d t o o l s , a n d h a r d w a r e ................... 173. 2 173. 5 172. 7 171. 8 169. 8 135. 5 135. 8 135. 4 134. 4 133. 03421,3,5 C u tle r y a n d h a n d t o o l s , in c l . s a w s ............... _ 70. 8 70. 1 66. 9 66. 0 _ 54. 6 54. 2 52. 3 51. 63429 H a rd w a re , n e c ........................................................... _ 102. 7 102. 6 104. 9 103. 8 _ 81. 2 81. 2 82. 1 81.4343 P lu m b in g a n d h e a t in g , e x c e p t e l e c t r i c . . . . 85. 9 85. 1 84. 8 83. 5 82. 8 64. 1 63. 3 63. 2 61. 9 61. 73431,2 S a n ita ry w a re & p lu m b e r s ’ b r a s s g o o d s . . _ 37. 8 37. 6 36. 8 36. 5 _ 30. 0 30. 0 29. 1 29. 03433 H e a t in g e q u ip m e n t , e x c e p t e l e c t r i c ............... _ 47. 3 47. 2 46. 7 46. 3 _ 33. 3 33. 2 32. 8 32. 7344 F a b r ic a t e d s tr u c tu ra l m e ta l p r o d u c t s ............... 436. 8 436. 7 437. 9 420. 6 418. 2 314. 8 315. 1 316. 5 305. 0 302. 93441 F a b r ic a t e d s t r u c tu ra l s t e e l ................................. _ 115. 1 115. 7 112. 6 111. 7 _ 84. 4 85. 2 83. 3 82. 13442 M eta l d o o r s , s a s h , a n d t r im .................................. _ 72. 7 72. 4 70. 0 69. 7 _ 53. 1 53. 1 51. 1 51. 13443 F a b r ic a t e d p la t e w ork (b o i l e r s h o p s ) . . . . _ 116. 3 115. 8 111. 0 108. 6 _ 81. 4 81. 0 78. 4 76. 73 4 4 4 S h e e t m e ta l w o r k ............... ... .................................... — 81.4 81. 7 80. 0 80. 0 — 59. 0 59. 3 59. 0 59. 03 4 4 6 ,9 A r c h it e c t u r a l a n d m is c . m e ta l w o r k ............... _ 51. 2 52.3 47. 0 48. 2 _ 37. 2 37. 9 33. 2 34. 03 45 S c r e w m a c h in e p r o d u c t s , b o l t s , e t c ............... 117. 1 115. 8 115. 9 112. 5 110. 6 92. 5 91. 3 91. 1 89. 0 87. 23451 S c r e w m a c h in e p r o d u c t s ......................................... 51. 7 52. 0 51. 8 50. 9 _ 43. 7 43. 7 43. 9 43. 134 5 2 B o l t s , n u ts , r iv e t s , a n d w a s h e r s ................... 64. 1 63. 9 60. 7 59. 7 47. 6 47. 4 45. 1 44. 13 4 6 M eta l s t a m p i n g s ............................................................... (*) 260. 3 262. 4 259. 4 255. 6 1*) 212. 0 214. 5 213. 2 210. 0347 M eta l s e r v i c e s , n e c ................... ... ......................... 99. 0 98. 0 97. 8 94. 6 94. 4 81. 5 80. 7 80. 2 78. 7 78. 7348 M is c . f a b r ic a t e d w ir e p r o d u c t s .............................. 70. 6 70. 6 70. 0 69. 5 68. 7 56. 3 56. 4 55. 9 56. 3 55. 73 4 9 M is c . f a b r ic a t e d m e ta l p r o d u c t s .......................... 160. 7 160. 2 160. 9 154. 7 153. 9 117. 5 117. 8 118. 3 113. 7 113. 33 4 9 4 ,8 V a lv e s , p ip e , a n d p ip e f i t t in g s .......................... - 94. 8 95. 4 93. 6 93. 5 - 66.4 66. 7 66. 1 65. 8
See footnotes at end of table. NOTE: Data for the 2 most recent months are preliminary.
Digitized for FRASER http://fraser.stlouisfed.org/ Federal Reserve Bank of St. Louis

ESTABLISHMENT DATA soEMPLOYMENT
B-2: Employees on nonogricultural payrolls, by industry-Continued
(In thousands)
SICC o d e
In du stryA ll e m p lo y e e s P r o d u c t io n w o rk e rs ^
N o v .1 9 6 9
O c t .1 9 6 9
S e p t .1 9 6 9
N o v .1 9 6 8
O c t .1 9 6 8
N o v .1 9 6 9
O c t .1 9 6 9
S e p t .1 9 6 9
N o v .1 9 6 8
O c t .1 9 6 8
Durable Goods — Contitiued35 M A C H IN E R Y , E X C E P T E L E C T R I C A L . . . . 1 , 9 8 5 . 6 2 , 0 1 0 . 9 2 , 0 0 9 . 7 1 , 9 6 6 . 1 1 , 9 4 7 . 8 1 , 3 4 6 . 6 1 , 3 7 1 . 7 1 , 3 7 1 . 3 1 , 3 4 5 . 9 1 , 3 2 6 . 3351 E n g in e s an d t u r b in e s .................................................... ( * > 1 1 3 . 7 1 1 4 . 2 1 1 1 . 0 1 1 0 . 0 ( * ) 7 7 . 4 7 7 . 7 7 6 . 3 7 5 . 23511 S tea m e n g in e s a n d t u r b in e s .................................. — 3 8 . 9 3 8 . 9 3 8 . 3 3 8 . 3 _ 2 2 . 4 2 2 . 4 2 2 . 4 2 2 . 4
3 519 In tern a l c o m b u s t io n e n g in e s , n e c ............... _ 7 4 . 8 7 5 . 3 7 2 . 7 7 1 . 7 _ 5 5 . 0 5 5 . 3 5 3 . 9 5 2 . 8
352 Farm m a c h i n e r y ............................................................... _ 1 2 6 . 2 1 2 6 . 6 1 3 3 . 2 1 3 4 . 0 _ 9 0 . 0 9 0 . 3 9 3 . 8 9 4 . 7
3 53 C o n s t r u c t io n a n d r e la te d m a c h i n e r y ............... 2 9 6 . 0 2 9 6 . 9 2 9 7 . 7 2 8 4 . 2 2 8 1 . 5 1 9 9 : l 1 9 8 . 9 2 0 0 . 0 1 8 9 . 8 1 8 7 . 2
3 5 3 1 ,2 C o n s t r u c t io n an d m in in g m a c h in e r y ............... - 1 5 6 . 9 1 5 7 . 3 1 5 2 . 2 1 5 1 . 3 _ 1 0 9 . 4 1 0 9 . 8 1 0 5 . 6 1 0 4 . 6
3 5 3 3 O il f ie ld m a c h in e r y .................................................... _ 4 7 . 0 4 6 . 8 4 2 . 3 4 2 . 1 _ 3 2 . 6 3 2 . 6 2 9 . 5 2 9 . 2
3 5 3 5 ,6 C o n v e y o r s , h o i s t s , c r a n e s , m o n o r a ils . . . - 4 3 . 8 4 3 . 8 4 2 . 5 4 1 . 6 - 2 7 . 3 2 7 . 3 2 6 . 4 2 5 . 5
3 537 In d u s tr ia l t ru ck s and t r a c t o r s .......................... - 3 4 . 5 3 4 . 5 3 2 . 1 3 1 . 5 - 2 2 . 2 2 2 . 3 2 0 . 6 2 0 . 3
354 M eta l w o rk in g m a c h i n e r y ......................................... 3 4 7 . 8 3 4 5 . 4 3 4 4 . 5 3 3 8 . 4 3 3 7 . 0 2 5 9 . 5 2 5 7 . 3 2 5 6 . 7 2 5 3 . 2 2 5 1 . 1
3541 M a ch in e t o o l s , m e ta l c u t t in g t y p e s ............... - 7 8 . 2 7 8 . 7 7 8 . 2 7 8 . 0 - 5 2 . 7 5 2 . 9 5 3 . 2 5 3 . 03 5 4 4 S p e c ia l d i e s , t o o l s , j i g s , & f ix tu r e s . . . . - 1 2 7 . 2 1 2 5 . 8 1 2 4 . 8 1 2 3 . 1 - 1 0 4 . 4 1 0 3 . 3 1 0 2 . 6 1 0 0 . 9
3545 M a ch in e t o o l a c c e s s o r i e s ..................................... - 6 0 . 7 6 0 . 7 6 0 . 2 6 0 . 0 - 4 4 . 0 4 4 . 1 4 3 . 5 4 3 . 5
3 5 4 2 ,8 M is c . m e ta l w o r k in g m a c h i n e r y ...................... - 7 9 . 3 7 9 . 3 7 5 . 2 7 5 . 9 - 5 6 . 2 5 6 . 4 5 3 . 9 5 3 . 7
355 S p e c i a l in d u s try m a c h in e r y ..................................... 1 9 6 . 7 1 9 9 . 9 2 0 0 . 4 1 9 7 . 8 1 9 6 . 9 1 3 0 . 2 1 3 2 . 4 1 3 2 . 4 1 3 3 . 2 1 3 2 . 3
3551 F o o d p r o d u c ts m a c h i n e r y ..................................... _ 4 3 . 8 4 3 . 8 4 2 . 9 4 2 . 7 _ 2 8 . 0 2 7 . 9 2 7 . 7 2 7 . 6
3 552 T e x t i l e m a c h in e r y . .................................................... _ 4 1 . 3 4 1 . 7 4 1 . 7 4 1 . 1 _ 3 1 . 1 3 1 . 2 3 1 . 9 3 1 . 3
3 555 P r in t in g tr a d e s m a c h in e r y ..................................... _ 3 1 . 2 3 1 . 3 3 0 . 8 3 0 . 8 1 9 . 9 1 9 . 9 2 0 . 6 2 0 . 6
356 G e n e r a l in d u s t r ia l m a c h in e r y .................................. 2 8 4 . 3 2 8 4 . 4 2 8 4 . 3 2 8 2 . 2 2 7 3 . 7 1 8 9 . 2 1 8 9 . 0 1 8 8 . 4 1 8 5 . 8 1 7 7 . 0
3561 P u m p s a n d c o m p r e s s o r s ......................................... - 7 5 . 7 7 5 . 2 7 7 . 1 7 7 . 0 - 4 3 . 7 4 3 . 3 4 3 . 0 4 2 . 4
3 5 6 2 B a ll a n d r o l l e r b e a r i n g s ......................................... _ 6 1 . 3 6 0 . 9 6 1 . 0 5 3 . 7 _ 4 7 . 5 4 7 . 0 4 7 . 4 4 0 . 0
3 5 6 4 B lo w e r s a n d f a n s ........................................................ - 3 1 . 2 3 2 . 5 3 1 . 6 3 1 . 4 _ 1 9 . 6 2 0 . 5 2 0 . 1 1 9 . 8
3 5 6 6 P o w e r t r a n s m is s io n e q u ip m e n t .......................... - 5 5 . 2 5 4 . 8 5 2 . 5 5 2 . 0 _ 3 9 . 8 3 9 . 3 3 8 . 1 3 7 . 9357 O f f i c e a n d co m p u t in g m a c h i n e s .......................#. ( * ) 2 5 6 . 4 2 5 3 . 8 2 5 0 . 9 2 5 0 . 3 ( * ) 1 3 4 . 1 1 3 2 . 9 1 3 5 . 7 1 3 5 . 23 5 7 3 E le c t r o n i c c o m p u t in g 'e q u ip m e n t ................... - 1 6 6 . 1 1 6 5 . 0 1 5 7 . 6 1 5 8 . 1 - 6 8 . 8 6 8 . 2 6 9 . 1 6 9 . 23 58 S e r v ic e in d u s try m a c h in e s ......................................... ( * ) 1 4 3 . 5 1 4 4 . 0 1 3 6 . 7 1 3 4 . 8 ( * ) 1 0 1 . 2 1 0 2 . 5 9 7 . 0 9 4 . 73 585 R e fr ig e r a t io n m a c h in e r y ......................................... 9 4 . 8 9 5 . 0 8 7 . 6 8 6 . 7 6 7 . 4 6 8 . 3 6 2 . 5 6 1 . 23 5 9 M is c . m a c h in e r y , e x c e p t e l e c t r i c a l ................... 2 4 6 . 4 2 4 4 . 5 2 4 4 . 2 2 3 1 . 7 2 2 9 . 6 1 9 3 . 2 1 9 1 . 4 1 9 0 . 4 1 8 1 . 1 1 7 8 . 9
36 E L E C T R I C A L E Q U IP M E N T AN D S U P P L IE S 1 , 9 7 5 . 4 2 , 0 9 4 . 3 2 , 0 8 3 . 1 2 , 0 1 1 . 3 1 , 9 9 9 . 4 1 , 2 8 9 . 0 1 , 4 0 7 . 3 1 , 3 9 4 . 2 1 , 3 4 6 . 0 1 , 3 3 8 . 6361 E le c t r i c t e s t & d is t r ib u t in g e q u ip m e n t . . . . ( * ) 2 2 1 . 6 2 2 0 . 0 2 0 6 . 9 2 0 3 . 8 ( * ) 1 5 1 . 1 1 , 4 6 9 . 2 1 4 0 . 8 1 3 8 . 03 611 E le c t r i c m e a s u r in g in s t r u m e n t s ...................... — 7 6 . 2 7 4 . 8 6 8 . 1 6 7 . 4 _ 4 7 . 9 4 7 . 2 4 3 . 7 4 3 . 23 6 1 2 T r a n s f o r m e r s ................................................................... - 6 0 . 6 6 1 . 0 5 7 . 4 5 6 . 4 _ 4 4 . 3 4 4 . 5 4 1 . 1 4 0 . 33 6 1 3 S w it c h g e a r a n d s w it c h b o a r d a p p a r a t u s . . . - 8 4 . 8 8 4 . 2 8 1 . 4 8 0 . 0 - 5 8 . 9 5 7 . 9 5 6 . 0 5 4 . 5
362 E le c t r i c a l in d u s t r ia l a p p a r a t u s .......................... ( * ) 2 2 4 . 4 2 2 3 . 9 2 1 2 . 3 2 0 9 . 0 ( * ) 1 5 7 . 9 1 5 7 . 6 1 4 7 . 5 1 4 4 . 3
3621 M o to rs a n d g e n e r a t o r s ............................................. _ 1 2 2 . 4 1 2 2 . 5 1 1 6 . 3 1 1 3 . 7 _ 8 8 . 0 8 8 . 2 8 2 . 2 7 9 . 63 6 2 2 I n d u s tr ia l c o n t r o l s .................................................... _ 6 2 . 7 6 1 . 9 5 7 . 7 5 7 . 2 - 4 1 . 5 4 0 . 8 3 7 . 3 3 6 . 8363 H o u s e h o ld a p p l i a n c e s ................................................ ( * ) 1 9 0 . 4 1 8 8 . 3 1 8 2 . 6 1 8 0 . 3 ( * ) 1 5 1 . 9 1 5 0 . 1 1 4 5 . 0 1 4 3 . 53632 H o u s e h o ld r e fr ig e r a to r s and f r e e z e r s . . . . _ 5 9 . 9 6 0 . 8 5 7 . 5 5 6 . 1 4 9 . 6 5 0 . 2 4 6 . 5 4 5 . 63 6 3 3 H o u s e h o ld la u n d ry e q u ip m e n t .............................. _ 2 7 . 8 2 8 . 1 2 6 . 1 2 6 . 3 _ 2 1 . 6 2 2 . 3 2 0 . 8 2 1 . 03 6 3 4 E le c t r i c h o u s e w a r e s a n d f a n s .......................... - 4 6 . 9 4 5 . 2 4 6 . 3 4 5 . 6 _ 3 7 . 6 3 6 . 0 3 7 . 0 3 6 . 4364 E le c t r i c l ig h t in g a n d w ir in g e q u ip m e n t . . . ( * ) 2 1 6 . 3 2 1 4 . 6 2 0 4 . 6 2 0 5 . 9 ( * ) 1 6 8 . 1 1 6 5 . 9 1 5 5 . 9 1 5 7 . 73641 E le c t r i c l a m p s ............................................................... - 4 1 . 5 4 0 . 9 3 9 . 5 3 9 . 2 _ 3 6 . 9 3 6 . 2 3 4 . 9 3 4 . 6
3642 L ig h t in g f i x t u r e s ........................................................ _ 6 8 . 1 6 8 . 0 6 6 . 9 6 6 . 7 _ 5 3 . 5 5 3 . 0 5 2 . 0 5 1 . 8
3 6 4 3 ,4 W iring d e v i c e s ............................................................... — 1 0 6 . 7 1 0 5 . 7 9 8 . 2 1 0 0 . 0 _ 7 7 . 7 7 6 . 1 6 9 . 0 7 1 . 3
3 65 R a d io and T V r e c e iv in g e q u ip m e n t ................... ( * ) 1 5 9 . 7 1 6 0 . 5 1 6 1 . 7 1 6 1 . 5 ( * ) 1 1 9 . 9 1 2 0 . 4 1 2 3 . 3 1 2 3 . 9
366 C o m m u n ic a t io n e q u ip m e n t ................................. . ( * ) 5 3 0 . 5 5 2 9 . 5 5 2 3 . 1 5 2 1 . 4 ( * ) 2 6 3 . 7 2 6 0 . 6 2 5 8 . 7 2 5 7 . 7
3661 T e le p h o n e a n d t e le g r a p h a p p a r a t u s ............... - 1 4 7 . 6 1 4 5 . 0 1 3 2 . 3 1 3 1 . 4 - 9 8 . 9 9 6 . 6 8 7 . 1 8 6 . 43 662 R a d io a n d T V c o m m u n ic a t io n e q u ip m e n t . . — 3 8 2 . 9 3 8 4 . 5 3 9 0 . 8 3 9 0 . 0 _ 1 6 4 . 8 1 6 4 . 0 1 7 1 . 6 1 7 1 . 3367 E le c t r o n i c c o m p o n e n ts a n d a c c e s s o r i e s . . . ( * ) 4 2 0 . 2 4 1 6 . 6 3 9 4 . 1 3 9 1 . 7 ( * ) 2 9 3 . 3 2 8 9 . 9 2 7 7 . 8 2 7 6 . 33 6 7 1 -3 E le c t r o n t u b e s ............................................................... - 6 9 . 4 7 0 . 7 7 4 . 0 7 4 . 4 - 4 7 . 2 4 8 . 6 5 1 . 4 5 1 . 83 6 7 4 ,9 O th er e l e c t r o n i c c o m p o n e n t s .............................. — 3 5 0 . 8 3 4 5 . 9 3 2 0 . 1 3 1 7 . 3 _ 2 4 6 . 1 2 4 1 . 3 2 2 6 . 4 2 2 4 . 5
3 69 M is c . e l e c t r i c a l e q u ip m e n t & s u p p l i e s . . . . ( * ) 1 3 1 . 2 1 2 9 . 7 1 2 6 . 0 1 2 5 . 8 ( * ) 1 0 1 . 4 1 0 0 . 1 9 7 . 0 9 7 . 23 6 9 4 E n g in e e l e c t r i c a l e q u i p m e n t .............................. — 7 0 . 5 6 9 . 5 6 8 . 2 6 8 . 5 5 5 . 2 5 4 . 3 5 3 . 3 5 3 . 6
37 T R A N S P O R T A T I O N E Q U I P M E N T .......................... 2 , 0 2 7 . 3 2 , 0 5 6 . 6 2 , 0 6 3 . 8 2 , 0 6 3 . 4 2 , 0 5 8 . 6 1 , 4 2 4 . 4 1 , 4 5 1 . 0 1 , 4 5 7 . 4 1 , 4 6 2 . 8 1 , 4 6 0 . 1371 Motor v e h ic le s and e q u ip m e n t ..........................
( * ) 9 3 3 . 1 9 3 3 . 9 9 0 5 . 2 9 0 2 . 2 ( * ) 7 2 9 . 3 7 2 8 . 8 7 1 2 . 4 7 0 8 . 73711 Motor v e h i c l e s ....................................................... 4 0 3 . 2 4 0 3 . 3 3 8 6 . 1 3 8 5 . 8 3 0 0 . 4 3 0 0 . 3 2 9 1 . 8* 2 9 1 . 43 7 1 2 P assen g er car b o d i e s ....................................... - 6 6 . 3 6 8 . 2 6 4 . 5 6 8 . 6 _ 5 5 . 3 5 7 . 0 5 3 . 2 5 6 . 63 7 13 Truck and bus b o d ie s .......................................... - 3 9 . 9 4 1 . 0 3 7 . 8 3 6 . 6 _ 3 2 . 6 3 3 . 6 3 0 . 5 2 9 . 53 7 1 4 Motor v eh ic le parts and a c c e s s o r ie s . . . . - 3 9 2 . 3 3 9 1 . 8 3 8 8 . 3 3 8 3 . 8 _ 3 1 6 . 5 3 1 5 . 2 3 1 5 . 2 3 1 0 . 537 15 Truck t r a i l e r s ....................................................... - 3 1 . 4 2 9 . 6 2 8 . 5 2 7 . 4 _ 2 4 . 5 2 2 . 7 2 1 . 7 2 0 . 7372 A ircraft and p a r t s .................................................... ( * ) 7 9 8 . 5 8 0 4 . 0 8 3 9 . 4 8 4 1 . 3 ( * ) 4 5 8 . 4 4 6 3 . 8 4 9 0 . 4 4 9 4 . 03721 A ircraft .................................................................... 4 7 6 . 4 4 8 1 . 0 4 9 0 . 8 4 9 2 . 2 2 6 5 . 7 2 7 0 . 6 2 7 7 . 9 2 8 0 . 53 7 2 2 A ircraft en gin es and engine p a rts ................. _ 1 9 6 . 1 1 9 6 . 3 2 0 7 . 9 2 0 8 . 2 _ 1 0 9 . 9 1 0 9 . 9 1 1 7 . 6 1 1 7 . 5
3 7 2 3 ,9 Other a ircraft parts and e q u ip m e n t ............. _ 1 2 6 . 0 1 2 6 . 7 1 4 0 . 7 1 4 0 . 9 _ 8 2 . 8 8 3 . 3 9 4 . 9 9 6 . 0373 Ship and boat bu ilding and re p a ir in g ............. 1 8 9 . 5 1 8 4 . 3 1 8 3 . 8 1 8 4 . 1 1 8 2 . 1 1 5 4 . 8 1 5 0 . 3 1 4 9 . 8 1 5 0 . 0 1 4 9 . 03731 Ship bu ild ing and re p a ir in g ..............................
- 1 4 2 . 4 1 4 1 . 9 1 4 2 . 3 1 4 1 . 6 - 1 1 6 . 1 1 1 5 . 7 1 1 5 . 7 1 1 5 . 8
See footnotes at end of table. NOTE: Data for the 2 most recent months are preliminary.
Digitized for FRASER http://fraser.stlouisfed.org/ Federal Reserve Bank of St. Louis

ESTABLISHMENT DATAEMPLOYMENT
B-2: Employees on nonagricultural payrolls, by industry—Continued
(In t h o u s a n d s )
SICAll em ployees Production workers ^
Code Industry N ov.1969
O ct.1969
Sept.1969
N ov.1968
O ct.1968
N ov.1969
O ct.1969
Sept.1969
N ov.1968
O ct.1968
3732
Durable G o o d s—C ontinued
T R A N S P O R T A T I O N E Q U I P M E N T - C o n t i n u e d
B oat building and rep a irin g ............................. 41. 9 41. 9 41. 8 40. 5 34. 2 34. 1 34. 3 33. 2374 Railroad eq u ip m en t.................................* • • • • - 53. 6 53. 8 48. 3 47. 2 41. 5 42. 1 36. 7 35. 6375,9 Other transportation e q u ip m e n t ....................... - 87. 1 88. 3 86. 4 85. 8 - 71. 5 72. 9 73. 3 72. 838 I N S T R U M E N T S A N D R E L A T E D P R O D U C T S -------- 465. 6 469. 3 469. 8 466. 5 463. 6 282. 2 288. 8 289 .5 288. 5 286. 5381 E ngineering & s c ie n tific instrum ents............ - 75. 8 76. 3 83. 7 83. 9 37. 5 37. 5 40. 8 41. 6382 M echanical measuring & control d e v ice s . . . 112. 1 113. 1 112. 9 110. 7 109. 8 71. 2 71. 5 71. 7 70. 8 70. 03821 M echanical measuring d e v i c e s ................... - 69. 4 69. 0 67. 2 66. 9 *“ 41. 3 41. 2 40. 2 40. 03822 Autom atic temperature c o n t r o l s .................. — 43. 7 43. 9 43. 5 42. 9 ~ 30. 2 30. 5 30. 6 30. 0383,5 O ptica l and ophthalm ic g o o d s ........................... 52. 3 5 1 .9 51. 3 50. 6 50. 6 36. 7 36. 3 36. 2 36. 1 36. 0385 Ophthalmic good s .............................................. - 33. 0 32. 7 31. 7 31. 8 25. 2 24. 8 24. 1 24. 0384 M edical instruments and su p p lies .................... 77. 6 77. 2 77. 1 74. 3 73. 7 52. 6 52. 7 52. 6 50. 7 50. 0386 Photographic equipment and s u p p l ie s .......... (*) 114. 6 115. 2 111. 0 109. 8 (*) 60. 7 61. 1 60. 6 59. 6387 W atches, c lo c k s , and w a t c h c a s e s ................. 36. 7 37. 0 36. 2 35. 8 2 9 .9 30. 4 2 9 .5 29. 3
39M I S C E L L A N E O U S M A N U F A C T U R I N G
I N D U S T R I E S ................................................................................... 465. 7 467. 0 458. 9 461. 5 462. 4 367. 0 368. 4 360. 8 366. 9 367. 2391 Jew elry , silverw are, and plated w are............ 52. 7 52. 6 52. 1 53. 1 52. 8 3_9. 8 39. 8 39. 4 40. 5 3 9 .9394 T oy s and sporting g o o d s .................................... - 143. 2 138. 1 138. 0 139. 4 119. 5 114. 8 116. 0 117. 23941-3 Gam es, toy s , d o lls , & play v e h ic le s . . . . - 90. 0 84. 9 85. 0 87. 2 — 76. 2 71. 5 72. 2 74. 43949 Sporting and ath letic go o d s , n e c ............ - 53. 2 53. 2 53. 0 52. 2 — 43. 3 43. 3 43. 8 42. 8395 P ens, p e n c ils , o f f ic e , and art su pp lies . . . . — 34. 9 34. 8 34. 4 35. 0 25. 5 25. 5 24. 5 25. 1396 Costum e jew elry and n otion s ............................. — 63. 4 62. 9 64. 1 63. 7 — 52. 8 52. 0 53. 4 53. 0393,8,9 Other m anufacturing in d u s tr ie s ........................ 173. 6 172. 9 171. 0 171. 9 171. 5 131. 0 130. 8 129. 1 132. 5 132. 0393 M usical instruments and parts...................... - 24. 4 24. 3 25. 2 24. 9 19. 3 19. 2 19. 8 19.5
20
Nondurable G ood s
F O O D A N D K I N D R E D P R O D U C T S .......................... 1,841. 1 1,854. 3 1,920. 2 1,805. 7 1,866. 0 1,254. 5 1,264. 8 1,324. 8 1,222. 1 1,279. 5201 Meat produ cts ............................................................ 349. 8 343. 2 340. 7 344. 2 342. 3 284. 4 278. 9 275. 9 278. 5 276. 62011 Meat packing p la n t s ......................................... - 182. 5 182. 4 187. 2 186. 2 ~ 142. 8 142. 2 146. 1 145. 22013 Sausages and other prepared m e a t s .......... - 58. 0 57. 9 58. 7 58. 8 ~ 41. 8 41. 8 42. 7 42. 62015 Poultry dressin g p la n t s .................................. - 102. 7 100. 4 98. 3 97. 3 94. 3 9 1 .9 89. 7 88. 8202 Dairy p ro d u cts .......................................................... 243. 2 247. 7 253. 3 253. 0 255. 3 113. 3 115. 6 119. 7 118. 7 120. 42024 Ice cream and frozen d e sse r ts ...................... - 25. 9 28. 1 25. 9 26. 6 ~ 13. 1 14. 6 12.9 13. 62026 Fluid m ilk .: .......................................................... - 175. 5 177. 8 180. 1 181. 3 - 66. 9 68. 1 69. 1 69. 7203 Canned, cured, and frozen fo o d s ...................... - 321. 8 394. 1 270. 3 329. 7 275. 9 347. 1 227. 1 284. 42031,6 Canned, cured, and frozen sea food s . . . . - 44. 6 43. 1 38. 6 42. 5 ~ 38. 9 37. 7 33. 8 37. 52032,3 Canned food , excep t sea f o o d s .................... - 172. 1 242. 8 137. 3 186. 3 ~ 145. 4 215. 3 112. 2 159. 32037 Frozen fruits and v e g e ta b le s ........................ _ 65. 2 67. 2 58. 7 61. 5 - 58. 7 60. 3 52. 6 55. 4204 Grain m ill p ro d u cts ................................................ ( * ) 138. 0 139. 5 133. 2 134. 7 ( * ) 98. 6 9 9 .9 94. 2 95. 72041 Flour and other grain m ill p r o d u c ts .......... 31. 2 31. 6 31. 2 30. 9 “ 23. 0 23. 4 22. 5 22. 32042 Prepared feed s for anim als and fow ls . . . - 64. 9 65. 8 61. 8 63. 8 43. 5 44. 3 40. 8 42. 4205 Bakery produ cts ........................................................ 281. 5 270. 3 270. 4 278. 5 280. 0 167. 2 155. 9 154. 8 163. 3 164. 72051 Bread, cak e , and related p r o d u c ts ............ - 233. 6 234. 3 235. 8 235. 6 — 127. 8 127. 5 128. 1 128. 02052 C ook ies and c r a c k e r s ....................................... - 36. 7 36. 1 42. 7 44. 4 “ 28. 1 27. 3 35. 2 36.7206 S u gar............................................................................. - 48. 6 37. 9 54. 1 5 1 .0 _ 4 0 .0 29. 5 47. 4 44. 6207 C on fection ery and related p r o d u c ts ............... ( * ) 91. 8 89. 4 89. 3 88. 1 ( * ) 76. 3 74. 2 74. 0 73. 42071 C on fection ery p r o d u c t s .......................... - 75. 4 72. 8 73. 1 71. 9 64. 0 61. 7 6 1 .9 61. 3208 B evera g es ................................................... 240. 8 244. 5 248. 8 235. 2 237. 3 123. 3 126. 3 128. 6 121 .8 122. 72082 Malt l i q u o r s ............................................ - 60. 3 62. 5 59. 4 5 9 .2 — 39. 4 41. 3 39. 9 39. 22086 B ottled and canned soft d rin k s ............... — 131. 4 136. 2 127. 0 128. 1 49. 4 52. 9 47. 6 48. 4209 M isc. foods and kindred p ro d u cts ............... 148. 4 148. 4 146. 1 147. 9 147. 6 97. 3 97. 3 95. 1 97. 1 97. 0
21 T O B A C C O M A N U F A C T U R E S .......................................... 84. 5 91. 4 93. 9 89. 1 96. 8 71. 2 77. 7 80. 3 76. 4 83. 9211 C ig a re ttes ................................................... - 39 .9 40. 4 41. 8 41. 3 32. 1 32. 6 34. 4 34. 0212 C igars ......................................................... — 19.6 19. 4 20. 7 20. 6 17. 9 17. 7 19. 3 19. 2
22 T E X T I L E M I L L P R O D U C T S .................. . . . . 990. 1 983. 1 984. 7 1,003. 2 999. 2 872. 5 866. 1 867. 4 888. 3 885. 0221 Weaving m ills , c o t to n ............................................ 226. 1 224. 7 224. 9 231. 7 231. 6 205. 7 204. 3 204. 5 211. 3 211. 0222 W eaving m ills , s y n t h e t ic s .................................. 101. 5 101. 4 101. 4 102. 7 102. 3 90. 4 9 0 .5 90. 4 92. 4 92. 0223 Weaving and fin ish ing m ills , w o o l ................. 42. 1 41. 9 42. 7 44. 2 43. 8 36. 0 35. 8 36. 4 38. 0 37. 6224 Narrow fabric m i l ls ................................................ 31. 8 31. 7 31. 6 31. 9 31. 7 28. 3 28. 1 28. 1 28. 4 28. 2225 Knitting m il ls ............................................................ (*) 243. 5 245. 1 253. 8 254. 5 (*) 214. 5 215. 9 225. 2 226. 42251 Women’ s h os iery , excep t s o c k s ................. 65. 3 65. 8 66. 8 66. 2 59. 2 59. 7 60. 8 60. 42252 H osiery, n e c ........................................................ - 37. 4 37. 5 39. 0 39. 4 “ 33. 8 33. 8 35. 4 35. 82253 Knit outerwear m il ls ......................................... — 70. 1 70. 8 78. 8 79. 7 60. 2 60. 8 68. 7 69. 82254 Knit underwear m ills ......................................... 1 - 33. 7 3 3 . 9 34. 1 33. 8 29. 6 29. 8 30. 2 30. 0
See footnotes at end of table. NOTE: Data for the 2 most recent months are preliminary.
371-793 0 - 69 - 6Digitized for FRASER http://fraser.stlouisfed.org/ Federal Reserve Bank of St. Louis

2 2 62 2 72282 2 9
232312 3 2
2 3212 3 2 7
2 3 2 8
2 3 32 3312 3 3 52 3 3 7
2 3 3 92 3 423 4 12 3 4 2
23523623612 3 7 ,fi
2 3 92 3 9 1 ,
26
261,22632 6 4
2 6432 6 52 6 5 1 ,
26 5 32 6 5 4
27271
27 2
2 732 7527512 7 5 22782 7 4 ,6
282812 8 1 22 8 1 8
2 8 1 92 8 22821
2 8 2 3 ,
2832 8 3 4
284
2841
2 8 4 4
2 8 52 8 72 8 7 1 ,;
2 8 6 ,92 8 9 2
2 9
291
2 9 5 ,9
>. 4:.o.9
». 5
>. 51
I. 4I. 0
I. 4.9o
». 9; . 3: . 3I. 5t. 8I. 1». 7I. 1
3. . 5>. 5i. 3
.. 7
31.4i. 2i. 2i. 81 . 5
'.9i .8•• 9
5. 2. 8
i. 5
. 3
.9
. 5
. 6
. 1
. 0
. 0
. 8
. 7
. 4
.9
. 2
. 2
. 1
. 2
.9.6
. 2
. 3
,. 7. 1. 1. 1
. 7
. 1
.6
DATA 82
LOYMENTB-2: Em ployees on nonagricu lturo l payro lls , by in dustry—C ontinued
(In th o u s a n d s )
A l l e m p lo y e e s P r o d u c t io n w o r k e r s 1Industry N o v .
1969O c t .1969
Se pt.1969
N o v .1968
O c t .1968
N o v .1969
O c t .1969
Nondurable Goods—Continued
T E X T IL E M IL L P R O D U C TS -C ontinuad
Textile finishing, except w o o l ...................... 85 . 2 84 . 3 83 . 9 8 2 . 5 8 1 . 9 7 2 . 3 7 1 . 5Floof covering m ills ........................................... - 5 5 . 8 5 5 . 4 52 . 8 5 1 . 9 — 44 . 7Yarn and thread m ills ........................................ 122. 4 121. 1 121. 4 122. 0 121. 0 113. 1 111. 9Miscellaneous textile g o o d s ........................... 7 8 . 0 78 . 7 7 8 . 3 8 1 . 6 8 0 . 5 6 4 . 1 64 . 8
A P P A R E L A N D O T H E R T E X T IL E P R O D U C T S . . . 1, 421 . 5 1 ,4 2 9 . 7 1 ,4 2 7 . 3 1 ,4 2 6 . 2 1 ,4 3 4 . 5 1 , 2 4 8 . 4 1 , 2 5 5 . 7Men’ s and boys ’ suits and coats..................... 136. 6 136 . 2 1 3 7 . 4 134. 9 133 . 2 119. 7 119. 2Men’ s and boys’ furnishings ............................ 376 . 7 375 . 2 373 . 9 367 . 4 368 . 7 3 3 3 . 8 332 . 5
Men’ s and boys’ shirts and nightwear . . . 124. 2 1 2 2 .5 1 2 0 . 4 1 2 1 .6 _ 111. 1Men’ s and boys’ separate tro u se rs ............ - 79 . 1 7 9 . 9 8 0 . 7 8 0 . 0 - 7 2 . 1Men’ s and boys’ work clothing..................... - 8 6 . 3 86 . 1 8 2 . 6 8 2 . 8 - 7 4 . 3
Women’ s and m isses’ outerwear..................... 4 2 8 . 3 4 3 5 . 0 4 3 2 . 6 4 2 5 . 6 4 3 0 . 4 3 8 0 . 8 385 . 6Women’ s and m isses’ blouses andwaists . - 5 1 . 8 5 0 . 8 5 3 . 1 5 2 . 3 - 4 6 . 6Women’ s and m isses’ d r e s s e s ..................... — 2 0 4 . 8 203 . 0 200 . 3 2 04 . 4 — 184. 3Women’ s and m isses’ suits and coats . . . - 9 1 . 6 95 . 3 88 . 1 9 2 . 4 - 8 0 . 1Women’s and m isses’ outerwear, n e c . . - 86 . 8 8 3 . 5 84 . 1 8 1 . 3 - 7 4 . 6
Women’ s and children’ s undergarments . . . 124 . 9 1 2 5 .8 1 2 5 .7 130 . 4 130. 5 108. 3 109. 7Women’ s and children’ s underwear............ — 8 6 . 7 8 6 . 6 8 8 . 1 8 8 . 5 - 7 6 . 8Corsets and allied garments . . . . . . . . . - 39. 1 39 . 1 4 2 . 3 4 2 . 0 — 3 2 . 9
Hats, caps, and m illinery................................. - 19. 1 1 9 . 6 2 1 . 8 22 . 4 - 1 7 . 0Children’ s outerwear............ ............................. 78 . 1 78. 6 7 8 . 9 80 . 0 8 0 . 8 6 8 . 8 6 9 . 4
Children’ s dresses and b louses................... - 34. 3 3 3 . 7 34 . 9 34. 7 - 30. 8Fur goods and miscellaneous apparel . . . . - 81 . 1 80 . 2 8 2 . 2 84 . 2 - 6 9 . 7Misc. fabricated textile p rod u cts .................. 177. 6 178. 7 1 7 9 . 0 1 8 3 . 9 184 . 3 151. 3 1 5 2 .6
House furn ish ings............................................. - 66 . 8 6 5 . 9 6 5 . 7 6 5 . 4 — 57 . 7
P A P E R A N D A L L IE D P R O D U C T S .................. 7 2 3 . 4 7 20 . 2 7 2 2 . 2 7 0 6 . 5 7 0 0 . 4 5 6 0 . 6 5 5 7 . 5Paper and pulp m ills .......................................... 224 . 1 224 . 4 226 . 2 219 . 2 2 1 7 . 0 174. 3 174 . 2Paperboard m i l l s ................................................ 7 3 . 7 72 . 9 7 3 . 5 7 3 . 7 7 3 . 0 58 . 8 5 8 . 1Misc. converted paper prod u cts ..................... 190. 5 188. 5 1 8 8 .6 183 . 2 182. 1 138. 7 136. 9
Bags, except textile b ags.............................. - 4 2 . 7 4 2 . 8 4 2 . 9 4 2 . 0 - 3 4 . 7Paperboard containers and b o x e s .................. 235 . 1 234 . 4 2 3 3 . 9 2 3 0 . 4 228 . 3 188. 8 188. 3
Folding and setup paperboard boxes . . . . - 7 4 . 2 7 4 . 0 7 2 . 4 7 1 . 6 - 61 . 7Corrugated and solid fiber b o x e s ............... - 107. 9 107. 4 105. 7 104. 6 83 . 7Sanitary food containers................................. - 3 2 . 6 32 . 7 32. 2 3 1 . 9 - 26 . 3
P R IN T IN G A N D P U B L IS H IN G ........................... 1 ,100 . 0 1 ,100 . 3 1 , 0 9 1 . 6 1 ,0 7 5 . 6 1 ,0 7 0 . 7 6 8 4 . 0 6 8 4 . 5Newspapers........................... .. ............................. 370 . 3 368 . 9 365 . 3 362 . 8 361 . 8 181. 5 181. 1P eriod ica ls ........................ .................... .. - 7 9 . 9 7 9 . 0 7 7 . 6 77 . 3 — 28 . 2Books........................................................................ - 9 6 . 8 96. 8 94. 5 94 . 2 _ 53 . 4Commercial printing . ....................................... 351 . 3 351 . 2 348 . 9 343 . 5 341 . 0 272 . 3 272 . 7
Commercial printing, ex. lithographic . . . _ 217 . 0 2 1 5 . 9 2 1 2 . 4 210 . 1 _ 170. 2Commercial printing, lithographic............... — 122. 1 1 2 1 .0 119. 5 119. 5 — 93. 3
Blankbooks and bookbinding........................... 5 9 . 6 5 9 . 4 5 9 . 5 56. 2 5 5 . 9 49 . 1 49. 1Other publishing & printing ind........................ 143. 2 144. 1 142. 1 141. 0 140. 5 99. 2 1 0 0 . 0
C H E M IC A L S A N D A L L IE D P R O D U C T S . . . . 1 ,0 5 0 . 6 1 ,047 . 1 1 ,0 5 2 . 2 1 ,0 3 3 . 2 1 ,029 . 8 6 1 3 . 7 6 1 0 . 3Industrial ch e m ica ls .......................................... ( * ) 313 . 1 315 . 7 313 . 1 312 . 3 ( * J 171. 5
Alkalies and chlorine....................................... ~ 25. 5 25. 8 25. 8 25. 8 17. 8Industrial organic chemicals, n e c . . . . 123. 8 124. 1 125. 3 124. 7 ~~ 54 . 9Industrial inorganic chemicals, n e c . . . - 9 6 . 3 97. 8 9 5 . 3 95 . 3 - 5 5 . 5
Plastics materials and synthetics.................. 227 . 1 226 . 1 2 2 6 . 4 2 1 9 . 9 217 . 2 1 4 8 .8 147. 9Plastics materials and r e s in s ..................... - 9 7 . 9 9 7 . 7 9 5 . 0 9 3 . 0 _ 5 9 . 6Synthetic f ib e r s ................................. ... - 1 1 5 .0 1 1 5 .5 111. 6 111. 0 — 7 9 . 6
Drugs........................................................................ 143. 9 143. 9 144. 2 1 3 7 .6 137. 5 7 0 . 6 70 . 4Pharmaceutical preparations........................ - 1 1 2 .6 113. 0 107. 1 1 0 6 .7 — 5 4 . 3
Soap, cleaners, and toilet g o o d s .................. 126. 3 1 2 5 .7 1 2 4 .8 120. 3 1 2 0 . 8 7 4 . 5 73. 9Soap and other detergents.............................. - 4 0 . 6 41 . 0 3 9 . 6 40 . 1 — 26. 5Toilet preparations.......................................... - 5 3 . 7 52 . 5 51 . 2 5 0 . 9 — 32. 5
Paints and allied prod u cts .............................. 70 . 4 71 . 2 7 2 . 3 7 0 . 0 7 0 . 2 38. 8 39. 4Agricultural chem icals....................................... 5 2 . 9 5 2 . 5 5 1 . 8 53 . 2 53 . 6 3 2 . 0 31 . 4
Fertilizers, complete & mixing only . . . . - 3 5 . 9 35. 1 3 6 . 5 37 . 1 — 23. 4Other chemical products.................................... 1 1 2 .8 114. 6 1 1 7 . 0 119. 1 118. 2 7 4 . 3 75 . 8
E x p losives ......................................................... — 4 2. 1 43 . 9 47 . 2 46 . 8 — 32 . 1
P E T R O L E U M A N D C O A L P R O D U C T S . . . . 192. 5 1 9 2 .7 1 9 2 .9 187. 8 188. 2 118. 9 1 1 9 .3Petroleum refining................................................ 154. 0 154. 0 154. 0 150. 5 150. 1 91. 1 9 1 . 5Other petroleum and coal p rod u cts ............... ( * ) 38. 7 38. 9 37. 3 38 . 1 ( * ) 2 7 . 8
at end of table. NOTE: Data for the 2 most recent months are preliminary.
Digitized for FRASER http://fraser.stlouisfed.org/ Federal Reserve Bank of St. Louis

83 ESTABLISHMENT DATAEMPLOYMENT
B-2: Employees on nonogricultural payrolls, by industry—Continued
(In th o u s a n d s )
SIC IndustryAll employees Production workers ^
Code Nov.1969
Oct.1969
Sept.1969
Nov.1968
Oct.1968
Nov..1969
Oct.1969
Sept.1969
Nov.1968
Oct.1968
3 0
Nondurable G o o d s—C on tin u ed
R U B B E R A N D P L A S T IC S P R O D U C T S , N E C 587. 1 587. 1 585. 8 573. 3 572. 8 4 5 4 .4 455. 3 454. 0 445. 9 444. 7301 Titps and inner tubes............... .......................... 120. 1 119 .4 119. 6 113. 8 114 .4 83. 6 8 3 .4 83. 3 78 .5 79. 33 0 2 ,3 ,6 Other rubber p r o d u c ts ....................................... 182. 0 182. 5 183. 3 187. 6 186. 5 142.4 143. 3 143. 8 147. 7 146.43 0 2 Rubber footw ear........................ .. ....................... _ 24. 7 25. 6 27. 6 27. 9 _ 20. 7 21. 5 23. 2 23. 33 0 7 Miscellaneous plastics p r o d u c ts .................. 285. 0 285. 2 282. 9 271. 9 271. 9 2 28 .4 228. 6 226. 9 219. 7 219. 0
31 L E A T H E R A N D L E A T H E R P R O D U C T S . . . 341. 0 338. 7 336. 2 359. 2 356. 7 291. 7 289. 7 287. 1 310. 5 306. 8311 Leather tanning and fin ish in g ........................ 28. 2 28. 1 28. 5 30. 2 30. 1 24. 3 24. 3 24. 5 26. 3 26. 23 1 4 Footwear, except rubber................................... 224. 0 221. 2 218. 1 234. 2 231. 7 194 .4 192.4 189.4 205. 1 202. 83 1 2 ,3 ,5 - 7 ,9 Other leather products............... ... 88. 8 8 9 .4 89. 3 94. 8 9 4 .9 73. 0 73. 0 73. 2 79. 1 77. 8316 Luggage .................................................................. _ 2 2 .4 2 2 .4 21. 5 22. 9 _ 18. 0 18. 0 17. 6 17. 5317 Handbags and personal leather goods . . . . 36. 2 36. 2 40. 8 40. 3 — 30. 3 30. 5 34. 9 34. 3
TRANSPORTATION AND PUBLIC U T IL IT IE S ........................................................ 4 ,5 1 2 4, 508 4 ,5 2 9 4, 373 4 , 363 _ _ _ .
4 0 R A IL R O A D T R A N S P O R T A T IO N . .......................... - 641. 9 645. 3 647. 2 652. 0 _ _ _ _ _4 011 Class I railroads^............ .. ................................ - 570. 3 5 73 .4 571 .7 577. 0 - - - - -
41
L O C A L A N D IN T E R U R B A N P A S S E N G E R
T R A N S I T . ............................................................................. 289. 5 287. 7 285. 0 283. 8411 L ocal and suburban transportation............... — 79. 6 8 0 .4 81. 3 80. 2 - 74. 8 75. 5 7 7 .4 76. 04 1 2 Taxicabs.................................................................. - 109. 6 108. 4 110. 6 109. 1 - - - _ _4 1 3 Intercity highway transportation..................... — 43. 2 44. 3 42. 3 42. 9 - 39.5 4 0 .4 38. 6 39. 1
42 T R U C K IN G A N D W A R E H O U S IN G .......................... 1 ,119.4 1,118. 5 1,077. 1 1,080. 1 1,016. 3 1 ,0 15.8 975. 5 979 .64 2 1 ,3 Trucking and trucking terminals..................... _ 1 ,027 .0 1,032. 8 986. 7 990. 4 935. 2 941. 1 896. 1 900. 94 2 2 Public warehousing............................................. _ 9 2 .4 85. 7 90. 4 89. 7 _ 81. 1 74. 7 7 9 .4 78. 745 T R A N S P O R T A T IO N B Y A I R .............................. _ 358. 1 360. 8 339. 9 338. 4 _ _ _ _ _4 5 1 ,2 Air transportation..................... ... ..................... - 323. 6 326. 7 308. 3 307. 2 - - - - -
46 P IP E L IN E T R A N S P O R T A T IO N ..................... - 18. 2 18. 9 18. 4 18. 5 - 14. 6 15. 2 15. 1 15. 24 4 ,4 7 O T H E R T R A N S P O R T A T IO N A N D S E R V IC E S — 339. 6 349 .9 338. 6 326. 7 - — - - —4 4 W A T E R T R A N S P O R T A T IO N .............................. - 232. 8 243. 6 239. 8 228. 9 - — - —47 T R A N S P O R T A T IO N S E R V IC E S ......................... 106. 8 106. 3 98. 8 97. 8 — “
48 C O M M U N IC A T IO N ................................................... - 1,079. 5 1,076. 3 1,015. 5 1,009. 8 - 850. 1 849. 3 7 96 .9 793. 1481 Telephone communication................................. — 897. 3 893. 6 843. 8 837. 2 - 716. 2 715. 3 669 .8 6 64 .44 8 2 Telegraph communication^.............................. - 31. 2 32. 0 32. 9 33. 0 - 21. 8 2 2 .4 23. 0 23. 04 8 3 Radio and television broadcasting............... — 134 .4 134. 3 124. 5 125. 5 “ 106. 2 105. 9 99. 0 100. 7
4 9 E L E C T R IC , G A S , A N D S A N IT A R Y S E R V IC E S - 662. 2 671. 3 651. 5 653. 2 - 568. 6 577. 7 563. l 564. 9491 Electric companies and s y s t e m s .................. “ 275. 3 278 .4 266. 2 267. 8 ~ 234. 6 237 .7 227. 3 228 .74 92 Gas companies and sy s te m s ........................... ~ 155. 8 158. 6 157. 4 157. 3 132. 6 135. 1 134. 3 134. 54 9 3 Combination companies and system s............ 183.6 186. 0 181. 7 181. 7 159. 6 162. 5 160. 8 160. 94 9 4 -7 Water, steam, & sanitary system s.................. ~ 47. 5 48. 3 46. 2 4 6 .4 41. 8 4 2 .4 40. 7 40. 8
WHOLESALE AND R E TA IL TRADE ............ 15,118 14,865 14,702 14,536 14,302 13,491 13,233 13,081 12,972 12,7255 0 W H O L E S A L E T R A D E .......................................... 3 ,843 3 ,835 3 ,806 3, 702 3, 686 3, 237 3, 226 3, 202 3, 121 3, 105501 Motor vehicles & automotive equipment . . . - 312. 2 310. 2 294. 5 2 92 .9 — 257. 0 256. 5 244. 3 242. 7502 Drugs, chemicals, and allied products. . . . - 238. 5 235. 8 227. 9 224. 5 _ 193.9 192. 6 189. 5 186.4503 Dry goods and apparel....................................... _ 151. 9 149. 3 150. 9 148. 9 _ 120. 2 117. 8 122. 6 120. 85 0 4
5 0 6
Groceries and related p r o d u c ts .....................Electrical g oods................................................... _
566. 6 308. 5
554. 5 310. 1
553. 9 297. 3
552. 2 2 9 4 .4
- 497. 3 258. 0
485. 1 258. 9
486. 1 243. 7
483. 7 241. 0
5 07 Hardware; plumbing & heating equipment. , . _ 171.7 172. 6 166.6 166. 2 _ 145. 5 146.4 140. 7 140. 55 0 8 Machinery, equipment, and su p p lie s ............ - 748. 5 748. 2 713. 9 710. 1 - 635. 3 636. 2 605. 3 601. 65 0 9 Miscellaneous w holesalers.............................. - 1,248. 3 1,242. 7 1,200. 2 1,199. 4 - 1 ,043.4 1,039. 2 1,006. 2 1 ,004.9
5 2 -5 9 R E T A I L T R A D E .................................................................. 11,275 11,030 10,896 10,834 10,616 10,254 10,007 9 ,8 7 9 9,8 51 9 ,6 2 053 R E T A IL G E N E R A L M E R C H A N D IS E ................ _ 2 ,3 4 5 .9 2 ,2 5 4 .4 2,385. 8 2,210. 0 - 2 ,1 5 7 .0 2,070. 6 2,206. 9 2,032. 7531 Department stores................................................ - 1 ,539.9 1,470.7 1,567. 1 1 ,436.9 - 1,418. 8 1,353. 1 1,450. 2 1,320. 0532 Mail order h o u se s ................................. .. _ 136. 8 127. 9 154. 0 134 .4 — 127.9 119. 0 145. 2 125.85 3 3 Variety s t o r e s ...................................................... - 340. 1 331. 1 338 .7 323. 9 - 313 .8 305. 6 318. 0 304. 1
54 F O O D S T O R E S ...................................................................... - 1,720. 5 1 ,686.5 1,670. 5 1,650. 3 - 1,602. 2 1 ,569.4 1 ,559.6 1 ,525.85 4 1 -3 Grocery, meat, and vegetable s to r e s ............ 1,551. 0 1 ,519.7 1,501. 8 1,485. 1 1,444. 0 1,414. 3 1 ,404 .2 1,373. 9
See footnotes at end of table. NOTE: Data for the 2 most recent months are preliminary.
Digitized for FRASER http://fraser.stlouisfed.org/ Federal Reserve Bank of St. Louis

ESTABLISHMENT DATAEMPLOYMENT
84
B-2i Employees on nonogriculhiral payrolls, by industry-C ontinued
(In t h o u s a n d s )
SICCode
All employees Production workers 1Industry Nov.
1969Oct.1969
Sept.1969
Nov.1968
Oct.1968
Nov.1969
Oct.1969
Sept.1969
Nov.1968
Oct.1968
56
WHOLESALE AND RE TA IL TRADE (Continued)
A P P .A R E L A N D A C C E S S O R Y S T O R E S . . . . 701. 2 686. 0 720. 2 690. 7 630. 6 614. 9 649. 4 620. 0561 Men’ s & boys’ clothing & furnishings............... - 123. 2 118. 9 123. 5 116. 5 - 110. 1 105. 3 110. 9 103. 7562 Women’ s ready-to-wear s t o r e s ........................ - 263 .4 256 .4 267. 6 258. 7 - 237. 2 229. 8 241. 6 232. 7565 Family clothing stores................................. ... . ~ 106.4 104. 7 114. 5 106. 6 - 9 9 .0 9 7 .4 107. 3 99 .5566 Shoe s to r e s ........................ .. .............. .. ............... 134. 3 133. 9 139. 5 136. 5 - 118. 9 118 .4 122. 8 119. 7
57 F U R N IT U R E A N D HOME F U R N IS H IN G S S TO R ES - 444. 7 440. 6 442. 7 436. 3 - 388. 9 385. 5 388. 7 382. 9571 Furniture and home furnishings...................... - 285. 3 281. 9 284. 2 279. 2 - 248. 3 245. 5 248. 9 2 44 .458 E A T IN G A N D D R IN K IN G P L A C E S ........................ 2 ,4 7 5 .4 2 ,4 9 3 .9 2 ,3 1 6 .2 2,369. 3 - 2,314. 3 2,333. 5 2,165. 1 2,215. 55 2 ,5 5 ,5 9 O T H E R R E T A IL T R A D E .................................... ~ 3,342. 5 3 ,3 3 4 .9 3,298. 5 3,259. 8 - 2,914. 0 2,905. 0 2,880. 9 2,842. 652 Building materials and farm equipment . . . ~ 552. 0 553. 7 540. 8 538. 9 - 475. 0 475. 6 4 6 5 .4 462. 855 Automotive dealers & service stations . . . _ 1,598.5 1,606. 1 1,566. 5 1,556. 1 _ _ _ - -
5 5 1 ,2 Motor vehicle dealers....................................... _ 775. 2 773. 8 757 .4 756. 0 _ 656. 3 655. 0 640. 6 639. 85 5 3 ,9 Other automotive & accessory dealers. . . - 225. 5 224. 3 220. 8 216. 3 - 193.9 193. 3 191. 0 186. 35 5 4 Gasoline service stations.............................. - 597. 8 608. 0 588. 3 583. 8 - - — - -
59 Miscellaneous retail stores.............................. - 1,192. 0 1,175. 1 1,191. 2 1 ,164.8 - - - - -
591 Drug stores and proprietary s to re s ............ - 432. 9 429. 6 436. 9 434. 3 - 387. 0 383 .8 394. 5 391. 65 9 4 Book and stationery stores........................... _ 62. 8 61. 6 61. 5 61. 1 _ 54. 2 53. 0 53. 2 52. 75 9 6 Farm and garden supply s t o r e s ..................... - 107. 1 106. 9 104. 2 104. 7 - - — - -5 9 8 Fuel and ice d ea lers .......................................... ~ 107.4 104.4 111. 6 105. 7 - 93. 2 90. 6 97. 0 91. 3
- FINANCE,.INSURANCE, AND REAL ESTATE4.......................................... .................. 3,597 3,590 3,597 3,439 3,430 2,850 2,849 2 ,857 2,735 2,725
6 0 B anking ................................................ .................... - 1,000. 2 996 .7 934. 3 929. 1 - 825. 9 827. 1 7 7 5 .4 771. 361 Credit agencies other than bank s..................... - 363. 4 362 .4 352. 6 352. 0 - 284. 5 2 8 3 .4 275. 1 275. 16 1 2 Savings and loan associations........................ - 105. 8 105. 4 100. 4 100. 5 - 8 4 .4 83. 9 79. 8 80. 26 1 4 Personal credit institutions.............................. - 192. 5 192. 2 190. 3 189, 8 - - - - -6 2 Security, commodity brokers 8c serv ices . . . . - 208. 5 212. 3 205. 3 202. 7 - 182. 6 186 .4 182. 3 178. 563 Insurance carriers............... .. ................................ - 1,031. 7 1,031. 5 995 .8 993 .6 - 723. 6 718. 8 6 9 7 .4 6 9 4 .96 31 Life insurance...................................................... 533. 7 534. 4 518. 2 518. 0 - 316. 0 316. 2 304. 1 303. 06 3 2 Accident and health insurance. . . ............... ~ 88. 0 87. 2 83. 5 82. 8 - 75 .7 75. 1 7 2 .2 71. 6633 Fire, marine, and casualty insurance . . . . — 364. 3 364. 0 349. 5 348. 4 - 293. 6 289. 1 284. 0 283. 16 4 Insurance agents, brokers, and service . . . . — 273. 8 273. 9 259. 8 257. 4 - — - - -65 Real e s ta te ............................................................... _ 632. 8 638. 6 613. 3 617. 5 - - — — -6 5 5 Subdividers and developers.............................. — 84. 2 85. 6 77. 3 78. 9 - - - - -6 5 6 Operative builders....................................... - 44. 8 46. 1 43. 8 44. 6 - —6 6 ,6 7 Other finance, insurance, 8c real estate . . . . — 79. 8 8 1 .4 78. 3 77. 9
- SER V IC ES ...................................................... i i , z 1 1 11,246 11,183 10,755 10,732 - - - - -
7 0 Hotels and other lodging p la ce s .................... 690. 6 716. 6 743. 5 678. 7 701. 1 - - - - -701 Hotels, tourist courts, and m o t e ls ............. - 657. 2 671. 7 624. 7 639. 9 608. 7 622. 4 579. 8 593. 572 Personal serv ices . ........................................ 1,027. 1 1 ,028.6 1,021. 8 1 ,034.6 1 ,030 .4 - - - — —721 Laundries and dry cleaning p la n ts ............ - 532. 3 5 33 .4 542. 5 545. 9 - 484. 3 485. 0 4 9 3 .4 496. 57 2 2 Photographic studios................................ .. — 45. 2 4 2 .4 44. 0 42. 8 — 38. 8 37. 0 38. 7 38. 37 3 Miscellaneous business se r v ice s ................. - 1,515. 2 1,515. 6 1,428. 7 1,425. 9 - — - — -731 Advertising ................................................. . - 119. 0 119. 0 117. 7 117. 7 - - - - -7 3 2 Credit reporting and c o l le c t io n .......... .. — 75. 2 74. 1 73. 5 73. 1 - — — — ~7 3 4 Services to buildings................. .. .............. _ 264. 3 265. 5 243. 7 2 41 .476 Miscellaneous repair s e r v ice s ...................... _ 186. 8 186. 6 174. 9 175. 37 8 Motion pictures............................................... _ 210 .4 214. 0 201. 6 200. 2781 Motion picture filming 8c distributing . . . . — 51. 2 50. 8 5 6 .9 56. 0 - 34. 2 33. 8 35 .8 35. 37 8 2 ,3 Motion picture theaters and se rv ice s . . . . . - 159. 2 163. 2 144. 7 144. 2 — - - — —8 0 Medical and other health services................. 2 ,9 4 1 .9 2,912. 5 2,893. 8 2,720. 6 2 ,6 9 9 .5 — — ~ •806 H o sp ita ls ................................................. ^ - 1 ,794.6 1,785.3 1,696. 5 1,685. 1 — - - “81 Legal serv ices ......................................................... — 225 .8 225. 0 212. 2 210. 6 — — - — —
82 Educational s e r v i c e s ........................................ ... 1 ,166 .0 1,153. 7 1 ,053.4 1 ,145.4 1 ,120.9 - - — — *“821 Elementary and secondary schools . . . . . . — 389. 0 364 .4 385. 3 378. 8 - - - - -8 2 2 C olleges and universities. . ........................... - 671. 5 600. 0 666 .2 651. 0 - — - — -8 9 Miscellaneous s e r v ic e s ...................................... - 618. 9 619. 8 581. 6 578. 9 - — - — -891 Engineering 8c architectural services . . . . - 299 .9 301 .4 289. 7 288. 3 - - — - -8 9 2 Nonprofit research a g e n c ie s ........................... 93. 3 94. 2 93. 7 93. 2 — “
See footnotes at end of table. NOTE: Data for the 2 most recent months are preliaunary.
Digitized for FRASER http://fraser.stlouisfed.org/ Federal Reserve Bank of St. Louis

ESTABLISHMENT DATAEMPLOYMENT
B-2: Em ployees on non a g r ic u ltu ra l p a yro lls , by in d u s try --C o n tin u e d
(In thousands)
SICCode
IndustryAll employees Production workers ^
N o v .1 9 6 9
O c t .1 9 6 9
S e p t .1 9 6 9
N o v .1 9 6 8
O c t .1 9 6 8
N o v .1 9 6 9
O c t .1 9 6 9
S e p t .1 9 6 9
N o v .1 9 6 8
O c t .1 9 8 8
_ G O VE RN M EN T ......................................................... 1 2 , 5 0 5 1 2 ,3 8 8 1 2 ,0 8 0 1 2 ,1 0 9 1 2 ,0 3 7 _ _ _
91 F E D E R A L G O V E R N M E N T 5. ............................. 2 , 7 1 2 2 , 7 1 5 2 , 7 3 3 2 , 7 0 3 2 , 6 9 4 - - - - -
E x e cu tiv e ..................................................................... _ 2 , 6 7 9 . 6 2 , 6 9 7 . 3 2 , 6 6 7 . 6 2 , 6 5 8 . 9 _ _ _ _ _Department of D e fe n s e ....................................... - 1 , 1 0 2 . 8 1 , 1 1 1 . 6 1 , 0 9 3 . 1 1 , 0 9 4 . 1 - - - - -Post Office Department.................. ... - 7 2 5 . 5 7 2 6 . 5 7 2 1 . 8 7 1 1 . 5 - - - - -Other agencies ..................................................... - 8 5 1 . 3 8 5 9 . 2 8 5 2 . 7 8 5 3 . 3 - - - - -
Legislative............................ ... ................................... - 2 9 . 0 2 9 . 2 2 8 . 2 2 8 . 1 - - - - -Judicial ....................................... ... ........................... - 6 . 7 6 . 7 6 . 7 6 . 7 - - — - -
92,93 S T A T E A N D L O C A L G O V E R N M E N T . . . 9 , 7 9 3 9 , 6 7 3 9 , 3 4 7 9 , 4 0 6 9 , 3 4 3 - - - - -
92 State governm ent..................................................... - 2 , 5 9 5 . 2 2 , 4 8 7 . 1 2 , 5 5 5 . 6 2 , 5 2 6 . 8 - - - - -State e d u c a tio n ..................................................... - 1 , 0 9 5 . 6 9 7 0 . 4 1 , 0 6 5 . 4 1 , 0 3 7 . 0 - - - - -Other State government .................................... - 1 , 4 9 9 . 6 1 , 5 1 6 . 7 1 , 4 9 0 . 2 1 , 4 8 9 . 8 ~ — - -
93 Local government .................................................. - 7 , 0 7 7 . 7 6 , 8 5 9 . 8 6 , 8 5 0 . 0 6 , 8 1 5 . 8 - - - - -Local education ................................................. - 4 , 0 3 5 . 5 3 , 7 8 9 . 8 3 , 9 1 3 . 4 3 , 8 9 7 . 8 - - - - -Other local government ................................... 3 , 0 4 2 . 2 3 , 0 7 0 . 0 2 , 9 3 6 . 6 2 , 9 1 8 . 0
^Data relate to production workers in mining and manufacturing; to construction workers in contract construction; and to nonsupervisory workers in wholesale and retail trade; finance, insurance, and real estate, transportation and public utilities; and services. Transportation and public utilities, and services are included in Total Private but are not shown separately in this table.
"Beginning January 1965, data relate to railroads with operating revenues of $ 5,000,000 or more.
'^Data for nonsupervisory workers exclude messengers.
^Data for nonoffice salesmen excluded from nonsupervisory count for all series in this division.
Prepared by the U.S. Civil Service Commission. Data relate to civilian employment only and exclude Central Intelligence and National Security Agencies. Beginning January 1969, federal employment includes approximately 39,000 civilian technicians of the National Guard who were transferred from State to federal status in accordance with Public Law 90-486.
•Not available.N O T E : Data for the 2 most recent months are preliminary.
Digitized for FRASER http://fraser.stlouisfed.org/ Federal Reserve Bank of St. Louis
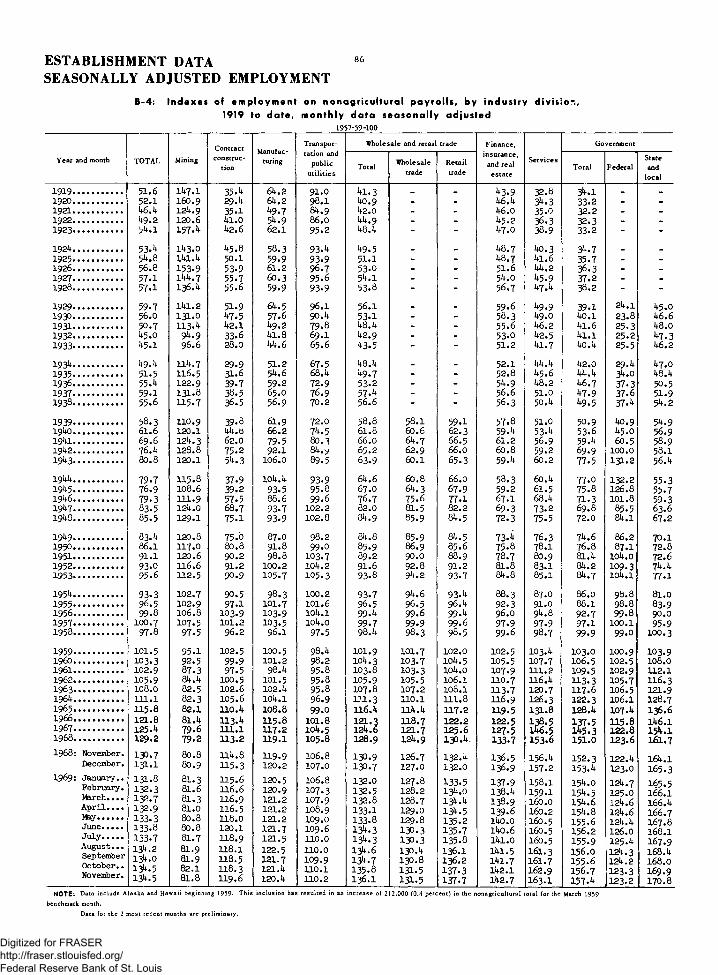
ESTABLISHMENT DATASEASONALLY ADJUSTED EMPLOYMENT
86
B-4: In d ex es of e m p lo y m e n t on no n a g r icu l tu ra l p a y ro l ls , by in d u s try d iv is ion ,1919 to d a te , m o n th ly d a t a s e aso n a l ly ad jus ted
1957-39=100
Year and month TOTAL MiningContractconstruc
tion
Manufacturing
Transpor- tation and
public utilities
Wholesale and retail trade Finance, insurance,
and real estate
Services
Government
Total Wholesaletrade
Retailtrade
Total FederalStateand
local
1 9 1 9 ........................... 5 1 .6 1 4 7 .1 3 5 .^ 6 4 .2 9 1 .0 4 1 .3 _ _ 4 3 .9 3 2 .8 3 4 .1 _1 9 2 0 ........................... 5 2 .1 1 6 0 .9 2 9 .4 6 4 .2 9 8 .1 4 0 .9 - - 4 6 .4 3 4 .3 3 3 .2 - -
1 9 2 1 ........................... 1*6.4 1 2 4 .9 3 5 .1 4 9 .7 8 4 .9 4 2 .0 - - 4 6 .0 3 5 .0 3 2 .2 - -1 9 2 2 ........................... 1*9.2 1 2 0 .6 4 1 .0 5 ^ -9 8 6 .0 4 4 .9 - - 4 5 .2 3 6 .3 3 2 .3 _ -1 9 2 3 ........................... 5 4 .1 1 5 7 .^ 4 2 .6 6 2 .1 9 5 .2 4 8 .4 - “ 4 7 .0 3 8 .9 3 3 .2 - -
1 9 2 4 ........................... 5 3 . 1 4 3 .0 4 5 .8 5 8 .3 9 3 .^ 4 9 .5 _ _ 4 8 .7 4 0 .3 3 4 .7 _ _
1 9 2 5 ........................... 5 4 .8 1 4 1 .4 5 0 .1 5 9 .9 9 3 .9 5 1 .1 - - 4 8 .7 4 1 .6 3 5 .7 - _1 9 2 6 ........................... 5 6 .8 1 5 3 .9 5 3 .9 6 1 .2 9 6 .7 5 3 .0 - - 5 1 .6 4 4 .2 3 6 .3 - -1 9 2 7 ........................... 5 7 .1 1 4 4 .7 5 5 .7 6 0 .3 9 5 .6 5 4 .1 - - 5 4 .0 4 5 .9 3 7 .2 - _1 9 2 8 ........................... 5 7 .1 1 3 6 .4 5 5 .6 5 9 .9 9 3 .9 5 3 .8 - 5 6 .7 4 7 .4 3 8 .2 - "
1 9 2 9 ........................... 5 9 .7 1 4 1 .2 5 1 .9 6 4 .5 9 6 .1 5 6 .1 _ _ 5 9 .6 4 9 .9 3 9 .1 2 4 .1 4 5 .01 9 3 0 ........................... 5 6 .0 1 3 1 .0 *>7*5 5 7 .6 9 0 .4 5 3 .1 - - 5 8 .3 4 9 .0 4 0 .1 2 3 .8 4 6 .61 9 3 1 ........................... 5 0 .7 1 1 3 .4 4 2 .1 4 9 .2 7 9 .8 4 8 .4 - - 5 5 .6 4 6 .2 4 1 .6 2 5 .3 4 8 .01 9 3 2 ........................... 4 5 .0 9 ^ .9 3 3 .6 4 1 .8 6 9 .1 4 2 .9 - - 5 3 .0 4 2 .5 4 1 .1 25.2 4 7 . 31 9 3 3 ........................... 4 5 .1 9 6 .6 28.0 4 4 .6 6 5 .6 4 3 .5 - " 5 1 .2 4 1 .7 4 0 .4 2 5 .5 4 6 .2
1 9 3 ^ ........................... 4 9 .4 1 1 4 .7 2 9 .9 51.2 6 7 .5 4 8 .4 _ _ 5 2 .1 4 4 .4 4 2 .0 2 9 .4 4 7 .01 9 3 5 ........................... 5 1 .5 1 1 6 .5 3 1 .6 5 4 .6 6 8 .4 4 9 .7 - - 5 2 .8 4 5 .6 4 4 .4 3 4 .0 4 8 .41 9 3 6 ........................... 55.** 1 2 2 .9 3 9 .7 5 9 .2 7 2 .9 5 3 .2 - - 5 4 .9 4 8 .2 4 6 .7 3 7 .3 5 0 .51 9 3 7 ........................... 5 9 .1 1 3 1 .8 3 8 .5 6 5 .0 7 6 .9 5 7 .4 - - 5 6 .6 51.0 4 7 .9 3 7 .6 5 1 .91 9 3 8 ........................... 5 5 .6 1 1 5 .7 3 6 .5 5 6 .9 7 0 .2 5 6 .6 - - 5 6 .3 5 0 .4 4 9 .5 3 7 .4 5 4 .2
1 9 3 9 ........................... 5 8 .3 110.9 3 9 .8 6 1 .9 7 2 .0 5 8 .8 5 8 .1 5 9 .1 5 7 .8 51.0 5 0 .9 4 0 .9 5 4 .91 9 4 0 ........................... 61.6 120.1 J*4.e 66.2 7 ^ .5 6 1 .8 6 0 .6 6 2 .3 5 9 .4 5 3 .4 5 3 .6 4 5 .O 5 6 .91 9 4 1 ........................... 6 9 .6 1 2 4 .3 6 2 .0 7 9 .5 8 0 .3 66.0 6 4 .7 6 6 .5 6 1 .2 5 6 .9 5 9 .4 6 0 .5 5 8 .91 9 ^ 2 ...................... 7 6 .4 128.8 7 5 .2 9 2 .1 8 4 . y 6 5 .2 6 2 .9 6 6 .0 6 0 .8 5 9 .2 6 9 .9 100.0 5 8 .11 9 ^ 3 ............................ 8 0 .8 120.1 5 4 .3 1 0 6 .0 8 9 .5 6 3 .9 6 0 .1 6 5 .3 5 9 .4 6 0 .2 7 7 .5 1 3 1 .2 5 6 .4
1 9 4 4 ........................... 7 9 .7 1 1 5 .8 3 7 .9 1 0 4 .4 9 3 .9 6 4 .6 6 0 .8 6 6 .0 5 8 .3 6 0 .4 7 7 .0 1 3 2 .2 5 5 .31 9 ^ 5 ............................ 7 6 .9 1 0 8 .6 3 9 .2 9 3 .5 9 5 .8 6 7 .0 6 4 .3 6 7 .9 5 9 .2 6 1 .5 7 5 .8 1 2 6 .8 5 5 .71 9 4 6 ............................ 7 9 .3 1 1 1 .9 5 7 .5 88.6 9 9 .6 7 6 .7 7 5 .6 7 7 .1 6 7 .1 6 8 .4 7 1 .3 101.8 5 9 .31 9 V 7 ........................... 8 3 .5 1 2 4 .0 6 8 .7 9 3 .7 102.2 8 2 .0 8 1 .5 82.2 6 9 .3 7 3 .2 69.8 85.5 63.61948........................... 85.5 129.1 75.1 93.9 102.8 84.9 85.9 84.5 72.3 75.5 72.0 84.1 67.2
19U9............................ 83.4 120.8 75.0 87.0 98.2 84.8 85.9 84.5 73.4 76.3 74.6 86.2 70.11950..................... 86.1 117.0 80.8 91.8 99.0 85.9 86.9 85.6 75.8 78.1 76.8 87.1 72.81951...................... 91.1 120.6 90.2 98.8 103.7 89.2 90.0 88.9 78.7 80.9 81.4 104.0 72.61952...................... 93.0 116.6 91.2 100.2 104.2 91.6 92.8 91.2 81.8 83.1 84.2 109.3 74.41953...................... 95.6 112.5 90.9 105.7 105.3 93.8 94.2 93.7 84.8 85.1 84.7 104.1 77.1
195^...................... 93*3 102.7 90.5 98.3 100.2 93.7 94.6 93.4 88.3 87.0 86.0 98.8 81.01955...................... 96.5 102.9 97.1 101.7 101.6 96.5 96.5 96.4 92.3 91.0 88.1 98.8 83.91956...................... 99.8 106.8 103.9 103.9 104.1 99.4 99.6 99.4 96.0 94.8 92.7 99.8 90.01957...................... 100.7 107.5 101.2 103.5 104.0 99.7 99.9 99.6 97.9 97.9 97.1 100.1 95.91958...................... 97.8 97.5 96.2 96.1 97.5 98.4 98.3 98.5 99.6 98.7 99.9 99.0 100.3
1959...................... 101.5 95.1 102.5 100.5 98.4 101.9 101.7 102.0 102.5 103.4 103.0 100.9 103.9I960...................... 103.3 92.5 99.9 101.2 98.2 104.3 103.7 104.5 105.5 107.7 IO6.5 102.5 108.01961...................... 102.9 87.3 97.5 98.4 95.8 103.8 103.3 104.0 107.9 111.2 109.5 102.9 112.11962...................... 105.9 84.4 100.5 101.5 95.8 105.9 105.5 106.1 110.7 116.4 113.3 105.7 116.31963...................... 108.0 82.5 102.6 102.4 95.8 107.8 107.2 108.1 113.7 120.7 117.6 106.5 121.91964........................... 111.1 82.3 105.6 104.1 96.9 111. 3 110.1 111.8 116.9 126.3 122.3 106.1 128.71965....................... 115.8 82.1 110.4 108.8 99.0 116.4 114.4 117.2 119.5 131.8 128.4 107.4 136.61966...................... 121.8 81.4 113.4 115.8 101.8 121.3 118.7 122.2 122.5 138.5 137.5 115.8 146.11967...................... 125.4 79.6 111.1 117.2 104.5 124.6 121.7 125.6 127.5 146.5 145.3 122.8 154.11968...................... 129.2 79.2 113.2 119.1 105.8 128.9 124.9 130.4. 133.7 153.6 151.0 123.6 161.71968: November. 130.7 80.8 114.8 119.9 106.8 130.9 126.7 132.4 136.5 156.4 152.3 122.4 164.1December. 131.1 80.9 115.3 120.2 107.0 130.7 127.0 132.0 136.9 157.2 153.4 123.0 165.31969: January.. 131.8 81.3 115.6 120.5 106.8 132.0 127.8 133.5 137.9 158.1 154.0 124.7 165.5February. 132.3 81.6 116.6 120.9 107.3 132.5 128.2 134.0 138.4 159.1 154.5 125.0 166.1March...• 132.7 81.3 116.9 121.2 107.9 132.8 128.7 134.4 138.9 160.0 154.6 124.6 166.4A p r il .. . . 132.9 81.0 116.5 121.2 108.9 133.1 129.0 134.5 139.6 160.2 154.8 124.6 166.7
133.3 80.8 118.0 121.2 109.0 133.8 129.8 135.2 140.0 160.5 155.6 124.4 167.8June......... 133.8 80.8 120.1 121.7 109.6 134.3 130.3 135.7 140.6 160.5 156.2 126.0 168.1July......... 133.7 81.7 118.9 121.5 110.0 134.3 130.3 135.8 141.0 160.5 155.9 125.4 167.9August.. . 134.2 81.9 118.1 122.5 110.0 134.6 130.4 136.1 141.5 161.3 156.0 124.3 168.4September 134.0 81.9 118.5 121.7 109.9 134.7 130.8 136.2 141.7 161.7 155.6 124.2 168.0October.. 134.5 82.1 118.3 121.4 110.1 135.8 131.5 137.3 142.1 162.9 156.7 123.3 169.9November. 134.5 81.8 119.6 120.4 110.2 136.1 131.5 137.7 142.7 163.1 157.4 123.2 170.8N O T E : Data include Alaska and Hawaii beginning 1959* This inclusion has resulted in an increase of 212,000 (0.4 percent) in the nonagricultural total for the March 1959
benchmark month.Data for the 2 most recent months are preliminary.
Digitized for FRASER http://fraser.stlouisfed.org/ Federal Reserve Bank of St. Louis

87 ESTABLISHMENT DATASEASONALLY ADJUSTED EMPLOYMENT
B -5: E m p loyees on n o n a g ric u ltu ra l p a y ro lls , by in d u s try , seaso n a lly a d ju s te d
(In thousands)
Industry division and group1969 1968
N ov . O ct. S e p t. Aug. Ju ly June May A p r. Mar. Feb. Jan. Dec. N ov .
TOTAL........................................................... 70,621 70,61*2 70,390 70,500 70,247 70,300 70,013 69,789 69,710 69,487 69,199 68,875 68,664
M IN IN G .................................................................... 630 632 631 631 629 622 622 624 626 628 626 623 622
CONTRACT CONSTRUCTION........................... 3,^52 3A15 3A20 3,1*10 3,434 3,466 3,407 3,363 3,374 3,366 3,338 3,330 3,313
MANUFACTURING................................................ 19,982 20,156 20,197 2 0 ,331* 20,161* 20,198 20,118 20,111 20,122 20,061 19,999 19,958 19,897
D U R A B L E G O O D S ..................................................................... 11,712 11,937 11,965 12,081 11,912 11,931 11,874 11,868 11,881 11,839 11,819 11,744 11,700
Ordnance and a ccessories.............................. 306 307 311* 325 332 337 342 343 346 346 349 351 347Lumber and wood products........................... 588 595 598 600 607 610 6o4 608 607 606 603 600Furniture and fix tu re s .................................... 1*83 1*92 1*92 U93 491 496 496 1*96 494 494 490 485 484Stone, clay, and glass products.................. 664 663 660 659 658 662 656 658 664 666 664 658 652Primary metal in d u s tr ie s .............................. 1,377 1,383 1,378 1,361 1,348 1,347 1,333 1,326 1,332 1,330 1,321 1,313 1,300Fabricated metal products.............................. 1,^50 1,^57 1,1*68 1,**65 1,456 1,456 1,453 1,450 1,451 1,444 1,437 1,426 1,420Machinery, except e le c tr ica l........................ 1,99^ 2,029 2,020 2,005 2,007 2,010 1,999 1,999 1,993 1,997 1,981 1,971 1,974Electrical equipment....................................... 1,952 2,076 2,075 2,076 2,070 2,063 2,058 2,046 2,036 2,026 2,013 1,996 1,988Transportation equipment.............................. 1,995 2,032 2,051* 2,183 2,032 2,035 2,009 2,029 2,042 2,020 2,01*5 2,031 2,031Instruments and related p ro d u cts ............... 1*61* 1*69 1*69 1*73 471 473 474 472 470 468 466 465 465Miscellaneous manufacturing........................ 1*1*3 k k l 1*1*0 443 447 445 444 445 445 441 447 445 439
N O N D U R A B L E G O O D S .......................................................... 8,270 8,219 8,232 8,253 8,252 8,267 8,244 8,243 8,241 8,222 8,180 8,214 8,197
Food and kindred p ro d u c ts ........................... 1,816 1,771 1,791 1,797 1,787 1,789 1,793 1,795 1,793 1,801 1,792 1,789 1,781Tobacco m anufactures.................................... 78 78 80 83 81 81 82 81 83 82 81* 81 82Textile mill products....................................... 981* 978 979 979 988 990 987 991 995 999 1,000 998 997Apparel and other textile p ro d u cts ............ 1,407 1,1*11 1,1+12 1,414 1,423 1,429 1,426 1,425 1,417 1,409 1,424 1,412 1,412Paper and allied products.............................. 721 719 718 718 716 717 714 710 714 713 709 706 704Printing and pu blish in g ................................. 1,097 1,099 1,093 1,089 1,081* 1,083 1,075 1,078 1,078 1,077 1,076 1,074 1,072Chemicals and allied products..................... 1,056 1,051 1,051 1,052 1,054 1,055 1,01+6 1,044 1,045 1,01*4 1,040 1,040 1,038Petroleum and coal products........................ 193 191 189 190 191 191 190 190 187 170 128 189 188Rubber and plastics products, nec . . . . . 580 582 583 586 585 584 581 579 579 577 573 571 567Leather and leather products........................ 338 339 336 345 343 348 350 350 350 350 354 354 356
TRANSPORTATION AND PUBLICU TILITIE S............................................................ i*,i*90 i*, 1*86 1*,1*80 4,484 4,483 4,467 4,444 4,439 4,399 4,373 4,353 4,360 4,352
WHOLESALE AND RETAIL TRAD E............... ll*,863 ll*,827 14,716 14,702 14,671 14,665 14,609 14,533 14,508 14,1*68 14,1*12 14,271 14,291
W H O L E S A L E T R A D E .............................................................. 3,809 3,808 3,787 3,776 3,773 3,774 3,758 3,737 3,726 3,714 3,701 3,678 3,669R E T A IL T R A D E ......................................................................... l l , 0 5 k 11,019 10,929 10,926 10,898 10,891 10,851 10,796 10,782 10,754 10,7H 10,593 10,622
FINANCE, INSURANCE, ANDREAL E S T A T E ................................................... 3,611 3,594 3,586 3,581 3,568 3,557 3,541 3,531 3,515 3,502 3,490 3,463 3,453
S E R V IC E S ............................................................... 11,21*5 11,235 11,150 11,120 11,067 11,066 11,065 11,044 11,034 10,967 10,900 10,838 10,787Hotels and other lodging p la c e s ..................... 736 738 721 704 706 724 730 741 745 733 733 729 724Personal s e r v ic e s ................................................ 1,023 1,026 1,026 1,026 1,030 1,026 1,025 1,024 1,026 1,027 1,028 1,032 1,031Medical and other health se rv ice s .................. 2,91+2 2,915 2,897 2,874 2,861 2,850 2,831 2,813 2,795 2,778 2,762 2,737 2,721Educational s e r v ic e s .......................................... 1,109 1,111 1,092 1,094 1,099 1,102 1,120 1,119 1,117 1,112 1,090 1,096 1,090
GOVERNMENT ...................................................... 12,31*8 12,297 12,210 12,238 12,231 12,259 12,207 12,144 12,132 12,122 12,081 12,032 11,949F E D E R A L ...................................................................................... 2,728 2,729 2,7^9 2,752 2,777 2,790 2,754 2,758 2,759 2,767 2,760 2,724 2,709S T A T E A N D L O C A L .................................................................. q .620 9,568 9,461 9,486 q.454 9.469 9.453 -3 ,3 8 6 , 9,373 .9 ,355 9,321 9,308 9.240
NOTE: Data for the 2 most recent months are preliminary.
Digitized for FRASER http://fraser.stlouisfed.org/ Federal Reserve Bank of St. Louis

ESTABLISHMENT DATASEASONALLY ADJUSTED EMPLOYMENT
8 8
B>6: Production workers in industrial and construction activities^seasonally adjusted
(In thousands)
Major industry group ______________________________________________ 1262______________________________________________ 1968Nov. O ct. S e p t. Aug. Ju ly June May A p r. Mar. Feb. Jan. Dec. Nov.
TOTAL .............................................................. 17,950 18,093 18,137 18,267 18,142 18,203 18,092 18,054 18,101 18,063 17,993 17,928 17,859
M IN IN G ........................................................ 481 483 484 483 481 473 474 476 477 480 1*77 475 474
CONTRACT CONSTRUCTION............... 2,913 2,880 2,881 2,862 2,889 2,919 2,878 2,839 2,853 2,852 2,832 2,818 2,791
M ANUFACTURING ................................... 11*, 556 11*, 730 11*, 772 14,922 14,772 14,811 14,740 14,739 14,771 1^,731 llt,68lf 14,635 14,594
DURABLE GOODS............................... 8,1*53 8,677 8,701 8,823 8,668 8,687 8,630 8,634 8,654 8,628 8,606 8,536 8,505
Ordnance and a c c e s s o r ie s ........................ 168 168 173 181 187 188 192 193 197 195 196 195 195
Lumber and wood prod u cts ........................ 504 509 516 518 520 528 530 525 528 527 528 524 520
Furniture and fix tu re s ................................. 400 408 408 410 408 411 412 ^13 410 410 407 402 4oo
Stone, clay, and glass products............... 531 531 529 527 526 532 526 529 535 537 53^ 530 524
Primary metal in d u str ie s ........................... 1,102 1,111 1,106 1,087 1,077 1,076 1,062 1,057 1,063 1,058 1,051 1,044 1,031
Fabricated metal products........................... 1,109 1,117 1,127 1,128 1,122 1,122 1,121 1,118 1,121 1,115 1,109 1,100 1,095
Machinery, except e le c tr ica l..................... 1,355 1,387 1,380 1,366 1,369 1,377 1,366 1,370 1,363 1,370 1,359 1,3^6 1,35^
Electrical equipment and supplies . . . . 1,267 1,389 1,383 1,387 1,388 1,379 1,381 1,369 1,364 1,355 1 ,3** 1,330 1,324
Transportation equipment........................... 1,392 1,425 1,447 1,582 1,430 1,434 1,399 1,420 1,432 1,426 1,439 1,427 1,430
Instruments and related prod u cts ............ 280 288 289 292 291 292 292 292 289 288 287 287
Miscellaneous manufacturing industries. 3^5 344 343 3^5 350 348 347 348 349 346 351 351 345
NONDURABLE GOODS......................... 6,103 6,053 6,071 6,099 6,104 6,124 6,110 6,105 6,117 6,103 6,078 6,099 6,089
Food and kindred p rod u cts ........................ 1,225 1,180 1,199 1,204 1,197 1,201 1,206 1,205 1,208 1,215 1,205 1,202 1,19^
T obacco manufactures................................. 65 65 67 70 68 69 69 68 69 69 71 69 70
Textile mill products.................................... 867 861 862 863 873 873 871 875 880 883 885 883 883
Apparel and other textile products . . . . 1,236 1,238 1,239 1,242 1,248 1,255 1,255 1,252 1,246 1,238 1,254 1,243 1,245
Paper and allied products........................... 557 556 557 557 555 556 55^ 5^9 555 555 550 5^9 546
Printing and pu blish ing .............................. 681 682 678 676 675 674 669 672 673 672 673 671 670
Chemicals and allied products.................. 617 613 6l4 619 620 623 617 617 620 620 617 617 616
Petroleum and coal products..................... 119 118 117 118 119 119 118 118 116 101 73 119 119
Rubber and plastics products, nec . . . . 447 450 451 454 455 455 ^51 449 449 448 444 441 ^39
Leather and leather products .................. 289 290 287 296 294 299 300 300 301 302 306 305 307
^For mining and manufacturing, data refer to production and related workers; for contract construction, data relate to construction workers.
NOTE: Data for the 2 most recent months are preliminary.
Digitized for FRASER http://fraser.stlouisfed.org/ Federal Reserve Bank of St. Louis

fo r a w e a lth o f fre e and in exp en s ive s o u rce m a te r ia l-
COUNSELOR’S GUIDE TO MANPOWER
INFORMATION
O C C U P A T IO N A LO U T L O O KS U M M E R J O B S
A P P R E N T IC E S H IP
C A R E E R S IN G O V E R N M E N T
FIN A N C IA LA S S IS T A N C E
L A B O RS T A N D A R D S
T h is updated and e x p an d ed 1 00 -p ag e
reference is a veritab le horn
of plenty for the counselor
looking for a bibliography of career -re la ted
inform ation published by
Federal and State agencies betw een 1962
and mid-1968.
T h e G uide (B L S B ulletin 1598) is availab le for $1 a copy from the
S uperin tenden t of D ocum ents, U .S .
G overnm ent Printing O ffice ,
W ashington , D.C.2 0 4 0 2 .
U.S. DEPARTMENT OF LABOR Bureau of Labor Statistics
Digitized for FRASER http://fraser.stlouisfed.org/ Federal Reserve Bank of St. Louis
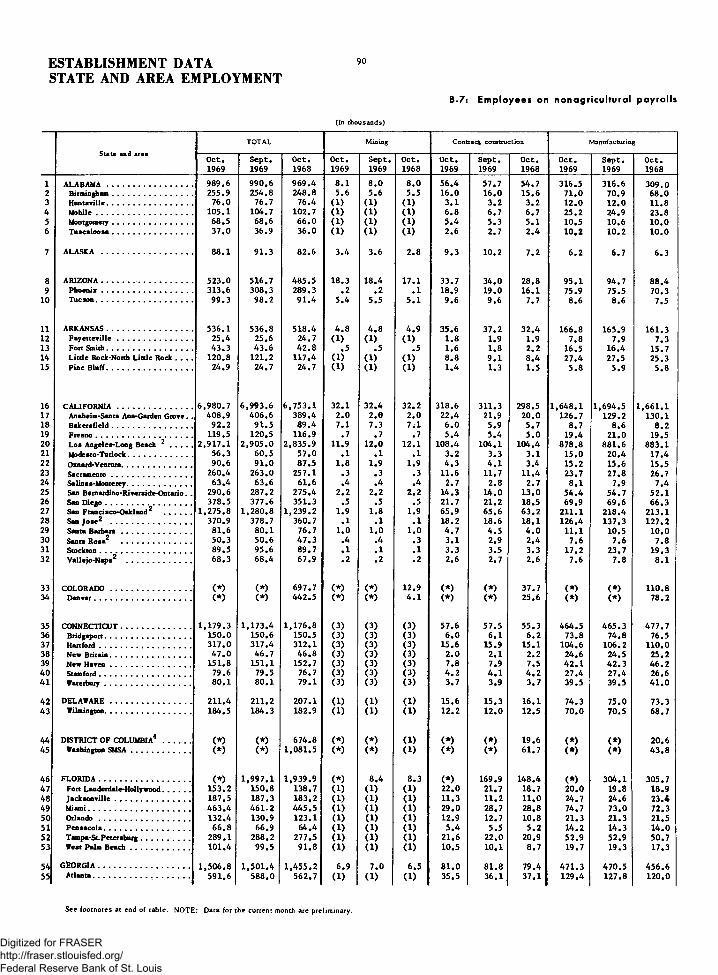
ESTABLISHMENT DATASTATE AND AREA EMPLOYMENT
90
B-7: Em ployees on nonogricultural payrolls
(In thousands)
State and areaTOTAL Mining Contract construction Manufacturing
Oct.1969
Sept.1969
Oct.1968
Oct.1969
Sept.1969
Oct.1968
Oct.1969
Sept.1969
Oct.1968
Oct.1969
Sept.1969
Oct.1968
1 ALABAMA .................................... 9 8 9 .6 9 9 0 .6 9 6 9 .4 8 .1 8 .0 8 .0 5 6 .4 5 7 .7 5 4 .7 3 1 6 .5 3 1 6 .6 3 0 9 .02 Birmingham.................................. 2 5 5 .9 2 5 4 .8 2 4 8 .8 5 .6 5 .6 5 .5 1 6 .0 1 6 .0 1 5 .6 7 1 .0 7 0 .9 6 8 .03 Huntsville.................................... 7 6 .0 7 6 .7 7 6 .4 ( 1 ) ( 1 ) ( 1 ) 3 .1 3 .2 3 .2 1 2 .0 1 2 .0 1 1 .84 Mobile........................................ 1 0 5 .1 1 0 4 .7 1 0 2 .7 ( 1 ) ( 1 ) ( 1 ) 6 .8 6 .7 6 .7 2 5 .2 2 4 .9 2 3 .85 Montgomery.................................. 6 8 .5 6 8 .6 6 6 .0 ( 1 ) ( 1 ) ( 1 ) 5 .4 5 .3 5 .1 1 0 .5 1 0 .6 1 0 .06 Tuscaloosa.................................. 3 7 .0 3 6 .9 3 6 .0 ( 1 ) ( 1 ) ( 1 ) 2 .6 2 .7 2 .4 1 0 * 2 1 0 .2 1 0 .0
7 ALASKA ...................................... 8 8 .1 9 1 .3 8 2 .6 3 .4 3 .6 2 .8 9 .3 1 0 .2 7 .2 6 .2 6 .7 6 .3
8 ARIZONA...................................... 5 2 3 .0 5 1 6 .7 4 8 5 .5 1 8 .3 1 8 .4 1 7 .1 3 3 .7 3 4 .0 2 8 .8 9 5 .1 9 4 .7 8 8 .49 Phoenix...................................... 3 1 3 .6 3 0 8 .3 2 8 9 .3 .2 . 2 .1 1 8 .9 1 9 .0 1 6 .1 7 5 .9 7 5 .5 7 0 .3
10 Tucson........................................ 9 9 .3 9 8 .2 9 1 .4 5 .4 5 .5 5 .1 9 .6 9 .6 7 .7 8 .6 8 .6 7 .5
11 ARKANSAS.................................... 5 3 6 .1 5 3 6 .8 5 1 8 .4 4 .8 4 .8 4 .9 35.6 3 7 .2 3 2 .4 1 6 6 .8 1 6 5 .9 1 6 1 .312 Fayetteville............................... 2 5 .4 2 5 .6 2 4 .7 ( 1 ) ( 1 ) ( 1 ) 1 .8 1 .9 1 .9 7 .8 7 .9 7 .313 Fort Smith.................................... 4 3 .3 4 3 .6 4 2 .8 ,5 .5 .5 1 .6 1 .8 2 .2 1 6 .5 1 6 .4 1 5 .714 Little Rock-North Little Rock . . . . 1 2 0 .8 1 2 1 .2 1 1 7 .4 ( 1 ) ( 1 ) ( 1 ) 8 .8 9 .1 8 .4 2 7 .4 2 7 .5 2 5 .315 Pine Bluff.................................... 2 4 .9 2 4 .7 2 4 .7 ( 1 ) ( 1 ) ( 1 ) 1 .4 1 .3 1 .5 5 .8 5 .9 5 .8
16 CALIFORNIA............................... 6 ,9 8 0 .7 6 ,9 9 3 .6 6 ,7 5 3 .1 3 2 .1 3 2 .4 3 2 .2 3 1 8 .6 3 1 1 .3 2 9 8 .5 1 ,6 4 8 .1 1 ,6 9 4 .5 1 ,6 6 1 .117 Anaheim-Santa Ana-Garden Grove. . 4 0 8 .9 4 0 6 .6 3 8 9 .4 2 .0 2 .0 2 .0 2 2 .4 2 1 .9 2 0 .0 1 2 6 .7 1 2 9 .2 1 3 0 .118 Bakersfield.................................. 9 2 .2 9 1 .5 8 9 .4 7 .1 7 .3 7 a 6 .0 5 .9 5 .7 8 .7 8 .6 8 .219 Fresno ........................................ 1 1 9 .5 1 2 0 .5 1 1 6 .9 .7 .7 .7 5 .4 5 .4 5 . 0 1 9 .4 2 1 .0 1 9 .520 Los Angeles-Long Beach 2 ......... 2 ,9 1 7 .1 2 ,9 0 5 .0 2 ,8 3 5 .9 1 1 .9 1 2 .0 1 2 .1 1 0 8 .4 1 0 4 .1 1 0 4 .4 8 7 8 .8 8 8 1 .6 8 8 3 .121 Modesto-Turlock........................... 5 6 .3 6 0 .5 5 7 .0 .1 .1 .1 3 .2 3 .3 3 .1 1 5 .0 2 0 .4 1 7 .422 Oxnard-Ventura............................. 9 0 .6 9 1 .0 8 7 .5 1 .8 1 .9 1 .9 4 .3 4 . 1 3 .4 1 5 .2 1 5 .6 1 5 .523 Sacramento.................................. 2 6 0 .4 2 6 3 .0 2 5 7 .1 .3 .3 .3 1 1 .6 1 1 .7 1 1 .4 2 3 .7 2 7 .8 2 6 .724 Salinas-Monterey........................... 6 3 .4 6 3 .6 6 1 .6 .4 . 4 . 4 2 .7 2 .8 2 .7 8 .1 7 .9 7 .425 San Bernardino-Riverside-Ontario. . 2 9 0 .6 2 8 7 .2 2 7 5 .4 2 .2 2 .2 2 .2 1 4 .3 1 4 .0 1 3 .0 5 4 .4 5 4 .7 5 2 .126 San Diego.................................... 3 7 8 .5 3 7 7 .6 3 5 1 .3 .5 .5 .5 2 1 .7 2 1 .2 1 8 .5 6 9 .9 6 9 .6 6 6 .327 San Franciaco-Oakland2 ............ 1 ,2 7 5 .8 1 ,2 8 0 .8 1 ,2 3 9 .2 1 .9 1 .8 1 .9 6 5 .9 6 5 .6 6 3 .2 2 1 1 .1 2 1 8 .4 2 1 3 .128 San Jose2 .................................. 3 7 0 .9 3 7 8 .7 3 6 0 .7 .1 .1 . 1 1 8 .2 1 8 .6 1 8 .1 1 2 6 .4 1 3 7 .3 1 2 7 .229 Santa Barbara............................. 8 1 .6 8 0 .1 7 6 .7 1 .0 1 .0 1 .0 4 .7 4 .5 4 . 0 1 1 .1 1 0 .5 1 0 .030 Santa Rosa2 ............................. 5 0 .3 5 0 .6 4 7 .3 .4 .4 .3 3 .1 2 .9 2 .4 7 .6 7 .6 7 .831 Stockton...................................... 8 9 .5 9 5 .6 8 9 .7 .1 .1 . 1 3 .3 3 .5 3 .3 1 7 .2 2 3 .7 1 9 .332 Vallejo-Napa2 ........................... 6 8 .3 6 8 .4 6 7 .9 . 2 .2 . 2 2 .6 2 .7 2 .6 7 .6 7 .8 8 .1
33 COLORADO .................................. <*) (* ) 6 9 7 .7 <*) <*> 1 2 .9 <*) (* ) 3 7 .7 <*) <*) 1 1 0 .834 Denver........................................ <*> <*> 4 4 2 .5 <*) (* ) 4 .1 (* ) (* ) 2 5 .6 (* ) (* ) 7 8 .2
35 CONNECTICUT............................. 1 ,1 7 9 .3 1 ,1 7 3 .4 1 ,1 7 6 .8 ( 3 ) ( 3 ) ( 3 ) 5 7 .6 5 7 .5 5 5 .3 4 6 4 .5 4 6 5 .3 4 7 7 .736 Bridgeport.................................... 1 5 0 .0 1 5 0 .6 1 5 0 .5 ( 3 ) ( 3 ) ( 3 ) 6 .0 6 .1 6 .2 7 3 .8 7 4 .8 7 6 .537 Hartford...................................... 3 1 7 .0 3 1 7 .4 3 1 2 .1 ( 3 ) ( 3 ) ( 3 ) 1 5 .6 1 5 .9 1 5 .1 1 0 4 .6 1 0 6 .2 1 1 0 .038 New Britain.................................. 4 7 .0 4 6 .7 4 6 .8 ( 3 ) ( 3 ) ( 3 ) 2 .0 2 .1 2 .2 2 4 .6 2 4 .5 2 5 .239 New Haven.................................. 1 5 1 .8 1 5 1 .1 1 5 2 .7 ( 3 ) ( 3 ) ( 3 ) 7 .8 7 .9 7 .5 4 2 .1 4 2 .3 4 6 .24 0 Stamford...................................... 7 9 .6 7 9 .5 7 6 .7 ( 3 ) ( 3 ) ( 3 ) 4 . 2 4 . 1 4 . 2 2 7 .4 2 7 .4 2 6 .64 1 Vaterbury.................................... 8 0 .1 8 0 .1 7 9 .1 ( 3 ) ( 3 ) ( 3 ) 3 .7 3 .9 3 .7 3 9 .5 3 9 .5 4 1 .0
4 2 DELAWARE .................................. 2 1 1 .4 2 1 1 .2 2 0 7 .1 ( 1 ) ( 1 ) ( 1 ) 1 5 .6 1 5 .3 1 6 .1 7 4 .3 7 5 .0 7 3 .34 3 Wilmington.................................... 1 8 4 .5 1 8 4 .3 1 8 2 .9 ( 1 ) ( 1 ) ( 1 ) 1 2 .2 1 2 .0 1 2 .5 7 0 .0 7 0 .5 6 8 .7
44 DISTRICT OF COLUMBIA4 ........... (* ) <*> 6 7 4 .8 (* ) (* ) ( 1 ) (* ) <*) 1 9 .6 (*> (* ) 2 0 .645 Washington SMSA......................... (* ) <*) 1 ,0 8 1 .5 <*) <*) ( 1 ) <*) (*) 6 1 .7 <*> <*> 4 3 .8
46 FLORIDA.................... ................. <*> 1 ,9 9 7 .1 1 ,9 3 9 .9 <*) 8 .4 8 .3 <*> 1 6 9 .9 1 4 8 .4 <*) 3 0 4 .1 3 0 5 .74 7 Fort Lauderdale-Hollywood........... 1 5 3 .2 1 5 0 .8 1 3 8 .7 ( 1 ) ( 1 ) ( 1 ) 2 2 .0 2 1 .7 1 8 .7 2 0 .0 1 9 .8 1 8 .94 8 Jacksonville............................... 1 8 7 .5 1 8 7 .3 1 8 3 .2 ( 1 ) ( 1 ) ( 1 ) 1 1 .3 1 1 .2 1 1 .0 2 4 .7 2 4 .6 2 3 .449 Miami.......................................... 4 6 3 .4 4 6 1 .2 4 4 5 .5 ( 1 ) ( 1 ) ( 1 ) 2 9 .0 2 8 .7 2 8 .8 7 4 .7 7 3 .0 7 2 .35 0 Orlando...................................... 1 3 2 .4 1 3 0 .9 1 2 3 .1 ( 1 ) ( 1 ) ( 1 ) 1 2 .9 1 2 .7 1 0 .8 2 1 .3 2 1 .3 2 1 .55 1 Pensacola.................................... 6 6 .8 6 6 .9 6 4 .4 ( 1 ) ( 1 ) ( 1 ) 5 .4 5 .5 5 .2 1 4 .2 1 4 .3 1 4 .05 2 Tampa-St. P eter sburg.................... 2 8 9 .1 2 8 8 .2 2 7 7 .5 ( 1 ) ( 1 ) ( 1 ) 2 1 .6 2 2 .0 2 0 .9 5 2 .9 5 2 .9 5 0 .753 West Palm Beach......................... 1 0 1 .4 9 9 .5 9 1 .8 ( 1 ) ( 1 ) ( 1 ) 1 0 .5 1 0 .1 8 .7 1 9 .7 1 9 .3 1 7 .3
54 GEORGIA...................................... 1 ,5 0 6 .8 1 ,5 0 1 .4 1 ,4 5 5 .2 6 .9 7 .0 6 .5 8 1 .0 8 1 .8 7 9 .4 4 7 1 .3 4 7 0 .5 4 5 6 .655 Atlanta........................................ 5 9 1 .6 5 8 8 .0 5 6 2 .7 ( 1 ) ( 1 ) ( 1 ) 3 5 .5 3 6 .1 3 7 .1 1 2 9 .4 1 2 7 .8 1 2 0 .0
See footnotes at end of table. NOTE: Data for the current month are preliminary.
Digitized for FRASER http://fraser.stlouisfed.org/ Federal Reserve Bank of St. Louis

91 ESTABLISHMENT DATASTATE AND AREA EMPLOYMENT
for States and selected areas , by industry d iv is ion
(In thousands)
Transportation and public utilities
Wholesale and retail trade Finance, insurance, and real estate Services Government
Oct.1969
Sept.1969
Oct.1968
Oct.1969
Sept.1969
Oct.1968
Oct.1969
Sept.1969
Oct.1968
Oct.1969
Sept.1969
Oct.1968
Oct. 1969___
Sept.1969
Oct.____1968
55.1 55,5 54.0 185.4 185.0 181.1 40.5 40.8 40.0 129.3 130.2 126.7 198.3 196.8 195.9 119.4 19.5 18.6 57.5 57.2 57.3 17.2 17.2 16.9 35.3 35.0 33.8 33.9 33.4 33.1 21.7 1.7 1.7 11.3 11.4 11.3 1.8 1.8 1.9 16.7 16.9 17.6 29.4 29.7 28.9 39.7 9.9 9.5 25.1 25.0 24.9 4.7 4.7 4.6 16.8 16.8 15.8 16.8 16.7 17.4 44.5 4.5 4.5 15.9 15.8 15.3 4.3 4.4 4.1 10.2 10.2 10.0 17.7 17.8 17.0 51.5 1.5 1.5 5.8 5.8 5.8 1.2 1.2 1.2 3.3 3.3 3.3 12.4 12.2 11.8 6
8.3 8.7 8.2 14.2 14.4 13.3 2.8 2.8 2.5 10.7 11.2 9.6 33.2 33.7 32.7 7
28.7 28.6 27.2 119.1 116.9 108.8 27.6 27.4 24.8 86.2 84.7 78.6 114.3 112.0 111.8 816.6 16.5 15.9 77.0 74.6 69.7 20.6 20.4 18.2 50.3 49.0 46.2 54.1 53.1 52.8 95.6 5.6 5.3 21.9 21.4 19.9 4.1 4.1 3.7 18.0 17.9 17.0 26.1 25.5 25.2 10
32.3 31.8 31.5 103.7 105.1 102.4 20.9 21.1 20.1 72.0 73.2 68.6 100.0 97.7 97.2 112.0 2.0 1.9 4.4 4.4 4.5 .6 .6 .6 3.1 3.0 3.0 5.7 5.8 5.5 122.5 2.6 2.5 8.7 8.7 8.6 1.4 1.4 1.4 6.4 6.5 6.2 5.7 5.7 5.7 139.5 9.5 9.3 25.2 25.3 25.6 8.7 8.7 8.4 17.8 17.8 17.5 23.4 23.3 22.9 143.3 3.2 3.2 4.4 4.5 4.6 .9 .9 .9 3.2 3.2 3.1 5.9 5.7 5.6 15
470.1 472.6 454.3 1,513.9 1,513.0 1,450.9 366.7 366.0 348.8 1,212.4 1,214.7 1,153.6 1,418.8 1,389.1 1,353.7 1613.2 13.3 12.1 94.8 93.5 86.0 19.4 19.3 17.8 65.0 66.3 60.2 65.4 61.1 61.2 176.4 6.4 6.2 20.0 20.2 19.4 3.5 3.4 3.2 15.0 14.1 14.4 25.5 25.6 25.2 187.9 8.1 8.3 31.7 32.4 30.8 5.4 5.3 5.3 21.8 21.1 20.5 27.2 26.5 26.8 19
178.1 178.3 172.4 634.4 631.0 604.8 164.3 164.4 157.0 530.9 531.2 503.0 410.3 402.4 399.1 203.1 3.1 3.0 12.0 11.8 11.9 1.5 1.5 1.3 10.1 \ 9.8 9.4 11.3 10.5 10.8 214.0 4.2 3.8 19.4 19.4 18.3 3.1 3.1 3.0 14.2 14.5 13.2 28.6 28.2 28.4 22
18.3 18.5 18.3 54.2 53.9 51.8 10.4 10.3 10.3 36.3 36.6 34.8 105.6 103.9 103.5 234.1 4.1 4.1 16.6 16.9 16.8 2.4 2.4 2.4 12.0 12.2 11.2 17.1 16.9 16.6 24
17.4 17.5 17.4 64.2 64.1 60.0 9.9 9.8 9.6 53.5 52.5 49.5 74.7 72.4 71.6 2519.8 19.8 19.0 82.7 83.0 74.1 17.6 17.5 16.0 69.8 70.6 64.7 96.5 95.4 92.2 26
137.5 137.6 133.9 270.3 271.4 258.5 96.8 96.6 92.1 219.1 219.5 208.5 273.2 269.9 268.0 2716.1 16.3 15.1 68.3 67.5 64.9 13.0 13.1 12.4 71.9 71.5 68.2 56.9 54.3 54.7 283.6 3.6 3.4 16.7 16.8 16.7 3.1 3.1 2.8 19.8 19.7 18.6 21.6 20.9 20.2 292.8 2.9 2.6 11.8 12.3 11.3 3.2 3.2 2.9 8.6 8.9 8.0 12.8 12.4 12.0 306.6 7.0 7.1 20.8 20.0 19.8 3.0 3.0 2.9 14.5 14.3 13.1 24.1 24.1 24.1 313.7 3.8 3.8 11.5 11.8 11.3 1.9 1.9 1.8 10.3 9.9 9.7 30.5 30.3 30.4 32
<*) (*) 49.4 (*) <*) 164.4 <*> (*) 35.7 (*) <*) 116.8 (*) (* ) 170.0 33(* ) <*) 34.4 (* ) <*) 111.8 <*) (*) 27.0 (*) <*) 79.1 (*) (* ) 82.3 34
53.3 52.8 51.3 215.8 212.0 209.9 69.4 69.1 70.1 169.4 169.7 167.3 149.3 146.9 145.2 356.3 6.3 6.0 27.0 26.6 26.2 4.5 4.5 4.5 19.2 19.3 18.2 13.1 13.0 12.9 36
11.6 11.5 11.3 59.0 57.5 57.0 40.6 40.7 40.3 45.5 45.6 40.2 40.0 40.0 38.3 371.8 1.8 1.7 7.6 7.5 6.9 1.2 1.2 1.1 5.4 5.4 5.2 4.5 4.3 4.5 38
13.6 13.4 13.9 30.7 30.0 29.5 8.0 8.0 7.6 31.3 31.1 30.1 18.3 18.3 18.0 393.2 3.0 2.9 17.2 17.2 16.4 4.1 4.0 3.9 16.1 16.3 15.5 7.5 7.6 7.2 403.2 3.2 3.1 13.5 13.5 11.5 2.0 2.0 1.9 10.0 10.0 9.8 8 . 2 8.1 8.1 41
10.8 10.8 10.8 42.8 42.6 40.8 8.5 8.6 8.4 28.7 28.7 28.1 30.7 30.2 29.6 429.5 9.6 9.8 34.7 34.6 34.3 7.6 7.7 7.5 24.6 24.5 25.1 25.9 25.4 25.0 43
<*) (*) 30.5 <*) (*) 88.1 <*) <*) 31.1 <*> (*) 129.4 <*) (*) 355.5 44(*) <*) 58.7 <*) <*) 216.1 (*) (* ) 60.8 <*) <*) 226.7 <*) <*) 413.7 45
<*) 147.1 138.2 (* ) 508.7 501.0 (*) 120.3 112.2 (*) 348.5 340.7 (*) 390.1 385.4 467.2 7.0 6.4 40.9 39.8 38.0 10.3 10.2 9.0 29.0 28.6 26.1 23.8 23.7 21.6 47
19.3 19.4 19.2 52.4 52.2 50.9 17.9 17.8 16.7 27.8 27.9 27.8 34.1 34.2 34.2 4852.2 52.0 50.1 123.8 123.5 116.8 29.8 29.7 28.6 97.6 98.1 94.8 56.3 56.2 54.1 498.2 8.2 7.1 38.0 36.9 34.8 9.0 8.9 8 .2 21.8 2 1 .8 2 0 .6 21.2 21.1 20.1 503.4 3.4 3.4 14.4 14.2 13.3 2.4 2.5 2.4 8.8 8.7 8.0 18.2 18.3 18.1 51
20.0 20.1 18.7 83.8 82.7 80.7 16.1 16.1 15.6 51.4 51.2 48.9 43.3 43.2 42.0 524.9 4.8 4.4 25.7 25.7 23.7 6.6 6.3 5.9 17.9 17.3 16.5 16.1 16.0 15.3 53
106.8 106.8 99.9 314.9 313.2 302.4 71.8 71.8 68.8 171.7 171.0 169.2 282.4 279.3 272.4 5459.9 59.7 55.9 157.8 156.4 149.1 40.6 40.5 38.9 83.0 83.1 81.1 85.4 84.4 80.6 55
Digitized for FRASER http://fraser.stlouisfed.org/ Federal Reserve Bank of St. Louis

ESTABLISHMENT DATASTATE AND AREA EMPLOYMENT
9 2
B-7: Em ployees on nonagricultural payrolls
(In thousands)
TOTAL Mining Contract construction Manufacturing
Oct.1969
Sept.1969
Oct.1968
Oct.1969
Sept.1969
Oct.1968
Oct.1969
Sept.1969
Oct.1968
Oct.1969
Sept.1969
Oct.1968
1G E O R G IA ( c o n t in u e d )
A u g u s t a ............................................................... 89 .7 89 .2 88 .9 CD CD CD 6 .9 6 .9 6 .7 30 .9 31.0 30.82 C o l u m b u s ........................................................... 68 .7 6 9 .I 68 .7 (1) CD CD l+.l 1+.2 1+.2 18 .8 18 .9 19.33 M a c o n ...................................................................... 78 .9 78.3 76.0 ( D CD CD 1+.8 b.9 3 .7 15 .9 15 .7 15.31+ S a v a n n a h ............................................................... 66 .9 67.3 63 .9 ( D CD CD l+.O l+.O 3 .8 17 .7 17 .9 17.3
5 H A W A II...................................................................... 270.6 271.6 25I+.7 (1 ) CD CD 21.6 21.6 19.1+ 22.3 23.6 21.1+6 H o n o lu lu ............................................................... 229.8 230.5 215.8 ( D CD CD 18 .9 19.0 16.8 15.5 16.6 15.0
7 I D A H O ...................................................................... 203.6 205.8 198.1 3.5 3.5 3 .5 10 .8 11.1+ 10.6 1+1.2 1+0.5 1+0.88 B o i s e ...................................................................... 38.7 39.0 36.8 (1) CD CD 2.5 2.6 2 .2 **•5 1+.1+ 1+.1+
9 I L L I N O I S ............................................................... (* ) M 3 i* .5 it, 3 ^ .9 (* ) 21+.8 21+.5 CD 222.5 206.6 ( D 1,1+00.7 1,389 .^10 C h ic a g o 5 ....................................................... (* ) 3 ,0 3 8 .^ 2 ,995 .9 (* ) 5 .0 5 .2 (* ) 137.2 131.8 CD 973 •** 972.1+11 C h ic a g o -N o r th w e s te r n I n d ia n a . . . . (* ) (* ) 3,20l+.6 (* ) (* ) 5.3 CD CD 11+5.6 CD CD 1,070.1+12 D a v e n p o r t -R o c k I s la n d -M o l in e . . . . (* ) 135.0 135.0 CD (3 ) (3) (* ) 7 .7 7 .6 CD 1*3.9 1+6.1+13 P e o r i a ........................................................... . . (* ) 133.0 130.0 (* ) ( 3 ) C3) (* ) 9.1 8 .6 CD 1+8.9 1+8.5ll+ R o c k f o r d ............................................................... (* ) 113.8 111.1+ w (3) (3 ) CD 5-5 5.2 CD 57.6 57.8
15 IN D IA N A 2 ....................................................... 1 ,891 .6 1,89^ . 9 1 ,827 .5 l-b 7.6 7 .7 95.9 96.6 89.2 752.0 758.0 713.816 E v a n s v i l l e ........................................................... 87.2 87.1+ 87.1 1 .6 1.6 1 .7 1+.1+ 1+.5 1+.1+ 33.1* 33.5 33.517 F o r t W a y n e ....................................................... 118.5 118.8 112.5 CD CD CD 5.6 5 .9 I+.9 1+6.1 1+6.1 1+3.818 G a ry -H a m m o n d -E a s t C h i c a g o 5 . . . 220.7 220.8 208.7 CD CD CD 13 .8 11+.2 13 .8 108.1 106.9 98.019 I n d i a n a p o l i s .................................................... 1+25.6 1+26.3 1+20.7 CD CD CD 20.8 21.0 19.6 138.3 139.0 137.720 M u n c i e .................................................................. 1+8.1+ 1+8.3 1*6.0 CD CD CD 2.1 2 .2 2.1 19.6 19.5 18.1+21 S ou th B e n d ....................................................... 95 -1* 95.3 96.9 CD CD CD 1+.1 1+.1 l+.O 31*. 7 31+.9 36.522 T e r r e H a u t e . . . . . ..................................... 55.0 51+. 8 53.2 .9 .9 .8 2 .8 2 .8 2.3 15.1 1I+.9 11+.2
23 I O W A .......................................................................... 885.O 886.0 871.7 3 .8 3 .8 3 .7 1+3.0 1+5.1+ 1+1+.1+ 222.1+ 223.1 222.82b C e d a r R a p i d s .................................................... 67 .8 68 .0 66.2 CD CD CD 2 .7 2 .9 3.1 28.1 28.2 26.925 D e s M o i n e s ....................................................... 128.0 127.7 125.1 CD CD CD 6.3 6.1+ 6 .1 26.0 25.9 26.026 D u b u q u e ............................................................... 33 .9 3i+.o 32.1+ CD CD CD 1 .5 1.6 1.5 13 .9 13 .8 13.527 S io u x C i t y ........................................................... 1+1.7 1+1.6 1+1.9 CD CD CD 2 .2 2.1+ 2.1 9.1+ 9.1 9 .928 W a t e r l o o ................................................ . . . . 51.3 50.7 50.9 CD CD CD 3 .1 3 .2 2.7 19.1+ 19.1+ 20.5
29 K A N S A S 2 ........................................................... 688.3 687.8 680.5 11.6 11.7 11.5 39.0 38.6 35.2 11+5.1+ 11+5.8 11+6.830 T o p e k a 2 ........................................................... 61 .9 61.3 59.6 .1 .1 .1 3 .9 3 .7 3.3 9.1 9.0 8.531 W ic h it a .................................................................. (* ) 11+6.5 11+8.1+ (* ) 2.1+ 2.6 CD 7 .8 7.1 CD 1+9.0 52.3
32 K E N T U C K Y ........................................................... 901.8 900.3 89I.O 26.1+ 26.7 27.1 56.8 59.2 59.2 21+8.2 21+5.8 21+3-933 L e x i n g t o n ........................................................... 78.7 78.1 77-1+ CD CD CD 5.5 5.5 1+.8 16 .8 16 .8 17.63** L o u i s v i l l e ........................................................... 336.7 33b.3 301+.0 CD CD CD 19.1 19.1 16 .9 123.0 121.9 101+.3
35 L O U I S IA N A ....................................................... . 1 ,068 .1 1 ,067 .2 l,05 l*. 9 52.7 53.2 51.9 90.6 90.6 96.1 183.7 181.6 183.O36 B a ton R o u g e ................................................ 101.3 101.6 105.3 .7 .7 .7 12 .8 13 .0 17.0 18.0 18.1 17 .937 L a k e C h a r le s ................................................ 1+1.1 1+0.8 1+0.8 1 .2 1 .2 1 .1 5.2 5.5 6 .0 9.1 8 .9 8 .538 M o n r o e ............................................................... 38 .9 38.6 38.1+ .1+ .1+ .1+ 1+.1+ l*-3 i*-5 6 .8 6 .8 6 .739 N e w O r l e a n s ................................................ 375.3 377.1 371.9 15.3 15.2 ll+.O 26.5 26.7 26.0 55.1* 55.9 57.91+0 S h r e v e p o r t .................................................... 9I+.I+ 9I+.1+ 92.3 3 .9 1+.0 1+.2 7 .2 7.2 7 .0 17.1+ 17.6 16.5
bl M A I N E .................................................................. 330.2 330.6 329.3 CD CD CD 16.2 16.1+ 17.0 116.2 115.9 118.9b2 L e w i s t o n - A u b u r n ..................................... 28.2 28.3 29.3 CD CD CD 1.1+ 1.1+ • 1.1+ 12 .9 13.0 lb .31*3 P o r t la n d ........................................................... 61+.0 6I+.2 63.2 CD CD CD 3.5 3.5 3.6 15.5 15.5 15.1+
bb M A R Y L A N D 4 ................................................ 1,300 .6 1 ,2 96 .7 1,21+8.0 1 .8 1 .8 1 .8 87.7 89.2 85.O 281+.1 285.6 280.21+5 B a l t i m o r e ....................................................... 810.0 807.8 782.6 .3 .3 .3 1+6.3 1+6.9 M+.O 208.6 209.O 20I+.9
1+6 M A S S A C H U S E T T S ................, ..................... 2 ,2 57 .7 2 ,261.5 2,223 .0 CD CD CD 100.8 101.1+ lOl+.O 683.8 681.2 687.51+7 B o s t o n ............................................................... 1 ,292 .1 1,287.1+ 1 ,272.6 CD CD CD 51+.1 53.6 59.0 29I+.9 293.3 29I+.61+8 B r o c k to n ........................................................... 50.2 50.3 1+9.1 - - - 2 .0 2 .1 2 .0 17 .0 17.1 16 .91+9 F a l l R i v e r ........................ ............................... 1+8.2 1+7.9 1+7.0 CD CD CD CD CD CD 23.5 23.3 22 .950 L a w r e n c e -H a v e r h i l l ................................. 80.1+ 80 .9 79.9 CD CD CD 2.1 2.1 2 .1 38.3 38.2 39.751 L o w e l l .............................................................. 52.9 52.7 51.7 CD CD CD 2 .2 2.3 2.1+ 20.6 20.1+ 19.852 N e w B e d f o r d ................................................ 55.3 55.7 55.0 CD CD CD 1 .9 2 .0 1 .9 26 .9 26 .9 27.153 S p r in g f ie ld -C h i c o p e e -H o ly o k e . . . 196.1 195.6 I9I+.8 CD CD CD 8 .8 8 .7 8 .1 71.2 71.6 73.851* W o r c e s t e r ....................................................... 130.6 129.9 129.3 C i) CD (1 ) 5.6 5 .6 5.8 ^7.7 1+7.6 1+8.0
See footnotes at end of table. NOTE: Data for the current month are preliminary.
Digitized for FRASER http://fraser.stlouisfed.org/ Federal Reserve Bank of St. Louis

9 3 ESTABLISHMENT DATASTATE AND AREA EMPLOYMENT
for States and selected a reas , by industry d iv is io n --C ontinu ed
(In thousands)
Transportation and public utilities W holesale and retail trade Finance, insurance,
and real estate S e rv ice s Government
Oct.1969
Sept. 1969
Oct.I968
Oct.1969
Sept.1969
Oct.1968
Oct.1969
Sept.1969
Oct.1968
Oct.1969
Sept.1969
Oct.1968
Oct.1969
Sept.1969
Oct.1968
4.3 4-3 4.0 15.2 14 .9 15.6 3 .2 3 .2 3-0 8 .9 8 .8 8 .9 20.3 20.1 19 .9 13-4 3 .4 3 .2 13 .4 13-3 13.1 3 .7 3 . 7 3.5 8 .4 8 .5 8 .5 16 .9 17.1 16 .9 23-4 3.5 3 .4 14 .1 14.1 13.8 4 .0 4 .1 3 .7 8 .6 8 .4 8 .5 28.1 27.6 27.6 37 .0 7 .2 6 .3 14.8 l4 .8 13.5 3 .1 3 .1 2 .9 8 .5 8 .5 8 .4 11.8 11.8 11.7 4
22 .9 22.9 20.7 62 .7 62.7 5 9 .9 16.1 16.1 14 .9 53.6 53.6 49.5 71.4 71.1 68 .9 519.2 19.3 17.4 53.8 5 3 .8 51.2 14 .9 14 .9 13.8 44.6 44.3 4 l . o 62 .9 62.6 60.6 6
14.0 1 4 .1 14.0 48.4 48 .9 46.8 7 .7 7 .7 7 .4 30 .9 31.4 29.5 47.1 48.3 45.5 73 .2 3 .2 3 .2 11 .0 10 .9 10.3 2 .7 2 .7 2.5 6 .0 6 .1 5.6 8 .8 9.1 8 .6 8
( * ) 296.4 290.3 ( * ) 9^3.4 9 3 6 .9 ( * ) 230.3 222.6 ( * ) 690.2 663.6 ( * ) 626.2 610.9 9( * ) 216.2 211.0 ( * ) 677.3 671.6 ( * ) 180.4 175.0 ( * ) 501.9 490.0 ( * ) 347.0 338.9 10(* ) (* ) 224.3 (* ) (* ) 7 0 6 .7 ( * ) ( * ) 180.7 ( * ) ( * ) 511.5 ( * ) ( * ) 360.2 11( * ) 7.3 7.2 ( * ) 30.1 29.3 ( * ) 5.2 5.1 ( * ) 18 .9 17.6 ( * ) 21.8 21.8 12( * ) 7-5 7.3 ( * ) 2 8 .6 28.3 ( * ) 5.1 5.0 ( * ) 19 .0 18.1 ( * ) 14 .9 14.2 13( * ) 3 .6 3 .4 ( * ) 21.1 20.7 ( * ) 3 .0 3 .1 ( * ) 13 .8 13.0 ( * ) 9.0 8.3 14
99-9 100.7 98.8 365.9 365.1 355.3 74.3 74.2 72 .7 204.0 204.8 199.9 292.3 287.8 290.0 155.1 5.2 5.2 19.1 19.1 18.9 3.3 3.3 3.3 12.3 12.3 12.1 8 .0 7 .9 8 .0 167 .9 8 .2 7 .8 26.7 26.3 24.9 6 .2 6 .2 6 .0 15.0 15.1 14.5 11.0 11.0 10.6 17
13-4 13.5 13.3 36.0 36.3 35.1 5.8 5.8 5.7 21 .9 22.1 21.5 21.7 22.0 21.3 1828.4 28.4 27.4 9 3 . ^ 92.6 92.6 28.7 28.9 28.4 51.1 51.3 50.1 64 .9 65.1 64 .9 19
2 .4 2.5 2.3 8 .9 8 .7 8 .4 1 .4 1 .4 1 .4 5.2 5.2 5.1 8 .8 8 .8 8.3 204 .9 4 .9 4 .7 20.4 20.3 20.2 4 .8 4 .8 4 .8 16.0 16 .0 16.1 10.5 10.3 10.6 214 .2 4 .2 4 .2 13.1 13.1 12 .9 1 .8 1 .8 1 .8 6.3 6 .4 6.3 10 .8 10.7 10.7 22
51.0 51.4 50.7 209.1 210.3 204.9 4o.8 4l.O 39-2 142.9 142.8 140.2 172.1 168.3 165.9 233 .2 3.3 3 .2 13.1 13 .0 13.0 3-2 3 .2 3 .0 10.2 10.2 10.1 7 .2 7 .2 6 .8 249 .7 9 .7 9.1 31.6 31.5 31.8 14.7 14 .7 13 .7 21 .7 21.7 21.0 17 .9 17.8 17.4 251 .8 1 .8 1 .7 6 .9 7 .1 6 .3 .9 • 9 • 9 6.3 6 .2 6 .2 2.6 2.5 2.3 263 .3 3.3 3.3 11.5 11.7 11.7 2 .0 2 .1 1 .9 7 .9 7 .7 7 .9 5.4 5.4 5.2 272 .4 2-5 2.5 10.1 10 .1 9.7 1 .4 1 .4 1.3 7 .1 7 .2 7 .1 7-8 7 .0 7 .2 28
51.7 52.0 51.9 158.3 158.5 155.8 29.6 29.7 28.8 100.9 101.1 100.0 151.8 150.4 150.5 297-4 7-5 7 .4 13.2 13.1 13.0 3 .9 3 .8 3.6 9 .9 9 .9 9.6 14 .7 14.4 14.3 30
(* ) 7 .6 7 .6 (* ) 31 .1 31.3 (* ) 6 .5 6 .4 (* ) 23.3 22.8 (* ) 19.0 18.6 31
61.0 60.8 60.5 181.5 181.5 176.8 33.6 33.7 33.9 125.5 125.2 120.9 168.8 167.4 168.7 324.3 4 .4 3 .9 14.5 14 .7 15.0 3 .8 3 .7 3 .4 13.0 12 .2 11.6 20.8 20.8 21.2 33
22.4 22.4 22.0 69 .9 69 .1 64.8 16.6 16.7 16.1 45.3 45 .4 43.3 40.3 39.7 36.6 34
97*5 97.9 93.4 230.3 230.0 225.1 47.7 47 .9 46.7 149.5 150.8 147.3 216.1 215.2 211.4 355*3 5.4 5.2 21.3 21.3 21.2 5.2 5.2 5.1 13 .8 13.7 13.3 24.3 24.2 24.8 363 .4 3 .2 3-1 8 .2 8 .1 8 .1 1 .5 1 .5 1 .4 5.4 5.6 5.6 7 .1 6 .8 7 .0 372 .4 2 .4 2 .2 9.6 9.5 9 .7 2 .7 2.6 2 .4 5.1 5 .1 5.1 7 .5 7 .5 7 .4 38
47.1 48.3 46.9 88.9 88 .7 87 .9 22.0 22.0 21.7 67 .2 67.3 65.5 52.9 53.1 52.0 399 .4 9 .4 9.2 23.2 23.3 23.1 4.5 4.5 4.3 13.6 13.7 13 .4 15.1 14.7 14.5 4o
17.2 17.8 17.1 63.1 63 .2 62 .1 11 .9 11.8 11.5 4 o .6 41.5 40.2 65.0 64 .0 62.5 41• 9 • 9 .9 5 .8 5 .9 5.8 • 9 • 9 • 9 4.3 4 .2 4.1 2 .0 2 .0 1 .9 42
5.1 5.3 5.0 17.0 17.1 16.6 5.2 5.2 4 .9 10 .4 10 .4 10.4 7.3 7 .2 7.3 43
78.8 79-8 75-9 299.7 296.2 282.7 68.4 68.8 64 .7 231.9 233.7 218.7 248.2 241.6 239.0 4456.3 57.6 53.7 170.0 168.4 163.7 43.2 43.4 41.5 132.6 133.1 126.9 152.7 149.1 147.6 45
117.0 117.0 112.9 475.7 476.9 468.2 126.8 126.2 121.3 459.5 462.9 440.5 294.1 295.9 288.6 4674.7 74.4 71 .9 288.6 287.7 286.4 91.7 91.4 88.2 314.8 313.8 302.7 173.3 173.2 169.8 47
3-3 3.3 3 .2 12.3 12 .4 12.0 1 .4 1 .4 1.3 6 .5 6 .3 6 .1 7 .7 7 .7 7-6 481 .7 1 .8 1 .7 9.4 9 .2 9-2 (1) (1 ) (1) 9.3 9.3 8 .9 4.3 4.3 4.3 492 .4 2 .4 2 .2 15 .1 14 .9 14.6 2 .4 2 .4 2.3 10.0 10 .1 9 .7 10.1 10 .8 9.3 502 .0 2 .0 1 .9 10 .9 10.8 10.7 1.5 1.5 1 .4 8 .9 8 .9 8 .8 6 .8 6 .8 ' 6 .7 512.6 2.6 2.6 9 .8 9 .9 9.4 (1 ) (1) (1 ) 9.5 9 .6 9.5 4.6 4.7 4.5 528 .2 8.3 8 .4 39.^ 39.1 38 .4 9.2 9.1 9.2 34.3 34.4 32 .9 25.O 24.4 24.0 536 .7 6 .6 6 .5 25 .7 25.5 25.1 6 .9 6 .9 6 .6 22.0 21.8 21.6 16.0 15 .9 15.7 54
Digitized for FRASER http://fraser.stlouisfed.org/ Federal Reserve Bank of St. Louis

ESTABLISHMENT DATASTATE AND AREA EMPLOYMENT
94
B-7: Em ployees on nonagricu ltural payrolls
(In thousands)
12345678 9
101112
131415
16 17
181920 21 22
232425
262728
293031
3233
3435363738394041
4243
444546474849505152535455565758
S ta te and area
T O T A L M in in g C o n tra c t con s tru ction M a n u fa ctu rin g
Oct.1969
Sept.1969
Oct.1968
Oct.1969
Sept.1969
Oct.1968
Oct.1969
Sept.1969
Oct.1968
Oct.1969
Sept.1969
Oct.1968
MICHIGAN.................................. 3,088.4 3,090.9 3,051.2 12.8 13.2 13.0 117.0 122.3 125.1 1,184.5 1,190.7 1,176.1Ann Arbor................................ 107.3 105.2 103.1 (1) C D (1) 3.3 3.5 3.2 38.4 38.1 37.7Bottle Creek........................... 60.1 60.4 59.6 (1) (1) C D 2.3 2.4 2.3 27.0 27.1 27.0Boy City.................................. 31.4 30.8 31.2 (1) C D (1) 1.4 1.5 1.5 12.8 12.2 12.7Detroit.................................... 1,545.7 1,548.1 1,515.0 1 . 0 1.1 .9 58.7 61.0 59.7 613.2 614.4 603.6Flint...................................... 161.4 163.7 164.4 (1) (1) C D 7.0 7.2 7.2 84.6 88.1 89.0Grnnd Ropido........................... 189.5 191.2 187.9 (1) C D (1) 9 .0 10.1 9.7 76.8 77.8 78.4Jockson .................................. 47.4 47.7 46.1 (1) C D C D 2.4 2.5 2.1 19.6 19.9 18.9Koloaozoo. ......................... 73.9 74.2 72.6 (1) (1) (1) 3.5 3.6 3.7 30.1 30.2 30.1Lonoing.................................. 137.0 132.7 131.3 (1) C D 6.1 6.4 6.7 42.3 42.7 39.3Muskegon-Muskegon Heights . . . 52.2 53.0 51.5 (1) d 5 C D 1.7 1.9 2.1 28.1 28.5 27.6Soginow.................................. 75.2 74.9 73.4 C D C D C D 4.3 4.3 4.0 33.5 33.6 33.3
MINNESOTA............................. 1,312.2 1,320.1 1,273.3 15.5 16.3 15.6 72.5 75.2 71.8 322.1 333.1 317.7Duluth-Superior......................... 57.3 57.5 56.4 C D C D C D 3.1 3.1 3.1 9.8 10.2 9.4Minneupolis-St. Poul................ 777.4 776.2 763.0 C D C D C D 41.0 42.0 41.2 215.3 216.9 213.6
MISSISSIPPI............................. 570.7 571.6 560.7 6.2 6.2 6.3 36.1 37.4 33.0 179.5 179.5 178.4Jockson .................................. 90.2 90.2 87.5 .8 .8 .8 6.3 7.0 5.9 14.2 14.2 14.0
MISSOURI.................................. 1,663.9 1 ,655.5 1,643.9 9.2 9.2 8.7 75.3 76.5 74.7 455.8 455.9 461.8Konsos C ity........................... 515.3 514.0 504.6 .6 .6 .6 27.7 26.1 28.9 132.4 133.6 131.9St. Joseph ^ ........................... 33.0 33.0 31.8 (3) (3) (3) 2.5 2.5 1.8 10.0 10.1 9.8St. Louis . .............................. 910.4 908.4 899.0 2.3 2.3 2.3 46.7 46.4 44.1 290.4 291.6 292.0Springfield............................. 55.5 55.0 54.4 .1 .1 .1 2.9 3.0 2.7 16.2 16.2 16.6
MONTANA ................................ 201.9 205.2 199.5 6.2 6.2 5.6 12.5 12.9 13.2 24.7 24.3 25.1Billings.................................. 28.6 28.0 28.2 (1) C D C D 1.5 1.5 1.8 3.7 3.2 3.6Greet Foils............................. 24.9 25.2 24.2 C D C D C D 2.0 2.1 1.9 3.2 3.3 3.5
NEBRASKA................................ 481.9 477.4 469.3 2.0 2.0 1.8 26.2 26.8 26.0 88.1 87.4 85.2Lincoln.................................. 73.2 71.5 68.6 - - - 3.8 3.9 3.9 11.4 11.1 10.6Omaha.................................... 204.4 202.8 197.1 (3) (3) (3) 12.6 12.6 11.3 39.7 39.3 37.5
NEVADA .................................. 193.6 195.4 182.1 3.9 4.0 3.8 11.6 11.5 10.2 7.8 7.9 7.3Las Veges......................... 107.8 108.1 98.5 .2 .2 .2 7.1 6.9 5.6 4.0 4.0 3.8Reno.................... ............. 52.6 53.1 50.0 .2 .2 .2 3.0 3.0 2.9 2.7 2.7 2.5
NEW HAMPSHIRE 2 ................ 258.3 262.4 254.4 .3 .4 .3 14.5 15.2 13.4 96.1 96.9 98.6Manchester 2 ................ 49.2 49.4 49.0 C D C D (1) 2.8 2.9 2.9 16.3 16.9 17.5
NEW JERSEY.............................. 2,572.0 2.,568.1 2,522.5 3.2 3.2 3.2 121.8 120.4 122.7 890.6 895.2 894.8Atlantic City........................... 64.5 66.9 64.0 - - - 3.7 3.7 3.4 11.6 11.8 11.1Camden6 ?............................. 245.6 242.8 238.6 .1 .1 .1 14.4 14.1 13.2 73.9 74.3 77.2Jersey City .........................Newark'..................................
268.2 266.9 266.7 - - - 8.6 8.5 7.6 111.8 112.0 115.5796.4 792.6 778.6 .5 .5 .5 33.4 33.7 32.9 258.1 259.3 257.7
Paterson-Cltfton-Passaic . . . Perth Amboy .......................
484.3 479.5 479.2 .4 .4 .3 22.0 22.2 22.8 185.9 186.2 189.4259.3 256.9 246.3 -8 .8 .8 13.4 13.3 12.4 110.3 110.8 108.1
Trenton.................................. 132.2 131.5 129.2 (1) C D C D 3.9 3.4 4.0 42.0 42.6 41.9
NEW MEXICO................ .......... 287.5 287.6 280.5 17.3 17.5 16.8 17.1 17.9 17.9 20.7 20.5 18.8Albuquerque........................... 106.3 106.0 100.2 (1) C D (1) 7.3 7.6 6.4 9.1 9.0 7.8
NEW YORK................................ (* ) 7 !,179.0 7,096.2 <*) 8.7 8.4 <*) 284.8 285.1 (*) 1,896.1 1,912.5Albany-Schenectady-Troy......... 272.3 272.3 271.4 C D C D C D 13.5 13.5 14.0 63.3 63.8 64.2Binghamton............................. 104.6 103.7 105.6 (1) C D C D 4.1 4.2 5.3 44.6 44.7 45.1Buffalo................ .. ................ 511.3 509.7 500.1 C D C D C D 23.4 24.3 24.1 179.6 179.2 177.0Elmira . . . . .............. 38.2 37.8 40.1 C D (1) (1) 2.0 2.0 1.9 14.6 14.5 16.7Monroe County8 .................... 306.2 305.8 301.9 (1) (1) C D 14.5 14.8 15.2 136.0 135.9 135.2Nassau and Suffolk Counties 9 . 716.7 716.4 683.6 C D C D C D 40.4 41.7 40.1 162.8 162.7 163.0New Yodc-Nottheaatem New Jersey.New York SMSA7 ....................New York City8 ....................
<*)(*>
6,4,
,669.3,875.4
6,576.84,806.0
(*)(* )
4.93.3
4.73.1
(*)(* )
249.2171.8
249.7174.1
(*)(* )
1,773.21,105.6
1,791.01,120.3
(*) 3,,799.8 3,767.6 (* ) 2.5 2.4 <*> 106.1 110.5 <*) 850.0 863.0Rochester ................................Rockland County ..................
350.7 349.6 346.9 C D C D C D 16.6 17.0 17.7 151.2 150.9 151.856.9 57.3 55.9 C D C D C D 3.6 3.6 3.8 14.2 14.2 15.2
Syracuse.................................. 231.6 230.6 226.5 C D C D (1) 12.8 14.0 12.8 68.1 68.3 67.4Utica-Rome ............................. 117.2 117.5 116.1 (1) (1) (1) 4.0 4.2 4.1 43.5 43.7 43.6Westchester County .............. 305.1 301.7 298.9 C D C D (1) 20.6 20.4 19.6 79.1 78.7 79.1
See footnotes at end of table. NOTE: Data for the current month are preliminary.
Digitized for FRASER http://fraser.stlouisfed.org/ Federal Reserve Bank of St. Louis

95 ESTABLISHMENT DATASTATE AND AREA EMPLOYMENT
for States and selected areas , by industry d iv is ion--Continued
(In thousands)
T ra n sporta tion and p u b lic u t il it ie s
W h o le sa le and r e ta i l tra d eF in a n c e , in su ra n ce ,
an d r e a l es ta teService s Government
Oct. Sept. Oct. Oct. Sept. Oct. Oct. Sept. Oct. Oct. Sept. Oct. Oct. Sept. Oct.1 9 6 9 1 9 6 9 1 9 6 8 1 9 6 9 1 9 6 9 1 9 6 8 1 9 6 9 1 9 6 9 1 9 6 8 1 9 6 9 1 9 6 9 1 9 6 8 1 9 6 9 1 9 6 9 1 9 6 8
1 5 2 . 4 1 5 2 . 8 1 4 9 . 2 5 8 7 . 2 5 8 6 . 9 5 7 5 . 5 1 1 4 . 5 1 1 4 . 7 1 1 1 . 0 4 0 3 . 9 4 0 1 . 0 3 9 7 . 1 5 1 6 . 2 5 0 9 . 4 5 0 4 . 1 1
2 . 7 2 . 7 2 . 7 1 3 . 6 1 3 . 3 1 1 . 8 2 . 2 2 . 2 2 . 2 1 0 . 2 1 0 . 3 9 . 5 3 6 . 8 3 5 . 0 3 6 . 0 2
2 . 6 2 . 6 2 . 5 9 . 2 9 . 3 9 . 0 3 . 3 3 . 3 3 . 3 7 . 8 7 . 8 7 . 6 8 . 0 8 . 0 7 . 9 3
1 . 6 1 . 6 1 . 6 7 . 0 7 . 0 6 . 9 . 7 . 8 . 7 3 . 8 3 . 8 3 . 8 4 . 0 3 . 9 4 . 0 4
8 0 . 1 8 0 . 8 7 9 . 2 2 9 4 . 9 2 9 3 . 5 2 8 4 . 1 6 6 . 4 6 6 . 6 6 4 . 4 2 1 4 . 4 2 1 5 . 3 2 1 4 . 3 2 1 7 . 0 2 1 5 . 3 2 0 8 . 8 5
6 . 0 6 . 0 5 . 5 2 3 . 3 2 2 . 9 2 4 . 9 4 . 3 4 . 3 4 . 1 1 7 . 1 1 6 . 5 1 5 . 7 1 9 . 1 1 8 . 9 1 8 . 2 6
1 0 . 5 1 0 . 4 9 . 9 4 2 . 3 4 2 . 6 4 0 . 1 7 . 2 7 . 3 7 . 2 2 6 . 8 2 6 . 2 2 6 . 1 1 7 . 0 1 6 . 9 1 6 . 6 74 . 3 4 . 3 4 . 3 8 . 6 8 . 5 8 . 3 1 . 4 1 . 4 1 . 4 5 . 0 5 . 0 5 . 0 6 . 2 6 . 2 6 . 2 8
2 . 5 2 . 5 2 . 5 1 3 . 2 1 3 . 3 1 2 . 6 2 . 2 2 . 2 2 . 2 9 . 0 9 . 0 8 . 6 1 3 . 4 1 3 . 4 1 3 . 0 9
3 . 5 3 . 2 3 . 4 2 1 . 5 2 1 . 2 2 1 . 0 5 . 0 5 . 1 5 . 2 1 6 . 2 1 5 . 5 1 4 . 6 4 2 . 4 3 8 . 5 4 1 . 2 1 02 . 8 2 . 7 2 . 7 8 . 1 8 . 2 7 . 8 1 . 3 1 . 3 1 . 2 5 . 3 5 . 5 5 . 3 5 . 1 5 . 0 4 . 8 1 14 . 6 4 . 6 4 . 5 1 3 . 4 1 3 . 3 1 3 . 3 2 . 8 2 . 7 2 . 6 8 . 7 8 . 7 8 . 4 7 . 9 7 . 8 7 . 6 1 2
8 9 . 0 8 9 . 8 8 6 . 1 3 1 4 . 7 3 1 2 . 4 3 0 2 . 3 6 2 . 4 6 2 . 4 5 9 . 8 2 0 7 . 2 2 0 6 . 8 2 0 0 . 3 2 2 8 . 9 2 2 4 . 1 2 1 9 . 6 1 37 . 3 7 . 5 7 . 8 1 3 . 7 1 3 . 6 1 3 . 4 2 . 0 2 . 0 2 . 0 1 1 . 2 1 1 . 3 1 0 . 9 1 0 . 2 9 . 9 9 . 8 1 4
5 7 . 1 5 7 . 9 5 6 . 0 1 8 4 . 9 1 8 3 . 5 1 8 1 . 3 4 5 . 0 4 5 . 0 4 3 . 5 1 3 1 . 8 1 3 2 . 0 1 2 7 . 7 1 0 2 . 4 9 9 . 0 9 9 . 7 1 5
3 0 . 2 2 9 . 4 2 9 . 5 1 0 1 . 4 1 0 1 . 5 1 0 1 . 0 1 9 . 7 1 9 . 7 1 9 . 5 6 2 . 3 6 2 . 6 6 2 . 8 1 3 5 . 3 1 3 5 . 3 1 3 0 . 2 1 65 . 4 5 . 5 5 . 5 2 0 . 4 2 0 . 2 1 9 . 6 6 . 8 6 . 7 6 . 6 1 5 . 7 1 5 . 5 1 5 . 3 2 0 . 6 2 0 . 3 1 9 . 8 1 7
1 2 6 . 3 1 2 6 . 3 1 2 5 . 4 3 6 4 . 4 3 6 2 . 4 3 6 1 . 0 8 7 . 7 8 7 . 6 8 5 . 4 2 5 6 . 5 2 5 6 . 5 2 5 1 . 8 2 8 8 . 7 2 8 1 . 1 2 7 5 . 1 1 85 0 . 5 5 0 . 8 5 0 . 3 1 2 4 . 9 1 2 3 . 8 1 2 1 . 1 3 2 . 8 3 2 . 5 3 1 . 1 7 7 . 1 7 7 . 3 7 4 . 2 6 9 . 3 6 9 . 3 6 6 . 5 1 9
2 . 1 2 . 1 2 . 1 7 . 8 7 . 8 7 . 7 1 . 3 1 . 3 1 . 3 4 . 7 4 . 6 4 . 7 4 . 6 4 . 6 4 . 4 2 06 8 . 8 . 6 9 . 2 6 8 . 0 1 8 5 . 6 1 8 5 . 5 1 8 3 . 6 4 6 . 4 4 6 . 7 4 4 . 9 1 4 9 . 1 1 4 9 . 4 1 4 2 . 9 1 2 1 . 1 1 1 7 . 3 1 2 1 . 2 2 1
4 . 2 4 . 2 4 . 2 1 3 . 4 1 3 . 1 1 2 . 3 2 . 2 2 . 3 2 . 2 8 . 8 8 . 8 8 . 5 7 . 7 7 . 3 7 . 8 2 2
1 7 . 6 1 7 . 8 1 7 . 6 4 6 . 7 4 8 . 1 4 6 . 0 7 . 8 7 . 8 7 . 6 3 0 . 3 3 1 . 5 2 9 . 9 5 6 . 1 5 6 . 6 5 4 . 5 2 32 . 9 2 . 9 2 . 8 8 . 9 8 . 8 8 . 6 1 . 5 1 . 5 . 1 . 4 5 . 3 5 . 4 5 . 3 4 . 8 4 . 7 4 . 7 2 42 . 0 2 . 0 2 . 0 6 . 4 6 . 6 6 . 2 1 . 4 1 . 4 1 . 3 4 . 8 4 . 7 4 . 5 5 . 1 5 . 1 4 . 8 2 5
3 6 . 6 3 7 . 0 3 6 . 3 1 1 9 , 3 . 1 1 7 . 3 1 1 6 . 0 2 8 . 3 2 8 . 4 2 7 . 3 7 8 . 9 7 8 . 1 7 7 . 1 1 0 2 . 5 1 0 0 . 2 9 9 . 8 2 65 . 0 5 . 0 4 . 8 1 5 . 7 1 5 . 2 1 4 . 8 5 . 5 5 . 5 5 . 2 1 1 . 2 1 1 . 3 1 0 . 7 2 0 . 7 1 9 . 5 1 8 . 7 2 7
2 1 . 2 2 1 . 3 2 0 . 8 5 0 . 8 5 0 . 4 4 9 . 7 1 6 . 4 1 6 . 4 1 5 . 8 3 4 . 8 3 4 . 5 3 3 . 5 2 8 . 9 2 8 . 3 2 8 . 5 2 8
1 3 . 6 1 3 . 7 1 2 . 9 3 6 . 1 3 6 . 3 3 4 . 5 7 . 2 7 . 3 6 . 8 7 7 . 4 7 8 . 6 7 2 . 2 3 6 . 0 3 6 . 1 3 4 . 4 2 97 . 0 7 . 0 6 . 5 1 9 . 4 1 9 . 6 1 8 . 1 3 . 5 3 . 6 3 . 3 5 0 . 9 5 1 . 1 4 6 . 0 1 5 . 7 1 5 . 7 1 5 . 0 3 04 . 6 4 . 6 4 . 5 1 1 . 6 1 1 . 6 1 1 . 1 3 . 0 3 . 0 2 . 9 1 7 . 8 1 8 . 3 1 6 . 9 9 . 7 9 . 7 9 . 0 3 1
1 1 . 1 1 1 . 1 1 0 . 6 4 9 . 3 4 9 . 3 4 6 . 9 1 0 . 3 1 0 . 4 1 0 . 0 4 0 . 7 4 3 . 0 3 9 . 7 3 6 . 0 3 6 . 1 3 4 . 9 3 23 . 5 3 . 5 3 . 1 1 1 . 7 1 1 . 5 1 1 . 1 2 . 8 2 . 8 2 . 8 8 . 2 7 . 9 7 . 8 3 . 9 3 . 9 3 . 8 3 3
1 7 5 . 2 1 7 4 . 1 1 6 8 . 2 5 2 0 . 5 5 1 8 . 5 4 9 8 . 0 1 1 5 . 0 1 1 5 . 1 1 1 0 . 7 3 9 1 . 3 3 9 3 . 3 3 7 8 . 1 3 5 4 . 4 3 4 8 . 3 3 4 6 . 8 3 43 . 5 3 . 5 3 . 3 1 6 . 1 1 7 . 3 1 6 . 6 2 . 9 2 . 9 2 . 8 1 6 . 2 1 7 . 2 1 6 . 4 1 0 . 5 1 0 . 5 1 0 . 4 3 5
1 1 . 4 1 1 . 4 1 1 . 2 5 7 . 1 5 5 . 8 5 1 . 9 8 . 4 8 . 4 8 . 1 3 4 . 6 3 3 . 8 3 4 . 0 4 5 . 7 4 4 . 9 4 2 . 9 3 6
3 7 . 7 3 7 . 8 3 6 . 4 4 2 . 3 4 1 . 0 4 0 . 3 9 . 0 8 . 9 8 . 6 2 9 . 5 2 9 . 4 2 9 . 3 2 9 . 3 2 9 . 3 2 9 . 0 3 76 0 . 8 6 0 . 8 57.9 156.7 153.6 150.5 55.2 5 5 . 5 53.3 129.1 128.6 125.7 1 0 2 . 6 1 0 0 . 6 1 0 0 . 1 3 82 5 . 1 2 5 . 1 2 4 . 8 1 1 5 . 2 1 1 1 . 2 1 1 0 . 2 1 7 . 3 1 7 . 4 1 6 . 5 6 9 . 7 6 9 . 7 6 8 . 2 4 8 . 7 4 7 . 3 4 7 . 0 3 91 3 . 4 1 3 . 3 1 1 . 2 4 8 . 9 4 7 . 8 4 5 . 3 5 . 1 5 . 1 5 . 1 2 6 . 6 2 6 . 5 2 5 . 9 4 0 . 8 3 9 . 3 3 7 . 5 4 0
6 . 9 6 . 8 6 . 6 2 0 . 5 2 0 . 2 2 0 . 0 4 . 7 4 . 6 4 . 4 2 5 . 9 2 5 . 7 2 5 . 3 2 8 . 3 2 8 . 2 2 7 . 0 4 1
2 0 . 0 2 0 . 0 1 9 . 9 5 9 . 7 6 0 . 5 5 7 . 9 1 1 . 5 1 1 . 5 1 1 . 5 5 4 . 0 5 4 . 7 5 1 . 6 8 7 . 2 8 5 . 0 8 6 . 1 4 2
6 . 4 6 . 5 6 . 5 2 5 . 4 2 5 . 6 2 4 . 4 6 . 4 6 . 5 5 . 8 2 5 . 7 2 5 . 9 2 4 . 6 2 6 . 0 2 4 . 9 2 4 . 7 4 3
( * ) 5 0 7 . 1 4 9 5 . 4 < * ) 1 , 4 2 6 . 1 1 , 4 2 1 . 0 ( * ) 5 9 1 . 1 5 7 0 . 4 < * > 1 , 3 3 0 . 7 1 , 2 9 5 . 7 < * > 1 , 1 3 4 . 5 1 , 1 0 7 . 7 4 4
1 4 . 9 1 5 . 0 1 4 . 8 5 4 . 0 5 3 . 6 5 3 . 2 1 0 . 4 1 0 . 5 1 0 . 4 4 5 . 8 4 5 . 7 4 5 . 0 7 0 . 5 7 0 . 3 6 9 . 7 4 5
4 . 8 4 . 8 4 . 8 1 7 . 3 1 6 . 8 1 7 . 2 3 . 2 3 . 2 3 . 1 1 1 . 6 1 1 . 7 1 1 . 4 1 9 . 0 1 8 . 4 1 8 . 7 4 6
3 3 . 2 3 3 . 2 3 2 . 5 1 0 4 . 4 1 0 3 . 3 1 0 1 . 2 1 8 . 9 1 8 . 9 1 8 . 5 7 4 . 5 7 4 . 1 7 2 . 0 7 7 . 3 7 6 . 7 7 4 . 8 4 7
1 . 6 1 . 6 1 . 6 7 . 7 7 . 6 7 . 9 1.0 1.0 . 9 5 . 9 5 . 9 5 . 8 5 . 4 5 . 3 5 . 3 4 8
1 1 . 2 1 1 . 5 1 1 . 3 5 4 . 8 5 4 . 0 5 3 . 0 1 0 . 9 1 0 . 8 1 0 . 4 4 6 . 9 4 6 . 5 4 4 . 6 3 1 . 9 3 2 . 3 3 2 . 2 4 9
3 1 . 8 3 1 . 7 2 8 . 9 1 8 6 . 5 1 8 3 . 9 1 7 2 . 8 2 9 . 2 2 9 . 3 2 7 . 9 1 2 8 . 6 1 3 0 . 4 1 2 2 . 3 1 3 7 . 5 1 3 6 . 7 1 2 8 . 7 5 0
( * ) 5 2 2 . 5 5 0 6 . 6 < * ) 1 , 3 5 5 . 2 1 , 3 4 4 . 7 ( * ) 5 9 3 . 8 5 7 2 . 6 ( * ) 1 , 2 2 8 . 7 1 , 2 0 3 . 4 ( * > 9 4 1 . 8 9 0 4 . 1 5 1
( * ) 3 8 5 . 5 3 7 6 . 3 ( * ) 1 , 0 0 2 . 6 9 9 8 . 4 ( * > 5 0 6 . 7 4 8 9 . 1 ( * ) 9 7 3 . 7 9 5 4 . 3 ( * ) 7 2 6 . 1 6 9 0 . 5 5 2
< * > 3 3 2 . 5 3 2 6 . 5 ( * ) 7 4 5 . 0 7 5 1 . 4 ( * ) 4 6 2 . 4 4 4 6 . 6 < * > 7 6 9 . 6 7 6 0 . 0 ( * > 5 3 1 . 7 5 0 7 . 3 5 3
1 3 . 2 1 3 . 5 1 3 . 2 6 2 . 9 6 1 . 4 6 0 . 6 1 1 . 9 1 1 . 8 1 1 . 3 5 1 . 7 5 1 . 3 4 9 . 1 4 3 . 2 4 3 . 5 4 3 . 3 5 4
3 . 2 3 . 1 3 . 1 9 . 7 9 . 7 9 . 5 1 . 8 1 . 8 1 . 8 9 . 6 1 0 . 1 9 . 3 1 4 . 8 1 4 . 7 1 3 . 3 5 5
1 4 . 6 1 4 . 8 1 4 . 4 4 9 . 9 4 9 . 3 4 8 . 2 1 1 . 3 1 1 . 4 1 0 . 8 3 8 . 9 3 7 . 8 3 6 . 9 3 6 . 0 3 5 . 0 3 6 . 0 5 6
5 . 3 5 . 3 5 . 2 1 9 . 5 1 9 . 6 1 9 . 1 4 . 6 4 . 6 4 . 3 1 3 . 9 1 4 . 1 1 3 . 7 2 6 . 3 2 6 . 0 2 6 . 1 5 7
1 8 . 0 1 8 . 0 1 7 . 8 6 5 . 9 6 5 . 4 6 4 . 8 1 3 . 0 1 3 . 2 1 2 . 9 6 5 . 2 6 4 . 4 6 3 . 5 4 3 . 3 4 1 . 7 4 1 . 2 5 8
Digitized for FRASER http://fraser.stlouisfed.org/ Federal Reserve Bank of St. Louis

ESTABLISHMENT DATASTATE AND AREA EMPLOYMENT
96
B-7: Employees on nonagricultural payrolls
(In thousands)
State and areaTOTAL Mining Contract construction Manufacturing
Oct.1969
Sept.1969
Oct.1968
Oct.1969
Sept.1969
Oct.1968
Oct.1969
Sept.1969
Oct.1968
Oct.1969
Sept.1969
Oct.1968
1 NORTH CAROLINA........................... 1 ,7 02 .9 1,698.1+ 1 ,6 75 .9 3 .5 3 .5 3.5 9*1.8 94.3 92.8 701.5 703.3 702.32 Asheville........................ _ _ - _ - - 18 .8 18.8 19 .23 Charlotte.............................. 173.8 173.5 169.2 ( l ) (1 ) (1 ) 13«2 13 .1 12.1 1+0.7 1+0.6 1+1.3k Greensboro-Winston-Salero-High Point 256.0 251+.3 250.8 (1 ) (1 ) (1) 13.5 13.1+ 12 .7 111.9 112.5 112.15 R a le igh ................................ - - - “ 11+.3 1I+.5 13 .7
6 NORTH DAKOTA...................... 160.9 159.2 158.0 1 .9 1 .9 1 .9 9 .9 10 .1 9.1 9.1 8 .8 9.37 Fargo-Moorhead.............................. 1+1.1+ 39.7 1+0.2 (1) (1) (1) 3 .2 3 .2 3 .1 3 .2 3 .2 3 .2
8 OHIO........................................ 3 ,9 63 .8 3 ,956.5 3 ,8 17 .4 20.3 20.7 17 .9 197.1 200.7 181+.!+ 1,1+71+.6 1,1+86.7 1,1+39.29 Akron...................................... 253.2 21+9.6 21+1+.1+ .2 .2 .2 9 .9 10.0 9.3 101.9 102.3 100.1+
ib Canton...................................... 138.6 139.6 131.3 .3 .3 .3 6 .2 6 .2 6 .0 62 .9 63 .8 58.7n Cincinnati................................... 512.8 508.5 1+99.1+ .1+ .1+ .1+ 21+.1+ 21+.9 21+.0 175.6 175.5 175.112 Cleveland...................................... 876.8 87 6 .I 850.5 1 .6 1.5 1 .5 1+1.2 1+1.8 38.1 311.9 313.1 312.113 Columbus...................................... 377.0 373.4 360.6 .8 .8 .8 21.7 22.0 20.2 92.7 93.0 91.0Ik Dayton................................................ 338.4 336.0 325.6 .5 • 5 • 5 13 - k 13.7 12 .7 13I+.6 131+.!+ 130.315 Toledo................................................ 21+8.6 245.9 239.1 .3 .3 .3 12 .2 12.5 11.1 86.1+ 88.0 81+.916 Youngs to wn-Varren........................... 199.5 199.6 187.5 .1+ .1+ .1+ 9 .2 9.6 8 .8 92.8 93.1+ 8 5 .I
17 OKLAHOMA .............................. 757.2 751.1+ 737.7 38 .9 39.2 1+0.1+ 35.li 35.6 36.0 130.3 129.7 122.118 Oklahoma C ity ................ 21+6.7 21+6.2 239-6 6 .7 6 .7 6 .9 12.3 12.6 12.3 35 .9 35.6 32.219 Tulsa.............................................. 178.6 179.2 175.5 13.0 13.0 13.3 9.0 9.1 8 .8 1+3.8 1+3.7 1+2.5
20 OREGON ........................................ 7 H .9 722.2 694.3 1 .7 1 .9 2 .0 33.6 36.1 33.5 181.0 188.9 180.521 Eugene......................................... 68.6 69.5 67 .2 (1) (1 ) (1 ) 3 .1 3 .5 3.5 18 .1 19.6 19.322 Portland........................................ 383.3 385.8 368.9 (1 ) (1) (1 ) 20.3 21.5 19.6 92.3 91+.1 89.523 Salem ...................... 55.6 59.0 55-1+ (1 ) (1) (1 ) 2 .6 2 .6 2 .8 12.7 16 .0 13.6
2l+ PENNSYLVANIA................................ l+,31+8.9 ^,3^5-8 ii,277.3 39.7 39.5 29.1 205.1 210.8 206.0 1,562 .3 1 ,5 66 .1 1 ,553.325 Allentown-Bethlehem-Easton........... 215.5 211+.7 213.0 .5 .5 •5 9 .0 9.0 9.0 106.8 106.9 105.726 Altoona................................................ 1+7-5 1+7-9 1+7.0 (1 ) (1 ) (1 ) 1 -9 2 .0 1 .9 15.3 15.6 15 .227 Erie..................................................... 98.8 97.6 95.1 (1 ) (1 ) (1 ) 5.1+ 5.3 l+.l 1+3.8 1+3.6 1+3.028 Harrisburg........................................... 169.9 170.9 167.6 (1 ) (1 ) (1) 9 .7 10 .2 9.0 38.3 38 .7 38 .729 Johnstown........................................... 79.1+ 80.1 76.1 k.9 1+.9 1+.2 3 .8 1+.0 3 .8 26.1 26.1 23 .930 Lancaster........................................... 117.8 117.9 115.3 (1 ) (1) (1) 6 .1 6 .3 6 .0 56.3 56.1+ 55.631 Philadelphia...................................... 1 ,7 95 .1 1 ,7 79 .0 1 ,7 71 .7 1.3 1.3 1 .3 90.2 89.I+ 88.6 565.3 563.7 572.732 Pittsburgh........................................... 86I+.5 867.8 81+2.1 9.2 9.2 5 .0 1+3.6 1+1+.8 1+3.6 292.0 291+.3 279.333 Reading.............................................. 121.8 121.3 120.7 (1 ) (1 ) (1 ) 5 .0 1+.9 1+.6 58.1+ 58.0 59.33*+ Scranton ............................................. 86.3 87.I+ 86.0 • 5 • 5 •5 2 .8 2 .8 2 .8 31+.1+ 35.9 35.1+35 Wilkes-Barre—H azleton................... 123.8 122.2 119.9 2.3 2.3 2.3 6 .3 6 .3 5 .8 5I+.6 51+.1 53.1+36 York..................................................... 130.1 130.2 128.2 (1) (1 ) (1) 7 .2 7 .6 7 .2 63.8 63 .7 63.1
37 RHODE ISLAND................................... 3I46.I 3I+I+.8 3li7.9 (1) (1 ) (1 ) 15 .0 13 .7 16 .0 126.5 125.7 127.738 Providence-Pawtucket-Warwick . . . 357.3 356.3 360.0 (1 ) (1 ) (1) 1I+.9 13.6 16.3 1I+1+.2 11+3.6 11+5.6
39 SOUTH CAROLINA............................. 792.1 791.3 777.2 1 .5 1.5 1 .5 1+6.8 1+8.2 1+7.9 331.9 332.5 327.3ho Charleston.......................................... 86.1+ 85.7 85 .0 (1 ) CD (1) 1+.6 1+.8 5.6 16 .2 16.2 15.3in Columbia.............................................. 103.2 103.2 100.9 (1) (D (1 ) 7 .7 7 .9 7.3 19 .2 19.6 19.51+2 Greenville........................................... 122.3 121.8 120.1+ (1) (1 ) (1) 9 .8 9 .8 10.1+ 56.2 56.2 55.2
1+3 SOUTH DAKOTA................................ 172.1 171.8 170.1 2 .2 2.3 2 .2 8.1+ 8.1+ 7 .9 15.6 15.5 15 .71+1+ Sioux F a lls ........................................ 33.5 33.3 33.5 (1 ) (1) (1 ) 2 .1 2 .1 1 .7 6 .1 6 .0 6 .2
1+5 TENNESSEE........................................ (* ) 1 ,3 07 .9 1,291+. 6 (* ) 7.1+ 7 .2 (* ) 71.8 68.0 (* ) 1+68.9 1+63.11+6 Chattanooga.................................... 122.0 122.3 121.8 .2 .2 .2 1+.8 1+.8 5.1+ 51.7 51.9 50.51+7 Knoxville....................................... 11+9-5 11+9.1 1I+8.2 1 .7 1 .7 1 .9 7.1+ 7 .7 7.1+ 1+9.5 1+9.6 1+9.01+8 U mpklc 269.3 267.8 262.3 .2 .2 .2 11+.1+ 11+.8 11+.5 60.1+ 60.5 60 .91+9 N ashville........................................... 218.0 216.8 213.1+ (1 ) (1) (1 ) 13.3 13.3 13.2 63 .2 61 .7 61 .0
50 TEXAS ................................................ 3 ,6 09 .7 3 ,6 01 .0 3,li70.0 101+.6 106.0 103.7 231.6 231.2 22k. 6 739.9 738.0 715.151 Amarillo............................................. _ - _ - - - - - 6.3 6.1+ 5.552 Austin................................................ _ _ _ _ - - - - - 11.1 10 .9 9 .953 Beaumont-Port Arthur-Orange . . . . _ _ _ _ - - - - - 37.2 36 .8 31+.751+ - - - - - - - - - 11.3 11.1+ 10.7
See footnotes at eijd of table. NOTE: Data for the current month are preliminary.
Digitized for FRASER http://fraser.stlouisfed.org/ Federal Reserve Bank of St. Louis

97 ESTABLISHMENT DATASTATE AND AREA EMPLOYMENT
for States and selected areas , by industry d iv is ion—Continued
(In thousands)
T ra n sporta tion and p u b lic u t il it ie s
W h o le sa le and r e ta i l tra d eF in a n c e , in su ra n ce ,
and r e a l es ta te S e r v i c e s G o v e rn m e n t
O ct.1969
S e p t.1969
O ct.1968
O ct.1969
S e p t.1969
O ct.1968
O ct.1969
S e p t.1969
O ct.1968
O ct.1969
S e p t.1969
O ct.1968
Oct.1969
S e p t.1969
O ct.1968
91.4 91.2 87.O 303 . f - 301.5 298.O 67 .4 67.1 63.6 200.4 199.6 195.0 240.5 237.9 233.7 1O
18 .9 19 .0 18 .2 44 .2 44 .2 43 .4 12.1 12.0 11 .2 24.7 24.6 23.6 20.0 20.0 19.4C.
315.0 l lf .8 Ilf. 5 U5.1 44.3 43 .9 11 .9 1 1 . 8 1 1 . 8 29.1 28 .9 27.6 29.5 28.6 28.2 4
5
12-5 12.5 12.5 43 .9 44.1 42.8 6 . 8 6 . 8 6 . 8 29.3 29.0 28.6 47.6 46.1 47.0 63 .2 3 .2 3 .2 12.3 12 .4 1 2 . 1 2 . 2 2.3 2.3 8 .4 7 .7 7 .9 8 . 8 7 .8 8 .4 7
229.1 229.7 219.2 7 7 i .o 767.4 741.4 154.5 155.2 148.0 553.1 555.1 525.5 564.1 541.1 541.9 81 5 . 0 15.1 Ilf. 9 50.0 49.2 47 .4 6 .9 6 .9 6 .4 32.5 32 .8 30 .9 37.0 33.2 35.0 9
7 .2 7.3 7 .0 25 .9 25.7 24.8 4 .7 4 .8 4.5 18 .2 18.3 17 .4 13 .2 1 3 . 2 1 2 . 6 1 036.5 36. If 34 .9 107.6 106.7 103.5 25.4 25.4 25.1 74.5 74 .2 71.2 68 .4 65.1 65 .2 1 153.6 53.8 51.2 182.8 182.7 176.3 41.4 41.8 4 o .l 133.9 133.4 127.3 110.4 107.9 103.8 1 22 0 . 8 20 .9 19 .8 78.2 77.6 74 .7 24.8 24.8 22.9 60 .2 59.7 56.9 77 .9 74.6 74.3 131 2 . 6 12 .7 1 2 . 2 60 .8 60 .0 57.4 9.5 9.5 8 .9 ^7.3 46.5 44.8 59.8 58.7 58.7 l41 8 . 2 18.3 17. If 51.0 5 0 . 6 49.6 7 .9 8 . 0 7-4 38.2 37.8 36 .0 34.3 30.4 32.4 1510. 4 10.5 1 0 . 0 36.0 35 .8 34 .8 5.6 5.6 5.2 26.5 26.4 24.8 1 8 . 6 18 .0 18.4 16
52.9 53.0 52.1 l6 if.o 164.1 162.9 36.1 35 .8 34.6 1 1 0 . 1 1 1 0 . 1 106.3 189.5 183.9 183.3 171 6 .If 16. If 16 .0 54.3 54.0 53.1 15.6 15 .6 14 .8 3 6 . 0 36.4 35.3 69.5 68 .9 69 .0 1816 .8 16 .9 16.3 IfO.l 40 .4 4 o .l 9.1 9 .0 8 .7 29.0 29.2 27.9 17 .8 17 .9 17 .9 19
50.1 50.5 if 9 .1 160.0 161.7 154.3 34.5 34 .4 33.1 107.1 109.3 103.2 1*13.9 139*4 138.6 2 04.1 Jf.l lf.0 13.5 13.6 12 .9 2 .9 2 .9 2 . 8 9.6 1 0 .'0 8 . 8 17.3 15 .8 15 .9 2 1
31.3 31.6 30.2 92. If 92.6 88.4 23.3 23.3 2 2 . 8 64 .2 64 .5 60 .4 59.5 58.2 58.0 2 21 . 8 1 . 8 1 . 8 10.6 10.6 1 0 . 2 3 .2 3 .2 3 .0 7 .5 7.5 6 .9 17.2 17.3 17.1 23
276.2 275.8 270.3 816.0 811.4 8 0 3 . 8 183.8 184.5 179.1 661.2 663.4 643.3 604.6 594.3 592.4 2411 .9 1 1 . 8 1 1 . 6 35-3 34.6 35.2 6 .5 6 . 6 6 .3 2 6 .I 25 .8 25.7 19 .4 19.5 19 .0 2 5
7 .8 7 .8 7 .9 8 . 6 8 .5 8 . 1 1 . 2 1 . 2 1 . 2 6 . 8 6 .9 6 .9 5 .9 5 .9 5.8 265.5 5.5 5.5 16 .8 16 .7 16 .4 3.5 3 .4 3 .1 12 .9 12.7 12.4 10 .9 10.4 1 0 . 6 2 7
12 .9 13 .0 1 2 . 8 32 .2 32.5 32 .2 8 . 1 8 . 1 8 . 0 24 .8 24 .7 23 .8 43-9 43.7 43*1 2 85 .2 5.2 5.1 13.1 13 .4 13.3 2 . 1 2 . 1 2 . 0 1 1 . 8 12.1 11.7 12 .4 12.3 1 2 . 1 295.6 5.5 5-4 21.1 21.2 2 0 . 6 2 .7 2 .7 2 . 6 15 .8 16.0 15.3 1 0 . 2 9.8 9.8 30
110.6 111.9 109.2 3 6 6 . 6 360.0 359.3 97.3 98.2 95.8 303.1 297.9 291.6 260.7 256.6 253.2 3158.8 59.0 58.2 166. if 166.4 165.3 37.7 37.7 36.5 155.9 156.8 152.2 100.9 99.6 1 0 2 . 0 32
6 . U 6 . 6 6 . if 18 .7 18 .7 18.3 4 .8 4 .8 4.5 16.3 16.3 1 5 . 8 1 2 . 2 12 .0 1 1 . 8 335-4 5.3 5.1 17.3 17.6 16 .7 2.5 2.5 2.5 13.7 13 .2 13.6 9.7 9.6 9.4 346 . 6 6 .7 6 .5 20.3 19.7 19 .7 4.2 4 .2 4 .1 14.5 14.3 13 .4 15.0 14.6 14.7 356 . 0 5 .9 5.7 22.5 22.3 2 2 . 2 2 . 8 2 . 8 2 .7 14.5 14 .6 14 .0 13.3 13.3 13.3 36
16 .0 16.1 15 .4 67 .5 67 .4 6 6 . 8 15 .0 15 .0 14 .9 53.8 54.6 5 4 .9 ' 52.3 52.3 52.2 371 5 .if 15.5 l i f .9 67. if 67 .5 67 .2 15.0 15 .0 14 .9 52.4 53.1 53.2 48.0 48.0 47*9 38
34.5 3lf.if 33 .1 1 3 0 . 2 130.2 127.9 27.6 27.6 26.4 77.1 76 .9 77.3 142.5 lifO.O 135.8 395.1 * .9 5 .1 16. if 16 .4 16 .4 3.3 3.3 3-3 9 .7 9 .8 9.6 31.1 30.3 29 .7 406 . 8 6 .7 6 . if 20 .8 20 .8 20.7 6 . 1 6 . 1 5.8 13.2 13 .2 13 .0 29.4 28 .9 28.2 41if.6 if.6 if.if 2 0 . 1 19 .9 2 0 . 1 4.6 4.6 4 .4 11 .7 11 .7 1 1 . 8 15.3 15 .0 l 4 . i 42
1 0 . 2 10.3 10.3 If5.7 46.1 45.5 7.3 7.3 7 .2 3 1 . 6 31.5 30.5 51.1 50.4 50.9 433 .0 3 .0 3.1 9.5 9.5 9 .7 2 . 1 2 . 1 2 . 1 6 .3 6 . 2 6 .4 4 .4 4.5 4 .4 44
(* ) 65.3 6 i f . l (* ) 246.9 247.2 (* ) 53.3 52.7 (* ) 173.8 170.3 (* ) 220.5 2 2 2 . 0 456.3 6.3 6 .5 2 1 . 9 2 1 . 8 22.3 7.3 7*2 7 .0 14 .4 14 .7 14.6 15.4 15 .4 15.3 466 .7 6 . 8 6.5 31.5 3 1 . 6 3 1 . 2 4 .9 4 .8 4 .8 19.7 19 .7 19.2 28.1 27.2 28.2 47
20.7 2 0 . 2 19 .8 67.3 66 .9 67.0 1 3 . 8 13 .9 13 .7 44.3 44 .2 41.2 48.2 47.1 45.0' 4813.1 13.1 1 2 . 6 46.2 46.6 46 .9 13 .8 13 .8 12 .9 35 .2 35 .0 34 .8 33.2 33.3 32.0 49
262.7 266.9 250.6 850.7 848.5 8 1 1 . 2 1 8 6 . 1 186.3 174.7 564.6 566.6 534.3 669.5 657.5 655.8 505152
-
- --
- - - - - - - - - - -5354
371-793 0 - 69 - 7Digitized for FRASER http://fraser.stlouisfed.org/ Federal Reserve Bank of St. Louis

ESTABLISHMENT DATASTATE AND AREA EMPLOYMENT
9 8
B-7: Employees on nonagricultural payrolls
(In thousands)
TOTAL Mining Contract construction Manufacturing
Oct.1 9 6 9
Sept.1 9 6 9
Oct.1 9 6 8
Oct.1 9 6 9
Sept.1 9 6 9
Oct.1 9 6 8
Oct.1 9 6 9
Sept.1 9 6 9
Oct.1 9 6 8
Oct.1 9 6 9
Sept.1 9 6 9
Oct.1 9 6 8
1
TEXAS (continued)D allas................................................... 6 2 5 . 4 6 2 3 . 7 5 9 2 . 4 8 . 1 8 . 2 8 . 1 3 4 . 5 3 4 . 6 3 1 . 5 1 7 3 . 7 1 7 4 . 5 1 6 2 . 0
2 El P a so ................................................. - - - - - - - - - 2 3 . 2 2 3 . 6 2 0 . 83 Fort Worth.............................................. - - - - - - - - - 9 2 . 7 9 2 . 3 9 0 . 34 Galveston-Texas C ity ........................ - - - - - - - - - 1 1 . 0 1 1 . 2 1 0 . 75 Houston................................................. 7 4 5 . 6 7 4 3 . 6 7 0 8 . 5 2 9 . 3 2 9 . 4 2 7 . 4 7 3 . 8 7 2 . 9 6 9 . 1 1 4 2 . 8 1 4 3 . 3 1 3 6 . 76 Lubbock...................................................... - - - - - - - - - 7 . 0 7 . 0 6 . 47 San Antonio........................................... 2 5 1 . 6 2 5 1 . 3 2 4 7 . 8 1 . 5 1 . 5 1 . 5 1 5 . 3 1 5 . 4 1 5 . 8 3 1 . 0 3 1 . 0 3 0 . 18 Waco......................................................................... - - - - - - - - - 1 2 . 7 1 2 . 9 1 3 . 39 Wichita Falls....................................................... - - - - “ - - - - 4 . 3 4 . 4 4 . 1
1 0 UTAH............................................................................. 3 5 3 . 4 3 5 5 . 8 3 4 4 . 0 1 2 . 4 1 2 . 7 1 2 . 2 1 5 . 3 1 6 . 2 1 5 . 2 5 6 . 3 5 7 . 2 5 3 . 91 1 Salt Lake City .................................................... 1 8 5 . 9 1 8 8 . 6 1 7 9 . 7 7 . 5 7 . 6 7 . 4 8 . 6 9 . 1 8 . 0 2 9 . 5 2 9 . 6 2 9 . 6
1 22
VERMONT ....................................................... 1 4 8 . 1 1 4 7 . 4 1 4 3 . 0 1 . 0 1 . 0 1 . 1 1 0 . 9 1 1 . 0 1 0 . 1 4 4 . 0 4 3 . 7 4 4 . 11 3 Burlington. ° .......................................................
Springfield .......................................................3 8 . 0 3 7 . 6 3 6 . 3 - - - - - - 1 1 . 0 1 0 . 9 1 0 . 8
1 4 1 3 . 5 1 3 . 5 1 3 . 6 - - - - - 6 . 6 6 . 7 6 . 8
1 5 VIRGINIA4 ........................................... 1 , 4 3 9 . 4 1 , 4 3 5 . 5 1 , 4 0 7 . 9 1 4 . 3 1 4 . 4 1 2 . 8 9 6 . 4 9 9 . 4 9 4 . 7 3 6 9 . 8 3 6 7 . 5 3 7 1 . 71 6 5 0 . 7 5 0 . 5 4 8 . 9 ( 1 ) ( 1 ) ( 1 ) 2 . 8 2 . 7 2 . 6 2 3 . 6 2 3 . 5 2 2 . 8
1 7 Newport News-Hampton...................... 9 6 . 5 9 6 . 8 9 3 . 6 ( 1 ) ( 1 ) ( 1 ) 5 . 1 5 . 3 4 . 9 2 6 . 8 2 6 . 8 2 7 . 51 8 Norfolk-Portsmouth.............................. 1 9 4 . 5 1 9 4 . 8 1 9 2 . 3 ( 1 ) ( 1 ) ( 1 ) 1 2 . 9 1 3 . 2 1 3 . 3 2 0 . 8 2 0 . 9 2 0 . 21 9 Northern Virginia ........................... 2 4 2 . 5 2 4 3 . 1 2 3 5 . 7 . 4 . 4 . 4 1 9 . 2 1 9 . 8 1 9 . 3 9 . 2 9 . 3 9 . 32 0 R ic h m o n d .............................................................. 2 2 8 . 8 2 2 8 . 1 2 2 4 . 1 . 2 . 2 . 2 1 6 . 1 1 6 . 2 1 5 . 2 5 1 . 6 5 1 . 5 5 2 . 32 1 Roanoke................................................ 8 0 . 3 8 0 . 2 7 7 . 0 . 1 . 1 . 1 4 . 9 5 . 2 4 . 9 1 9 . 3 1 9 . 1 1 8 . 7
2 2 WASHINGTON 2 ................................... 1 , 1 4 3 . 0 1 , 1 5 2 . 0 1 , 1 2 4 . 6 1 . 7 1 . 8 1 . 7 6 2 . 5 6 5 . 4 6 2 . 0 2 7 8 . 2 2 8 4 . 7 2 9 3 . 22 3 Scattle-Everett 2 .............................. 5 6 7 . 4 5 6 9 . 6 5 6 3 . 9 ( 1 ) ( 1 ) ( 1 ) 3 1 . 4 3 2 . 8 3 2 . 0 1 5 8 . 3 1 6 0 . 6 1 7 2 . 42 4 Spokane2 ........................................... 9 0 . 7 9 0 . 0 8 8 . 4 ( 1 ) ( 1 ) ( 1 ) 5 . 2 5 . 5 4 . 9 1 3 . 3 1 3 . 6 1 3 . 52 5 Tacoma ........................................... 1 0 9 . 4 111 .1 1 0 6 . 6 ( 1 ) ( 1 ) ( 1 ) 6 . 2 6 . 4 6 . 3 2 0 . 7 2 1 . 2 2 0 . 7
2 6 WEST VIRGINIA...................................... 5 1 3 . 8 5 1 5 . 0 5 0 3 . 8 4 7 . 2 4 7 . 3 3 5 . 5 2 6 . 5 2 6 . 8 2 8 . 3 1 3 3 . 1 1 3 3 . 4 1 3 4 . 02 7 Charleston........................................... 8 1 . 9 8 2 . 0 8 3 . 1 3 . 6 3 . 6 3 . 1 3 . 9 4 . 0 4 .4 1 7 . 5 1 7 . 8 1 9 . 32 8 Huntington-Ashland.............................. 8 1 . 6 8 1 . 9 8 1 . 0 . 7 . 7 . 7 4 . 4 4 .4 4 . 8 2 6 . 4 2 6 . 7 2 5 . 22 9 Wheeling.............................................. 5 9 . 8 5 9 . 9 5 5 . 2 4 . 7 4 . 6 . 9 6 . 0 6 . 2 5 . 0 1 5 . 4 1 5 . 5 1 6 . 4
3 0 WISCONSIN............................................................... 1 , 5 3 6 . 3 1 , 5 4 1 . 2 1 , 4 9 9 . 8 2 . 6 2 . 7 2 . 6 7 2 . 5 7 4 . 2 7 2 . 8 5 1 4 . 9 5 2 5 . 7 5 1 3 . 63 1 Green Bay.............................................. 5 4 . 1 5 4 . 0 5 2 . 6 ( 1 ) ( 1 ) ( 1 ) 2 . 5 2 . 7 2 . 7 1 7 . 6 1 7 . 7 1 7 . 1
3 2 Kenosha................................................ 3 4 . 1 3 3 . 8 3 3 . 3 ( 1 ) ( 1 ) ( 1 ) 1 . 1 1 . 1 1 . 4 1 5 . 4 1 5 . 4 1 5 . 33 3 La C r o s s e ................................................ 3 0 . 1 3 0 . 2 2 9 . 3 ( 1 ) ( 1 ) ( 1 ) 1 . 3 1 . 5 1 . 5 8 . 4 8 . 8 8 . 23 4 Madison................................................ 1 1 9 . 5 1 1 9 . 0 1 1 6 . 6 ( 1 ) ( 1 ) ( 1 ) 7 . 3 7 . 6 7 . 1 1 6 . 2 1 6 . 5 1 6 . 13 5 Milwaukee........................................... 5 7 2 . 3 5 7 0 . 4 5 6 0 . 7 ( 1 ) ( 1 ) ( 1 ) 2 3 . 2 2 3 . 9 2 3 . 3 2 1 1 . 7 2 1 2 . 4 2 1 1 . 13 6 Racine................................................... 5 6 . 5 5 5 . 7 5 4 . 4 ( 1 ) ( 1 ) ( 1 ) 2 . 0 2 . 0 2 . 0 2 6 . 3 2 6 . 0 2 5 . 3
3 7 WYOMING2 ...........................................................Casper ..............................................
1 0 8 . 1 1 1 2 . 6 1 0 6 . 0 1 1 . 9 1 2 . 4 1 1 . 0 6 . 3 7.7 8 . 1 7.4 7 . 1 7 . 63 8 1 9 . 9 2 0 . 3 1 9 . 0 4 . 3 4 . 6 3.3 1 . 2 1 . 2 1 . 4 1 . 3 1 . 4 1 . 33 9 Cheyenne ........................................ 1 8 . 3 1 8 . 7 1 8 . 3 (1) (1) (1) .9 1 . 2 1.1 1.1 1.1 .9
Combined with services.2 Revised to 1969 benchmark; not s tr ic t ly comparable with previously published data.^Combined with construction.4Federal employment in the Maryland and Virginia sectors o f the Washington Standard Metropolitan S ta tis tica l Area
is included in data for the D istrict o f Columbia.gArea included in Chicago-Northwestern Indiana Standard Consolidated Area.6Subarea o f Philadelphia, Pennsylvania Standard Metropolitan S ta tistica l Area. gArea included in New York-Northeastern New Jersey Standard Consolidated Area.^Subarea o f Rochester Standard Metropolitan S ta tistica l Area.
Subarea o f New York Standard Metropolitan S ta tistica l Area.™Total includes data for industry d ivisions not shown separately. Services excludes agriculture, forestry and fish eries . 1 Subarea o f Washington, D.C. Standard Metropolitan S ta tis tica l Area. *
*Not available.NOTE: Data for the current year are preliminary.SOURCE: Cooperating State agencies listed on inside back cover.
Digitized for FRASER http://fraser.stlouisfed.org/ Federal Reserve Bank of St. Louis

9 9 ESTABLISHMENT DATASTATE AND AREA EMPLOYMENT
for States and selected areas , by industry d iv is ion.-Cont inued
(In thousands)
Transportation and public utilities Wholesale and retail trade F inance, insurance,
and real estate Services Government
Oct,1969
Sept.1969
Oct.1968
Oct.1969
Sept.1969
Oct.1968
Oct.1969
Sept.1969
Oct.1968
Oct.1969
Sept.1969
Oct.1968
Oct.1969
Sept.1969
Oct.1968
49.4 49.4 47.8 162.0 159.9 154.1 48.9 48.7 46.3 85.1 85.6 82.6 63.7 62.9 59.9 129
65.8 67.1 61.9 182.4 180.7 175.3 38.0 37.7 35.4 127.3 128.0 121.3 86.2 84.5 81.4
J
45
11.3 11.2 10.9 62.4 62.2 61.1 15.2 15.2 15.2 43.1 43.3 42.3 71.8 71.5 70.9078 Q
23.3 23.8 22.6 79.1 80.6 75.9 14.4 14.5 13.5 54.2 53.8 51.8 98.3 97.0 98.9
7
1015.4 15.8 14.8 49.4 50.1 47.7 10.5 10.5 10.2 29.5 30.7 28.0 35.5 35.2 34.0 11
7.9 7.9 7.6 27.9 27.5 26.4 5.3 5.2 5.1 26.3 26.3 24.7 24.9 24.8 24.1 121.8 1.8 1.7 7.9 7.6 7.5 - - - 7.0 7.1 6.4 - - - 13
.9 .9 .8 2.0 2.0 2.0 - - - 1.6 1.6 1.6 - - - 14
96.5 97.2 94.2 293.1 290.5 283.4 65.6 65.7 62.1 207.2 207.5 200.8 296.5 293.3 288.2 152.5 2.5 2.4 8.3 8.3 7.9 1.9 1.9 1.8 5.9 5.9 6.0 5.7 5.7 5.4 164.5 4.5 4.2 16.6 16.6 14.9 2.9 2.9 2.7 11.8 11.8 10.7 28.8 28.9 28.7 17
16.2 16.3 15.8 46.4 46.1 45.0 8.7 8.8 8.5 27.8 28.2 27.3 61.7 61.3 62.2 1819.5 19.7 18.8 56.2 56.0 54.3 14.1 14.1 13.2 44.0 43.9 42.1 79.9 79.9 78.3 1918.3 18.5 18.1 51.7 51.4 49.9 17.8 17.9 17.2 32.4 32.5 31.7 40.7 39.9 39.5 2010.5 10.6 10.2 19.2 19.0 17.7 3.9 3.9 3.8 12.4 12.4 12.2 10.0 9.9 9.4 21
74.4 75.5 72.7 256.0 256.8 242.8 58.9 59.3 56.1 169.4 172.2 162.6 241.9 236.3 233.5 2240.9 41.0 40.0 125.2 125.6- 119.3 36.2 36.4 34.1 84.8 85.3 78.8 90.6 87.9 87.3 23
7.6 7.7 7.3 23.6 23.7 23.2 5.1 5.1 4.9 18.5 18.3 17.8 17.4 16.1 16.8 246.9 7.0 6.6 24.8 25.3 23.5 6.0 6.2 5.8 18.6 18.9 17.5 26.2 26.1 26.2 25
41.4 41.9 41.3 91.6 91.5 91.4 15.1 15.2 14.8 62.8 63.1 63.1 96.1 95.9 95.5 269.0 9.0 8.8 18.8 18.4 18.3 4.0 4.0 3.8 11.7 11.6 11.5 13.5 13.6 13.8 278.2 8.2 8.1 17.1 17.0 17.2 2.7 2.7 2.7 10.1 10.2 10.0 12.0 12.0 12.2 283.5 3.5 3.5 12.6 12.6 12.3 2.2 2.2 2.1 8.6 8.6 8.7 6.8 6.7 6.5 29
81.6 81.3 79.1 326.7 323.0 313.9 60.3 60.0 57.0 218.4 219.9 210.3 259.3 254.3 250.3 304.5 4.4 4.3 13.4 13.2 12.7 1.3 1.3 1.3 8.0 8.1 7.8 6.8 6.6 6.6 311.4 1.4 1.4 6.2 6.0 5.8 .7 .7 .7 4.7 4.7 4.7 4.5 4.4 4.1 322.4 2.3 2.2 7.0 6.9 6.8 .6 .6 .6 5.8 5.9 5.6 4.6 4.2 4.4 334.9 4.9 4.9 23.5 23.1 22.6 6.5 6.5 6.1 16.9 16.8 16.1 44.2 43.6 43.8 34
31.8 31.6 30.7 121.2 118.9 116.9 28.3 28.1 26.9 83.7 83.6 81.8 72.5 71.9 70.0 352.3 2.3 2.3 9.6 9.5 9.5 1.5 1.5 1.3 7.7 7.6 7.4 7.0 6.8 6.7 36
11.1 11.4 10.7 24.6 25.5 22.3 3.6 3.6 3.5 15.0 17.0 13.4 28.2 27.9 29.4 371.5 1.5 1.6 4.6 4.5 4.6 .9 .9 .8 2.5 2.5 2.4 3.6 3.7 3.6 382.5 2.5 2.6 4.0 4.0 4.1 1.0 1.0 1.0 3.3 3.4 3.2 5.5 5.5 5.4 39
Digitized for FRASER http://fraser.stlouisfed.org/ Federal Reserve Bank of St. Louis

BIBLIOGRAPHY 01 BLSm a n p o w e r andEMPLOYMENTSTATISTICS
The U.S. Department of Labor announces a new publication designed to help research workers and writers locate publications in the manpower and employment fields. The 30- page booklet contains approximately 350 listings of BLS periodicals, reports, bibliographies, and articles published primarily between 1963 and 1968.
Listings cover such topics as hours of work, labor force projections, employment and unemployment, labor mobility, poverty and underemployment, education, and occupational outlook.
Copies of the publication, MANPOWER AND EMPLOYMENT STATISTICS PUBLICATIONS OF THE BUREAU OF LABOR STATISTICS— A SELECTED BIBLIOGRAPHY, are free while supply lasts from the U.S. Department of Labor, Bureau of Labor Statistics, Washington, D.C. 20212.
Please send me________ copies of MANPOWER AND EMPLOYMENT STATISTICS PUBLICATIONSOF THE BUREAU OF LABOR STATISTICS--A SELECTED BIBLIOGRAPHY.
N a m e ____________________________________________________________________________
Address--------------------------------------------------------------------------------- --------------------------------------------
City, State, Zip Code__________________________________________________ —........ ..................
Digitized for FRASER http://fraser.stlouisfed.org/ Federal Reserve Bank of St. Louis

101 ESTABLISHMENT DATAHISTORICAL HOURS AND EARNINGS
C-1: Gross hours an d ea rn ing s of p r o d u c t io n or no ns upe rv isory w o r k e r s 1on p r iv a te n o n a g r ic u l t u r a l p a y ro l ls , 19 47 to d a te
Y e a r a n d m onth
A v e r a g ew e e k ly
e a r n in g s
A v e r a g ew e e k lyh o u rs
A v e r a g eh ou r ly
e a r n in g s
A v e r a g ew e e k ly
e a r n in g s
A v e r a g ew e e k lyh ou rs
A v e r a g eh o u r ly
e a r n in g s
A v e r a g ew e e k ly
e a r n in g s
A v e r a g ew e e k lyh o u rs
A v e r a g eh ou rly
e a r n in g s
A v e r a g ew e e k ly
e a r n in g s
A v e r a g ew e e k lyh o u rs
A v e r a g eh ou r ly
e a r n in g s
T o t a l p r iv a te * M a n u fa c tu r in g D u ra b le g o o d s N o n d u ra b le g o o d s
191*7. $45.58 40.3 $1,131 $49.17 40.4 $1,217 $51.76 40.5 $1,278 $46.03 40.2 $1,1451948. 49.00 40.0 1.225 53.12 40.0 1.328 56.36 40.4 1.395 49.50 39.6 I.2 5 019U9. 50.24 39 .1* 1.275 53.88 39.1 1.378 57.25 39.4 1.453 50.38 38.9 1.2951950. 53.13 39.8 1.335 58.32 40.5 1.440 62.43 41.1 1.519 53.40 39.7 1.3471951. 57.86 39.9 1.45 6 3 .31* 40.6 1.56 68.48 41.5 1.65 56.88 39.5 1.441952. 60.65 39.9 1 .52 67.16 40.7 1.65 72.63 41.5 1.75 59.95 39.7 1.511953. 63.76 39.6 1 .6 l 70.47 40.5 1.74 76.63 41.2 1 . 8 6 62.57 39.6 1 .581951*. 64.52 39.1 1.65 70.49 39.6 1 .78 76.19 40.1 1.90 63.18 39.0 1 .621955. 67.72 39.6 1.71 75.70 40.7 1 . 8 6 82.19 41.3 1.99 66.63 39.9 1.671956. 70.71* 39.3 1.80 78.78 40.4 1.95 85.28 4 l.O 2.08 70.09 39.6 1.771957. 73.33 38.8 I .8 9 81.59 39.8 2.05 88.26 40.3 2.19 72.52 39.2 1.851950. 75.08 38.5 1.95 82.71 39.2 2 . 1 1 89.27 39.5 2.26 74.11 38.8 1.911959. 78.78 39.0 2 . 0 2 8 8 . 2 6 40.3 2.19 96.05 40.7 2.36 78.61 39.7 1 .98I9 6 0 . 80.67 38.6 2.09 69.72 39.7 2.26 97.44 40.1 2.43 80.36 39.2 2.051961. 8 2 . 6 0 38.6 2.14 92.34 39.8 2.32 100.35 40.3 2.49 82.92 39.3 2 . 1 11962. 85.91 38.7 2 . 2 2 96.56 40.4 2.39 104.70 40.9 2.56 85.93 39.6 2 .171963. 88.46 38.8 2.28 99.63 40.5 2.46 108.09 41.1 2.63 87.91 39.6 2 . 2 21964. 91.33 38.7 2.36 102.97 40.7 2.53 112.19 41.4 2.71 90.91 39.7 2.291965. 95.06 38.8 2.45 107.53 41.2 2.61 117.18 42.0 2.79 94.64 40.1 2.361966. 98.82 38.6 2.56 112.34 41.3 2 .72 122.09 42.1 2.90 98.49 40.2 2.451967. 101.84 38.0 2 . 6 8 114.90 40.6 2.83 123.60 41.2 3 . 0 0 102.03 39.7 2.571968. 107.73 37.8 2.85 122.51 40.7 3.01 132.07 41.4 3.19 109.05 39.8 2.74
1968: November.•••••• 109.50 37.5 2.92 125.97, 40.9 3 . 0 8 136.36 41 .7 3.27 H l . 7 2 39.9 2 . 8 0December............ H O .3 8 37.8 2.92 1 2 7 . 8 2 41.1 3.11 137.61 4 1 .7 3.30 1 1 3 . 0 8 40.1 2 . 8 2
1969: January.......... .. • 110.25 37.5 2.94 126.05 40.4 3 . 1 2 136.04 41.1 3.31 111.50 39.4 2 .83February............ 1 1 0 . 1 1 37.2 2.96 124.80 40.0 3.12 135.05 4 0 .8 3.31 110.48 38.9 2.84March.••••••••• 111.67 37-6 2.97 127.39 40.7 3.13 137.^5 41.4 3.32 U 3 .1 5 39.7 2.85A p ril.................. 111.75 37.5 2.98 127.58 40.5 3.15 137.20 41 .2 3.33 1 1 3 . 0 8 39.4 2.87May...................... 113.48 37.7 3 . 0 1 1 2 8 . 6 1 40.7 3.16 138.69 41.4 3.35 114.34 39.7 2 . 8 8June. .............. .. • 115*14 38.0 3.03 129.65 40.9 3.17 1 3 9 .^ 41.5 3.36 115.31 39.9 2.89July.................... 1 1 5 . 8 2 38.1 3.04 129.20 40.5 3.19 137.83 40.9 3.37 1 1 6 . 2 2 39.8 2.92August................. 116.51 38.2 3.05 129.51 40.6 3.19 139.33 41.1 3.39 116.51 39.9 2 .92September.••••• 1 1 7 . 8 0 38.0 3.10 132.84 4 l.O 3-24 143.45 41.7 3.44 1 1 8 . 0 0 40.0 2.95October............... 117.25 37.7 3 .H 1 3 2 . 2 8 40.7 3.25 142.42 41.4 3.44 117.51 39.7 2.96November.•••••• 116.63 37.5 3 .H 132.36 40.6 3.26 142.55 41.2 3.46 117.91 39.7 2 .97
Y e a r a n d m onth M in in g C o n tr a c t c o n s t r u c t io nW h o le s a le and
r e t a i l tra d eF in a n c e , in s u r a n c e
r e a l e s t a t e, an d
191*7. $59.94 40.8 $1,469 $58.87 38.2 $1,541 $38.07 40.5 $0,940 $43.21 37.9 $1,1401948., 65.56 39.4 1.664 65.27 38.1 1.713 40.80 40.4 1.010 45.48 37.9 1 . 2 0 0191*9.. 62.33 36.3 1.717 67.56 37.7 1.792 42.93 40.5 1.060 47.63 37.8 1.2601950., 67.16 37.9 1.772 69.68 37.4 I.8 6 3 44.55 40.5 1.100 50.52 37.7 1.3401951.. 74.11 38.4 1 .93 76.96 38.1 2 . 0 2 47.79 40.5 1 .18 54.67 37.7 1.451952., 77.59 38.6 2 . 0 1 8 2 . 8 6 38.9 2.13 49.20 40.0 1 .23 57.08 37.8 1.511 9 5 3 - 83.03 38.8 2.14 86.41 37.9 2.28 51.35 39.5 1.30 59.57 37.7 1.581951*.. 82.60 38.6 2.14 88.91 37.2 2.39 53.33 39.5 1.35 62.04 37.6 1.651955.. 89.54 40.7 2 . 2 0 90.90 37-1 2.45 55.16 39.4 1.40 63.92 37.6 1 .701956.. 95.06 40.8 2.33 96.38 37.5 2.57 57.48 39.1 1 .47 65.68 36.9 1 .781957 .. 98.65 4 o .l 2 .46 100.27 37.0 2.71 59.60 38.7 ' 1 .54 67.53 36.7 1.841958.. 96.08 38.9 2.47 103.78 36.8 2 . 8 2 61.76 38.6 1 .60 70.12 37.1 1 .891959 .. 103.68 40.5 2.56 108.41 37.0 2.93 64.41 38.8 1 . 6 6 72.74 37.3 1.95i9 6 0 .. 105.44 4o.4 2.61 113.04 36.7 3 . 0 8 66.01 38.6 1.71 75.14 37.2 2 . 0 21 961 .. 106.92 40.5 2.64 1 1 8 . 0 8 36.9 3 . 2 0 67.41 38.3 1 .76 77.12 36.9 2.091 962 .. 110.43 40.9 2.70 122.47 37.0 3.31 69.91 38.2 1 .83 80.94 37.3 2.171963. • 114.40 41.6 2.75 127.19 37.3 3.41 72.01 38.1 1 .89 84.38 37.5 2.251964’. • 117.74 41.9 2 . 8 1 132.06 37.2 3.55 74.28 37.9 1.96 85.79 37.3 2.301 965 .. 123.52 42.3 2.92 138.38 37.4 3.70 76.53 37.7 2.03 88.91 37.2 2.391 96 6 .. 130.24 42.7 3.C5 146.26 37.6 3.89 79.02 37.1 2 .13 92.13 37.3 2.471967 .. 135.89 42.6 3.19 154.95 37.7 4.11 81.76 36.5 2.24 95.46 37.0 2.581968.• 143.05 42.7 3.35 164.56 37.4 4.40 86.40 36.0 2.40 IO I.7 5 37.0 2.751968: November.......... .. 148.52 42.8 3.^7 159.35 35.1 4 .54 87.33 35.5 2.46 IO 3.69 36.9 2 . 8 1
December............. 1 5 1 . 1 2 43.3 3.49 1 6 8 . 8 1 37.1 4.55 87.96 35.9 2.45 104.99 37.1 2.83
1969: January............... 150.15 42.9 3.50 168.09 36.7 4 .58 88.40 35.5 2.49 " IO 6.76 37.2 2.87February............ 149.60 42.5 3.52 1 6 6 . 9 0 36.6 4 .56 88.60 35.3 2.51 107.59 37.1 2.90March................. 148.54 42.2 3.52 171.86 37.2 4 .62 88.85 35.4 2.51 107.22 37.1 2.89A p ril.................. 154.78 43.6 3.55 174.46 37.6 4 .64 88.96 35.3 2 . 5 2 106.85 37.1 2 . 8 8May...................... 155.30 43.5 3.57 179.92 38.2 4 .71 89.92 35.4 2 .54 107.30 37.0 2.90June.................... 150.88 42.5 3.55 181.34 38.5 4 .71 91.55 35.9 2.55 IO 8.70 37.1 2 .93July.................... 154.30 43.1 3.58 183.91 38.8 4 .74 93.08 36.5 2.55 107.96 37.1 2.91August............... 1 5 6 . 8 8 43.7 3.59 187.77 39.2 4 .79 93.70 36.6 2 .56 108.04 37.0 2.92September.••••• 157.91 43.5 3.63 192.96 39.3 4.91 92.46 35.7 2.59 108.41 37.0 2.93October.............. 159.71 43.4 3 . 6 8 189.20 38.3 4.94 92.13 35.3 2.61 109.45 37.1 2.95November............. 159.71 43.4 3 . 6 8 182.78 37.0 4.94 91.96 35.1 2.62 111.15 37.3 2 .98
*For coverage of series, see footnote 1, table B-2.HOTE: Data include Alaska and Hawaii beginning 1959. Data for the 2 most recent months are preliminary.
Digitized for FRASER http://fraser.stlouisfed.org/ Federal Reserve Bank of St. Louis

ESTABLISHMENT DATAHOURS AND EARNINGS
102
C-2: Gross hours and earn ings of production or nonsupervisory w o rk e rs 1on p r iva te no nagricultura l payro lls , by industry *
S ICC o d e
In du stry
A vera g e w e e k ly e a r n in g s A v e r a g e h ou r ly e a r n in g s
N o v 1 QAQ
O c t1 9 6 9
S e p t1 9 6 9
N o v .1 9 6 8
O c t .1 9 6 8
N o v .1 9 6 9
O c t .1 9 6 9
S e p t .1 9 6 9
N o v .1 9 6 8
O c t .1 9 6 8
- T O T A L P R I V A T E ........................................... $ 1 1 6 . 6 3 $ 1 1 7 . 2 5 $ 1 1 7 . 8 0 $ 1 0 9 . 5 0 $ 1 1 0 . 2 9 $ 3 . 11 $ 3 . 1 1 $ 3 . 1 0 $ 2 . 9 2 $ 2 . 9 1
_ M I N I N G ................................................................... 1 5 9 . 71 1 5 9 . 7 1 1 5 7 . 9 1 1 4 8 . 5 2 1 3 8 . 8 6 3 . 6 8 3 . 6 8 3 . 6 3 3 . 4 7 3 . 3 310 M E T A L M I N I N G ................................................................... - 1 6 2 . 2 6 1 6 0 . 7 0 1 4 9 . 8 0 1 5 1 . 9 9 - 3 . 7 3 3 . 7 2 3 . 5 0 3 . 4 7101 Iron o r e s ..................................................................... - 1 5 9 . 3 3 1 6 0 . 0 6 1 4 3 . 6 8 1 4 5 . 0 8 - 3 . 8 3 3 . 8 2 3 . 6 1 3 . 6 0102 C o p p e r o r e s ............................................................ - 1 7 2 . 2 4 1 7 1 . 0 3 1 6 0 . 4 0 1 6 4 . 6 4 - 3 . 7 2 3 . 7 1 3 . 4 2 3 . 4 311,12 C O A L M I N I N G ...................................................................... - 1 7 4 . 1 0 1 6 6 . 8 3 1 6 5 . 6 5 1 1 0 . 7 8 - 4 . 3 2 4 . 1 5 4 . 0 9 3 . 7 312 B itu m in o u s c o a l an d l i g n it e m in in g . . . . ~ 1 7 6 . 5 8 1 6 9 . 2 9 1 6 7 . 6 8 1 0 9 . 9 1 ~ 4 . 3 6 4 . 1 8 4 . 1 3 3 . 7 913 O I L A N D G A S E X T R A C T I O N ............................. - 1 5 1 . 1 1 1 5 0 . 7 7 1 4 3 . 0 1 1 4 1 . 8 1 - 3 . 4 5 3 . 4 5 3 . 2 8 3 . 2 6131,2 C ru d e p e tro le u m an d n a tu ra l g a s f i e l d s . - 1 4 5 . 8 4 1 4 7 . 8 3 1 3 8 . 0 4 1 3 6 . 2 1 - 3 . 6 1 3 . 6 5 3 . 4 0 3 . 3 8138 O il a n d g a s f ie l d s e r v i c e s ............................ - 1 5 4 . 2 2 1 5 2 . 9 7 1 4 6 . 3 8 1 4 5 . 7 8 - 3 . 3 6 3 . 3 4 3 . 2 1 3 . 1 914 N C N M E T A L L IC M IN E R A L S , E X C E P T F U E L S - 1 5 7 . 6 4 1 5 9 . 0 6 1 3 7 . 2 8 1 4 5 . 0 7 - 3 . 3 9 3 . 3 7 3 . 1 2 3 . 1 4142 C r u s h e d and b r o k e n s t o n e ............................ - 1 6 1 . 8 1 1 6 6 . 3 0 1 3 5 . 4 4 1 4 5 . 6 2 - 3 . 3 5 3 . 3 8 3 . 0 3 3 . 0 4
_ CONTRACT CONSTRUCTION.............. 1 8 2 . 7 8 1 8 9 . 2 0 1 9 2 . 9 6 1 5 9 . 3 5 1 7 3 . 5 7 4 . 9 4 4 . 9 4 4 . 9 1 4 . 5 3 4 . 5 215 G E N E R A L B U I L D I N G C O N T R A C T O R S . - 1 7 4 . 8 0 1 7 5 . 5 8 1 4 9 . 3 6 1 6 0 . 8 8 - 4 . 7 5 4 . 7 2 4 . 3 8 4 . 3 616 H E A V Y C O N S T R U C T IO N C O N T R A C T O R S . - 1 9 8 . 0 5 2 0 8 . 3 0 1 5 4 . 2 9 1 7 8 . 5 1 - 4 . 6 6 4 . 6 6 4 . 1 7 4 . 2 2161 H ig h w a y a n d s t r e e t c o n s t r u c t i o n .............. - 1 8 5 . 2 2 2 0 0 . 6 8 1 4 2 . 9 2 1 7 7 . 9 4 - 4 . 4 1 4 . 4 3 3 . 9 7 4 . 1 0162 H e a v y c o n s t r u c t i o n , - n e c ............................... - 2 0 8 . 9 2 2 1 5 . 2 5 1 6 4 . 4 9 1 7 9 . 2 4 - 4 . 8 7 4 . 8 7 4 . 3 4 4 . 3 417 S P E C I A L T R A D E C O N T R A C T O R S ............. - 1 9 4 . 1 8 1 9 5 . 9 4 1 6 7 . 7 4 1 7 9 . 7 3 - 5 . 2 2 5 . 1 7 4 . 8 2 4 . 7 8171 P lu m b in g , h e a t in g , a ir c o n d it< 6 n : n g . . . - 2 0 7 . 5 8 2 0 7 . 7 6 1 8 3 . 5 2 1 9 1 . 8 8 - 5 . 3 5 5 . 3 0 4 . 9 2 4 . 9 2172 P a in t in g , p a p e r h a n g in g , d e c o r a t i n g . . . - 1 7 5 . 3 7 1 8 0 . 5 6 1 5 6 . 6 2 1 6 4 . 1 6 - 4 . 9 4 4 . 9 2 4 . 6 2 4 . 5 6173 E le c t r i c a l w o r k .................................................... - 2 3 2 . 4 7 2 3 1 . 2 6 1 9 9 . 8 1 2 1 0 . 2 7 - 5 . 7 4 5 . 7 1 5 . 3 0 5 . 2 7174 M a s o n ry , s t o n e w o r k , an d p la s te r in g . . . - 1 7 6 . 4 6 1 7 8 . 9 2 1 4 6 . 3 2 1 6 4 . 3 7 - 5 . 1 0 5 . 0 4 4 . 6 6 4 . 6 3176 R o o f in g and s h e e tm e ta l w o r k ...................... - 1 6 2 . 1 5 1 6 3 . 3 0 1 3 0 . 5 1 1 4 8 . 9 7 - 4 . 7 0 4 . 6 0 4 . 2 1 4 . 2 2
- MANUFACTURING 1 3 2 . 3 6 1 3 2 . 2 8 1 3 2 . 8 4 1 2 5 . 9 7 1 2 5 . 7 7 3 . 2 6 3 . 2 5 3 . 2 4 3 . 0 8 3 . 0 6
19,24,25,32-39
DURABLE GOODS............................................ 1 4 2 . 5 5 1 4 2 . 4 2 1 4 3 . 4 5 1 3 6 . 3 6 1 3 5 . 4 3 3 . 4 6 3 . 4 4 3 . 4 4 3 . 2 7 3 . 2 4
20-23,26-31 NONDURABLE G O O D S ..............................
Durable Goods1 1 7 . 9 1 1 1 7 . 5 1 1 1 8 . 0 0 1 1 1 . 7 2 1 1 1 . 8 8 2 . 9 7 2 . 9 6 2 . 9 5 2 . 8 0 2 . 7 9
19 O R D N A N C E A N D A C C E S S O R IE S ............... 1 4 3 . 2 6 1 4 1 . 4 0 1 4 1 . 6 9 1 3 8 . 8 6 1 4 0 . 1 0 3 . 5 2 3 . 5 0 3 . 4 9 3 . 3 3 3 . 3 2192 A m m u n itio n , e x c e p t fo r s m a ll a rm s . . 1 3 7 . 6 0 1 3 6 . 5 7 1 3 6 . 8 0 1 3 7 . 0 3 1 3 8 . 6 9 3 . 4 4 3 . 4 4 3 . 4 2 3 . 3 1 3 . 311925 C o m p le te g u id e d m i s s i l e s ...................... - 1 7 0 . 5 3 1 7 1 . 7 8 1 6 1 . 7 0 1 6 0 . 0 9 - 4 . 0 7 4 . 0 9 3 . 8 5 3 . 8 3
1929 A m m u n itio n , e x c . f o r s m a ll a rm s , n e c ~ 1 1 8 . 5 8 1 1 8 . 2 6 1 2 2 . 8 9 1 2 4 . 3 2 3 . 0 8 3 . 0 4 2 . 9 9 2 . 9 6
24 L U M B E R A N D W O O D P R O D U C T S .............. 1 1 3 . 8 8 1 1 3 . 6 5 1 1 4 . 3 3 1 0 5 . 7 3 1 0 7 . 6 8 2 . 8 4 2 . 8 2 2 . 8 3 2 . 6 3 2 . 6 2242 S a w m ills and p la n in g m i l l s ...................... 1 0 8 . 9 3 1 0 9 . 2 1 1 0 9 . 8 9 1 0 1 . 4 5 1 0 4 . 3 3 2 . 7 3 2 . 7 1 2 . 7 2 2 . . 5 3 2 . 5 22421 S a w m ills a n d p la n in g m i l l s , g e n e r a l . - 1 1 2 . 9 6 1 1 3 . 5 2 1 0 4 . 5 4 1 0 7 . 3 8 - 2 . 8 1 2 . 8 1 2 . 6 2 2 . 6 0243 M illw o rk , p ly w o o d & r e la te d p r o d u c ts . 1 1 8 . 9 0 1 1 9 . 8 0 1 2 0 . 2 9 1 1 5 . 5 1 1 1 5 . 0 9 2 . 9 8 2 . 9 8 2 . 9 7 2 . 7 9 2 . 7 82431 M i l l w o r k .............................................................. — 1 1 7 . 4 1 1 1 6 . 1 3 1 1 1 . 0 8 1 1 0 . 1 5 - 2 . 9 8 2 . 9 4 2 . 7 7 2 . 7 42432 V e n e e r a n d p l y w o o d ................................. - 1 2 0 . 4 2 1 2 1 . 8 4 1 1 9 . 9 7 1 1 8 . 0 0 - 2 . 9 3 2 . 9 5 2 . 7 9 2 . 7 7244 W ood en c o n t a i n e r s ............................................ 9 1 . 4 9 9 2 . 2 7 9 1 . 1 8 8 7 . 0 7 8 9 . 8 7 2 . 3 4 2 . 3 3 2 . 3 2 2 . 2 1 2 . 2 32441,2 W ood en b o x e s , s h o o k , and c r a t e s . . - 9 0 . 5 7 9 1 . 1 4 8 4 . 1 4 8 7 . 6 7 - 2 . 2 7 2 . 2 9 2 . 1 3 2 . 1 7249 M is c e l la n e o u s w o o d p r o d u c t s ................... 1 0 1 . 4 0 1 0 2 . 0 9 1 0 1 . 5 0 9 4 . 8 3 9 5 . 1 7 2 . 5 1 2 . 4 9 2 . 5 0 2 . 3 3 2 . 3 1
25 F U R N IT U R E A N D F I X T U R E S .......................... 1 0 8 . 1 4 1 0 8 . 8 1 1 0 9 . 0 8 1 0 3 . 4 8 1 0 4 . 5 8 2 . 6 9 2 . 6 8 2 . 6 8 2 . 5 3 2 . 5 2251 H o u s e h o ld f u r n i t u r e ......................................... ( * ) 1 0 2 . 2 1 1 0 2 . 2 1 9 7 . 9 2 9 9 . 3 6 ( * ) 2 . 5 3 2 . 5 3 2 . 4 0 2 . 4 02511 W ood h o u s e h o ld fu r n itu r e ......................... 9 7 . 8 2 9 7 . 8 2 9 3 . 1 5 9 3 . 8 6 2 . 3 8 2 . 3 8 2 . 2 5 2 . 2 42512 U p h o ls te r e d h o u s e h o ld fu r n itu r e . . . . - 1 0 7 . 3 2 1 0 6 . 7 7 1 0 6 . 0 8 1 0 6 . 8 1 - 2 . 7 1 2 . 7 1 2 . 6 0 2 . 5 82515 M a ttr e s s e s a n d b e d s p r i n g s ................... - 1 0 7 . 5 3 1 1 0 . 2 5 1 0 4 . 0 2 1 0 5 . 3 2 - 2 . 7 5 2 . 7 7 2 . 6 4 2 . 6 2252 O f f i c e fu r n it u r e .................................................... - 1 2 6 . 9 6 1 2 7 . 6 7 1 1 7 . 8 8 1 2 0 . 7 0 3 . 0 3 2 . 9 9 2 . 8 2 2 . 8 2254 P a r t it io n s an d f ix t u r e s ............................... - 1 3 3 . 8 2 1 3 7 . 4 5 1 2 4 . 0 9 1 2 5 . 8 7 - 3 . 2 8 3 . 3 2 3 . 11 3 . 0 7253,9 O th e r fu rn itu re a n d f i x t u r e s ...................... 1 1 6 . 9 7 1 1 5 . 8 3 1 1 6 . 0 0 1 1 0 . 8 3 1 1 2 . 5 9 2 . 8 6 2 . 8 6 2 . 8 5 2 . 6 9 2 . 7 0
32 S T O N E , C L A Y , A N D G L A S S P R O D U C T S . . 1 3 6 . 3 6 1 3 7 . 5 7 1 3 8 . 4 5 1 2 7 . 4 9 1 2 9 . 9 3 3 . 2 7 3 . 2 6 3 . 2 5 3 . 0 5 3 . 0 5321 F la t g l a s s ............................................................... 1 7 8 . 4 3 1 7 5 . 0 9 1 6 3 . 8 8 1 6 9 . 8 9 — 4 . 1 4 4 . 11 3 . 8 2 3 . 8 7322 G la s s a n d g la s s w a r e , p r e s s e d o r b lo w n 1 3 3 . 9 8 1 3 3 . 5 7 1 3 2 . 7 6 1 2 8 . 4 4 1 2 7 . 5 1 3 . 3 0 3 . 2 9 3 . 2 7 3 . 11 3 . 113221 G la s s c o n t a in e r s ......................................... 1 3 7 . 2 3 1 3 7 . 2 3 1 3 2 . 6 6 1 3 2 . 4 3 3 . 3 8 3 . 3 8 3 . 2 2 3 . 2 33229 P r e s s e d a n d b lo w n g l a s s , n e c ............ - 1 2 8 . 3 9 1 2 6 . 6 7 1 2 2 . 5 4 1 2 0 . 8 3 - 3 . 1 7 3 . 1 2 2 . 9 6 2 . 9 4324 C e m e n t , h y d r a u l i c ............................................ 1 6 6 . 3 0 1 6 6 . 3 4 1 6 3 . 3 1 1 5 2 . 5 8 1 4 8 . 4 5 3 . 9 5 3 . 9 7 3 . 8 7 3 . 5 9 3 . 5 6325 S tru ctu ra l c la y p r o d u c t s .............................. 1 1 1 . 5 2 1 1 1 . 2 4 1 1 2 . 2 0 1 0 4 . 9 0 1 0 6 . 5 5 2 . 7 4 2 . 7 4 2 . 7 3 2 . 5 9 2 . 5 83251 B r ic k an d s tr u c tu ra l c la y t i l e ............... - 1 0 6 . 7 1 1 0 6 . 9 1 9 9 . 5 5 1 0 2 . 2 4 2 . 5 9 2 . 5 7 2 . 4 4 2 . 4 4326327
P o t te r y an d r e la t e d p r o d u c t s ...................C o n c r e t e , g y p s u m , a n d p la s t e r
1 1 6 . 1 1 1 1 5 . 6 3 1 1 1 . 8 8 1 1 0 . 2 5 2 . 9 1 2 . 9 2 2 . 7 9 2 . 7 7
328,9p r o d u c t s ...............................................................
O th e r s t o n e and n o n m e t a ll ic m in e ra l1 4 0 . 3 8 1 4 7 . 1 9 1 4 8 . 6 2 1 3 1 . 1 5 1 3 8 . 4 6 3 . 2 8 3 . 3 3 3 . 3 1 3 . 0 5 3 . 0 7
p r o d u c t s ................................................................ 1 3 6 . 9 5 1 3 5 . 9 4 1 3 6 . 8 3 1 2 8 . 5 4 1 2 8 . 7 4 3 . 3 0 3 . 2 6 3 . 2 5 3 . 0 9 3 . 0 83291
S e e foo tn c
A b r a s iv e p r o d u c t s .......................................
>tes at e n d o f t a b le . N O T E : D a ta fo r th e 2 m o s t r e c e n t
1 2 9 . 8 1
m on th s a re
1 3 0 . 6 1p re lim in a r y .
1 2 7 . 2 8 1 2 4 . 4 3 3 . 3 2 3 . 2 9 3 . 1 9 3 . 1 5
Digitized for FRASER http://fraser.stlouisfed.org/ Federal Reserve Bank of St. Louis
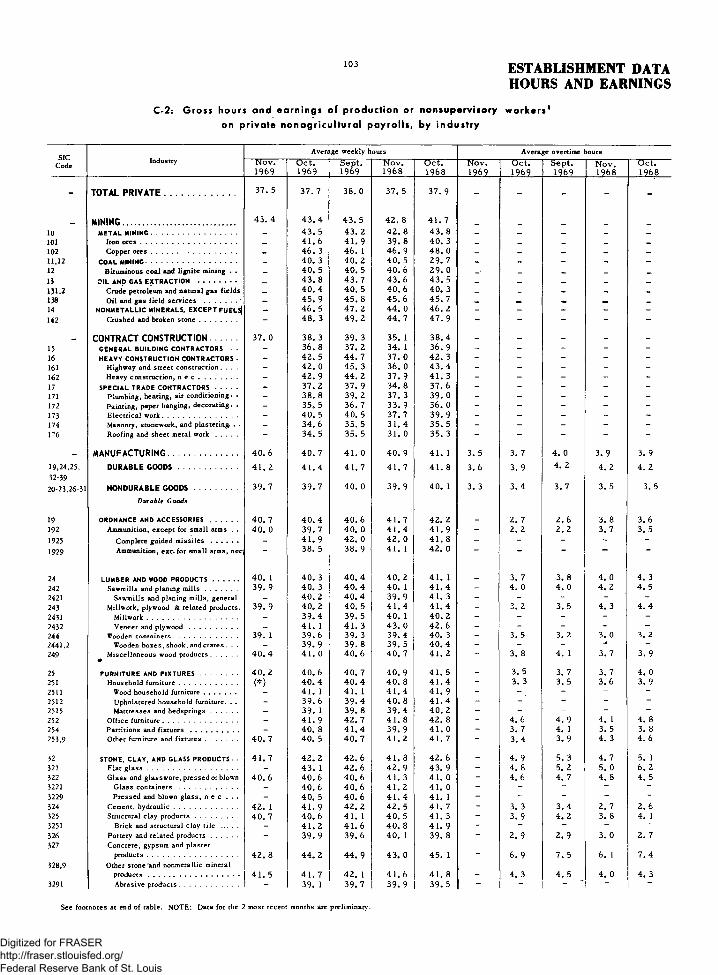
10 3 ESTABLISHMENT DATAHOURS AND EARNINGS
C-2: Gross hours an d earn ings of production or nonsupervisory w o rk e rs 1on p r iva te n o n a g r icu ltu ra i payro l ls , by indus try
S IC In d u stryA v e r a g e w e e k ly h o u rs A v e r a g e o v e r t im e h ou rs
C o d e N o v .1969
O c t .1969
Se pt.1969
N o v .1968
O c t .1968
N o v .1969
O ct .1969
Sept.1969
N o v .1968
O c t . ------1968
- TO TAL P R IV A T E ................................... 37 . 5 37. 7 38. 0 37. 5 37. 9 - - - - -
M IN IN G ........................................................ 43. 4 4 3 . 4 4 3 . 5 4 2 . 8 4 1 . 7
10 METAL MINING................................................ _ 4 3 . 5 4 3 . 2 4 2 . 8 4 3 . 8 _ _ _ _ _
101 Iron o r e s .................................................................. _ 4 1 . 6 4 1 . 9 39. 8 4 0 . 3 _ _ _ _102 C o p p e r o r e s .......................................................... _ 4 6 . 3 46 . 1 4 6 . 9 4 8 . 0 _ _ _ _ _
11,12 COAL MINING.................................................. - 4 0 . 3 40 . 2 40 . 5 29 . 7 - - - - -
12 B itu m in o u s c o a l an d l i g n it e m in in g . . _ 4 0 . 5 40 . 5 4 0 . 6 29. 0 _■ _ _ _
13 OIL AND GAS EXTRACTION ................... _ 4 3 . 8 4 3 . 7 4 3 . 6 4 3 . 5 _ _ _ _ _
1 3 1 ,2 C ru d e p e tr o le u m an d n a tu ra l g a s f i e l d s _ 4 0 . 4 40 . 5 4 0 . 6 4 0 . 3 _ _ _ _ _
138 O i l a n d g a s f ie ld s e r v i c e s ...................... _ 4 5 . 9 4 5 . 8 4 5 . 6 4 5 . 7 __ _14 NONMETALLIC MINERALS, EXCEPT FUELSj - 4 6 . 5 4 7 . 2 4 4 . 0 4 6 . 2 - - - - -
142 C r u s h e d an d b r o k e n s t o n e .......................... - 4 8 . 3 49 . 2 4 4 . 7 4 7 . 9 - - - - -
_ CONTRACT CONSTRUCTION 37. 0 38. 3 39. 3 35. 1 3 8 . 4 - - - - -
15 GENERAL BUILDING CONTRACTORS - 36. 8 37. 2 34. 1 36. 9 - - - - -
16 HEAVY CONSTRUCTION CONTRACTORS • - 42 . 5 44 . 7 37. 0 4 2 . 3 - - - - -
161 H ig h w a y a n d s t r e e t c o n s t r u c t i o n . . . . - 4 2 . 0 4 5 . 3 36. 0 4 3 . 4 - - - - -
162 H e a v y c o n s t r u c t i o n , n e c ........................... - 4 2 . 9 44 . 2 37. 9 4 1 . 3 - - - - -
17 SPECIAL TRADE CONTRACTORS............ - 37. 2 37. 9 34. 8 37. 6 - - - - -
171 P lu m b in g , h e a t in g , a ir c o n d i t i o n i n g . . - 38. 8 39. 2 37. 3 39 . 0 - - - - -
172 P a in t in g , p a p e r h a n g in g , d e c o r a t in g . . - 35. 5 36 . 7 33. 9 36 . 0 - - - - -
173 E le c t r i c a l w o r k ................................................... - 4 0 . 5 4 0 . 5 37. 7 3 9 . 9 - - - - -
174 M a s o n ry , s t o n e w o r k , a n d p la s t e r in g . . - 34. 6 35. 5 31. 4 3 5 . 5 - - - - -
1 76 R o o f in g an d s h e e t m e ta l w o r k ............... - 34. 5 35. 5 31. 0 35 . 3 - - - - -
- MANUFACTURING ................................................ 40 . 6 4 0 . 7 4 1 . 0 40 . 9 4 1 . 1 3. 5 3. 7 4 . 0 3 . 9 3 . 9
1 9 ,2 4 ,2 5 , DURABLE G O O D S ........................................ 4 1 . 2 4 1 . 4 4 1 . 7 4 1 . 7 4 1 . 8 3 . 6 3. 9 4. 2 4 . 2 4 . 23 2 -3 9
2 0 -2 3 ,2 6 -3 1 NONDURABLE G O O D S ............................. 39. 7 39. 7 4 0 . 0 39. 9 4 0 . 1 3. 3 3 . 4 3. 7 3. 5 3. 5
19
Durable GoodsORDNANCE AND ACCESSORIES ................... 4 0 . 7 4 0 . 4 4 0 . 6 41 . 7 4 2 . 2 2. 7 2 . 6 3. 8 3 . 6
192 A m m u n ition , e x c e p t fo r s m a ll arm s . . 40 . 0 39. 7 4 0 . 0 4 1 . 4 4 1 . 9 - 2. 2 2. 2 3. 7 3. 51925 C o m p le te g u id e d m i s s i l e s ................... - 4 1 . 9 4 2 . 0 4 2 . 0 4 1 . 8 - - - - -
1 9 2 9 A m m u n ition , e x c . fo r s m a ll a rm s , n e c j 38. 5 38 . 9 4 1 . 1 4 2 . 0 ~ ~ — —
24 LUMBER AND WOOD PRODUCTS .................. 40 . 1 4 0 . 3 4 0 . 4 40 . 2 4 1 . 1 _ 3. 7 3. 8 4. 0 4 . 3242 S a w m ills an d p la n in g m i l l s ...................... 39. 9 4 0 . 3 4 0 . 4 40 . 1 4 1 . 4 - 4 . 0 4 . 0 4. 2 4 . 52421 S a w m ills and p la n in g m i l l s , g e n e r a l - 4 0 . 2 40. 4 3 9 . 9 4 1 . 3 - - - - -
243 M illw o r k , p ly w o o d & r e la te d p r o d u c ts . 3 9 . 9 4 0 . 2 4 0 . 5 4 1 . 4 4 1 . 4 - 3. 2 3. 5 4. 3 4 . 42431 M i l lw o r k .............................................................. - 3 9 . 4 39 . 5 4 0 . 1 4 0 . 2 - - - - -
2 4 3 2 V e n e e r and p l y w o o d ................................. - 4 1 . 1 4 1 . 3 43 . 0 4 2 . 6 - - - - -
2 4 4 39. 1 39 . 6 39 . 3 39. 4 4 0 . 3 - 3. 5 3. 2 3. 0 3. 22 4 4 1 ,2 W ood en b o x e s , s h o o k , and c r a t e s . . . - 3 9 . 9 39. 8 39. 5 4 0 . 4 - - - -
2 4 9 M is c e l la n e o u s w o o d p r o d u c t s .................. 4 0 . 4 4 1 . 0 4 0 . 6 4 0 . 7 4 1 . 2 - 3. 8 4 . 1 3. 7 3 . 9
25 FURNITURE AND FIXTURES........................ 4 0 . 2 4 0 . 6 4 0 . 7 4 0 . 9 4 1 . 5 - 3. 5 3. 7 3. 7 4 . 0251 H o u s e h o ld f u r n i t u r e ........................................ ( * ) 4 0 . 4 4 0 . 4 4 0 . 8 4 1 . 4 - 3. 3 3. 5 3 . 6 3. 92511 W ood h o u s e h o ld f u r n i t u r e ...................... 4 1 . 1 4 1 . 1 4 1 . 4 4 1 . 9 - - - - -
2512 U p h o ls te r e d h o u s e h o ld fu rn itu re . . . - 3 9 . 6 3 9 . 4 4 0 . 8 4 1 . 4 - - - - -
2515 M a tt r e s s e s and b e d s p r i n g s .................. - 39. 1 39 . 8 3 9 . 4 4 0 . 2 - - - - -2 5 2 O f f i c e f u r n it u r e ................................................... - 4 1 . 9 42 . 7 4 1 . 8 4 2 . 8 - 4 . 6 4 . 9 4. 1 4. 8254 P a r t it io n s a n d f i x t u r e s ................................. - 40 . 8 4 1 . 4 39. 9 4 1 . 0 - 3. 7 4. 1 3. 5 3. 82 5 3 ,9 O th er fu rn itu re an d f i x t u r e s ...................... 4 0 . 7 40 . 5 4 0 . 7 4 1 . 2 4 1 . 7 - 3 . 4 3 . 9 4 . 3 4 . 6
32 STONE, CLAY, AND GLASS PRODUCTS - - 4 1 . 7 4 2 . 2 4 2 . 6 4 1 . 8 4 2 . 6 - 4 . 9 5. 3 4 . 7 5. 1321 F la t g l a s s .............................................................. - 4 3 . 1 4 2 . 6 42 . 9 4 3 . 9 - 4 . 8 5. 2 5. 0 6. 2322 G la s s a n d g la s s w a r e , p r e s s e d o r b lo w n 4 0 . 6 4 0 . 6 4 0 . 6 4 1 . 3 4 1 . 0 - 4 . 6 4. 7 4. 8 4 . 53221 G la s s c o n t a i n e r s ........................................ - 4 0 . 6 4 0 . 6 4 1 . 2 41 . 0 - - - - -
3 2 2 9 P r e s s e d and b lo w n g l a s s , n e c . . . - 40 . 5 4 0 . 6 4 1 . 4 4 1 . 1 - - - - -
3 24 C e m e n t , h y d r a u l i c ............................................ 4 2 . 1 4 1 . 9 4 2 . 2 42 . 5 4 1 . 7 - 3 . 3 3 . 4 2. 7 2. 6325 S tru ctu ra l c la y p r o d u c t s ............................. 4 0 . 7 4 0 . 6 4 1 . 1 4 0 . 5 4 1 . 3 - 3 . 9 4 . 2 3. 8 4. 13251 B r ic k an d s tr u c tu ra l c la y t i l e ........... - 4 1 . 2 4 1 . 6 4 0 . 8 4 1 . 9 - - - - -
326 P o t te r y a n d r e la te d p r o d u c t s .................. - 3 9 . 9 3 9 . 6 4 0 . 1 39. 8 - 2 . 9 2 . 9 3. 0 2. 7327 C o n c r e t e , g y p s u m a n d p la s t e r
p r o d u c ts .............................................................. 4 2 . 8 4 4 . 2 4 4 . 9 4 3 . 0 4 5 . 1 - 6. 9 7. 5 6. 1 7 . 43 2 8 ,9 O th er s t o n e 'a n d n o n m e ta ll ic m in era l
p r o d u c t s .............................................................. 4 1 . 5 4 1 . 7 4 2 . 1 4 1 . 6 4 1 . 8 _ 4. 3 4 . 5 4 . 0 4. 33291 A b r a s iv e p r o d u c t s ........................................ - 39. 1 3 9 . 7 3 9 . 9 39 . 5 - - 1 " ' 1 1
See footnotes at end of table. NOTE: Data for the 2 most recent months are preliminary.
Digitized for FRASER http://fraser.stlouisfed.org/ Federal Reserve Bank of St. Louis
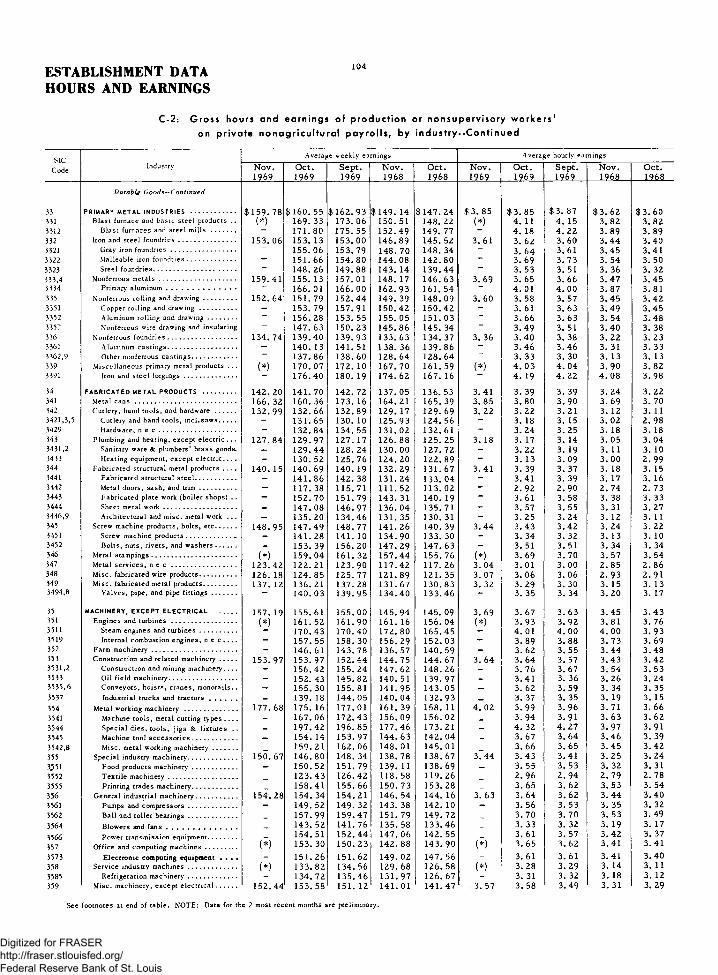
ESTABLISHMENT DATAHOURS AND EARNINGS
1 0 4
C-2: Gross hours and earnings of production or nonsupervisory w o rkers 'on p r iva te n o na gr icu ltu ra i payro l ls , by in dus try --C o ntinued
SICAverage w eekly earnings A verage hourly earnings
C ode Industry N o v .1969
O c t .1969
Sept.1969
N o v .1968
O ct .1968
N o v .1969
O c t .1969
Sept.1969
N o v .1968
O c t .196 8
33
Durably G ood s—C ontinued
PRIMARY METAL INDUSTRIES ......................... $ 1 5 9 . 78 $ 1 6 0 . 55 $ 1 6 2 . 9 3 $ 1 4 9 . 14 $ 1 4 7 . 24 $ 3 . 85 $ 3 . 8 5 $ 3 . 87 $ 3 . 62 $ 3 . 60331 B last furnace and b a s ic s tee l products . . ( * ) 1 6 9 . 3 3 1 7 3 . 0 6 1 5 0 .5 1 148. 22 ( * ) 4 . 11 4 . 15 3. 82 3 . 8 23312 B last furnaces and stee l m ills ............... - 1 7 1 . 8 0 1 7 5 . 5 5 1 5 2 . 4 9 1 4 9 . 7 7 4 . 18 4 . 2 2 3 . 8 9 3. 89332 Iron and stee l fo u n d r ie s .................................. 1 5 3 . 0 6 1 5 3 . 1 3 1 5 3 . 0 0 1 4 6 . 8 9 1 4 5 . 5 2 3 . 6 1 3. 62 3 . 6 0 3 . 4 4 3 . 4 03321 Gray iron fo u n d r ie s ....................................... ~ 1 5 5 . 0 6 1 5 3 . 7 9 148. 70 1 4 8 . 3 4 - 3. 64 3 . 6 1 3 . 4 5 3 . 4 13322 M alleable iron fo u n d r ie s ............................. — 1 5 1 . 6 6 1 5 4 . 8 0 1 4 4 . 0 8 1 4 2 . 8 0 - 3 . 6 9 3. 73 3. 54 3. 503323 Steel fou n d ries ................................................. - 1 4 8 . 2 6 1 4 9 .8 8 143 . 14 1 3 9 . 4 4 - 3 . 5 3 3 . 5 1 3. 36 3. 32333,4 Nonferrous m e t a ls .............................................. 1 5 9 .4 1 1 5 5 . 1 3 1 5 7 .0 1 1 4 8 . 1 7 1 4 6 . 6 3 3 . 6 9 3. 65 3 . 6 6 3 . 4 7 3 . 4 53334 Primary a lu m in u m .......................................... - 1 6 6 .0 1 1 6 6 .0 0 1 6 2 . 9 3 1 6 1 . 5 4 - 4 . 01 4 . 0 0 3. 87 3 . 8 1335 Nonferrous ro llin g and d ra w in g .................... 1 5 2 . 6 4 1 5 1 . 7 9 1 5 2 . 4 4 1 4 9 . 3 9 1 4 8 . 0 9 3. 60 3 . 5 8 3. 57 3 . 4 5 3 . 4 23351 C opper rolling and drawing ...................... - 1 5 3 . 7 9 1 5 7 .9 1 1 5 0 . 4 2 1 5 0 . 4 2 - 3 . 6 1 3. 63 3 . 4 9 3 . 4 53352 Aluminum rolling and d ra w in g ................. 1 5 6 . 2 8 153 . 55 155 . 05 1 5 1 . 0 3 3 . 6 6 3 . 6 3 3. 54 3 . 4 83357 N onferrous wire drawing and insulating - 1 4 7 . 6 3 1 5 0 . 2 3 1 4 5 . 8 6 1 4 5 . 3 4 - 3 . 4 9 3. 51 3 . 4 0 3. 38336 N onferrous fo u n d r ie s ......................................... 1 3 4 . 7 4 1 3 9 . 4 0 1 3 9 . 9 3 1 3 3 . 6 3 1 3 4 . 3 7 3. 36 3 . 4 0 3. 38 3. 22 3. 233361 Aluminum c a s t in g s ......................................... — 1 4 0 . 1 3 1 4 1 .5 1 138 . 36 1 3 9 . 8 6 - 3 . 4 6 3 . 4 6 3. 31 3. 333362,9 Other nonferrous ca s t in g s ........................... - 1 3 7 . 8 6 1 3 8 . 6 0 1 2 8 . 6 4 1 2 8 . 6 4 3. 33 3. 30 3. 13 3. 13339 M isce lla n eou s primary metal products . . . ( * ) 1 7 0 . 0 7 1 7 2 . 1 0 1 6 7 . 7 0 1 6 1 . 5 9 ( * ) 4 . 03 4 . 0 4 3 . 9 0 3 . 8 23391 Iron and s te e l f o r g in g s ................................ 1 7 6 . 4 0 1 8 0 .1 9 1 7 4 . 6 2 1 6 7 . 1 6 4 . 19 4 . 22 4 . 08 3 . 9 8
34 FABRICATED METAL PRODUCTS .................... 1 4 2 . 2 0 141. 70 1 4 2 . 7 2 1 3 7 . 0 5 136. 53 3 . 4 1 3. 39 3. 39 3 . 2 4 3. 22341 M etal cans ............................................................ 1 6 6 . 3 2 1 6 0 . 3 6 1 7 3 . 1 6 1 6 4 .2 1 1 6 5 . 3 9 3. 85 3 . 8 0 3 . 9 0 3. 69 3. 70342 C utlery , hand to o ls , and hardware ............ 1 3 2 . 9 9 1 3 2 . 6 6 1 3 2 .8 9 1 2 9 . 1 7 1 2 9 . 6 9 3. 22 3. 22 3. 21 3. 12 3. 113421,3,5 C utlery and hand to o ls , in c l .s a w s .......... - 1 3 1 . 6 5 1 3 0 . 1 0 1 2 5 . 9 3 1 2 4 . 5 6 - 3. 18 3. 15 3. 02 2. 983429 Hardware, n e c .............................................. - 1 3 2 . 8 4 1 3 4 . 5 5 1 3 1 . 0 2 1 3 2 .6 1 ~ 3 . 2 4 3 . 2 5 3. 18 3. 18343 Plumbing and heating, ex ce p t e le c tr ic . . . 1 2 7 . 8 4 1 2 9 . 9 7 1 2 7 . 1 7 1 2 6 . 8 8 1 2 5 . 2 5 3. 18 3. 17 3. 14 3. 05 3 . 0 43431,2 Sanitary ware & plum bers’ b rass goods. - 1 2 9 . 4 4 1 2 8 . 2 4 1 3 0 . 0 0 1 2 7 . 7 2 - 3. 22 3 . 1 9 3. 11 3. 103433 H eating equipm ent, ex ce p t e le c t r i c . . . . - 1 3 0 . 5 2 1 2 5 . 7 6 1 2 4 . 2 0 1 2 2 . 8 9 - 3. 13 3. 09 3 . 0 0 2 . 9 9344 F abricated structural metal products . . . . 1 4 0 . 1 5 1 4 0 . 6 9 1 4 0 . 1 9 1 3 2 . 2 9 1 3 1 . 6 7 3 . 4 1 3. 39 3. 37 3. 18 3. 153441 F abrica ted structural s t e e l ........................ - 1 4 1 . 8 6 1 4 2 . 3 8 1 3 1 . 2 4 1 3 3 . 0 4 - 3 . 4 1 3. 39 3. 17 3. 163442 Metal d oors , sa sh , and t r im ...................... — 1 1 7 .3 8 1 1 5 .7 1 1 1 1 . 52 113 . 02 - 2. 92 2. 90 2. 74 2. 733443 F abrica ted plate work (b o ile r sh ops) . . — 1 5 2 . 7 0 1 5 1 . 7 9 143 . 31 140. 19 - 3. 61 3. 58 3. 38 3 . 3 33444 Sheet metal w’o r k ............................................ - 1 4 7 . 0 8 1 4 6 . 9 7 1 3 6 . 0 4 1 3 5 .7 1 - 3. 57 3. 55 3. 31 3. 273446,9 A rch itectural and m isc . metal work . . . — 1 3 5 .2 0 1 3 4 . 4 6 1 3 1 . 3 5 1 3 0 .3 1 - 3. 25 3. 24 3. 12 3. 11345 Screw m achine products, b o lts , e t c ............ 1 4 8 . 9 5 1 4 7 . 4 9 1 4 8 . 7 7 1 4 1 . 2 6 1 4 0 . 3 9 3 . 4 4 3 . 4 3 3 . 4 2 3. 24 3. 223451 Screw machine p ro d u cts ...........................- - 1 4 1 . 2 8 1 4 1 . 1 0 1 3 4 . 9 0 133 . 30 - 3. 34 3. 32 3. 13 3. 103452 B o lts , nuts, r iv e ts , and w a s h e rs ............ - 153. 39 1 5 6 . 2 0 1 4 7 . 2 9 1 4 7 . 6 3 - 3. 51 3 . 5 1 3. 34 3. 34346 Metal s ta m pin g s ................................................... ( * ) 1 5 9 . 0 4 1 6 1 . 3 2 1 5 7 . 4 4 1 5 5 . 7 6 ( * ) 3 . 6 9 3. 70 3. 57 3. 54347 Metal s e r v ic e s , n e c ....................................... 1 2 3 . 4 2 1 2 2 .2 1 1 2 3 . 9 0 1 1 7 . 4 2 1 1 7 . 2 6 3. 04 3 . 0 1 3. 00 2 . 8 5 2 . 8 6348 M isc. fabricated w ire p rodu cts ...................... 1 2 6 . 1 8 1 2 4 . 8 5 1 2 5 .7 7 1 2 1 . 8 9 1 2 1 . 3 5 3. 07 3. 06 3 . 0 6 2 . 9 3 2 . 9 1349 M isc. fabricated metal p rodu cts .................... 1 3 7 . 1 2 1 3 6 .2 1 1 3 7 .2 8 1 3 1 . 6 7 1 3 0 . 8 3 3. 32 3 . 2 9 3. 30 3. 15 3. 133494,8 V a lv e s , p ip e , and pipe f i t t i n g s ............... — 1 4 0 . 0 3 1 3 9 . 9 5 1 3 4 . 4 0 1 3 3 . 4 6 - 3. 35 3. 34 3. 20 3. 17
35 MACHINERY, EXCEPT ELECTRICAL .......... 1 5 7 . 1 9 1 5 5 .6 1 1 5 5 . 0 0 1 4 5 . 9 4 145 . 09 3 . 6 9 3. 67 3 . 6 3 3 . 4 5 3 . 4 3351 E ngines and turbines ....................................... ( * ) 1 6 1 . 5 2 1 6 1 . 9 0 1 6 1 . 1 6 1 5 6 . 0 4 ( * ) 3. 93 3 . 9 2 3 . 8 1 3. 763511 Steam engines and tu r b in e s ...................... 1 7 0 . 4 3 1 7 0 . 4 0 1 7 2 . 8 0 1 6 5 . 4 5 4 . 01 4 . 00 4 . 00 3 . 9 33519 Internal com bustion en g in es , n e c . . . . - 1 5 7 . 5 5 1 5 8 . 3 0 1 5 6 . 2 9 152 . 03 - 3. 89 3. 88 3. 73 3 . 6 9352 Farm m a ch in e ry ................................................... - 1 4 6 .6 1 143. 78 1 3 6 . 5 7 1 4 0 . 5 9 - 3. 62 3. 55 3 . 4 4 3 . 4 8353 C onstruction and related m a ch in e ry .......... 153 . 97 1 5 3 . 9 7 1 5 2 . 4 4 1 4 4 . 7 5 1 4 4 . 6 7 3. 64 3. 64 3. 57 3 . 4 3 3 . 4 23531,2 C onstruction and mining m achinery. . . . - 1 5 6 .4 2 1 5 5 . 2 4 1 4 7 . 6 2 1 4 8 . 2 6 - 3 . 7 6 3. 67 3. 54 3. 533533 O il fie ld m achinery......................................... - 152. 43 1 4 5 . 8 2 1 4 0 .5 1 1 3 9 . 9 7 - 3 . 4 1 3. 36 3. 26 3. 2435 3 5 ,6 C on vey ors , h o is ts , cran es, m onorails. . - 1 5 5 .3 0 1 5 5 .8 1 141 . 95 143 . 05 — 3. 62 3 . 5 9 3. 34 3. 353537 Industrial trucks and t r a c t o r s ................. _ 1 3 9 .1 8 1 4 4 . 0 5 1 4 0 . 0 4 1 3 2 . 9 3 _ 3. 37 3. 35 3. 19 3. 15354 Metal working m achinery ................................ 1 7 7 . 6 8 1 7 5 . 1 6 1 7 7 .0 1 1 6 1 . 3 9 1 5 8 .1 1 4 . 02 3 . 9 9 3 . 9 6 3. 71 3 . 6 63541 M achine to o ls , metal cutting types . . . . _ 1 6 7 .0 6 1 7 2 . 4 3 1 5 6 . 0 9 1 5 6 . 0 2 _ 3. 94 3 . 9 1 3. 63 3. 623544 S pec ia l d ie s , to o ls , jig s & fixtures . . _ 1 9 7 . 4 2 1 9 6 . 8 5 1 7 7 . 4 6 173 . 21 _ 4 . 32 4 . 27 3. 97 3 . 9 13545 M achine too l a c c e s s o r i e s ........................... _ 154 . 14 1 5 3 . 9 7 1 4 4 . 6 3 1 4 2 . 0 4 _ 3 . 6 7 3 . 6 4 3 . 4 6 3. 393542,8 M isc. metal working m a ch in e ry ............... 1 5 9 .2 1 1 6 2 . 0 6 1 4 8 .0 1 145. 01 3 . 6 6 3. 65 3 . 4 5 3 . 4 2355 S pec ia l industry m achinery............................. 1 5 0 . 6 7 1 4 6 .8 0 1 4 8 . 3 4 1 3 8 . 7 8 1 3 8 . 6 7 3744 3 . 4 3 3 . 4 1 3 . 2 5 3 . 2 43^51 F ood products m a ch in e ry ........................... — 1 5 0 . 5 2 1 5 1 . 7 9 1 3 9 .1 1 1 3 8 .6 9 _ 3. 55 3. 53 3. 32 3. 313552 T e x tile m a ch in e ry ......................................... 1 2 3 . 4 3 1 2 6 .4 2 1 1 8 . 5 8 1 1 9 . 2 6 2. 96 2 . 9 4 2. 79 2. 783555 Printing trades m achinery........................... 1 5 8 .4 1 1 5 5 . 6 6 1 5 0 . 7 3 1 5 3 . 2 8 3. 65 3. 62 3 . 5 3 3. 54356 G eneral industrial m ach in ery ........................ 1 5 4 . 2 8 154. 34 1 5 4 .2 1 1 4 6 . 5 4 1 4 4 . 1 6 3763 3 . 6 4 3 . 6 2 3 . 4 4 3 . 4 03561 Pumps and c o m p r e s s o r s ............................. - 1 4 9 . 5 2 1 4 9 .3 2 143. 38 142 . 10 - 3 . 5 6 3. 53 3. 35 3. 323562 B all and roller b e a r in g s ............................. _ 1 5 7 .9 9 1 5 9 . 4 7 1 5 1 .7 9 1 4 9 . 7 2 _ 3 . 7 0 3. 70 3 . 5 3 3. 493564 Blowers and fa n s ........................................... _ 143. 52 141. 76 1 3 5 .5 8 1 3 3 . 4 6 _ 3 . 3 3 3. 32 3. 19 3. 17
3566 Pow er transm ission equipm ent................. 1 5 4 .5 1 1 5 2 . 4 4 1 4 7 . 0 6 1 4 2 . 5 5 3 . 6 1 3. 57 3 . 4 2 3. 37
357 O ffice and com puting m a c h in e s ................... ( * ) 1 5 3 .3 0 1 5 0 . 2 3 1 4 2 . 8 8 143. 90 ( * ) 3 . 6 5 3. 62 3 . 4 1 3 . 4 1
3573 Electronic computing equipment . . . . - 1 5 1 . 2 6 1 5 1 .6 2 1 4 9 . 0 2 1 4 7 . 5 6 - 3 . 6 1 3 . 6 1 3 . 4 1 3 . 4 0358 S erv ice industry m a c h in e s ............................. ( * ) 1 3 3 . 8 2 1 3 4 . 5 6 1 2 9 . 6 8 1 2 6 .5 8 ( * ) 3. 28 3. 29 3. 14 3. 113585 R efrigeration m a ch in e ry ............................. 1 3 4 . 7 2 135i 4 6 1 3 1 . 9 7 1 2 6 . 6 7 - 3. 31 3. 32 3. 18 3. 12359 M isc. m achinery, excep t e le c t r i c a l ............ 1 5 2 . 4 4 1 5 3 .5 8 1 5 1 . 1 2 141. 01 1 4 1 . 4 7 . 3. 57 3. 58 3 . 4 9 3. 31 3. 29
See footnotes at end of table. NOTE: Data for the 2 most recent months are preliminary.
Digitized for FRASER http://fraser.stlouisfed.org/ Federal Reserve Bank of St. Louis

105 ESTABLISHMENT DATAHOURS AND EARNINGS
C-2: Gross hours and earnings of production or nonsuperv isory w o rk e rs 1on pr iva te n o n a g r ic u l tu ra i payrolls , by in d u s try - -C o n t in u e d
IndustryAverage weekly hours Average overtime hours
Code N ov.1969
O ct.1969
Sept.1969
N ov.1968
O ct.1968
N ov.1969
O ct.1969
Sept.1969 00
• O ct.1968
33
Durable Goods—Continued
PRIMARY METAL INDUSTRIES........................ 41. 5 4 1 .7 42. 1 41. 2 40. 9 4. 2 4. 5 3. 8 3 .6331 Blast furnace and basic steel products . . (* ) 41. 2 41. 7 39. 4 38. 8 - 3 .4 3. 7 2. 0 1. 73312 Blast furnaces and steel mills.............. 41. 1 41. 6 39. 2 38. 5 - - — - —332 Iron and steel foundries............................. 42. 4 42. 3 42. 5 42. 7 42. 8 - 5. 3 5. 6 5. 8 5. 73321 Gray iron foundries................................... — 42. 6 42. 6 43. 1 43. 5 - - - — -3322 Malleable iron foundries........................ - 41. 1 41. 5 40. 7 40. 8 - - - - -3323 Steel foundries........................................ - 42. 0 42. 7 4 2 .6 42. 0 - - - - -333,4 Nonferrous metals........................................ 4 3 .2 42. 5 42. 9 42. 7 42. 5 - 4 .9 5. 1 4. 5 4. 53334 Primary aluminum................................... - 4 1 .4 4 1 .5 42. 1 4 2 .4 - - - — ~
335 Nonferrous rolling and drawing................ 4 2 .4 4 2 .4 42. 7 43. 3 43. 3 ~ 4. 8 4 .9 5 .2 5 .43351 Copper rolling and drawing................... - 42. 6 43. 5 43. 1 43. 6 ~ “ - —3352 Aluminum rolling and drawing................ — 42. 7 42. 3 43. 8 43. 4 - ~ — — —3357 Nonferrous wire drawing and insulating . - 42. 3 42. 8 42. 9 43. 0 ~ “ ~ ~336 Nonferrous foundries................................... 40. 1 41. 0 41. 4 41. 5 41. 6 3 .9 4. 5 4. 3 4 .63361 Aluminum castings................................... - 40. 5 40. 9 41. 8 42. 0 - ~ — ~3362,9 Other nonferrous castin gs...................... - 4 1 .4 42. 0 41. 1 41. 1 - — ~339 Miscellaneous primary metal products . . . (* ) 42. 2 42. 6 43. 0 42. 3 ” 5. 3 5. 7 5 .4 5 .23391 Iron and steel forgings........................... 42. 1 42. 7 42. 8 42. 034 FABRICATED METAL PRODUCTS................ 41. 7 41. 8 42. 1 42. 3 42. 4 - 4. 3 4 .7 4. 8 4 .9341 Metal c a n s ................................................... 43. 2 42. 2 4 4 .4 44. 5 44. 7 - 3. 5 6. 1 5 .6 5. 9342 Cutlery, hand tools, and hardware........... 41. 3 41. 2 41. 4 4 1 .4 41. 7 — 3. 3 3. 5 3 .6 4. 03421,3,5 Cutlery and hand tools, incl. saws. . . . — 4 1 .4 41. 3 41. 7 41. 8 - - - - -3429 Hardware, n e c ...................................... - 41. 0 4 1 .4 41. 2 41. 7 — — - — —343 Plumbing and heating, except electric. . . 40. 2 41. 0 40. 5 41. 6 41. 2 - 3. 6 3. 4 4. 0 3 .63431,2 Sanitary ware & plumbers’ brass goods . - 40. 2 40. 2 41. 8 41. 2 - - - - -3433 Heating equipment, except electric . . . - 41. 7 40. 7 41. 4 41. 1 - - - - -344 Fabricated structural metal products . . . . 41. 1 41. 5 41. 6 41. 6 41. 8 _ 4. 1 4 0 3 4. 1 4. 33441 Fabricated structural steel...................... — 41. 6 42. 0 41. 4 42. 1 — - — _ _3442 Metal doors, sash, and trim ................... - 40. 2 39. 9 40. 7 4 1 .4 _ _ _ _ _3443 Fabricated plate work (boiler shops). : . - 42. 3 4 2 .4 42. 4 42. 1 _ _ _ _ _3444 Sheet metal work...................................... ... 41. 2 41. 4 41. 1 41. 53446,9 Architectural and misc. metalwork.. . . _ 41. 6 41. 5 42. 1 41. 9345 Screw machine products, bolts, etc............ 43. 3 43. 0 43. 5 43. 6 4 3 .6 5. 8 5". 9 5. 9 5 .43451 Screw machine products........................... — 42. 3 42. 5 43. 1 43. 0 - - - _ -3452 Bolts, nuts, rivets, and washers........... T 43. 7 44. 5 44. 1 44. 2 - - - - -346 Metal stampings........................................... (* ) 43. 1 43. 6 44. 1 44. 0 - 5. 3 5 .9 6. 7 7. 0347 Metal services, n e c ................................. 40. 6 4 0 .6 41. 3 4 1 .2 41. 0 — 4. 7 4. 5 4. 3 4. 5348 Misc. fabricated wire products................... 41. 1 40. 8 41. 1 41. 6 41. 7 — 4. 0 4. 1 4. 2 4. 2349 Misc. fabricated metal products................ 41. 3 4 1 .4 41. 6 41. 8 41. 8 - 3. 7 3. 9 4. 1 4. 03494,8 Valves, pipe, and pipe fittings................ - 41. 8 41. 9 42. 0 42. 1 - - - - -
35 MACHINERY, EXCEPT E LEC TRICAL ........... 42. 6 42. 4 42. 7 42. 3 42. 3 _ 4. 6 4. 9 4. 3 4. 2351 Engines and turbines................................... (* ) 41. 1 41. 3 42. 3 41. 5 - 4. 7 4. 8 5. 0 4. 53511 Steam engines and turbines........... 42. 5 42. 6 43. 2 42. 1 - - - - -3519 Internal combustion engines, n e c . . . — 40. 5 40. 8 41. 9 41. 2 - _ - _ _352 Farm machinery............................................. - 40. 5 40. 5 3 9 o 7 40. 4 - 3. 0 2. 8 2. 1 2. 9353 Construction-and related machinery........... 42. 3 42. 3 42. 7 42. 2 42. 3 _ 4. 0 4. 5 3 .6 3 .93531,2 Construction and mining machinery . . . - 41. 6 42. 3 41. 7 42. 0 _ _ _ _ _3533 Oil field machinery................................ - 44. 7 43. 4 43. 1 43. 2 _ _ _ _3535,6 Conveyors, hoists, cranes, monorails. . - 42. 9 4 3 .4 42. 5 1 42. 7 _ - - - -3537 Industrial trucks and tractors . . . . . . . - 41. 3 43. 0 43. 9 42. 2 _ - - - -354 Metal working machinery........................... 44. 2 43. 9 44. 7 43. 5 43. 2 _ 6. 0 6. 3 5. 3 4 .93541 Machine tools, metal cutting types. . . . - 4 2 .4 44. 1 43. 0 43. 1 _ _ _ _ _3544 Special dies, tools, jigs, & fixtures. . . - 45. 7 46. 1 44. 7 44. 3 _ - - - -3545 Machine tool accessories........................ - 42. 0 42. 3 41. 8 41. 9 _ _ - - -3542,8 Misc. metal working machinery.............. - 43. 5 4 4 .4 42. 9 4 2 .4 _ _ - - -355 Special industry machinery........................ 43. 8 42. 8 43. 5 42. 7 42. 8 _ 4. 8 5. 3 4 .6 4. 53551 Food products machinery........................ - 4 2 .4 43. 0 41. 9 41. 9 _ _ _ _3552 Textile machinery................................... - 41. 7 43. 0 42. 5 42. 9 _ - - - -3555 Printing trades machinery...................... _ 4 3 .4 43. 0 42. 7 43. 3 _ _ - - -356 General industrial machinery..................... 42. 5 4 2 .4 42. 6 42. 6 4 2 .4 _ 4 .6 4. 7 4 .4 4. 23561 Pumps and com pressors........................ - 42. 0 42. 3 42. 8 42. 8 _ — _ _3562 Ball and roller bearings........................... - 42. 7 43. 1 43. 0 42. 9 - - - - -3564 Blowers and fans...................................... - 43. 1 42. 7 42. 5 42. 1 - - ~ - -3566 Power transmission equipment.............. — 42. 8 42. 7 43. 0 42. 3 - - - ~357 Office and computing machines.................. (*) 42. 0 41. 5 41. 9 42. 2 - 3 .7 3 .7 3. 2 3 .43573 Electronic computing equipment . . . . 41. 9 42. 0 4 3 .7 4 3 .4 - - - -358 Service industry m achines........................ (*) 40. 8 40. 9 41. 3 40. 7 - 2. 9 3. 1 3. 3 3. 13585 Refrigeration machinery........................... 40. 7 40. 8 41. 5 40. 6 - - - -359 Misc. machinery, except electrical........... 42. 7 42. 9 43. 3 42. 6 43. 0 - 5. 5 5 .9 5. 2 5. 3
See footnotes at end of table. NOTE: Data for the 2 most recent months are preliminary.
Digitized for FRASER http://fraser.stlouisfed.org/ Federal Reserve Bank of St. Louis

ESTABLISHMENT DATAHOURS AND EARNINGS
1 06
C-2: Gross hours an d earnings of prod uc t ion or nonsuperv isory w o rk e rs 1on p r iv a te n o n o g r ic u l tu ra l payro l ls , by in d u s try - -C o n t in u e d
A v e r a g e w e e k ly e a r n in g s A v e r a g e h o u r ly e a r n in g s
N o v . O ct . Sept. N o v . O ct . N o v . O c t . Sept. N o v . O c t .1 9 6 9 1 9 6 9 1 9 6 9 1 9 6 8 1 9 6 8 1 9 6 9 1 9 6 9 1 9 6 9 1 9 6 8 1 9 6 8
$ 1 2 6 . 5 4 $ 1 2 6 . 4 5 $ 1 2 7 . 3 9 $ 1 2 2 . 1 0 $ 1 2 0 . 9 9 $ 3 . 1 4 $ 3 . 1 3 $ 3 . 1 3 $ 3 . 0 0 $ 2 . 9 8
( * ) 1 3 3 . 4 9 1 3 4 . 6 9 1 3 2 . 1 9 1 2 9 . 1 7 ( * ) 3 . 2 4 3 . 2 3 3 . 1 7 3 . 1 2— 1 2 0 . 3 0 1 2 0 . 8 8 1 1 6 . 6 9 1 1 5 . 3 0 3 . 0 0 2 . 9 7 2 . 8 6 2 . 8 4- 1 3 7 . 1 9 1 3 7 . 5 7 1 3 3 . 7 6 1 3 1 . 5 6 - 3 . 2 9 3 . 2 6 3 . 2 0 3 . 1 7— 1 4 1 . 7 0 1 4 3 . 9 0 1 4 3 . 3 1 1 3 8 . 6 0 - 3 . 3 9 3 . 4 1 3 . 3 8 3 . 3 0
( * ) 1 3 3 . 0 8 1 3 3 . 9 5 1 2 8 . 0 3 1 2 6 . 2 8 ( * ) 3 . 2 3 3 . 2 2 3 . 1 0 3 . 0 8— 1 3 4 . 6 4 1 3 6 . 5 0 1 3 1 . 3 6 1 3 0 . 0 0 3 . 2 6 3 . 2 5 3 . 1 5 3 . 1 4— 1 2 9 . 0 2 1 3 0 . 2 9 1 2 1 . 3 9 1 2 0 . 0 9 - 3 . 1 7 3 . 1 7 2 . 9 9 2 . 9 8
( * ) 1 3 3 . 2 5 1 3 4 . 9 7 1 3 2 . 6 6 1 3 2 . 1 6 ( * ) 3 . 2 9 3 . 3 0 3 . 2 2 3 . 2 0— 1 4 6 . 2 1 1 4 9 . 5 1 1 4 7 . 9 1 1 4 6 . 5 6 3 . 6 1 3 . 6 2 3 . 5 9 3 . 5 4— 1 4 0 . 4 8 1 3 7 . 7 6 1 4 0 . 2 7 1 4 1 . 2 0 - 3 . 4 6 3 . 4 7 3 . 3 8 3 . 3 7— 1 0 9 . 7 6 1 1 1 . 7 8 1 0 5 . 4 1 1 0 5 . 6 7 - 2 . 7 1 2 . 7 0 2 . 5 9 2 . 5 9
( * ) 1 1 7 . 6 0 1 1 8 . 8 9 1 1 3 . 8 1 1 1 2 . 5 6 ( * ) 2 . 9 4 2 . 9 5 2 . 8 1 2 . 8 0- 1 1 7 . 7 1 1 1 7 . 5 1 1 1 4 . 9 0 1 1 4 . 5 1 - 2 . 9 8 2 . 9 6 2 . 8 3 2 . 8 7- 1 1 9 . 1 0 1 2 1 . 2 0 1 1 4 . 7 4 1 1 3 . 2 4 — 3 . 0 0 3 . 0 3 2 . 8 4 2 . 8 1— 1 1 6 . 7 6 1 1 8 . 0 3 1 1 2 . 4 6 1 1 1 . 6 3 - 2 . 8 9 2 . 9 0 2 . 7 7 2 . 7 7
( * ) 1 0 5 . 5 4 1 0 3 . 8 5 1 0 1 . 3 9 1 0 0 . 4 7 ( * ) 2 . 7 2 2 . 7 4 2 . 5 8 2 . 5 5
( * ) 1 4 6 . 5 6 1 4 7 . 9 1 1 3 6 . 3 7 1 3 5 . 9 6 ( * ) 3 . 5 4 3 . 5 3 3 . 3 1 3 . 3 0— 1 5 3 . 6 5 1 5 7 . 1 1 1 3 9 . 6 7 4 3 8 . 9 9 3 . 5 9 3 . 6 2 3 . 3 9 3 . 3 9- 1 4 2 . 5 1 1 4 2 . 6 8 1 3 5 . 0 5 1 3 4 . 6 4 - 3 . 5 1 3 . 4 8 3 . 2 7 3 . 2 6
( * ) 1 0 6 . 2 3 1 0 7 . 3 2 1 0 3 . 1 0 1 0 2 . 5 6 ( * ) 2 . 7 1 2 . 7 1 2 . 6 1 2 . 5 9— 1 2 0 . 3 0 1 1 9 . 5 0 1 0 9 . 9 8 1 1 1 . 3 9 ~ 3 . 0 0 2 . 9 8 2 . 8 2 2 . 8 2— 1 0 3 . 3 5 1 0 5 . 0 7 1 0 1 . 3 8 1 0 0 . 5 8 2 . 6 5 2 . 6 6 2 . 5 6 2 . 5 4
( * ) 1 3 7 . 5 0 1 3 8 . 8 4 1 4 0 . 1 9 1 3 5 . 9 4 ( * ) 3 . 3 7 3 . 3 7 3 . 3 3 3 . 2 61 3 8 . 2 5 1 4 1 . 8 0 1 4 3 . 4 4 1 3 8 . 4 5 3 . 5 0 3 . 5 1 3 . 4 9 3 . 4 1
1 6 4 . 3 9 1 6 6 . 3 2 1 6 7 . 0 9 1 6 5 . 0 2 1 6 2 . 9 2 3 . 9 9 3 . 9 6 3 . 9 5 3 . 8 2 3 . * 7 8
( * ) 1 7 3 . 4 4 1 7 8 . 0 2 1 8 1 . 7 5 1 7 8 . 2 0 ( * ) 4 . 1 1 4 . 1 4 4 . 0 3 3 . 9 6- 1 8 1 . 0 5 1 8 6 . 1 9 1 8 8 . 2 4 1 8 9 . 6 0 4 . 2 5 4 . 2 9 4 . 1 1 4 . 0 6— 1 8 6 . 1 9 1 8 9 . 2 3 2 0 1 . 7 1 1 9 4 . 1 9 ~ 4 . 3 3 4 . 3 5 4 . 3 1 4 . 2 4- 1 4 0 . 3 5 1 3 7 . 9 0 1 3 7 . 9 4 1 3 0 . 4 1 - 3 . 4 4 3 . 3 8 3 . 3 4 3 . 2 2— 1 7 1 . 3 5 1 7 5 . 8 9 1 8 0 . 5 9 1 7 2 . 9 2 ~~ 4 . 0 7 4 . 1 0 4 . 0 4 3 . 9 3- 1 2 3 . 8 6 1 2 6 . 2 7 1 2 1 . 3 6 1 2 1 . 7 7 3 . 1 2 3 . 1 1 2 . 9 6 2 . 9 7
( * ) 1 6 6 . 3 0 1 6 2 . 9 6 1 5 7 . 5 0 1 5 5 . 1 7 ( * ) 3 . 9 5 3 . 8 8 3 . 7 5 3 . 7 31 6 7 . 5 6 1 6 3 . 3 8 1 5 8 . 8 4 1 5 6 . 9 1 3 . 9 8 3 . 8 9 3 . 8 0 3 . 7 9
- 1 6 3 . 1 2 1 6 3 . 8 6 1 5 8 . 3 0 1 5 4 . 0 1 - 3 . 9 4 3 . 9 2 3 . 7 6 3 . 7 2- 1 6 5 . 2 1 1 6 0 . 7 4 1 5 3 . 0 6 1 5 2 . 5 1 - 3 . 8 6 3 . 8 0 3 . 6 1 3 . 5 8
( * ) 1 5 3 . 1 8 1 5 1 . 9 4 1 4 0 . 2 4 1 4 1 . 8 6 ( * ) 3 . 7 0 3 . 6 7 3 . 4 8 3 . 4 6- 1 6 2 . 6 8 1 6 1 . 0 7 1 4 8 . 7 4 1 5 0 . 1 0 - 3 . 9 2 3 . 9 0 3 . 7 0 3 . 6 7- 1 1 9 . 0 2 1 2 0 . 3 5 1 1 2 . 6 1 1 1 3 . 0 2 - 2 . 9 1 2 . 9 0 2 . 7 6 2 . 7 3- 1 6 3 . 6 8 1 6 1 . 8 5 1 4 7 . 1 7 1 4 7 . 1 0 - 3 . 9 2 3 . 9 0 3 . 6 7 3 . 6 5
- 1 1 7 . 8 1 1 1 8 . 1 9 1 1 3 . 7 7 1 1 4 . 7 7 ~ 2 . 9 6 2 . 9 4 2 . 8 3 2 . 8 2
1 3 4 . 1 4 1 3 1 . 7 0 1 3 1 . 8 4 1 2 4 . 7 5 1 2 3 . 2 2 3 . 2 4 3 . 2 2 3 . 2 0 3 . 0 5 3 . 0 2- 1 5 0 . 1 2 1 5 1 . 5 0 1 4 1 . 8 6 1 4 1 . 2 8 - 3 . 6 0 3 . 5 9 3 . 4 1 3 . 3 8
1 2 9 . 0 2 1 2 7 . 6 6 1 2 9 . 7 4 1 2 1 . 6 0 1 1 9 . 6 9 3 . 1 7 3 . 1 6 3 . 1 8 3 . 0 1 2 . 9 7- 1 3 0 . 2 4 1 3 2 . 3 4 1 2 2 . 8 2 1 1 9 . 9 0 - 3 . 2 0 3 . 2 2 3 . 0 4 2 . 9 9- 1 2 4 . 7 1 1 2 6 . 3 6 1 1 9 . 2 9 1 1 9 . 0 7 - 3 . 1 1 3 . 1 2 2 . 9 6 2 . 9 4
1 2 3 . 5 3 1 2 3 . 1 2 1 2 3 . 2 2 1 1 3 . 8 8 1 1 4 . 1 7 3 . 0 5 3 . 0 4 3 . 0 2 2 . 8 4 2 . 8 4- 1 1 1 . 6 7 1 1 1 . 8 8 1 0 2 . 7 0 1 0 3 . 7 4 - 2 . 8 2 2 . 7 9 2 . 6 0 2 . 6 0
1 1 2 . 9 6 1 1 0 . 9 2 1 1 1 . 2 3 1 0 8 . 0 0 1 0 6 . 6 6 2 . 8 1 2 . 7 8 2 . 7 6 2 . 6 6 2 . 6 4
( * ) 1 6 1 . 4 1 1 6 0 . 7 6 1 5 1 . 2 3 1 4 8 . 9 7 ( * ) 3 . 7 8 3 . 7 3 3 . 5 5 3 . 5 31 0 2 . 5 7 1 0 2 . 3 1 9 6 . 6 1 9 5 . 6 5 — 2 . 6 1 2 . 5 9 2 . 4 9 2 . 4 4
1 0 6 . 6 5 1 0 5 . 9 9 1 0 4 . 6 6 1 0 0 . 1 9 1 0 0 . 1 5 2 . 7 0 2 . 6 9 2 . 6 7 2 . 5 3 2 . 5 1
1 2 1 . 3 9 1 2 0 . 6 9 1 1 7 . 6 0 1 1 7 . 8 3 1 1 6 . 6 0 2 . 9 9 2 . 9 8 2 . 9 4 2 . 8 6 2 . 8 3- 9 2 . 3 4 9 2 . 1 1 8 8 . 7 6 8 9 . 4 4 - 2 . 3 8 2 . 3 8 2 . 2 7 2 . 2 7- 8 7 . 1 7 8 7 . 7 1 8 4 . 6 7 8 5 . 0 6 - 2 . 2 7 2 2 . 9 2 . 1 6 2 . 1 7- 1 0 1 . 1 2 9 9 . 1 8 9 5 . 5 5 9 7 . 1 1 - 2 . 5 6 2 . 5 3 2 . 4 5 2 . 4 4- 1 0 5 . 0 6 1 0 5 . 3 4 1 0 0 . 6 5 9 7 . 8 6 - 2 . 6 8 2 . 6 6 2 . 5 1 2 . 4 9- 9 4 . 6 0 9 4 . 4 6 9 1 . 6 5 9 2 . 6 6 - 2 . 4 7 2 . 4 6 2 . 3 5 2 . 3 4
■ 1 1 9 . 6 9 1 1 8 . 3 0 1 1 6 . 6 1 1 0 7 . 8 6 1 0 8 . 2 7 2 . 9 7 2 . 9 5 2 . 9 3 2 . 7 1 2 . 7 01 1 3 . 3 7 1 1 5 . 3 7 1 1 0 . 7 0 1 1 0 . 7 0 2 . 8 7 2 . 8 7 2 . 7 2 2 . 7 0
. 1 2 3 . 0 0 1 2 1 . 4 7 1 2 3 . 7 3 1 1 6 . 2 8 1 1 5 . 2 1 3 . 0 0 2 . 9 7 2 . 9 6 2 . 8 5 2 . 8 1
. 1 3 6 . 4 3 1 3 3 . 1 4 1 3 3 . 7 7 1 2 7 . 9 8 1 2 4 . 9 2 3 . 2 1 3 . 1 7 3 . 1 7 3 . 0 4 3 . 0 1
. 1 6 1 . 2 5 1 6 0 . 8 8 1 5 5 . 4 9 1 5 1 . 0 8 - 3 . 7 5 3 . 7 5 3 . 5 5 3 . 5 3
. 1 4 4 . 6 7 1 4 5 . 2 5 1 3 9 . 0 3 1 3 4 . 3 1 - 3 . 5 2 3 . 5 0 3 . 3 5 3 . 3 0• 8 5 . 2 7 8 6 . 7 4 7 7 . 8 2 7 8 . 0 1 2 . 0 9 2 . 0 9 1 . 9 7 1 . 9 6
siccode Industry
36 361 3611 3612 3613 3623621362236336323633363436436413642 3643,4365366 3661 3662 367 3671-33674.9 369 3694
3737137113712371337143715372372137223723.937337313732374375.9
38 381 38238213822 383,5385 384386 387
39 391394 3941-3 3949395396393.8.9
Durable Goods^Continued
ELECTRICAL EQUIPMENT AND SUPPLIES..Electric test & distributing equipment . .
Electric measuring instruments ..........Transformers..........................................Switchgear and switchboard apparatus.
Electrical industrial apparatus................Motors and generators ..........................Industrial controls................................
Household appliances ..............................Household refrigerators and freezers . .Household laundry equipment..............Electric housewares and fans ............
Electric lighting and wiring equipment . .Electric lamps........................................Lighting fixtures....................................Wiring devices........................................
Radio and TV receiving equipment........Communication equipment........................
Telephone and telegraph apparatus . . . Radio and TV communication equipment
Electronic components and accessoriesElectron tubes......................................Other electronic components..............
Misc. electrical equipment & supplies.. Engine electrical equipment..............
TRANSPORTATION EQUIPMENT..................Motor vehicles and equipment................
Motor vehicles......................................Passenger car bodies..........................Truck and bus bodies..........................Motor vehicle parts and accessories .Truck trailers......................................
Aircraft and parts....................................Aircraft..................................................Aircraft engines and engine parts . . . Other aircraft parts and equipment. . .
Ship and boat building and repairing . . .Ship building and repairing................Boat building and repairing................
Railroad equipment..................................Other transportation equipment..............
INSTRUMENTS AND RELATED PRODUCTS .Engineering & scientific instruments . . . Mechanical measuring & control devices.
Mechanical measuring dev ices.......... ..Automatic temperature controls...........
Optical and ophthalmic goods ................Ophthalmic goods..................................
Medical instruments and supplies............Photographic equipment and supplies . . . Watches, clocks, and w atchcases..........
MISQ MANUFACTURING INDUSTRIES . . . Jewelry, silverware, and plated ware...Toys and sporting goods...................... ,
Games, toys, dolls & play vehicles . Sporting and athletic goods, n e c . .
Pens, pencils, office and art supplies.Costume jewelry and notions..............Other manufacturing industries............
393 Musical instruments and parts................
Nondurable Goods
20 FOOD AND KINDRED PRODUCTS .....................201 Meat products ..............................................2011 Meat packing plants................................2013 Sausages and other prepared meats . . . .2015 Poultry dressing plants...........................
See footnotes at end of table. NOTE: Data for the 2 most recent months are preliminary.
Digitized for FRASER http://fraser.stlouisfed.org/ Federal Reserve Bank of St. Louis

107 ESTABLISHMENT DATAHOURS AND EARNINGS
C -2 : G ro ss ho urs a n d e a r n i n g s o f p r o d u c t io n or n o n s u p e r v is o r y w o r k e r s 1on p r i v a t e n o n a g r i c u l t u r a l p a y r o l l s , by i n d u s t r y - - C o n t i n u e d
SICCode Industry
Average weekly hours Average overtime hoursN o v .
1969U c t .
1969S e p t .
1969NOV.1968
u c t .1968
N o v .
1969u c t .
1969S e p t .1969
N o v .1968
O c t .1968
36
D u r a b le G o o d s - -C o n t i n u e d
ELECTRICAL EQUIPMENT AND SUPPLIES . 4 0 . 3 4 0 . 4 4 0 . 7 40 . 7 4 0 . 6 2 .9 3. 1 3. 0 2 .9361 Electric test 8t distributing equipment . . (* ) 4 1 .2 4 1 . 7 4 1 . 7 4 1 . 4 _ 3. 3 3. 7 3. 5 3. 23611 Electric measuring instruments............. 4 0 . 1 4 0 . 7 4 0 . 8 4 0 . 6 _ - — - —3 6 1 2 Transformers............................................. - 4 1 . 7 4 2 . 2 4 1 . 8 4 1 . 5 - - - - -3 6 1 3 Switchgear and switchboard apparatus. . _ 4 1 . 8 4 2 . 2 4 2 .4 4 2 . 0 - - - - -3 6 2 Electrical industrial apparatus................ (* ) 4 1 . 2 4 1 .6 4 1 . 3 4 1 . 0 - 4 . 0 4 . 1 3. 5 3. 13 621 Motors and generators............................. 4 1 . 3 4 2 . 0 4 1 . 7 4 1 . 4 - - - - -3 6 2 2 Industrial controls................................... — 4 0 . 7 4 1 . 1 4 0 .6 4 0 . 3 — - - - -363 Household appliances................................ ( * ) 4 0 . 5 4 0 . 9 4 1 .2 4 1 . 3 - 3. 1 3 .4 3. 5 3. 53 6 3 2 Household refrigerators and freezers . . - 4 0 . 5 4 1 . 3 4 1 . 2 4 1 .4 — - - - -3 6 3 3 Household laundry equipment.................. - 4 0 . 6 39 . 7 4 1 . 5 4 1 . 9 - - - - -3 6 3 4 Electric housewares and fans................ - 4 0 . 5 4 1 . 4 4 0 . 7 4 0 . 8 - -3 6 4 Electric lighting and wiring equipment . . (* ) 4 0 . 0 4 0 . 3 4 0 . 5 4 0 . 2 - 3. 0 3. 0 2 . 8 2 .63641 Electric la m p s........................................ 39 . 5 39 . 7 4 0 .6 3 9 .9 — - - - —3 6 4 2 Lighting fixtures...................................... — 39 . 7 4 0 . 0 4 0 .4 4 0 . 3 - - - - -3 6 4 3 ,4 Wiring devices........................................... - 4 0 .4 4 0 . 7 4 0 . 6 4 0 . 3 - — — - —365 Radio and TV receiving equipment . . . . . (* ) 38 . 8 37 . 9 39 . 3 39 . 4 - 1. 8 1. 9 2 .2 2 . 3366 Communication equipment........................... ( * ) 4 1 . 4 4 1 . 9 4 1 . 2 4 1 . 2 - 3. 1 3. 5 2 . 8 2 . 93 661 Telephone and telegraph apparatus . . . 4 2 . 8 4 3 . 4 4 1 .2 4 1 . 0 - —3 6 6 2 Radio and TV communication equipment — 4 0 . 6 4 1 . 0 4 1 . 3 4 1 . 3 - - - - _367 Electronic components and accessories . . ( * ) 39 . 2 3 9 .6 39 . 5 3 9 .6 - 2 . 1 2 . 4 2 . 1 2 . 13 6 7 1 -3 Electron tu b e s ........................................ - 4 0 . 1 4 0 . 1 39 . 0 39 . 5 - _ - - ~3 6 7 4 ,9 Other electronic components.................. - 39 . 0 3 9 .5 3 9 .6 3 9 .6 " ~ ” —369 Misc. electrical equipment & supplies. . . (* ) 4 0 . 8 4 1 . 2 4 2 . 1 4 1 . 7 3. 2 3. 2 4 . 5 4 . 23 6 9 4 Engine electrical equipment.................. 39 . 5 4 0 .4 4 1 . 1 4 0 . 6 ~ — —
37 TRANSPORTATION EQUIPMENT ................ 4 1 . 2 4 2 . 0 4 2 . 3 4 3 . 2 4 3 . 1 4 . 1 4 . 3 5. 6 5 . 5371 Motor vehicles and equipment................... (* ) 4 2 . 2 4 3 . 0 4 3 . 0 4 5 . 0 - 4 . 6 5. 0 Z. 8 7 . 63711 Motor vehicles........................................... 4 2 . 6 4 3 . 4 4 5 . 8 4 6 . 7 — - - - -3 7 1 2 Passenger car bodies.............................. - 4 3 . 0 4 3 . 5 4 6 . 8 4 5 . 8 - “ - “3 7 1 3 Truck and bus bodies.............................. - 4 0 . 8 4 0 . 8 4 1 . 3 4 0 . 5 - — ~ —3 7 1 4 Motor vehicle parts and accessories. . . - 4 2 . 1 4 2 . 9 4 4 . 7 4 4 . 0 - - - - -37 1 5 Truck tra ilers ........................................ - 39 . 7 4 0 . 6 4 1 . 0 4 1 . 0 - - - - -372 Aircraft and parts........................................ (* ) 4 2 . 1 4 2 . 0 4 2 . 0 4 1 . 6 - 3 .6 3 .6 3 .7 3. 53721 Aircraft ...................................................... 4 2 . 1 4 2 . 0 4 1 . 8 4 1 .4 - - - - -3 7 2 2 Aircraft engines and engine parts . . . . - 4 1 .4 4 1 . 8 4 2 . 1 4 1 .4 - - - - -3 7 2 3 ,9 Other aircraft parts and equipment. . . . - 4 2 . 8 4 2 . 3 4 2 .4 4 2 . 6 - - - - -3 73 Ship and boat building and repairing. . . . (* ) 4 1 .4 4 1 .4 4 0 . 3 4 1 . 0 - 4 . 1 4 . 2 3 .4 3. 53731 Ship building and repairing...................... 4 1 . 5 4 1 . 3 4 0 . 2 4 0 . 9 - - - - -3 7 3 2 Boat building and repairing.................... - 4 0 . 9 4 1 . 5 4 0 . 8 4 1 .4 - - - - -3 7 4 Railroad equipment...................................... - 4 1 . 5 4 1 . 5 4 0 . 1 4 0 . 3 - 3. 8 4 . 3 2 .9 2 . 53 7 5 ,9 Other transportation equipment................ - 39 . 8 4 0 . 2 4 0 . 2 4 0 . 7 - 2 . 7 3. 0 3. 3 3. 5
38 INSTRUMENTS AND RELATED PRODUCTS . . 4 1 .4 4 0 . 9 4 1 . 2 4 0 . 9 40 . 8 _ 3. 2 3 .4 3. 1 2 .9‘381 Engineering 8c scientific instruments . . . . - 4 1 . 7 4 2 . 2 4 1 . 6 4 1 . 8 - 4 . 0 4 . 1 3 .6 3. 53 8 2 Mechanical measuring 8c control d ev ices . 4 0 . 7 4 0 . 4 4 0 . 8 4 0 . 4 4 0 . 3 - 3. 1 3. 4 3. 2 2 . 83 821 Mechanical measuring d ev ices ................ - 4 0 . 7 4 1 . 1 4 0 . 4 4 0 . 1 - - - - -3 8 2 2 Automatic temperature con tro ls .............. - 4 0 . 1 4 0 . 5 4 0 . 3 4 0 . 5 - - - - -3 8 3 ,5 Optical and ophthalmic g o o d s .................... 4 0 . 5 4 0 . 5 4 0 . 8 4 0 . 1 4 0 . 2 - 3. 0 3. 1 2 . 4 2. 2385 Ophthalmic g o o d s ...................................... 3 9 .6 4 0 . 1 39 . 5 3 9 .9 - 2 . 3 2 . 5 2 . 2 2 . 13 8 4 Medical instruments and supplies.............. 4 0 . 2 39. 9 4 0 . 3 4 0 . 6 4 0 .4 - 2 . 5 2 . 7 2 . 7 2 .63 86 Photographic equipment and supplies.. . . (* ) 4 2 . 7 4 3 . 1 4 2 . 6 4 2 . 2 - 4 . 0 4 . 2 4 . 1 3. 7387 Watches, c locks, and watch c a s e s ............ 39 . 3 39 . 5 38 . 8 39 . 2 2 . 3 2 . 3 2 . 0 2. 1
39 MISC. MANUFACTURING INDUSTRIES . . . 39 . 5 3 9 .4 3 9 .2 39. 6 39. 9 _ 2 .9 2 .9 2 .9 3. 0391 Jewelry, silverware, and plated ware. . . . 4 0 .6 4 0 . 5 4 0 . 0 4 1 . 2 4 1 . 2 - 3. 5 3 .4 4 . 1 4 . 13 9 4 Toys and sporting goods................................ - 38 . 8 38 . 7 39 . 1 3 9 .4 - 2. 7 2 . 7 2 . 5 3. 03 9 4 1 -3 Games, toys, dolls , & play vehicles . . . - 3 8 .4 38 . 3 3 9 .2 39 . 2 _ _ - - -3 9 4 9 Sporting and athletic goods, n e c ............ - 39 . 5 3 9 .2 39. 0 39 . 8 - - - - -395 Pens, pencils, office and art supplies . . . - 3 9 .2 3 9 .6 4 0 . 1 39 . 3 - 2. 3 2. 5 2 . 0 1. 73 96 Costume jewelry and notions....................... - 38 . 3 3 8 .4 39 . 0 3 9 .6 _ 3. 0 2. 5 2 . 7 2 . 83 9 3 ,8 ,9 Other manufacturing industries.................. 4 0 . 3 4 0 . 1 39 . 8 39 . 8 4 0 . 1 - 3. 0 3. 2 3. 1 3 .23 9 3 Musical instruments and p a rts ................ - 39 . 5 4 0 . 2 4 0 . 7 4 1 . 0 - 2 . 0 2 .6 3. 1 3 .2
20
N o n d u r a b le G o o d s
FO O D A N D K IN D R E D P R O D U C TS .............. 4 1 . 0 4 0 . 9 4 1 . 8 40 . 8 4 1 . 0 4 . 3 5. 0 4 . 2 4 . 3201 M ea t p r o d u c t s ............................................................. 4 2 .5 4 2 . 0 4 2 . 2 4 2 . 1 4 1 . 5 - 5. 3 5. 8 5. 2 4 . 82011 M ea t p a c k in g p l a n t s .......................................... - 4 3 . 0 4 2 . 9 4 3 . 8 4 2 . 8 - - - - -2 0 1 3 S a u s a g e s a n d o th e r p r e p a r e d m e a ts . . . - 4 1 . 1 4 1 . 5 4 1 . 5 4 0 . 7 - - - - -20 1 5 P o u lt r y d r e s s in g p l a n t s .................................. 4 0 . 8 4 1 . 5 39. 5 39 . 8 - - - -
See footnotes at end of table. NOTE: Data for the 2 most recent months are preliminary.
Digitized for FRASER http://fraser.stlouisfed.org/ Federal Reserve Bank of St. Louis

ESTABLISHMENT DATAHOURS AND EARNINGS
108
C-2: Gross hours a n d e a r n in g s o f prod uc t ion or n o n s u p e rv is o ry w o r k e r s 1on p r iv a t e n o n a g r ic u l t u r a l p a y r o l ls , by in d u s t r y - -C o n t in u e d
SIC IndustryAverage weekly earnings Average hourly earnings
Code N ov.1969
O ct.1969
Sept.1969
N ov.1968
O ct.1968
N ov.1969
O ct.1969
Sept.1969
N ov.1968
O ct.1968
202
Nondurable Goods—Continued
FOOD AND KINDRED PRODUCTS-Continued Dairy products.............................................. $129 .07 $12 7 .9 3 $ 129 .58 $121 .76 $121. 09 $3. 11 $ 3 . 09 $3. 10 $2. 92 $2. 89
2024 Ice cream and frozen desserts.......... ... _ 116. 13 122.81 114.17 117.56 - 2. 94 3. 01 2. 92 2 .9 120 26 _ 135 .53 137 .67 128. 71 127 .93 _ 3 .2 5 3. 27 3. 05 3. 01203 Canned, cured, and frozen foods................ _ 96. 82 106 .26 89. 11 94 .4 9 _ 2. 47 2. 53 2. 37 2. 382031,6 Canned, cured, and frozen sea foods . . . _ 87. 23 82. 94 72. 08 77. 68 _ 2 . 32 2. 26 2. 12 2. 142032,3 Canned food, except sea foods.............. _ 97. 86 112.75 92. 48 98. 90 _ 2 .4 9 2. 58 2 .4 4 2 .4 32037 Frozen fruits and vegetables................
(* )96. 56 9 6 .6 3 89. 10 89. 89 _ 2. 39 2. 38 2. 25 2 .2 7
204 Grain mill products.......... •.......................... 140. 04 144 .29 136. 20 134 .99 (*) 3. 14 3. 13 3. 02 2. 982041 Flour and other grain mill products . . . . _ 152 .10 152 .13 145.01 148.46 _ 3. 25 3 .2 3 3. 04 3. 082042 Prepared feeds for animals and fowls... _ 121 .58 129.05 123. 30 118 .88 - 2. 72 2. 74 2. 74 2. 63205 Bakery products............................................ 123. 91 122.71 122.61 114 .23 113 .83 3. 09 3. 06 3. 05 2. 87 2. 862051 Bread, cake, and related products........ - 1 23 .78 123. 91 116. 00 115 .31 - 3. 11 3. 09 2. 90 2. 892052 Cookies and crackers ............................ - 119.11 116 .28 108. 25 108. 90 - 2. 87 2. 85 2. 79 2 .7 5206 Sugar.............................................................. — 122.67 133 .08 114 .28 106 .47 _ 2. 90 3. 23 2. 67 2 .7 8207 Confectionery and related products.......... (* ) 101. 92 104 .14 97 .4 6 100. 28 (*) 2 .6 0 2. 61 2. 48 2 .4 72071 Confectionery products.......................... — 98. 03 9 9 .9 4 93. 75 96. 72 — 2. 52 2. 53 2 .4 1 2 .4 0208 Beverages .................................................... (*) 135 .63 138 .80 133 .87 132 .76 (*) 3 .4 6 3 .4 7 3. 33 3. 272082 Malt liquors.............................................. 178 .45 188.41 175 .07 171. 33 - 4 .4 5 4. 54 4. 27 4. 222086 Bottled and canned soft drinks.............. _ 100. 20 104.41 97. 75 99. 35 _ 2. 63 2. 63 2. 50 2 .4 9209 Misc. foods and kindred products.............. 124 .79 122. 35 122.01 118. 58 118 .02 2 .9 5 2. 92 2. 94 2. 81 2. 79
21 TOBACCO MANUFACTURES .......................... 99. 15 97. 02 98. 81 94. 50 92. 58 2. 63 2. 52 2. 54 2. 52 2. 38211 Cigarettes.................................................... - 117 .69 126.01 116.31 1 1 1 .75 - 3. 26 3 .2 9 3. 11 3. 07212 Cigars............................................................ - 81. 09 79. 25 78. 66 77. 39 - 2. 09 2. 08 2. 07 2. 01
22 TEXTILE MILL PRODUCTS ............................ 9 9 .2 2 98. 57 98. 81 93. 98 94. 21 2 .4 2 2 .4 1 2 .4 1 2. 27 2. 27221 Weaving mills, cotton.................................. 100. 19 100.67 100.19 9 3 .7 9 9 3 .7 9 2 .4 2 2 .4 2 2 .4 2 2. 26 2. 26222 Weaving mills, synthetics.......................... 106 .64 104 .48 105.22 101. 15 101. 36 2 .4 8 2 .4 7 2 .4 7 2. 32 2. 33223 Weaving and finishing mills, w oo l............ 1 02 .92 101 .76 101. 11 98. 47 9 9 .4 5 2 .4 8 2. 47 2 .4 6 2. 35 2. 34224 Narrow fabric mills...................................... 97. 20 98. 16 97. 34 90. 68 91. 35 2 .4 0 2. 40 2. 38 2. 25 2. 25225 Knitting m ills .............................................. 89. 78 87. 71 87. 94 86. 07 86. 33 2. 32 2 .2 9 2 .2 9 2. 19 2. 182251 Women’ s hosiery, except socks.............. - 86. 11 87 .4 6 86. 94 86. 72 - 2. 26 2. 26 2. 19 2. 192252 Hosiery, n e c .......................................... _ 80. 39 77. 54 75. 40 75. 98 _ 2. 11 2. 09 2. 00 2. 012253 Knit outerwear mills................................ _ 89. 52 89. 65 87. 02 88. 92 _ 2 .4 0 2 .4 1 2 .2 9 2. 282254 Knit underwear mills................................ _ 78. 60 79. 24 80. 78 81. 40 _ 2. 13 2. 13 2. 04 2. 04226 Textile finishing, except w oo l.................. 109 .62 107 .52 108. 29 104 .49 101 .46 2. 61 2. 56 2. 56 2. 43 2 .4 1227 Floor covering mills.................................... - 110 .52 109.86 9 9 .7 9 100 .69 - 2. 50 2 .4 8 2. 31 2. 32228 Yarn and thread mills.................................. 91. 58 91. 35 91. 76 87. 97 87. 77 2. 25 2. 25 2. 26 2. 13 2. 12229 Miscellaneous textile goods...................... 110. 77 111.41 1 1 1 .78 106 .68 106. 82 2. 65 2. 64 2. 63 2. 51 2. 49
23 APPAREL AND OTHER TEXTILE PRODUCTS • 83. 54 84. 84 84. 13 81. 36 82. 63 2. 34 2. 35 2 .3 5 2. 26 2 .2 7231 Men’ s and boys’ suits and coats................ 105 .74 104.51 104 .99 102 .64 1 03 .18 2. 85 2. 84 2. 83 2 .6 8 2 .6 8232 Men’ s and boys’ furnishings...................... (* ) 7 5 .4 8 74. 70 71. 74 71. 96 (*) 2. 04 2. 03 1 .96 1 .952321 Men's and boys’ shirts and nightwear . . 75. 78 74. 00 6 9 .4 8 6 9 .8 9 2. 01 2. 00 1 .9 3 1. 922327 Men’ s and boys’ separate trousers........ — 7 4 .4 2 73. 89 72. 54 72. 36 - 2. 05 2. 03 1 .9 5 1. 942328 Men's and boys’ work clothing .............. - 72. 30 71. 57 71. 04 70. 66 - 1 .97 1 .95 1 .9 2 1 .92233 Women’ s and misses’ outerwear.............. 82. 50 83. 58 84. 09 81. 22 83. 30 2. 50 2. 51 2. 51 2 .4 1 2 .4 52331 Women’s and misses’ Mouses and waists . . — 77. 13 74. 56 72. 16 71. 90 — 2. 21 2. 18 2. 11 2. 092335 Women's and misses’ dresses.............. _ 84. 56 83 .6 6 81. 42 84. 66 - 2. 61 2 .5 9 2 .4 9 2. 552337 Women’ s and misses’ suits and coats . . _ 93. 34 94 .9 2 91. 73 94. 73 _ 2. 82 2. 80 2. 73 2. 772339 Women’ s and misses’ outerwear, n e c . . _ 76. 30 77. 17 74. 76 74. 05 _ 2. 18 2. 18 2. 10 2. 08234 Women’ s and children’ s undergarments . . . 78. 26 78. 11 78. 32 74. 62 7 6 .4 3 2. 15 2. 14 2. 14 2. 05 2. 062341 Women’ s and children’ s underwear........ - 77. 28 76. 54 7 3 .2 0 75. 17 - 2. 10 2. 08 2. 00 2. 012342 Corsets and allied garments.................. _ 8 0 .6 8 81 .4 9 77. 90 79. 06 - 2 .2 6 2. 27 2. 17 2. 16235 Hats, caps, and millinery............................ _ 76. 30 77. 00 7 5 .4 7 7 5 .4 0 - 2. 18 2. 20 2. 12 2. 13236 Children’ s outerwear.................................... 76. 11 75. 33 75. 04 72. 42 74. 57 2. 15 2. 14 2. 15 2. 04 2. 062361 Children’ s dresses and blouses............ — 74. 20 72. 55 7 0 .9 9 7 2 .4 2 — 2. 12 2. 14 2. 04 2. 04237,8 Fur goods and miscellaneous apparel . . . . _ 90. 36 88. 92 85. 80 87. 95 - 2. 51 2 .4 7 2. 39 2. 39239 . Misc. fabricated textile products.............. 9 2 .6 9 9 2 .6 9 9 5 .59 93. 51 9 3 .6 0 2 .4 2 2. 42 2. 47 2 .4 1 2 .4 02391,2 Housefurnishings .................................... - 8 1 .6 9 80. 85 77. 18 77. 59 - 2. 10 2. 10 2. 01 2. 01
26 PAPER AND ALLIED PRODUCTS ................ 142 .10 142 .33 142.99 134 .78 134 .54 3. 32 3. 31 3. 31 3. 12 3. 10261,2,6 Paper and pulp mills.................................... 163. 02 163. 97 164.05 154 .22 153. 77 3 .6 8 3 .6 6 3 .6 7 3 .4 5 3 .4 4263 Paperboard mills........................................... 168 .14 164 .28 168.35 1 56 .50 154 .69 3 .7 2 3. 70 3. 70 3 .4 7 3 .4 3264 Misc. converted paper products................... 124.31 124 .09 124 .15 1 18 .14 117. 18 3. 01 2 .9 9 2. 97 2. 84 2 .8 12643 Bags, except textile bags.................... .. - 118 .12 116 .88 111 .87 109 .82 - 2 .8 6 2. 83 2. 67 2 .6 42652651,2
Paperboard containers and boxes . - ..........Folding and setup paperboard boxes . . .
127 .60 128 .52 117. 14
129 .44116 .44
122 .54 108 .39
123. 55 109 .03
3. 06 3. 06 2. 85
3. 06 2. 84
2. 89 2 .6 5
2. 88 2 .6 4
2653 Corrugated and solid fiber boxes.......... _ 139 .54 140. 83 133 .42 135 .86 - 3 .2 3 3. 23 3. 06 3 .0 62654 Sanitary food containers'......................... - 123. 37 123. 97 119 .55 119. 13 *- 2. 98 2. 98 2. 86 2. 85
See footnotes at end of table. NOTE: Data for the 2 most recent months are preliminary.
Digitized for FRASER http://fraser.stlouisfed.org/ Federal Reserve Bank of St. Louis

109 ESTABLISHMENT DATAHOURS AND EARNINGS
C-2: Gross hours an d earnings of production or nonsuperv isory w o rk e rs 1on p r iva te n o n a g r icu ltu ra l payrolls , by indus try --C ontinued
Average weekly hours Average overtime 1hours
CodeIndustry Nov.
1969Oct.1969
Sept.1969
Nov.1968
— U£T.— 1968
NOV.1969
UcT. 1969
sept.1969
NOV.1968
(Jet.1968
20 2
Nondurable Goods--ContinuedFOOD AND KINDRED PRODUCTS -Continued
Dairy products............................................... 41. 5 41.4 41. 8 41. 7 41. 9 3. 8 4. 2 3. 7 3. 92 0 2 4 Ice cream and frozen desserts.............. - 39.5 40. 8 39. 1 40.4 - - — - —2 0 2 6 Fluid milk................................................... - 41. 7 42. 1 42. 2 42. 5 - - - - *■*20 3 Canned, cured, and frozen foods............. - 39. 2 42. 0 37. 6 39. 7 - 3. 3 5. 2 3. 2 3. 72 0 3 1 ,6 Canned, cured and frozen sea foods . - 37.6 36. 7 34. 0 36. 3 - - - - -2 0 3 2 ,3 Canned food, except sea fo o d s ........... - 39. 3 43. 7 37. 9 40. 7 - - - - -2 0 3 7 Frozen fruits and v e g e ta b le s .............. — 40. 4 40.6 39.6 39. 6 — - - - -2 0 4 Grain mill products...................................... ( * ) 44. 6 46. 1 45. 1 45. 3 - 7. 0 8. 1 7. 0 7. 62041 Flour and other train mill product 46. 8 47. 1 47. 7 48. 2 - - - - -2 0 4 2 Prepared feeds for animals and fowls - 44. 7 47. 1 45. 0 45. 2 - - - - -205 Bakery products............................................. 40. 1 40. 1 40. 2 39. 8 39. 8 - 4. 3 4. 1 3.6 3. 52051 Bread, cake, and related products . . . - 39. 8 40. 1 40. 0 39.9 - - - - -2 0 5 2 Cookies and crackers............. - 41. 5 40. 8 38. 8 39.6 - — - - —20 6 Sugar............................. - 42. 3 41. 2 42. 8 38. 3 - 4. 1 5. 3 3. 1 2. 8207 Confectionery and related products . . . . (*) 39. 2 39.9 39. 3 40. 6 - 2.9 3. 0 2. 8 3.42 0 71 Confectionery products............ — 38. 9 39.5 38. 9 40. 3 — - - - -20 8 Beverages......................... (*) 39.2 40. 0 40. 2 40. 6 — 3. 0 3. 8 3. 2 3.42 0 8 2 Malt liq u ors ............................................... 40. 1 41. 5 41. 0 40. 6 ~ _ ~ ~2 0 8 6 Bottled and canned soft drinks........... — 38. 1 39. 7 39. 1 39.9 - — - - -20 9 Misc. foods and kindred products........... 42. 3 41. 9 41. 5 42. 2 42. 3 ~ 5. 1 4. 7 5. 3 5. 1
21 TOBACCO MANUFACTURES........................... 37.7 38. 5 38. 9 37. 5 38. 9 - 1.4 1. 9 1.4 1. 6211 Cigarettes........................................................ — 36. 1 38. 3 37.4 36.4 . 7 2. 3 1. 1 . 721 2 C igars.............................................................. 38. 8 38. 1 38. 0 38. 5 1. 7 1. 2 1. 7 1.6
22 TEXTILE MILL PRODUCTS............................. 41. 0 40. 9 41. 0 41.4 41. 5 _ 3. 9 4. 1 4. 3 4. 3221 Weaving mills, cotton .................................. 41.4 41. 6 41.4 41. 5 41. 5 — 4. 4 4. 5 4. 3 4. 3222 Weaving mills, syn thetics......................... 43. 0 42. 3 42. 6 43. 6 43. 5 4.4 4.9 5. 7 5. 722 3 Weaving and finishing mills, w o o l......... 41. 5 41. 2 41. 1 41. 9 42. 5 — 3. 7 3. 7 4.4 4. 622 4 Narrow fabric mills .................................... 40. 5 40. 9 40. 9 40. 3 40. 6 — 3. 7 3. 5 3. 8 3. 322 5 Knitting m ills................................................. 38. 7 38. 3 38.4 39. 3 39.6 2.6 2. 8 3. 0 3. 122 51 Women’ s hosiery, except socks........... — 38. 1 38. 7 39. 7 39.6 — — - - -2 2 5 2 H osiery,nec ............................................. — 38. 1 37. 1 37. 7 37. 8 •-* - -2 2 5 3 Knit outerwear m ills ............................... — 37. 3 37.2 38. 0 39. 0 — - — - -2 2 5 4 Knit underwear m ills............................... — 36. 9 37. 2 39.6 39. 9 — — - -22 6 Textile finishing, except w o o l.................. 42. 0 42. 0 42. 3 43. 0 42. 1 4. 8 5. 2 5. 6 4. 722 7 Floor covering m ills .................................... — 44. 2 44. 3 43. 2 43. 4 6. 0 6.5 5. 5 5.62 2 8 Yam and thread m ills .................................. 40. 7 40. 6 40. 6 41. 3 41.4 — 3. 7 3. 9 4. 3 4. 222 9 Miscellaneous textile g o o d s .................... 41. 8 42. 2 42. 5 42. 5 42. 9 4. 7 4.9 4. 6 4. 9
23 APPAREL AND OTHER TEXTILE PRODUCTS 35. 7 36. 1 35. 8 36. 0 36.4 — 1. 4 1. 4 1. 5 1. 5231 Men’ s and boys’ suits and c o a t s ........... 37. 1 36. 8 37. 1 38. 3 38. 5 — 1.4 1. 3 1.7 1. 923 2 Men’ s and boys’ furnishings.................... (*) 37. 0 36.8 36.6 36.9 - 1. 3 1. 2 1. 1 1. 223 21 Men’ s and boys’ shirts and nightwear i- 37. 7 37. 0 36. 0 36.4 — - — — —2 3 2 7 Men’ s and boys’ separate trousers . . . - 36. 3 36.4 37. 2 37. 3 — — - — -2 3 2 8 Men’ s and boys* work cloth in g ........... — 36. 7 36. 7 37. 0 36. 8 — — — — —23 3 Women’ s and m isses’ outerwear............. 33. 0 33. 3 33. 5 33. 7 34. 0 — 1. 1 1. 1 1. 2 1. 123 31 Women’ s and misses’ blouses and waists _ 34. 9 34. 2 34. 2 34.4 _ _ _ _ _2 3 3 5 Women’ s and m isses’ dresses ............. — 32.4 32. 3 32. 7 33. 2 - - - - -2 3 3 7 Women’ s and m isses’ suits and coats - 33. 1 33. 9 33. 6 34. 2 — - - - —2 3 3 9 Women’ s and m isses’ outerwear, n e c — 35. 0 35.4 35. 6 35. 6 _ _ _ _ _23 4 Women’ s and children’ s undergarments . 36.4 36. 5 36.6 36.4 37. 1 - 1. 5 1. 5 1. 6 1.42341 Women’ s and children’ s underwear.. . — 36. 8 36. 8 36.6 37.4 — — — — —2 3 4 2 Corsets and allied garm ents................ - 35. 7 35.9 35. 9 36. 6 - - - - -23 5 Hats, caps, and millinery........................... — 35. 0 35. 0 35.6 35.4 - . 9 .9 1. 0 1. 123 6 Children’ s ou terw ear................................. 35.4 35. 2 34. 9 35. 5 36. 2 - 1. 3 1. 0 1. 4 1. 423 61 Children’ s dresses and b lo u se s ......... - 35. 0 33. 9 34. 8 35. 5 — — — — -2 3 7 ,8 Fur goods and miscellaneous apparel . . — 36. 0 36. 0 35. 9 36. 8 — 1. 5 1. 3 1. 5 1. 523 9 Misc. fabricated textile products........... 38. 3 38. 3 38.7 38. 8 39. 0 _ 2.2 2. 6 3. 0 2.92 3 9 1 ,2 H ousefum ishings.................................... ~ 38. 9 38. 5 38.4 38. 6 “ ~ - —
26 PAPER AND ALLIED PRODUCTS................ 42. 8 43. 0 43.2 43. 2 43.4 _ 5.6 5. 8 5. 7 5. 72 6 1 ,2 ,6 Paper and pulp m i l l s ................................. 44. 3 44. 8 44. 7 44. 7 44. 7 - 6. 7 6. 7 6. 7 6.626 3 Paperboard m ills ........................................... 45. 2 44.4 45. 5 45. 1 45. 1 - 7. 6 8. 0 7. 9 7. 426 4 Misc. converted paper products................ 41. 3 41. 5 41. 8 41. 6 41.7 - 4. 2 4. 3 4. 3 4. 22 6 4 3 Bags, except textile b a g s .................... — 41. 3 41. 3 41. 9 41. 6 - - - - -265 Paperboard containers and b o x e s ........... 41. 7 42. 0 42. 3 42 . 4 42. 9 - 5. 0 5.4 5. 0 5.42 6 5 1 ,2 Folding and setup paperboard boxes . — 41. 1 41. 0 40. 9 41. 3 - — - - -2 6 5 3 Corrugated and solid fiber boxes . . . . - 43. 2 43.6 43.6 44.4 - - — - -2 6 5 4 Sanitary food containers ...................... - 41. 4 41. 6 41. 8 41. 8 - — - - -
See footnotes at end of table. NOTE: Data for the 2 most recent months are preliminary.
Digitized for FRASER http://fraser.stlouisfed.org/ Federal Reserve Bank of St. Louis
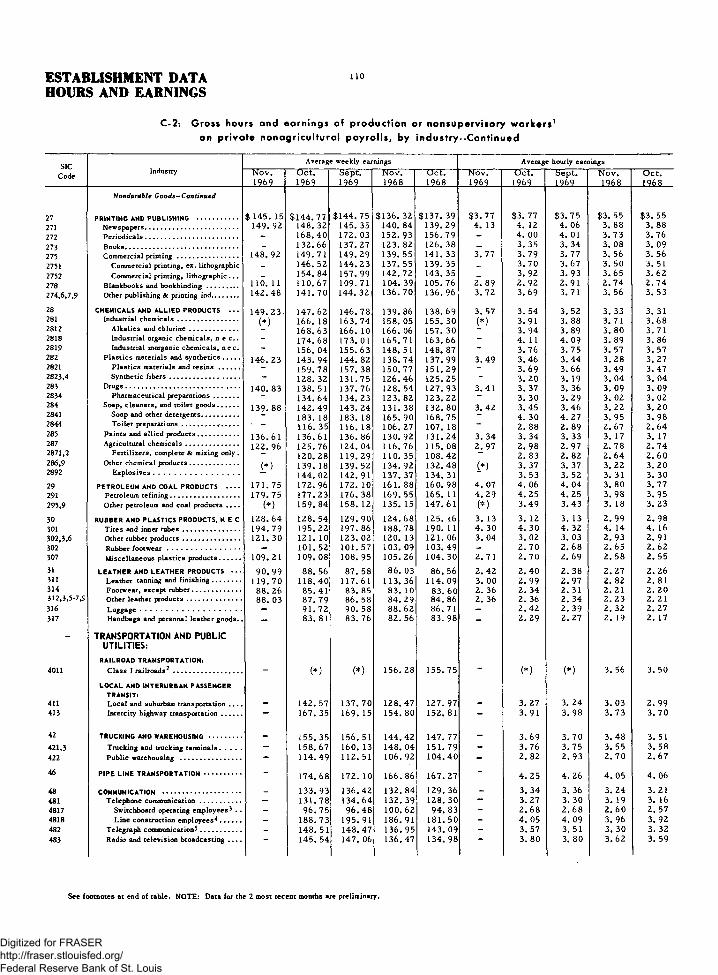
ESTABLISHMENT DATAHOURS AND EARNINGS
no
C-2: Gross hours and earn ings of p roduc tion or nonsuperv isory w o rk e rs 1on p r iv a te no nagr icu itura l payro l ls , by in d u s try—Continued
SICAverage weekly earnings Average hourly earnings
CodeIndustry N o v ,
1 9 6 9O c t .1 9 6 9
S e p t .1 9 6 9
N o v .
1 9 6 8O c t .1 9 6 8
N o v .
1 9 6 9O c t .
1 9 6 9S e p t . I 1 9 6 9
N o v .
1 9 6 8O c t .1 9 6 8
27
Nondurable Goods—Continued
PRINTING AND PUBLISHING ....................... $ 1 4 6 . 1 6 $ 1 4 4 . 7 7 $ 1 4 4 . 7 5 $ 1 3 6 . 3 2 $ 1 3 7 . 3 9 $ 3 . 7 7 $ 3 . 7 7 $ 3 . 7 5 $ 3 . 5 5 $ 3 . 5 5
271 Newspapers................................................... 1 4 9 . 9 2 1 4 8 . 3 2 1 4 5 . 3 5 1 4 0 . 8 4 1 3 9 . 2 9 4 . 1 3 4 . 1 2 4 . 0 6 3 . 8 8 3 . 8 8
2 7 2 P eriod ica ls................................................... - 1 6 8 . 4 0 1 7 2 . 0 3 1 5 2 . 9 3 1 5 6 . 7 9 - 4 . 0 0 4 . 0 1 3 . 7 3 3 . 7 6
2 7 3 _ 1 3 2 . 6 6 1 3 7 . 2 7 1 2 3 . 8 2 1 2 6 . 3 8 _ 3 . 3 5 3 . 3 4 3 . 0 8 3 . 0 9
2 7 5 Commercial p rin ting .................................. 1 4 8 . 9 2 1 4 9 . 7 1 1 4 9 . 2 9 1 3 9 . 5 5 1 4 1 . 3 3 3 . 7 7 3 . 7 9 3 . 7 7 3 . 5 6 3 . 5 6
2 751 Commercial printing, ex. lithographic _ 1 4 6 . 5 2 1 4 4 . 2 3 1 3 7 . 5 5 1 3 9 . 3 5 _ 3 . 7 0 3 . 6 7 3 . 5 0 3 . 5 1
2 7 5 2 Commercial printing, lithographic. . . _ 1 5 4 . 8 4 1 5 7 . 9 9 1 4 2 . 7 2 1 4 3 . 3 5 _ 3 . 9 2 3 . 9 3 3 . 6 5 3 . 6 2
2 7 8 1 1 0 . 11 1 1 0 . 6 7 1 0 9 . 7 1 1 0 4 . 3 9 1 0 5 . 7 6 2 . 8 9 2 . 9 2 2 . 9 1 2 . 7 4 2 . 7 4
2 7 4 ,6 ,7 ,9 Other publishing & printing ind............... 1 4 2 . 4 8 1 4 1 . 7 0 1 4 4 . 3 2 1 3 6 . 7 0 1 3 6 . 9 6 3 . 7 2 3 . 6 9 3 . 7 1 3 . 5 6 3 . 5 3
28 CHEMICALS AND ALLIED PRODUCTS • • . 1 4 9 . 2 3 . 1 4 7 . 6 2 1 4 6 . 7 8 1 3 9 . 8 6 1 3 8 . 6 9 3 . 5 7 3 . 5 4 3 . 5 2 3 . 3 3 3 . 3 1281 Industrial ch em ica ls.................................. (*) 1 6 6 . 1 8 1 6 3 . 7 4 1 5 8 . 0 5 1 5 5 . 3 0 (*) 3 . 9 1 3 . 8 8 3 . 7 1 3 . 6 82 8 1 2 Alkalies and ch lorin e ........................... 1 6 8 . 6 3 1 6 6 . 1 0 1 6 6 . 0 6 1 5 7 . 3 0 3 . 9 4 3 . 8 9 3 . 8 0 3 . 7 12 8 1 8 Industrial organic chemicals, n e c . . - 1 7 4 . 6 8 1 7 3 . 0 1 1 6 5 . 7 1 1 6 3 . 6 6 - 4 . 11 4 . 0 9 3 . 8 9 3 . 8 62 8 1 9 Industrial inorganic chemicals, n e c . - 1 5 6 . 0 4 1 5 5 . 6 3 1 4 8 . 5 1 1 4 8 . 8 7 - 3 . 7 6 3 . 7 5 3 . 5 7 3 . 5 72 8 2 P lastics materials and synthetics......... 1 4 6 . 2 3 1 4 3 . 9 4 1 4 4 . 8 2 1 3 8 . 7 4 1 3 7 . 9 9 3 . 4 9 3 . 4 6 3 . 4 4 3 . 2 8 3 . 2 72821 Plastics materials and r e s in s ............ - 1 5 9 . 7 8 1 5 7 . 3 8 1 5 0 . 7 7 1 5 1 . 2 9 - 3 . 6 9 3 . 6 6 3 . 4 9 3 . 4 72 8 2 3 ,4 Synthetic f ib e r s ....................................... - 1 2 8 . 3 2 1 3 1 . 7 5 1 2 6 . 4 6 1 2 5 . 2 5 - 3 . 2 0 3 . 1 9 3 . 0 4 3 . 0 4283 Drugs................................................................ 1 4 0 . 8 3 1 3 8 . 5 1 1 3 7 . 7 6 1 2 8 . 5 4 1 2 7 . 9 3 3 . 4 1 3 . 3 7 3 . 3 6 3 . 0 9 3 . 0 92 8 3 4 Pharmaceutical preparations.............. - 1 3 4 . 6 4 1 3 4 . 2 3 1 2 3 . 8 2 1 2 3 . 2 2 - 3 . 3 0 3 . 2 9 3 . 0 2 3 . 0 22 8 4 Soap, cleaners, and toilet g o o d s ............ 1 3 9 . 8 8 1 4 2 . 4 9 1 4 3 . 2 4 1 3 1 . 3 8 1 3 2 . 8 0 3 . 4 2 3 . 4 5 3 . 4 6 3 . 2 2 3 . 2 02 841 Soap and other detergents..................... 1 8 3 . 1 8 1 8 3 . 1 8 1 6 5 . 9 0 1 6 8 . 7 5 - 4 . 3 0 4 . 2 7 3 . 9 5 3 . 9 82 8 4 4 Toilet preparations.................. ............ • ~ 1 1 6 . 3 5 1 1 6 . 1 8 1 0 6 . 2 7 1 0 7 . 1 8 ~ 2 . 8 8 2 . 8 9 2 . 6 7 2 . 6 4285 Paints and allied products....................... 1 3 6 . 6 1 1 3 6 . 6 1 1 3 6 . 8 6 1 3 0 . 9 2 1 3 1 . 2 4 3 . 3 4 3 . 3 4 3 . 3 3 3 . 1 7 3 . 172 8 7 Agricultural ch em ica ls............................. 1 2 2 . 9 6 1 2 5 . 7 6 1 2 4 . 0 4 1 1 6 . 7 6 1 1 5 . 0 8 2 . 9 7 2 . 9 8 2 . 9 7 2 . 7 8 2 . 7 42 8 7 1 ,2 Fertilizers, complete & mixing only . 1 2 0 . 2 8 1 1 9 . 2 9 1 1 0 . 3 5 1 0 8 . 4 2 - 2 . 8 3 2 . 8 2 2 . 6 4 2 . 6 02 8 6 ,9 Other chemical products........................... 1 3 9 . 1 8 1 3 9 . 5 2 1 3 4 . 9 2 1 3 2 . 4 8 i*) 3 . 3 7 3 . 3 7 3 . 2 2 3 . 2 02 8 9 2 E x plosives................................................ 1 4 4 . 0 2 1 4 2 . 9 1 1 3 7 . 3 7 1 3 4 . 3 1 3 . 5 3 3 . 5 2 3 . 3 1 3 . 3 0
2 9 PETROLEUM AND COAL PRODUCTS ------ 1 7 1 . 7 5 1 7 2 . 9 6 1 7 2 . 1 0 1 6 1 . 8 8 1 6 0 . 9 8 4 . 0 7 4 . 0 6 4 . 0 4 3 . 8 0 3 . 7 7291 Petroleum refining........... .......................... 1 7 9 . 7 5 1 7 7 . 2 3 1 7 6 . 3 8 1 6 9 . 5 5 1 6 5 . 11 4 . 2 9 4 . 2 5 4 . 2 5 3 . 9 8 3 . 9 5
2 9 5 ,9 Ocher petroleum and coal products . . . . (*) 1 5 9 . 8 4 1 5 8 . 1 2 1 3 5 . 1 5 1 4 7 . 6 1 (*) 3 . 4 9 3 . 4 3 3 . 1 8 3 . 2 3
3 0 RUBBER AND PLASTICS PRODUCTS, N E C 1 2 8 . 6 4 1 2 8 . 5 4 1 2 9 . 9 0 1 2 4 . 6 8 1 2 5 . 16 3 . 1 3 3 . 1 2 3 . 1 3 2 . 9 9 2 . 9 8301 Tires and inner tu b e s ................................ 1 9 4 . 7 9 1 9 5 . 2 2 1 9 7 . 8 6 1 8 8 . 7 8 1 9 0 . 1 1 4 . 3 0 4 . 3 0 4 . 3 2 4 . 1 4 4 . 1 63 0 2 ,3 ,6 Other rubber products............................... 1 2 1 . 3 0 1 2 1 . 1 0 1 2 3 . 0 2 1 2 0 . 1 3 1 2 1 . 0 6 3 . 0 4 3 . 0 2 3 . 0 3 2 . 9 3 2 . 9 13 0 2 Rubber fo o tw e a r ......................................... — 1 0 1 . 5 2 1 0 1 . 5 7 1 0 3 . 0 9 1 0 3 . 4 9 - 2 . 7 0 2 . 6 8 2 . 6 5 2 . 6 23 0 7 Miscellaneous plastics products............ 1 0 9 . 2 1 1 0 9 . 0 8 1 0 8 . 9 5 1 0 5 . 2 6 1 0 4 . 3 0 2 . 7 1 2 . 7 0 2 . 6 9 2 . 5 8 2 . 5 5
31 LEATHER AND LEATHER PRODUCTS •• • 9 0 . 9 9 8 8 . 5 6 8 7 . 5 8 8 6 . 0 3 8 6 . 5 6 2 . 4 2 2 . 4 0 2 . 3 8 2 . 2 7 2 . 2 6311 Leather tanning and finishing................ 1 1 9 . 7 0 1 1 8 . 4 0 1 1 7 . 6 1 1 1 3 . 3 6 1 1 4 . 0 9 3 . 0 0 2 . 9 9 2 . 9 7 2 . 8 2 2 . 8 13 1 4 Footwear, except rubber......... .. 8 8 . 2 6 8 5 . 4 1 8 3 . 8 5 8 3 . 1 0 8 3 . 6 0 2 . 3 6 2 . 3 4 2 . 3 1 2 . 2 1 2 . 2 03 1 2 ,3 ,5 -7 ,9 Other leather products.............................. 8 8 . 0 3 8 7 . 7 9 8 6 . 5 8 8 4 . 2 9 8 4 . 8 6 2 . 3 6 2 . 3 6 2 . 3 4 2 . 2 3 2 . 2 13 1 6 Luggage ......................................................... — 9 1 . 7 2 9 0 . 5 8 8 8 . 6 2 8 6 . 7 1 - 2 . 4 2 2 . 3 9 2 . 3 2 2 . 2 73 1 7 Handbags and personal leather g o o d s .. - 8 3 . 8 1 8 3 . 7 6 8 2 . 5 6 8 3 . 9 8 - 2 . 2 9 2 . 2 7 2 . 1 9 2 . 1 7
40 1 1
TRANSPORTATION AND PUBLIC U TILITIES:
RAILROAD TRANSPORTATION:Class I railroads2 ...................................... (*) (*) 1 5 6 . 2 8 1 5 5 . 7 5 (*) (*) 3 . 5 6 3 . 5 0
411
LOCAL AND INTERURBAN PASSENGER TRANSIT:L ocal and suburban transportation . . . . 1 4 2 . 5 7 1 3 7 . 7 0 1 2 8 . 4 7 1 2 7 . 91 3 . 2 7 3 . 2 4 3 . 0 3 2 . 9 9
4 1 3 Intercity highway transportation........... — 1 6 7 . 3 5 1 6 9 . 1 5 1 5 4 . 8 0 1 5 2 . 8 1 - 3 . 9 1 3 . 9 8 3 . 7 3 3 . 7 0
42 TRUCKING AND WAREHOUSING .................. - 1 5 5 . 3 5 1 5 6 . 5 1 1 4 4 . 4 2 1 4 7 . 7 7 - 3 . 6 9 3 . 7 0 3 . 4 8 3 . 5 1421,3 Trucking and trucking terminals............ — 1 5 8 . 6 7 1 6 0 . 1 3 1 4 8 . 0 4 1 5 1 . 7 9 - 3 . 7 6 3 . 7 5 3 . 5 5 3 . 5 84 2 2 Public warehousing .................................. - 1 1 4 . 4 9 1 1 2 . 5 1 1 0 6 . 9 2 1 0 4 . 4 0 - 2 . 8 2 2 . 9 3 2 . 7 0 2 . 6 7
4 6 PIPE LINE TRANSPORTATION..................... - 1 7 4 . 6 8 1 7 2 . 1 0 1 6 6 . 8 6 1 6 7 . 2 7 - 4 . 2 5 4 . 2 6 4 . 0 5 4 . 0 6
48 COMMUNICATION ........................................... _ 1 3 3 . 9 3 1 3 6 . 4 2 1 3 2 . 8 4 1 2 9 . 3 6 - 3 . 3 4 3 . 3 6 3 . 2 4 3 . 2 14 8 1 Telephone com m unication....................... — 1 3 1 . 7 8 1 3 4 . 6 4 1 3 2 . 3 9 1 2 8 . 3 0 — 3 . 2 7 3 . 3 0 3 . 1 9 3 . 164817 Switchboard operating em ployees3 . . - 9 6 . 7 5 9 6 . 4 8 1 0 0 . 6 2 9 4 . 8 3 - 2 . 6 8 2 . 6 8 2 . 6 0 2 . 5 74818 Line construction em ployees^............ - 1 8 8 . 7 3 1 9 5 . 9 1 1 8 6 . 9 1 1 8 1 . 5 0 - 4 . 0 5 4 . 0 9 3 . 9 6 3 . 9 24 8 2 Telegraph communication 5 ....................... - 1 4 8 . 5 1 1 4 8 . 4 7 1 3 6 . 9 5 1 4 3 . 0 9 - 3 . 5 7 3 . 5 1 3 . 3 0 3 . 3 24 8 3 Radio and television broadcasting . . . .
"1 4 5 . 5 4 1 4 7 . 0 6 1 3 6 . 4 7 1 3 4 . 9 8 3 . 8 0 3 . 8 0 3 . 6 2 3 . 5 9
See footnotes at end of table. NOTE: Data for the 2 most recent months are preliminary.
Digitized for FRASER http://fraser.stlouisfed.org/ Federal Reserve Bank of St. Louis

I l l ESTABLISHMENT DATAHOURS AND EARNINGS
C -2 : G ro s s hours an d e a r n in g s o f p r o d u c t io n o r n o n s u p e rv is o r y w o r k e r s 1on p r iv a t e n o n a g r ic u l t u r a l p a y r o l l s , by in d u s t r y - - C o n t i n u e d
SICIndustry
Average weekly hours Average overtime hoursCode N o v .
1 9 6 9O c t .1 9 6 9
S e p t .1 9 6 9
N o v .1 9 6 8
O c t .1 9 6 8
N o v .1 9 6 9
O c t .1 9 6 9
u)6pt«1 9 6 9
N o v .1 9 6 8
O c t .1 9 6 8
27
Nondurable G o o d s—Con tin u ed
PRINTING AND PUBLISHING.................... 3 8 . 5 3 8 . 4 3 8 .6 3 8 . 4 3 8 . 7 3 . 5 3 . 9 3 . 3 3 . 4271 3 6 . 3 3 6 . 0 3 5 . 8 3 6 . 3 3 5 . 9 3 . 1 2 . 9 2 . 9 2 . 9272 Periodicals...................................................... _ 4 2 . 1 4 2 . 9 4 1 . 0 4 1 . 7 _ 5 . 6 6 . 3 4 . 6 5 . 2273 Books .............................................................. 3 9 . 6 4 1 . 1 4 0 . 2 4 0 . 9 _ 3 . 4 4 . 1 3 . 3 3 . 2275 Commercial printing.................................... 3 9 . 5 3 9 . 5 3 9 . 6 3 9 . 2 3 9 . 7 _ 4 . 0 4 . 6 3 . 6 4 . 02751 Commercial printing, ex. lithographic _ 3 9 . 6 3 9 . 3 3 9 . 3 3 9 . 7 _ _ _ _ _2752 Commercial printing, lithographic . . . _ 3 9 . 5 4 0 . 2 3 9 . 1 3 9 . 6 - - - - _278 Blankbooks and bookbinding.................... 3 8 . 1 3 7 . 9 3 7 . 7 3 8 . 1 3 8 . 6 _ 2 . 6 2 . 8 2 . 2 2 . 22 7 4 ,6 ,7 ,9 Other publishing & printing ind.............. 3 8 . 3 3 8 . 4 3 8 . 9 3 8 . 4 3 8 . 8 - 3 . 0 3 . 4 3 . 2 3 . 1
28 CHEMICALS AND ALLIED PRODUCTS.. 4 1 . 8 4 1 . 7 4 1 . 7 4 2 . 0 4 1 . 9 3 . 4 3 . 5 3 . 4 3 . 4
281 Industrial chem icals.................................... ( * ) 4 2 . 5 4 2 . 2 4 2 . 6 4 2 . 2 3 .9 3 . 8 3 .7 3 . 72812 Alkalies and chlorine........................... .. _ 4 2 . 8 4 2 . 7 4 3 . 7 4 2 . 4 _ _ _ _ _2818 Industrial organic chemicals, n e c . . . _ 4 2 . 5 4 2 . 3 4 2 . 6 4 2 . 4 _ _ _ _ _2819 Industrial inorganic chemicals, n e c . _ 4 1 . 5 4 1 . 5 4 1 . 6 4 1 . 7 _ _ _ _ _282 Plastics materials and synthetics......... 4 1 . 9 4 1 . 6 4 2 . 1 4 2 . 3 4 2 . 2 _ 3 . 0 3 . 0 3 . 0 3 . 22821 Plastics materials and res ins.............. _ 4 3 . 3 4 3 . 0 4 3 . 2 4 3 . 6 _ _ _ _ _2823,4 Synthetic fibers........................................ _ 4 0 . 1 4 1 . 3 4 1 . 6 4 1 . 2 _ _ _ _ _283 Drugs .............................................................. 4 1 . 3 4 1 . 1 4 1 . 0 4 1 . 6 4 1 . 4 - 3 . 3 3 . 3 3 . 4 3 . 22834 Pharmaceutical preparations................ - 4 0 . 8 4 0 . 8 4 1 . 0 4 0 . 8 - - - - -
284 Soap, cleaners, and toilet goods.............. 4 0 . 9 4 1 . 3 4 1 . 4 4 0 . 8 4 1 . 5 - 3 . 5 3 . 7 3 . 0 3 . 52841 Soap and other detergents.................... _ 4 2 . 6 4 2 . 9 4 2 . 0 4 2 . 4 - - - - -
2844 Toilet preparations.................. . . ............ - 4 0 . 4 4 0 . 2 3 9 . 8 4 0 . 6 - - - - -
285 Paints and allied products......................... 4 0 . 9 4 0 . 9 4 1 . 1 4 1 . 3 4 1 . 4 _ 3 . 1 3 . 4 2 . 9 3 . 4287 Agricultural chem icals............................... 4 1 . 4 4 2 . 2 4 2 . 1 4 2 . 0 4 2 . 0 - 4 . 1 3 . 9 3 . 6 3 . 72871,2 Fertilizers, complete & mixing o n ly .. _ 4 2 . 5 4 2 . 3 4 1 . 8 4 1 . 7 - - - - -286,9 Other chemical p rodu cts........................... ( * ) 4 1 . 3 4 1 . 4 4 1 . 9 4 1 . 4 - 2 . 8 3 . 3 4 . 0 3 . 22892 E x p losives ................................................. 4 0 . 8 4 0 . 6 4 1 . 5 4 0 . 7 - - - - -
29 PETROLEUM AND COAL PRODUCTS........... 4 2 . 2 4 2 . 6 4 2 . 6 4 2 . 6 4 2 . 7 - 4 . 1 4 . 3 3 . 8 4 . 0
291 Petroleum refining........................................ 4 1 . 9 4 1 . 7 4 1 . 5 4 2 . 6 4 1 . 8 - 3 . 0 3 . 1 3 . 2 2 . 9
295,9 Other petroleum and coal products......... ( * ) 4 5 . 8 4 6 . 1 4 2 . 5 4 5 . 7 - 7 . 8 8 . 1 5 . 9 7 . 8
30 RUBBER AND PLASTICS PRODUCTS, NEC.. 4 1 . 1 4 1 . 2 4 1 . 5 4 1 . 7 4 2 . 0 - 4 . 4 4 . 5 4 . 5 4 . 5
301 Tires and inner tubes.................................. 4 5 . 3 4 5 . 4 4 5 . 8 4 5 . 6 4 5 . 7 - 7 . 8 7 . 9 7 . 1 7 . 1302, 3, 6 Other rubber products ................................ 3 9 . 9 4 0 . 1 4 0 . 6 4 1 . 0 4 1 . 6 - 3 . 2 3 . 5 3 . 7 3 . 8302 Rubber fo o tw e a r .......................................... - 3 7 . 6 3 7 . 9 3 8 . 9 3 9 . 5 - 2 . 1 1. 8 2 . 4 2 . 1307 Miscellaneous plastics p ro d u cts ........... 4 0 . 3 4 0 . 4 4 0 . 5 4 0 . 8 4 0 . 9 - 3 . 8 3 . 8 4 . 1 4 . 1
31 LEATHER AND LEATHER PRODUCTS......... 3 7 . 6 3 6 . 9 3 6 . 8 3 7 . 9 3 8 . 3 - 1. 8 1. 8 2 . 0 2 . 0311 Leather tanning and finishing......... .. 3 9 . 9 3 9 . 6 3 9 . 6 4 0 . 2 4 0 . 6 3 . 4 3 .6 3 .7 3 . 6314 Footwear, except rubber............................. 3 7 . 4 3 6 . 5 3 6 . 3 3 7 . 6 3 8 . 0 ~ 1 .6 1. 5 1. 6 1. 6312,3,5-7 ,9 Other leather products................................ 37._3 3 7 . 2 3 7 . 0 3 7 . 8 3 8 . 4 1. 9 2 . 2 2 . 5 2 . 6316 Luggage ......................................................... 3 7 . 9 3 7 . 9 3 8 . 2 3 8 . 2 - 2 . 8 3 . 1 3 . 0 3 . 3317 Handbags and personal leather goods . . “ 3 6 . 6 3 6 . 9 3 7 . 7 3 8 . 7 - 1. 6 2 . 0 2 . 6 2 . 5
4011
TRAN SPO RTATION AND PUBLIC UTILITIES:RAILROAD TRANSPORTATION:
Class I railroads2 ...................................... ( * ) ( * ) 4 3 . 9 4 4 . 5
411
LOCAL AND INTERURBAN PASSENGER TRANSIT:Local and suburban transportation......... 4 3 . 6 4 2 . 5 4 2 . 4 4 2 . 8
413 Intercity highway transportation.............. ~ 4 2 . 8 4 2 . 5 4 1 . 5 4 1 . 3 — ~ — ~
42 TRUCKING AND WAREHOUSING.................... - 4 2 . 1 4 2 . 3 4 1 . 5 4 2 . 1 - - - - -421,3 Trucking and trucking term inals............ 4 2 . 2 4 2 . 7 4 1 . 7 4 2 . 4 —422 Public w arehousing.................................... - 4 0 . 6 3 8 . 4 3 9 . 6 3 9 . 1 - - - - -
46 PIPE LINE TRANSPORTATION....................... - 4 1 . 1 4 0 . 4 4 1 . 2 4 1 . 2 - - - - -
48 C O M M U N IC A T IO N .......................................................... - 4 0 . 1 4 0 . 6 4 1 . 0 4 0 . 3 - - - - -
481 T e le p h o n e c o m m u n ic a t i o n .............................. — 4 0 . 3 4 0 . 8 41. 5 4 0 . 6 - - - - -4817 S w itc h b o a r d o p e r a t in g e m p lo y e e s 5. . . — 3 6 . 1 3 6 . 0 3 8 . 7 3 6 . 9 - - — — —
4818 L in e c o n s t r u c t i o n e m p lo y e e s 4 .............. - 4 6 . 6 4 7 . 9 4 7 . 2 4 6 . 3 ~ ~ ~482 T e le g r a p h c o m m u n ic a t io n 5.............................. 4 1 . 6 4 2 . 3 4 1 . 5 4 3 . 1 - - - ~ ~483 R a d io a n d t e l e v i s i o n b r o a d c a s t i n g ............ 3 8 . 3 3 8 . 7 3 7 . 7 3 7 . 6 “
See footnotes at end of table. NOTE: Data for the 2 most recent months are preliminary.
Digitized for FRASER http://fraser.stlouisfed.org/ Federal Reserve Bank of St. Louis

4 9
4914 9 2
4 9 34 9 4 *
5 0
501
5 0 2
50 35 0 4
5 0 6
50 7
5 0 8
5 0 9
5 2 -5
53
53153 2
5 3 354
5 4 1 -
56
561
5 6 2
56 55 6 6
57
571
58
5 2 ,552
5 5 1 ,
5 5 3 ,59159459 8
6 0
61612626 363 16326 3 3
70 1
721
7 2 2
781
.ISHMENT DATAAND EARNINGS
112
C-2: Gross hours and earn ings of production or nonsuperv isory w o rk e rs 'on p r iva te no na gr icu itu ra l p a y ro l ls , by industry--Corft inued
A v e r a g e w e e k ly e a r n in g s A v e r a g e h o u r ly e a r n in g s
Industry N o v .1 9 6 9
O c t .1 9 6 9
S e p t .1 9 6 9
N o v .1 9 6 8
O c t .1 9 6 8
N o v .1 9 6 9
O c t .1 9 6 9
S e p t .1 9 6 9
N o v .1 9 6 8
O c t .1 9 6 8
TRANSPORTATION AND PUBLIC UTILITIES -C o n tin u e d
ELECTRIC, GAS, AND SANITARY SERVICES $ 1 6 6 .3 8 $ 1 6 4 . 7 4 $ 1 5 7 . 1 7 $ 1 5 5 . 0 8 $ 3 . 9 9 $ 3 . 96 $ 3 . 7 6 $ 3 . 71Electric companies and sy s te m s ........... - 1 6 8 .8 4 1 6 8 . 82 1 5 9 .6 8 1 5 6 .8 3 _ 4 . 02 4 . 01 3 . 82 3 . 77Gas companies and sy stem s.................... - 1 5 0 .8 4 1 4 8 .4 2 1 4 4 .7 0 1 4 4 . 9 0 _ 3 . 6 7 3 . 6 2 3 .4 7 3 .4 5Combination companies and systems . . . - 1 8 2 .6 8 1 7 8 . 87 1 7 1 .3 5 1 6 9 . 2 4 _ 4 . 36 4 . 31 4 . 07 4 . 02Water, steam, & sanitary sy s te m s ......... “ 1 3 4 .9 7 1 3 4 .8 9 1 2 7 . 20 1 2 7 .5 1 - 3 . 3 0 3 . 2 9 3 . 11 3 . 08
WHOLESALE AND RETAIL TRAD E........... $ 9 1 . 96 9 2 . 13 9 2 . 4 6 8 7 . 33 8 7 . 11 $ 2 . 6 2 2 . 61 2 . 5 9 2 . 4 6 2 . 4 4
WHOLESALE T R A D E .................................... 1 3 3 . 8 0 1 3 2 . 26 1 3 2 .5 9 1 2 4 .4 0 1 2 3 .8 2 3 . 32 3 .2 9 3 . 2 9 3 . 11 3 . 0 8Motor vehicles & automotive equipment. - 1 2 2 .6 1 1 2 3 . 8 2 1 1 8 .0 1 1 1 5 .3 6 - 3 . 02 3 . 0 2 2 . 8 3 2 . 8 0Drugs, chem icals, and allied products. . - 1 3 4 .4 1 1 3 4 . 7 0 1 2 4 . 2 3 1 2 3 .9 5 _ 3 .4 2 3 .4 1 3 . 21 3 . 17Dry goods and apparel.................................. - 1 2 2 .9 0 1 2 1 . 5 0 1 1 7 .3 1 1 1 7 .5 6 _ 3 . 2 6 3 . 2 4 3 . 12 3 . 11Groceries and related products................ - 1 2 2 .4 1 1 2 4 .7 5 1 1 5 .7 8 1 1 6 .9 7 _ 3 . 03 3 . 05 2 . 8 8 2 . 86Electrical goods............................................. - 1 3 4 . 6 0 1 3 6 .0 8 1 2 8 . 4 4 1 2 5 .9 7 _ 3 . 2 2 3 . 2 4 3 . 0 8 3 . 08Hardware; plumbing & heating equipment 1 2 6 .6 3 1 2 7 .4 3 1 2 1 . 5 0 1 2 1 . 6 0 - 3 . 15 3 1 . 7 3 . 0 3 3 . 01Machinery, equipment, and supplies. . . . - 1 4 7 .5 5 1 4 5 .2 0 1 4 1 . 8 0 1 4 0 . 4 2 - 3 .5 9 3 . 5 5 3 . 51 3 .4 5Miscellaneous wholesalers......................... - 1 3 3 .4 5 1 3 3 . 12 1 2 2 .5 3 1 2 1 . 6 6 - 3 . 37 3 . 37 3 . 11 3 . 0 8
RETAIL TRADE............................................... 7 8 . 7 3 7 8 . 6 2 7 9 . 6 9 7 5 . 7 0 7 5 . 4 6 2 . 35 2 . 34 2 . 33 2 . 2 2 2 . 2 0Retail general m erchandise....................... - 7 2 . 2 8 7 3 . 4 2 6 9 . 32 6 9 . 87 - 2 . 2 8 2 . 2 8 2 . 18 2 . 17
Department stores...................................... - 7 5 . 7 5 7 7 . 5 2 7 2 . 4 5 7 3 . 51 - 2 . 4 2 2 . 4 3 2 . 3 0 2 . 2 9Mail order h o u se s ...................................... - 8 4 . 37 8 7 . 2 4 7 9 . 55 7 9 . 33 - 2 . 39 2 .4 1 2 . 26 2 . 26Variety s to r e s ............................................. - 5 5 . 91 5 5 . 4 3 5 4 . 4 2 5 3 . 8 8 - 1. 87 1. 86 1. 82 1 .7 9
Food ^stores...................................................... - 8 2 . 8 8 8 4 . 30 7 8 . 81 7 8 . 4 9 - 2 . 5 9 2 . 57 2 . 4 4 2 . 4 3Grocery, meat, and vegetable stores . . - 8 4 . 10 8 6 . 13 8 0 . 03 7 9 . 38 - 2 . 6 2 2 . 6 1 2 . 4 7 2 . 4 5
Apparel and accessory s to r e s .................. - 6 8 . 89 6 9 . 4 4 6 5 . 21 6 5 . 6 2 - 2 . 18 2 . 17 2 . 07 2 . 07Men's & boys* clothing & furnishings . - 8 3 . 4 2 8 4 . 7 2 7 9 . 9 7 8 0 . 3 4 - 2 . 4 9 2 . 4 7 2 . 3 8 2 . 37Women’ s ready-to-wear s to r e s ................ - 6 2 . 2 2 6 2 . 51 5 9 . 14 5 9 . 4 0 - 2 . 02 2 . 01 1 .9 2 1 .9 1Family clothing stores............................. - 6 5 . 6 5 6 4 . 9 4 6 0 . 4 8 6 2 . 01 - 2 . 02 1. 9 8 1. 92 1 .9 5Shoe stores......... .......................................... - 6 9 . 0 8 7 0 . 7 6 6 6 . 5 8 6 5 . 6 2 - 2 . 2 8 2 . 2 9 2 . 19 2 . 18
Furniture and home furnishings stores . . - 1 0 6 . 0 2 1 0 5 .9 3 1 0 1 .4 1 9 9 . 9 1 - 2 . 85 2 . 8 4 2 . 6 9 2 . 6 5Furniture and home furnishings.............. — 1 0 5 .5 6 1 0 5 .7 5 1 0 1 . 0 4 9 9 . 9 1 - 2 . 8 3 2 . 8 2 2 . 6 8 2 . 6 5
Eating and drinking places ^ .................... - 5 4 . 56 5 5 . 8 3 5 2 . 8 0 5 3 . 4 5 - 1 .7 6 1. 7 5 1 .6 5 1 .6 6Other retail trade........................................... — 9 9 . 18 9 8 . 9 4 9 3 . 8 4 9 3 . 9 4 - 2 . 61 2 . 5 9 2 . 4 5 2 . 4 4
Building materials and farm equipment - 1 0 8 . 2 6 1 0 7 .3 3 1 0 1 .5 6 1 0 3 . 07 - 2 . 7 2 2 . 6 7 2 . 5 2 2 . 52Motor vehicle dealers................................ - 1 3 0 .0 6 1 2 7 .8 0 1 2 2 .2 5 1 2 1 . 7 2 - 3 . 18 3 . 14 2 . 96 2 . 9 4Other automotive & accessory dealers. - 1 1 0 . 5 4 1 1 0 . 2 4 1 0 3 . 5 7 1 0 0 . 91 - 2 . 6 7 2 . 6 5 2 . 4 6 2 . 4 2Drug stores and proprietary stores . . . - 7 2 . 13 7 2 . 13 6 8 . 5 8 6 8 . 02 — 2 . 2 4 2 . 2 4 2 . 11 2 . 0 8Book and stationery stores . . . . . . . 8 2 . 0 0 8 3 . 6 4 7 8 . 92 7 9 . 59 — 2 . 4 7 2 . 4 6 2 . 37 2 . 39Fuel and ice dealers.................................. — 1 1 6 .8 5 1 1 4 . 9 0 1 1 9 . 1 4 1 1 5 .7 9 - 2 . 85 2 . 8 3 2 . 8 3 2 . 77
FINANCE, INSURANCE, AND REAL ESTATE7 .......................................................... 1 1 1 . 15 1 0 9 .4 5 1 0 8 .4 1 1 0 3 .6 9 1 0 3 . 51 2 . 9 8 2 . 9 5 2 . 9 3 2 . 81 2 . 7 9
Banking............................................................. _ 9 8 . 9 5 9 8 . 5 8 9 4 . 86 9 4 . 0 0 _ 2 . 6 6 2 . 6 5 2 . 5 5 2 . 52Credit agencies other than b ank s............ - 1 0 1 . 0 4 9 9 . 11 9 4 . 7 5 9 4 . 38 _ 2 . 6 8 2 . 6 5 2 . 5 2 2 . 51
Savings and loan a ssoc ia tion s .............. - 9 7 . 8 4 9 6 . 0 5 9 2 . 0 0 9 2 . 87 _ 2 . 6 3 2 .6 1 2 . 5 0 2 . 51Security, commodity brokers & services . . _ 1 6 8 .5 2 1 7 0 . 5 4 1 6 9 . 3 4 1 7 0 . 2 5 4 . 5 3 4 . 56 4 . 5 4 4 . 5 4Insurance carr iers........................................ — 1 1 6 .4 9 1 1 4 .7 6 1 0 9 .3 7 1 0 8 . 9 3 _ 3 . 14 3 . 11 2 . 9 8 2 . 96
Life insurance.................................... ...... . _ 1 1 8 .9 9 1 1 6 . 96 1 0 8 . 8 9 1 0 8 .4 2 3 . 26 3 . 2 4 3 . 0 5 3 . 02Accident and health insurance.............. _ 1 0 3 . 09 1 0 0 . 91 9 5 . 8 3 9 5 . 21 _ 2 . 8 4 2 . 7 8 2 . 6 4 2 . 6 3Fire, marine, and casualty insurance. . - 1 1 7 .4 2 1 1 5 . 6 0 1 1 3 .0 2 1 1 2 . 9 4 _ 3 . 09 3 . 0 5 2 .9 9 2 . 9 8
SERVICES:Hotels and other lodging places:
Hotels, tourist courts, and motels * . . . 6 5 . 82 6 4 . 38 6 0 . 01 6 0 . 0 0 1. 87 1. 8 5 1 .7 0 1 .6 9Personal Services:
Laundries and dry cleaning plants . . . . _ 7 4 . 57 7 4 . 05 6 9 . 9 1 7 1 . 05 2 . 06 2 . 0 4 1. 91 1. 91Photographic s t u d io s .............................. - 8 7 . 61 8 6 . 2 5 8 4 . 6 7 8 2 . 0 4 - 2 . 33 2 . 35 2 . 27 2 . 26
Motion pictures:Motion picture filming & distributing . . - 1 8 5 .4 7 1 8 4 .6 1 1 7 0 . 14 1 7 1 .7 2 - 4 . 66 4 . 6 5 4 . 16 4 . 2 4
f o r th e 2 m o s t r e c e n t m o n th s a re p r e lim in a r y .
Digitized for FRASER http://fraser.stlouisfed.org/ Federal Reserve Bank of St. Louis

11 3 ESTABLISHMENT DATAHOURS AND EARNINGS
C-2: Gross hours and earn ings of produc tion or nonsuperv isory w o r k e r s 1on pr iva te no n a g r icu l tu ra l p a y ro l ls , by in dustry--C ontinued
SICC ode
Average weekly hours Average overtim e hoursIndustry N ov.
1969Oct.1969
Sept.1969
N ov.1968
O ct.1968
N ov.1969
O ct.1969
Sept. _ 1969
N ov.1968
O ct.1968
T R A N S P O R T A T IO N A N D P U B L IC
U T I L I T I E S —C o n tin u e d
49 E L E C T R IC , CAS, A N D S A N IT A R Y S E R V IC E S - 41. 7 41. 6 41. 8 41. 8 _ _ - _ _
491 Electric companies and system s............ 42. 0 42. 1 41. 8 41. 6492 Gas companies and systems.................... 41. 1 41. 0 4 1 .7 42. 0493 Combination companies and systems . . 41. 9 41. 5 42. 1 42. 1494-7 Water, steam sanitary systems........... 40. 9 41. 0 40. 9 4 1 .4
. WHOLESALE A N 0 R E T A I L T R A D E ............ 35. 1 35. 3 35. 7 35. 5 35. 7 _ _ _ _ _
50 W H O L E S A L E T R A D E ............................................ 40. 3 40. 2 40. 3 40. 0 40. 2 _ _ _ _ -
501 Motor v e h ic le s & autom otive equ ipm ent. - 4 0 .6 41. 0 4 1 .7 41. 2 - - - - -502 Drugs, ch em ica ls , and a llied products . . . - 39. 3 39. 5 38. 7 39. 1 - - - - -503 Dry good s and apparel.................................... - 37. 7 37. 5 37. 6 37. 8 - - - -504 G roceries and related p r o d u c ts ................. - 4 0 .4 40. 9 40. 2 40. 9 - - - -506 E lectrica l g o o d s ................................................ - 41. 8 42. 0 41. 7 40. 9 - - - -507 Hardware; plumbing & heating equipment - 4 0 .2 40. 2 40. 1 4 0 .4 - - -508 M achinery, equipment, and supp lies . . . . - 41. 1 40. 9 4 0 .4 40. 7 - - -509 M isce llan eou s w h o lesa lers .......................... - 39 .6 39. 5 3 9 .4 3 9 .5 _ - - -
52-59 R E T A IL T R A D E ................................................... 33. 5 33 .6 34. 2 34. 1 34. 3 - - - - -53 R etail general m e rch a n d is e ........................ - 31 .7 32. 2 31. 8 32. 2 - - - - -531 Department s to r e s ......................................... - 31. 3 31. 9 31. 5 32. 1 - - - -532 Mail order h o u s e s ......................................... - 35. 3 36. 2 35. 2 35. 1 - - - -533 V ariety s t o r e s ................................................ - 2 9 .9 29. 8 2 9 .9 30. 1 - - -54 F ood s to re s .......................................................... - 32. 0 32. 8 32. 3 32. 3 “ - - - -541-3 G rocery, meat, and veg etab le stores . . . - 32. 1 33. 0 32. 4 32. 4 - - - -56 Apparel and a cce sso ry s t o r e s ................... - 31. 6 32. 0 31. 5 31. 7 - ~ - - -561 Men’ s & b o y s ’ c loth ing & furnishings . - 33. 5 34. 3 3 3 .6 33. 9 - - -562 Women’ s ready-to-w ear s to r e s ................. - 30. 8 31. 1 30. 8 31. 1 - - - -565 Fam ily cloth ing stores ............................. 32. 5 32. 8 31. 5 31. 8 * - - -566 Shoe s to re s ....................................................... - 30. 3 30. 9 3 0 .4 30. 1 “ - - -57 Furniture and home furnishings s tores . . - 37. 2 37. 3 37. 7 37. 7 ~ ~ - - -571 Furniture and home furnishings............... - 37. 3 37. 5 37. 7 37. 7 - - - -58 Eating and drinking p l a c e s * ...................... - 31. 0 31. 9 32. 0 32. 2 “ - - -52,55,59 Other retail trad e .............................................. - 38. 0 38. 2 38. 3 38. 5 - - - -52 Building m aterials and farm equipment - 39. 8 40. 2 40. 3 40. 9 ~ - - - -551,2 Motor veh ic le d e a le r s .................................. - 40. 9 40. 7 41. 3 4 1 .4 ~ - - -553,9 Other autom otive & a cce s so ry dea lers . - 4 1 .4 4 1 .6 42. 1 41. 7 - - -591 Drug stores and proprietary s tores . . . - 32. 2 32. 2 32. 5 32. 7 ~ - - -594 B ook and stationery s tores ................... - 33. 2 34. 0 33. 3 33. 3 “ - - -598 Fuel and ic e d e a le rs .................................... _ 41. 0 4 0 .6 42. 1 41. 8 - - - - _
_ FINANC E, INSURANCE, AND R E A LE S T A T E 7 ............................................................... 37. 3 37. 1 37. 0 3 6 .9 37. 1 “ “ - - -
60 Banking ................................................................. - 37. 2 37. 2 37. 2 37. 3 “ ~ - " -61 Credit a gen cies other than banks ............ - 37. 7 3 7 .4 37. 6 37. 6 ~ -612 Savings and loan a s s o c ia t io n s ............... - 37. 2 36. 8 36. 8 37. 0 - _ -62 S ecurity, com m odity brokers & se rv ice s . - 37. 2 37. 4 37. 3 37. 5 - -
63 Insurance c a r r ie r s ........................................... - 37. 1 36. 9 36. 7 36. 8 - -631 L ife in su ra n ce ................................................ - 3 6 .5 36. 1 35. 7 35. 9 ~ ~ _ —632 A ccid en t and health in s u r a n c e ............... - 36. 3 36. 3 36. 3 36. 2 ~ - _ ~633 F ire, marine, and casu a lty insurance . . - 38. 0 37. 9 37. 8 37. 9 - - - -
- SERVICES:H otels and other lodging p la ce s :
701 H ote ls , tourist courts, and m o te ls * . . . - 35. 2 34. 8 35. 3 35. 5 _ _ _ _ _Personal S erv ices :
721 Laundries & dry clean in g p lan ts............ - 36. 2 36. 3 36 .6 37. 2 _ _ -722 Photographic s t u d i o s ................................ - 3 7 .6 - 3 6 .7 37. 3 36. 3 _ ~
Motion p ictures:781 Motion p icture film ing & d is tr ib u t in g .. 39. 8 39. 7 40. 9 40. 5 ~ ~ —
1 F o r c o v e r a g e o f s e r i e s , s e e f o o tn o te 1 , ta b le B -2 ,
^B eginning January 1 9 6 5 , data relate to railroads with operating revenues o f $5 ,000 ,000 or more. April 1969: $159.48, $ 3 .6 0 , and 4 4 .3 - May 1969: $ 161 .09 , $ 3 .6 2 and 4 4 .5 .^ D a ta r e la te to e m p lo y e e s in s u c h o c c u p a t i o n s in th e t e le p h o n e in d u s try a s s w it c h b o a r d o p e r a t o r s ; s e r v i c e a s s i s t a n t s ; o p e r a t in g room in s t r u c to r s ; and p a y -s t a t io n
a tte n d a n ts . In 1 9 6 8 , s u c h e m p lo y e e s m a d e up 32 p e r c e n t o f th e t o ta l n u m ber o f n o n s u p e r v is o r y e m p lo y e e s in e s t a b lis h m e n t s re p o r t in g h o u rs and e a r n in g s d a ta .
4 D a ta r e la te to e m p lo y e e s in s u c h o c c u p a t i o n s in the t e le p h o n e in d u s tr y a s c e n tr a l o f f i c e c r a ft s m e n ; in s t a l la t io n a n d e x c h a n g e r e p a ir c r a ft s m e n ; l in e , c a b le , and c o n d u it c r a fts m e n ; an d la b o r e r s . In 1 9 6 8 , s u c h e m p lo y e e s m a d e up 32 p e r c e n t o f th e t o ta l n u m b er o f n o n s u p e r v is o r y e m p lo y e e s in e s t a b lis h m e n t s r e p o r t in g h o u rs
a n d e a r n in g s d a ta .5Data relate to nonsupervisory em p loyees except m essen gers.^ M oney p a y m e n ts o n ly ; t ip s , n o t in c lu d e d .7Data for n on office salesm en exclu ded from all se r ie s in th is d iv is ion .
♦Not available.NOTE: Data for the 2 most recent months are preliminary.
371-793 0 - 69 - 8Digitized for FRASER http://fraser.stlouisfed.org/ Federal Reserve Bank of St. Louis

ESTABLISHMENT DATAHOURS AND EARNINGS
114
C-3: Employment, hours, and indexes of earnings in the Executive Branch of the Federal Government
(E m p lo y m e n t in th o u s a n d s —in c l u d e s b o th s u p e r v is o r y a n d n o n s u p e r v is o r y e m p lo y e e s )
h e m1969 1968
Sept. 1 Aug. I1 July J 1 June 11 May I1 Apr. I1 Mar. 11 Feb. I Jan. Dec. I Nov. |1 Oct. 11 Sept.EXECUTIVE BRANCH
T o t a l e m p lo y m e n t .............................. 2 ,6 9 7 .3 2 ,767 .2 2,80*1.5 2 ,795 .9 2,70*1.5 TO ro b 2 ,701.9 2,70*1.2 2 ,6 9 9 .3 2,734*3 2 ,6 6 7 .6 2 ,658 .9 2 ,670 .2A v e r a g e w e e k ly h o u r s ................... 39.3 39.6 39.4 39-4 39-4 39.5 39.5 39.9 39.5 39.8 39.5 39.3 39.1
A v e n g e o v e r t im e h o u r s . . . 1 .0 •9 .8 1 .0 1 .0 1 .0 1 .1 1 .0 1 .0 1 .8 1 .0 1 .1 1 .0I n d e x e s ( 1 9 6 5 = 1 0 0 ):
A v e r a g e w e e k ly e a r n in g s . . 126.0 12^.7 119.1 117.8 118.9 117.5 117.5 118.7 117.5 119.0 117.2 115.8 11*1.3A v e n g e h o u r ly e a r n in g s . . . 1 2 9 .8 127.5 123.7 1 2 1 .1 1 2 2 .2 120.5 120.5 120.5 1 2 0 .5 1 2 1 .1 1 2 0 .2 119.3 n 8 .* i
DEPARTMENT OP DEFENSE
T o n i e m p lo y m e n t .............................. 1 ,1 1 1 .6 1 ,142 .9 1 ,1 6 7 .5 1 ,1 6 2 .4 1 ,1 2 5 .2 1 ,128.2 1 ,129 .0 1 ,1 3 0 .4 1 ,1 3 1 .3 1 ,090.6 1 ,0 9 3 .1 1 ,0 9 4 .1 1 ,097 .0A v e n g e w e e k ly h o u r s ................... 39.6 39.8 38.5 40.2 39.9 39.8 40.2 40.7 40.2 39.5 40.0 40.1 39.8
A v e n g e o v e r t im e h o u r s . . . . • 9 1 . 0 .9 1 .2 1 . 0 .8 1 .2 1 .2 1 .3 1 .2 1 .1 1 .4 1 . 0I n d e x e s (1 9 6 5 = 1 0 0 ) :
A v e n g e w e e k ly e a r n in g s . . 125.2 123.8 118.4 118.2 119.9 116.5 117.4 118.8 117.7 115.6 115.7 114.8 113.4A v e r a g e h o u r ly e a r n in g s . . . 129.0 126.9 125.5 120.0 122.6 119.4 119.1 119.1 119.4 119.4 118.0 116.8 116.2
POST OFFICE DEPARTMENT
T o t a l e m p lo y m e n t .............................. 726.5 7*H.O 739.8 736.6 723.1 720.9 718.5 718.4 718.5 795.4 721.8 7 H .5 712.8A v e n g e w e e k ly h o u r s ................... 38.7 38.7 39.1 38.4 38.5 38.8 38.7 39.4 38.6 41.4 39.3 38.6 38.2
A v e r a g e .o v e r t im e h o u r s . . . 1 .2 .9 .8 .9 1 .1 1 .3 1 .2 1 . 0 1 .1 4 .0 1 .2 1 .2 • 9I n d e x e s (1 9 6 5 = 1 0 0 ) :
A v e r a g e w e e k ly e a r n in g s . . . 117.8 1 1 6 .6 117.8 1 1 1 . 1 1 1 2 .0 1 1 3 .2 1 1 2 .6 114.3 112.3 123.7 n 4 .o 1 1 2 .0 109.6A v e n g e h o u r ly e a r n in g s . . . 125.7 124.4 124.4 119.5 1 2 0 .1 1 2 0 .5 1 2 0 .1 119.8 1 2 0 .1 123.4 119.8 119.8 118.5
OTHER AGENCIES
T o t a l e m p lo y m e n t .............................. 859.2 883.3 897.2 896.9 856.2 862.9 854.4 855.4 849.5 848.3 852.7 853.3 860.4A v e r a g e w e e k ly h o u r s ................... 39A 40.0 39.6 39.2 39.6 39.8 39.3 39.4 39.2 38.9 39.1 38.8 38.9
A v e n g e o v e r t im e h o u r s . . . . .8 .8 .8 .9 .9 .9 .8 .8 .7 .7 .8 .7 .8I n d e x e s (1 9 6 5 = 1 0 0 ) :
A v e r a g e w e e k ly e a r n in g s . . . 133.8 131.4 1 2 2 .0 122.9 124.2 122.9 121.9 122.4 1 2 1 .8 121.4 1 2 2 .1 1 2 0 .1 119.0A v e n g e h o u r ly e a r n in g s . . . 13^.1 129.8 121.7 1 2 3 .8 1 2 3 .8 1 2 2 .0 122.5 1 2 2 .8 1 2 2 .8 123.3 123.J 1 2 2 .2 1 2 0 .9
NOTE: Averages presented in this table have been computed using data collected by the U.S. Civil Service Commission from all agencies of the executive branch of the Federal Government; the data cover both salaried workers and hourly paid wage-board employees. Since these averages relate to hours and earnings of all workers, both supervisory and non supervisory, they are nor comparable to similar data presented in table C-2 which relate only to production or non supervisory workers.
C-4: Average hourly earnings excluding overtime off production workers on manufacturing payrolls,by industry
A v e n g e h o u r ly e a r n in g s e x c lu d in g o v e r t im e 1
Major industry group Nov.1969
05^;1969
se p t.1969
NOV.1968
----------0 3 ^ -------------1968
MANUFACTURING..................................................................................... $3 .13 $3.10 $3.09 $2.94 $2 .92
DURABLE GOODS...................................................................................... 3.32 3.29 3.27 3.11 3.09
Ordnance and accessories....................................................................... _ 3.39 3.38 3.19 3.18Lumber and wood products....................................................................... - 2 .70 2.70 2.50 2.49Furniture and fixtures............................................................................ - 2.57 2 .57 2.42 2.40Stone, clay, and glass products............................................................. - 3.09 3.06 2.89 2.88Primary metal industries......................................................................... - 3.67 3.67 3.46 3.45Fabricated metal products....................................................................... - 3.22 3.21 3.06 3.04Machinery, except electrical.................................................................. - 3.48 3.^3 3.28 3.27Electrical equipment and supplies........................................................ - 3.02 3.01 2.90 2.87Transportation equipment....................................................................... - 3.77 3.75 3.59 3.55Instruments and related products........................................................... - 3.10 3.07 2.94 2.92Miscellaneous manufacturing industries................................................. - 2 .59 2.58 2.44 2.42
• NONDURABLE GOODS.............................................................................. 2.85 2.83 2.82 2.69 2.67
Food and kindred products..................................................................... _ 2.82 2.79 2.71 2.67Tobacco manufactures.........................*................................................. _ 2.48 2.48 2.47 2 .33T e x t i le m ill p rod u cts ......................................................................................................... - 2.30 2.29 2.16 2.16Apparel and other tex tile p r o d u c t s . ........................................................................... _ 2.30 2.30 2.21 2.22Paper and a llie d p r o d u c t s .............................................................................................. _ 3.10 3.10 2.93 2.91Printing and p u b lish in g .................................................................................................... (2 ) (2 ) (2 ) (2 ) (2 )C h em ica ls and a llie d p r o d u c t s .................................................................................... 3.40 3.38 3.20 3.18Petroleum and co a l p r o d u c t s ........................................................................................ _ 3.87 3.85 3.64 3.60Rubber and p la s t ic s p rodu cts, n e c ........................................................................... _ 2.96 2.97 2.84 2.83L eather and leather p r o d u c t s ....................................................................................... - 2 .34 2.32 2.21 2.20
iDerived by assuming chat overtime hours are paid at the rate o f time and oae-half.^Not available as average overtime rates are significantly above time and oae-half. Inclusion o f data for the group ia the nondurable goods total has little effect. NOTE: Data for the 2 most recent aMaths are preliminary.
Digitized for FRASER http://fraser.stlouisfed.org/ Federal Reserve Bank of St. Louis
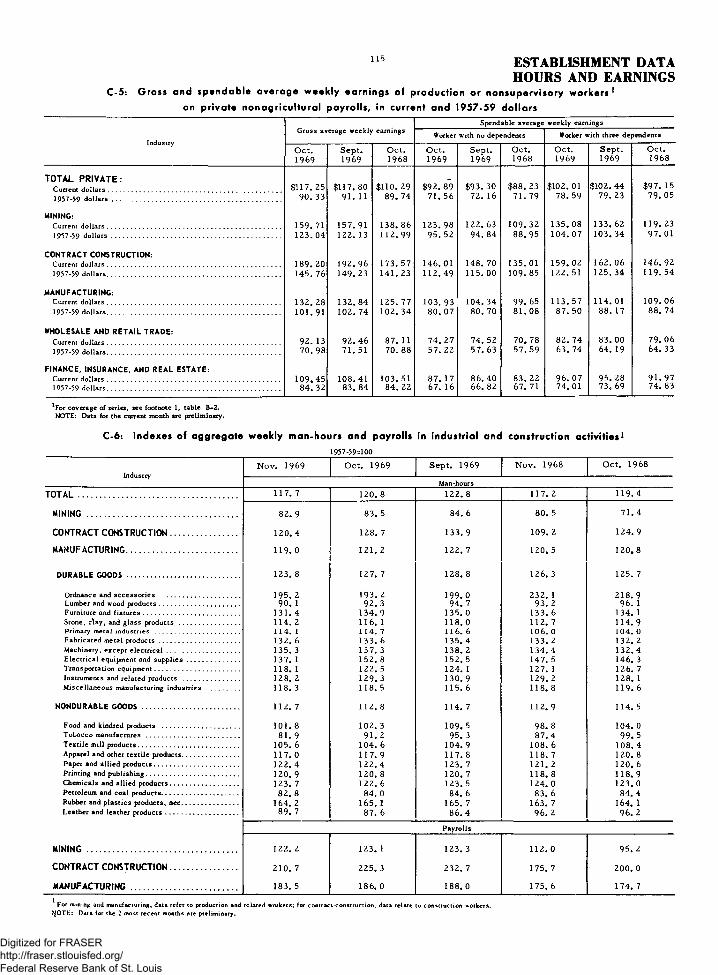
115 ESTABLISHMENT DATAHOURS AND EARNINGS
C -5: Gross and sp en d ab le a v era g e w eek ly earn ings of production or nonsupervisory w o rk e rs 1
on p riva te n o n a g ricu ltu ra l payro lls , in current and 1957 -5 9 d o lla rsSpendable average weekly earnings
Gross average weekly earnings Worker with no dependents Worker with three dependents
O ct.1969
Sept.1969
O ct.1968
O ct.1969
Sept.1969
O ct.1968
O ct.1969
Sept.1969
O ct.1968
TOTAL PRIVATE:$117. 25 $117. 80 $110. 29 $92 .89 $93 .30 $88. 23 $102. 01 $102. 44 $97. 15
1957-59 d o lla rs .............................................................................................. 90. 33 91. 11 89. 74 71. 56 72. 16 71. 79 78. 59 79. 23 79. 05
MINING:Current do lla rs ................................................................................................1957-59 d o lla rs ..............................................................................................
159.71 123 .04
157.91 122 .13
138. 86 112 .99
1 23 .98 95. 52
122 .63 94. 84
109 .328 8 .9 5
135 .08 104 .07
133 .62 103 .34
119 .23 97. 01
CONTRACT CONSTRUCTION:Current d o lla rs ................................................................................................ 189 .20 192 .96 173. 57 146.01 148 .70 135.01 159 .02 1 62 .06 146. 921957-59 dollars................................................................................................ 145 .76 149 .23 141 .23 112 .49 115 .00 109 .85 122.51 1 25 .34 1 19 .54
MANUFACTURING:Current do lla rs ................................................................................................1957-59 dollars................................................................................................
132 .28 101.91
132 .84 102 .74
125 .77 1 02 .34
103. 93 80. 07
104 .34 80. 70
99. 65 81. 08
113 .57 87. 50
114.01 88. 17
1 09 .06 88. 74
WHOLESALE AND RETAIL TRADE:Current dolla rs................................................................................................1957-59 dollars................................................................................................
92. 13 70. 98
9 2 .4 6 71. 51
87. 11 70. 88
74. 27 57. 22
74. 52 57. 63
70. 78 5 7 .5 9
82. 74 63. 74
83. 00 64. 19
79. 06 64. 33
FINANCE, INSURANCE, AND REAL ESTATE:Current dolla rs................................................................................................1957-59 dollars................................................................................................
109 .45 84. 32
108.41 83. 84
103.51 84. 22
87. 17 67. 16
86. 40 66. 82
83. 22 67. 71
96. 07 74. 01
95. 28 73. 69
9 1 .9 7 74. 83
*For coverage of series, see footnote 1, table B-2. NOTE: Data for the current month are preliminary.
C-6: Indexes of ag g reg a te w eekly m an-hours and payrolls in industrial and construction activ ities11957*59=100
IndustryN ov. 1969 O ct. 1969 Sept. 1969 N ov. 1968 O ct. 1968
Man-hoursTOTAL ................................................................................ 117. 7 120. 8 122. 8 117. 2 119. 4
MINING ........................................................................... 82. 9 83. 5 84. 6 80. 5 7 1 .4
CONTRACT CONSTRUCTION................................. 120. 4 128. 7 133. 9 109. 2 124. 9
MANUFACTURING....................................................... 119. 0 121. 2 122. 7 120. 5 120 .8
DURABLE G O O D S............................................................... 123. 8 127. 7 128. 8 126. 3 125. 7
Ordnance and accessories ......................................... 195. 2 193. 2 1 99 .0 232. 1 218. 9Lumber and wood products............................................. 90. 1 9 2 .3 94. 7 9 3 .2 96. 1Furniture and fixtures...................................................... 131. 4 134. 9 135. 0 133. 6 134. 1Stone, clay, and glass products .................................. 114. 2 116. 1 118 .0 112. 7 114. 9Primary metal industries ............................................... 114. 1 114. 7 116. 6 106. 0 104. 0Fabricated metal products............................................. 132. 6 133. 6 135. 4 133. 2 132. 2Machinery, except e le c tr ica l......................................... 135. 3 137. 3 138. 2 134. 4 132. 4Electrical equipment and su p p lie s ............................. 137. 1 152. 8 152. 5 147. 5 146. 3Transportation equipment............................................... 118. 1 122. 5 124. 1 127. 1 126. 7Instruments and related products ............................... 128. 2 129. 3 130. 9 129. 2 128. 1Miscellaneous manufacturing industries .................. 118. 3 118. 5 115. 6 118. 8 119. 6
NONDURABLE G O O D S ................................................ 112. 7 112. 8 114. 7 112. 9 114. 5
Food and kindred products ........................................... 101. 8 102. 3 109 .5 98. 8 104. 0T obacco manufactures .................................................... 81. 9 9 1 .2 9 5 .3 8 7 .4 9 9 .5Textile mill products.................................................. 105. 6 104. 6 104. 9 108. 6 108. 4Apparel and other textile products............................ 117. 0 117. 9 117. 8 118. 7 120. 8Paper and allied products.......................................... 122. 4 122 .4 123. 7 121. 2 120. 6Printing and publishing.............................................. 120. 9 120. 8 120. 7 118. 8 118. 9Chemicals and allied products.................................. 123. 7 122. 6 123. 5 124. 0 123. 0Petroleum and coal products...................................... 82. 8 84. 0 84. 6 83. 6 8 4 .4Rubber and plastics products, nec............................ 164. 2 165. 1 165. 7 163. 7 164. 1Leather and leather products.................................... 89. 7 87. 6 8 6 .4 96. 2 96. 2
Payrolls
M IN IN G ........................................................................... 122. 2 123. 1 123. 3 112. 0 9 5 .2
CONTRACT CONSTRUCTION................................. 210. 7 225. 3 232. 7 175. 7 200. 0
M AN UFA CTU RING ..................................................... 183. 5 186. 0 188 .0 175. 6 174. 7
For mining and manufacturing, data refer to production and related workers; for contract-construction, data relate to construction workers. NJOTE: Data for the 2 most recent months are preliminary.
Digitized for FRASER http://fraser.stlouisfed.org/ Federal Reserve Bank of St. Louis
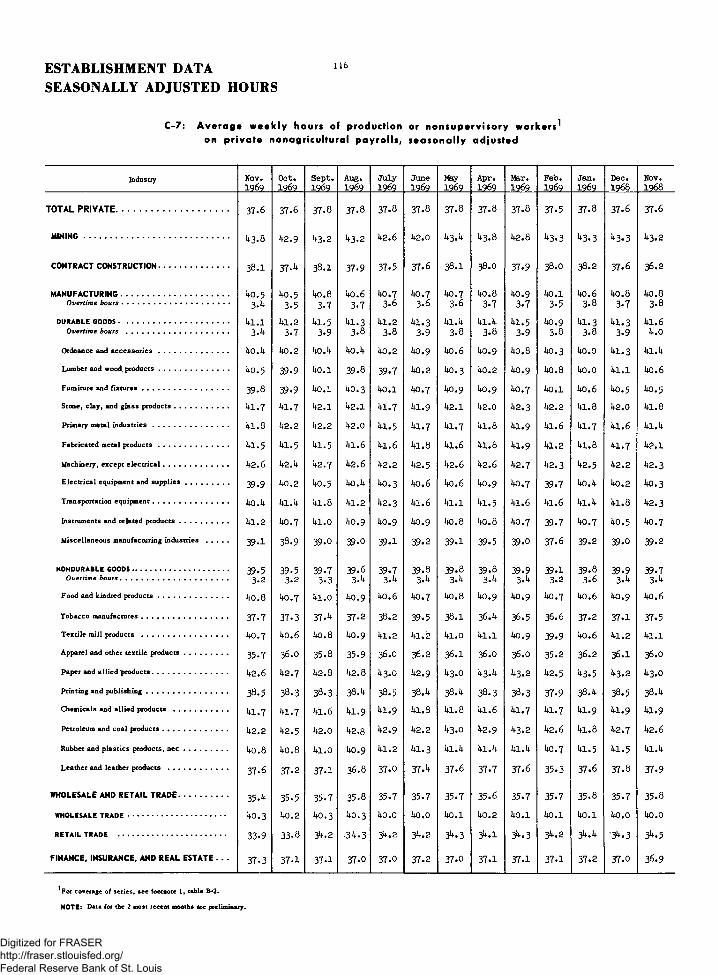
ESTABLISHMENT DATA SEASONALLY ADJUSTED HOURS
116
C-7: A v e ra g e w eekly hours off production or n o n sup erv iso ry workers1on priva te nonagricultural payro lls , seasonally adjusted
Industry Nov.1 9 6 9
Oct.1 9 6 9
Sept.1 9 6 9
Aug.1 9 6 9
July1 9 6 9
June1 9 6 9
May1 9 6 9
Apr.1969
Mar.1 9 6 9
Feb.1969
Jan.1 9 6 9
Dec.1 9 6 8
Nov.1 9 6 8
TOTAL PR IV A TE........................................................ 3 7.6 3 7.6 3 7 .8 37.8 3 7 .8 3 7 .8 3 7 .8 3 7 .8 3 7 .8 3 7 .5 3 7 .8 3 7 .6 3 7 .6
M IN IN G ................................................................................. 43.8 1*2.9 1*3.2 1*3.2 4 2 .6 4 2 .0 4 3 .4 4 3 .8 4 2 .8 4 3 .3 4 3 .3 4 3 .3 4 3 .2
CONTRACT CONSTRUCTION....................................... 3 8 .1 37.*t 3 8 .1 3 7 .9 3 7 -5 3 7 .6 3 8 .1 38.0 3 7 .9 38.0 38.2 3 7 .6 36.2
M ANUFACTURING ............................................................ 40.5 1*0.5 1*0 .8 1*0 .6 4 0 .7 4 0 .7 4 0 .7 4 0 .8 4 0 .9 1*0 .1 4 0 .6 4 0 .8 4 0 .8O vertim e h o u r s ............................................................ 3 -4 3 .5 3 .7 3 .7 3 .6 3 .6 3 .6 3 .7 3 .7 3 .5 3 .8 3 .7 3 .8
DURABLE GOODS.............................................................. 4 l . l 1*1 .2 1*1.5 1*1.3 4 1 .2 4 1 .3 4 1 .4 4 1 .4 4 1 .5 4 0 .9 4 1 . 3 4 1 . 3 4 1 .6O vertim e hours ......................................................... 3 -4 3 .7 3 .9 3 .8 3 .8 3 .9 3 .8 3 .8 3 .9 3 .8 3 .8 3 .9 4 .0
Ordnance and a c c e s s o r i e s .................................... .. 4 o .4 1*0 .2 1*0 . 1* 1*0 . 1* 4 0 .2 1*0 .9 4 0 .6 4 0 .9 4 0 .8 4 0 .3 4 o . o 4 1 .3 4 1 .4
Lumber and wood, p rod u cts ....................................... 1*0 .5 3 9 .9 1*0 .1 39.8 3 9 .7 4 0 .2 4 0 .3 4 0 .2 4 0 .9 4 0 .8 1*0 .0 4 1 .1 4 0 .6
Furniture and fix tu re s ................................................ 39.8 3 9 .9 1*0 .1 1*0 .3 4 o . i 4 0 .7 1*0 .9 4 0 .9 4 0 .7 1*0 .1 1*0 .6 4 0 .5 4 0 .5
Stone, clay, and glass products........................... k 1*1.7 1*1.7 1*2 .1 1*2 .1 4 1 .7 4 1 .9 4 2 .1 4 2 .0 4 2 .3 4 2 .2 4 1 .8 4 2 .0 4 1 .8
Primary metal in d u str ie s .......................................... 1*1 .8 1*2 .2 1*2 .2 1*2.0 4 1 .5 4 1 .7 4 1 .7 4 1 .8 4 1 .9 4 1 .6 4 1 .7 4 1 .6 4 1 .4
Fabricated metal p r o d u c ts ....................................... 1*1.5 4 1 .5 * n . 5 1*1 .6 4 1 .6 4 1 .8 4 1 .6 4 1 .8 4 1 .9 4 1 .2 4 1 .8 4 1 .7 4 2 .1
Machinery, except e le c tr ica l.................................... 1*2 .6 1*2 . 1* 1*2.7 1*2 .6 4 2 .2 4 2 .5 4 2 .6 4 2 .6 4 2 .7 4 2 .3 4 2 .5 4 2 .2 4 2 .3
Electrical equipment and s u p p lie s ........................ 3 9 .9 1*0 .2 1*0.5 1*0 . 1* 4 0 .3 4 0 .6 1*0 .6 1*0 .9 4 0 .7 3 9 .7 4 0 .4 4 0 .2 4 0 .3
Transportation equipm ent.......................................... 1*0 . 1* 1*1 . 1* 1*1 .8 1*1 .2 4 2 .3 4 1 .6 4 1 .1 4 1 .5 4 1 .6 4 1 .6 4 1 .4 4 1 .8 4 2 . 3
Instruments and related prod u cts ........................... 1*1 .2 1*0.7 1*1 .0 1*0.9 4 0 .9 1*0.9 4 0 .8 4 0 .8 4 0 .7 3 9 .7 4 0 .7 4 0 .5 4 0 .7
Miscellaneous manufacturing industries ............ 3 9 .1 3 8 .9 3 9 .0 3 9 .0 3 9 .1 3 9 .2 3 9 .1 3 9 .5 3 9 .0 3 7 .6 3 9 .2 3 9 .0 3 9 .2
NONDURABLE GOODS..................................................... 3 9 .5 3 9 .5 3 9 .7 3 9 .6 3 9 .7 3 9 .8 3 9 .8 3 9 .8 3 9 .9 3 9 .1 3 9 .8 3 9 .9 3 9 .7O vertim e h o u r s ............................................................ 3 .2 3 .2 3 .3 3 -4 3 .4 3 .4 3 .4 3 .4 3 .4 3 .2 3 .6 3 .4 3 .4
Food and kindred prod u cts ....................................... 1*0 .8 1*0.7 1*1 .0 1*0.9 4 0 .6 4 0 .7 4 0 .8 4 0 .9 4 0 .9 1*0 .7 4 0 .6 1*0 .9 4 0 .6
T obacco manufactures................................................ 3 7 .7 3 7.3 37.4 3 7 .2 38.2 3 9 .5 3 8 .1 3 6 .4 3 6 .5 36.6 3 7 .2 3 7 .1 3 7 .5
Textile mill products ................................................ 1+0 .7 1* 0 .6 1* 0 .8 1*0.9 4 1 .2 4 1 .2 4 1 .0 4 1 .1 40.9 3 9 .9 4 0 .6 4 1 .2 4 l . l
Apparel and other textile p rod u cts ........................ 3 5 .7 36.0 3 5 .8 3 5 .9 36.0 36.2 3 6 .1 36.0 36.0 3 5 .2 36.2 3 6 .1 36.0
Paper and allied products....................................... .. 1* 2 .6 1*2 .7 1* 2 .8 1* 2 .8 4 3 .0 4 2 .9 4 3 .0 4 3 .4 4 3 .2 4 2 .5 4 3 .5 4 3 .2 43.0
Printing and pu blish ing ............................................. 38.5 3 8 .3 3 8 .3 38.1* 3 8 .5 3 8 .4 3 8 .4 3 8 .3 3 8 .3 3 7 .9 3 8 .4 3 8 .5 3 8 .4
Chemicals and allied products .............................. 1*1.7 1*1.7 1* 1 .6 1*1.9 4 1 .9 4 1 .8 4 1 .8 4 1 .6 4 1 .7 4 1 .7 4 1 .9 4 1 .9 4 1 .9
Petroleum and coal products.................................... 1* 2 .2 1*2 .5 1* 2 .0 1* 2 .8 4 2 .9 4 2 .2 4 3 .0 4 2 .9 4 3 .2 4 2 .6 4 1 .8 4 2 .7 4 2 .6
Rubber and plastics products, n e c ........................ 1*0 .8 1* 0 .8 1*1 .0 1*0 .9 4 1 .2 4 1 .3 4 1 .4 4 1 .4 4 1 .4 1*0.7 4 1 .5 4 1 .5 4 1 .4
Leather and leather products ................................. 3 7 .6 3 7 .2 3 7 .1 36.8 3 7 .0 3 7 .4 3 7 .6 3 7 .7 3 7 .6 3 5 .3 3 7 .6 3 7 .8 3 7 .9
WHOLESALE AND RE TAIL TR A D E........................... 35 A 3 5 .5 3 5 .7 35.8 3 5 .7 3 5 .7 3 5 .7 3 5 .6 3 5 .7 3 5 .7 3 5 .8 3 5 .7 3 5 .8
WHOLESALE TRADE...................................................... 1*0.3 1* 0 .2 1*0.3 1*0 .3 4 0 .0 4 0 .0 4 0 .1 4 0 .2 1*0 .1 1*0 .1 4 0 .1 1+ 0 .0 4 0 .0
RETAIL TRADE ............................................................ 3 3 .9 3 3 .8 3 4 .2 .3 4 .3 34.2 3 4 .2 3 4 .3 3 4 .1 3 4 .3 34.2 3 4 .4 •34.3 34.5
FINANCE, INSURANCE, AND REAL ESTATE . . . 3 7 .3 3 7 .1 3 7 .1 37.0 37.0 3 7 .2 3 7 .0 3 7 .1 3 7 .1 3 7 .1 3 7 .2 3 7 .0 36.9
*For coverage of series, see footnote 1, table B-2.
NOTE: Data for the 2 most recent months are preliminary.
Digitized for FRASER http://fraser.stlouisfed.org/ Federal Reserve Bank of St. Louis
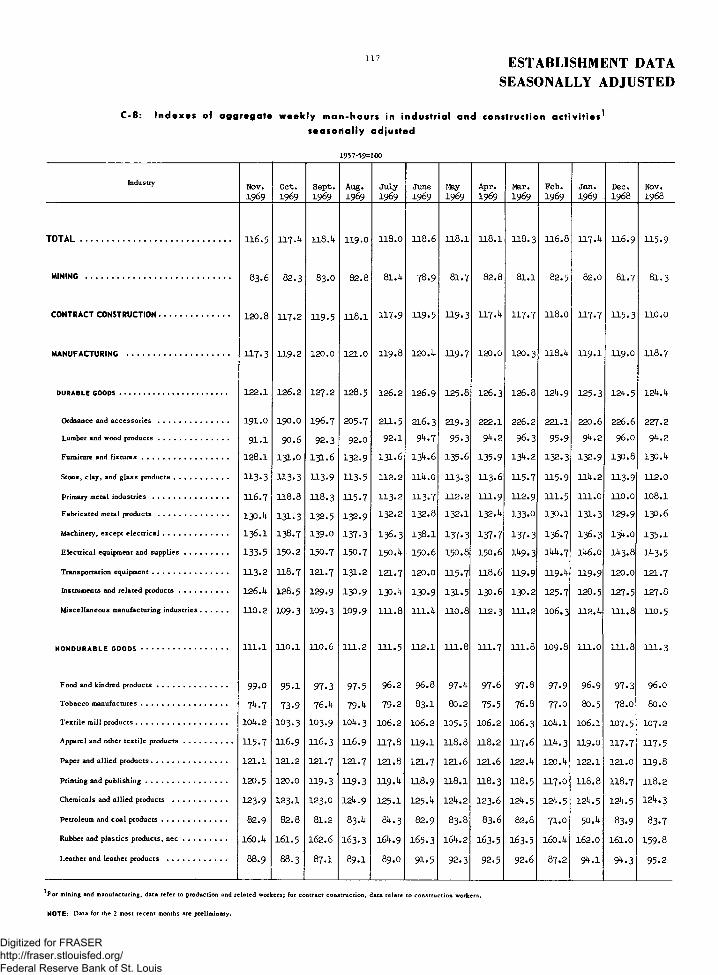
117 ESTABLISHMENT DATASEASONALLY ADJUSTED
C -8: In d e x e s off a g g re g a te w e e k ly m an -h o u rs in in d u s tria l and construction ac tiv ities^s e a s o n a lly ad justed
1957-59=100
In du stry Nov.1969
Oct.1969
Sept.1969
Aug.1969
July1969
June1969
May1969
Apr.1969
Mar.1969
Feb.1969
Jan.1969
Dec.1968
Nov.1968
TO TAL ........................................................................... 116.5 117.4 118.4 119.0 118.0 118.6 118.1 118.1 118.3 116.8 117.4 116.9 115.9
MINING ................................................................................ 83.6 82 .3 83.O 82.8 81.4 78.9 81 .7 82 .8 81.1 82.5 82.0 81.7 81 .3
CONTRACT CONSTRUCTION....................................... 120.8 117.2 119.5 118.1 117.9 119.5 119.3 117.4 H 7 .7 118.0 117.7 H 5 .3 110.0
MANUFACTURING ......................................................... 117.3 119.2 120.0 121.0 119.8 120.4 119.7 120.0 120.3 118.4 119.1 119.0 118.7
DURABLE GOODS............................................................ 122.1 126.2 127.2 128.5 126.2 126.9 125.8 126.3 126.8 124.9 125.3 124.5 124.4
O rd n a n ce a n d a c c e s s o r i e s ................................................ 191.0 190.0 196.7 205.7 211.5 216.3 219.3 222.1 226.2 221.1 220.6 226.6 227.2
L u m b er a n d w o o d p r o d u c t s ................................................ 91 .1 90 .6 92 .3 92 .0 92.1 94 .7 95 .3 94 .2 96 .3 95 .9 94 .2 96.0 94 .2
F u rn itu re a n d f i x t u r e s ........................................................... 128.1 131.0 131.6 132.9 131.6 134.6 135.6 135.9 134.2 132.3 132.9 130.8 130.4
S to n e , c l a y , a n d g l a s s p r o d u c t s ..................................... 113.3 113.3 113.9 H 3 .5 112.2 n4.o 113.3 113.6 115.7 115.9 114.2 113.9 112.0
P rim a ry m e ta l i n d u s t r i e s .................................................... 116.7 118.8 118.3 115.7 113.2 113.7 1 1 2 .2 111.9 1 1 2 .9 111.5 1 1 1 .0 1 1 0 .0 108.1
F a b r ic a t e d m e ta l p r o d u c t s ................................................ 130.4 131.3 132.5 132.9 132.2 132.8 132.1 132.4 133.0 130.1 131.3 129.9 130.6
M a c h in e r y , e x c e p t e l e c t r i c a l ............................................ 136.1 138.7 139.0 137.3 136.3 138.1 137.3 137.7 137.3 136.7 136.3 134.0 135.1
E le c t r i c a l e q u ip m e n t a n d s u p p l i e s .............................. 133.5 1 5 0 .2 150.7 150.7 150.4 150.6 150.8 150.6 149.3 144.7 146.0 143.8 143-5
T r a n s p o r ta t io n e q u ip m e n t .................................................... 113.2 I I 8 .7 1 2 1 .7 131.2 121.7 120.0 115.7 1 1 8 .6 119.9 119.4 119.9 1 2 0 .0 121.7
In stru m en ts a n d r e la te d p r o d u c t s ................................. 1 2 6 . 4 128.5 129.9 130.9 130.4 130.9 131.5 130.6 130.2 125.7 128.5 127.5 127.8
M is c e l la n e o u s m a n u fa c tu r in g in d u s t r i e s ................... 1 1 0 .2 109.3 109.3 109.9 1 1 1 .8 111.4 1 1 0 .8 112.3 1 1 1 .2 106.3 112.4 1 1 1 .8 1 1 0 .5
NONDURABLE G O O D S................................................ 1 1 1 . 1 1 1 0 .1 1 1 0 .6 1 1 1 .2 111.5 112.1 1 1 1 .8 111.7 1 1 1 .8 109.8 1 1 1 . 0 1 1 1 .8 111.3
F o o d a n d k in d re d p r o d u c t s ................................................ 99.0 95.1 97 .3 97.5 96 .2 96 .8 97.4 97.6 97 .8 97.9 96 .9 97 .3 96.0
T o b a c c o m a n u f a c t u r e s ........................................................... 74 .7 73.9 76.4 79.4 79 .2 83.1 80 .2 75.5 76.8 77.0 80.5 78.0 80.0
T e x t i l e m il l p r o d u c t s ............................................................... 104.2 103.3 103.9 104.3 106.2 106.2 105.5 106.2 106.3 104.1 106.1 107.5 107.2
A p p a r e l a n d o th e r t e x t i l e p r o d u c t s .................................. 115.7 116.9 116.3 116.9 117.8 119.1 1 1 8 .8 118.2 117.6 114.3 119.0 117.7 117.5
P a p e r a n d a l l i e d p r o d u c t s .................................................... 1 2 1 .1 1 2 1 .2 121.7 121.7 1 2 1 .8 121.7 1 2 1 .6 1 2 1 .6 122.4 120.4 1 2 2 .1 1 2 1 .0 119.8
P r in t in g a n d p u b l i s h i n g ........................................................ 120.5 1 2 0 .0 119.3 119.3 119.4 118.9 1 1 8 .1 1 1 8 .3 118.5 117.0 1 1 8 .8 1 1 8 .7 1 1 8 .2
C h e m ic a l s an d a l l i e d p r o d u c ts ..................................... 123.9 123.1 123.0 124.9 125.1 125.4 124.2 123.6 124.5 124.5 124.5 124.5 124.3
P e tr o le u m a n d c o a l p r o d u c t s ............................................ 8 2 .9 82 .8 8 1 .2 83.4 84 .3 82.9 83 .8 83 .6 82 .8 71.0 50.4 83.9 83.7
R u b b e r a n d p l a s t i c s p r o d u c t s , n e c .............................. 160.4 161.5 162.6 163.3 164.9 165.3 164.2 163.5 163.5 160.4 162.0 161.0 159.8
L e a th e r a n d le a th e r p r o d u c ts ......................................... 88.9 88 .3 8 7 .I 8 9 .I 89.0 91.5 92 .3 92.5 92.6 87.2 94.1 9*1.3 95 .2
*For mining and manufacturing, data refer to production and related workers; for contract construction, data relate to construction workers.
NOTE: Data for the 2 most recent months are preliminary.
Digitized for FRASER http://fraser.stlouisfed.org/ Federal Reserve Bank of St. Louis

OUTPUT PER MAN-HOURSEASONALLY ADJUSTED
118
C-9: Output per man-hour, hourly compensation, and unit labor costs,private economy, seasonally adjusted
(Indexes 1957-59 = 100)
Output Man-hours Output per Compensation Realcompensation Unit labor costs
Year and quarter per man-hour2
Private Privatenonfarm Private Private
nonfarm Private Privatenonfarm Private Private
nonfarm Private Privatenonfarm Private Private
nonfarm
1966: 1st Quarter....................................... 143.2 144.8 109.4 113.7 130.9 127.3 139.2 135.5 124.9 121.6 106.3 106.52d Quarter....................................... 144.3 146.3 109.8 114.5 131.5 127.7 142.0 137.9 126.1 122.5 108.0 108.03d Quarter....................................... 145.3 147.4 110.5 115.5 131.5 127.6 144.0 139.6 126.7 122.9 109.5 109.44th Quarter....................................... 146.9 149.0 110.6 115.5 132.9 129.0 146.5 141.9 128.0 123.9 110.3 110.0Annual average................................ 144.9 146.9 110.1 114.8 131.7 127.9 142.9 138.8 126.5 122.8 108.5 108.5
1967: 1st Quarter....................................... 146.4 148.2 110.6 115.5 132.4 128.3 147.9 143.5 129.0 125.2 111.7 111.92d Quarter....................................... 147.2 148.9 109.6 114.9 134.4 129.6 150.3 145.5 130.1 126.0 111.9 112.33d Quarter....................................... 148.9 150.7 110.3 115.3 134.9 130.6 152.2 147.6 130.4 126.4 112.9 113.04th Quarter....................................... 150.2 152.1 110.9 116.0 135.4 131.1 154.3 149.7 131.1 127.2 114.0 114.2Annual average................................ 148.2 150.0 110.4 115.4 134.3 129.9 151.2 146.6 130.1 126.2 112.6 112.9
1968: 1st Quarter....................................... 152.4 154.3 111.2 116.4 137.0 132.6 158.5 153.6 133.3 129.2 115.7 115.92d Quarter....................................... 155.2 157.5 112.2 117.5 138.3 134.1 160.8 155.7 133.7 129.4 116.3 116.13d Quarter....................................... 156.7 159.0 112.7 118.3 139.0 134.4 163.7 158.1 , 134.5 129.8 117.8 117.64th Quarter....................................... 158.1 160.6 112.6 118.3 140.4 135.8 167.8 162.0 136.3 131.5 119.6 119.4
155.6 157.9 112.2 117.6 138.7 134.2 162.7 157.4 134.4 130.0 117.4 117.3
1969: 1st Quarter....................................... 159.1 161.5 113.7 119.6 139.9 135.0 170.5 164.4 136.7 131.8 121.8 121.8159.9160.7
162.3 114.6 129.7 139.5 134.5 172.7 166.5 136.2 131.3 123.8 123.83d Quarter....................................... 163.1 115.0 121.4 139.8 134.3 175.7 169.0 136.7 131.4 125.8 125.8
Percent change from previous quarter 3
1966: 1st Quarter........................................ 2 .0 2.1 0.5 0 .8 1.5 1.2 2.1 1.8 1.4 1.0 0.6 0.52d Quarter........................................ 0 .8 1.0 0 .4 0.7 0 .4 0 .3 2.0 1.8 0.9 0.7 1.6 1.53d Quarter....................................... 0 .7 0 .8 0.7 0.9 0.0 - 0 .1 1.4 1.2 0.5 0.3 1.4 1.34th Quarter....................................... 1.1 1.1 0.1 0.0 1.0 1.1 1.8 1.6 1.0 0.8 0.7 0.5
1967: 1st Quarter....................................... - 0 .4 - 0 .6 0.0 - 0.1 - 0 .4 - 0 .5 1.0 1.2 0.8 1.0 1.3 1.72d Quarter....................................... 0 .6 0.5 - 0.9 - 0 .5 - 1.5 1.0 1.6 1.3 0.9 0 .6 0.1 0.33d Quarter....................................... 1.1 1.2 0 .7 0 .4 0 .4 0.7 1.3 1.4 0.2 0 .4 0.9 0.74th Quarter....................................... 0.9 1.0 0.5 0 .6 0 .4 0 .4 1.4 1.4 0.5 0 .6 1.0 1.1
1968: 1st Quarter....................................... 1.5 1.5 0.3 0.3 1.2 1.2 2.7 2.6 1.7 1.6 1.5 1.42d Quarter....................................... 1 .8 2 .0 0.9 0.9 0.9 1.1 1.5 1.3 0.3 0.2 0.5 0.23d Quarter....................................... 1.0 1.0 0.5 0.7 0.5 0.3 1.8 1.6 0 .6 0.3 1.3 1.34th Quarter....................................... 0 .9 1.0 - 0 .1 0.0 0.9 1.0 2.5 2.5 1.3 1.3 1.6 1.5
1969: 1st Quarter....................................... 0 .7 0 .6 0.9 1.1 - 0 .3 - 0 .6 1.6 1.4 0 .3 0 .2 1.8 2 .02d Quarter....................................... 0 .5 0.5 0 .8 0.9 - 0 .3 - 0 .4 1.3 1.3 - 0 .4 - 0 .4 1.7 1.73d Quarter....................................... 0 .5 0.5 0 .3 0.6 0 .2 - 0 .1 1.7 1.5 0 .3 0 .0 1.6 1.4
Percent change from previous year 4
1968: 1st Quarter.......................................2d Quarter........................................3d Quarter.......................................4th Quarter.......................................
4.15.45.35.3
4.15.85.65.6
0.62.4 2.11.5
0.32.32.61.9
3.52.93.13.7
3.33.4 2.9 3.6
7.27,'J7.60.3
7.07.07.29.3
3.42.73.13.9
3.22.72.73.4
3.53.9 4 .44.9
3.63.5 4.14.5
1969: 1st Quarter.......................................2d Quarter . .....................................3d Quarter.......................................
4 .4 3.02.5
4.6O2 . 5
2 . 2
2 . 22 . C
2 . 3
2.72.6
2.10 .3 0 .5
1.3 0.3
- 0 .1
7.67 .47.3
7.07.0 6.9
2.61.91.7
2.01.51.2
5.36.56.8
5.1 6.*6 6.9
1 Wages and salaries of employees plus employers’ contributions for social insurance and private benefit plans. Also includes an estimate of wages salaries and supplementary payments for the self-employed. ’ ’
2 Compensation per man-hour adjusted for changes in the consumer price index.3 Percent change based on aggregates.4 C urrent quarter d iv id e d b y co m p a r a b le quarter a y e a r a g o .
Source: Output data from the Office of Business Economics, U.S. Department of Commerce. Man-hours and compensation of all persons from the Bureau of Labor Statistics. See BLS Handbook of Methods for Surveys and Studies--Chapter 22. Output Per Man-Hour Measures, Private Economy.
Digitized for FRASER http://fraser.stlouisfed.org/ Federal Reserve Bank of St. Louis

119 ESTABLISHMENT DATASTATE AND AREA HOURS AND EARNINGS
C-10: Gross hours a n d e a rn in g s of p ro d u c t io n workers on m a n u fa c tu r in g p a y ro l ls ,by State a n d se lec ted a r e a s
State and areaAverage weekly earnings Average weekly hours Average hourly earnings
O c t .1969
S e p t .1969
O c t .1968
O c t .1969
S e p t .1969
O c t .1968
O c t .1969
S e p t .1969
O c t .1968
ALABAMA ................................................................................. $112.61 $112.89 $106.14 41.1 ~4I72---- ---- 4T73 $2774----- $2.74---- $2757-----135.62 134.88 126.18 41.6 41.5 41.1 3.26 3.25 3.07
Mobile ................................................................................... 130.31 133.67 129.86 41.5 42.3 43.0 3.14 3.16 3.02
ALASKA .................................................................................... ( * ) 200.69 176.11 ( * ) 40.3 40.3 <*) 4.98 4.37
ARIZO N A.................................................................................... 126.63 126.54 123.71 40.2 40.3 41.1 3.15 3.14 3.01127.43 126.40 125.77 40.2 40.0 41.1 3.17 3.16 3.06134.46 132.80 124.95 41.5 41.5 40.7 3.24 3.20 3.07
ARKANSAS................................................................................. 96.46 97.64 92.70 40.7 41.2 41.2 2.37 2.37 2.2591.41 96.12 87.70 39.4 40.9 40.6 2.32 2.35 2.16
Little Rock-North Little Rock ....................................... 100.00 101.18 97.64 40.0 40.8 41.2 2.50 2.48 2.37Pine Bluff .............................................................................. 122.78 121.01 114.68 41.2 41.3 41.7 2.98 2.93 2.75
C A L IF O R N IA ........................................................................... 148.67 148.56 142.45 40.4 40.7 40.7 3.68 3.65 3.50Anaheim-Santa Ana-Garden G r o v e ................................. 148.92 150.70 140.63 40.8 41.4 41.0 3.65 3.64 3.43
149.88 151.03 145.25 40.4 40.6 41.5 3.71 3.72 3.50123.80 121.91 121.10 39.3 38.7 40.1 3.15 3.15 3.02
Los Angeles-Long Beach ................................................ 145.25 144.54 139.54 40.8 40.6 40.8 3.56 3.56 3.42Modesto-Turlock.................................................................... 125.19 132.07 119.04 39.0 41.4 38.4 3.21 3.19 3.10Oznard-Ventura..................................................................... 126.55 126.68 125.36 38.7 39.1 41.1 3.27 3.24 3.05Sacram ento............................................................................. 153.58 158.12 155.36 38.3 41.5 41.1 4.01 3.81 3.78Salinas-M onterey.................................... ............................. 134.13 135.34 125.06 39.8 40.4 39.7 3.37 3.35 3.15San Bemardino-Riverside-Ontario ................................. 141.50 144.94 143.94 40.2 40.6 41.6 3.52 3.57 3.46San Diego-................................................................................. 161.18 157.99 151.10 40.6 40.2 40.4 3.97 3.93 3.74San Francisco-Oak land ................................................... 161.95 162.81 154.80 39.5 40.1 40.0 4.10 4.06 3.87San J ose ................................................................................ 155.16 154.09 146.97 40.3 41.2 40.6 3.85 3.74 3.62Santa B a rb ara ....................................................................... 132.38 140.70 129.89 39.4 40.2 39.6 3.36 3.50 3.28Santa Rosa .......................................................................... 129.69 126.34 121.48 39.3 38.4 39.7 3.30 3.29 3.06Stnckrnn ............................................................ 146.12 147.63 138.38 39.6 42.3 40.7 3.69 3.49 3.40Vallejo-Napa ........................................................................ 137.83 142.40 132.50 38.5 38.8 39.2 3.58 3.67 3.38
COLORADO .............................................................................. ( * ) ( * ) 129.60 ( * ) ( * ) 40.5 ( * ) ( * ) 3.20Denver .................................................................................... <*) ( * ) 134.72 <*> ( * ) 40.7 ( * ) ( * ) 3.31
CONNECTICUT........................................................................ 139.44 139.26 131.98 42.0 42.2 42.3 3.32 3.30 3.12Bridgeport ............... .............................................................. 142.72 143.06 137.82 42.1 42.2 42.8 3.39 3.39 3.22
148.94 153.04 143.55 42.8 43.6 43.5 3.48 3.51 3.30New Britain ..........................................................................New H a v en .............................................................................Stamford ................................................................................Waterbury .............................................................................
141.79 138.86 131.77 42.2 41.7 41.7 3.36 3.33 3.16138.44 139.35 131.04 41.7 42.1 41.6 3.32 3.31 3.15148.67 145.67 137.70 42.6 42.1 42.5 3.49 3.46 3.24125.56 126.27 122.35 40.9 41.4 41.9 3.07 3.05 2.92
DELAWARE ............................................................................. 131.93 136.94 142.23 40.1 41.0 43.1 3.29 3.34 3.30Wilmington .......................................................................... 147.42 153.14 158.05 40.5 41.5 43.3 3.64 3.69 3.65
DISTRICT OF COLUMBIA :Washington SM SA .................................................................. ( * ) 140.66 130.87 ( * ) 39.4 39.3 <*> 3.57 3.33
FLORIDA ................................................................................ ( * ) 115.92 108.99 < *) 41.4 41.6 ( * ) 2.80 2.62Fort Lauderdale-Hollywood ............................................. ( * ) 112.75 102.62 ( * ) 39.7 40.4 ( * ) 2.84 2.54J ack son v ille .................................... .. ................................... (*) 123.26 107.59 <*) 42.8 40.6 ( * ) 2.88 2.65Miami ...................................................................................... ( * ) 111.65 101.35 ( * ) 41.2 41.2 ( * ) 2.71 2.46O rla n d o ................................................................................... ( * ) 115.83 116.53 ( * ) 40.5 43.0 ( * ) 2.86 2.71Pensacola .............................................................................. ( * ) 133.90 128.74 ( * ) 41.2 41.8 ( * ) 3.25 3.08Tampa-St. P etersb u rg .................................... .. ................. ( * ) 118.02 112.52 ( * ) 42.0 42.3 ( * ) 2.81 2.66West Palm B e a c h ................................................................. ( * ) 122.72 116.41 ( * ) 40.5 43.6 ( * ) 3.03 2.67
GEORGIA ................................................................................ 108.21 106.97 100.19 41.3 41.3 41.4 2.62 2.59 2.42Atlanta ................................................................................... 135.79 131.54 125.82 40.9 40.6 41.8 3.32 3.24 3.01Savannah ................................................................................ 131.63 130.51 125.42 42.6 42.1 43.1 3.09 3.10 2.91
H A W AII.....................................................................: .............. 130.49 127.20 121.36 40.4 40.0 41.0 3.23 3.18 2.96Honolulu ................................................................................. 135.05 126.43 121.39 40.8 38.9 40.6 3.31 3.25 2.99
IDAHO ...................................................................................... 125.26 129.87 120.87 38.9 39.0 39.5 3.22 3.33 3.06
ILLINOIS ................................................................................. <*) 144.93 136.82 (*) 41.5 41.3 (*) 3.50 3.31C h ica g o .................................................................................... (*) 147.26 138.13 (*) 41.4 41.3 (*) 3.55 3.35Davenport-Rock Island-Moline ....................................... (*) 153.45 152.11 <*) 40.2 40.0 (*) 3.82 3.80
See footnotes at end of table.
NOTE: Data for the current month are preliminary.
Digitized for FRASER http://fraser.stlouisfed.org/ Federal Reserve Bank of St. Louis

ESTABLISHMENT DATASTATE AND AREA HOURS AND EARNINGS
120
C-10: Gross hours and earnings of production workers on manufacturing payrolls,by S ta te a n d se lec ted a r e a s - -C o n t in u e d
State and areaAverage weekly earnings Average weekly hours Average hourly earnings
Oct.1969
Sept.1969
Oct.1968
Oct.1969
Sept.1969
Oct.1968
Oct.1969
Sept.1969
Oct.1968
ILLINOIS (continued)(*) $161.79 $158.57 <*) 41.8 42.2 (*) $3.87 $3.76
Rockford............................................................................................ (*) 155.82 146.38 (*) 44.0 43.9 (*) 3.54 3.33
INDIANA................................................................................................ $146.78 148.10 138.84 41.0 41.6 41.2 $3.58 3.56 3.37Indianapolis....................................................................................... (*) 149.23 139.52 (*) 41.8 41.4 (*) 3.57 3.37
IOWA..................................................................................................... 143.72 142.61 134.97 40.6 40.4 41.1 3.54 3.53 3.29Cedar Rapids................................................................... .............. 142.27 144.01 131.91 41.0 41.5 41.1 3.47 3.47 3.21Des M oines....................................................................................... 158.80 157.17 142.31 41.9 41.8 40.6 3.79 3.76 3.51Dubuque ............................................................................................ 157.38 160.74 145.81 38.2 39.3 39.3 4.12 4.09 3.71Sioux C ity .......................................................................................... 132.40 132.82 132.11 41.9 41.9 43.4 3.16 3.17 3.04W aterloo............................................................................................. 158.80 152.82 170.08 39.9 39.9 43.6 3.98 3.83 3.90
KANSAS............................................................................................... 131.32 130.84 130.58 42.3 42.4 42.7 3.11 3.08 3.06Topeka................................................................................................ 163.75 161.02 153.62 46.4 46.5 45.2 3.53 3.46 3.40Wichita................................................................................................ (*) 135.92 136.75 (*) 42.5 42.2 (*) 3.20 3.24
KENTUCKY......................................................................................... 124.93 124.31 119.48 40.3 40.1 40.5 3.10 3.10 2.95L ou isville ....................................................................................... 138.01 137.95 140.61 39.6 39.7 41.9 3.48 3.48 3.36
LOUISIANA......................................................................................... 131.70 130.93 122.60 42.9 42.1 41.7 3.07 3.11 2.94Baton R o u g e ................................................................................... 157.92 158.79 148.06 42.0 42.8 40.9 3.76 3.71 3.62
136.59 135.22 128.44 41.9 41.1 41.7 3.26 3.29 3.08123.61 122.18 108.88 41.9 41.7 41.4 2.95 2.93 2.63
MAINE.................................................................................................. 105.06 104.66 99.38 40.1 40.1 40.4 2.62 2.61 2.4684.01 86.11 85.58 35.9 36.8 37.7 2.34 2.34 2.27
111.23 110.57 104.40 40.3 40.5 40.0 2.76 2.73 2.61
MARYLAND ...................................................................................... 131.45 134.07 123.12 40.2 41.0 40.5 3.27 3.27 3.04136.00 140.08 126.45 40.0 41.2 40.4 3.40 3.40 3.13
MASSACHUSETTS........................................................................... 122.85 124.00 118.55 39.5 40.0 40.6 3.11 3.10 2.92131.32 132.93 127.48 39.2 39.8 40.6 3.35 3.34 3.14104.99 103.97 101.14 37.1 37.0 38.9 2.83 2.81 2.60
Fall R iver......................................................................................... 91.87 91.35 89.55 35.2 35.0 36.7 2.61 2.61 2.44Lawrence-Haverhill............................................ .......................... 115.42 115.60 112.48 39.8 40.0 41.2 2.90 2.89 2.73Lowell . . ......................................................................................... 107.03 108.98 103.83 38.5 39.2 40.4 2.78 2.78 2.57
98.10 98.47 97.25 37.3 37.3 38.9 2.63 2.64 2.50Springfield-Chicopee-Holyoke................................................... 127.20 128.21 119.50 40.0 40.7 40.1 3.18 3.15 2.98
130.80 131.46 123.72 40.0 40.7 40.3 3.27 3.23 3.07
MICHIGAN............................................................................................ 169.03 172.27 170.51 42.3 42.8 44.3 4.00 4.03 3.85161.66 163.95 170.07 40.7 41.1 42.7 3.97 3.99 3.98
Battle Creek . . ............................................................................. 163.69 165.46 155.34 42.2 42.7 42.9 3.88 3.88 3.62Bay C ity ............................................................................................ 151.22 155.96 160.26 41.6 43.0 45.4 3.64 3.63 3.53
182.80 185.97 179.47 43.4 43.8 44.8 4.21 4.25 4.01F lin t .................................................................................................. 186.52 190.86 187.39 42.0 42.9 42.9 4.44 4.45 4.37
146.36 150.23 142.68 40.7 41.8 42.4 3.60 3.59 3.37155.88 160.38 150.73 40.0 40.8 40.4 3.90 3.93 3.73
K ala m a zoo ...................................................................................... 158.99 160.76 148.50 43.5 43.9 42.5 3.66 3.66 3.49L a n s in g ............................................................................................ 172.66 180.67 192.83 42.0 43.4 46.6 4.11 4.16 4.14Muskegon-Muskegon H eights...................................................... 149.07 149.60 137.22 41.5 42.2 40.1 3.59 3.55 3.42S aginaw ............................................................................................ 173.19 169.57 181.08 42.2 41.9 45.0 4.10 4.05 4.02
MINNESOTA...................................................................................... 140.61 138.65 131.43 41.4 41.5 41.3 3.40 3.34 3.18Duluth-Superior............................................................................. 127.50 127.65 121.28 39.1 39.2 39.3 3.26 3.26 3.08Minneapolis-St. P a u l..................................................................... 149.31 147.97 139.55 41.7 41.6 41.8 3.58 3.56 3.33
MISSISSIPPI...................................................................................... 95.88 97.06 93.60 40.8 41.3 41.6 2.35 2.35 2.25Jackson ............................................................................................ 92.75 94.58 92.96 40.5 41.3 41.5 2.29 2.29 2.24
MISSOURI............................................................................................ 130.15 130.80 126.98 39.8 40.0 40.7 3.27 3.27 3.12Kansas City...................................................................................... 129.20 131.22 130.29 40.0 40.5 41.1 3.23 3.24 3.17
139.53 142.14 130.66 42.8 43.6 43.7 3.26 3.26 2.99147.06 147.83 141.45 40.4 40.5 41.0 3.64 3.65 3.45
Springfield...............................................................'...................... .. 106.14 106.47 • 39.4 39.7 2.70 2.68
MONTANA............................................................................................ 144.08 145.44 136.18 40.7 41.2 41.9 3.54 3.53 3.25
NEBRASKA. - , .......................................................................... 128.30 128.97 124.31 42.6 43.1 43.3 3.01 2.99 2.87131.08 130.84 127.78 41.8 41.9 42.8 3.14 3.12 2.98
See footnotes at end of table.
NOTE- Data for the current month are preliminary.
Digitized for FRASER http://fraser.stlouisfed.org/ Federal Reserve Bank of St. Louis

121 ESTABLISHMENT DATASTATE AND AREA HOURS AND EARNINGS
C-10: Gross hours and earnings off production workers on manufacturing payrolls,by S ta te a n d s e lec ted a r e a s - -C o n t in u e d
State and areaAverage weekly eamings Average weekly hours Average hourly eamings
O ct.1969
S ep t.1969
O ct.1968
O ct.1969
S ep t.1969
O ct.1968
O ct.1969
S ep t.1969
O ct.1968
NEVADA................................................................................ $157.17 $159 .58 $152.49 3 9 .0 3 9 .5 3 9 .1 $4 .03 $4 .0 4 $3 .90
NEW HAMPSHIRE 1 ........................................................... 105 .60 105 .74 101 .66 3 9 .7 39 .9 4 0 .5 2 .6 6 2 .6 5 2 .5 1Manchester 1 ................................................................... 9 7 .1 4 96 .0 0 90 .62 3 8 .7 3 8 .4 3 8 .4 2 .5 1 2 .5 0 2 .3 6
NEW JERSEY........................................................................ 135 .63 135 .55 129 .68 4 1 .1 4 1 .2 4 1 .3 3 .3 0 3 .2 9 3 .1 4Atlantic C ity ...................................................................... 107 .87 107 .33 102 .72 4 0 .1 39 .9 4 0 .6 2 .6 9 2 .69 2 .5 3Camden 2 ........................................................................ 137.61 136 .27 130 .82 4 1 .2 4 0 .8 4 1 .4 3 .3 4 3 .3 4 3 .1 6
143 .56 142 .80 130 .00 4 2 .6 4 2 .5 4 1 .4 3 .3 7 3 .3 6 3 .1 4Newark 3 ........................................................................... 135.81 134 .34 131 .04 4 0 .3 4 0 .1 4 1 .6 3 .3 7 3 .3 5 3 .1 5
136 .70 137 .19 130 .41 4 1 .3 4 1 .7 4 1 .4 3 .3 1 3 .2 9 3 .1 5139 .88 138 .99 136 .62 4 0 .9 4 1 .0 4 1 .4 3 .4 2 3 .39 3 .3 0126.72 129 .04 128 .11 4 0 .1 4 0 .2 4 0 .8 3 .1 6 3 .21 3 .1 4
NEW MEXICO...................................................................... 108 .25 108 .40 102 .00 3 8 .8 4 0 .0 4 0 .0 2 .7 9 2 .71 2 .5 5122 .18 121 .51 110 .57 4 1 .7 4 1 .9 4 0 .5 2 .9 3 2 .9 0 2 .7 3
NEW YORK........................................................................... ( * )142 .27
130 .22 124 .93 (* )4 1 .0
39 .7 4 0 .3 (* )3 .4 7
3 .2 8 3 .1 0143 .24 133 .90 4 1 .4 4 0 .7 3 .4 6 3 .2 9
Binghamton........................................................................ 136 .10 136 .21 126 .84 4 2 .4 4 2 .3 4 2 .0 3 .2 1 3 .2 2 3 .0 2Buffalo................................................................................ 156.49 158 .38 147 .97 4 1 .4 4 1 .9 4 1 .8 3 .7 8 3 .7 8 3 .5 4Elmira.................................................................................. 121 .83 124 .00 114 .80 3 9 .3 4 0 .0 4 0 .0 3 .1 0 3 .1 0 2 .87Monroe County * ........................................... .. ................ 160 .02 162 .35 150 .23 4 2 .0 4 2 .5 4 2 .2 3 .8 1 3 .8 2 3 .5 6Nassau and Suffolk Counties 5 ........................................ 129 .82 128 .95 126 .28 3 9 .7 3 9 .8 4 1 .0 3 .2 7 3 .2 4 3 .0 8New York-Northeastern New J e rse y ............................. (* ) 128 .12 124 .31 (* ) 3 9 .3 4 0 .1 (* ) 3 .2 6 3 .1 0New York SMSA 3 ........................................................... (* ) 122 .24 119 .47 (* ) 3 8 .2 3 9 .3 (* ) 3 .2 0 3 .0 4New York City 5 ................................................................ ( * ) 120 .26 117 .56 <*> 37 .7 3 8 .8 (* ) 3 .1 9 3 .0 3Rochester........................................................................... 153 .67 156 .71 143 .90 42 .1 4 2 .7 4 2 .2 3 .6 5 3 .6 7 3 .4 1Rockland County 5 ........................................................ 133 .22 132 .19 130 .90 4 1 .5 4 1 .7 4 2 .5 3 .2 1 3 .1 7 3 .0 8Syracuse.................. ............................................................ 139 .74 141 .10 135 .56 4 1 .4 4 1 .5 4 2 .1 3 .4 0 3 .4 0 3 .2 2Utica-Rome........................................................................... 126 .86 125 .33 119 .48 4 0 .4 4 0 .3 4 1 .2 3 .1 4 3 .11 2 .9 0Westchester County 5 ...................................................... 127 .92 129 .56 128 .64 3 9 .0 3 9 .5 4 1 .1 3 .2 8 3 .2 8 3 .1 3
NORTH CAROLINA............................................................. 96 .87 95 .99 92 .06 4 0 .7 4 0 .5 4 1 .1 2 .3 8 2 .3 7 2 .2 4Asheville........................................................................... ..Charlotte.............................................................................
93 .3 8100 .86
92 .29100 .70
8 9 .5 49 6 .7 4
4 0 .64 1 .0
4 0 .34 1 .1
4 0 .74 1 .7
2 .3 02 .4 6
2 .2 92 .4 5
2 .2 02 .3 2
Greensboro—Winston-Salem—High Point . . . . . . . . . . . 102 .70 102 .31 9 7 .8 4 3 9 .5 3 9 .5 4 0 .1 2 .6 0 2 .59 2 .4 4R aleigh ........................................................ ...................... 98 .33 97 .7 5 89 .28 4 0 .8 4 0 .9 4 0 .4 2 .4 1 2 .39 2 .2 1
NORTH DAKOTA...................................................................Fargo-Moorhead................... .. ............................................
118 .20129.71
115 .62122 .29
109 .94115 .83
41 .14 0 .7
4 0 .238 .7
4 0 .23 9 .8
2 .8 73 .19
2 .873 .1 6
2 .7 32 .91
OHIO........................................................................................ 154.27 156 .27 146 .09 4 1 .9 4 2 .4 42 .1 3 .6 8 3 .69 3 .4 7Akron. ................................................................................... 173 .33 172 .18 165 .61 4 3 .0 4 3 .0 4 3 .3 4 .0 3 4 .0 0 3 .8 2Canton........... ...................................................... 153 .25 158 .63 138 .24 4 1 .2 4 2 .5 4 0 .2 3 .7 2 3 .7 3 3 .4 4C in c in n a t i . . . . . . . . . . . . . . . . . . . . . . . . . . . . . . 142 .38 144 .28 135 .24 4 2 .0 4 2 .4 4 2 .1 3 .3 9 3 .4 0 3 .2 1C l e v e l a n d ........................................................... ... 161 .74 161 .01 150 .13 4 2 .6 4 2 .6 4 2 .4 3 .8 0 3 .7 8 3 .5 4Columbus........................................................................... .. 143.77 144 .04 136 .87 4 1 .0 4 1 .1 4 0 .8 3 .5 1 3 .5 0 3 .3 5Dayton................................................................................ .. 172 .69 175 .39 167 .45 4 2 .4 4 3 .0 4 3 .5 4 .0 7 4 .0 8 3 .8 5Toledo................................................................................... 169 .14 174 .98 166 .60 4 3 .4 4 4 .9 4 4 .6 3 .9 0 3 .9 0 3 .7 4Youngstown-Warren........................................................... .. 155 .76 162 .97 147 .55 4 0 .1 4 1 .4 40 .1 3 .8 8 3 .9 4 3 .6 8
OKLAHOMA........................................................................... .. 123 .30 125 .63 117 .45 4 1 .1 4 1 .6 4 1 .5 3 .0 0 3 .02 2 .8 3Oklahoma C ity ........................................................ .. 121 .13 122 .72 114 .26 4 1 .2 4 1 .6 4 1 .7 2 .9 4 2 .9 5 2 .7 4Tulsa................... ............................ .................................... 138 .03 139 .11 130 .51 4 1 .7 4 1 .9 4 2 .1 3 .31 3 .3 2 3 .1 0
OREGON................................................................................ 138 .68 143 .78 131 .77 38 .1 3 9 .5 3 9 .1 3 .6 4 3 .6 4 3 .3 7Eugene................................................................................ 144 .39 153 .22 139 .74 3 7 .7 4 1 .3 4 1 .1 3 .8 3 3 .7 1 3 .4 0Portland.............................................................................. 140 .07 143 .50 133 .72 3 8 .8 3 9 .1 3 9 .1 3 .61 3 .67 3 .4 2
PENNSYLVANIA................................................................ 130 .25 130 .65 121 .50 4 0 .2 4 0 .2 4 0 .1 3 .2 4 3 .2 5 3 .0 3Allentown-Bethlehem-Easton................ .................... .. 127 .01 126 .94 116 .91 3 9 .2 3 9 .3 3 9 .1 3 .2 4 3 .2 3 2 .99Altoona................................................................................ 109 .09 109 .65 100 .88 3 9 .1 3 9 .3 3 9 .1 2 .7 9 2 .7 9 2 .5 8Erie...................................................................................... 140 .25 142 .56 133 .14 4 2 .5 4 3 .2 4 2 .4 3 .3 0 3 .3 0 3 .1 4Harrisburg........................................................................... 118 .50 120 .88 110 .25 3 9 .9 4 0 .7 3 9 .8 2 .9 7 2 .9 7 2 .7 7Johnstown................ ........................... ........................... 130 .34 128 .59 116 .18 3 8 .0 3 7 .6 3 7 .0 3 .4 3 3 .4 2 3 .1 4Lancaster................................................................ . . . . 122 .36 120 .25 110 .97 4 1 .2 4 0 .9 4 0 .5 2 .9 7 2 .9 4 2 .7 4Philadelphia........................................ ............................ 139 .26 139 .26 129 .28 4 0 .6 4 0 .6 4 0 .4 3 .4 3 3 .4 3 3 .2 0Pittsburgh........................................................................... 150 .29 151 .37 136 .32 4 0 .4 4 0 .8 3 9 .4 3 .7 2 3 .7 1 3 .4 6Reading................ .................................... .. 115 .94 117 .22 116 .31 3 9 .3 3 9 .6 4 1 .1 2 .9 5 2 .9 6 2 .8 3Scranton.............................................................................. 101 .11 103 .33 96 .13 3 8 .3 3 8 .7 3 8 .3 2 .6 4 2 .6 7 2 .5 1Wilkes-Barre-Hazleton................................................... 93 .86 9 4 .9 0 88 .5 4 3 6 .1 3 6 .5 3 7 .2 2 .6 0 2 .6 0 2 .3 8Y o rk ................................................................................... 122 .55 121 .25 114 .17 4 2 .7 4 2 .1 4 2 .6 2 .8 7 2 .8 8 2 .6 8
See footnotes at end of table.
NOTE: Data for the current month are preliminary.
Digitized for FRASER http://fraser.stlouisfed.org/ Federal Reserve Bank of St. Louis

ESTABLISHMENT DATASTATE AND AREA HOURS AND EARNINGS
1 22
C-10: Gross hours and earnings of production workers on manufacturing payrolls,b y S ta te a n d s e lec ted a r e a s - -C o n t in u e d
State and areaAverage weekly earnings Average weekly hours Average hourly eamings
Oct.1969
Sept.1969
Oct.1968
Oct.1969
Sept.1969
Oct.1968
Oct.1969
Sept.1969
Oct.1968
RHODE ISLAND................................................................................. $109.33 $109.34 $103.31 39.9 40.2 40.2 $2.74 $2.72 $2.57Providence-Pawtucket-W arwick................................................ 110.95 109.74 103.85 40.2 40.2 40.1 2.76 2.73 2.59
SOUTH CAROLINA........................ .................................................. 100.94 100.94 94.99 41.2 41.2 41.3 2.45 2.45 2.30C h a rleston ....................................................................................... 117.55 121.40 119.00 41.1 42.3 41.9 2.86 2.87 2.84Greenville......................................................................................... 101.57 100.50 93.75 41.8 41.7 41.3 2.43 2.41 2.27
SOUTH D A K O TA ............................................................................. 126.58 124.70 126.21 43.8 43.6 45.4 2.89 2.86 2.78Sioux F a l ls ...................................................................................... 148.80 146.14 144.18 46.5 46.1 47.9 3.20 3.17 3.01
TENNESSEE................................................................................... 105.85 106.37 101.50 40.4 40.6 40.6 2.62 2.62 2.50C hattanooga ................................................................................... 119.23 121.82 112.06 41.4 42.3 41.2 2.88 2.88 2.72K n o x v ille ......................................................................................... 117.31 116.22 112.12 39.9 39.8 39.9 2.94 2.92 2.81Memphis ......................................................................................... 119.25 118.90 113.44 40.7 41.0 41.1 2.93 2.90 2.76N a sh v ille ......................................................................................... 113.43 115.46 109.75 39.8 40.8 40.8 2.85 2.83 2.69
TEXAS....................................................................... 128.13 128.13 121.93 41.6 41.6 41.9 3.08 3.08 2.91Am arillo............................................................T , 116.90 111.50 105.98 41.6 40.4 41.4 2.81 2.76 2.56A u s t in ............................................................................................... 103.98 104.86 99.80 41.1 40.8 40.9 2.53 2.57 2.44Beaumont-Port Arthur-Orange................................................ 164.27 163.12 152.07 41.8 41.4 41.1 3.93 3.94 3.70Corpus C h risti......................................................T T t , 146.30 145.95 137.76 41.8 41.7 42.0 3.50 3.50 3.28D a lla s ............................................................ 121.54 123.31 114.95 41.2 41.8 41.2 2.95 2.95 2.79El Paso ............................................................................. 83.56 84.40 84.00 39.6 40.0 40.0 2.11 2.11 2.10Fort Worth................................. .. .......................T _ T 140.95 142.71 133.56 42.2 42.6 42.4 3.34 3.35 3.15Galveston-Texas C i t y ........................................................... . 188.79 184.47 169.58 43.6 43.0 42.5 4.33 4.29 3.99H ouston ......................................................... 152.69 153.04 141.67 43.5 43.6 42.8 3.51 3.51 3.31Lubbock .......................................................................... 111.50 109.22 101.95 44.6 43.0 43.2 2.50 2.54 2.36San Antonio......................................................T 103.99 103.91 97.29 42.1 41.9 42.3 2.47 2.48 2.30W a co ....................................................................... T _ 110.57 110.68 106.55 40.5 40.1 41.3 2.73 2.76 2.58Wichita F a lls ....................................................................... T t 100.67 102.85 94.19 42.3 42.5 40.6 2.38 2.42 2.32
U T A H .................................................................................................. 123.93 127.83 127.44 37.9 39.7 39.7 3.27 3.22 3.21Salt Lake C ity ................................................................................ 121.16 123.13 123.11 38.1 38.6 40.9 3.18 3.19 3.01
VERMONT ......................................................................................... 117.46 119.43 108.36 41.8 42.2 41.2 2.81 2.83 2.63Burlington...................................................................................... T 126.82 130.94 115.08 42.7 43.5 41.1 2.97 3.01 2.80S prin g fie ld ...................................................................................... 131.29 134.08 116.42 40.9 41.9 39.6 3.21 3.20 2.94
VIRGINIA............................................................................................ 107.30 109.03 103.34 40.8 41.3 41.5 2.63 2.64 2.49Lynchburg......................................................................................... 107.95 108.80 99.88 42.5 42.5 42.5 2.54 2.56 2.35Norfolk-Portsmouth........................................................................ 122.67 112.59 115.45 43.5 41.7 42.6 2.82 2.70 2.71Richm ond......................................................................................... 106.96 122.67 111.11 37.4 42.3 40.7 2.86 2.90 2.73Roanoke ............................................................................................ 104.16 105.58 100.01 42.0 42.4 42.2 2.48 2.49 2.37
WASHINGTON.................................... ............................................... 156.80 154.82 145.73 40.0 39.8 39.6 3.92 3.89 3.68Seattle-Everett .............................................................................. 165.65 161.19 153.22 40.8 40.5 39.9 4.06 3.98 3.84Spokane . ......................................................................................... 148.57 147.75 145.30 39.2 39.4 40.7 3.79 3.75 3.57Tacoma............................................................................................... 150.92 150.93 137.90 39.2 38.8 38.2 3.85 3.89 3.61
WEST VIRGINIA................................................................................. 130.49 130.65 122.82 40.4 40.2 40.4 3.23 3.25 3.04C h a rleston ...................................................................................... 164.16 158.95 150.84 43.2 42.5 41.9 3.80 3.74 3.60Huntington-Ashland........................................................................ 138.60 143.64 128.54 39.6 39.9 38.6 3.50 3.60 3.33Wheeling............................................................................................ 133.72 133.65 128.96 40.4 40.5 40.3 3.31 3.30 3.20
WISCONSIN........................................................................... 143.92 143.71 134.00 41.4 41.9 41.4 3.48 3.43 3.24Green B a y ...................................................... 143.33 142.53 131.52 42.4 42.9 41.8 3.38 3.32 3.14K enosha............................................................... T , 165.56 164.49 139.12 42.5 42.3 39.3 3.90 3.89 3.54La C rosse ...................................................................................... .. 118.09 114.00 111.52 39.6 39.9 39.7 2.98 2.86 2.81M adison ............................................................ 154.25 154.92 144.43 40.5 41.5 40.9 3.81 3.74 3.53Milwaukee................................................................. 154.01 156.13 142.55 41.0 41.4 40.8 3.76 3.77 3.49R a cin e ........................................................................ 157.52 159.79 136.42 42.6 43.0 40.5 3.69 3.72 3.37
WYOMING............................................................................................ 117.00 132.33 115.13 37.5 40.1 38.7 3.12 3.30 2.98C asp er............................................................................................... 151.44 151.18 144.84 40.6 40.1 41.5 3.73 3.77 3.49
1 Revised ser ies ; not s t r ic t ly comparable with previously published data.2 Subarea o f Philadelphia, Pennsylvania Standard Metropolitan S ta tistica l Area.3 Area included in New York-Northeastern New Jersey Standard Consolidated Area.4 Subarea o f Rochester Standard Metropolitan S ta tistica l Area.5 Subarea o f New York Standard Metropolitan S ta tistica l Area. *
* Not available.NOTE: Data for the current month are preliminary.SOURCE: Cooperating State agencies lis ted on inside back cover.
Digitized for FRASER http://fraser.stlouisfed.org/ Federal Reserve Bank of St. Louis

1 2 3 ESTABLISHMENT DATALABOR TURNOVER
Dr1< Labor turnover rotas in manufacturing
1958 to data
(Per 100 employee*)
Y e a r F e b . Mac. Apr. May Ja a e Ju ly Aug. Sept. O c t. N o t . D e c .A a a u a laTerage
Total accessions
1958.............. 2.9 2.6 2.8 3.1 3.6 4.7 4.2 4.9 5.0 4.0 3.2 2.7 3.619591 ........... 3.8 3.7 4.1 4.1 4.2 5.4 4.4 5.2 5.1 3.9 3.4 3.6 4.2196a...................... 4.0 3.5 3.3 3.4 3.9 4.7 3.9 4.9 4.8 3.5 2.9 2.3 3.81961.............. 3.7 3.2 4.0 4.0 4.3 5.0 4.4 5.3 4.7 4.3 3.4 2.6 4.11962.............. 4.1 3.6 3.8 4.0 4.3 5.0 4.6 5.1 4.9 3.9 3.0 2.4 4.11963............. 3.6 3.3 3.5 3.9 3.9 4.8 4.3 4.8 4.8 3.9 2.9 2.5 3.9196b.............. 3.6 3.4 3.7 3.8 3.9 5.1 4.4 5.1 4.8 4.0 3.2 2.6 4.01965............... 3.8 3.5 4.0 3.8 4.1 5.6 4.5 5.4 5.5 4.5 3.9 3.1 4.31966.............. 4.6 4.2 4.9 4.6 5.1 6.7 5.1 6.4 6.1 5.1 3.9 2.9 5.01967............. 4.3 3;6 3.9 3.9 4.6 5.9 4.7 5.5 5.3 4.7 3.7 2.8 4.41968............ 4.2 3.8 3.9 4.3 4.6 5.9 5.0 5.7 5.7 5.0 3.8 3*0 4.61969............ 4.6 3.9 4.4 4.5 4.8 6.6 5.1 5.6 5.9 5.0
New hires
1958............... 1.2 1.1 1.1 1.3 1.5 2.2 2.1 2.4 2.6 2.2 1.7 1.3 1.71999* •••>••••• 2.0 2.1 2.4 2.5 2.7 3.7 3.0 3.5 3.5 2.6 1.9 1.5 2.6i960.............. 2.2 2.2 2.0 2.0 2.3 3.0 2.4 2.9 2.8 2.1 1.5 1.0 2.21961.............. 1.5 1.4 1.6 1.8 2.1 2.9 2.5 3.1 3.0 2.7 2.0 1.4 2.21962.............. 2.2 2.1 2.2 2.4 2.8 3.5 2.9 3.2 3.1 2.5 1.8 1.2 2.51963.............. 1.9 1.8 2.0 2.3 2.5 3.3 2.7 3.2 3.2 2.6 1.8 1.4 2.41964...................... 2.0 2.0 2.2 2.4 2.5 3.6 2.9 3.4 3.5 2.8 2.2 1.6 2.61965.............. 2.4 2.4 2.8 2.6 3.0 4.3 3.2 3.9 4.0 3.5 2.9 2.2 3.11966.............. 3.2 3.1 3.7 3.6 4.1 5.6 3.9 4.8 4.7 4.2 3.1 2.1 3.81967............. 3.0 2.7 2.8 2.8 3.3 4.6 3.3 4.0 4.1 3.7 2.8 2.0 3.31968............. 3.0 2.7 2.9 3.2 3.6 4.7 3.7 4.3 4.5 4.0 2.9 2.2 3.51969............. 3.3 3.0 3.4 3.5 3.8 5.4 3.9 4.3 4.8 4.0
Total separations
1958.............. 5.4 4.1 4.5 4.4 3.9 3.5 3.7 4.1 4.5 4.1 3.6 3.5 4.11S59X .......... 3.7 3.1 3.3 3-6 3.5 3.6 4.0 4.6 5.3 5.5 4.7 3.9 4.11&>............. 3.6 3.5 4.0 4.2 3.9 4.0 4.4 4.8 5.3 4.7 4.5 4.8 4.31961.............. 4.7 3.9 3.8 3.4 3.5 3.6 4.1 4.2 5.1 4.2 4.0 4.0 4.01962.............. 3.9 3.4 3.6 3.6 3.8 3.8 4.4 5.1 5.0 4.4 4.0 3.8 4.11963............. 4.0 3-2 3.5 3.6 3.6 3.4 4.1 4.8 4.9 4.1 3.9 3.7 3.91964............... 4.0 3.3 3.5 3.5 3.6 3.5 4.4 4.3 5.1 4.2 3.6 3.7 3.91965.............. 3.7 3.1 3.4 3.7 3.6 3.6 4.3 54 5.6 |*.5 3-9 4.1 4.11966.............. 4.0 3.6 4.1 4.3 4.3 4.4 5.3 5.8 6.6 4.8 4.3 4.2 4.61 9 6 7 ............. 4.5 4.0 4.6 4.3 4.2 4.3 4.8 5.3 6.2 4.7 4.0 3.9 4.61968............ 4.4 3.9 4.1 4.1 4.3 4.1 5.0 6.0 6.3 4.9 4.1 3.8 4.61969............ 4.5 4.0 4.4 4.5 4.6 4.5 5.3 6.2 6.6 5.3
Quits
1958............. .9 .8 .8 .8 .9 1 .0 1.1 1.5 1.9 1,3 1 .0 .8 1.11959............. 1.1 1 .0 1.2 1.4 1.5 1.5 1.6 2.1 2.6 1.7 1.2 1 .0 1.5I960.............. 1.2 1.2 1.2 1.4 1.3 1.4 1.4 1.8 2.3 1.3 .9 .7 1.31961.............. .9 .8 .9 1.0 1.1 1.2 1.2 1.7 2.3 1.4 1.1 .9 1.21962............... 1.1 1.1 1.2 1.3 1.5 1.5 1.4 2.1 2.4 1.5 1.1 .8 1.41963............... 1.1 1 .0 1.2 1.3 1.4 1.4 1.4 2.1 2.4 1.5 1.1 .8 1.41964............... 1.2 1.1 1.2 1.3 1.5 1.4 1.5 2.1 2.7 1.7 1.2 1 .0 1.51965............... 1.4 1.3 1.5 1.7 1.7 1.7 1.8 2.6 3.5 2.2 1.7 1.4 1.91966.............. 1.9 1.8 2.3 2.5 2.5 2.5 2.5 3.6 4.5 2.8 2.1 1.7 2.61967............ 2.1 1.9 2.1 2.2 2.2 2.3 2.1 3.2 4.0 2.5 1.9 1.5 2.31968............ 2.0 1.9 2.1 2.2 2.4 2.2 2.3 3.7 4.1 2.8 2.1 1.6 2.51969............ 2.3 2.1 2.4 2.6 2.7 2.6 2.6 4.0 4.4 3.0
Layoffs
1958............... 4.0 2.9 3.3 3.2 2.6 2.0 2.3 2.1 2.1 2.3 2.2 2.4 2.61959.............. 2.1 1.5 1.6 1.6 1.4 1.4 1.8 1.8 2.0 3.2 2.9 2.4 2.0I960............... 1.8 1.7 2.2 2.2 1.9 2.0 2.4 2.4 2.4 2.8 3-1 3.6 2.41961.............. 3.2 2.6 2.3 1.9 1.8 1.8 2.3 1.8 2.1 2.0 2.2 2.6 2.2•1962.............. 2.1 1.7 1.6 1.6 1.6 1.6 2.2 2.2 1.9 2.2 2.3 2.5 2.01963............... 2.2 1.6 1.7 1.6 1.5 1.4 2.0 1.9 1.8 1.9 2.1 2.3 1.81964............... 2.0 1.6 1.6 1.4 1.4 1.3 2.1 1.4 1.5 1.8 1.7 2.1 1.71965............... 1.6 1.2 1.2 1.3 1.1 1.1 1.8 1.6 1.3 1.4 1.5 1.9 1.41966.............. 1.3 1 .0 1 .0 1.0 •9 1 .0 2.0 1.1 1 .0 1.1 1.3 1.7 1.21967.............. 1.5 1.3 1.5 1.3 1.1 1.1 1.9 1.2 1.2 1.3 1.3 1.6 1.41968............ 1.5 1.2 1.1 1.0 1 .0 .9 1.7 1.2 1.1 1.2 1.2 1.4 1.21969............. 1.2 1 .0 1 .0 .9 •9 •9 1.6 1.1 1.1 1.2
* Beginning with January 1939, transfers between establishments of the same firm are included in total accessions and total separations, therefore rates for these items are not strictly comparable with prior data. Transfers comprise part of other accessions and other separations, the rates for which are not shown separately.
NOTE: Data include Alaska and Hawaii beginning 1939. This inclusion has not significantly affected the labor turnover series.Data for the current month are preliminary.
Digitized for FRASER http://fraser.stlouisfed.org/ Federal Reserve Bank of St. Louis

ESTABLISHMENT DATALABOR TURNOVER
124
D-2: Labor turnover rates, by industry
(Per 100 employees)
SICCode
Industry
Accession rates Separation ratesTotal New hires Total Quits Layoffs
O c t.1 9 6 9
O c t .1 9 6 9
S ep t.1 9 6 9
O c t .1 9 6 9 m
O c t .1 9 6 9
S ep t.1 9 6 9
O c t .1 9 6 9
S ep t.1 9 6 9
MANUFACTURING ......................................................................................... 5 . 0 5 . 9 4 . 0 4 . 8 5 . 3 6 . 6 3 . 0 , 4 . 4 1. 2 1. 1
19,24,25,32-39 DURABLE G O O DS...................................................................................... 4 . 5 5 . 4 3 . 8 4 . 4 4 . 9 6 . 1 2 . 7 4 . 0 1. 1 . 9
20-23,26-31 NONDURABLE G O O D S............................................................................. 5 . 6 6 . 6 4 . 5 5 . 3 5 . 8 7. 4 3 . 4 5 . 0 1. 5 1. 4
D u r a b le Goods
19 ORDNANCE AND ACCESSORIES....................................................................... 2 . 3 2 . 8 1. 5 2. 1 3 . 6 5 . 2 1. 7 2. 9 1. 1 1 . 4192 Ammunition, except for small a rm s ............................................................ 2 . 4 2 . 8 1 .4 2. 0 3 . 8 5 . 4 1. 7 2 . 9 1. 2 1. 6
24 LUMBER AND WOOD PRODUCTS........................................................................... 5 . 7 7 . 1 5 . 0 6 . 4 6 . 4 8 . 9 4 . 3 6 . 7 1. 1 1. 0242 Sawmills and planing m ills............................................................................. 5 . 5 6 . 5 5 . 0 6 . 0 6 . 0 8 . 1 4 . 5 6. 2 ! 6 . 92421 Sawmills and planing mills, g e n e ra l...................................................... 5 . 1 6 . 0 4 . 6 5 . 5 5 . 7 7. 8 4 . 1 5 . 8 . 6 1. 0243 Mill work, plywood & related products........................................................ 4 . 8 6 . 4 4 . 1 5 . 7 6 . 1 8 . 4 3 . 8 6 . 2 1 . 4 1. 32431 M illwork........................................................................................................... 3 . 5 5 . 4 3 . 2 4 . 9 6 . 2 7. 4 3 . 4 5 . 5 2 . 1 1. 12432 Veneer and plywood...................................................................................... 6 . 0 6 . 2 4 . 8 5 . 3 5 . 5 8 . 2 4 . 1 5 . 8 . 5 1. 5244 Wooden conta iners............................................................................................ 8 . 9 9 . 7 8 . 1 8 . 4 9 . 3 11 . 2 5 . 7 7 . 7 2 . 1 1. 52441,2 Wooden boxes, shook, and c r a te s ............................................................ 7 . 7 9 . 0 6 . 9 8 . 1 8 . 2 11. 1 4 . 5 7. 8 2 . 3 1. 7249 Miscellaneous wood products....................................................................... 6 . 5 8 . 0 5 . 9 7 . 4 6 . 4 8 . 7 4 . 5 6 . 8 . 7 . 4
25 FURNITURE AND F IX TU R E S ............................................................................. 6 . 8 8 . 5 6 . 1 7. 8 6 . 6 8 . 8 4 . 7 6 . 8 . 5 . 6251 Household furniture......................................................................................... 7 . 0 8 . 9 6 . 2 8 . 1 6 . 9 9 . 1 5 . 0 7. 0 . 4 . 62511 Wood household furniture............................................................................. 6 . 1 8 . 3 5 . 6 7 . 6 6. 7 9 . 0 4 . 9 7 . 1 . 4 . 52512 Upholstered household furniture............................................................... 5 . 5 7 . 3 5 . 2 6 . 7 5 . 2 6 . 8 4 . 0 5 . 6 . 3 . 52515 Mattresses and bedsp rin gs....................................................................... 9 . 8 11 . 0 9 . 3 1 0 . 2 8 . 9 11 . 5 6 . 5 8 . 2 . 6 1. 3252 Office furniture.................................................................................................. ( l ) 7. 1 ( * ) 6. 7 l 1 ) 7. 9 H 6 . 6 ( ' ) . 1
32 STONE, CLAY, AND GLASS PRODUCTS........................................................... 5 . 2 5 . 7 4 . 3 5. 0 5 . 6 7 . 2 3 . 3 5 . 1 1. 1 . 9321 Flat g l a s s ........................................................................................................... 2 . 5 3 . 4 . 5 1. 3 2. 7 4 . 3 . 4 1. 5 2 . 1 2 . 0322 Glass and glassware, pressed or blown...................................................... 5 . 2 5 . 7 4 . 2 4 . 6 5 . 3 6 . 9 3 . 2 5 . 2 . 8 . 53221 Glass containers............................................................................................ 5 . 5 5 . 8 4 . 9 5 . 0 6 . 0 8 . 1 3. 7 6 . 4 1. 0 . 63229 Pressed and blown glass, n e c .............................................................. 4 . 8 5 . 5 3 . 3 4 . 0 4 . 4 5 . 3 2 . 4 3 . 5 . 6 . 3324 Cement, h y d rau lic ............................................................................................ 2 . 4 2. 4 1. 6 2. 2 2 . 0 4 . 9 1. 1 3 . 4 . 3 . 7325 Structural clay products................................................................................... 5 . 0 6 . 1 4 . 5 5 . 5 6 . 6 8 . 7 4 . 8 6 . 7 . 9 . 83251 Brick and structural clay tile ..................................................................... 5 . 8 6 . 3 5 . 2 5 . 6 7 . 8 9 . 2 5 . 6 7 . 6 1. 1 . 5326 Pottery and related products.......................................................................... 5 . 7 6 . 6 5 . 2 5 . 8 4 . 6 6 . 5 3 . 2 5 . 1 . 1 . 33291 Abrasive products......................................................................................... 4 . 7 5 . 1 4 . 4 4 . 8 4 . 1 5 . 3 2 . 3 4 . 0 . 4 . 3
33 PRIMARY METAL INDUSTRIES.......................................................................... 4 . 0 4 . 6 3 . 3 3 . 6 4 . 1 5 . 8 2 . 3 4 . 0 . 5 . 5331 Blast furnace and basic steel products...................................................... 2 . 7 3. 3 2. 0 2 . 5 3 . 2 5 . 4 1 .5 3 . 9 . 5 . 43312 Blast furnaces and steel m il ls ................................................................. 2 . 7 3 . 1 1 .9 2 . 3 3 . 1 5 . 4 1 .4 3 . 9 . 5 . 4332 Iron and steel foundries................................................................................... 6 . 8 7 . 3 6 . 3 6 . 1 6 . 4 7 . 3 4 . 3 4 . 9 . 4 . 63321 Gray iron foundries...................................................................................... 7 . 1 7 . 7 6 . 4 6 . 2 6 . 3 7 . 5 4 . 5 5 . 1 . 3 . 73322 Malleable iron foundries............................................................................. n 8 . 0 n 6 . 9 C ) 7. 9 n 5 . 2 n . 73323 Steel foundries............................................................................................... 6 . 2 6 . 3 5 . 8 5 . 7 6 . 1 6 . 5 3 . 6 4 . 4 . 6 . 4333,4 Nonferrous m e t a ls ............................................................................................ 3 . 7 4 . 1 3 . 3 3 . 5 3 . 5 6 . 3 2 . 2 4 . 7 . 4 . 2335 Nonferrous rolling and draw ing ..................................................................... 3 . 6 4 . 4 2 . 6 3 . 1 3 . 4 5 . 0 1 . 8 2 . 9 . 8 1. 13351 Copper rolling and draw ing ........................................................................ 2 . 7 3 . 7 2 . 4 3 . 3 3 . 4 5 . 0 2 . 0 3 . 4 . 3 . 23352 Aluminum rolling and drawing..................................................................... 2 . 2 3 . 2 1. 5 2. 7 2 . 4 4 . 1 1. 1 2 . 5 . 7 . 73357 Nonferrous wire drawing, and insulating................................................ 5 . 5 6 . 6 3 . 6 3. 5 4 . 7 6 . 3 2 . 4 3 . 2 1. 3 2 . 2336 Nonferrous foundries......................................................................................... 7 . 1 7 . 6 6 . 2 7 . 1 7 . 2 7 . 1 4 . 1 5 . 4 1. 0 . 33361 Aluminum c a s t in g s ...................................................................................... 6 . 9 7 . 2 5 . 3 6 . 5 7. 2 6 . 7 4 . 0 5 . 3 . 9 . 33362,9 Other nonferrous ca stin gs........................................................................... 7 . 4 8 . 1 7 . 0 7 . 6 7 . 2 7 . 6 4 . 3 5 . 5 1. 0 . 3339 Miscellaneous primary metal products........................................................ 3 . 3 4 . 4 2 . 8 3 . 5 3 . 5 5 . 1 2. 1 3 . 5 . 4 . 63391 Iron and steel forgings................................................................................. 3 . 2 4 . 3 2 . 8 3 . 3 3 . 5 4 . 9 2 . 0 3 . 2 . 5 . 7
See footnotes at end of table. NOTE: Data for the current month are preliminary.
Digitized for FRASER http://fraser.stlouisfed.org/ Federal Reserve Bank of St. Louis
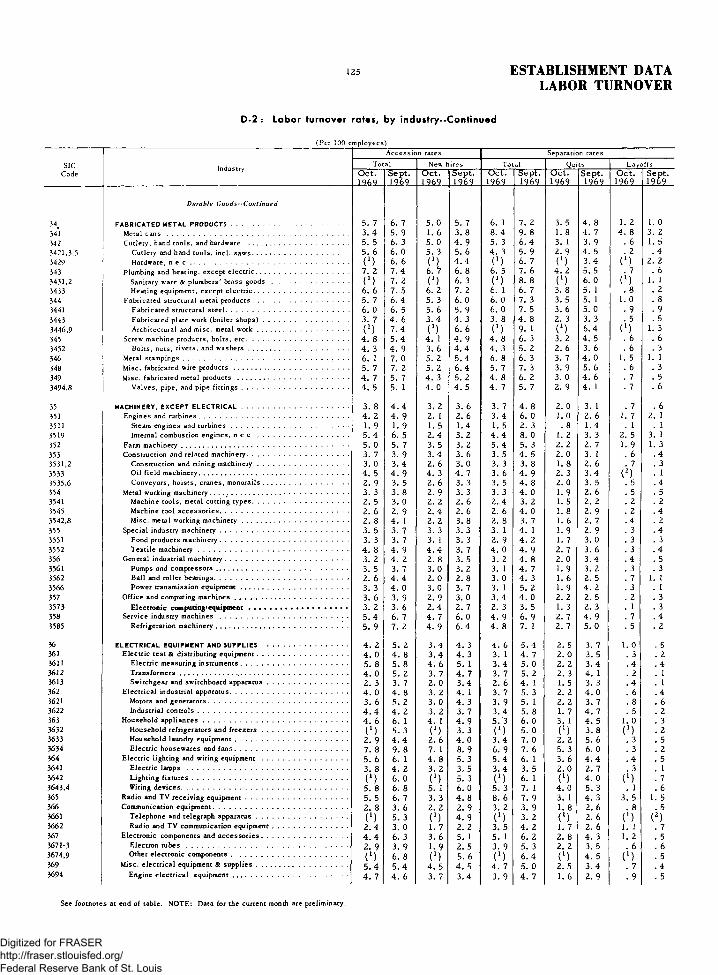
125 ESTABLISHMENT DATALABOR TURNOVER
D -2: Labor turnover rates, by industry—Continued
(P er 100 em ployees)
S ICC o d e
In du stry
A c c e s s i o n r a te s S e p a ra tio n r a te s
T o ta l N ew 1li r e s T o t a l Q u its L a y o f f sO c t.1 9 6 9
S ept.1 9 6 9
O c t .1 9 6 9
S e p t.1 9 6 9
O c t.1 9 6 9
S ept.1 9 6 9
O c t .1 9 6 9
S ep t.1 9 6 9 .
O c t.1 9 6 9
S ep t.1 9 6 9
Durable G ood s--C o u lin u ed
34 F A B R IC A T E D M E T A L P R O D U C T S ................................................................................ 5 . 7 6 . 7 5 . 0 5 . 7 6 . 1 7 . 2 3 . 5 4 . 8 1. 2 1. 0341 M eta l c a n s ............................................................................................................................ 3 . 4 5 . 9 1. 6 3 . 8 8 . 4 9 . 8 1. 8 4 . 7 4 . 8 3 . 2342 C u t le r y , h an d t o o l s , a n d h a rd w a re .................................................................... 5 . 5 6 . 3 5 . 0 4 . 9 5 . 3 6 . 4 3 . 1 3 . 9 . 6 1. 53 4 2 1 ,3 ,5 C u t le r y and h a n d t o o l s , in c l . s a w s .................................................................. 5 . 6 6 . 0 5 . 3 5 . 6 4 . 3 5 . 9 2 . 9 4 . 5 . 2 . 434 2 9 H a rd w a re , n e c ............................................................................................................ ( X) 6 . 6 H 4 . 4 ( 1) 6 . 7 ( X) 3 . 4 ( M 2 . 2
3 43 P lu m b in g a n d h e a t in g , e x c e p t e l e c t r i c ............................................................... 7 . 2 7 . 4 6 . i 6 . 8 6 . 5 7 . 6 4 . 2 5 . 5 . 7 . 63 4 3 1 ,2 S a n ita ry w a re & p lu m b e r s ’ b r a s s g o o d s ..................................................... (* ) 7 . 2 C ) 6 . 3 ( X) 8 . 8 (*) 6 . 0 (*) 1. 13 4 3 3 H e a t in g e q u ip m e n t , e x c e p t e l e c t r i c ................................................................. 6 ; 6 7 . 5 6 . 2 7. 2 6 . 1 6 . 7 3 . 8 5 . 1 . 8 . 2344 F a b r ic a t e d s tr u c tu ra l m e ta l p r o d u c t s .................................................................. 5 . 7 6 . 4 5 . 3 6 . 0 6 . 0 7 . 3 3 . 5 5 . 1 1. 0 . 83441 F a b r ic a t e d s tru c tu ra l s t e e l .................................................................................... 6 . 0 6 . 5 5 . 6 5 . 9 6 . 0 7 . 5 3 . 6 5 . 0 . 9 . 934 4 3 F a b r ic a t e d p la te w ork ( b o i l e r s h o p s ) .......................................................... 3 . 7 4 . 6 3 . 4 4 . 3 3 . 8 4 . 8 2 . 3 3 . 3 . 5 . 5
3 4 4 6 ,9 A r c h ite c tu r a l and m is c . m eta l w o r k .............................................................. ( X) 7 . 4 ( X) 6 . 6 ( X) 9 . 1 ( X) 6 . 4 n 1. 3345 S c r e w m a c h in e p r o d u c t s , b o l t s , e t c ...................................................................... 4 . 8 5 . 4 4 . 1 4 . 9 4 . 8 6 . 3 3 . 2 4 . 5 . 6 . 634 5 2 B o lt s , n u ts , r iv e t s , a n d w a s h e r s ..................................................................... 4 . 3 4 . 9 3 . 6 4 . 4 4 . 3 5 . 2 2 . 6 3 . 6 . 6 . 3346 M eta l s t a m p i n g s ...................................................................................................• • • ■ 6 . 1 7. 0 5 . 2 5 . 4 6 . 8 6 . 3 3 . 7 4 . 0 1. 5 1. 1348 5 7 7 . 2 5 . 2 6 . 4 5 . 7 7 . 3 3 . 9 5 . 6 . 6 . 3
349 M is c . fa b r ic a t e d m eta l p r o d u c t s ................................ ........................................... 4 . 7 5 . 7 4 . 3 5 . 2 4 . 8 6 . 2 3 . 0 4 . 6 . 7 . 53 4 9 4 ,8 V a lv e s , p ip e , a n d p ip e f i t t i n g s ......................................................................... 4 . 5 5 . 1 4 . 0 4 . 5 4 . 7 5 . 7 2 . 9 4 . 1 . 7 . 6
35 M A C H IN E R Y , E X C E P T E L E C T R I C A L ..................................................................................... 3 . 8 4 . 4 3 . 2 3 . 6 3 . 7 4 . 8 2 . 0 3 . 1 . 7 . 6351 E n g in e s an d t u r b in e s ...................................................................................................... 4 . 2 4 . 9 2 . 1 2 . 6 3 . 4 6 . 0 1. 0 2 . 6 1. 7 2 . 13511 S team e n g in e s and t u r b i n e s ................................................................................. 1. 9 1. 9 1. 5 1 . 4 1. 5 2 . 3 . 8 1 . 4 . 1 . 13 5 1 9 In tern a l c o m b u s t io n e n g in e s , n e c .............................................................. 5 . 4 6 . 5 2 . 4 3 . 2 4 . 4 8 . 0 1. 2 3 . 3 2 . 5 3 . 13 52 F arm m a c h in e r y .................................................................................................................. 5 . 0 5 . 7 3 . 5 3 . 2 5 . 4 5 . 3 2. 2 2 . 7 1. 9 1. 3353 C o n s t r u c t io n a n d r e la te d m a c h in e r y ..................................................................... 3 . 7 3 . 9 3 . 4 3 . 6 3 . 5 4 . 5 2. 0 3 . 1 . 6 . 43 5 3 1 ,2 C o n s t r u c t io n a n d m in in g m a c h i n e r y .............................................................. 3 . 0 3 . 4 2 . 6 3 . 0 3 . 3 3 . 8 1. 8 2 . 6 . 7 . 335 3 3 O il f i e l d m a c h in e r y ...................................................................................................... 4 . 5 4 . 9 4 . 3 4 . 7 3 . 6 4 . 9 2 . 3 3 . 4 ( 2 ) . 13 5 3 5 ,6 C o n v e y o r s , h o i s t s , c r a n e s , m o n o r a i l s ........................................................... 2 . 9 3 . 5 2 . 6 3 . 3 3 . 5 4 . 8 2 . 0 3 . 5 . 5 . 4354 M eta l w o r k in g m a c h in e r y . . . . ; ................................. .............................................. 3 . 3 3 . 8 2. 9 3 . 3 3 . 3 4 . 0 1. 9 2 . 6 . 5 . 53541 M a c h in e t o o l s , m e ta l c u t t in g t y p e s .................................................................. 2 . 5 3 . 0 2. 2 2. 6 2 . 4 3 . 2 1. 5 2. 2 . 2 . 23 545 M a c h in e t o o l a c c e s s o r i e s ........................................................................................ 2 . 6 2. 9 2 . 4 2 . 6 2 . 6 4 . 0 1. 8 2 . 9 . 2 . 43 5 4 2 ,8 M is c . m eta l w o rk in g m a c h i n e r y ......................................................................... 2 . 8 4 . 1 2. 2 3 . 8 2 . 8 3 . 7 1. 6 2 . 7 . 4 . 2355 S p e c ia l in d u s try m a c h in e r y ........................................................................................ 3 . 5 3 . 7 3 . 3 3 . 3 3 . 1 4 . 1 1. 9 2 . 9 . 3 . 43551 F o o d p r o d u c t s m a c h in e r y ........................................................................................ 3 . 3 3 . 7 3 . 1 3 . 3 2 . 9 4 . 2 1. 7 3 . 0 . 3 . 335 5 2 T e x t i l e m a c h i n e r y ...................................................................................................... 4 . 8 4 . 9 4 . 4 3 . 7 4 . 0 4 . 9 2 . 7 3 . 6 . 3 . 43 5 6 G e n e r a l in d u s t r ia l m a c h in e r y .................................................................................... 3 . 2 4 . 2 2 . 8 3 . 5 3 . 2 4 . 8 2 . 0 3 . 4 . 4 . 53561 P u m p s an d c o m p r e s s o r s .......................................................................................... 3 . 5 3 . 7 3 . 0 3 . 2 3 . 1 4 . 7 1. 9 3 . 2 . 3 . 33 5 6 2 B a ll a n d r o l le r b e a r in g s ........................................................................................* 2 . 6 4 . 4 2 . 0 2 . 8 3 . 0 4 . 3 1. 6 2 . 5 . 7 1. 135 6 6 P o w e r t r a n s m is s io n e q u i p m e n t ......................................................................... 3 . 3 4 . 0 3 . 0 3 . 7 3 . 1 5 . 2 1. 9 4 . 2 . 3 . 1357 O f f i c e a n d c o m p u t in g m a c h i n e s .............................................................................. 3 . 6 3 . 9 2 . 9 3 . 0 3 . 4 4 . 0 2. 2 2 . 5 . 2 . 33 5 7 3 3 . 2 3 . 6 2 . 4 2 . 7 2 . 3 3 . 5 1. 3 2 . 3 . 1 . 33 58 S e r v ic e in d u s tr y m a c h i n e s ........................................................................................ 5 . 4 6 . 7 4 . 7 6 . 0 4 . 9 6 . 9 2 . 7 4 . 9 . 7 . 43 585 R e fr ig e r a t io n m a c h in e r y .......................................................................................... 5 . 9 7 . 2 4 . 9 6 . 4 4 . 8 7 . 1 2 . 7 5 . 0 . 5 . 2
36 E L E C T R IC A L E Q U IP M E N T A N D S U P P L IE S ................................................................ 4 . 2 5 . 2 3 . 4 4 . 3 4 . 6 5 . 4 2 . 5 3 . 7 1 . 0 . 5361 E le c t r i c t e s t & d is t r ib u t in g e q u ip m e n t .............................................................. 4 . 0 4 . 8 3 . 4 4 . 3 3 . 1 4 . 7 2 . 0 3 . 5 . 3 . 23611 E le c t r i c m e a s u r in g in s t r u m e n t s ......................................................................... 5 . 8 5 . 8 4 . 6 5 . 1 3 . 4 5 . 0 2. 2 3 . 4 . 4 . 43 6 1 2 T r a n s f o r m e r s ....................................... ........................................................................... 4 . 0 5 . 2 3 . 7 4 . 7 3 . 7 5 . 2 2 . 3 4 . 1 . 2 . 13 613 S w it c h g e a r an d s w it c h b o a r d a p p a r a t u s ....................................................... 2 . 3 3 . 7 2 . 0 3 . 4 2 . 6 4 . 1 1 . 5 3 . 3 . 4 . 1362 E le c t r i c a l in d u s t r ia l a p p a r a tu s ................................................................................ 4 . 0 4 . 8 3 . 2 4 . 1 3 . 7 5 . 3 2. 2 4 . 0 . 6 . 43621 M o to rs an d g e n e r a t o r s ............................................................................................... 3 . 6 5 . 2 3 . 0 4 . 3 3 . 9 5 . 1 2. 2 3 . 7 . 8 . 63 6 2 2 In d u s tr ia l c o n t r o l s ....................................................................................................... 4 . 4 4 . 2 3 . 2 3 . 7 3 . 4 5 . 8 1. 7 4 . 7 . 5 . 2363 H o u s e h o ld a p p l i a n c e s ................................................................................................... 4 . 6 6 . 1 4 . 1 4 . 9 5 . 3 6 . 0 3 . 1 4 . 5 1. 0 . 33 6 3 2 H o u s e h o ld r e fr ig e r a to r s a n d f r e e z e r s . ....................................................... ( X) 5 . 3 ( X) 3 . 3 ( M 5 . 0 ( X) 3 . 8 ( M . 23 6 3 3 H o u s e h o ld la u n d ry e q u ip m e n t ............................................................................. 2 . 9 4 . 4 2 . 6 4 . 0 3 . 4 7 . 0 2 . 2 5 . 6 . 3 . 53634 E le c t r i c h o u s e w a r e s a n d f a n s ............................................................................. 7 . 8 9 . 8 7 . 1 8 . 9 6 . 9 7 . 6 5 . 3 6 . 0 . 3 . 2364 E le c t r i c l ig h t in g and w ir in g e q u i p m e n t ........................................................... 5 . 6 6 . 1 4 . 8 5 . 3 5 . 4 6 . 1 3 . 6 4 . 4 . 4 . 53 641 E le c t r i c l a r p p s .............................................................................................................. 3 . 8 4 . 2 3 . 2 3 . 5 3 . 4 3 . 5 2 . 0 2 . 7 . 3 . 13 6 4 2 L ig h t in g f i x t u r e s .......................................................................................................... ( X) 6 . 0 C1) 5 . 3 ( M 6 . 1 ( X) 4 . 0 ( ' ) . 73 6 4 3 ,4 W irin g d e v i c e s .................................................................................................................. 5 . 8 6 . 8 5 . 1 6 . 0 5 . 3 7 . 1 4 . 0 5 . 3 . 1 . 6365 R a d io a n d T V r e c e iv in g e q u ip m e n t ...................................................................... 5 . 5 6 . 7 3 . 3 4 . 8 8 . 6 7 . 9 3 . 1 4 . 3 3 . 5 1. 53 66 C o m m u n ic a t io n e q u ip m e n t ............................................................................................ 2 . 8 3 . 6 2 . 2 2 . 9 3 . 2 3 . 9 1. 8 2 . 6 . 8 . 53661 T e le p h o n e a n d te le g r a p h a p p a r a t u s ........................................................... C ) 5 . 3 ( 1) 4 . 9 ( X) 3 . 2 i 1 ) 2 . 6 C ) ( 2 )3 6 6 2 R a d io a n d T V c o m m u n ic a t io n e q u ip m e n t ................................................... 2 . 4 3 . 0 1. 7 2. 2 3 . 5 4 . 2 1. 7 2 . 6 1. 1 . 7367 E le c t r o n i c c o m p o n e n ts an d a c c e s s o r i e s ........................................................... 4 . 4 6 . 3 3 . 6 5 . 1 5 . 1 6 . 2 2 . 8 4 . 3 1. 2 . 53 6 7 1 -3 E le c t r o n t u b e s .............................................................................................................. 2 . 9 3 . 9 1. 9 2 . 5 3 . 9 5 . 3 2. 2 3 . 5 . 6 . 63 6 7 4 ,9 O th er e l e c t r o n i c c o m p o n e n t s ................................................................................
n 6 . 8 ( X) 5 . 6 n 6 . 4 C ) 4 . 5 C ) . 5369 M is c . e l e c t r i c a l e q u ip m e n t & s u p p l i e s .............................................................. 5 . 4 5 . 4 4 . 5 4 . 5 4 . 7 5 . 0 2 . 5 3 . 4 . 7 . 43 6 9 4 E n g in e e l e c t r i c a l e q u ip m e n t ............................................................................... 4 . 7 4 . 6 3 . 7 3 . 4 3 . 9 4 . 7 1. 6 2 . 9 . 9 . 5
See footnotes at end of table. NOTE: Data for the current month are preliminary.
Digitized for FRASER http://fraser.stlouisfed.org/ Federal Reserve Bank of St. Louis
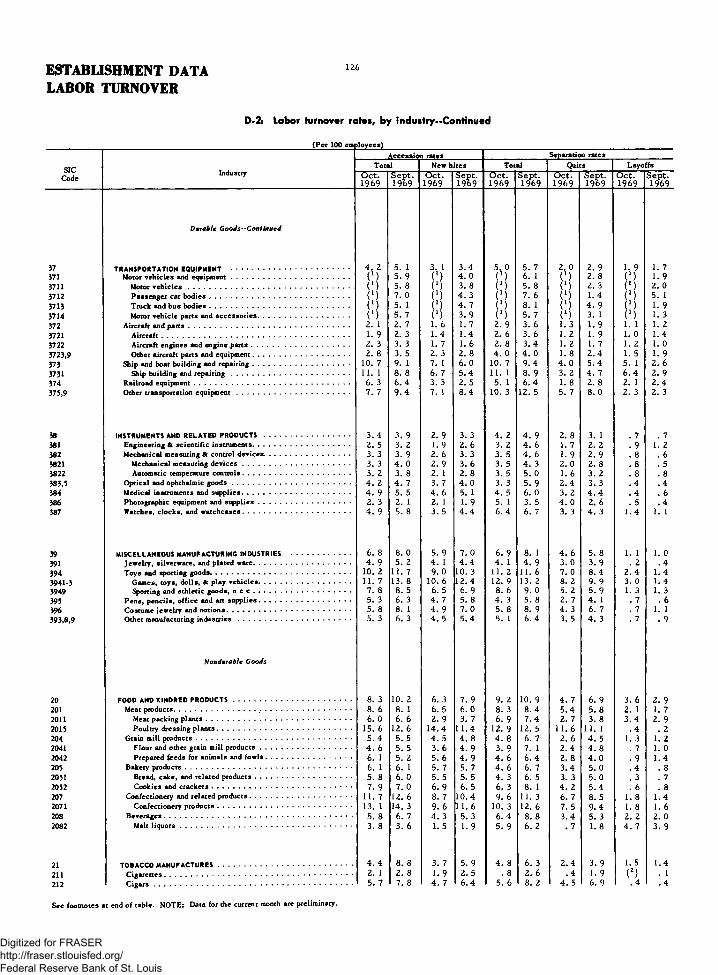
ESTABLISHMENT DATALABOR TURNOVER
1 26
D-2s Labor turnover rates, by industry—Continued
A c c e s s i o in r a te s ___ S e p a r a t io n r a te s
S ICC o d e
T o t a l N e w h ir e s T o t a l Q u it s L a y o f f sIn d u s try O c t .
1969S e p t .1969
O c t .1969
S ep t.1969
O c t .1969
S ep t.1969
O c t .1969
S ep t.1969
O c t .1969
S ep t.1969
37
Durable G o o d s —C on tin u ed
TRANSPORTATION EQUIPMENT ........................................................... 4 . 2 5. 1 3. 1 3 .4 5. 0 5. 7 2. 0 2. 9 1. 9 1. 73 71 M otor v e h i c l e s a n d e q u i p m e n t ................................................................................. ( !) 5 .9 ( ! ) 4 . 0 ( ! ) 6. 1 (!) 2. 8 ( ) 1. 937 1 1 M o to r v e h i c l e s .............................................................................................................. 5. 8 3. 8 ( ) 5. 8 ) 2. 3 ( ) 2. 03 7 1 2 P a s s e n g e r c a r b o d i e s ................................................................................................ ( )
( >7. 0 ( > 4 . 3 ( > 7. 6 ( ) 1 .4 ( ) 5 . 1
3 7 1 3 T r u c k a n d b u s b o d i e s ................................................................................................ 5. 1 (* ) 4 . 7 ) 8. 1 ) 4 . 9 1. 93 7 1 4 M o to r v e h i c l e p a r t s a n d a c c e s s o r i e s .............................................................. ( l ) 5. 7 ( ) 3 .9 { ' ) 5. 7 ( l ) 3. 1 ( l ) 1. 33 7 2 A ir c r a f t a n d p a n s .............................................................................................................. 2. 1 2. 7 1. 6 1. 7 2. 9 3. 6 1. 3 1 .9 1. 1 1. 23 7 2 1 A i r c r a f t ................................................................................................................................ 1. 9 2. 3 1 .4 1 .4 2. 6 3. 6 1. 2 1. 9 1. 0 1 .43 7 2 2 A ir c r a ft e n g in e s a n d e n g in e . p a r t s ................................................................... 2. 3 3. 3 1. 7 1 .6 2. 8 3 .4 1. 2 1. 7 1. 2 1. 03 7 2 3 ,9 O th e r a ir c r a ft p a n s a n d e q u ip m e n t .................................................................. 2. 8 3. 5 2. 3 2. 8 4 . 0 4 . 0 1. 8 2 .4 1. 5 1. 93 7 3 S h ip a n d b o a t b u ild in g a n d r e p a i r i n g .................................................................. 10. 7 9. 1 7. 1 6. 0 10. 7 9 .4 4 . 0 5 .4 5. 1 2. 637 3 1 S l i p b u ild in g an d r e p a i r i n g ................................................................................. 11. 1 8. 8 6. 7 5 .4 11. 1 8. 9 3. 2 4 . 7 6 .4 2. 93 7 4 R a il r o a d e q u ip m e n t .......................................................................................................... 6. 3 6 .4 3. 3 2. 5 5. 1 6 .4 1. 8 2. 8 2. 1 2 .43 7 5 ,9 O th e r tr a n s p o r ta t io n e q u i p m e n t ............................................................................. 7. 7 9 .4 7. 1 8 .4 10. 3 12. 5 5. 7 8. 0 2. 3 2. 3
38 INSTRUMENTS ANO RELATED PRODUCTS................................................ 3. 4 3. 9 2 .9 3. 3 4 . 2 4 . 9 2. 8 3. 1 . 7 . 7381 E n g in e e r in g & s c i e n t i f i c in s t r u m e n ts .................................................................. 2. 5 3. 2 1 .9 2. 6 3. 2 4 . 6 1. 7 2. 2 . 9 1. 23 8 2 M e c h a n ic a l m e a s u r in g & c o n t r o l d e v i c e s . ....................................................... 3. 3 3. 9 2. 6 3. 3 3. 5 4 . 6 1 .9 2 .9 . 8 . 63 8 2 1 M e c h a n ic a l m e a s u r in g d e v i c e s .......................................................................... 3. 3 4 . 0 2. 9 3. 6 3. 5 4 . 3 2. 0 2. 8 . 8 . 53 8 2 2 A u to m a t ic tem p e ra tu re c o n t r o l s .......................................................................... 3. 2 3. 8 2. 1 2. 8 3. 5 5. 0 1. 6 3. 2 . 8 . 83 8 3 ,5 O p t ic a l a n d O p h th a lm ic g o o d s ................................................................................. 4 . 2 4 . 7 3. 7 4 . 0 3. 3 5 .9 2 .4 3. 3 . 4 . 43 8 4 M e d ic a l in s tr u m e n ts a n d s u p p l i e s .......................................................................... 4 . 9 5. 5 4 . 6 5. 1 4 . 5 6. 0 3. 2 4 .4 . 4 . 63 8 6 P h o t o g r a p h ic e q u ip m e n t an d s u p p l i e s ............................................................... 2. 3 2. 1 2. 1 1 .9 5. 1 3. 5 4 . 0 2. 6 . 5 . 43 8 7 W a tc h e s , c l o c k s , a n d w a t c h c a s e s .......................................................................... 4 . 9 5. 8 3. 5 4 .4 6. 4 6. 7 3. 3 4 . 3 1 .4 1. 1
39 MISCELLANEOUS MANUFACTURING INDUSTRIES ................................. 6. 8 8. 0 5. 9 7. 0 6. 9 8. 1 4 . 6 5. 8 1. 1 1. 0391 J e w e lr y , s i lv e r w a r e , a n d p la t e d w a r e .................................................................. 4 . 9 5. 2 4 . 1 4 .4 4 . 1 4 . 9 3. 0 3 .9 . 2 . 43 9 4 T o y s a n d s p o r t in g g o o d s ................................................................................................ 10. 2 11. 7 9 .0 10. 3 11. 2 11. 6 7. 0 8 .4 2. 4 1 .43 9 4 1 -3 G a m e s , t o y s , d o l l s , & p la y v e h i c l e s ............................................................... 11. 7 13. 8 10. 6 1 2 .4 12. 9 13. 2 8. 2 9. 9 3. 0 1. 43 9 4 9 S p o r t in g a n d a t h le t i c g o o d s , n e c ................................................................... 7. 8 8. 5 6. 5 6. 9 8. 6 9. 0 5. 2 5 .9 1. 3 1. 33 95 P e n s , p e n c i l s , o f f i c e a n d art s u p p l i e s ............................................................... 5. 3 6. 3 4 . 7 5. 8 4 . 3 5. 8 2. 7 4 . 1 . 7 . 63 9 6 C o s tu m e je w e lr y a n d n o t i o n s ..................................................................................... 5. 8 8. 1 4 .9 7. 0 5. 8 8. 9 4 . 3 6. 7 . 7 1. 13 9 3 ,8 ,9 O th e r m a n u fa c tu r in g i n d u s t r i e s ............................................................................. 5. 3 6. 3 4 . 5 5 .4 5. 1 6 .4 3. 5 4 . 3 . 7 . 9
20
N ondurable G o o d s
FOOD AND KINDRED PRODUCTS.................................................................. 8. 3 10. 2 6. 3 7. 9 9. 2 10. 9 4 . 7 6. 9 3. 6 2. 9201 M ea t p r o d u c t s ........................................................ ........................................................... 8. 6 8. 1 6 .5 6. 0 8. 3 8 .4 5 .4 5. 8 2. 1 1. 72 011 M ea t p a c k in g p l a n t s ................................................................................................... 6. 0 6. 6 2 .9 3. 7 6. 9 7 .4 2. 7 3. 8 3 .4 2. 92 0 1 5 P o u lt r y d r e s s in g p l a n t s ............................................................................................ 15. 6 12. 6 1 4 .4 1 1 .4 12. 9 12. 5 11. 6 11. 1 . 4 . 22 0 4 G ra in m il l p r o d u c t s ........................................................................................................... 5 .4 5. 5 4 . 5 4 . 8 4 . 8 6. 7 2. 6 4 . 5 1. 3 1. 22 0 4 1 F lo u r a n d o th e r g r a in m il l p r o d u c t s .............................................................. 4 . 6 5. 5 3 .6 4 .9 3 .9 7. 1 2 .4 4 . 8 . 7 1. 02 0 4 2 P r e p a r e d f e e d s fo r a n im a ls a n d f o w l s ........................................................... 6. 1 5. 2 5. 6 4 .9 4 . 6 6 .4 2. 8 4 . 0 . 9 1 .42 0 5 B a k e r y p r o d u c t s .................................................................................................................. 6. 1 6. 1 5. 7 5. 7 4 . 6 6. 7 3 .4 5 .0 . 4 . 820 5 1 B r e a d , c a k e , an d r e la t e d p r o d u c t s .................................................................. 5. 8 6. 0 5. 5 5. 5 4 . 3 6. 5 3. 3 5 .0 . 3 . 72 0 5 2 C o o k i e s a n d c r a c k e r s ................................................................................................ 7. 9 7. 0 6 .9 6. 5 6. 3 8. 1 4 . 2 5 .4 . 6 . 82 0 7 C o n fe c t io n e r y and r e la t e d p r o d u c t s ...................................................................... 11. 7 12. 6 8. 7 1 0 .4 9. 6 11. 3 6. 7 8. 5 1. 8 1 .42 0 7 1 C o n f e c t io n e r y p r o d u c t s ............................................................................................ 13. 1 14. 3 9 .6 11. 6 10. 3 12. 6 7 .5 9 .4 1. 8 1. 62 0 8 B e v e r a g e s ................................................................................................................................ 5. 8 6. 7 4 . 3 5 .3 6 .4 8. 8 3 .4 5. 3 2. 2 2. 02 0 8 2 M alt l i q u o r s ..................................................................................................................... 3. 8 3. 6 1 .5 1 .9 5. 9 6. 2 . 7 1. 8 4 . 7 3. 9
21 TOBACCO MANUFACTURES........................................................................... 4 .4 8. 8 3. 7 5 .9 4 . 8 6. 3 2 .4 3 .9 1. 5 1 .4211 2. 1 2. 8 1 .9 2. 5 . 8 2. 6 .4 1 .9 ( 2) . 12 1 2 C i g a r s ........................................................................................................................................ 5. 7 7. 8 4 . 7 6 .4 5. 6 8. 2 4 . 5 6. 9 . 4 1 . 4
See footnotes at end of table. NOTE: Data for the current month are preliminary.
Digitized for FRASER http://fraser.stlouisfed.org/ Federal Reserve Bank of St. Louis
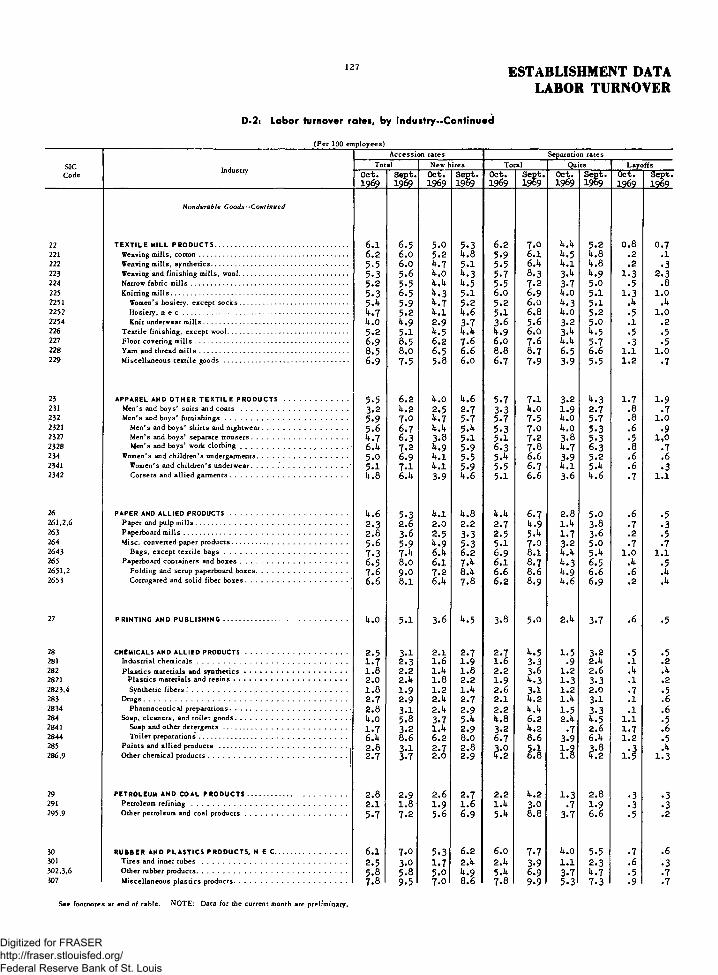
127 ESTABLISHMENT DATALABOR TURNOVER
D-2: labor turnover rates, by industry—Continued
(P e r 100 em p loyees )A c c e s s i o n r a te s S e p a r a t io n r a te s
S IC In du stryT o t a l N e w h ir e s T o t a l Q u it s L a y o f f s
C o d e Oct. 19 69
Sept.1969
Oct.1969
Sept.1969
Oct.1969
Sept.1969
Oct.1969
Sept.1969
Oct.1969
Sept.1969
22
N o n d u r a b le G o o d s — C o n t i n u e d
t e x t i l e m il l p r o d u c t s .......................................................................... 6.1 6.5 5.0 5.3 6.2 7.0 4.4 5.2 0.8 0.7221 W ea v in g m i l ls , c o t t o n ..................................................................................................... 6.2 6.0 5.2 4.8 5.9 6.1 4.5 4.8 .2 .1222 W ea v in g m i l ls , s y n t h e t i c s ............................................................................................. 5-5 6.0 k . i 5.1 5.5 6.4 4.1 4.8 .2 •3223 W ea v in g a n d f in i s h in g m i l l s , w o o l .......................................................................... 5-3 5.6 k .o 4.3 5.7 8.3 3.* 1.3 2.3224 N a rrow fa b r ic m i l l s ........................................................................................................... 5.2 5.5 k .k .5 5.5 7.2 3.7 5.0 .5 .8225 K n itt in g m i l l s ......................................................................................................................... 5.3 6.5 fc.3 5.1 6.0 6.9 4.0 5.1 1.3 1.02251 W om en ’ s h o s ie r y , e x c e p t s o c k s .......................................................................... 5.4 5.9 4.7 5.2 5.2 6.0 4.3 5.1 .4 .42252 H o s ie r y , n e c ................................................................................................................ 4.7 5.2 k . i k .6 5.1 6.8 4.0 5.2 .5 1.02254 K n it u n d e rw e a r m i l l s ................................................................................................... 4.0 k .9 2.9 3.7 3.6 5.6 3.2 5.0 .1 .2226 T e x t i l e f in is h in g , e x c e p t w o o l .................................................................................. 5.2 5.1 4.5 4.4 4.9 6.0 3^ 4.5 .5 .5227 F lo o r c o v e r in g m i l l s ........................................................................................................ 6.9 8.5 6.2 7.6 6.0 7.6 4.4 5.7 .3 • 5228 Y a rn an d th re a d m i l l s ..................................................................................................... 8.5 8.0 6.5 6.6 8.8 8.7 6.5 6.6 1.1 1.0229 M is c e l la n e o u s t e x t i l e g o o d s ..................................................................................... 6.9 7.5 5.8 6.0 6.7 7.9 3.9 5.5 1.2 • 7
23 APPAREL AND OTHER TE X T ILE P R O D U C T S .................................... 5-5 6.2 4.0 k.6 5.7 7.1 3.2 4.3 1.7 1.9231 M en ’ s and b o y s ’ s u it s a n d c o a t s ............... ................................................... 3.2 k .2 2.5 2.7 3.3 4.0 1.9 2.7 .8 .7232 M en ’ s a n d b o y s ’ f u r n i s h i n g s .................................................................................... 5.9 7.0 4.7 5.7 5.7 7.5 4.0 5.7 .8 1.02321 M en ’ s a n d b o y s ’ s h ir t s an d n ig h t w e a r ........................................................... 5.6 6.7 4.4 5.4 5.3 7.0 4.0 5.3 .6 • 92327 M e n ’ s an d b o y s ’ s e p a r a te t r o u s e r s .................................................................. 4.7 6.3 3.8 5.1 5.1 7.2 3.8 5.3 .5 1,02328 M en ’ s an d b o y s ’ w ork c l o t h i n g ......................................................................... 6.4 7.2 4.9 5.9 6.3 7.8 4.7 6.3 .8 .7234 W om en ’ s an d c h i ld r e n ’ s u n d e r g a r m e n ts .............................................................. 5.0 6.9 4.1 5.5 5.4 6.6 3.9 5.2 .6 .62341 W o m e n 's a n d c h i ld r e n ’ s u n d e r w e a r ..............................................................V 5.1 7.1 4.1 5.9 5.5 6.7 4.1 5.4 .6 .32342 C o r s e t s a n d a l l i e d g a r m e n t s ................................................................................ 4.8 6 .k 3.9 k .6 5.1 6.6 3.6 4.6 .7 l . l
26 PAPER AND ALLIED PRODUCTS................................................................. 4.6 5.3 4.1 k.Q 4.4 6.7 2.8 5.0 .6 .5261,2,6 P a p e r and p u lp m i l l s ........................................................................................................ 2.3 2.6 2.0 2 .2 2.7 4.9 1.4 3.8 .7 .3263 P a p e r b o a r d m i l l s ................................................................................................................ 2.8 3.6 2.5 3.3 2.5 5.4 1.7 3.6 .2 .5264 Mi s c . c o n v e r t e d p a p e r p r o d u c t s ............................................................................... 5.6 5.9 M 5.3 5.1 7.0 3.2 5.0 .7 .72643 B a g s , e x c e p t t e x t i le b a g s .................................................................................... 7.3 7.4 e .k 6.2 6.9 8.1 4.4 5.4 1.0 1.1265 P a p e r b o a r d c o n t a in e r s and b o x e s ......................................................................... 6.5 8.0 6.1 7. 6.1 8.7 4.3 6.5 .4 .52651,2 F o ld in g and s e tu p p a p e r b o a r d b o x e s .............................................................. 7.6 9.0 7.2 8.4 6.6 8.6 4.9 6.6 .6 .42653 C o r r u g a te d a n d s o l id f ib e r b o x e s ......................................................................! 6.6 8.1 e .k 7.8 6.2 8.9 4.6 6.9 .2 .4
27 PRINTING AND PUB LIS H IN G ..................................................................... k.O 5.1 3.6 4.5 3.8 5.0 2.4 3.7 .6 .5
28 CHEMICALS AND ALLIED PRODUCTS........................................................ 2.5 3.1 2.1 2.7 2.7 4.5 1.5 3.2 .5 .5281 I n d u s tr ia l c h e m i c a l s ...................................................................................................... 1.7 2.3 1.6 1.9 1.6 30 .9 2.4 .1 .2282 P l a s t i c s m a te r ia ls a n d s y n t h e t i c s ...................................................................... 1.8 2.2 i . k 1.8 2.2 3.6 1.2 2.6 .4 .42821 P l a s t i c s m a te r ia ls a n d r e s i n s ............................................................................. 2.0 2 .k 1.8 2.2 1.9 4.3 1.3 3.3 .1 .22823,4 S y n th e t ic f ib e r s .............................................................................................................. 1.8 1.9 1.2 1.4 2.6 3.1 1.2 2.0 .7 .5283 D r u g s ........................................................................................................................................... 2.7 2.9 2.4 2.7 2.1 4.2 1.4 3.1 .1 .62834 P h a r m a c e u t ic a l p r e p a r a t i o n s ................................................................................ 2.8 3.1 2 .k 2.9 2.2 4.4 1.5 3.3 .1 .6284 S o a p , c l e a n e r s , and t o i l e t g o o d s ............................................................................ .. 4.0 5.8 3.7 5.4 4.8 6.2 2.4 4.5 1.1 .52841 S o a p a n d o th e r d e t e r g e n t s .................................................................................... 1.7 3.2 l . k 2.9 3.2 4.2 .7 2.6 1.7 .62844 T o i l e t p r e p a r a t i o n s '..................................................................................................... 6 .k 8.6 6.2 8.0 6.7 8.6 3.9 6.4 1.2 .5285 P a in t s a n d a l l i e d p r o d u c t s ....................................................................................... 2.8 3.1 2.7 2.8 3.0 5.1 1 .9 3.8 .3 .4286,9 O th e r c h e m ic a l p r o d u c t s ............................................................................................... 2.7 3.7 2.0 2.9 4.2 6.8 1.8 4.2 1.5 1.3
29 PETROLEUM AND COAL PRO DUCTS....................................................... 2.8 2.9 2.6 2.7 2.2 4.2 1.3 2.8 • 3 .3291 P e tr o le u m r e f i n i n g .......................................................................................................... 2.1 1.8 1.9 1.6 1.4 3.0 .7 1.9 •3 • 3295,9 O th e r p e tr o le u m and c o a l p r o d u c t s ..................................................................... 5.7 7.2 5.6 6.9 5.4 8 . 8 3.7 6 .6 .5 .2
30 RUBBER AND PLASTICS PRODUCTS, N E C ........................................ 6.1 7.0 5.3 6.2 6.0 7.7 4.0 5.5 .7 . 6301 T ir e s a n d in n e r t u b e s ................................................................................................... 2.5 3.0 1.7 2.4 2.4 3.9 1.1 2.3 . 6 .3302,3,6 O th e r ru b b e r p r o d u c t s ...................................................................................................... 5.8 5.8 5.0 4.9 5.4 6.9 3.7 4.7 .5 .7307 M is c e l la n e o u s p la s t i c s p r o d u c t s ............................................................................. 7.8 9.5 7.0 8.6 7.8 9.9 5.3 7.3 .9 .7
See footnotes at end of table. NOTE: Data for the current month are preliminary.
Digitized for FRASER http://fraser.stlouisfed.org/ Federal Reserve Bank of St. Louis

ESTABLISHMENT DATA 12sLABOR TURNOVER
D-2: Labor turnover rates, by industry—Continued
(Per 100 employees)Accession rates Separation rates
SIC IndustryTotal New hires Total Quits Layoffs
Code Oct.1969
Sept.1969
Oct.1969
Sept.1969
Oct.1969
S e p t .1969
Oct.1969
Sept.1969
Oct.1969
S e p t .1969
31
Nondurable G o o d s —Con tin u ed
LEATHER AND LEATHER PRODUCTS......................................................... 7 .1 7 .2 It.8 5 .3 7 .6 9 .5 5 .8 1 .9 2 .5311 Leather tanning and fin is h in g .................................................................. (1) 6 .0 (1) 4 .5 (1) 8 .3 (1) 5.5 (1) 1 .9314 Footwear, except rubber.............................................................................. 7 .1 6 .7 lt.it it.8 6.9 9 .5 It.2 5 .6 1 .6 2 .7
10
NONMANUFACTURING
METAL MINING..................................................................................................... 3.5 3.9 3.1 3-^ 3.6 6 .1 1 .? 4 .8 .8 .2101 Iron o re s ........................................................................................................... 2.5 2.5 1 .5 2 .0 it.8 6 .1 1 .4 5 .0 2 .5 .1102 Copper o r e s ..................................................................................................... 3.9 3.5 3.5 3.0 2 .7 5 .3 1 .7 3.7 .2 .2
11,12 COAL MINING-..................................................................................................... 1 .8 2.5 1 .5 2 .0 1 .6 2.5 .8 1 .5 .1 .412 Bituminous coal and lignite m in in g ................................................... 1 .8 2.5 1 .5 2 .1 1 .6 2.5 .8 1 .5 .1 .4
481COMMUNICATION:
Telephone com m unication..................................................................... ( l ) 3 .2 (1) it.it (1) 3 .3 (1) .6482 Telegraph communication 3..................................................................... (1) 2 .7 - - (1) it.it (1) 3 .3 (1) .7
xNot available.2Less than 0 .05.3Data relate to a l l employees except messengers. NOTE: Data fo r the current month are preliminary.
Digitized for FRASER http://fraser.stlouisfed.org/ Federal Reserve Bank of St. Louis

129 ESTABLISHMENT DATASEASONALLY ADJUSTED LABOR TURNOVER
D-3: Labor turnover rates in manufacturing, >958 to d a teseasonally adjusted
(Per 100 employees)
Y e a r J a n . F e b . M ar. A p r . M ay J u n e J u ly A u g . S e p t . O c t . N o v . D e c .
T o t a l a c c e s s i o n s
1958,.......................... 3.1 3.1 3.2 30 3.5 3.7 3.9 3.9 4.0 3.9 3.9 4.219591 ......................... 4.0 4.3 4.6 4.3 4.1 4.2 4.1 4.1 4.0 3.8 4.2 5.6I960............................ 4.2 4.1 3.7 3.6 3.8 3.7 3.6 3.9 3.8 3-5 3.6 3.61961............................ 3.9 3*7 4.4 4.2 4.2 4.0 4.0 4.1 3.8 4.3 4.3 4.11962............................ *•3 4.2 4.1 4.2 4;2 4.0 4.2 4.0 4.0 3.9 3.8 3.81963............................ 3.8 3.9 3.8 4.1 3.8 3.8 3.9 3.8 3.9 3.9 3.6 4.01964............................ 3.8 4.0 4.0 4.0 3.9 4.0 4.0 4.0 3.9 3.9 4.0 4.11965............................ 4.0 4.1 4.3 4.1 4.1 4.3 4.1 4.3 4.5 4.4 4.8 4.91966............................ 4.9 5.0 5.2 5.0 5.1 5.1 4.7 5.1 5.0 4.9 4.8 4.61967............................ 4.6 *.3 4.1 4.2 4.6 4.5 4.4 4.4 4.3 4.5 4.5 4.41968........................... 4.5 4.5 4.1 *.7 4.6 4.5 4.7 4.6 4.7 4.8 4.6 4.71969........................... 4-9 4.6 4.6 4.9 4 .8 5.0 4 .8 4 .5 4 .8 4 .8
N ew h ir e s
1958............................ 1.4 1.4 1.3 1.5 1.5 1.6 1.8 1.8 2.0 2.0 2.1 2.21959............................ 2.4 2.6 2.9 2.8 2.7 2.7 2.6 2.6 2.7 2.4 2.4 2.7I960............................ 2.6 2.8 2.4 2.2 2.3 2.2 2.1 2.2 2.1 1.9 1.9 1.81961............................ 1.8 1.8 1.9 2.0 2.1 2.1 2.2 2.3 2.3 2.5 2.5 2.51962............................ 2.6 2.6 2.6 2.6 2.7 2.5 2.6 2.4 2.4 2.3 2.3 2.11963............................ 2.3 2.2 2.4 2.5 2.4 2.4 2.4 2.4 2.5 2.4 2.2 2.51964........................... 2.4 2.5 2.6 2.6 2.4 2.6 2.6 2.6 2.7 2.6 2.7 2.81965............................ 2.8 3.0 3.3 2.8 2.9 3.1 3.0 3.1 3.1 3.2 3.5 3.71966........................... 3.7 3.8 4.3 3.9 4.0 4.0 3.7 3.8 3.7 3.8 3.7 3.51967............................ 3.5 3-3 3.3 3.1 3-2 3.2 3.1 3.2 3.2 3.4 3.4 3.31968........................... 3.5 3.3 3.4 3.5 3.5 3-3 3.5 3.5 3.6 3.6 3.5 3.71969........................... 3.8 3.7 4.0 3.9 3-7 3.8 3.7 3.5 3.8 3.6
Total separations
1958,.......................... 5.4 4.8 4.9 4.6 4.2 3*8 3.8 3.7 3.6 3.8 3.6 3.719591 ......................... 3.7 3.6 3.6 3.8 3.8 3.9 4.0 4.1 4.2 5.0 4.6 4.1I960............................ 3.6 4.1 4.4 4.4 4.3 4.4 4.3 4.3 4.2 4.3 4.4 5.01961............................ 4.6 4.6 4.2 3.6 3.8 4.0 4.0 3.7 4.1 3.9 4.0 4.11962............................ 3.9 4.0 4.0 3.9 4.2 4.2 4.2 4.4 3.9 4.1 4.1 3.91963............................ 4.0 3.8 3-9 3.9 3.9 3.8 3.9 4.1 3.8 3.8 4.0 3.91964............................ 4.0 4.0 3.9 3.8 3.9 3.9 4.1 3.6 3.9 4.0 3.8 3.91965............................ 3.8 3.7 3.8 4.1 3.9 4.0 4.0 4.2 4.2 4.2 4.2 4.41966............................ 4.1 4.3 4.6 4.7 4.7 4.9 4.9 4.7 4.9 4.5 4.7 4.51967............................ 4.6 4.8 5.2 4.7 4.6 4.7 4.4 4.3 4.5 4.4 4.4 4.31968............................ 4.5 4.7 4.6 4.5 4.7 4.5 4.6 4.9 4.6 4.6 4.5 4.21969............................ 4.6 4.8 4.9 4.9 5.0 4 .9 4 .9 5.1 4 .8 5.0
Q u its
1958............................ 1.1 1.1 1.0 •9 1.0 1.0 1.1 1.1 1.1 1.2 1.2 1.31959............................ 1.4 1.3 1.5 1.5 1.6 1.5 1.5 1.5 1.5 1.5 1.5 1.6i960........... ................ 1*5 1.6 1.5 1.5 1.3 1.4 1.4 1.3 1-3 1.2 1.1 1.11961............................ 1.1 1.1 1.1 1.1 1.1 1.2 1.2 1.2 1-3 1.3 1.4 1.41962............................ 1.3 1.4 1.4 1.4 1-5 1-5 1.4 1.5 1.4 1.4 1.4 1.31963............................ 1.3 1.3 1.4 1.4 1.4 1.4 1.4 1.5 1.4 1.4 1.4 1-31964............................ 1.4 1.4 1.4 1.4 1.5 1.4 1-5 1.5 1.5 1.6 1.5 1.61965........................... 1-7 1.7 1.7 1.8 1.7 1.8 1.8 1.9 2.0 2.0 2.1 2.21966............................ 2.3 2.3 2.6 2.7 2.6 2.6 2.6 2.6 2.6 2.6 2.6 2.71967............................ 2.5 2.4 2.4 2.3 2.3 2.4 2.2 2.3 2.3 2.3 2.3 2.41968............................ 2.4 2.4 2.4 2.3 2.5 2.3 2.4 2.6 2.4 2.6 2.6 2.51969............................ 2.7 2.7 2.7 2.7 2 .8 2 .7 2 .7 2 .9 2.5 2 .8L a y o f f s
1 Beginning with January 1959, transfers between establishments of the same firm are included in total a ccessions and total separations, therefore rates for these items are not strictly comparable with prior data. Transfers comprise part of other accessions and other separations, the rates for which are not shown separately.
NOTE: Data include Alaska and Hawaii beginning 1959. This inclusion has not significantly affected the labor turnover series.Data for the current month are preliminary.
371-7 9 3 0 - 6 9 - 9
Digitized for FRASER http://fraser.stlouisfed.org/ Federal Reserve Bank of St. Louis

ESTABLISHMENT DATA 130STATE AND AREA LABOR TURNOVER
D-4: Labor turnover rates in manufacturing for selected States and a re a s
(Per 100 employees)
State and area
A ccessi on rates Separation ratesTotal New hires Total Qtrits Layoffs
Sept.1969
A u g .1969
Sept.1969
A u g .1969
Sept.i m
A u g .1969
Sept.1969
A u g .1969
Sept.1969
A u g .1969
ALABAMA:-----------------------------------Birmingham.............................................................................. 4 .4 3 .4 3 .2 2 .7 4 .4 5 .0 2 .7 2 .4 0 .8 1 .7Mobile 1 ................................................................................. 7 .7 5 .2 4 .4 2 .9 9 .2 8 .2 4 .8 3 .7 3 .3 3 .0
ALASKA....................................................................................... 1 2 .9 1 4 .3 1 1 .1 1 1 .6 3 7 .1 5 8 .3 9 .4 8 .1 2 6 .7 4 9 .4
ARIZO N A.................................................................................... 6 .9 7 .2 5 .7 5 .5 6 .9 7 .6 4 .8 4 .6 .8 1 .4Phoenix .................................................................................... 7 .1 7 .4 5 .9 5 .5 6 .5 7 .6 4 .6 4 .6 .6 1 .4
ARKANSAS................................................................................. 8 .6 8 .4 7 .5 7 .2 9 .4 9 .3 7 .2 7 .3 1 .3 .7Fort Smith................................................................................. 1 1 .9 9 .6 1 1 .2 9 .0 1 2 .8 1 1 .2 1 0 .9 1 0 .0 .7 .4Little Rock-North Little R o c k .......................................... 8 .6 9 .5 8 .3 8 .3 7 .6 1 0 .0 6 .6 7 .7 .1 .3Pine B lu ff................................................................................. 6 .7 6 .5 5 .7 6 .0 7 .6 7 .9 6 .8 6 .8 .1 .2
CALIFORNIA ........................................................................ ( * ) ( * ) ( * ) ( * ) <*) ( * ) <*) ( * ) < *) ( * )Los Angeles-Long Beach . . . . . . . . . . . . . . . . . ( * ) <*) ( * ) ( * ) ( * ) ( * ) ( * ) ( * ) ( * ) ( * )
COLORADO ............................................................................. ( * ) 5 .8 < *) 5 .0 ( * ) 6 .8 ( * ) 4 .7 ( * ) .9Denver ...................................................................................... ( * ) 5 .7 ( * ) 5 .1 ( * ) 7 .4 <*> 5 .0 ( * ) 1.0
CONNECTICUT........................................................................ 4 .6 3 .6 3 .9 3 .1 5 .3 5 .1 3 .8 3 .6 .5 .5H artford.................................................................................... 3 .8 3 .3 2 .9 2 .8 4 .2 4 .6 2 .9 3 .1 .3 .4
DELAWARE1 .......................................................................... 3 .7 8 .9 2 .7 3 .4 4 .3 4 .3 2 .7 2 .9 .4 .2Wilmington 1 .......................................................................... 4 .0 8 .8 3 .0 3 .4 4 . i 3 .6 2 .8 2 .4 .2 .2
DISTRICT OF COLUMBIA:Washington SM SA ................................................................. ( * ) 2 .5 ( * ) 2 .4 ( * ) 3 .3 ( * ) 2 .7 < *) .2
FLO RID A................................................................................ .. 7 .7 6 .5 6 .3 5 .6 7 .7 9 .4 5 .2 5 .5 1 .2 1 .6Fort Lauderdale-Hollywood............................................... 9 .4 7 .8 9 .0 7 .3 9 .1 9 .7 6 .7 7 .1 .3 .5J a ck son v ille .......................................................................... 6 .7 7 .0 6 .2 6 .8 7 .9 7 .9 6 .3 6 .5 .7 .6Miami......................................................................................... 8 .1 5 .5 6 .3 5 .0 6 .1 7 .3 4 .5 4 .8 .6 1 .5Orlando...................................................................................... 6 .1 6 .7 5 .0 5 .4 7 .1 9 .3 4 .4 4 .6 1 .6 3 .2P ensacola ................................................................................ 2 .1 1 .7 2 .1 1 .6 1 .6 1 .8 1 .3 1 .6 (2 ) ( 2 )Tampa-St. P etersburg ........................................................ 8 .1 8 .7 6 .4 7 .1 8 .0 9 .4 5 .4 6 .5 1 .4 1 .8West Palm B e a c h ................................................................. 6 .0 4 .3 4 .9 3 .2 5 .5 5 .9 3 .8 4 .1 .3 .2
GEORGIA................................................................................... 7 .7 6 .8 6 .1 5 .4 7 .9 8 .2 5 .7 5 .6 1.0 1 .3Atlanta ® ............................................................................. .. 6 .5 6 .1 5 .8 5 .2 7 .3 7 .3 5 .2 5 .7 1.0 .5
HAWAU 4 ................................................................................ <*) 3 .6 ( * ) 3 .2 <*) 4 .1 (*) 3 .0 ( * ) .2
IDAHO 5 ................................................................................ 7 .6 5 .9 6 .6 5 .3 9 .8 8 .6 7 .7 6 .2 .8 1 .3
ILLINOIS:6 .1 5 .2 5 .3 4 .6 6 .8 6 .1 5 .1 4 .3 .4 .5
INDIANA 1 ........................................................................... 5 .0 4 .4 4 .1 3 .5 5 .6 5 .1 4 .0 3 .3 . 4 .6Indianapolis ® ..................... .............................................. 4 .1 4 .1 3 .4 3 .1 4 .5 4 .4 3 .0 2 .8 .2 .2
IOWA......................................................................................... 5 .3 5 .6 4 .2 4 .3 5 .9 6 .1 4 .1 4 .4 1 .1 1.0Cedar Rapids........................................................................ 4 .6 3 .9 4 .1 2 .9 4 .9 4 .7 3 .7 3 .0 .3 1 .1Des M oines............................................ 6 .6 6 .2 4 .7 3 .9 7 .9 7 .1 4 .7 4 .5 1 .9 1 .5
KANSAS................................................................................... <*) 5 .8 ( * ) 4 .1 ( * ) 6 .2 ( * ) 4 .2 ( * ) 1.04 .8 3 .7 4 .1 2 .6 7 .7 5 .5 3 .3 2 .9 1 .4 1 .8
Wichita................................................................................... (*) 4 .2 (*) 3 .2 (*) 4 .5 (*) 3 .2 (*) .7
KENTUCKY.............................................................................. 5 .2 4 .9 4 .4 4 .1 5 .9 5 .7 4 .2 4 .0 .8 .74 .8 4 .2 3 .9 3 .5 5 .1 4 .6 3 .5 3 .2 .6 .4
LOUISIANA:New Orleans .................................................................. 4 .5 4 .0 3 .1 2 .9 5 .7 5 .7 3 .3 3 .1 1 .3 1 .4
MAINE....................................................................................... 7 .4 7 .0 5 .8 6 .0 9 .9 7 .8 5 .9 5 .4 2 .9 1 .3Portland................................................................................ 4 .7 4 .4 4 .3 3 .0 6 .4 8 .0 5 .4 5 .1 .3 2 .1
MARYLAND ........................................................................... 4 .5 5 .1 3 .6 2 .9 5 .3 6 .1 3 .2 2 .8 1 .2 2 .3Baltim ore.................................................................... . . . 4 .5 5 .4 3 .7 2 .8 5 .2 6 .3 3 .2 2 .7 1.0 2 .7
See footnotes st end of table. NOTE: Data for the current month are preliminary.
Digitized for FRASER http://fraser.stlouisfed.org/ Federal Reserve Bank of St. Louis

131 ESTABLISHMENT DATASTATE AND AREA LABOR TURNOVER
D -4 : Labo r turnover rates in m anu facturing fo r se lected States and areas --C o n tin u e d
(Per 100 employees)
Stale and area
Accession rates Separation ratesTotal New hires Total Quiits Layoffs
S e p t .1969
Aug .1969
S e p t .1969
Aug .1969
S e p t .1969
Aug .1969
S e p t .1969
Aug .1969
S e p t . 1969 _
Aug . 1969____
MASSACHUSETTS.................................................................. 5 . 6 5 . 1 4 . 7 3 . 5 6 . 4 6 . 1 4 . 5 4 . 3 0 . 8 0 . 8B o s to n .................................................................................... 5 . 0 4 . 9 4 . 4 3 . 1 5 . 9 5 . 6 4 . 4 4 . 1 .6 . 5
MICHIGAN.............................................................................. ( * ) 6 . 3 ( * ) 4 . 1 ( * ) 5 . 8 ( * ) 2 . 8 ( * ) 1 . 7Detroit................................................................................... <*) 7 . 3 ( * ) 4 . 0 ( * ) 5 . 5 ( * ) 2 . 7 ( * ) 1 . 5
MINNESOTA........................................................................... 7 . 1 6 . 0 6 . 0 4 . 7 8 . 6 6 . 3 6 . 3 4 . 4 1 . 4 1 . 1Duluth-Superior.................................................................. ( * ) ( * ) ( * ) ( * ) ( * ) ( * ) ( * ) ( * ) ( * ) ( * )Minneapolis-St. P a u l ...................................................... . 5 . 9 4 . 6 5 . 2 3 . 6 7 . 0 5 . 9 5 . 5 4 . 2 .7 .9
MISSISSIPPI:Jackson ................................................................................ 8 . 1 6 . 0 7 . 4 5 . 6 7 . 8 7 . 0 6 . 7 6 . 0 .1 .1
MISSOURI................................................................................ 5 . 4 4 . 9 4 . 5 3 . 9 6 . 3 5 . 9 4 . 1 3 . 8 1 . 0 1 . 0Kansas C i t y ....................................................................... 5 . 7 4 . 9 4 . 9 4 . 0 6 . 2 6 . 2 4 . 4 4 . 3 .9 .9St. L o u i s ............................................................................. 4 . 3 4 . 1 3 . 7 3 . 4 5 . 8 4 . 8 3 . 6 2 . 9 .9 .7
MONTANA 5 .......................................................................... 5 . 1 4 . 1 4 . 6 3 . 3 9 . 3 6 . 3 6 . 5 3 . 9 1 . 2 . 8
NEBRASKA......... ................................................................... 9 . 1 7 . 0 8 . 3 6 . 2 9 . 4 7 . 9 7 . 7 6 . 6 .6 . 3
NEVADA................................................................................... 9 . 0 8 . 6 8 . 8 7 . 6 1 0 . 2 8 . 9 6 . 9 6 . 0 1 . 0 1 . 1
NEW HAMPSHIRE................................................................. 6 . 4 5 . 3 5 . 4 4 . 7 7 . 9 7 . 3 5 . 9 5 . 5 1 . 0 .9
NEW JERSEY:Camden 8 .......................................................................... 4 . 7 5 . 1 4 . 0 3 . 8 5 . 5 5 . 0 3 . 7 2 . 9 . 8 .8Jersey City .................................................................... ... . 4 . 2 5 . 4 3 . 6 3 . 5 4 . 5 5 . 1 2 . 6 3 . 1 . 9 .9Newark................................................................................... 4 . 9 6 . 8 4 . 2 4 . 6 5 . 9 6 . 3 4 . 1 4 . 3 . 6 . 8Paterson-Clifton-Passaic................................................ 5 . 2 5 . 6 4 . 4 4 . 0 6 . 1 6 . 5 3 . 9 4 . 1 1 . 0 1 . 3Perth A m b o y ....................................................................... 4 . 2 5 . 5 3 . 1 2 . 9 4 . 9 6 . 6 3 . 2 3 . 7 .6 2 . 0Trenton................................................................................... 5 . 4 4 . 2 4 . 7 2 . 8 5 . 6 4 . 9 3 . 7 3 . 5 .6 . 6
NEW Y O R K .............................................................................. 5 . 6 5 . 7 4 . 3 3 . 8 5 . 9 5 . 7 3 . 6 3 . 3 1 . 3 1 . 3Albany-Schenectady-Troy................................................ 3 . 7 3 . 2 3 . 0 2 . 5 5 . 0 4 . 0 3 . 5 2 . 5 . 4 . 4Binghamton........................................................................... 3 . 0 3 . 1 2 . 4 2 . 2 3 . 8 3 . 4 2 . 6 2 . 6 .3 .1Buffalo............ .. ............................................... .................... 4 . 9 4 . 5 3 . 5 3 . 0 5 . 4 4 . 9 3 . 6 2 . 8 1 . 0 1 . 1Elm ir a ................................................................................... 4 . 6 4 . 9 4 . 2 3 . 8 5 . 4 6 . 2 3 . 8 4 . 4 . 4 .9Monroe County 8 ............................................................ 3 . 6 2 . 9 3 . 0 2 . 5 4 . 3 3 . 8 3 . 0 2 . 4 . 3 . 4Nassau and Suffolk Counties .................................... 5 . 4 5 . 7 4 . 7 4 . 3 5 . 4 6 . 3 4 . 0 4 . 2 .6 1 . 0New York SM S A.................................................................. 6 . 1 7 . 1 4 . 6 4 . 5 6 . 3 6 . 8 3 . 4 3 . 5 1 . 8 2 . 1New York City 1 0 ............................................................... 6 . 3 7 . 6 4 . 7 4 . 6 6 . 5 7 . 0 3 . 3 3 . 3 2 . 1 2 . 4Rochester.............................................................................. 4 . 5 4 . 3 3 . 8 3 . 5 5 . 2 4 . 0 3 . 5 2 . 6 . 8 . 4Syracuse................................................................................ 4 . 4 3 . 9 3 . 8 3 . 1 5 . 8 4 . 1 4 . 0 2 . 8 .6 .3Utica-Rome........................................................................... 4 . 0 3 . 7 3 . 2 2 . 4 4 . 5 4 . 5 2 . 9 2 . 7 . 8 . 9Westchester County * 0 ...................................................... 6 . 1 5 . 9 4 . 4 3 . 7 6 . 4 5 . 6 3 . 6 3 . 0 1 . 6 1 . 5
NORTH C A R O L I N A ............................................................ 6 . 3 6 . 1 5 . 3 5 . 3 6 . 3 6 . 5 5 . 0 5 . 2 . 4 .3C ha r lo t te .......................................... ................................... 7 . 0 6 . 8 6 . 7 6 . 3 7 . 4 7 . 1 6 . 1 6 . 3 .1 .1Greensboro—Winston-Salem—'High P o in t ..................... 6 . 6 5 . 4 5 . 6 4 . 6 6 . 1 6 . 1 4 . 7 5 . 1 .5 ( 2 )
NORTH D AK O TA.................................................................. 8 . 3 5 . 1 7 . 6 3 . 8 8 . 1 6 . 5 5 . 4 4 . 4 1 . 1 .9Fargo-Moorhead.................................................................. 1 7 . 0 4 . 9 9 . 1 4 . 6 7 . 3 7 . 1 5 . 4 5 . 6 . 5 . 4
OHIO......................................................................................... 5 . 3 5 . 6 4 . 5 3 . 6 5 . 9 4 . 8 4 . 1 2 . 9 .6 .9Akron...................................................................................... 3 . 8 3 . 5 3 . 4 2 . 5 4 . 8 3 . 2 3 . 1 2 . 0 .6 . 4Canton ................................................................................... 4 . 4 4 . 4 3 . 7 3 . 7 6 . 4 4 . 9 3 . 9 2 . 9 . 8 .5Cincinnati............................................................................. 4 . 6 7 . 0 4 . 0 3 . 5 5 . 5 4 . 9 3 . 7 3 . 1 . 4 .6Cleveland............................................................................. 4 . 9 4 . 1 4 . 3 3 . 4 5 . 8 4 . 5 4 . 2 3 . 1 . 5 . 4Columbus............................................................................. 5 . 5 4 . 5 4 . 6 3 . 8 5 . 2 5 . 5 3 . 7 3 . 4 . 6 1 . 1Dayton ................................................................................... 5 . 7 7 . 3 4 . 9 2 . 8 5 . 6 4 . 0 3 . 7 2 . 5 . 3 . 6T o le d o ................................................................................... 6 . 4 5 . 4 5 . 4 4 . 0 7 . 4 5 . 7 4 . 7 3 . 2 . 6 . 8Youngstown-Warren............................................................ 2 . 8 8 . 5 2 . 3 1 . 8 4 . 7 6 . 2 3 . 5 1 . 9 .2 3 . 3
OKLAHOMA:Oklahoma C i t y ..................................................................... 9 . 5 9 . 2 8 . 2 7 . 9 8 . 1 9 . 1 6 . 3 6 . 9 . 5 . 8Tulsa ................................................................................ ( * ) ( * ) ( * ) ( * ) ( * ) ( * ) ( * ) <*) ( * ) ( * )
OREGON 1 ........................................................................... 6 . 6 5 . 3 5 . 7 4 . 7 8 . 1 6 . 5 5 . 4 3 . 8 1 . 6 1 . 7Portland ^ ........................................................................... 6 . 2 5 . 5 5 . 5 5 . 0 7 . 6 6 . 4 5 . 1 3 . 6 1 . 4 1 . 7
See footnotes at end of table. NOTE: Data for the current month are preliminary.
Digitized for FRASER http://fraser.stlouisfed.org/ Federal Reserve Bank of St. Louis

ESTABLISHMENT DATASTATE AND AREA LABOR TURNOVER
1 3 2
D -4 : Labor turnover ra te * in m anu fac turing fo r se lected States and a re a s —C on tin ued
(Per 100 employees)
State and area
Accession rates Separation ratesTotal New hires Total Q« its Layoffs
Sept.1969
Aug.1969
Sept.1969
Aug.1969
Sept.1969
Aug.1969
Sept.1969
Aug.1969
Sept.1969
Aug.1969
P E N N S Y L V A N I A :A l l e n t o w n -B e t h le h e m -E a s t o n ....................................................... 4 .4 3 .9 3 .2 2 .8 5 .3 4 .3 3 .6 3 .1 0 .8 0 .4A lt o o n a .......................................................................................................... 6 .4 8 .0 5 .9 4 .6 6 .3 6 .3 4 .6 4 .1 1 .0 1 .6E r i e .............................................................................................................. 5 .7 5 .0 4 .7 3 .7 6 .5 5 .0 4 .9 3 .4 .5 .4H a r r is b u r g ................................................................................................... 4 .0 3 .3 3 .1 2 .7 4 .7 4 .5 2 .7 2 .8 1 .0 1 .1J o h n s t o w n ............................................................................................... 3 .9 3 .2 1 .9 2 .6 4 .1 4 .5 2 .3 2 .4 1 .4 1 .5L a n c a s t e r ............................................................................................... 4 .5 3 .6 4 .0 3 .1 5 .5 5 .3 4 .4 4 .0 .4 .4P h i l a d e l p h i a ........................................................................................ 4 .9 4 .5 3 .9 3 .3 5 .6 5 .3 3 .5 3 .2 1 .0 1 .0P i t t s b u r g h ............................................................................................... 2 .8 2 .6 2 .1 1 .8 3 .7 3 .6 2 .2 2 .1 .6 .6R e a d i n g ................................................................................................... 4 .6 3 .8 4 .3 3 .1 5 .2 4 .6 4 .4 3 .7 .2 .3S c r a n to n ................................................................................................... 4 .3 4 .5 3 .8 3 .0 5 .4 4 .6 3 .6 3 .1 1 .2 .7W ilk e s -B a r r e —H a z le t o n .................................................................. 4 .4 5 .4 2 .9 2 .7 5 .6 5 .6 3 .3 3 .3 1 .6 1 .7Y o r k .............................................................................................................. 1 0 .3 5 .7 6 .3 4 .2 6 .4 6 .5 5 .5 4 .9 .1 .8
R H O D E I S L A N D .................................................................................... 8 .0 6 .0 6 .6 4 .8 9 .4 7 .2 6 .5 5 .1 1 .8 1 .1P r o v i d e n c e - P a w t u c k e t - W a r w ic k ............................................ 7 .7 5 .7 6 .3 4 .5 9 .3 7 .1 6 .6 5 .0 1 .7 1 .0
S O U T H C A R O L I N A :6 .6 6 .2 5 .9 5 .5 6 .6 7 .3 4 .9 5 .8 .5 .2
S O U T H D A K O T A ................................................................................. 6 .2 5 .0 4 .5 2 .6 7 .9 8 .0 5 .0 4 .7 1 .1 2 .2S io u x F a l l s ...................... ..................... 5 .2 4 .4 2 .7 1 .8 7 .6 9 .8 4 .0 4 .7 1 .6 3 .7
T E N N E S S E E :M e m p h is ................................................................................................... 5 .8 6 .9 5 .3 6 .1 8 .9 7 .2 4 .5 4 .7 3 .0 1 .0
T E X A S ....................................................................................................... <*) (*) (*) (*) (*) (*) (*) (*) <*) (*)(*) (*) (*) (*) (*) (*) (*) <*) (*) (*)
F o r t W orth ............................................................................................ (*) <*) (*) (*) (*) (*) (*) (*) (*) (*)H o u s to n ................................................................................................ (*) (*) (*) (*) (*) (*) (*) (*) (*) (*>S a n A n to n io ........................................................................................ <*) (*) (*) (*) (*) (*) (*) (*) (*) <*)
U T A H 5 ................................................................................................ 5 .4 5 .1 4 .1 4 .0 6 .5 5 .4 4 .1 3 .2 1 .5 1 .55 .3 5 .1 4 .3 4 .5 7 .1 4 .8 4 .3 3 .2 2 .0 . 8
V E R M O N T ................................................................................................... 4 .3 3 .4 3 .6 2 .8 4 .5 5 .0 3 .6 3 .6 .4 .6B u r l in g t o n ............................................................................................... 3 .5 2 .6 2 .6 2 .1 4 .0 4 .2 3 .1 2 .9 .5 .6S p r i n g f i e l d ............................................................................................ 2 .9 2 .5 2 .7 2 .2 2 .7 3 .1 2 .3 2 .3 (2 ) .1
V I R G I N I A ................................................................................................... 6 .1 5 .4 4 .9 4 .0 5 .8 6 .0 4 .4 4 .2 .5 .9R i c h m o n d ............................................................................................... 4 .6 4 .8 4 .3 3 .8 4 .8 5 .1 3 .8 3 .5 .1 .5
W A S H IN G T O N :S e a t t le -E v e r e t t ^ ......................................................................... 4 .0 3 .0 3 .2 2 .5 5 .2 4 .8 3 .5 2 .6 1 .1 1 .4
W E S T V IR G IN IA :C h a r le s t o n ............................................................................................... 1 .0 1 .3 .8 1 .1 2 .9 3 .2 1 .4 1 .5 .9 1 .3
W I S C O N S IN ............................................................................................... 5 .9 6 .6 5 .0 5 .0 7 .4 6 .9 4 .9 4 .9 1 .3 .9M ilw a u k e e ............................................................................................... 5 .4 5 .6 4 .6 3 .6 6 .3 5 .9 4 .4 4 .2 .6 .5
W Y O M IN G 5 ........................................................................................ 7 .8 5 .4 7 .0 5 .0 7 .7 7 .7 5 .2 5 .2 1 .2 1 .4
1 E xclu des cann in g and p r e s e r v in g .2 L ess than 0 .0 5 .2 E xcludes a g r ic u l tu r a l ch em ica ls and m isce lla n e o u s m an u factu rin g .4 E xcludes canned f r u i t s , v e g e t a b le s , p r e s e r v e s , jams and j e l l i e s .5 E xcludes cann in g and p r e s e r v in g , and su ga r.6 E xclu des cann in g and p r e s e r v in g , and new spapers. r E xcludes p r in t in g and p u b lis h in g .8 I n i t i a l in c lu s io n in th is p u b l i c a t io n . Subarea o f P h ila d e lp h ia , P en n sy lv a n ia S tandard M e tro p o lita n S t a t i s t i c a l A rea .9 Subarea o f R och ester S tandard M e tro p o lita n S t a t i s t i c a l A rea .
1C Subarea o f Mew York Standard M e tro p o lita n S t a t i s t i c a l A rea .11 E xcludes cann in g and p r e s e r v in g , p r in t in g and p u b lis h in g .
* Not a v a i la b le .NOTE: Data f o r the cu rre n t month are p re lim in a r y .SOURCE: C oop era tin g S ta te a g e n c ie s l i s t e d on in s id e back co v e r .
Digitized for FRASER http://fraser.stlouisfed.org/ Federal Reserve Bank of St. Louis
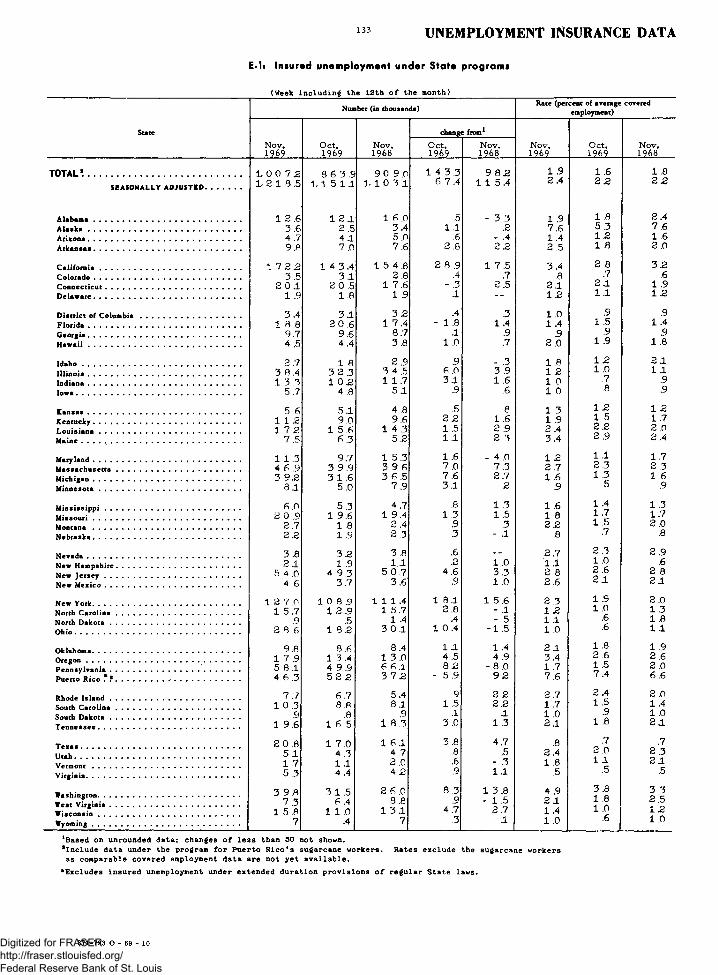
133 UNEMPLOYMENT INSURANCE DATA
E-1: Insured unemployment under State programs
State
TOTAL *...............................................SEASONALLY ADJUSTED
A la b a m a .......................A l a s k a ..........................A r iz o n a ..........................A r k a n s a s .......................
C a l i f o r n ia ....................C o lo ra d o .......................C o n n e c t ic u t ................D e la w a re .......................
D is tr ic t of Colum biaF lo r id a ............. ... . . ,G e o rg ia ..........................H a w a i i ..........................
I d a h o .............................I l l i n o i s ..........................In d ia n a ..........................Io w a ................................
K a n sa s ..........................K e n tu c k y .......................L o u i s ia n a ....................M aine ..............................
M a ry la n d .......................M assach usetts . . . .M ichigan .......................M in n e s o ta ....................
M is s is s i p p i .................M is s o u r i.......................M o n t a n a .......................N e b ra sk a .......................
Nevada ..........................New Hampshire . . . .New J e r s e y .................New M e x ic o .................
New Y o rk.......................North C a ro lin a . . . .North D a k o t a .............O h io .................................
O klahom a.......................O re g o n ...........................P e n n s y lv a n ia ..............Puerto R ic o
Rhode I s l a n d .............South C a ro lin a . . . .South D a k o t a .............T e n n e s s e e ....................
T e x a s ..............................U ta h .................................V e r m o n t .......................V irg in ia ...........................
W ashington....................West V i r g in ia ..............W is c o n s in ....................W yom ing .......................
(Week In c lu d in g the 12th o f the month)
Number (in thousands)
change from1N o v . O c t . N o v . O c t . N o v .1 9 6 9 1 9 6 9 1 9 6 8 1 9 6 9 1 9 6 8
1 0 0 7 5 8 6 3 .9 9 0 9.0 1 4 3.3 9 8 51 2 1 8 . 5 1,1 5 1 1 1, 1 0 3 .1 6 7.4 1 1 5.4
1 2.6 1 2 1 1 6.0 .5 - 3.33.6 2.5 3.4 1.1 .24.7 4 1 5.0 .6 - .49.8 7.0 7.6 2.8 2 2
1 7 2 5 1 4 3.4 1 5 4.8 2 8 .9 1 7.53.5 3.1 2.8 .4 .7
2 0.1 2 0.5 1 7.6 - .3 2.51 .9 1.8 1 .9 1 - -
3.4 3 1 3.2 .4 .31 8 .8 2 0 .6 1 7.4 - 1.8 1.4
9.7 9.6 8.7 .1 .94 .5 4.4 3.8 1 .0 .7
2.7 1 8 2.9 .9 - .33 8.4 3 2.3 3 4 .5 6.0 3 .91 3 3 1 0.2 1 1.7 3 1 1 .6
5.7 4 .8 5.1 .9 .6
5 6 5 1 4.8 .5 .81 1 .2 9.0 9.6 2.2 1 .61 7.2 1 5.6 1 4 .3 1 .5 2 .9
7 .5 6.3 5.2 1.1 2.3
1 1 .3 9.7 1 5.3 1 .6 - 4 .04 6 .9 3 9.9 3 9.6 7.0 7.33 9.2 3 1 .6 3 6.5 7.6 2.7
8 1 5.0 7.9 3.1 .2
6.0 5.3 4.7 .8 1.32 0 .9 1 9.6 1 9.4 1 .3 1 .5
2.7 1 .8 2.4 .9 .32.2 1 .9 2.3 .3 - 1
3.8 3.2 3.8 .6 - -
2 1 1 .9 1.1 .2 1 .05 4 .0 4 9.3 5 0.7 4.6 3.3
4.6 3.7 3.6 .9 1 . 0
1 2 7.0 1 0 8 .9 1 1 1 .4 1 8 1 1 5.61 5.7 1 2 .9 1 5.7 2.8 - .1
.9 .5 1 .4 .4 - .52 8 6 1 8.2 3 0.1 1 0 .4 - 1 .5
9.8 8.6 8.4 1 1 1 .41 7 .9 1 3.4 1 3.0 4.5 4.95 8.1 4 9.9 6 6.1 8.2 - 8.04 6 .3 5 2.2 3 7 2 - 5 .9 9 2
7.7 6.7 5.4 .9 2.21 0.3 8.8 8 1 1 .5 2.2
.9 .8 .9 .1 .11 9.6 1 6 .5 1 8.3 3.0 1 .3
2 0 .8 1 7.0 1 6 1 3.8 4.75 1 4.3 4.7 .8 .51.7 1 1 2.0 .6 - .35.3 4.4 4 2 .9 1 1
3 9.8 3 1.5 2 6.0 8 .3 1 3.87.3 6.4 8.8 .9 - 1 .5
1 5.8 1 1 .0 1 3 1 4.7 2.77 .4 .7 .3 1
Rate (percent of average covered employment)
N o v . O c t , N o v .1 9 6 9 1 9 6 9 1 9 6 8
1 .9 2 .4
1.62.2
1.82.2
1 .97.61.42 53.4
.82.11.2
1 .01.4
.92.0
1.8 1.2 1 .0 1.01.3 1 .92.43.41 22.7 1 .6
.91 .61.82.2
.8
2.71 .12.8 2.6
2.3 12 1.1 1.02 13.4 1.77.62.71.7 1.0 2.1
.82.41 .8
.54 .9 211.4 1 .0
1.85.3 1.2 1 .8
2.8.7
2 11.1
.9 1 .5
.9 1 .91 2 1 .0
.7
.8
1 21 .5 2.22 .9
1.12.3 1 .3
.5
1.41.71 .5
.7
2.3 1.0 2.6 2 1
1 .91 .0
.6
.6
1 .82 .6I .57.4
2.41.5
.91 .8
.72.0I I
.5
3.8 1 .8 1 .0
.6
2.47.61.62.0
3.2 .6
1 .91.2
.91.4
.91.8
2.11 1
.9
.9
1.21.7 2.02.4
1.72 .3 1 .6
.9
1 .31.7 2.0
.8
2 .9.6
2.8 2 1
2.0 1 .3 1 .8 1.1
1 .9 2.6 2.0 6.6
2.01.4 1.0 2 1
.72 .3 2 1
.5
3.3 2:5 1 2 1 .0
1Based on unrounded data ; changes o f l e s s than 50 n ot shown.■ in clu d e d ata under the program f o r P u erto R ic o 's sugarcane w orkers. R ates ex c lu d e the sugarcane w orkers
as com parable cov ered employment data are n o t y e t a v a i la b le .^Excludes in su red unemployment under extended d u ra tio n p r o v is io n s o f r e g u la r S ta te law s.
371-793 0 - 69 - 10Digitized for FRASER http://fraser.stlouisfed.org/ Federal Reserve Bank of St. Louis

UNEMPLOYMENT INSURANCE DATA 134
E-2: Insured un em plo ym ent1 in 150 major labor a re a s 2
(In thousands, for week including the 12th of the month)
State and areaN ov.1969
Oct.1969 State and area
Nov.1969
O ct. 1969 State and area
Nov.1969
Oct.1969 State and area
Nov.1969
Oct.1969
ALABAMA INDIANA NEW HAMPSHIRE Pennsylvania-Birmingham..... 3.1 2.6 Evansville...... .8 .7 Manchester..... .7 .4 continued
1 .5 1.6 .4 .3 York................ .8 .6Gary-Hammond.. 1.3 .8Indianapolis.... 2.4 1.8 NEW JERSEYSouth Bend..... 1 .0 9 Atlantic City.... 2 .7 1 .8 PUERTO RICO
ARIZONA .4 £ Jersey City .... 7.7 7.4 Mayaguez.......... 1 .8 1 .82.7 2.4 Newark........... 1 3 0 1 3 .0 Ponce.............. 2 .5 2.2
New Brunswick. 4.7 4.4 San Juan........... 4.4 4.3IOWA Paterson ......... 1 1 .0 1 0 .3
ARKANSAS Cedar Rapids.... £ 1 Trenton ......... 1.3 1.2Little Rock...... .7 .6 Des Moines..... .7 .7
RHODE ISLANDCALIFORNIA KANSAS NEW MEXICO Providence........ 8 £ 1 £Anaheim-S. Ana- Wichita ........... 1 .9 1.8 Albuquerque .... 1 .9 1.7Garden Grove . 1 0 .4 9.1
Fresno............ 3.7 2.4 KENTUCKYLos Angeles.... 6 8.8 6 2 .7 Louisville....... 2 .3 2 .6 NEW YORK SOUTH CAROLINASacramento..... 8.0 6.5 Albany ........... 3 .0 2.3 Charleston....... 9 9San Bernardino.. 8.4 7.6 LOUISIANA Binghamton.... 1 3 .9 Greenville...... 1 1 9
9.0 7 .9 1 .3 1.3 Buffalo .......... 6.7 5 £San Francisco .. 2 8.4 2 3.7 New Orleans .... 5.4 5.3 New York........ 9 2 .9 8 4.8
8.6 6.5 1 1 .9 Rochester...... 2.7 2 £4.6 2.8 Syracuse ........ 3.3 2 1 TENNESSEE
Utica............. 2.7 1.8 Chattanooga.... 1.7 1 £MAINE Knoxville....... 2 .3 1.4
COLORADO Portland.......... .6 .6 Memphis.......... 2 .7 2 .61 8 1.8 NORTH CAROLINA Nashville........ 1 .5 1.4
MARYLAND Asheville........ .8 .5Baltimore....... 7.4 6 .7 Charlotte....... 1 .0 .8
CONNECTICUT Durham........... .6 .4 TEXASRri/lgApnrt 3.1 3 .4 Greensboro— Austin ............ .4 .3Hartford ....... 3 .4 4.6 MASSACHUSETTS Winston-Salem. 1 .5 1 .0 Beaumont....... 1 .4 1 £|aiv Pnr in..... 1 £ 1 .3 Boston............ 1 9 £ 1 7.6 Corpus Christi.. .7 .6jpn; ..... 2 .5 2.4 Brockton ........ 1 .4 1 3 Dallas ............ 1 .7 1 .5rarnfnM......... 1 .0 .9 Fall River...... 3 .3 2.3 OHIO El Paso .......... 1.8 1 3
....... 2 .4 2 2 I.awrence ....... 3 .5 3 1 1 .5 1 .3 Ft. Worth......... 1 .0 .82.0 1.8 Canton ......... .9 .7 Houston .......... 1 .9 1 .8
New Bedford .... 3.4 2 £ Cincinnati..... 5.7 2.4 San Antonio.... 1 .6 1 .5DELAWARE Springfield...... 4 .5 4 2 Cleveland..... 4.0 3 2XBt lm ingfon 1 .9 1.8 Worcester____ 2.5 2 2 Columbus...... 2 2 1.4
Dayton ......... 1 .4 1 .0 UTAHHamilton....... .8 .4 Salt Lake City •• 2.8 2 .6
DIST. OF COL. MICHIGAN Lorain........... .7 .4Washington..... 5 .8 5 1 Battle Creek .... .9 .6 Steubenville ... .4 .3
n#»rrrtif- 1 6.7 1 4.6 Toledo.......... 1 .3 1.0Flint.............. 2.4 2.0 Youngstown.... 1 .0 .8 VIRGINIA
FLORIDA Grand Rapids ... 3.0 2.4 Hampton.......... .7 .6J acksonviile. .7 .6 Kalamazoo...... .6 .6 Norfolk............ .9 .8Miami............. 6 £ 5.6 Lansing........... 1 J. .9 OKLAHOMA Richmond........ .3 .3Tampa............ 2 .5 2.6 Muskegon ....... .8 1.0 Oklahoma City. 1 .5 1.6 Roanoke.......... JL £
Saginaw .......... .5 .5 Tulsa............ 2 1 1 .6
GEORGIA WASHINGTONArlanra ........ 2 .4 2 .8 MINNESOTA OREGON Seattle............ 1 8.0 1 5 1AngiKta ....... .7 .7 Duluth ............ .9 .7 Portland....... 7 .6 5.5 Spokane........... 2.8 2 2r oltimhus........ .6 .6 Minneapolis.... 2 2 1.6 Tacoma........... 4.4 3.4Macon............ .5 .5Savannah........ .4 .3 PENNSYLVANIA
MISSISSIPPI Allentown..... 2.3 2.3 WEST VIRGINIAJackson ........ .4 3 Altoona.......... .9 .7 Charleston..... 1.0 .7
HAWAII .7 .6 Huntington..... 1 .7 1 1Honolulu...... 3.3 3.5 Harrisburg..... 1 £ .9 Wheeling........ .8 .7
MISSOURI Johnstown..... 1 .9 1.5Kansas City.... 4 .3 4 .0 Lancaster..... .7 .5
ILLINOIS St. Louis....... 1 2 2 1 1 £ Philadelphia ... 2 3 1 2 1 .9 WISCONSINChicago........ 1 8 .9 1 6 .6 Pittsburgh .... 1 0 . 6 8 .6 Kenosha......... .5 .3D aven p orr........ 3 .0 2 £ Reading......... 9 .9 Madison ......... .5 .3
.9 .7 N E B R A S K A Scranton............. 2 . 9 2 .4 M ilwaukee ........ 4 5 3 .7Rockford...... 1 . 0 .8 Omaha............ 1 £ 1 1 Wilkes-Barre... 4 .5 3 .7 Racine........... .6 .4
1Insured jobless under State, Federal Bnployee, and Ex-Servicemen's unemployment insurance programs.2For full name of labor area, see Area Trends in Bnployment and Unemployment published by the Bureau of Bnployment Security.
♦Excludes insured unemployed under extended duration provisions of regular State laws.♦♦Revised.
Digitized for FRASER http://fraser.stlouisfed.org/ Federal Reserve Bank of St. Louis

Technical Note
A d d i t io n a l in f o r m a t io n c o n c e r n i n g t h e p r e p a r a t i o n
o f t h e l a b o r f o r c e , e m p lo y m e n t , h o u r s a n d e a r n i n g s ,
a n d l a b o r t u r n o v e r s e r i e s — c o n c e p t s a n d s c o p e ,
s u r v e y m e t h o d s , a n d l i m i t a t i o n s — i s c o n t a in e d in
t e c h n i c a l n o t e s f o r e a c h o f t h e s e s e r i e s , a v a i l a b l e
f r o m t h e B u r e a u o f L a b o r S t a t i s t i c s f r e e o f c h a r g e .
INTRODUCTION
T h e s t a t i s t i c s in t h i s p e r i o d i c a l a r e c o m p i le d f r o m
t h r e e m a j o r s o u r c e s : ( 1 ) h o u s e h o ld i n t e r v i e w s , ( 2 ) p a y
r o l l r e p o r t s f r o m e m p l o y e r s , a n d ( 3 ) a d m i n i s t r a t i v e
s t a t i s t i c s o f u n e m p lo y m e n t i n s u r a n c e s y s t e m s .
Data b a sed on h ou seh old in ter v ie w s a r e o b t a in e d f r o m
a s a m p l e s u r v e y o f t h e p o p u la t io n 16 y e a r s o f a g e a n d
o v e r . T h e s u r v e y i s c o n d u c t e d e a c h m o n t h b y t h e B u r e a u
o f t h e C e n s u s f o r t h e B u r e a u o f L a b o r S t a t i s t i c s a n d p r o
v i d e s c o m p r e h e n s i v e d a t a o n t h e l a b o r f o r c e , t h e e m
p lo y e d a n d t h e u n e m p lo y e d , i n c lu d in g s u c h c h a r a c t e r i s t i c s
a s a g e , s e x , c o l o r , m a r i t a l s t a t u s , o c c u p a t io n s , h o u r s o f
w o r k , a n d d u r a t io n o f u n e m p lo y m e n t . T h e s u r v e y a l s o
p r o v i d e s d a t a o n t h e c h a r a c t e r i s t i c s a n d p a s t w o r k e x
p e r i e n c e o f t h o s e n o t in t h e l a b o r f o r c e . T h e in f o r m a t io n
i s c o l l e c t e d b y t r a i n e d i n t e r v i e w e r s f r o m a s a m p l e o f
a b o u t 5 0 ,0 0 0 h o u s e h o ld s , r e p r e s e n t i n g 4 4 9 a r e a s in 8 6 3
c o u n t ie s a n d in d e p e n d e n t c i t i e s , w it h c o v e r a g e in 5 0 S t a t e s
a n d t h e D i s t r i c t o f C o l u m b i a . T h e d a t a c o l l e c t e d a r e b a s e d
o n t h e a c t i v i t y o r s t a t u s r e p o r t e d f o r t h e c a l e n d a r w e e k
in c lu d in g t h e 1 2 th o f t h e m o n t h .
Data b a sed o n esta b lish m en t p a y roll record s a r e c o m
p i l e d e a c h m o n th f r o m m a i l q u e s t i o n n a i r e s b y th e B u r e a u
o f L a b o r S t a t i s t i c s , in c o o p e r a t io n w it h S t a t e a g e n c i e s .
T h e p a y r o l l s u r v e y p r o v i d e s d e t a i l e d i n d u s t r y i n f o r m a t io n
o n n o n a g r i c u l t u r a l w a g e a n d s a l a r y e m p lo y m e n t , a v e r
a g e w e e k ly h o u r s , a v e r a g e h o u r l y a n d w e e k ly e a r n i n g s ,
a n d l a b o r t u r n o v e r f o r t h e N a t io n , S t a t e s , a n d m e t r o
p o l i t a n a r e a s . T h e f i g u r e s a r e b a s e d o n p a y r o l l r e p o r t s
f r o m a s a m p l e o f e s t a b l i s h m e n t s e m p lo y in g a b o u t 3 0
m i l l i o n n o n a g r i c u l t u r e w a g e a n d s a l a r y w o r k e r s . T h e
d a t a r e l a t e to a l l w o r k e r s , f u l l - o r p a r t - t i m e , w h o r e
c e i v e d p a y d u r in g th e p a y r o l l p e r io d w h ic h i n c l u d e s th e
1 2 th o f t h e m o n t h .
Data b a sed on adm inistrative record s of u n em ploym ent insurance s y s te m s f u r n i s h a c o m p le t e c o u n t o f i n s u r e d
u n e m p lo y m e n t a m o n g t h e t w o - t h i r d s o f t h e N a t io n ’ s
l a b o r f o r c e c o v e r e d b y u n e m p lo y m e n t i n s u r a n c e p r o
g r a m s . W e e k ly r e p o r t s , b y S t a t e , a r e i s s u e d o n t h e
n u m b e r o f i n i t i a l c l a i m s , t h e v o l u m e a n d r a t e o f i n s u r e d
u n e m p lo y m e n t u n d e r S t a t e u n e m p lo y m e n t i n s u r a n c e p r o
g r a m s , a n d t h e v o l u m e u n d e r p r o g r a m s o f u n e m p lo y m e n t
c o m p e n s a t io n f o r F e d e r a l e m p l o y e e s , e x - s e r v i c e m e n ,
a n d r a i l r o a d w o r k e r s . T h e s e s t a t i s t i c s a r e p u b l i s h e d b y
th e M a n p o w e r A d m in i s t r a t io n , U . S . D e p a r t m e n t o f L a b o r ,
in ‘ ’ U n e m p lo y m e n t I n s u r a n c e C l a i m s . ”
Relation between the household and payroll series
T h e h o u s e h o ld a n d p a y r o l l d a t a s u p p le m e n t o n e
a n o t h e r , e a c h p r o v id in g s i g n i f i c a n t t y p e s o f in f o r m a t io n
t h a t t h e o t h e r c a n n o t s u i t a b l y s u p p ly . P o p u la t io n c h a r a c
t e r i s t i c s , f o r e x a m p le , a r e r e a d i l y o b t a in e d o n ly f r o m
t h e h o u s e h o ld s u r v e y w h e r e a s d e t a i l e d i n d u s t r i a l c l a s s i
f i c a t i o n s c a n b e r e l i a b l y d e r i v e d o n ly f r o m e s t a b l i s h
m e n t r e p o r t s .
D a t a f r o m t h e s e tw o s o u r c e s d i f f e r f r o m e a c h o t h e r
b e c a u s e o f d i f f e r e n c e s in d e f in i t io n a n d c o v e r a g e , s o u r c e s
o f i n f o r m a t i o n , m e t h o d s o f c o l l e c t i o n , a n d e s t i m a t i n g
p r o c e d u r e s . S a m p l in g v a r i a b i l i t y a n d r e s p o n s e e r r o r s
a r e a d d i t io n a l r e a s o n s f o r d i s c r e p a n c i e s . T h e m a j o r
f a c t o r s w h ic h h a v e a d i f f e r e n t i a l e f f e c t o n l e v e l s a n d
t r e n d s o f t h e tw o s e r i e s a r e a s f o l l o w s :
Employment
C o v e r a g e . T h e h o u s e h o ld s u r v e y d e f in i t io n o f e m p lo y
m e n t c o m p r i s e s w a g e a n d s a l a r y w o r k e r s ( in c lu d in g
d o m e s t i c s a n d o t h e r p r i v a t e h o u s e h o ld w o r k e r s ) , s e l f -
e m p lo y e d p e r s o n s , a n d u n p a id w o r k e r s w h o w o r k e d 1 5
h o u r s o r m o r e d u r in g t h e s u r v e y w e e k in f a m i l y - o p e r a t e d
e n t e r p r i s e s . E m p lo y m e n t in b o th a g r i c u l t u r a l a n d n o n
a g r i c u l t u r a l i n d u s t r i e s i s in c lu d e d . T h e p a y r o l l s u r v e y
c o v e r s o n ly w a g e a n d s a l a r y e m p lo y e e s o n t h e p a y r o l l s
o f n o n a g r i c u l t u r a l e s t a b l i s h m e n t s .
M ultiple jo b h o ld in g . T h e h o u s e h o ld a p p r o a c h p r o
v i d e s in f o r m a t i o n o n t h e w o r k s t a t u s o f t h e p o p u la t io n
w ith o u t d u p l i c a t io n s i n c e e a c h p e r s o n i s c l a s s i f i e d a s
e m p lo y e d , u n e m p lo y e d , o r n o t in t h e l a b o r f o r c e . E m
p lo y e d p e r s o n s h o ld in g m o r e t h a n o n e jo b a r e c o u n t e d
o n ly o n c e a n d a r e c l a s s i f i e d a c c o r d i n g to t h e jo b a t
w h ic h t h e y w o r k e d t h e g r e a t e s t n u m b e r o f h o u r s d u r in g
t h e s u r v e y w e e k . In t h e f i g u r e s b a s e d o n e s t a b l i s h m e n t
r e c o r d s , p e r s o n s w h o w o r k e d in m o r e t h a n o n e e s t a b
l i s h m e n t d u r in g t h e r e p o r t i n g p e r io d a r e c o u n t e d e a c h
t i m e t h e i r n a m e s a p p e a r o n p a y r o l l s .
Unpaid a b s e n c e s from jo b s . T h e h o u s e h o ld s u r v e y i n
c l u d e s a m o n g t h e e m p lo y e d a l l p e r s o n s w h o h a d jo b s b u t
w e r e n o t a t w o r k d u r in g t h e s u r v e y w e e k — t h a t i s , w e r e
n o t w o r k in g b u t h a d jo b s f r o m w h ic h t h e y w e r e t e m
p o r a r i l y a b s e n t b e c a u s e o f i l l n e s s , b a d w e a t h e r , v a c a
t io n , l a b o r - m a n a g e m e n t d i s p u t e , o r b e c a u s e t h e y w e r e
t a k in g t i m e o f f f o r v a r i o u s o t h e r r e a s o n s , e v e n i f t h e y
w e r e n o t p a id b y t h e i r e m p l o y e r s f o r t h e t i m e o f f . In
1 35
Digitized for FRASER http://fraser.stlouisfed.org/ Federal Reserve Bank of St. Louis

t h e f i g u r e s b a s e d o n p a y r o l l r e p o r t s , p e r s o n s o n l e a v e
p a id f o r b y t h e c o m p a n y a r e i n c l u d e d , b u t n o t
t h o s e o n l e a v e w i t h o u t p a y f o r t h e e n t i r e p a y r o l l
p e r i o d .
Hours of Work
T h e h o u s e h o ld s u r v e y m e a s u r e s h o u r s a c t u a l l y w o r k e d
w h e r e a s t h e p a y r o l l s u r v e y m e a s u r e s h o u r s p a id f o r b y
e m p l o y e r s . In t h e h o u s e h o ld s u r v e y d a t a , a l l p e r s o n s
w it h a jo b b u t n o t a t w o r k a r e e x c lu d e d f r o m t h e h o u r s
d i s t r i b u t i o n s a n d t h e c o m p u t a t io n s o f a v e r a g e h o u r s .
In t h e p a y r o l l s u r v e y , e m p lo y e e s o n p a id v a c a t i o n , p a id
h o l i d a y , o r p a id s i c k l e a v e a r e in c lu d e d a n d a s s i g n e d t h e
n u m b e r o f h o u r s f o r w h ic h t h e y w e r e p a id d u r in g t h e
r e p o r t i n g p e r io d .
Comparability of the household interview data with other series
U n em p loym en t insurance data. T h e u n e m p lo y e d t o t a l
f r o m t h e h o u s e h o ld s u r v e y i n c l u d e s a l l p e r s o n s w h o d id
n o t h a v e a jo b a t a l l d u r in g t h e s u r v e y w e e k a n d w e r e lo o k
in g f o r w o r k o r w e r e w a i t in g to b e c a l l e d b a c k to a jo b
f r o m w h ic h t h e y h a d b e e n l a i d o f f , r e g a r d l e s s o f w h e t h e r
o r n o t t h e y w e r e e l i g i b l e f o r u n e m p lo y m e n t i n s u r a n c e .
F i g u r e s o n u n e m p lo y m e n t i n s u r a n c e c l a i m s , p r e p a r e d b y
t h e M a n p o w e r A d m i n i s t r a t i o n o f t h e D e p a r t m e n t o f
L a b o r , e x c lu d e p e r s o n s w h o h a v e e x h a u s t e d t h e i r b e n e f i t
r i g h t s , n e w w o r k e r s w h o h a v e n o t e a r n e d r i g h t s to u n
e m p lo y m e n t i n s u r a n c e , a n d p e r s o n s lo s i n g jo b s n o t
c o v e r e d b y u n e m p lo y m e n t i n s u r a n c e s y s t e m s ( a g r i c u l
t u r e , S t a t e a n d l o c a l g o v e r n m e n t , d o m e s t i c s e r v i c e ,
s e l f e m p lo y m e n t , u n p a id f a m i l y w o r k , n o n p r o f i t o r g a n i z a
t i o n s , a n d f i r m s b e lo w a m in im u m s i z e ) .
In a d d i t io n , t h e q u a l i f i c a t i o n s f o r d r a w in g u n e m p lo y
m e n t c o m p e n s a t io n d i f f e r f r o m t h e d e f in i t io n o f u n e m
p lo y m e n t u s e d i n t h e h o u s e h o ld s u r v e y . F o r e x a m p le ,
p e r s o n s w i t h a jo b b u t n o t a t w o r k a n d p e r s o n s w o r k in g
o n ly a f e w h o u r s d u r in g t h e w e e k a r e s o m e t i m e s e l i g i b l e
f o r u n e m p lo y m e n t c o m p e n s a t io n b u t a r e c l a s s i f i e d a s
e m p lo y e d r a t h e r t h a n u n e m p lo y e d i n t h e h o u s e h o ld
s u r v e y .
A gricultural em p loym en t es tim a tes o f the D epartm ent o f A gricu ltu re. T h e p r i n c i p a l d i f f e r e n c e s in c o v e r a g e
a r e t h e i n c l u s i o n o f p e r s o n s u n d e r 16 in t h e S t a t i s t i c a l
R e s e a r c h S e r v i c e ( S R S ) s e r i e s a n d t h e t r e a t m e n t o f d u a l
jo b h o l d e r s w h o a r e c o u n t e d m o r e t h a n o n c e i f t h e y w o r k e d
o n m o r e t h a n o n e f a r m d u r in g t h e r e p o r t i n g p e r io d .
T h e r e a r e a l s o w id e d i f f e r e n c e s i n s a m p l i n g t e c h n iq u e s
a n d c o l l e c t i n g a n d e s t i m a t i n g m e t h o d s , w h ic h c a n n o t b e
r e a d i l y m e a s u r e d i n t e r m s o f im p a c t o n d i f f e r e n c e s in
l e v e l a n d t r e n d o f t h e tw o s e r i e s .
Comparability of the payroll employment data with other series
S ta tis tic s on m anufactures and b u s in e s s , Bureau of the C e n s u s . B L S e s t a b l i s h m e n t s t a t i s t i c s o n e m p lo y m e n t
d i f f e r f r o m e m p lo y m e n t c o u n t s d e r i v e d b y t h e B u r e a u
o f t h e C e n s u s f r o m i t s c e n s u s e s o r a n n u a l s a m p l e s u r
v e y s o f m a n u f a c t u r in g e s t a b l i s h m e n t s a n d t h e c e n s u s e s
o f b u s i n e s s e s t a b l i s h m e n t s . T h e m a j o r r e a s o n s f o r s o m e
n o n c o m p a r a b i l i t y a r e d i f f e r e n t t r e a t m e n t o f b u s i n e s s
u n i t s c o n s i d e r e d p a r t s o f a n e s t a b l i s h m e n t , s u c h a s
c e n t r a l a d m i n i s t r a t i v e o f f i c e s a n d a u x i l i a r y u n i t s , t h e
i n d u s t r i a l c l a s s i f i c a t i o n o f e s t a b l i s h m e n t s , a n d d i f f e r e n t
r e p o r t i n g p a t t e r n s b y m u l t iu n i t c o m p a n i e s . T h e r e a r e
a l s o d i f f e r e n c e s in t h e s c o p e o f t h e i n d u s t r i e s c o v e r e d ,
e . g . , t h e C e n s u s o f B u s i n e s s e x c l u d e s c o n t r a c t c o n s t r u c
t io n , p r o f e s s i o n a l s e r v i c e s , p u b l i c u t i l i t i e s , a n d f i n a n c i a l
e s t a b l i s h m e n t s , w h e r e a s t h e s e a r e in c lu d e d in B L S
s t a t i s t i c s .
C ou n ty B u s in e s s P a ttern s. D a t a in C o u n t y B u s i n e s s
P a t t e r n s , p u b l i s h e d j o i n t ly b y t h e U . S . D e p a r t m e n t s o f
C o m m e r c e a n d H e a l t h , E d u c a t i o n , a n d W e l f a r e , d i f f e r
f r o m B L S e s t a b l i s h m e n t s t a t i s t i c s in t h e t r e a t m e n t o f
c e n t r a l a d m i n i s t r a t i v e o f f i c e s a n d a u x i l i a r y u n i t s . D i f
f e r e n c e s m a y a l s o a r i s e b e c a u s e o f i n d u s t r i a l c l a s s i f i
c a t io n a n d r e p o r t i n g p r a c t i c e s . In a d d i t io n , C B P E x c l u d e s
i n t e r s t a t e r a i l r o a d s a n d g o v e r n m e n t , a n d c o v e r a g e i s
i n c o m p le t e f o r s o m e o f t h e n o n p r o f i t a c t i v i t i e s .
E m p loym en t c o v e r e d by State u n em p loym ent insurance program s. N o t a l l n o n a g r i c u l t u r a l w a g e a n d s a l a r y w o r k
e r s a r e c o v e r e d b y th e u n e m p lo y m e n t i n s u r a n c e p r o
g r a m s . A l l w o r k e r s in c e r t a i n a c t i v i t i e s , s u c h a s
i n t e r s t a t e r a i l r o a d s , a r e e x c lu d e d . In a d d i t io n , s m a l l
f i r m s in c o v e r e d i n d u s t r i e s a r e a l s o e x c lu d e d in 31
S t a t e s . In g e n e r a l , t h e s e a r e e s t a b l i s h m e n t s w it h l e s s
th a n f o u r e m p l o y e e s .
Labor Force Data
CO LLEC TIO N AND CO VERA G E
S t a t i s t i c s o n t h e e m p lo y m e n t s t a t u s o f t h e p o p u la t io n ,
t h e p e r s o n a l , o c c u p a t io n a l , a n d o t h e r c h a r a c t e r i s t i c s o f
t h e e m p lo y e d , t h e u n e m p lo y e d , a n d p e r s o n s n o t in t h e
l a b o r f o r c e , a n d r e l a t e d d a t a a r e c o m p i le d f o r t h e B L S b y
t h e B u r e a u o f t h e C e n s u s in i t s C u r r e n t P o p u la t io n
S u r v e y ( C P S ) . A d e t a i l e d d e s c r i p t i o n o f t h i s s u r v e y
a p p e a r s in " C o n c e p ts and M eth od s U s e d in M anpow er S ta tis tic s from the Current P op u la tion S u rv ey” ( B L S R e
p o r t 3 1 3 ) . T h i s r e p o r t i s a v a i l a b l e f r o m B L S o n r e
q u e s t .
T h e s e m o n t h ly s u r v e y s o f t h e p o p u la t io n a r e c o n
d u c t e d w it h a s c i e n t i f i c a l l y s e l e c t e d s a m p l e d e s ig n e d to
r e p r e s e n t t h e c i v i l i a n n o n in s t i t u t io n a l p o p u la t io n 1 6 y e a r s
a n d o v e r . R e s p o n d e n t s a r e i n t e r v i e w e d to o b t a in i n f o r
m a t io n a b o u t t h e e m p lo y m e n t s t a t u s o f e a c h m e m b e r o f
t h e h o u s e h o ld 1 6 y e a r s o f a g e a n d o v e r . T h e i n q u i r y
r e l a t e s to a c t i v i t y o r s t a t u s d u r in g t h e c a l e n d a r w e e k ,
1 36
Digitized for FRASER http://fraser.stlouisfed.org/ Federal Reserve Bank of St. Louis

S u n d a y t h r o u g h S a t u r d a y , w h ic h i n c l u d e s t h e 1 2 th o f t h e
m o n t h . T h i s i s k n o w n a s t h e s u r v e y w e e k . A c t u a l f i e l d
i n t e r v i e w i n g i s c o n d u c t e d in t h e f o l l o w in g w e e k .
I n m a t e s o f in s t i t u t i o n s a n d p e r s o n s u n d e r 16 y e a r s
o f a g e a r e n o t c o v e r e d i n t h e r e g u l a r m o n t h ly e n u m e r a
t io n s a n d a r e e x c lu d e d f r o m t h e p o p u la t io n a n d l a b o r
f o r c e s t a t i s t i c s s h o w n in t h i s r e p o r t . D a t a o n m e m b e r s
o f t h e A r m e d F o r c e s , w h o a r e in c lu d e d a s p a r t o f t h e
c a t e g o r i e s " t o t a l n o n in s t i t u t io n a l p o p u la t io n " a n d " t o t a l
l a b o r f o r c e , " a r e o b t a in e d f r o m t h e D e p a r t m e n t o f D e
f e n s e .
E a c h m o n t h , 5 0 ,0 0 0 o c c u p ie d u n i t s a r e d e s ig n a t e d f o r
i n t e r v i e w . A b o u t 2 ,2 5 0 o f t h e s e h o u s e h o ld s a r e v i s i t e d
b u t i n t e r v i e w s a r e n o t o b t a in e d b e c a u s e t h e o c c u p a n t s
a r e n o t fo u n d a t h o m e a f t e r r e p e a t e d c a l l s o r a r e u n
a v a i l a b l e f o r o t h e r r e a s o n s . T h i s r e p r e s e n t s a n o n in
t e r v i e w r a t e f o r t h e s u r v e y o f a b o u t 4 .5 p e r c e n t . In a d d i
t io n to t h e 5 0 ,0 0 0 o c c u p ie d u n i t s , t h e r e a r e 8 ,5 0 0 s a m p l e
u n i t s in a n a v e r a g e m o n th w h ic h a r e v i s i t e d b u t fo u n d to b e
v a c a n t o r o t h e r w i s e n o t to b e e n u m e r a t e d . P a r t o f t h e
s a m p l e i s c h a n g e d e a c h m o n t h . T h e r o t a t io n p la n p r o v i d e s
f o r t h r e e - f o u r t h s o f t h e s a m p l e to b e c o m m o n f r o m o n e
m o n t h to* t h e n e x t , a n d o n e - h a l f to b e c o m m o n w it h t h e
s a m e m o n th a y e a r a g o .
CO N CEPTS
E m p lo yed p erson s c o m p r i s e ( a ) a l l t h o s e w h o d u r in g
th e s u r v e y w e e k d id a n y w o r k a t a l l a s p a id e m p lo y e e s , in
t h e i r o w n b u s i n e s s , p r o f e s s i o n , o r f a r m , o r w h o w o r k e d
1 5 h o u r s o r m o r e a s u n p a id w o r k e r s in a n e n t e r p r i s e
o p e r a t e d b y a m e m b e r o f t h e f a m i l y , a n d (b ) a l l t h o s e
w h o w e r e n o t w o r k in g b u t w h o h a d jo b s o r b u s i n e s s e s
f r o m w h ic h t h e y w e r e t e m p o r a r i l y a b s e n t b e c a u s e o f
i l l n e s s , b a d w e a t h e r , v a c a t i o n , labor-m a n a g e m e n t
d i s p u t e , o r p e r s o n a l r e a s o n s , w h e t h e r o r n o t t h e y w e r e
p a id b y t h e i r e m p l o y e r s f o r t h e t im e o f f , a n d w h e t h e r o r
n o t t h e y w e r e s e e k in g o t h e r jo b s .
E a c h e m p lo y e d p e r s o n i s c o u n t e d o n ly o n c e . T h o s e w h o
h e ld m o r e t h a n o n e jo b a r e c o u n t e d in t h e jo b a t w h ic h t h e y
w o r k e d t h e g r e a t e s t n u m b e r o f h o u r s d u r in g t h e s u r v e y
w e e k .
I n c lu d e d in t h e t o t a l a r e e m p lo y e d c i t i z e n s o f f o r
e ig n c o u n t r i e s , t e m p o r a r i l y in t h e U n i t e d S t a t e s , w h o a r e
n o t l i v i n g o n t h e p r e m i s e s o f a n E m b a s s y .
E x c l u d e d a r e p e r s o n s w h o s e o n ly a c t i v i t y c o n s i s t e d
o f w o r k a r o u n d t h e h o u s e ( s u c h a s o w n h o m e h o u s e w o r k ,
a n d p a in t in g o r r e p a i r i n g o w n h o m e ) o r v o l u n t e e r w o r k
f o r r e l i g i o u s , c h a r i t a b l e , a n d s i m i l a r o r g a n i z a t i o n s .
U n em p loyed p erson s c o m p r i s e a l l p e r s o n s w h o d id
n o t w o r k d u r in g t h e s u r v e y w e e k , w h o m a d e s p e c i f i c e f
f o r t s to f in d a jo b w i t h in t h e p a s t 4 w e e k s , a n d w h o w e r e
a v a i l a b l e f o r w o r k d u r in g t h e s u r v e y w e e k ( e x c e p t f o r
t e m p o r a r y i l l n e s s ) . A l s o in c lu d e d a s u n e m p lo y e d a r e
t h o s e w h o d id n o t w o r k a t a l l , w e r e a v a i l a b l e f o r w o r k ,
a n d ( a ) w e r e w a i t in g to b e c a l l e d b a c k to a jo b f r o m w h ic h
t h e y h a d b e e n l a i d o f f ; o r (b ) w e r e w a i t in g to r e p o r t to a
n e w w a g e o r s a l a r y jo b w i t h in 3 0 d a y s .
D u r a t io n o f u n e m p lo y m e n t r e p r e s e n t s t h e le n g t h o f
t i m e ( t h r o u g h t h e c u r r e n t s u r v e y w e e k ) d u r in g w h ic h p e r
s o n s c l a s s i f i e d a s u n e m p lo y e d h a d b e e n c o n t in u o u s ly lo o k
in g f o r w o r k . F o r p e r s o n s o n l a y o f f , d u r a t io n o f u n e m
p lo y m e n t r e p r e s e n t s t h e n u m b e r o f f u l l w e e k s s i n c e t h e
t e r m i n a t i o n o f t h e i r m o s t r e c e n t e m p lo y m e n t . A p e r io d o f
2 w e e k s o r m o r e d u r in g w h ic h a p e r s o n w a s e m p lo y e d o r
c e a s e d lo o k in g f o r w o r k i s c o n s i d e r e d to b r e a k t h e c o n
t in u i t y o f t h e p r e s e n t p e r io d o f s e e k i n g w o r k . A v e r a g e
d u r a t io n i s a n a r i t h m e t i c m e a n c o m p u t e d f r o m a d i s t r i
b u t io n b y s i n g l e w e e k s o f u n e m p lo y m e n t .
U n e m p lo y e d p e r s o n s b y r e a s o n s f o r u n e m p lo y m e n t
a r e d iv i d e d in to f o u r m a j o r g r o u p s . (1 ) J o b l o s e r s a r e
p e r s o n s w h o s e e m p lo y m e n t e n d e d i n v o l u n t a r i l y w h o i m
m e d i a t e l y b e g a n lo o k in g f o r w o r k a n d p e r s o n s o n l a y o f f .
(2 ) J o b l e a v e r s a r e p e r s o n s w h o q u it o r o t h e r w i s e t e r m i
n a t e d t h e i r e m p lo y m e n t v o l u n t a r i l y a n d i m m e d i a t e l y
b e g a n lo o k in g f o r w o r k . (3 ) R e e n t r a n t s a r e p e r s o n s w h o
p r e v i o u s l y w o r k e d a t a f u l l - t i m e jo b l a s t i n g 2 w e e k s o r
lo n g e r b u t w h o w e r e o u t o f th e l a b o r f o r c e p r i o r to b e
g in n in g to lo o k f o r w o r k . (4 ) N e w e n t r a n t s a r e p e r s o n s
w h o n e v e r w o r k e d a t a f u l l - t i m e jo b l a s t i n g 2 w e e k s o r
lo n g e r .
The c iv ilia n labor force c o m p r i s e s t h e t o t a l o f a l l
c i v i l i a n s c l a s s i f i e d a s e m p lo y e d o r u n e m p lo y e d in a c
c o r d a n c e w i t h t h e c r i t e r i a d e s c r i b e d a b o v e . T h e " t o t a l
l a b o r f o r c e " a l s o i n c l u d e s m e m b e r s o f t h e A r m e d F o r c e s
s t a t io n e d e i t h e r in t h e U n i t e d S t a t e s o r a b r o a d .
The u n em p loym en t rate r e p r e s e n t s t h e n u m b e r u n
e m p lo y e d a s a p e r c e n t o f t h e c i v i l i a n l a b o r f o r c e . T h i s
m e a s u r e c a n a l s o b e c o m p u t e d f o r g r o u p s w i t h in t h e l a b o r
f o r c e c l a s s i f i e d b y s e x , a g e , m a r i t a l s t a t u s , c o l o r , e t c .
T h e j o b - l o s e r , j o b - l e a v e r , r e e n t r a n t , a n d n e w e n t r a n t
r a t e s a r e e a c h c a l c u l a t e d a s a p e r c e n t o f t h e c i v i l i a n
l a b o r f o r c e ; th e s u m o f th e r a t e s f o r th e f o u r g r o u p s
t h u s e q u a l s th e t o t a l U n e m p lo y m e n t r a t e .
Not in labor force i n c l u d e s a l l c i v i l i a n s 16 y e a r s
a n d o v e r w h o a r e n o t c l a s s i f i e d a s e m p lo y e d o r u n
e m p lo y e d . T h e s e p e r s o n s a r e f u r t h e r c l a s s i f i e d a s
" e n g a g e d i n o w n h o m e h o u s e w o r k ," " in s c h o o l , " " u n a b le
to w o r k " b e c a u s e o f l o n g - t e r m p h y s i c a l o r m e n t a l i l l n e s s ,
a n d " o t h e r . " T h e " o t h e r " g r o u p i n c l u d e s f o r t h e m o s t
p a r t r e t i r e d p e r s o n s , t h o s e r e p o r t e d a s to o o ld to w o r k ,
t h e v o l u n t a r i l y i d l e , a n d s e a s o n a l w o r k e r s f o r w h o m t h e
s u r v e y w e e k f e l l in a n " o f f " s e a s o n a n d w h o w e r e n o t
r e p o r t e d a s u n e m p lo y e d . P e r s o n s d o in g o n ly in c i d e n t a l
u n p a id f a m i l y w o r k ( l e s s t h a n 1 5 h o u r s ) a r e a l s o c l a s s i
f ie d a s n o t in t h e l a b o r f o r c e .
F o r p e r s o n s n o t in t h e l a b o r f o r c e , d a t a o n p r e v i o u s
w o r k e x p e r i e n c e , in t e n t io n s to s e e k w o r k a g a i n , d e s i r e f o r
a jo b a t t h e t im e o f i n t e r v i e w , a n d r e a s o n s f o r n o t lo o k in g
f o r w o r k a r e c o m p i le d o n a q u a r t e r l y b a s i s . T h e d e t a i l e d
q u e s t io n s f o r p e r s o n s n o t in t h e l a b o r f o r c e a r e a s k e d
o n ly in t h o s e h o u s e h o ld s t h a t a r e n e w e n t r a n t s to t h e
s a m p l e a n d in t h o s e t h a t a r e r e e n t e r i n g t h e s a m p l e a f t e r
8 m o n t h s 1 a b s e n c e .
O ccu p a tion , in du stry, and c la s s o f w orker f o r t h e
e m p lo y e d a p p ly to t h e jo b h e ld in t h e s u r v e y w e e k . P e r
1 3 7
Digitized for FRASER http://fraser.stlouisfed.org/ Federal Reserve Bank of St. Louis
s o n s w i t h tw o o r m o r e jo b s a r e c l a s s i f i e d i n t h e jo b a t
w h ic h t h e y w o r k e d t h e g r e a t e s t n u m b e r o f h o u r s d u r in g
t h e s u r v e y w e e k . T h e u n e m p lo y e d a r e c l a s s i f i e d a c c o r d
in g to t h e i r l a t e s t f u l l - t i m e c i v i l i a n jo b l a s t i n g 2 w e e k s
o r m o r e . T h e o c c u p a t io n a n d i n d u s t r y g r o u p s u s e d in
d a t a d e r i v e d f r o m t h e C P S h o u s e h o ld i n t e r v i e w s a r e
d e f in e d a s i n t h e 1 9 6 0 C e n s u s o f P o p u la t i o n . I n f o r m a t io n
o n t h e d e t a i l e d c a t e g o r i e s in c lu d e d i n t h e s e g r o u p s i s
a v a i l a b l e u p o n r e q u e s t .
T h e c l a s s - o f - w o r k e r b r e a k d o w n s p e c i f i e s " w a g e a n d
s a l a r y w o r k e r s , " s u b d iv id e d in t o p r i v a t e a n d g o v e r n m e n t
w o r k e r s , " s e l f - e m p l o y e d w o r k e r s , " a n d " u n p a id f a m i l y
w o r k e r s . " W a g e a n d s a l a r y w o r k e r s r e c e i v e w a g e s ,
s a l a r y , c o m m i s s i o n , t i p s , o r p a y in k in d f r o m a p r i v a t e
e m p l o y e r o r f r o m a g o v e r n m e n t a l u n i t . S e l f - e m p l o y e d
p e r s o n s a r e t h o s e w h o w o r k f o r p r o f i t o r f e e s in t h e i r
o w n b u s i n e s s , p r o f e s s i o n , o r t r a d e , o r o p e r a t e a f a r m .
U n p a id f a m i l y w o r k e r s a r e p e r s o n s w o r k in g w ith o u t p a y
f o r 1 5 h o u r s a w e e k o r m o r e o n a f a r m o r in a b u s i n e s s
o p e r a t e d b y a m e m b e r o f t h e h o u s e h o ld to w h o m t h e y a r e
r e l a t e d b y b lo o d o r m a r r i a g e .
H ours o f work s t a t i s t i c s r e l a t e to t h e a c t u a l n u m b e r
o f h o u r s w o r k e d d u r in g t h e s u r v e y w e e k . F o r e x a m p le ,
a p e r s o n w h o n o r m a l l y w o r k s 4 0 h o u r s a w e e k b u t w h o
w a s o f f o n t h e V e t e r a n s D a y h o l id a y w o u ld b e r e p o r t e d
a s w o r k in g 3 2 h o u r s e v e n th o u g h h e w a s p a id f o r t h e
h o l id a y .
F o r p e r s o n s w o r k in g i n m o r e t h a n o n e jo b , t h e f i g u r e s
r e l a t e to t h e n u m b e r o f h o u r s w o r k e d in a l l jo b s d u r in g
t h e w e e k . H o w e v e r , a l l t h e h o u r s a r e c r e d i t e d to t h e
m a j o r jo b .
P e r s o n s w h o w o r k e d 3 5 h o u r s o r m o r e in t h e s u r v e y
w e e k a r e d e s ig n a t e d a s .w o r k i n g " f u l l t i m e " ; p e r s o n s w h o
w o r k e d b e t w e e n 1 a n d 3 4 h o u r s a r e d e s ig n a t e d a s w o r k in g
" p a r t t i m e . " P a r t - t i m e w o r k e r s a r e c l a s s i f i e d b y t h e i r
u s u a l s t a t u s a t t h e i r p r e s e n t jo b ( e i t h e r f u l l t i m e o r p a r t
t i m e ) a n d b y t h e i r r e a s o n f o r w o r k in g p a r t t i m e d u r in g
t h e s u r v e y w e e k ( e c o n o m ic o r o t h e r r e a s o n s ) . " E c o n o m i c
r e a s o n s " in c l u d e : S l a c k w o r k , m a t e r i a l s h o r t a g e s , r e
p a i r s to p la n t o r e q u ip m e n t , s t a r t o r t e r m i n a t i o n o f jo b
d u r in g t h e w e e k , a n d i n a b i l i t y to f in d f u l l - t i m e w o r k .
" O t h e r r e a s o n s " in c l u d e : L a b o r d i s p u t e , b a d w e a t h e r ,
o w n i l l n e s s , v a c a t i o n , d e m a n d s o f h o m e h o u s e w o r k ,
s c h o o l , n o d e s i r e f o r f u l l - t i m e w o r k , a n d f u l l - t i m e
w o r k e r o n ly d u r in g p e a k s e a s o n . P e r s o n s o n f u l l - t i m e
s c h e d u l e s i n c l u d e , in a d d it io n to t h o s e w o r k in g 3 5 h o u r s
o r m o r e , t h o s e w h o w o r k e d f r o m 1 - 3 4 h o u r s f o r n o n
e c o n o m ic r e a s o n s b u t u s u a l l y w o r k f u l l t i m e .
F u ll -a n d part-tim e labor fo r c e . T h e f u l l -t im e labor force c o n s i s t s o f p e r s o n s w o r k in g o n f u l l - t i m e s c h e d u l e s ,
p e r s o n s i n v o l u n t a r i l y w o r k in g p a r t t i m e ( b e c a u s e f u l l
t i m e w o r k i s n o t a v a i l a b l e ) , a n d u n e m p lo y e d p e r s o n s
s e e k i n g f u l l - t i m e j o b s . T h e part-tim e labor force c o n s i s t s
o f p e r s o n s w o r k in g p a r t t i m e v o l u n t a r i l y a n d u n e m p lo y e d
p e r s o n s s e e k i n g p a r t - t i m e w o r k . P e r s o n s w i t h a jo b b u t
n o t a t w o r k d u r in g t h e s u r v e y w e e k a r e c l a s s i f i e d a c
c o r d i n g to w h e t h e r t h e y u s u a l l y w o r k f u l l o r p a r t
t i m e .
L a b or force tim e lo s t i s a m e a s u r e o f m a n - h o u r s
l o s t to th e e c o n o m y t h r o u g h u n e m p lo y m e n t a n d i n
v o l u n t a r y p a r t - t i m e e m p lo y m e n t a n d i s e x p r e s s e d
a s a p e r c e n t o f p o t e n t ia l l y a v a i l a b l e m a n - h o u r s .
I t i s c o m p u t e d b y a s s u m i n g : (1 ) t h a t u n e m p lo y e d
p e r s o n s lo o k in g f o r f u l l - t i m e w o r k l o s t a n a v
e r a g e o f 3 7 .5 h o u r s , (2 ) t h a t t h o s e lo o k in g f o r p a r t -
t im e w o r k l o s t th e a v e r a g e n u m b e r o f h o u r s a c t u a l l y
w o r k e d b y v o l u n t a r y p a r t - t i m e w o r k e r s d u r in g th e
s u r v e y w e e k , a n d (3 ) t h a t p e r s o n s o n p a r t t im e f o r
e c o n o m ic r e a s o n s l o s t th e d i f f e r e n c e b e t w e e n 3 7 .5
h o u r s a n d th e a c t u a l n u m b e r o f h o u r s t h e y
w o r k e d .
ESTIMATING METHODS
U n d e r t h e e s t i m a t i o n m e t h o d s u s e d i n t h e C P S , a l l o f
t h e r e s u l t s f o r a g iv e n m o n t h b e c o m e a v a i l a b l e s i m u l
t a n e o u s ly a n d a r e b a s e d o n r e t u r n s f r o m t h e e n t i r e
p a n e l o f r e s p o n d e n t s . T h e r e a r e no s u b s e q u e n t a d j u s t
m e n t s to in d e p e n d e n t b e n c h m a r k d a t a o n l a b o r f o r c e ,
e m p lo y m e n t , o r u n e m p lo y m e n t . T h e r e f o r e , r e v i s i o n s o f
t h e h i s t o r i c a l d a t a a r e n o t a n i n h e r e n t f e a t u r e o f t h i s
s t a t i s t i c a l p r o g r a m .
1. N on in terview a djustm ent. T h e w e ig h t s f o r a l l i n
t e r v i e w e d h o u s e h o ld s a r e a d ju s t e d to t h e e x t e n t n e e d e d
to a c c o u n t f o r o c c u p ie d s a m p l e h o u s e h o ld s f o r w h ic h no
i n f o r m a t io n w a s o b t a in e d b e c a u s e o f a b s e n c e , i m p a s s a b l e
r o a d s , r e f u s a l s , o r u n a v a i l a b i l i t y f o r o t h e r r e a s o n s . T h i s
a d ju s t m e n t i s m a d e s e p a r a t e l y b y g r o u p s o f s a m p l e a r e a s
a n d , w i t h in t h e s e , f o r s i x g r o u p s — c o l o r ( w h i t e a n d n o n
w h it e ) w i t h in t h e t h r e e r e s i d e n c e c a t e g o r i e s ( u r b a n ,
r u r a l n o n f a r m , a n d r u r a l f a r m ) . T h e p r o p o r t io n o f s a m p l e
h o u s e h o ld s n o t i n t e r v i e w e d v a r i e s f r o m 4 to 6 p e r c e n t
d e p e n d in g o n w e a t h e r , v a c a t i o n s , e t c .
2 . R atio e s t im a te s . T h e d i s t r i b u t i o n o f t h e p o p u la
t io n s e l e c t e d f o r t h e s a m p l e m a y d i f f e r s o m e w h a t , b y
c h a n c e , f r o m t h a t o f t h e N a t io n a s a w h o le , in s u c h
c h a r a c t e r i s t i c s a s a g e , c o l o r , s e x , a n d r e s i d e n c e . S i n c e
t h e s e p o p u la t io n c h a r a c t e r i s t i c s a r e c l o s e l y c o r r e l a t e d
w it h l a b o r f o r c e p a r t i c i p a t i o n a n d o t h e r p r i n c i p a l m e a s
u r e m e n t s m a d e f r o m t h e s a m p l e , t h e l a t t e r e s t i m a t e s
c a n b e s u b s t a n t i a l l y im p r o v e d w h e n w e ig h t e d a p p r o
p r i a t e l y b y t h e k n o w n d i s t r i b u t i o n o f t h e s e p o p u la t io n
c h a r a c t e r i s t i c s . T h i s i s a c c o m p l i s h e d t h r o u g h tw o s t a g e s
o f r a t i o e s t i m a t e s a s f o l l o w s :
a . F ir st -s ta g e ratio es tim a te . T h i s i s a p r o c e
d u r e in w h ic h t h e s a m p l e p r o p o r t io n s a r e w e ig h t e d b y
t h e k n o w n 1 9 6 0 C e n s u s d a t a o n t h e c o l o r - r e s i d e n c e
d i s t r i b u t i o n o f t h e p o p u la t io n . T h i s s t e p t a k e s in t o a c
c o u n t t h e d i f f e r e n c e s e x i s t i n g a t t h e t i m e o f t h e 1 9 6 0
C e n s u s b e t w e e n t h e c o l o r - r e s i d e n c e d i s t r i b u t i o n f o r t h e
N a t io n a n d f o r t h e s a m p l e a r e a s .
b . S e co n d -sta g e ratio e s tim a te . In t h i s s t e p , t h e
s a m p l e p r o p o r t io n s a r e w e ig h t e d b y in d e p e n d e n t c u r r e n t
e s t i m a t e s o f t h e p o p u la t io n b y a g e , s e x , a n d c o l o r .
T h e s e e s t i m a t e s a r e p r e p a r e d b y c a r r y i n g f o r w a r d t h e
m o s t r e c e n t c e n s u s d a t a ( 1 9 6 0 ) to t a k e a c c o u n t o f s u b
s e q u e n t a g in g o f t h e p o p u la t io n , m o r t a l i t y , a n d m i g r a
1 3 8
Digitized for FRASER http://fraser.stlouisfed.org/ Federal Reserve Bank of St. Louis

t io n b e t w e e n t h e U n i t e d S t a t e s a n d o t h e r c o u n
t r i e s .
3 . C om p o site estim a te p roced u re. In d e r i v i n g s t a t i s
t i c s f o r a g iv e n m o n t h , a c o m p o s i t e e s t i m a t i n g p r o c e
d u r e i s u s e d w h ic h t a k e s a c c o u n t o f n e t c h a n g e s f r o m
t h e p r e v i o u s m o n t h f o r c o n t in u in g p a r t s o f t h e s a m p l e
( 7 5 p e r c e n t ) a s w e l l a s t h e s a m p l e r e s u l t s f o r t h e c u r
r e n t m o n t h . T h i s p r o c e d u r e r e d u c e s t h e s a m p l in g v a r i a
b i l i t y o f m o n t h - t o - m o n th c h a n g e s e s p e c i a l l y a n d o f th e
l e v e l s f o r m o s t i t e m s a l s o .
Rounding of Estimates
T h e s u m s o f i n d iv id u a l i t e m s m a y n ot a l w a y s e q u a l t h e
t o t a l s s h o w n in th e s a m e t a b l e s b e c a u s e o f in d e p e n d e n t
r o u n d in g o f t o t a l s a n d c o m p o n e n t s to th e n e a r e s t th o u
s a n d . D i f f e r e n c e s , h o w e v e r , a r e i n s i g n i f i c a n t .
Reliability of the Estimates
S in c e t h e e s t i m a t e s a r e b a s e d o n a s a m p l e , t h e y m a y
d i f f e r f r o m t h e f i g u r e s t h a t w o u ld h a v e b e e n o b t a in e d i f
i t w e r e p o s s i b l e to t a k e a c o m p le t e c e n s u s u s in g t h e
s a m e s c h e d u l e s a n d p r o c e d u r e s .
T h e s t a n d a r d e r r o r i s a m e a s u r e o f s a m p l in g v a r i a
b i l i t y , t h a t i s , t h e v a r i a t i o n s t h a t m ig h t o c c u r b y c h a n c e
b e c a u s e o n ly a s a m p l e o f t h e p o p u la t io n i s s u r v e y e d .
T h e c h a n c e s a r e a b o u t 2 o u t o f 3 t h a t a n e s t i m a t e f r o m
t h e s a m p l e w o u ld d i f f e r f r o m a c o m p le t e c e n s u s b y l e s s
t h a n t h e s t a n d a r d e r r o r . T h e c h a n c e s a r e a b o u t 19 o u t o f
2 0 t h a t t h e d i f f e r e n c e w o u ld b e l e s s t h a n t w ic e t h e
s t a n d a r d e r r o r .
T a b l e A s h o w s t h e a v e r a g e s t a n d a r d e r r o r f o r t h e
m a j o r e m p lo y m e n t s t a t u s c a t e g o r i e s , b y s e x , c o m p u t e d
f r o m d a t a f o r p a s t m o n t h s . E s t i m a t e s o f c h a n g e d e r i v e d
f r o m t h e s u r v e y a r e a l s o s u b j e c t to s a m p l in g v a r i a b i l i t y .
T h e s t a n d a r d e r r o r o f c h a n g e f o r c o n s e c u t i v e m o n t h s i s
a l s o s h o w n in t a b le A . T h e s t a n d a r d e r r o r s o f l e v e l s h o w n
i n t a b le A a r e a c c e p t a b le a p p r o x im a t io n s o f t h e s t a n d a r d
e r r o r s o f y e a r - t o - y e a r c h a n g e .
T h e f i g u r e s p r e s e n t e d in t a b le B a r e to b e u s e d f o r
o t h e r c h a r a c t e r i s t i c s a n d a r e a p p r o x im a t io n s o f t h e
s t a n d a r d e r r o r s o f a l l s u c h c h a r a c t e r i s t i c s . T h e y s h o u ld
b e i n t e r p r e t e d a s p r o v id in g a n i n d ic a t io n o f t h e o r d e r o f
m a g n it u d e o f t h e s t a n d a r d e r r o r s r a t h e r t h a n a s t h e
p r e c i s e s t a n d a r d e r r o r f o r a n y s p e c i f i c i t e m .
T h e s t a n d a r d e r r o r o f t h e c h a n g e i n a n i t e m f r o m
o n e m o n th to t h e n e x t m o n th i s m o r e c l o s e l y r e l a t e d to
t h e s t a n d a r d e r r o r o f t h e m o n t h ly l e v e l f o r t h a t i t e m t h a n
to t h e s i z e o f t h e s p e c i f i c m o n t h - t o - m o n t h c h a n g e i t s e l f .
T h u s , in o r d e r to u s e t h e a p p r o x im a t io n s to t h e s t a n d a r d
e r r o r s o f m o n t h - t o - m o n t h c h a n g e s a s p r e s e n t e d in t a b le
C , i t i s f i r s t n e c e s s a r y to o b t a in t h e s t a n d a r d e r r o r o f
t h e m o n t h ly l e v e l o f t h e i t e m in t a b le B , a n d t h e n f in d t h e
s t a n d a r d e r r o r o f t h e m o n t h - t o - m o n t h c h a n g e i n t a b le C
c o r r e s p o n d in g to t h i s s t a n d a r d e r r o r o f l e v e l . I t s h o u ld
Table A. Average standard error of major employment status categories
( In t h o u s a n d s )
A v e r a g e s t a n d a r d e r r o r o f—
E m p lo y m e n t s t a t u s
a n d s e x M o n t h ly
l e v e l
M o n t h -
t o - m o n t h
c h a n g e
( c o n s e c u t i v e
m o n t h s o n ly )
B O T H S E X E S
L a b o r f o r c e a n d t o t a l
e m p lo y m e n t ...................................... 1 9 0 1 4 5A g r i c u l t u r e .......................................... 1 2 0 1 0 0N o n a g r i c u l t u r a l e m p lo y m e n t 2 0 0 1 5 0U n e m p lo y m e n t ..................................
M A L E
7 5 8 0
L a b o r f o r c e a n d t o t a l
e m p lo y m e n t ...................................... 1 0 0 7 5
A g r i c u l t u r e .......................................... 9 5 8 0
N o n a g r i c u l t u r a l e m p lo y m e n t 1 2 0 9 5
U n e m p lo y m e n t ..................................
F E M A L E
6 0 6 0
L a b o r f o r c e a n d t o t a l
e m p lo y m e n t ...................................... 1 5 0 1 1 5
A g r i c u l t u r e ..................................T . 5 0 4 0
N o n a g r i c u l t u r a l e m p lo y m e n t 1 5 0 1 1 5
U n e m p lo y m e n t . . . . 5 0 5 5
Table B . Standard error of level of monthly estimates
( In t h o u s a n d s )
S i z e o f
e s t i m a t e
B o t h s e x e s M a l e F e m a l e
T o t a l
o r
w h it e
N o n
w h it e
T o t a l
o r
w h it e
N o n
w h it e
T o t a l
o r
w h it e
N o n
w h it e
1 0 ..................... 4 4 6 4 6 4
5 0 • • • • • • 9 9 11 9 11 91 0 0 ................. 12 12 16 12 16 12
2 5 0 ................. 2 0 17 2 5 17 2 5 17
5 0 0 ................. 3 0 2 5 3 4 2 5 3 4 2 5
1 , 0 0 0 --------- 4 0 3 5 5 0 3 5 5 0 3 5
2 ,5 0 0 ________ 6 0 4 0 7 5 4 0 7 5 4 0
5 ,0 0 0 ________ 8 5 4 5 9 0 9 0 . . .1 0 ,0 0 0 . . . 1 1 5 . . . 1 1 5 1 1 5 . . .2 0 ,0 0 0 . . . 1 5 0 . . . 1 2 5 1 2 5 . . .3 0 ,0 0 0 . . . 1 7 0 . . . . . . . . . . . .4 0 ,0 0 0 . . , 1 8 0 . . . . . . . . . . . .
1 39
Digitized for FRASER http://fraser.stlouisfed.org/ Federal Reserve Bank of St. Louis

b e n o te d t h a t t a b le C a p p l i e s to e s t i m a t e s o f c h a n g e b e
t w e e n 2 c o n s e c u t i v e m o n t h s . F o r c h a n g e s b e t w e e n th e
c u r r e n t m o n t h a n d t h e s a m e m o n t h l a s t y e a r , t h e s t a n d
a r d e r r o r s o f l e v e l s h o w n in t a b le B a r e a c c e p t a b le
a p p r o x i m a t i o n s .
Illu stra tion : A s s u m e t h a t t h e t a b le s s h o w e d t h e t o t a l
n u m b e r o f p e r s o n s w o r k in g a s p e c i f i c n u m b e r o f h o u r s
a s 1 5 ,0 0 0 ,0 0 0 , a n i n c r e a s e o f 5 0 0 ,0 0 0 o v e r t h e p r e v i o u s
m o n t h . L i n e a r i n t e r p o la t io n in t h e f i r s t c o lu m n o f t a b le B
s h o w s t h a t t h e s t a n d a r d e r r o r o f 1 5 ,0 0 0 ,0 0 0 i s a b o u t
1 3 3 .0 0 0 . C o n s e q u e n t ly , t h e c h a n c e s a r e a b o u t 6 8 o u t o f
1 0 0 t h a t t h e s a m p l e e s t i m a t e d i f f e r s b y l e s s t h a n 1 3 3 ,0 0 0
f r o m t h e f i g u r e w h ic h w o u ld h a v e b e e n o b t a in e d f r o m a
c o m p le t e c o u n t o f t h e n u m b e r o f p e r s o n s w o r k in g t h e
g iv e n n u m b e r o f h o u r s . U s i n g t h e 1 3 3 ,0 0 0 a s t h e s t a n d a r d
e r r o r o f t h e m o n t h ly l e v e l in t a b le C , i t m a y b e s e e n
t h a t t h e s t a n d a r d e r r o r o f t h e 5 0 0 ,0 0 0 i n c r e a s e i s a b o u t
1 2 6 .0 0 0 .
Table C. Standard error of estimates of month-to-month change
( In t h o u s a n d s )
S t a n d a r d e r r o r o f
m o n t h ly l e v e l
S t a n d a r d e r r o r o f m o n t h -
t o - m o n t h c h a n g e
1 0 ................................................................ 12
2 5 ................................................................ 28
5 0 ................................................................. 5 5
1 0 0 ............................................................. 1 0 0
1 5 0 ............................................................ 1 4 0
2 0 0 ............................................................ 1 5 5
2 5 0 ............................................................. 1 6 0
3 0 0 ............................................................ 1 9 0
T h e r e l i a b i l i t y o f a n e s t i m a t e d p e r c e n t a g e , c o m p u t e d
b y u s in g s a m p l e d a t a f o r b o th n u m e r a t o r a n d d e n o m i
n a t o r , d e p e n d s u p o n b o th th e s i z e o f th e p e r c e n t a g e a n d
t h e s i z e o f th e t o t a l u p o n w h ic h th e p e r c e n t a g e i s b a s e d .
W h e r e th e n u m e r a t o r i s a s u b c l a s s o f t h e d e n o m in a t o r ,
e s t i m a t e d p e r c e n t a g e s a r e r e l a t i v e l y m o r e r e l i a b l e th a n
t h e c o r r e s p o n d i n g a b s o lu t e e s t i m a t e s o f th e n u m e r a t o r
o f t h e p e r c e n t a g e , p a r t i c u l a r l y i f t h e p e r c e n t a g e i s l a r g e
(5 0 p e r c e n t o r g r e a t e r ) . T a b l e D s h o w s t h e s t a n d a r d
e r r o r s f o r p e r c e n t a g e s d e r i v e d f r o m t h e s u r v e y . L i n e a r
i n t e r p o la t io n m a y b e u s e d f o r p e r c e n t a g e s a n d b a s e f i g
u r e s n o t s h o w n in t a b le D .
Table D . Standard error of percentage
B a s e o f
p e r c e n t -
a g e s
( t h o u
s a n d s )
E s t i m a t e d p e r c e n t a g e
1
o r
9 9
2
o r
9 8
5
o r
9 5
10
o r
9 0
15
o r
8 5
2 0
o r
8 0
2 5
o r
7 5
3 5
o r
6 5
5 0
1 5 0 . . . .8 1 .2 1 .8 2 .5 2 .9 3 .3 3 .4 3 .9 4 .02 5 0 . . . . 7 .8 1 .4 1 .9 2 .3 2 .5 2 .8 3 .0 3 .2
5 0 0 . . . . 5 . 7 1.0 1 .4 1 .6 1 .8 1 .9 2 .1 2 .3
1 ,0 0 0 . . .3 .4 .7 1.0 1 .2 1 .4 1 .4 1 .6 1 .6
2 ,0 0 0 . . .3 .3 .5 .7 .7 .8 1.0 1 .1 1 .2
3 ,0 0 0 . . . 2 .3 .4 .7 .7 .7 .8 .8 1.05 ,0 0 0 . . .2 .2 .3 .4 .5 .7 .7 .7 .7
1 0 ,0 0 0 . .1 .2 .3 .3 .3 .4 .4 .5 .5
2 5 ,0 0 0 . .1 .1 .2 .2 .3 .3 .3 .3 .3
5 0 ,0 0 0 . .1 .1 .1 .2 .2 .2 .2 .3 .3
7 5 ,0 0 0 . .1 .1 .1 .1 .2 .2 .2 .2 .2
Establishment DataCO LLEC TIO N
P a y r o l l r e p o r t s p r o v id e c u r r e n t in f o r m a t io n o n w a g e
a n d s a l a r y e m p lo y m e n t , h o u r s , e a r n i n g s , a n d l a b o r t u r n
o v e r in n o n a g r i c u l t u r a l e s t a b l i s h m e n t s , b y i n d u s t r y a n d
g e o g r a p h ic lo c a t io n .
Federal-State Cooperation
U n d e r c o o p e r a t i v e a r r a n g e m e n t s w it h S t a t e a g e n c i e s ,
th e r e s p o n d e n t f i l l s o u t a s i n g l e e m p lo y m e n t o r l a b o r
t u r n o v e r r e p o r t i n g f o r m , w h ic h i s th e n u s e d f o r n a t io n a l ,
S t a t e , a n d a r e a e s t i m a t e s . T h i s e l i m i n a t e s d u p l i c a t e r e
p o r t in g o n th e p a r t o f r e s p o n d e n t s a n d , t o g e t h e r w it h th e
u s e o f i d e n t i c a l t e c h n iq u e s a t t h e n a t io n a l a n d S t a t e
l e v e l s , i n s u r e s m a x im u m c o m p a r a b i l i t y o f e s t i m a t e s .
S t a t e a g e n c i e s m a i l t h e f o r m s to t h e e s t a b l i s h m e n t s
a n d e x a m in e t h e r e t u r n s f o r c o n s i s t e n c y , a c c u r a c y , a n d
c o m p l e t e n e s s . T h e S t a t e s u s e t h e i n f o r m a t io n to p r e p a r e
S t a t e a n d a r e a s e r i e s a n d th e n s e n d th e e s t a b l i s h m e n t
d a t a to th e B L S f o r u s e in p r e p a r i n g th e n a t io n a l s e r i e s .
Shuttle Schedules
T w o t y p e s o f d a t a c o l l e c t i o n s c h e d u l e s a r e u s e d :
F o r m B L S 7 9 0 —M o n th ly R e p o r t o n E m p lo y m e n t , P a y r o l l ,
a n d H o u r s ; a n d F o r m D L 1 2 1 9 —M o n t h ly R e p o r t o n J o b
O p e n in g s a n d L a b o r T u r n o v e r . T h e s e s c h e d u l e s a r e o f
th e " s h u t t l e ” t y p e , w it h s p a c e fo r e a c h m o n th o f th e
c a l e n d a r y e a r . T h e c o l l e c t i n g a g e n c y r e t u r n s th e
s c h e d u l e to th e r e s p o n d e n t e a c h m o n th s o t h a t th e n e x t
m o n t h ’ s d a t a c a n b e e n t e r e d . T h i s p r o c e d u r e a s s u r e s
m a x im u m c o m p a r a b i l i t y a n d a c c u r a c y o f r e p o r t in g , s i n c e
th e r e s p o n d e n t c a n s e e th e f ig u r e s h e h a s r e p o r t e d fo r
p r e v io u s m o n t h s .
F o r m B L S 7 9 0 p r o v i d e s f o r e n t r y o f d a ta o n th e n u m
b e r o f f u l l - a n d p a r t - t i m e w o r k e r s o n th e p a y r o l l s o f n o n
1 40
Digitized for FRASER http://fraser.stlouisfed.org/ Federal Reserve Bank of St. Louis

a g r i c u l t u r a l e s t a b l i s h m e n t s a n d , f o r m o s t i n d u s t r i e s ,
p a y r o l l a n d m a n - h o u r s o f p r o d u c t io n a n d r e l a t e d w o r k e r s
o r n o n s u p e r v i s o r y w o r k e r s f o r th e p a y p e r io d w h ic h
i n c l u d e s t h e 1 2 th o f th e m o n th . F o r m D L 1 2 1 9 p r o v id e s
fo r t h e c o l l e c t i o n o f in f o r m a t io n o n th e t o t a l n u m b e r o f
a c c e s s i o n s a n d s e p a r a t i o n s , b y t y p e , d u r in g t h e c a l e n d a r
m o n th , a n d w a s r e v i s e d in J a n u a r y 1 9 6 9 to p r o v id e fo r
th e c o l l e c t i o n o f jo b o p e n in g s d a t a a s w e l l .
CO N CEPTS
Industrial ClassificationE s t a b l i s h m e n t s r e p o r t in g o n F o r m B L S 7 9 0 a n d
F o r m D L 1 2 1 9 a r e c l a s s i f i e d in t o i n d u s t r i e s o n th e
b a s i s o f t h e i r p r i n c i p a l p r o d u c t o r a c t i v i t y d e t e r m in e d
f r o m in f o r m a t io n o n a n n u a l s a l e s v o l u m e . T h i s i n f o r m a
t io n i s c o l l e c t e d e a c h y e a r o n a s u p p le m e n t to t h e
m o n t h ly 7 9 0 o r 1 2 1 9 r e p o r t . F o r a n e s t a b l i s h m e n t m a k in g
m o r e th a n o n e p r o d u c t o r e n g a g in g in m o r e th a n o n e
a c t i v i t y , t h e e n t i r e e m p lo y m e n t o f t h e e s t a b l i s h m e n t i s
i n c lu d e d u n d e r th e i n d u s t r y in d ic a t e d b y t h e m o s t i m p o r
t a n t p r o d u c t o r a c t i v i t y .
A l l n a t io n a l , S t a t e , a n d a r e a e m p lo y m e n t , h o u r s ,
e a r n i n g s , a n d l a b o r t u r n o v e r s e r i e s a r e c l a s s i f i e d in
a c c o r d a n c e w it h t h e Standard Industrial Classification Manual, B u r e a u o f th e B u d g e t , 1 9 6 7 .
Industry Employment
E m p lo y m e n t d a t a , e x c e p t t h o s e f o r th e F e d e r a l G o v
e r n m e n t , r e f e r to p e r s o n s o n e s t a b l i s h m e n t p a y r o l l s w h o
r e c e i v e d p a y f o r a n y p a r t o f t h e p a y p e r io d w h ic h in c l u d e s
t h e 1 2 th o f t h e m o n t h . F o r F e d e r a l G o v e r n m e n t e s t a b
l i s h m e n t s , e m p lo y m e n t f i g u r e s r e p r e s e n t t h e n u m b e r o f
p e r s o n s w h o o c c u p ie d p o s i t io n s o n t h e l a s t d a y o f t h e
c a l e n d a r m o n t h . I n t e r m i t t e n t w o r k e r s a r e c o u n t e d i f t h e y
p e r f o r m e d a n y s e r v i c e d u r in g t h e m o n t h .
T h e d a ta e x c lu d e p r o p r i e t o r s , th e s e l f - e m p l o y e d ,
u n p a id v o l u n t e e r , o r f a m i l y w o r k e r s , f a r m w o r k e r s , a n d
d o m e s t i c w o r k e r s in h o u s e h o ld s . S a l a r i e d o f f i c e r s o f
c o r p o r a t i o n s a r e in c lu d e d . G o v e r n m e n t e m p lo y m e n t c o v
e r s o n ly c i v i l i a n e m p l o y e e s ; m i l i t a r y p e r s o n n e l a r e
e x c lu d e d .
P e r s o n s o n e s t a b l i s h m e n t p a y r o l l s w h o a r e o n p a id
s i c k l e a v e (w h e n p a y i s r e c e i v e d d i r e c t l y f r o m th e f i r m ) ,
o n p a id h o l id a y o r p a id v a c a t i o n , o r w h o w o r k d u r in g a
p a r t o f th e p a y p e r io d a n d a r e u n e m p lo y e d o r o n s t r i k e
d u r in g t h e r e s t o f t h e p e r io d , a r e c o u n t e d a s e m p lo y e d .
N o t c o u n t e d a s e m p lo y e d a r e p e r s o n s w h o a r e l a i d o f f ,
o n le a v e w ith o u t p a y , o r o n s t r i k e f o r th e e n t i r e p e r io d ,
o r w h o a r e h i r e d b u t h a v e n o t r e p o r t e d to w o r k d u r in g
th e p e r io d .
Industry Hours and Earnings
H o u r s a n d e a r n in g s d a t a a re d e r iv e d from r e p o r t s o f
p a y r o l l s a n d m a n - h o u r s fo r p r o d u c t io n a n d r e la t e d w o r k
e r s in m a n u f a c t u r in g a n d m in in g , c o n s t r u c t io n w o r k e r s in
c o n t r a c t c o n s t r u c t io n , a n d n o n s u p e r v i s o r y e m p lo y e e s in
th e r e m a i n i n g n o n a g r i c u l t u r a l c o m p o n e n t s . F o r F e d e r a l
G o v e r n m e n t , h o u r s a n d e a r n i n g s r e l a t e to a l l e m p lo y e e s ,
b o th s u p e r v i s o r y a n d n o n s u p e r v i s o r y . T e r m s a r e d e f in e d
b e lo w . W h e n th e p a y p e r io d r e p o r t e d i s lo n g e r th a n 1
w e e k , f i g u r e s a r e r e d u c e d to a w e e k ly b a s i s .
Production and related workers i n c l u d e w o r k i n g
f o r e m e n a n d a l l n o n s u p e r v i s o r y w o r k e r s ( in c lu d in g le a d -
m e n a n d t r a i n e e s ) e n g a g e d in f a b r i c a t i n g , p r o c e s s i n g ,
a s s e m b l i n g , in s p e c t io n , r e c e i v i n g , s t o r a g e , h a n d l in g ,
p a c k in g , w a r e h o u s in g , s h ip p in g , m a i n t e n a n c e , r e p a i r ,
j a n i t o r i a l a n d w a t c h m a n s e r v i c e s , p r o d u c t d e v e lo p m e n t ,
a u x i l i a r y p r o d u c t io n f o r p l a n t ' s o w n u s e ( e . g . , p o w e r
p la n t ) , a n d r e c o r d k e e p i n g a n d o t h e r s e r v i c e s c l o s e l y
a s s o c i a t e d w it h t h e a b o v e p r o d u c t io n o p e r a t io n s .
Construction workers in c lu d e t h e f o l lo w in g e m p lo y e e s
in t h e c o n t r a c t c o n s t r u c t i o n d i v i s i o n : w o r k in g f o r e m e n ,
jo u r n e y m e n , m e c h a n i c s , a p p r e n t i c e s , l a b o r e r s , e t c . ,
w h e t h e r w o r k in g a t t h e s i t e o f c o n s t r u c t i o n o r in s h o p s
o r y a r d s , a t jo b s ( s u c h a s p r e c u t t in g a n d p r e a s s e m b l i n g )
o r d i n a r i l y p e r f o r m e d b y m e m b e r s o f t h e c o n s t r u c t io n
t r a d e s .
N on supervisory employees i n c lu d e e m p lo y e e s (n o t
a b o v e t h e w o r k in g s u p e r v i s o r y l e v e l ) s u c h a s o f f i c e a n d
c l e r i c a l w o r k e r s , r e p a i r m e n , s a l e s p e r s o n s , o p e r a t o r s ,
d r i v e r s , p h y s i c i a n s , l a w y e r s , a c c o u n t a n t s , n u r s e s , s o c i a l
w o r k e r s , r e s e a r c h a i d s , t e a c h e r s , d r a f t s m e n , p h o to g
r a p h e r s , b e a u t i c i a n s , m u s i c i a n s , r e s t a u r a n t w o r k e r s ,
c u s t o d i a l w o r k e r s , a t t e n d a n t s , l in e m e n , l a b o r e r s , j a n i
t o r s , w a t c h m e n , a n d s i m i l a r o c c u p a t io n a l l e v e l s , a n d
o t h e r e m p lo y e e s w h o s e s e r v i c e s a r e c l o s e l y a s s o c i a t e d
w it h t h o s e o f th e e m p lo y e e s l i s t e d .
Payroll c o v e r s th e p a y r o l l f o r f u l l - a n d p a r t - t i m e
p r o d u c t io n , c o n s t r u c t i o n , o r n o n s u p e r v i s o r y w o r k e r s w h o
r e c e i v e d p a y f o r a n y p a r t o f t h e p a y p e r io d w h ic h i n
c l u d e s t h e 1 2 th o f th e m o n t h . T h e p a y r o l l i s r e p o r t e d
b e f o r e d e d u c t io n s o f a n y k in d , e . g . , f o r o ld - a g e a n d
u n e m p lo y m e n t i n s u r a n c e , g r o u p i n s u r a n c e , w it h h o ld in g
t a x , b o n d s , o r u n io n d u e s ; a l s o in c lu d e d i s p a y f o r o v e r
t i m e , h o l i d a y s , v a c a t i o n s , a n d s i c k l e a v e p a id d i r e c t l y
b y t h e f i r m . B o n u s e s ( u n l e s s e a r n e d a n d p a id r e g u l a r l y
e a c h p a y p e r i o d ) , o t h e r p a y n o t e a r n e d in p a y p e r io d
r e p o r t e d ( e . g . , r e t r o a c t i v e p a y ) , t i p s , a n d th e v a lu e o f
f r e e r e n t , f u e l , m e a l s , o r o t h e r p a y m e n t in k in d a r e
e x c lu d e d . " F r i n g e b e n e f i t s " ( s u c h a s h e a l t h a n d o t h e r
t y p e s o f i n s u r a n c e , c o n t r ib u t io n s to r e t i r e m e n t , e t c . p a id
b y th e e m p lo y e r ) a r e a l s o e x c lu d e d .
Man-hours c o v e r m a n - h o u r s p a id f o r , d u r in g th e p a y
p e r io d w h ic h i n c l u d e s th e 1 2 th o f t h e m o n th , f o r p r o d u c
t io n , c o n s t r u c t i o n , o r n o n s u p e r v i s o r y w o r k e r s . T h e m a n
h o u r s in c lu d e h o u r s p a id f o r h o l id a y s a n d v a c a t i o n s , a n d
f o r s i c k l e a v e w h e n p a y i s r e c e i v e d d i r e c t l y f r o m th e
f i r m .
Overtime hours c o v e r h o u r s w o r k e d b y p r o d u c t io n o r
r e l a t e d w o r k e r s f o r w h ic h o v e r t i m e p r e m i u m s w e r e p a id
b e c a u s e th e h o u r s w e r e in e x c e s s o f th e n u m b e r o f h o u r s
o f e i t h e r th e s t r a i g h t - t i m e w o r k d a y o r t h e w o r k w e e k d u r
in g th e p a y p e r io d w h ic h i n c lu d e s th e 1 2 th o f t h e m o n th .
W e e k e n d a n d h o l id a y h o u r s a r e in c lu d e d o n ly i f o v e r t i m e
1 4 1
Digitized for FRASER http://fraser.stlouisfed.org/ Federal Reserve Bank of St. Louis

p r e m i u m s w e r e p a id . H o u r s f o r w h ic h o n ly s h i f t d i f f e r e n
t i a l , h a z a r d , i n c e n t i v e , o r o t h e r s i m i l a r t y p e s o f p r e m i u m s
w e r e p a id a r e e x c lu d e d .
Gross Average Hourly and Weekly Earnings
A v e r a g e h o u r l y e a r n i n g s a r e o n a " g r o s s " b a s i s ,
r e f l e c t i n g n o t o n ly c h a n g e s in b a s i c h o u r l y a n d i n c e n t i v e
w a g e r a t e s b u t a l s o s u c h v a r i a b l e f a c t o r s a s p r e m i u m
p a y f o r o v e r t i m e a n d l a t e - s h i f t w o r k a n d c h a n g e s in
o u tp u t o f w o r k e r s p a id o n a n i n c e n t i v e p la n . S h i f t s in t h e
v o l u m e o f e m p lo y m e n t b e t w e e n r e l a t i v e l y h ig h - p a id a n d
l o w - p a id w o r k a n d c h a n g e s in w o r k e r s * e a r n i n g s in i n d i
v i d u a l e s t a b l i s h m e n t s a l s o a f f e c t t h e g e n e r a l e a r n i n g s
a v e r a g e s . A v e r a g e s f o r g r o u p s a n d d i v i s i o n s f u r t h e r r e
f l e c t c h a n g e s in a v e r a g e h o u r ly e a r n i n g s f o r in d i v i d u a l
i n d u s t r i e s .
A v e r a g e s o f h o u r ly e a r n i n g s d i f f e r f r o m w a g e r a t e s .
E a r n i n g s a r e t h e a c t u a l r e t u r n to t h e w o r k e r f o r a s t a t e d
p e r i o d o f t i m e ; r a t e s a r e t h e a m o u n t s s t i p u la t e d f o r a
g iv e n u n i t o f w o r k o r t i m e . T h e e a r n i n g s s e r i e s
d o e s n o t m e a s u r e t h e l e v e l o f t o t a l l a b o r c o s t s o n
t h e p a r t o f t h e e m p lo y e r s i n c e t h e f o l lo w in g a r e e x c lu d e d :
I r r e g u l a r b o n u s e s , r e t r o a c t i v e i t e m s , p a y m e n t s o f v a r i o u s
w e l f a r e b e n e f i t s , p a y r o l l t a x e s p a id b y e m p l o y e r s , a n d
e a r n i n g s f o r t h o s e e m p lo y e e s n o t c o v e r e d u n d e r t h e p r o
d u c t i o n - w o r k e r , c o n s t r u c t i o n w o r k e r , o r n o n s u p e r v i s o r y -
e m p lo y e e d e f i n i t i o n s .
G r o s s a v e r a g e w e e k ly e a r n i n g s a r e d e r i v e d b y m u l t i
p l y in g a v e r a g e w e e k ly h o u r s b y a v e r a g e h o u r l y e a r n i n g s .
T h e r e f o r e , w e e k ly e a r n i n g s a r e a f f e c t e d n o t o n ly b y
c h a n g e s in g r o s s a v e r a g e h o u r ly e a r n i n g s b u t a l s o b y
c h a n g e s in t h e le n g t h o f t h e w o r k w e e k , p a r t - t i m e w o r k ,
s t o p p a g e s f o r v a r y i n g c a u s e s , l a b o r t u r n o v e r , a n d
a b s e n t e e i s m .
Average Weekly Hours
T h e w o r k w e e k i n f o r m a t io n r e l a t e s to t h e a v e r a g e
h o u r s f o r w h ic h p a y w a s r e c e i v e d a n d i s d i f f e r e n t f r o m
s t a n d a r d o r s c h e d u l e d h o u r s . S u c h f a c t o r s a s a b s e n t e e
i s m , la b o r t u r n o v e r , p a r t - t i m e w o r k , a n d s t o p p a g e s c a u s e
a v e r a g e w e e k ly h o u r s to b e l o w e r t h a n s c h e d u l e d h o u r s
o f w o r k f o r a n e s t a b l i s h m e n t . G r o u p a v e r a g e s f u r t h e r
r e f l e c t c h a n g e s in t h e w o r k w e e k o f c o m p o n e n t i n d u s t r i e s .
Average Overtime Hours
T h e o v e r t i m e h o u r s r e p r e s e n t t h a t p o r t io n o f t h e
g r o s s a v e r a g e w e e k ly h o u r s w h ic h w e r e in e x c e s s o f
r e g u l a r h o u r s a n d f o r w h ic h o v e r t i m e p r e m i u m s w e r e
p a id . I f a n e m p lo y e e w o r k e d o n a p a id h o l id a y a t r e g u l a r
r a t e s , r e c e i v i n g a s t o t a l c o m p e n s a t io n h i s h o l id a y p a y
p l u s s t r a i g h t - t i m e p a y f o r h o u r s w o r k e d t h a t d a y , no
o v e r t i m e h o u r s w o u ld b e r e p o r t e d .
S in c e o v e r t i m e h o u r s a r e p r e m i u m h o u r s b y d e f i
n i t i o n , g r o s s w e e k ly h o u r s a n d o v e r t i m e h o u r s do n o t
n e c e s s a r i l y m o v e in th e s a m e d i r e c t i o n f r o m m o n t h - t o -
m o n t h ; f o r e x a m p le , o v e r t i m e p r e m i u m s m a y b e p a id f o r
h o u r s in e x c e s s o f t h e s t r a i g h t - t i m e w o r k d a y a lth o u g h l e s s
t h a n a f u l l w e e k i s w o r k e d . D i v e r s e t r e n d s a t th e i n
d u s t r y - g r o u p l e v e l a l s o m a y b e c a u s e d b y a m a r k e d c h a n g e
in g r o s s h o u r s f o r a c o m p o n e n t i n d u s t r y w h e r e l i t t l e o r n o
o v e r t i m e w a s w o r k e d i n b o th t h e p r e v i o u s a n d c u r r e n t
m o n t h s . In a d d i t io n , s u c h f a c t o r s a s s t o p p a g e s , a b s e n
t e e i s m , a n d l a b o r t u r n o v e r m a y n o t h a v e t h e s a m e i n f l u
e n c e o n o v e r t i m e h o u r s a s o n g r o s s h o u r s .
Hours and Earnings For Total Private Nonagricultural Industries
T h i s s e r i e s c o v e r s a l l n o n a g r i c u l t u r a l in d u s t r y d i v i
s i o n s e x c e p t g o v e r n m e n t . T h e p r i n c i p a l s o u r c e o f p a y r o l l
d a t a i s F o r m B L S 7 9 0 . S e c o n d a r y s o u r c e m a t e r ia l s u c h
a s Employment and Wages (M a n p o w e r A d m in i s t r a t io n ) ,
County Business Patterns ( B u r e a u o f th e C e n s u s ) , a n d
a d d i t io n a l s u p p o r t in g in f o r m a t io n s u c h a s The Hospital Guide, P a r t I I , o f th e A m e r i c a n H o s p i t a l A s s o c i a t i o n a n d
s p e c i a l s t u d i e s b y th e N a t io n a l C o u n c i l o f C h u r c h e s
s u p p le m e n t d a t a f o r c e r t a i n i n d u s t r y g r o u p s w i t h in th e
s e r v i c e d i v i s i o n .
F o r a t e c h n i c a l d e s c r i p t i o n o f t h i s s e r i e s , s e e th e
a r t i c l e , " H o u r s a n d E a r n i n g s f o r W o r k e r s in P r i v a t e
N o n a g r i c u l t u r a l I n d u s t r i e s , " p u b l i s h e d in t h e M a y 1 9 6 7
i s s u e o f E m p loym en t and Earnings and M onthly R ep ort on the L a b or F o r c e .
Railroad Hours and Earnings
T h e f i g u r e s f o r c l a s s I r a i l r o a d s ( e x c lu d in g s w i t c h
in g a n d t e r m i n a l c o m p a n i e s ) a r e b a s e d o n m o n t h ly d a t a
s u m m a r i z e d in t h e M - 3 0 0 r e p o r t o f t h e I n t e r s t a t e C o m
m e r c e C o m m i s s i o n a n d r e l a t e to a l l e m p l o y e e s e x c e p t
e x e c u t i v e s , o f f i c i a l s , a n d s t a f f a s s i s t a n t s ( I C C g r o u p I )
w h o r e c e i v e d p a y d u r in g t h e m o n t h . G r o s s a v e r a g e h o u r l y
e a r n i n g s a r e c o m p u t e d b y d iv i d in g t o t a l c o m p e n s a t io n
b y t o t a l h o u r s p a id f o r . A v e r a g e w e e k ly h o u r s a r e o b
t a in e d b y d iv i d in g t h e t o t a l n u m b e r o f h o u r s p a id f o r , r e
d u c e d to a w e e k ly b a s i s , b y t h e n u m b e r o f e m p l o y e e s , a s
d e f in e d a b o v e . G r o s s a v e r a g e w e e k ly e a r n i n g s a r e d e
r i v e d b y m u l t ip ly in g a v e r a g e w e e k l y h o u r s b y a v e r a g e
h o u r ly e a r n i n g s .
Spendable Average Weekly Earnings
S p e n d a b le a v e r a g e w e e k l y e a r n i n g s in c u r r e n t d o l l a r s
a r e o b t a in e d b y d e d u c t in g e s t i m a t e d F e d e r a l s o c i a l
s e c u r i t y a n d in c o m e t a x e s f r o m g r o s s w e e k l y e a r n i n g s .
T h e a m o u n t o f in c o m e t a x l i a b i l i t y d e p e n d s o n t h e n u m b e r
o f d e p e n d e n t s s u p p o r t e d b y th e w o r k e r a n d h i s m a r i t a l
s t a t u s , a s w e l l a s o n t h e l e v e l o f h i s g r o s s in c o m e . T o
r e f l e c t t h e s e v a r i a b l e s , s p e n d a b le e a r n i n g s a r e c o m p u t e d
f o r a w o r k e r w it h n o d e p e n d e n t s a n d a m a r r i e d w o r k e r
w it h t h r e e d e p e n d e n t s . T h e c o m p u t a t io n s a r e b a s e d o n
g r o s s a v e r a g e w e e k ly e a r n i n g s f o r a l l p r o d u c t io n o r n o n -
s u p e r v i s o r y w o r k e r s in t h e i n d u s t r y d i v i s i o n e x c lu d in g
o t h e r in c o m e a n d in c o m e e a r n e d b y o t h e r f a m i l y m e m
b e r s .
" R e a l " e a r n i n g s a r e c o m p u t e d b y d iv i d in g t h e c u r r e n t
C o n s u m e r P r i c e In d e x in t o t h e e a r n i n g s a v e r a g e s f o r
th e c u r r e n t m o n t h . T h e l e v e l o f e a r n i n g s i s t h u s a d
j u s t e d f o r c h a n g e s in p u r c h a s i n g p o w e r s i n c e t h e b a s e
p e r i o d ( 1 9 5 7 - 5 9 ) .
14 2
Digitized for FRASER http://fraser.stlouisfed.org/ Federal Reserve Bank of St. Louis

Average Hourly Earnings Excluding Overtime
Average hourly earnings excluding overtime premium pay are computed by dividing the total production- worker payroll for the industry group by the sum of total production-worker man-hours and one-half of total overtime man-hours. Prior to January 1956, these data were based on the application of adjustment factors to gross average hourly earnings (as described in the Monthly Labor Review, May 1950, pp. 537-540). Both methods eliminate only the earnings due to overtime paid for at l i times the straight-time rates. No adjustment is made for other premium payment provisions, such as holiday work, late-shift work, and overtime rates other than time and one-half.
Indexes of Aggregate Weekly Payrolls and Man-Hours
The indexes of aggregate weekly payrolls and manhours are prepared by dividing the current month’s aggregate by the monthly average for the 1957-59 period. The man-hour aggregates are the product of average weekly hours and production-worker employment, and the payroll aggregates are the product of gross average weekly earnings and production-worker employment.
Labor Turnover
Labor turnover is the gross movement of wage and salary workers into and out of employed status with respect to individual establishments. This movement, which relates to a calendar month, is divided into two broad types: Accessions (new hires and rehires) and reparations (terminations of employment initiated by either employer or employee). Each type of action is cumulated for a calendar month and expressed as a rate per 100 employees. The data relate to all employees, whether full- or part-time, permanent or temporary, including executive, office, sales, other salaried personnel, and production workers. Transfers to another establishment of the company are included, beginning with January 1959.
Accessions are the total number of permanent and temporary additions to the employment roll, including both new and rehired employees.
New hires are temporary or permanent additions to the employment roll of persons who have never before been employed in the establishment (except employees transferring from another establishment of the same company) or of former employees not recalled by the employer.
Other accessions, which are not published separately but are included in total accessions, are all additions to the employment roll which are not classified as new hires, including transfers from another establishment of the company.
Separations are terminations of employment during the calendar month and are classified according to cause: Quits, layoffs, and other separations, are defined as follows:
Quits are terminations of employment initiated by employees, failure to report after being hired, and unauthorized absences, if on the last day of the month the person has been absent more than 7 consecutive calendar days.
Layoffs are suspensions without pay lasting or expected to last more than 7 consecutive calendar days, initiated by the employer without prejudice to the worker.
0 the r sep aration s, which are not published separately but are included in total separations, are terminations of employment because of discharge, permanent disability, death, retirement, transfers to another establishment of the company, and entrance into the Armed Forces for a period expected to last more than 30 consecutive calendar days.
Relationship to Employment Series
Month-to-month changes in total employment in manufacturing industries reflected by labor turnover rates are not comparable with the changes shown in the Bureau’s employment series for the following reasons: (1) Accessions and separations are computed for the entire calendar month; the employment reports refer to the pay period which includes the 12th of the month; and (2) employees on strike are not counted as turnover actions although such employees are excluded from the employment estimates if the work stoppage extends through the report period.
ESTIMATING METHODS
The principal features of the procedure used to estimate employment for the industry statistics are (1) the use of the ’ ’link relative” technique, which is a form of ratio estimation, (2) periodic adjustment of employment levels to new benchmarks, and (3) the use of size and regional stratification.
The “ Link Relative” TechniqueFrom a sample composed of establishments reporting
for both the previous and current months, the ratio of current month employment to that of the previous month is computed. This is called a link relative. The estimates of employment (all employees, including production and nonproduction workers together) for the current month are obtained by multiplying the estimates for the previous month by these "link relatives. In addition, small bias correction factors are applied to selected employment estimates each month. The size of the bias correction factors is determined from past experience. Other features of the general procedures are described later in the table, Summary of Methods for Computing Industry Statistics on Employment, Hours, Earnings, and Labor Turnover. Further details are given in the technical notes on Measurement of Employment, Hours, and Earnings in Non-agricultural Industries and on Measurement of Labor Turnover, which are available upon request.
Size and Regional Stratification
A number of industries are stratified by size of establishment and/or by region, and the stratified produc
1 4 3
Digitized for FRASER http://fraser.stlouisfed.org/ Federal Reserve Bank of St. Louis

tion- or nonsupervisory-worker data are used to weight the hours and earnings into broader industry groupings. Accordingly, the basic estimating cell for an employment, hours, or earnings series, as the term is used in the summary of computational methods, may be a whole industry or a size stratum, a region stratum, or a size stratum of a region within an industry.
Benchmark Adjustments
Employment estimates are compared periodically with comprehensive counts of employment which provide ' ’benchmarks” for the various nonagriculturalindustries, and appropriate adjustments are made as indicated. The industry estimates are currently projected from March 1968 levels. Normally, benchmark adjustments are made annually.
The primary sources of benchmark information are employment data, by industry, compiled quarterly by State agencies from reports of establishments covered under State unemployment insurance laws. These tabulations, covering three-fourths of the total nonagricultural employment in the United States, are prepared under the direction of the Manpower Administration. Benchmark data for the residual are obtained from the records of the Social Security Administration, the Interstate Commerce Commission, and a number of other agencies in private industry or government.
The estimates relating to the benchmark month are compared with new benchmark levels, industry by industry. If revisions are necessary, the monthly series of estimates are adjusted between the new benchmark and the preceding one, and the new benchmark for each industry is then carried forward progressively to the current month by use of the sample trends. Thus, under this procedure, the benchmark is used to establish the level of employment; the sample is used to measure the month-to-month changes in the level. A comparison of the actual amounts of revisions made in the last 3 benchmark years follows*.
Nonagricultural payroll employment estimates, by industry division, as a percentage of the
benchmark for 1966-1968
Industry division 1966 1967 1968
T otal.............................................. 99.9 100.0 100.4Mining........................................... 100.5 99.5 101.7Contract construction................ 99.7 101.6 99.5Manufacturing..............................Transportation and public
99.4 99.5 99.8
utilities...................................... 99.7 99.8 100.7Wholesale and retail trade. . . . Finance, insurance, and
100.1 100.7 100.3
real estate................................. 99.5 100.2 99.2Services......................................... 100.3 99.8 99.2Government................................... 100.0 100.0 102.8
Data for all months since the last benchmark to which the series has been adjusted are subject to revision. To provide users of the data with a convenient reference source for the revised data, the BLS publishes as soon as possible after each benchmark revision a summary volume of employment, hours, earnings, and labor turnover statistics.
THE SAMPLE
Design
The sampling plan used in the current employment statistics program is known as "sampling proportionate to average size of establishment." This design is an optimum allocation design among strata since the sampling variance is proportional to the average size of establishments. The universe of establishments is stratified first by industry and then within each industry by size of establishment in terms of employment. For each industry, the number of sample units is distributed among the size class cells on the basis of average employment per establishment in each cell. In practice, this is equivalent to distributing the predetermined total number of establishments required in the sample among the cells on the basis of the ratio of employment in each cell to total employment in the industry. Within each noncertainty stratum the sample members are selected at random.
Under this type of design, large establishments fall into the sample with certainty. The size of the samples for the various industries is determined empirically on the basis of experience and of cost considerations. In a manufacturing industry in which a high proportion of total employment is concentrated in relatively few establishments, a large percentage of total employment is included in the sample. Consequently, the sample design for such industries provides for a complete census of the larger establishments with only a few chosen from among the smaller establishments or none at all if the concentration of employment is great enough. On the other hand, in an industry in which a large proportion of total employment is in small establishments, the sample design calls for inclusion of all large establishments and also for a substantial number of the smaller ones. Many industries in the trade and service divisions fall into this category. To keep the sample to a size which can be handled by available resources, it is necessary to accept samples in these divisions with a smaller proportion of universe employment than is the case for most manufacturing industries. Since individual establishments in these nonmanufacturing divisions generally show less fluctuation from regular cyclical or seasonal patterns than establishments in manufacturing industries, these smaller samples (in terms of employment) generally produce reliable estimates.
In the context of the BLS employment and labor turnover statistics programs, with their emphasis on pjro-
1 4 4
Digitized for FRASER http://fraser.stlouisfed.org/ Federal Reserve Bank of St. Louis

ducing timely data at minimum cost, a sample must be obtained which will provide coverage of a sufficiently large segment of the universe to provide reasonably reliable estimates that can be published promptly and regularly. The present sample meets these specifications for most industries. With its use, the BLS is able to produce preliminary estimates each month for many industries and for many geographic levels within a few weeks after reports are mailed by respondents, and at a somewhat later date, statistics in considerably greater industrial detail.
Coverage
The BLS sample of establishment employment and payrolls is the largest monthly sampling operation in the field of social statistics. The table that follows shows the approximate proportion of total employment in each industry division covered by the group of establishments furnishing monthly employment data. The coverage for individual industries within the division may vary from the proportions shown.
Approximate size and coverage of BLS employment and payrolls sample, March 19681
Number of establishments in sample
Employees
Industry division Numberreported
Percentof
total
Mining................................... 2,200 274,000 47Contract construction . . . . 16,200 772,000 26Manufacturing......................Transportation and public utilities:Railroad transportation
46,100 12,422,000 64
(ICC).................................Other transportation and
100 636,000 96
public utilities................. 7,100 2,042,000 57Wholesale and retail trade . Finance, insurance and
39,700 2,815,000 21
real estate........................... 9,400 1,239,000 37Services.................................Government:
Federal (Civil Service
22,400 2,227,000 21
Commission)2 ................ 3,200 2,699,000 100State and lo c a l ................. 9,400 4,907,000 54
Since a few establishments do not report payroll and man-hour information, hours and earnings estimates may be based on a slightly smaller sample than employment estimates.
2 State and area estimates of Federal employment are based on reports from a sample of Federal establishments, collected through the BLS-State cooperative program.
The table below shows the approximate coverage, in terms of employment, of the labor turnover sample.
Approximate size and coverage of BLS labor turnover sample, March 1968
EmployeesIndustry Number
reportedPercent of total
Manufacturing................ 11,060,000 ' 57Metal mining................... 49,100 74Coal mining......................Communication:
59,800 44
Telephone................... 632,400 78Telegraph................... 22,400 69
Reliability of the Employment Estimates
The estimates derived from the establishment survey may differ from the figures that would have been obtained if it were possible to take a complete census using the same schedules and procedures. The relatively large size of the BLS establishment sample assures a high degree of accuracy. However, since the link relative technique requires the use of the previous month’ s estimate as the base in computing the current month’ s estimate, small sampling and response errors may cumulate over several months. To remove this accumulated error, the estimates are adjusted annually to new benchmarks. In addition to the sampling and response errors, the benchmark revision adjusts the estimates for changes in the industrial c la ss ification of individual establishments (resulting from changes in their product which are not reflected in the levels of estimates until the data are adjusted to new benchmarks). In fact, at the more detailed industry levels, particularly within manufacturing, changes in classification are the major cause of benchmark adjustments. Another cause of differences, generally minor, arises from improvements in the quality of the benchmark data. (A detailed description of the March 1968 benchmark is available from the Bureau upon request.)
One measure of the reliability of ratio estimates is the root mean square error (RMSE). This measure is the standard deviation adjusted for the bias in ratio estimates (RMSE =\/(Standard Deviation)2 + (B ias)2). If the baas is small, the chances are about 2 out o f 3 that an estimate from the sample would differ from its benchmark by less than the root mean square error. The chances are about 19 out of 20 that the difference would be less than twice the root mean square error.
Approximations of the root mean square errors (based on the experience of the last several years) of differences between final estimates and benchmarks are presented in the following table.
1 4 5
Digitized for FRASER http://fraser.stlouisfed.org/ Federal Reserve Bank of St. Louis

Root-mean-square errors of differences between benchmarks and estimates
Size of employment estimate
Root-mean-squareerror1
50,000 2,000100,000 2,600200,000 3,600500,000 7,000
1,000,000 11,6002,000,000 18,400
1 Assuming 12-month intervals between benchmark revisions.
For the most recent months, estimates of employment, hours, and earnings are preliminary and are so footnoted in the tables. These figures are based on less than the total sample and are revised when all the reports in the sample have been received. The table below presents root-mean-square-errors of the amounts of
Errors of preliminary employment estimates
Size of empl. estimate
Root-mean- square error of
Monthly level Month-to-month change
50,000 600 600100,000 900 900200,000 1,700 1,700500,000 3,000 2,800
1,000,000 4,300 4,0002,000,000 8,000 8,000
10,000,000 29,600 27,600
Total Nonag. empl. 84,000 74,000
revision that may be expected between the preliminary and final levels of employment and preliminary and final month-to-month changes. Revisions of preliminary hours and earnings estimates are normally not greater than .1 of an hour for weekly hours or 1 cent for hourly earnings.
STA TISTICS FOR ST A TES AND AREAS
State and area employment, hours, earnings, and labor turnover data are collected and prepared by State agencies in cooperation with BLS. The area statistics relate to-metropolitan areas. Definitions for all areas are published each year in the issue of Employment and Earnings that contains State and area annual averages (usually the May issue). Changes in definitions are noted as they occur. Additional industry detail may be obtained from the State agencies listed on the inside back cover of each issue. These statistics are based on the same establishment reports used by BLS for preparing national estimates. For employment, the sum of the State figures may differ slightly from the equivalent official U.S. totals on a national basis, because some States have more recent benchmarks than others and because of the effects of differing industrial and geographic stratification.
For the States and the areas shown in the B and C sections of this periodical, all the annual average data for the detailed industry statistics currently published by each cooperating State agency are presented (from the earliest date of availability of each series) in a summary volume published annually by the BLS.
UNEMPLOYMENT INSURANCE DATA
Insured unemployment represents the number of persons reporting a week of unemployment under an unemployment insurance program. It includes some persons who are working part time who would be counted as employed in the payroll and household surveys. Excluded are persons who have exhausted their benefit rights, new workers who have not earned rights to unemployment insurance, and persons losing jobs not covered by unemployment insurance systems (agriculture, State and local government, domestic service, self-employment, unpaid family work, nonprofit organizations, and firms below a minimum size). The rate of insured unemployment is the number of insured unemployed expressed as a percent of average covered employment in a 12-month period ending 6 to 8 months prior to the week of reference. Initial
claims are notices filed by those losing jobs covered by an unemployment insurance program that they are starting a period of unemployment. A claimant who continues to be unemployed a full week is then counted in the insured unemployment figure.
Because of differences in State laws and procedures under which unemployment insurance programs are operated, State unemployment rates generally indicate, but do not precisely measure, differences among the individual States. Persons wishing to receive a detailed description of the nature, sources, inclusions and exclusions, and limitations of unemployment insurance data should address their inquiries to Manpower Administration, Washington, D.C.
146
Digitized for FRASER http://fraser.stlouisfed.org/ Federal Reserve Bank of St. Louis

SEASONAL ADJUSTMENTMany economic statistics reflect a regularly recurring
seasonal movement which can be estimated on the basis of past experience. By eliminating that part of the change which can be ascribed to usual seasonal variation, it is possible to observe the cyclical and other nonseasonal movements in the series. However, in evaluating deviations from the seasonal pattern—that is, changes in a seasonally adjusted series—it is important to note that seasonal adjustment is merely an approximation based on past experience. Seasonally adjusted estimates have a broader margin of possible error than the original data on which they are based, since they are subject not only to sampling and other errors but, in addition, are affected by the uncertainties of the seasonal adjustment process itself. Seasonally adjusted series for selected labor force and establishment data are published regularly in . Employment and Earnings.
The seasonal adjustment method used for these series is an adaptation of the standard ratio-to-moving average method, with a provision for "moving” adjustment factors to take account of changing seasonal patterns. A detailed description of the method is given in the booklet, The BLS Seasonal Factor Method (1966), which may be. obtained from the Bureau on request.
For establishment data, the seasonally adjusted series on weekly hours and labor turnover rates for industry groupings are computed by applying factors directly to the corresponding unadjusted series. However, seasonally adjusted employment totals for all employees and production workers by industry division are obtained by summing seasonally adjusted data for the component industries. Indexes of aggregate weekly man-hours, seasonally adjusted, for mining, contract construction, and the major industries in manufacturing are obtained by multiplying average weekly hours, seasonally adjusted, by production workers, seasonally adjusted, and dividing by the 1957-59 base. For total, manufacturing, and durable and nondurable goods, the indexes of aggregate weekly man-hours, seasonally adjusted, are obtained by summing the aggregate weekly man-hours, seasonally adjusted, for the appropriate component industries and dividing by the 1957-59 base.
The seasonally adjusted establishment data for Federal Government are based on a series which excludes the Christmas temporary help employed by the Post Office Department in December. The employment of these workers constitutes the only significant seasonal change in Federal Government employment during the winter months. Furthermore, the volume of such employment may change substantially from year to year because of administrative decisions by the Post Office Department. Hence, it was considered desirable to exclude this group from the data upon which the seasonally adjusted series is based. Factors currently in use for the establishment data a r e shown in the July 1969 Employment and Earnings, and revisions will be made coincidental with the adjustment of series to new benchmark levels.
For each of the three major labor force components— agricultural and nonagricultural employment and unemployment—data for four age-sex groups (male and female workers under age 20 and age 20 and over) are separately adjusted for seasonal variation and are then added to give seasonally adjusted total figures. In order to produce seasonally adjusted total employment and civilian labor force data, the appropriate series are aggregated. The seasonally adjusted rate of unemployment is derived by dividing the seasonally adjusted figure for total unemployment (the sum of four seasonally adjusted age-sex components) by the figure for the seasonally adjusted civilian labor force (the sum of twelve seasonally adjusted age-sex components).
The seasonal adjustment factors applying to current data are based on ar pattern shown by past experience. These factors are revised in the light of the pattern revealed by subsequent data. Revised seasonally adjusted series for major components of the labor force based on data through December 1968 are published in the February 1969 Employment and Earnings and Monthly Report on the Labor Force. Revisions will be made annually as each additional year's data become available.
a t t e n t i o n
As discussed in the Technical Note, the Bureau periodically adjusts the industry employment series to a recent benchmark to improve their accuracy. These adjustments may also affect the hours and earnings series because employment levels are used as weights. Industry data for all national series shown in this report have been adjusted to March 1968 benchmarks. Data from April 1968 forward are subject to revision at the time of the next benchmark.
Beginning with the July 1969 and subsequent issues of Employment and Earnings, the national data in sections B, C, andD supersede those published in previous issues, as well as those appearing in the Handbook of Labor Statistics, 1969. Comparable data will be published in Employment and Earnings, United States, 190 9-69, BLS Bulletin 1312-7.
1 4 7
Digitized for FRASER http://fraser.stlouisfed.org/ Federal Reserve Bank of St. Louis

Summary of Methods for Computing Industry Statistics
on Employment, Hours, Earnings, and Lnhor Turnover
ItemBasic estimating cells (industry, region,
s ize , or reg ion/s ize c e ll)Aggregate industry levels (d iv isions, groups and,
where stratified , individual c e lls )
Monthly Data
A ll e m p lo y e e s ...................................................... All-employee estimate for previous month m ulti- Sum of all-employee estimates for componentplied by ratio of a ll employees in current month to a ll employees in previous month, for sample establishmdhts which reported for both months.
cells .
Production or nonsupervisory workers; All-employee estimate for current month multi - Sum of production- or nonsupervisory-workerwomen employees . plied by (1) ratio of production or nonsuper- estimates, or estimates of women employees,
visory workers to a ll employees in sample establishments for current month, (2) ratio of women to a ll employees.
for component ce lls .
Gross average weekly h o u r s ......................... Production- or nonsupervisory-worker man-hours Average, weighted by production- or nonsuperdivided by number of production or nonsuper- visory-worker employment, of the average weeklyvisory workers. hours for component cells .
Average weekly overtime h o u r s ................... Production-worker overtime man-hours divided Average, weighted by production-worker employby number of production workers. ment, of the average weekly overtime hours for
component cells .
Gross average hourly e a rn in g s ...................... Total production- or nonsupervisory-worker pay- Average, weighted by aggregate man-hours, of theroll divided by total production- or nonsupervisory-worker man-hours.
average hourly earnings for component ce lls .
Gross average weekly earnings...................... Product of gross average weekly hours and Product of gross average weekly hours and averageaverage hourly earnings. hourly earnings.
Labor turnover ra te s ............................................ The number of particular actions (e .g ., quits) Average, weighted by employment, of the rates forin reporting firms divided by total employment in those firms. The result is m ultiplied by 100.
component cells .
Annual Average Data
A ll employees and production or nonsupervisory w orkers.
Sum of monthly estimates divided by 12. Sum of monthly estimates divided by 12.
Gross average weekly hours ......................... Annual total of aggregate man-hours (production- Annual total of aggregate man-hours for productionor nonsupervisory-worker employment multiplied or nonsupervisory workers divided by annual sumby average weekly hours) divided by annual sum of employment.
of employment for these workers.
Average weekly overtime h o u rs ...................... Annual total of aggregate overtime man-hours Annual total of aggregate overtime man-hours for(production-worker emp'oyment m ultiplied by production workers divided by annual sum ofaverage weekly overtime hours) divided by annual sum of employment.
employment for these workers.
Gross average hourly e a rn in g s ...................... Annual total of aggregate payrolls (production- Annual total of aggregate payrolls divided by annualor nonsupervisory-worker employment multiplied by weekly earnings) divided by annual aggregate man-hours.
aggregate man-hours.
Gross average weekly earn ings...................... Product of gross average weekly hours and Product of gross average weekly hours and averageaverage hourly earnings. hourly earnings.
Labor turnover ra te s ............................................ Sum of monthly rates divided by 12. Sum of monthly rates divided by 12.
1 48
U.S. GOVERNMENT PRINTING O FFICE: 1969 O - 371-793
Digitized for FRASER http://fraser.stlouisfed.org/ Federal Reserve Bank of St. Louis

UNITED STATES DEPARTMENT OF LABOR Bureau of Labor Statistics
Regional OfficesREGION I - BOSTON BLS Regional Director John Fitzgerald Kennedy Federal Government Center - Room 1603 A Boston, Mass. 02203
REGION II - NEW YORK BLS Regional Director
Bldg. 341 Ninth AvenueNew York, N.Y. 10001
REGION III - PHILADELPHIA BLS Regional Director Penn Square Bldg., Rm. 406 1317 Filbert Street Philadelphia, Pa. 19107
REGION IV - ATLANTA BLS Regional Director 1371 Peachtree Street, N.E. Atlanta, Ga. 30309
REGION V - CHICAGO BLS Regional Director 219 South Dearborn Street Chicago, 111. 60604
REGION VI - DALLAS BLS Regional Director 411 North Akard Street Dallas, Tex. 75201
REGIONS VII 8 VIII - KANSAS CITY BLS Regional Director 911 Walnut Street Kansas City, Mo. 64106
REGIONS IX $ X - SAN FRANCISCO BLS Regional Director 450 Golden Gate Avenue, Box 36017 San Francisco, Calif. 94102
BLSR egion
IV ALABAMAX ALASKAIX ARIZONAVI ARKANSASIX CALIFORNIA
VIII COLORADOI CONNECTICUT
III DELAWAREIII DIST. OF COL.IV FLORIDAIV GEORGIAIX HAWAIIX IDAHOV ILLINOIS
V INDIANAVII IOWAVII KANSASIV KENTUCKYVI LOUISIANAI MAINE
III MARYLANDI MASSACHUSETTS
V MICHIGANV MINNESOTAIV MISSISSIPPI
VII MISSOURIVIII MONTANAVII NEBRASKAIX NEVADAI NEW HAMPSHIRE
II NEW JERSEY*
VI NEW MEXICOII NEW YORK
IV NORTH CAROLINA
VIII NORTH DAKOTAV OHIO
VI OKLAHOMAX OREGON
III PENNSYLVANIAI RHODE ISLAND
IV SOUTH CAROLINAVIII SOUTH DAKOTA
IV TENNESSEEVT TEXAS
VIII UTAHI VERMONT
III VIRGINIA
X WASHINGTONIII WEST VIRGINIAV WISCONSIN
VIII WYOMING
COOPERATING STATE AGENCIESEmployment and Labor Turnover Statistics Programs
- Department of Industrial Relations, Montgomery 36104- Employment Security Division, Department of Labor, Juneau 99801- Unemployment Security Commission, Phoenix 85005- Employment Security Division, Department of Labor, Little Rock 72203- Division of Labor Statistics and Research, Department of Industrial Relations, Human Relations Agency,
San Francisco 94101 (Employment). Research and Statistics, Department of Employment,Sacramento 95814 (Turnover).
- Department of Employment, Denver 80203- Employment Security Division, Connecticut Labor Department, Hartford 06115- Employment Security Commission, Wilmington 19899- Manpower Training and Employment Services Administration for the District of Columbia, Washington 20212- Department of Commerce, Tallahassee 32304- Employment Security Agency, Department of Labor, Atlanta 30303- Department of Labor and Industrial Relations, Honolulu 96811- Department of Employment, Boise 83707- Division of Research and Statistics,
Department of Labor, Chicago 60606- Employment Security Division, Indianapolis 46204- Employment Security Commission, Des Moines 50319- Employment Security Division, Department of Labor, Topeka 66603- Bureau of Employment Security, Department of Economic Security, Frankfort 40601- Department of Employment Security, Baton Rouge 70804- Employment Security Commission, Augusta 04330- Department of Employment Security, Baltimore 21201- Division of Statistics, Department of Labor and Industries, Boston 02202 (Employment).
Division of Employment Security, Boston 02215 (Turnover).- Employment Security Commission, Detroit 48202- Department of Manpower Services, St. Paul 55101- Employment Security Commission, Jackson 39205- Division of Employment Security, Jefferson City 65102- Unemployment Compensation Commission, Helena 59601- D i v i s i o n o f E m p lo y m e n t , D e p a r t m e n t o f L a b o r , L i n c o l n 6 8 5 0 9- Employment Security Department, Carson City 89701- Department of Employment Security, Concord 03301- Division of Planning and Research, Department of Labor and Industry,
Trenton 08625.- Employment Security Commission, Albuquerque 87103- Research and Statistics Office, Division of Employment, N.Y. State Department of Labor,
State Campus Building 12, Albany 12201- Division of Statistics, Department of Labor, Raleigh 27602 (Employment). Bureau of
Employment Security Research, Employment Security Commission, Raleigh 27602 (Turnover).- Employment Security Bureau, Bismarck 58501- Division of Research and Statistics, Bureau of Employment Services, 145 S. Front St., Columbus 43216- Employment Security Commission, Oklahoma City 73105- Division of Employment, Salem 97310- Bureau of Employment Security, Department of Labor and Industry, Harrisburg 17121- Division of Statistics and Census, Department of Labor, Providence 02908 (Employment).
Department of Employment Security, Providence 02903 (Turnover).- Employment Security Commission, Columbia 29202- Employment Security Department, Aberdeen 57401- Department of Employment Security, Nashville 37219- Employment Commission, Austin 78701- Department of Employment Security, Salt Lake City 84111- Department of Employment Security, Montpelier 05602- Division of Research and Statistics, Department of Labor and Industry,
Richmond 23214 (Employment). Employment Commission, Richmond 23211 (Turnover).- Employment Security Department, Olympia 98501- Department of Employment Security, Charleston 25305- Department of Industrial, Labor and Human Relations, Madison 53701- Employment Security Commission, Casper 82601
Digitized for FRASER http://fraser.stlouisfed.org/ Federal Reserve Bank of St. Louis

UNITED STATESGOVERNMENT PRINTING OFFICE DIVISION OF PUBLIC DOCUMENTS
WASHINGTON, D.C. 20402
OFFICIAL BUSINESSPENALTY FOR PRIVATE USE TO AVOID
PAYMENT OF POSTAGE, $300 (GPO)
Digitized for FRASER http://fraser.stlouisfed.org/ Federal Reserve Bank of St. Louis