bls_1528_1967.pdf
TRANSCRIPT
Compensation Expenditures and
Payroll Hours
PIPELINES, 1964
Bulletin No. 1528
UNITED STATES DEPARTMENT OF LABOR W. Willard Wirtz, Secretary
BUREAU OF LABOR STATISTICS Arthur M. Ross, Commissioner
Digitized for FRASER http://fraser.stlouisfed.org/ Federal Reserve Bank of St. Louis
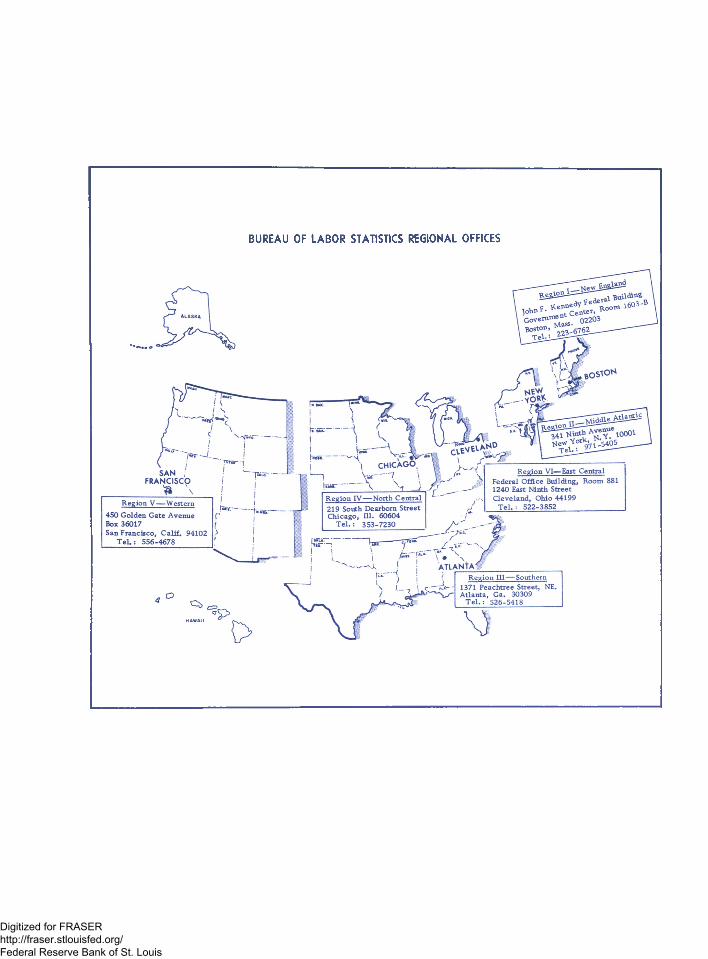
BUREAU OF LABOR STATISTICS REGIONAL OFFICES
Digitized for FRASER http://fraser.stlouisfed.org/ Federal Reserve Bank of St. Louis
Compensation Expenditures
and
Payroll Hours
PIPELINES, 1964
Bulletin No. 1528April 1967
UNITED STATES DEPARTMENT OF LABOR W. Willard Wirtz, Secretary
BUREAU OF LABOR STATISTICS Arthur M. Ross, Commissioner
For sale by the Superintendent of Documents, U.S. Government Printing Office, Washington, D.C., 20402 - Price 25 cents
Digitized for FRASER http://fraser.stlouisfed.org/ Federal Reserve Bank of St. Louis

Digitized for FRASER http://fraser.stlouisfed.org/ Federal Reserve Bank of St. Louis

Preface
The concept of employee compensation has broadened considerably in the past several decades through the adoption or liberalization of a host of supplementary pay practices. Statistics on straight-time wages for tirrte worked no longer sufficiently approximate the level of employer payments for hired labor. Therefore, it is important now to take account of such outlays as vacation and holiday pay, daily or weekly overtime and shift differentials, terminal (severance) pay, contributions to private pension and health and welfare funds, and payments under legally required insurance programs.
This bulletin analyzes the level and structure of employer outlays for the compensation of employees, considering the expenditures for each component as a percent of total compensation outlays and in cents-per-hour terms. Furthermore, the relative importance of working and leave hours as percents of total hours paid for is discussed.
This study of the pipeline industry is part of the Bureau’s program of studies of employer expenditures for supplementary compensation practices. A list of previously issued reports is found at the end of this bulletin.
The study was conducted by the Bureau’s Division of National Wage and Salary Income, Norman J. Samuels, Chief, in the Office of Wages and Industrial Relations, L». R. Linsenmayer, Assistant Commissioner. The statistical techniques were developed by Samuel E. Cohen and Theodore J. Golonka. The analysis was prepared by Robert E. Pope, under the immediate supervision of Victor J. Sheifer and the general direction of Arnold Strasser.
m
Digitized for FRASER http://fraser.stlouisfed.org/ Federal Reserve Bank of St. Louis

Digitized for FRASER http://fraser.stlouisfed.org/ Federal Reserve Bank of St. Louis
Contents
Page
Summary_____________________________________________________________________________ 1Compensation levels_________________________________________________________________ 2Prevalence of supplements__________________________________________________________ 2Paid leave____________________________________________________________________________ 4
Paid vacations and holidays_____________________________________________________ 4Sick leave and other paid leave_________________________________________________ 4
Premium payments__________________________________________________________________ 5Nonproduction bonuses and terminal payments___________________________________ 5Legally required insurance program s_____________________________________________ 5Private welfare plans________________________________________________________________ 6
Life, accident, and health insurance___________________________________________ 6Pension and retirement plans___________________________________________________ 6Savings and thrift plans__________________________________________________________ 7
Composition of payroll hours_______________________________________________________ 7
Chart: The structure of compensation, pipelines, 1964________________________ 3
Tables:
1. Employer expenditures for the compensation of employees,pipeline industry, 1964_____________________________________________________ 8
2# Percent distribution of workers, by employer expenditures forselected compensation practices, as a percent of total expendituresfor the compensation of employees, pipeline industry, 1964____________ 9
3. Percent distribution of workers, by employer expenditures forselected compensation practices, in cents per paid hour, pipeline industry, 1964_______________________________________________________________ 10
Appendixes:
A. Expenditures as proportions of payroll____________________________________ 11B. Scope and method of survey_________________________________________________ 15C. Questionnaire_________________________________________________________________ 17
v
Digitized for FRASER http://fraser.stlouisfed.org/ Federal Reserve Bank of St. Louis

Digitized for FRASER http://fraser.stlouisfed.org/ Federal Reserve Bank of St. Louis
Compensation Expenditures and Payroll Hours
Pipelines, 1964
Summary
Compensation1 in the pipeline industry2 amounted to $4.46 for each hour for which employees were paid during 1964. 3 Eighty-five percent ($3.79) of these employer expenditures consisted of direct payments to workers, of which $3.29 were payments at straight-time rates for working time and 50 cents were expenditures for leave time; premiums for overtime, weekend, holiday, and shift work; nonproduction bonuses; and terminal payments. In addition to these direct payments, pipeline employers had expenditures of 67 cents— 15 percent of all compensation expenditures— for legally required insurance programs and private welfare plans.
Aggregate expenditures for supplements to straight-time pay for working time amounted to $1.17 per hour— almost half (56 cents) of which consisted of expenditures for private welfare plans; slightly more than four-tenths was for direct payroll supplements. Expenditures for legally required insurance programs amounted to 11 cents per hour— less than 10 percent of all supplementary expenditures.
The pipeline industry has one of the highest compensation levels in the country. Expenditures in this industry are of such magnitude that the supplementary compensation payments, which accounted for just over one-fourth of total compensation expenditures, were only 8 cents per hour less than the legal minimum wage established under the Fair Labor Standards Act, as amended in 1964.
Companies within the industry vary widely in size. Some have fewer than 25 employees and others more than 1, 500 employees. About 60 percent of the industry's nonsupervisory workers were in companies with collectively bargained agreements covering a majority of their nonsupervisory employees.4 In general, however, a similar level of expenditures for supplements was reported by both unionized and nonunionized companies and by companies of different em ployment size. Nevertheless, the highest level of expenditures for paid leave— both as a proportion of total compensation outlays and in cents per paid hour----
1 Compensation, for purposes of this study, is defined as the sum of the payments, subject to Federal withholding taxes, that were made by employers directly to their employees, before deductions of any type, and the expenditures made by employers for legally required insurance programs and private welfare plans to provide the worker with full— or partial— economic security against a future contingency (e . g. , unemployment, retirement, m edical expenses, e tc .) .
2 The pipeline transportation industry includes companies classified, in accordance with the 1957 edition of the Standard Industrial Classification Manual and 1963 Supplement, in SIC 4612— crude petroleum pipelines— and SIC 4613— refined petroleum pipelines.
Paid hours consist of aggregate hours, including paid leave hours, rest periods, coffee breaks, machine down-tim e, and other nonleave hours paid for but not worked, for which employers made direct payments to workers during the year. Working time excludes paid leave, hours. As leave hours increase proportionate to total hours, expenditures per hour of working time differ increasingly from expenditures per paid hour. In this industry, leave hours accounted for about 11 percent of all 1964 paid hours occasioning a difference of about 12 percent between the two cents per hour measures. Unless otherwise noted, all cents-per-hour discussions in the text are based on aggregate paid hours.
The terms workers and employees, which are used synonymously in this report, are defined to include all em ployees of pipeline companies.
4 More than 8 out of every 10 pipeline workers were employed in nonsupervisory capacities during 1964. Em - ployment and Earnings Statistics for the United States, 1909 -65 (BLS Bulletin 1312 -3 , 1965).
Digitized for FRASER http://fraser.stlouisfed.org/ Federal Reserve Bank of St. Louis

2
were made by the largest size companies and by companies in which the majority of nonsupervisory workers were covered by bargained agreements. It should be noted that many pipeline companies are affiliated with petroleum refineries, and to a certain extent, both industries have similar supplemental compensation plans.
Compensation Levels
Expenditures in the pipeline industry for the compensation of employees amounted to $4.46 for each paid hour during 1964. Almost six-tenths of the industry’ s employees worked for companies whose expenditures ranged between $3.80 and $4.80 per hour. 5 About two-thirds of the remaining employees worked for firms with expenditures of over $4.80 per hour and one-third were employed by pipeline companies with compensation expenditures of less than $3.80 per hour. The tabulation below shows the distribution of workers by company expenditures.
Distribution of workers by company expenditures, in cents per paid hour, for the compensation of
_________ pipeline em ployees, 1964__________
Total compensation Percent of(cents per paid hour) all employees
A ll employees------------------------------------------- 100
Under $3. 4 0 ------------------------------------------------------ 6$3. 40 and under $3. 6 0 ----------------------------------- 3$3. 60 and under $3. 8 0 ---------------------------------- 7$3. 80 and under $4. 0 0 ----------------------------------- 12$4. 00 and under $4. 2 0 ---------------------------------- 12$4. 20 and under $4. 4 0 ----------------------------------- 2$4. 40 and under $4. 6 0 ----------------------------------- 16$4. 60 and under $4 . 8 0 ---------------------------------- 15$4. 80 and under $5. 0 0 ----------------------------------- 4$5. 00 and under $5. 2 0 ----------------------------------- 7$5. 20 or more---------------------------------------------------- 15
NOTE: Because of rounding, sum of individual items may not equal 100.
Prevalence of Supplements
All companies had expenditures during 1964 for vacations; holidays; sick leave; premium pay; life, accident, and health insurance; and pension and retirement plans. In addition, all companies in the industry had expenditures for legally mandated programs such as social security and unemployment insurance, and almost all had expenditures for workmen’ s compensation programs. 6
Savings and thrift plans were also very prevalent in this industry. Companies employing nine-tenths of all workers had expenditures for such plans. This is an unusually high incidence for savings and thrift plans and contrasts sharply with the pattern found inm ost industries.7 The prevalence of other supplements
5 For ease of reading in this and subsequent discussions of tabulations, the limits of the class intervals are designated as 2 to 5 percent, 1 to 6 cents, etc. , instead of using the more precise terminology, 2 and under 5 percent, 1 and under 6 cents, etc.
6 Companies can self-insure under the workmen's compensation laws in several States and in a given year may have no expenditures occasioned by occupational illness or injury. An estimated 2 percent of the woikers in the pipeline industry were employed by firms that did not have any expenditures for workmen's compensation programs during 1964.
For exam ple, in 1962, only 4 percent of the production and related woikers in the manufacturing industries were employed by establishments with expenditures for savings and thrift plans. See Employer Expenditures for Selected Supplementary Compensation Practices for Production and Related Workers: Composition of Payroll Horns: Manufacturing Industries, 1962 (BLS Bulletin 1428, 1965).
Digitized for FRASER http://fraser.stlouisfed.org/ Federal Reserve Bank of St. Louis

The Structure of Compensation, Pipelines, 1964(Cents per paid hour)
Legally required insurance programs
Digitized for FRASER http://fraser.stlouisfed.org/ Federal Reserve Bank of St. Louis
4
varied: Four-fifths of all employees worked for companies that had shift differential expenditures; almost three-fourths were in companies having terminal payments; and slightly over one-half were employed by companies that had expenditures for nonproduction bonuses. 8
Paid LeaveLeave payments accounted for over 80 percent of all expenditures for
direct payroll supplements, and were second in importance (among the various supplements to straight-time pay for working time) only to expenditures for private welfare plans.
Leave expenditures constituted 9.2 percent of total compensation with vacations and holidays accounting for over 80 percent of these payments. Sick leave and civic and personal leave accounted for the remainder of the leave payments. Generally, expenditures for leave time were at similar levels throughout the industry with almost two-thirds of the workers being employed by companies in which these payments ranged between 8 and 10 percent of total compensation, and almost seven-eights of the employees worked for companies whose leave payments amounted to 30 cents or more per 1964 paid hour. However, the highest levels of leave payments were found in the largest companies. This was not necessarily because of more liberal practices, although most of the firms with the highest expenditure levels granted 5 weeks or more of paid vacation to some of their employees, but possibly because these companies had more long service employees who were eligible for more extensive vacation periods.
Paid Vacations and Holidays. Vacation payments comprised 5. 2 percent of total compensation, and amounted to 23 cents per 1964 paid hour. Most workers (71 percent) were employed by companies whose vacation expenditures constituted 4 to 6 percent of total compensation with the larger companies generally having higher vacation expenditures as a proportion of total compensation than the small.
Holiday expenditures were generally uniform throughout the industry regardless of company size, location, or union status; 88 percent of all employees were in companies whose expenditures were 2 to 3 percent of total compensation; the overall average being 2. 4 percent. These expenditures amounted to almost 11 cents for each paid hour during 1964.
Sick Leave and Other Paid Leave. Payments to workers for sick leave were made by all pipeline firm s. These expenditures, which accounted for 15 percent of all leave payments, amounted to 1 .4 percent of compensation outlays and averaged almost 6 .5 cents for each paid hour. Expenditures of the different firms ranged from under 1 percent of all compensation outlays and less than 2 cents per paid hour to 2 percent and 12 cents. However, during 1964, two-thirds of the workers were employed by firms in which sick leave payments comprised 1 to 3 percent of compensation, and more than one-third worked for pipeline firms in which these payments amounted to 6 cents or more per paid hour.
Ninety percent of the industry1 s employees worked for companies that had expenditures for civic and personal leave 9 during 1964. However, these expenditures amounted to less than one-half of 1 percent of all compensation outlays. 10
8 None of the companies in the sample reported having expenditures for vacation and holiday funds or for severance and/or SUB funds. Most companies, however, provided similar benefits through direct payroll expenditures.
Includes military, jury, witness (excluding pay for serving as a witness for the employer), voting, and personal leave.
The low level of expenditures is due more to the infrequent occurrence of this type of paid leave, rather than a lack of liberality in benefits. The six pipeline contracts on file with the Bureau indicate that funeral leave and jury leave are prevalent in the industry.
Digitized for FRASER http://fraser.stlouisfed.org/ Federal Reserve Bank of St. Louis
5
Premium PaymentsPremium payments, 11 although reported by all companies, constituted
only 1.6 percent of total compensation and amounted to 7.1 cents per paid hour during 1964. Premiums for overtime, weekend, and holiday work comprised 80 percent of these payments and shift differentials accounted for the rest.
Although some workers were employed by companies in which these expenditures amounted to 5 percent of total compensation, all but 16 percent of the employees worked for companies with premium payments of less than 2 percent of total compensation.
Shift differential expenditures were uniformly low, amounting to less than 1 percent of all compensation payments.
Nonproduction Bonuses and Terminal PaymentsBoth nonproduction bonuses and terminal pay, comprised only minute
portions of the industry's total outlay for the compensation of employees. While a majority of the employees worked for companies with expenditures for these items (55 percent for those with bonuses and 81 percent for those with terminal pay), outlays were generally low. Even among companies with expenditures for these benefits, bonuses averaged only 0.2 cents and terminal pay 2.8 cents per paid hour.
Legally Required Insurance ProgramsCompany expenditures for legally required insurance programs consti
tuted only 2.5 percent of total compensation outlays during 1964. 12 Payments for social security comprised 72 percent of the total; unemployment compensation 20 percent; and workmen’ s compensation 8 percent. 13
Expenditures for social security (old-age, disability, and survivors insurance) accounted for 1.8 percent of total compensation, or slightly over 8 cents per paid hour. Nearly all employees were in companies whose costs were between 1 and 3 percent of total compensation, or between 6 and 10 cents per paid hour.
Payments made for State and Federal14 unemployment insurance constituted only 0.5 percent of compensation and amounted to 2 cents per paid hour. Over 90 percent of all employees worked for companies whose expenditures for unemployment insurance constituted less than 1 percent of total compensation payments, and 95 percent worked for companies with payments of less than 4 cents per hour.
Workmen’ s compensation expenditures of slightly over 1 cent per paid hour accounted for only 0.2 percent of compensation. Expenditures in all companies were less than 4 cents per hour and almost all workers (96 percent) were in companies in which these expenditures accounted for less than 1 percent of total compensation.
11 These include premium pay for overtime, weekend, and holiday work, and shift differentials.12 The expenditures for legally required insurance programs were only a small proportion of total compensation
expenditures because of the generally high level of gross money wages in the industry. In general, the legally required programs are funded on the basis of a rate applied against a specified maximum of each em ployee’s, earnings. For example: In 1964, the employer’ s rate of contribution for social security was 35/g percent of the first $ 4 ,8 0 0 of each em ployee's annual earnings. Employee earnings in the industry averaged considerably higher than these maximums, and hence, the payments are only a small proportion of total compensation expenditures.
Employers in a few States are subject to temporary disability insurance laws. None of the pipeline companies in the sample reported expenditures under these laws.
14 For 1964, employers in all but 9 States were taxed at a rate of 0 .4 percent of payroll. A rate of 0 .7 percent was paid in California, Delaware, Indiana, Massachusetts, Michigan, Minnesota, New Jersey, and West Virginia. Alaska had a rate of 0 .8 5 percent. In all States, the tax applied only to the first $ 3 ,0 0 0 paid to an employee.
Digitized for FRASER http://fraser.stlouisfed.org/ Federal Reserve Bank of St. Louis
6
Private Welfare Plans
In 1964, $1 of every $8 of compensation provided pipeline workers with deferred compensation, in the form of private welfare plans, which provided the workers with protection against various contingencies and/or eventualities. These expenditures were not only greater in the pipeline industry, during 1964 than those for any other group of pay supplements, but were considerably higher than those made in 1962 by manufacturing employers for production and related workers or those made in 1963 for nonproduction workers in the private sector of the economy. 15
Outlays for all private welfare plans constituted 12.6 percent of the pipeline industry's total compensation expenditures; outlays for pension and retirement plans accounted for one-half of these payments; savings and thrift plans amounted to 3.6 percent, and life, accident, and health insurance to 2.7 percent. Expenditures for private welfare plans amounted to 56 cents per paid hour, or 63 cents per 1964 working hour. Half of the industry's employees worked for companies in which these expenditures amounted to 45 cents per hour or more.
Life, Accident, and Health Insurance. All companies had expenditures for some type of life, accident, and health insurance. However, there was a wide range in the level of expenditures among the various companies. Measured as a percent of total compensation, the range was from under 1 to 6 percent; in cents per hour, it was from under 2 cents to as high as 30 cents per hour. Overall expenditures for these plans were 2. 7 percent of total compensation and represented payments of 12 cents per paid hour. A majority (55 percent) of all employees were in companies with expenditures of between 1 and 3 percent of total compensation. Generally, the highest expenditures were made by the largest companies and the lowest expenditures by the smallest companies. However, some large and some small companies had expenditures which fell in or around the center of the distribution.
About 95 percent of the pipeline employees worked for companies in which life, accident, and health insurance plans were partly paid for by employee contributions. However, employer expenditures for these contributoryplans----2. 7 percent of total compensation outlays— were only slightly lower thanthe expenditures (3.0 percent) reported by the few companies having noncontributory plans.
Pension and Retirement Plans. Expenditures for private pension and retirement plans were higher than for any other supplement to straight-time pay for working time, and were 31/ 2 times greater than expenditures for legally required social security. They comprised 6. 3 percent of total expenditures for compensation and amounted to 28 cents per paid hour. In general, the level of pension expenditures did not appear to be measureably affected by unionization or by the size of the company1 s employment.
Over 80 percent of all employees worked for companies in which pension expenditures were 3 percent or more of total compensation, and over one-fourth were in companies with expenditures of 10 percent or more. Over one-third of all employees worked for companies whose pension expenditures were 30 cents or more for each hour paid for during 1964.
15 For detail see BLS Bulletin 1428, op. c i t . , and Supplementary Compensation for Nonproduction Workers, 1963 (BLS Bulletin 1470, 1965).
Digitized for FRASER http://fraser.stlouisfed.org/ Federal Reserve Bank of St. Louis
Over nine-tenths of all employees were in companies with contributory pension and retirement plans; the remainder were employed by companies with noncontributory plans. Companies with contributory plans had lower expenditures (5.3 percent of total compensation) than did the few companies reporting expenditures under noncontributory plans (7.3 percent of total compensation).
Savings and Thrift Plans. More than nine-tenths of all pipeline employees worked for companies that had expenditures for savings and thrift plans in 1964. Only a few small companies reported no expenditures in 1964 for such plans.
Outlays in companies with expenditures for such plans comprised 3.8 percent of total compensation and ranged from 1 to 7 percent of total compensation. When divided among all paid hours, these expenditures amounted to 17.5 cents per hour and ranged from 4 to 35 cents per hour.
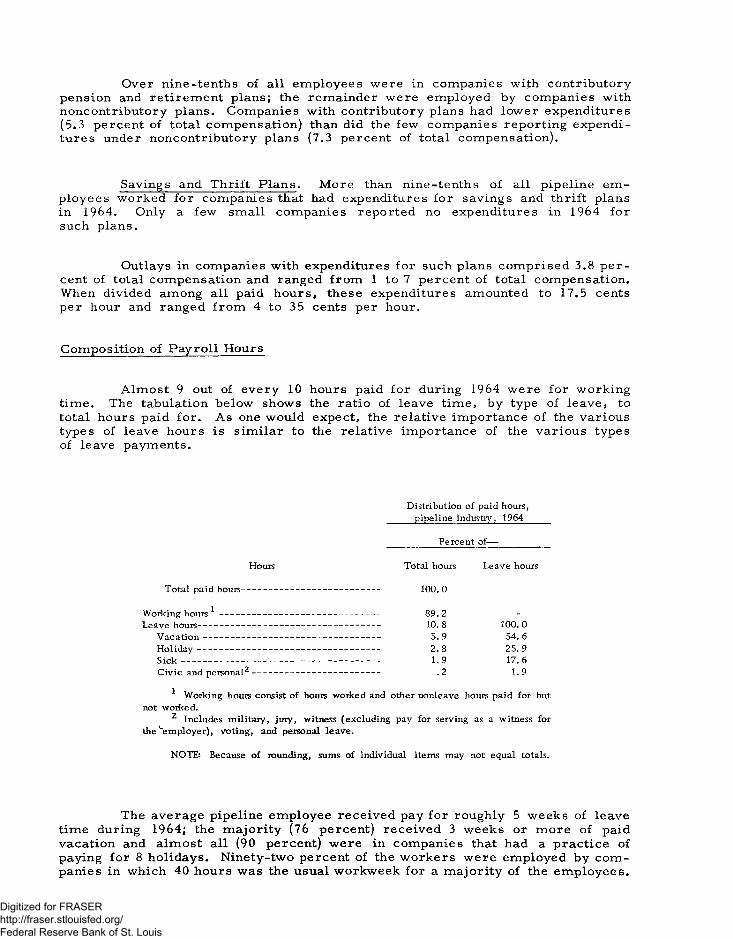
Composition of Payroll Hours
Almost 9 out of every 10 hours paid for during 1964 were for working time. The tabulation below shows the ratio of leave time, by type of leave, to total hours paid for. As one would expect, the relative importance of the various types of leave hours is similar to the relative importance of the various types of leave payments.
Distribution of paid hours, pipeline industry, 1964
Percent of—
Hours Total hours Leave hours
Total paid hours--
Working hours * ------------Leave h o u rs -----------------
V a c a tio n ------------------H o lid a y --------------------S ic k --------------------------Civic and personal2
1 00 .0
8 9 .2 _10 .8 1 00 .05 .9 5 4 .62 .8 2 5 .91 .9 1 7 .6
.2 1 .9
1 Working hours consist of hours worked and other nonleave hours paid for but not worked.
2 Includes m ilitary, jury, witness (excluding pay for serving as a witness for the ^employer), voting, and personal leave.
NOTE: Because of rounding, sums of individual items may not equal totals.
The average pipeline employee received pay for roughly 5 weeks of leave time during 1964; the majority (76 percent) received 3 weeks or more of paid vacation and almost all (90 percent) were in companies that had a practice of paying for 8 holidays. Ninety-two percent of the workers were employed by companies in which 40 hours was the usual workweek for a majority of the employees.
Digitized for FRASER http://fraser.stlouisfed.org/ Federal Reserve Bank of St. Louis
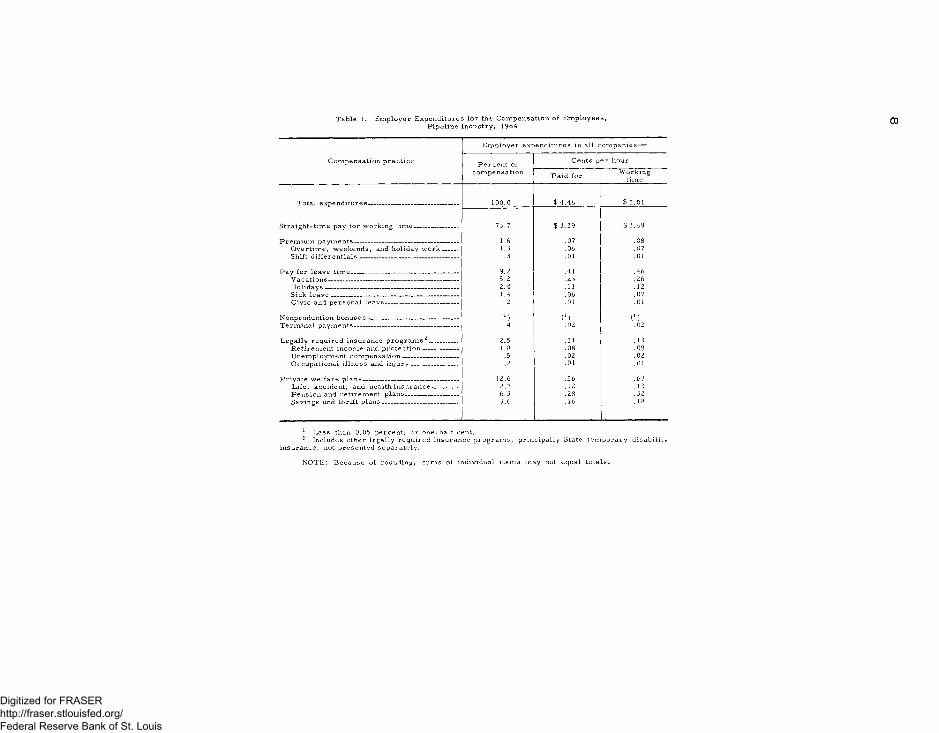
Table 1. Em ployer Expenditures for the Com pensation of E m p lo y ees,Pipeline Industry, 1964 00
Compensation practice
Employer expenditures in all companies—
Percent of compensation
Cents per hour
Paid for W orking time
Total expenditures----------------------------------------- 100.0 $ 4.46 $ 5.01
Straight-time pay for working time-------------------- 73.7 $ 3.29 $3.69
Premium payments----------------------------------------------- 1.6 .07 .08Overtime, weekends, and holiday work------- 1.3 .06 .07Shift differentials--------------------------------------------- .3 .01 .01
Pay for leave time------------------------------------------------- 9.2 .41 .46Vacations----------------------------------------------------------- 5.2 .23 .26Holidays------------------------------------------------------------ 2.4 .11 .12Sick leave---------------------------------------------------------- 1.4 .06 .07Civic and personal leave--------------------------------- .2 .01 .01
Nonproduction bonuses----------------------------------------- (M (M (MTerminal payments----------------------------------------------- .4 .02 .02
Legally required insurance program s1 2-------------- 2.5 .11 .13Retirement income and protection---------------- 1.8 .08 .09Unemployment compensation------------------------- .5 .02 .02Occupational illness and injury--------------------- .2 .01 .01
Private welfare plans-------------------------------------------- 12.6 .56 .63Life, accident, and health insurance------------ 2.7 .12 .13Pension and retirement plans------------------------ 6.3 .28 .32Savings and thrift plans----------------------------------- 3.6 .16 .18
1 Less than 0.05 percent, or one-half cent.2 Includes other legally required insurance programs, principally State temporary disability
insurance, not presented separately.
N O T E : B ecause of rounding, sum s of individual item s m ay not equal to ta ls .
Digitized for FRASER http://fraser.stlouisfed.org/ Federal Reserve Bank of St. Louis
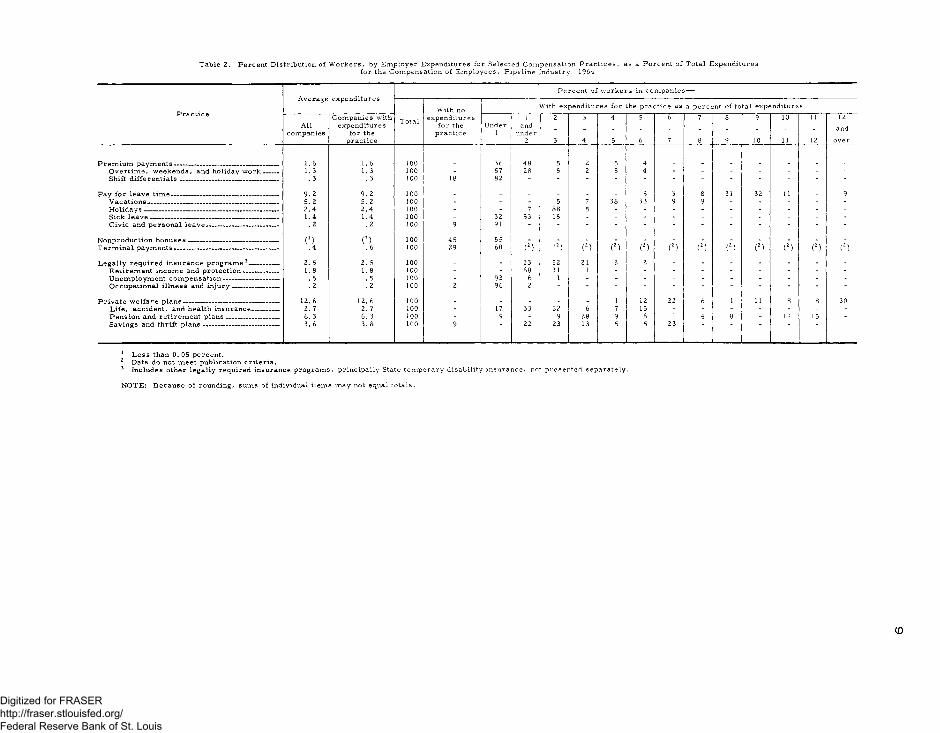
T able 2. Percent Distribution of W o rk e rs , by E m ployer Expenditures for Selected Com pensation P r a c tic e s , as a P ercent of Total Expendituresfor the Com pensation of E m p lo y ees, Pipeline Industry, 1964
Percent of workers in companies—
With no With expenditures for 1the practice as a percent of total expendituresCompanies with Total expenditures 1 2 3 4 5 6 7 8 9 10 11 12
All expenditures for the Under and andcompanies for the practice 1 underpractice 2 3 4 5 6 7 8 9 10 11 12 over
Premium payments-------------- ---------------------------- 1.6 1.6 100 36 48 5 2 5 4Overtime, weekends, and holiday work_____ 1.3 1. 3 100 - 57 28 5 2 5 4 - - - - - -Shift differentials--------------------------------------------- . 3 . 3 100 18 82 - - - ' - - - - -
Pay for leave tim e------------------------------------------------- 9 .2 9. 2 100 . . . - _ - 5 3 8 31 32 11 . 9Vacations------------------------------------------------------------ 5. 2 5. 2 100 - - - 5 7 38 33 9 9 - - - - -Holidays-------------------------------- ------------------------- 2 .4 2.4 100 - - 7 88 5 - - - - - - - - -Sick leave---------------------------------------------------------- 1.4 1.4 100 - 32 53 15 - - - - - - - - - -Civic and personal leave--------------------------------- . 2 . 2 100 9 91 - - - - - - - - -
Nonproduction bonuses----------------------------------------- C ) (M 100 45 55 - - - - - - - - - - - -Terminal payments------------------------------------------------ .4 . 6 100 29 60 (2) (2) (2) (2) (2) (2) (2) (2) (2) (2) (2) (2)
Legally required insurance programs 3-------------- 2. 5 2. 5 100 - - 23 52 21 2 2 - - - - - - -Retirement income and protection---------------- 1. 8 1.8 100 - - 68 31 1 - - - - - - - - -Unemployment compensation------------------------- . 5 . 5 100 - 93 6 1 - - - - - - - - - -Occupational illness and injury--------------------- . 2 . 2 100 2 96 2 ' " ' ' ~ ' "
Private welfare plans-------------------------------------------- 12. 6 12. 6 100 - . - . - 1 12 22 6 1 11 8 8 30Life, accident, and health insurance------------ 2. 7 2. 7 100 - 17 33 22 6 7 15 - - - - - - -Pension and retirement plans------------------------ 6. 3 6. 3 100 - 9 - 9 28 9 6 1 4 8 - 11 15 -Savings and thrift plans---------------------------------- 3. 6 3. 8 100 9 22 23 13 5 5 23
1 Less than 0. 05 percent.2 Data do not meet publication criteria.3 Includes other legally required insurance programs, principally State temporary disability insurance, not presented separately.
NOTE: Because of rounding, sums of individual items may not equal totals.
CD
Digitized for FRASER http://fraser.stlouisfed.org/ Federal Reserve Bank of St. Louis
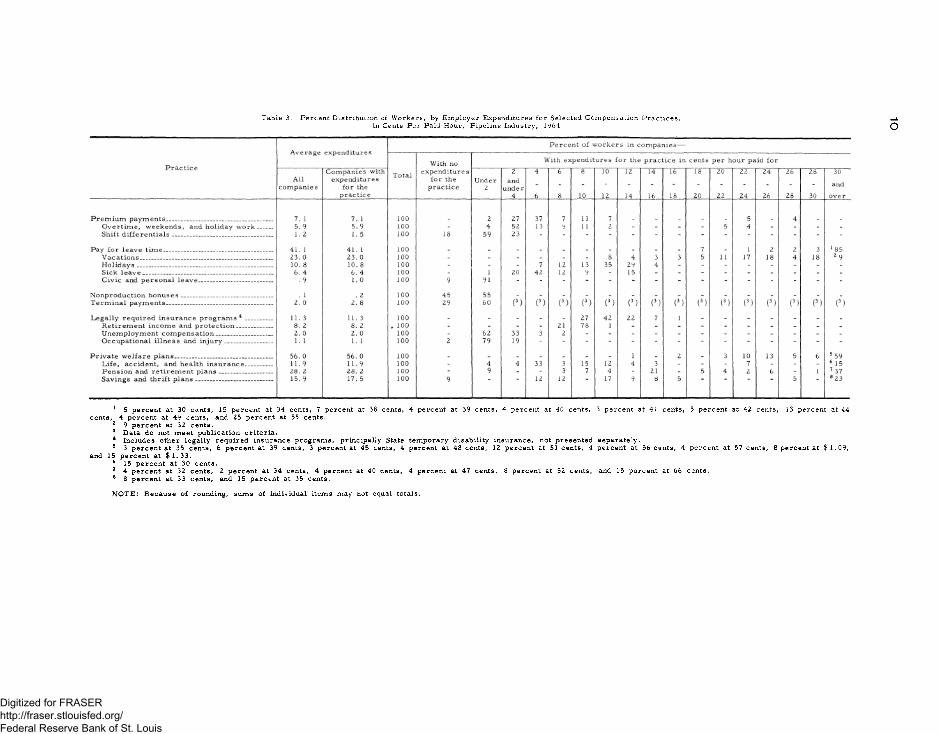
Table 3. Percent D istribution of W ork ers, by E m p loyer Expenditures for Selected C om pensation P ra ctices ,in Cents Per Paid Hour, Pipeline Industry, 1964
1 5 percent at 30 cents, 15 percent at 34 cents, 7 percent at 38 cents, 4 percent at 39 cents, 4 percent at 40 cents, 3 percent at 41 cents, 5 percent at 42 cents, 13 percent at 44 cents, 4 percent at 49 cents, and 25 percent at 55 cents.
2 9 percent at 32 cents.3 Data do not meet publication criteria.4 Includes other legally required insurance programs, principally State temporary disability insurance, not presented separately.5 3 percent at 35 cents, 6 percent at 39 cents, 3 percent at 45 cents, 4 percent at 48 cents, 12 percent at 51 cents, 4 percent at 56 cents, 4 percent at 57 cents, 8 percent at $ 1 .0 9 ,
and 15 percent at $ 1 .3 3 .6 15 percent at 30 cents.7 4 percent at 32 cents, 2 percent at 34 cents, 4 percent at 40 cents, 4 percent at 47 cents, 8 percent at 52 cents, and 15 percent at 66 cents.8 8 percent at 33 cents, and 15 percent at 35 cents.
NOTE: Because of rounding, sums of individual items may not equal totals.
Digitized for FRASER http://fraser.stlouisfed.org/ Federal Reserve Bank of St. Louis

Appendix A. Expenditures as Proportions of Payroll
In the body of the text, all supplements have been measured as a proportion of total compensation. This approach allows one to examine the level and structure of compensation expenditures. However, for some purposes, it may be desirable to examine expenditures for pay supplements in different ways. Two of the techniques often used are to express these outlays as percentages of gross or of straight-time payroll. 16 The first appendix table expresses supplementary expenditures in these terms. The second shows the percent distribution of workers by employer expenditures for particular supplements as a percent of gross payroll. It should be noted that the supplements when measured as a percent of gross or straight-time payroll cannot be added to other payroll statistics since some supplements are part of payroll while others are in addition to payroll. The appendix tables permit comparison of expenditures in the pipeline industry with similar statistics published by BLS in prior years for other industries.
16 Straight-time pay is derived by subtracting overtime, weekend, holiday, and shift premiums from gross payroll.
11
Digitized for FRASER http://fraser.stlouisfed.org/ Federal Reserve Bank of St. Louis
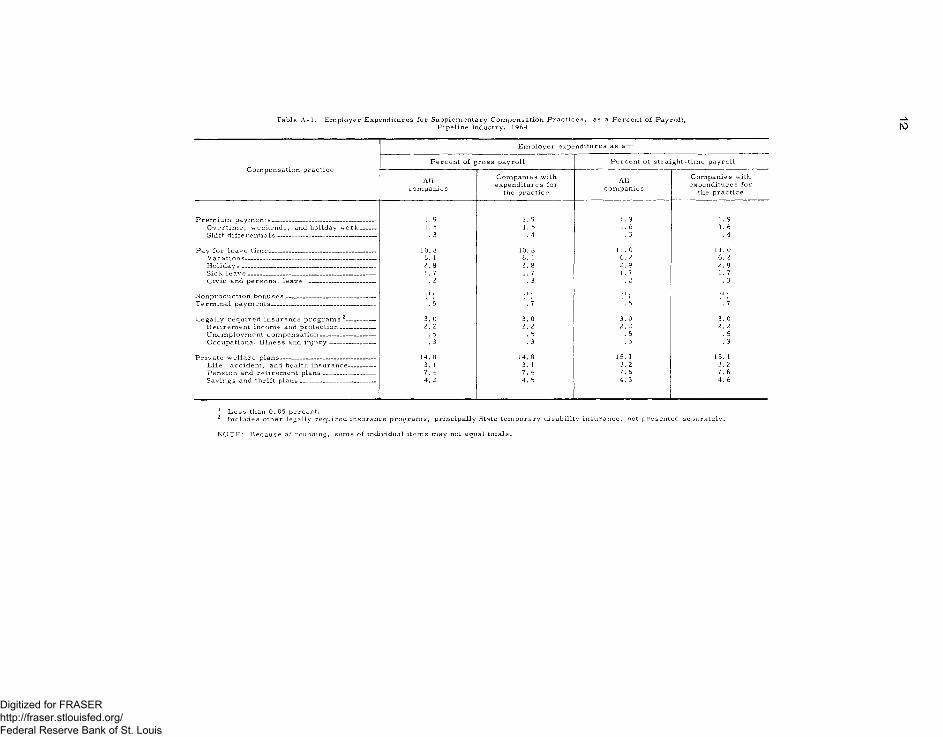
Table A - 1. Em ployer Expenditures for Supplem entary C om pensation P ra c tic es , as a P ercen t of P ayroll,P ipeline Industry, 1964 N)
Employer expenditures as a—
Compensation practicePercent of gross payroll Percent of straight-time payroll
Allcompanies
Companies with expenditures for
the practiceAll
companiesCompanies with expenditures for
the practice
Premium payments----------------------------------------------- 1.9 1.9 1.9 1.9Overtime, weekends, and holiday work------- 1. 5 1. 5 1.6 1.6Shift differentials--------------------------------------------- . 3 . 4 . 3 . 4
Pay for leave time________________________________ 10. 8 10. 8 11.0 11.0Vacations----------------------------------------------------------- 6. 1 6. 1 6. 2 6. 2Holidays_____________________ __________________ 2. 8 2. 8 2. 9 2 .9Sick leave______________________________________ 1.7 1.7 1.7 1.7Civic and personal leave ____________________ . 2 . 3 . 2 . 3
Nonproduction bonuses----------------------------------------- ( M C ) ( M ( MTerminal payments_______________________________ . 5 . 7 . 5 . 7
Legally required insurance program s2------------- 3. 0 3. 0 3. 0 3. 0Retirement income and protection---- ------------ 2. 2 2. 2 2 .2 2. 2Unemployment compensation------------------------- . 5 . 5 . 5 . 5Occupational illness and injury--------------------- . 3 . 3 . 3 . 3
Private welfare plans------------------------------------------- 14. 8 14. 8 15. 1 15. 1Life, accident, and health insurance------------ 3. 1 3. 1 3. 2 3. 2Pension and retirement plans------------------------ 7 .4 7. 4 7 .6 7. 6Savings and thrift plans______________________ 4. 2 4. 5 4. 3 4. 6
1 Less than 0.05 percent.2 Includes other legally required insurance programs, principally State temporary disability insurance, not presented separately.
NOTE: Because of rounding, sums of individual items may not equal totals.
Digitized for FRASER http://fraser.stlouisfed.org/ Federal Reserve Bank of St. Louis
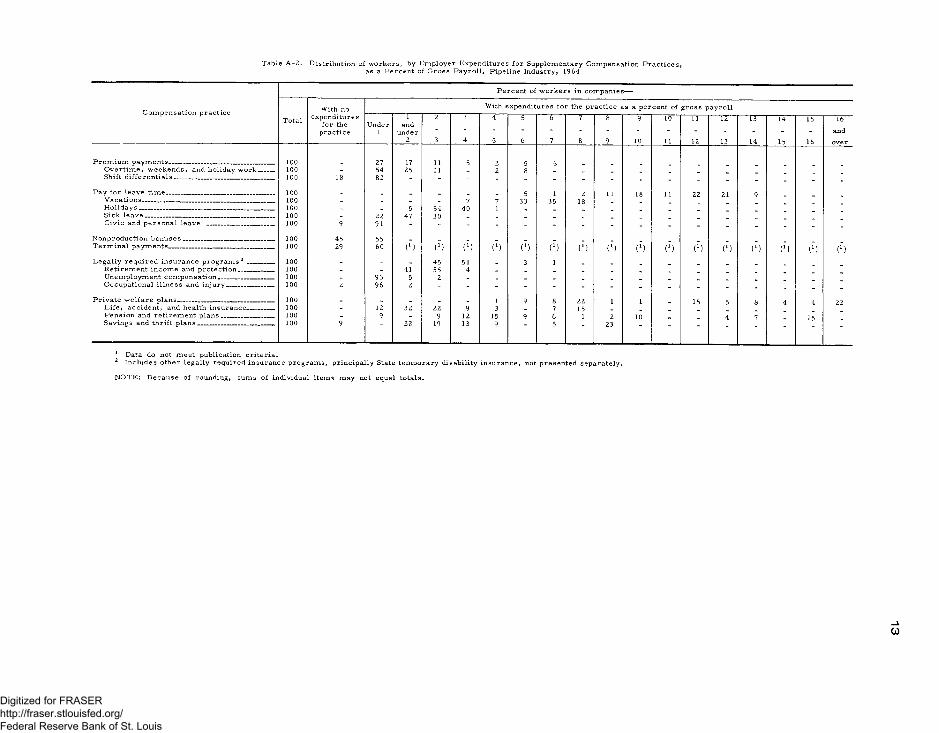
Table A -2 . D istribution of w ork ers, by E m ployer Expenditures for Supplem entary Com pensation P r a c tic e s ,as a P ercen t of G ro ss P a y ro ll, P ipeline Industry, 1964
Compensation practice
Percent of workers in companies—
TotalWith no
expenditures for the
practice
With expenditures for the practice as a percent of gross payroll
Under1
1and
under2
2
3
3
4
4
5
5
6
6
7
7
8
8
9
9
10
10
11
11
12
12
13
13
14
14
15
15
16
16
andover
Premium payments________________________________ 100 27 47 11 5 2 54
Overtime, weekends, and holiday work_____ 100 - 54 25 11 _ 2 8 _ _ _ _Shift differentials______________________________ 100 18 82 - - - - - - - - - - - - - - - -
Pay for leave time________________ ________ ____ 100 _ _ _ _ 5 1 2 11 18 11 22 21 9Vacations 100 - - - - 7 7 33 35 18 _ _Holidays _ 100 - _ 5 54 40 1 _ _ _ _ _ _Sick leave _ ..... 100 _ 22 47 30 _ _ _ _ _ _Civic and personal leave ____________________ 100 9 91 - - - - - - - - - - - - - - - -
Nonproduction bonuses 100 45 55 . _Terminal payments _ _ 100 29 60 ( M ( ’ ) (M (X) (X) (7) (X) (X) (X) (r) (X) ( M (M (M t1") (l")Legally required insurance programs 2 ________ 100 _ _ _ 45 51 _ 3 1
Retirement income and protection______ __ 100 - - 41 55 4 _ _ _ _ _ _ _ _Unemployment compensation_________________ 100 - 93 5 2 _ _ _ _ _ _ _ _ _Occupational illness and injury______________ 100 2 96 2 - - - - - - - - - - - - - -
Private welfare plans__________________________ _ 100 _ _ _ _ _ 1 9 8 22 1 1 15 5 8 4 4 22Life, accident, and health insurance________ 100 - 12 32 22 9 3 _ 7 15 _Pension and retirement p la n s _____ ____ 100 - 9 - 9 12 15 9 6 1 2 10 _ _ 4 7 15Savings and thrift plans _ 100 9 22 19 13 9 5 23
' '- “
1 Data do not meet publication criteria.2 Includes other legally required insurance programs, principally State temporary disability insurance, not presented separately.
NOTE: Because of rounding, sums of individual items may not equal totals.
Digitized for FRASER http://fraser.stlouisfed.org/ Federal Reserve Bank of St. Louis

Digitized for FRASER http://fraser.stlouisfed.org/ Federal Reserve Bank of St. Louis
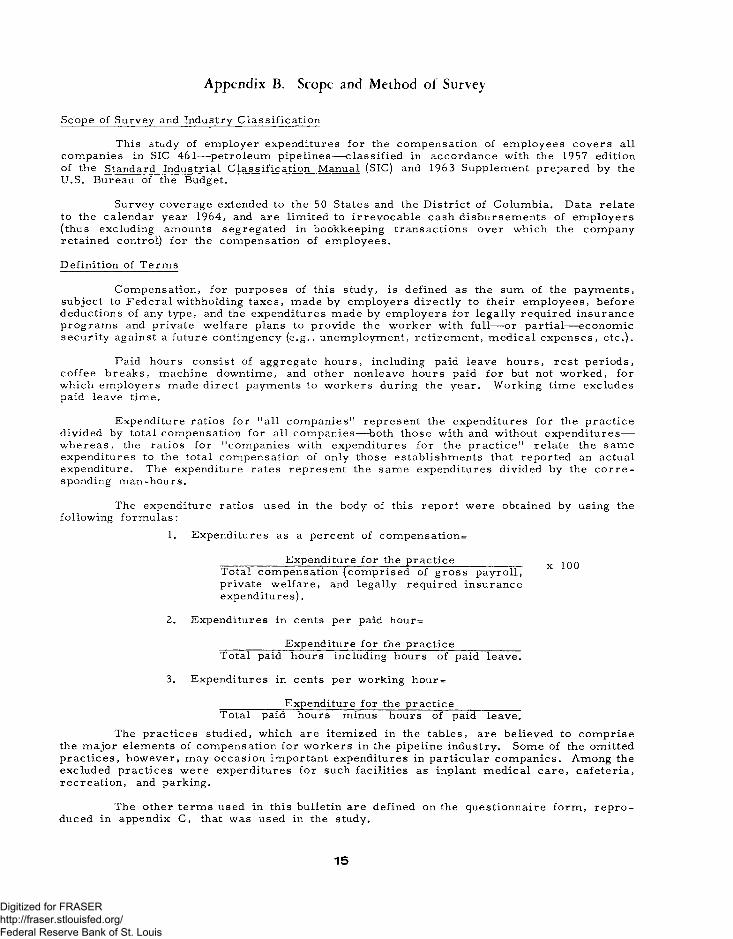
Appendix B. Scope and Method of Survey
Scope of Survey and Industry Classification
This study of employer expenditures for the compensation of employees covers all companies in SIC 461— petroleum pipelines— classified in accordance with the 1957 edition of the Standard Industrial Classification Manual (SIC) and 1963 Supplement prepared by the U.S. Bureau of the Budget.
Survey coverage extended to the 50 States and the District of Columbia. Data relate to the calendar year 1964, and are limited to irrevocable cash disbursements of employers (thus excluding amounts segregated in bookkeeping transactions over which the company retained control) for the compensation of employees.
Definition of Terms
Compensation, for purposes of this study, is defined as the sum of the payments, subject to Federal withholding taxes, made by employers directly to their employees, before deductions of any type, and the expenditures made by employers for legally required insurance programs and private welfare plans to provide the worker with full— or partial— economic security against a future contingency (e.g., unemployment, retirement, medical expenses, etc.).
Paid hours consist of aggregate hours, including paid leave hours, rest periods, coffee breaks, machine downtime, and other nonleave hours paid for but not worked, for which employers made direct payments to workers during the year. Working time excludes paid leave time.
Expenditure ratios for "a ll companies" represent the expenditures for the practice divided by total compensation for all companies— both those with and without expenditures— whereas, the ratios for "companies with expenditures for the practice" relate the same expenditures to the total compensation of only those establishments that reported an actual expenditure. The expenditure rates represent the same expenditures divided by the corresponding man-hours.
The expenditure ratios used in the body of this report were obtained by using the following formulas:
1. Expenditures as a percent of compensation =
Expenditure for the practice x jqqTotal compensation (comprised of gross payroll, private welfare, and legally required insurance expenditures).
2. Expenditures in cents per paid hour =
____________Expenditure for the practice____________Total paid hours including hours of paid leave.
3. Expenditures in cents per working hour =
____________ Expenditure for the practice____________Total paid hours minus hours of paid leave.
The practices studied, which are itemized in the tables, are believed to comprise the major elements of compensation for workers in the pipeline industry. Some of the omitted practices, however, may occasion important expenditures in particular companies. Among the excluded practices were expenditures for such facilities as inplant medical care, cafeteria, recreation, and parking.
The other terms used in this bulletin are defined on the questionnaire form, reproduced in appendix C, that was used in the study.
15
Digitized for FRASER http://fraser.stlouisfed.org/ Federal Reserve Bank of St. Louis
16
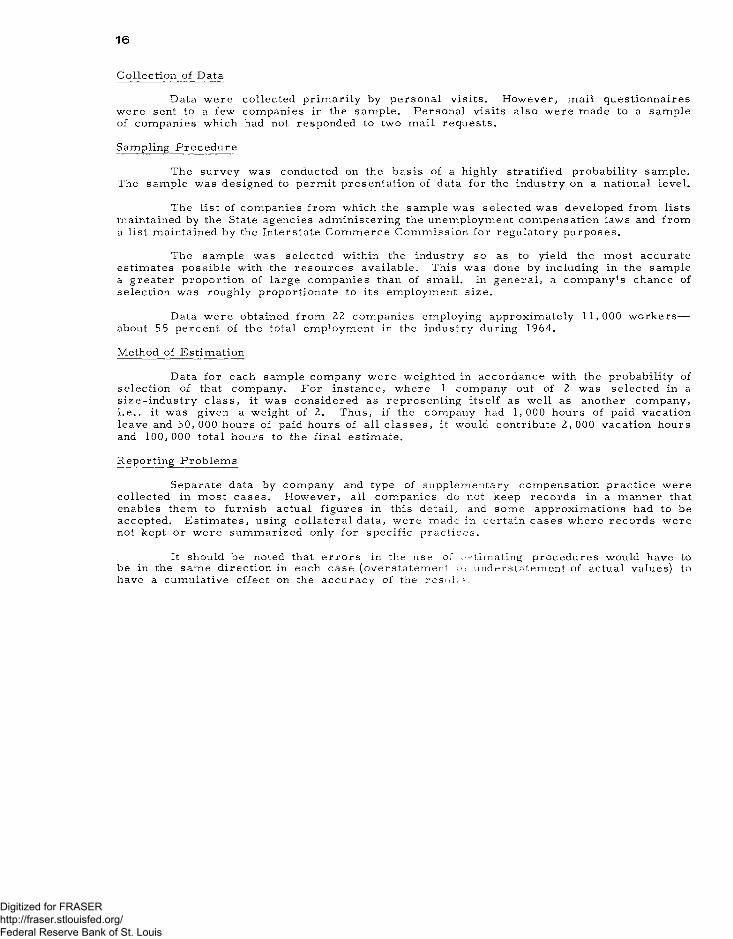
Collection of Data
Data were collected primarily by personal visits. However, mail questionnaires were sent to a few companies in the sample. Personal visits also were made to a sample of companies which had not responded to two mail requests.
Sampling Procedure
The survey was conducted on the basis of a highly stratified probability sample. The sample was designed to permit presentation of data for the industry on a national level.
The list of companies from which the sample was selected was developed from lists maintained by the State agencies administering the unemployment compensation laws and from a list maintained by the Interstate Commerce Commission for regulatory purposes.
The sample was selected within the industry so as to yield the most accurate estimates possible with the resources available. This was done by including in the sample a greater proportion of large companies than of small. In general, a company's chance of selection was roughly proportionate to its employment size.
Data were obtained from ZZ companies employing approximately 1 1,000 workers— about 5 5 percent of the total employment in the industry during 1964.
Method of Estimation
Data for each sample company were weighted in accordance with the probability of selection of that company. For instance, where 1 company out of Z was selected in a size-industry class, it was considered as representing itself as well as another company, i.e ., it was given a weight of Z. Thus, if the company had 1,000 hours of paid vacation leave and 50,000 hours of paid hours of all classes, it would contribute Z, 000 vacation hours and 100, 000 total hours to the final estimate.
Reporting Problems
Separate data by company and type of supplementary compensation practice were collected in most cases. However, all companies do not keep records in a manner that enables them to furnish actual figures in this detail, and some approximations had to be accepted. Estimates, using collateral data, were made in certain cases where records were not kept or were summarized only for specific practices.
It should be noted that errors in the use of estimating procedures would have to be in the same direction in each case (overstatement o r understatement of actual values) to have a cumulative effect on the accuracy of the r e s u l t s ,
Digitized for FRASER http://fraser.stlouisfed.org/ Federal Reserve Bank of St. Louis

Appendix C. Questionnaire
BLS 2863U.S. DEPARTMENT OF LABOR
BUREAU OF LABOR STATISTICSW ashington , D.C. 20212
Budget Bureau No. 44*6542 Approval expires 6-30-66
Employer Expenditures for Selected Compensation Practices in Transportation Industries, 1964
Company IdentificationO
Your reply will be held in confidence.
This report should cover all units of the company which are primarily engaged in transportation activities, and should not be limited to activities at the address shown. If the company was engaged in two or more substantially different transportation activities, e. g . , oil tanker and pipeline operations, separate reports should be submitted.
1. Principal Transportation Activity
(Check only one box)
A. | 1 Intercity bus lineB. [ 1 Local or suburban transitC. 1 1 Taxicab operatorD. | | Deep sea foreign transportationE. | | Other water transportation
F. [ 1 Marine cargo handlingG. | 1 Air transportation, certifi
cated carrierH. | | Pipelines, except natural gas
i. □ Other (specify) ______________
2. Employment
For each employee category, enter the total number of full- and part-time employees on the payroll who worked or received pay for any part of the payroll period which included September 12, 1964. Include officers of corporations, but exclude proprietors and partners of unincorporated xirms. Also exclude pensioners and members of the Armed Forces on active duty carried on the rolls but not working during the period. (Definitions of the terms "operating" and "nonoperating" employees are on page 2 of this questionnaire. If there were no workers in one of the employee categories, enter "n one.")
EmploymentOperating employees---------------------- -----------------------Nonoperating employees__________ _______________
For BLS use onlySchedulenumber Reg. State City
size SIC Est.size Weight Special
char.
17
Digitized for FRASER http://fraser.stlouisfed.org/ Federal Reserve Bank of St. Louis
18
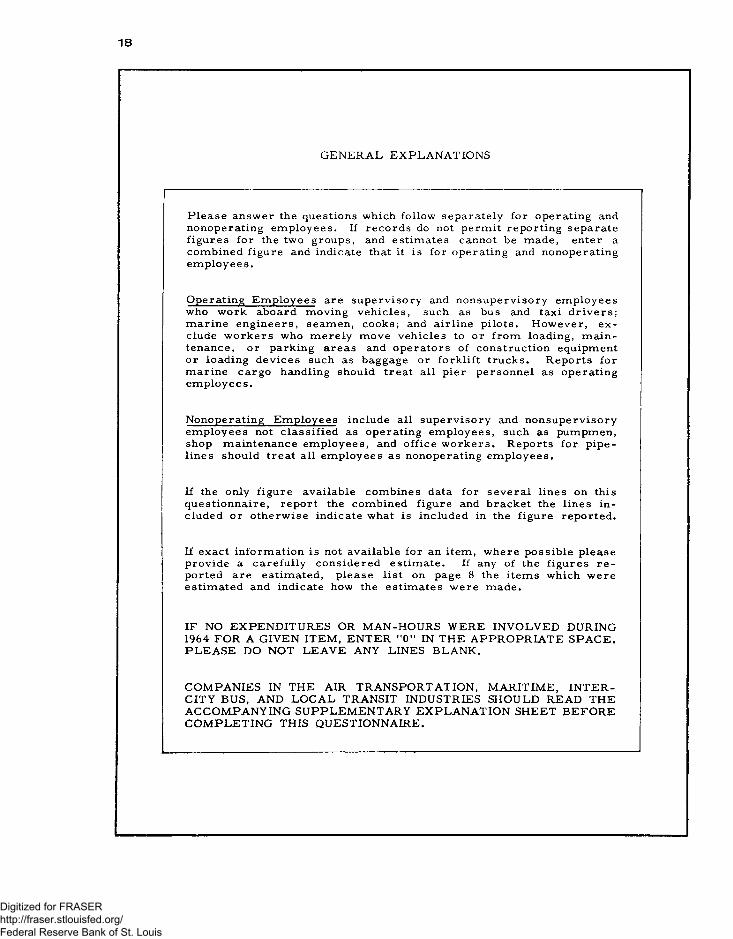
GENERAL EXPLANATIONS
Please answer the questions which follow separately for operating and nonoperating employees. If records do not permit reporting separate figures for the two groups, and estimates cannot be made, enter a combined figure and indicate that it is for operating and nonoperating employees.
Operating Employees are supervisory and nonsupervisory employees who work aboard moving vehicles, such as bus and taxi drivers; marine engineers, seamen, cooks; and airline pilots. However, exclude workers who merely move vehicles to or from loading, maintenance, or parking areas and operators of construction equipment or loading devices such as baggage or forklift trucks. Reports for marine cargo handling should treat all pier personnel as operating employees.
Nonoperating Employees include all supervisory and nonsupervisory employees not classified as operating employees, such as pumpmen, shop maintenance employees, and office workers. Reports for pipelines should treat all employees as nonoperating employees.
If the only figure available combines data for several lines on this questionnaire, report the combined figure and bracket the lines included or otherwise indicate what is included in the figure reported.
If exact information is not available for an item, where possible please provide a carefully considered estimate. If any of the figures reported are estimated, please list on page 8 the items which were estimated and indicate how the estimates were made.
IF NO EXPENDITURES OR MAN-HOURS WERE INVOLVED DURING 1964 FOR A GIVEN ITEM, ENTER "0 " IN THE APPROPRIATE SPACE. PLEASE DO NOT LEAVE ANY LINES BLANK.
COMPANIES IN THE AIR TRANSPORTATION, MARITIME, INTERCITY BUS, AND LOCAL TRANSIT INDUSTRIES SHOULD READ THE ACCOMPANYING SUPPLEMENTARY EXPLANATION SHEET BEFORE COMPLETING THIS QUESTIONNAIRE.
Digitized for FRASER http://fraser.stlouisfed.org/ Federal Reserve Bank of St. Louis

19
3. Payments Made Directly to Employees as Part of the Payroll in 1964
In this section report only payments which were part of the company's 1964 gross payroll. Include only payments to employees as defined in Item 2. Do not report payments to funds, trustees, insurance companies, or government agencies; these payments should be reported in Item 5.A.
B.
C.
Gross Payroll:Enter total employee earnings during 1964, before deductions. This amount should equal the sum of the figures shown on individual employees' W -2 forms under the heading "Total Wages Paid" --------------------------------------------------------------
Paid Leave:Enter total amounts paid directly to employees for each type of leave. Include payments under formal plans and informal salary continuation plans. If employees worked on paid holidays or during vacations and received both pay instead of time off and pay for work performed, include here only the pay in lieu of time off.1. Vacations---------------------------------------------------------------2. Holidays----------------------------------------------------------------3. Sick leave--------------------------------------------------------------4. Military, jury, witness, voting, and personal
leave (excluding pay for serving as a witness for the employer)-------------------------------------------------
Premiums Above Regular Pay:1. Premium pay for overtime, weekend, and
holiday work.Enter total payments above the regular straight-time pay for work performed. For example, if overtime is paid for at time and one-half, report only the half-time here.For work on holidays, exclude pay at the regular rate for work performed and pay in lieu of time off; report only payments above these sums (that is, if total pay for holiday work is double time and one-half, include only the half-time pay here)-------------------------------
2. Shift differentials.
Enter total payments above rates for the day shift. If late-shift workers receive 8 hours' pay for l l h hours' work, compared with 8 hours' work for the day shift, report tho l /z hour's pay as a shi''t d i f ferential ------------------
Employer payments toOperatingemployees
Nonope r at lhg employees
i ..... $
LINE1
2
34
5
6
7
Digitized for FRASER http://fraser.stlouisfed.org/ Federal Reserve Bank of St. Louis
20
D.
E.
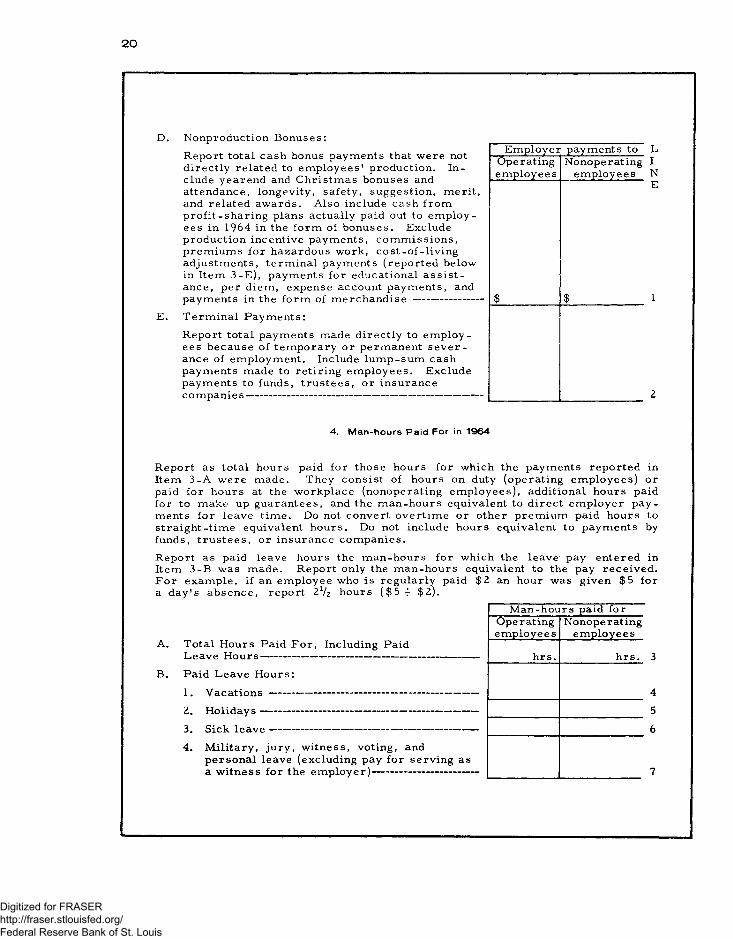
Nonproduction Bonuses:Report total cash bonus payments that were not directly related to employees1 production. Include yearend and Christmas bonuses and attendance, longevity, safety, suggestion, merit, and related awards. Also include cash from profit-sharing plans actually paid out to employees in 1964 in the form of bonuses. Exclude production incentive payments, commissions, premiums for hazardous work, cost-of-living adjustments, terminal payments (reported below in Item 3-E), payments for educational assistance, per diem, expense account payments, and payments in the form of merchandise -------------------Terminal Payments:Report total payments made directly to employees because of temporary or permanent severance of employment. Include lump-sum cash payments made to retiring employees. Exclude payments to funds, trustees, or insurance companies------------------------------------------------------------------
Employer payments toOperating Nonoperatingemployees employees
$ $
LINE
1
2
4. Man-hours Paid For in 1964
Report as total hours paid for those hours for which the payments reported in Item 3-A were made. They consist of hours on duty (operating employees) or paid for hours at the workplace (nonoperating employees), additional hours paid for to make up guarantees, and the man-hours equivalent to direct employer payments for leave time. Do not convert overtime or other premium paid hours to straight-time equivalent hours. Do not include hours equivalent to payments by funds, trustees, or insurance companies.Report as paid leave hours the man-hours for which the leave pay entered in Item 3-B was made. Report only the man-hours equivalent to the pay received. For example, if an employee who is regularly paid $ 2 an hour was given $5 for a day's absence, report 2 V2 hours ($5 4- $2).
A. Total Hours Paid For, Including PaidLeave Hours--------------------------------------------------------------
Man-hours paid forOperatingemployees
Nonoperatingemployees
hrs. hrs.B. Paid Leave Hours:
1. Vacations-----------------------------------------------------------
3. Sick leave------------------------------------------------------ -----4. Military, jury, witness, voting, and
personal leave (excluding pay for serving as a witness for the employer)------------------------------
Digitized for FRASER http://fraser.stlouisfed.org/ Federal Reserve Bank of St. Louis

21
5. Employer Expenditures in Addition to Payroll in 1964
A. Private Welfare Plans:Enter total employer expenditures for the plans listed below. Exclude employee contributions, employer payments already reported as payroll expenditures, those for legally required programs, and administrative costs (including actuarial and legal expenses) incurred by the company. Include payments to funds, trustees, insurance companies, employees or their beneficiaries, and to plans financed through profit sharing. However, exclude payments made by funds, trustees, or insurance companies and income earned by funds. For payments to insurance carriers report only net expenditures (i. e. , premiums less refunds). Include payments for current employees, employees on layoff status, retired employees, and dependents of these employee groups.1. Health, accident, and life insurance.
Enter payments for life insurance; accidental death and dismemberment insurance; death benefits; travel accident insurance; hospitalization, surgical, medical, major medical, dental, optical, and drug plans; and sickness and accident (wage and salary continuance) insurance. Exclude expenditures for in-plant medical facilities------- — — ----
Employer J- expenditures for I
Operatingemployees
Nonoperating N employees E
$ $ 12. Pension and retirement plans.
Include direct payments to pensioners under a pay-as-you-go plan. For funded plans, report payments in 1964 for past and current service liabilities. Include payments under profit-sharing plans deferred until retirement and payments for disability retirement program s----------------------------- 2
3. Vacation and holiday funds------------------------------ 34. Severance or dismissal pay funds and/or
supplemental unemployment benefit funds---- 45. Savings and thrift plans (including company
expenditures for contributions in the form of stock)________________________________________ 5
6. Automation funds.Report here payments to special automation funds. Do not include these payments else- where on the questionnaire. For example, if an automation fund provides retirement benefits, report the payment to the fund here and not in Item 5 - A - 2, above. (However, do not report regular payments to a retirement fund h ere .) Specify the name of the automation fund and the benefit provided. 6
7. Other (specify) 7
Digitized for FRASER http://fraser.stlouisfed.org/ Federal Reserve Bank of St. Louis
22
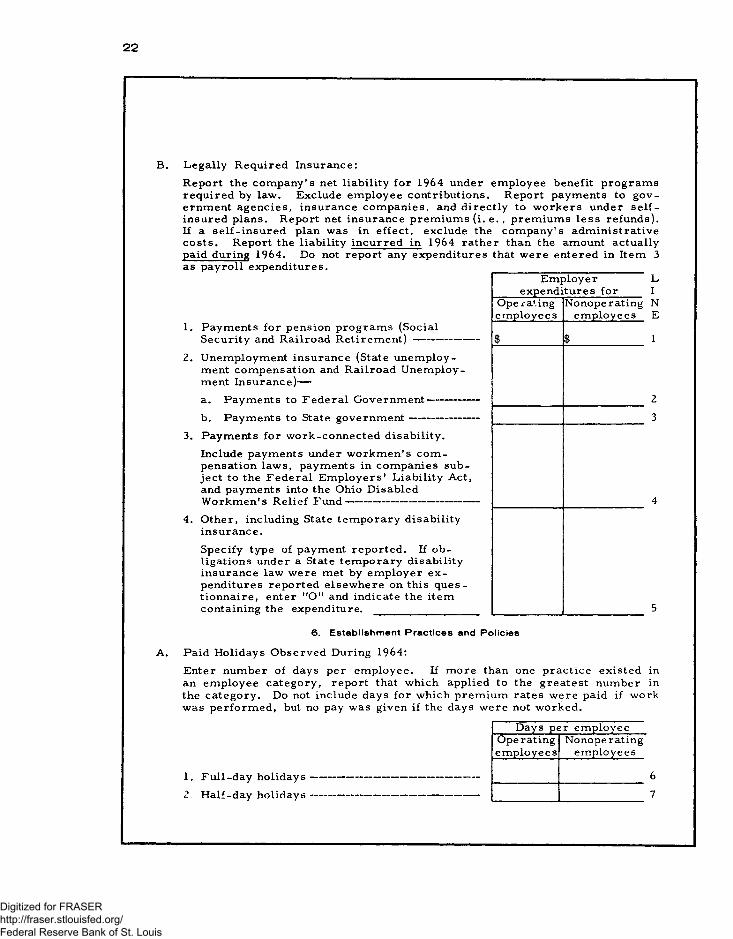
B. Legally Required Insurance:Report the company's net liability for 1964 under employee benefit programs required by law. Exclude employee contributions. Report payments to government agencies, insurance companies, and directly to workers under self- insured plans. Report net insurance premiums (i. e. , premiums less refunds). If a self-insured plan was in effect, exclude the company's administrative costs. Report the liability incurred in 1964 rather than the amount actually paid during 1964. Do not report any expenditures that were entered in Item 3 as payroll expenditures.
L I N E
1. Payments for pension programs (SocialSecurity and Railroad Retirement)-----------------
2. Unemployment insurance (State unemployment compensation and Railroad Unemployment Insurance)—a. Payments to Federal Government--------------b. Payments to State government-------------------
3. Payments for work-connected disability.Include payments under workmen's compensation laws, payments in companies subject to the Federal Employers' Liability Act, and payments into the Ohio Disabled Workmen's Relief Fund-------------------------------------
4. Other, including State temporary disability insurance.Specify type of payment reported. If obligations under a State temporary disability insurance law were met by employer expenditures reported elsewhere on this questionnaire, enter "O " and indicate the item containing the expenditure. ___________________
Employer expenditures for
Opex-atingemployees
Nonoperatingemployees
$ $
6. Establishment Practices and Policies
A. Paid Holidays Observed During 1964:Enter number of days per employee. If more than one practice existed in an employee category, report that which applied to the greatest number in the category. Do not include days for which premium rates were paid if work was performed, but no pay was given if the days were not worked.
1. Full-day holidays-----------------------------------------2 Half-day holidays-----------------------------------------
Days per employeeOperatingemployees
Nonoperatingemployees
Digitized for FRASER http://fraser.stlouisfed.org/ Federal Reserve Bank of St. Louis
23
B. Paid Vac ation s:
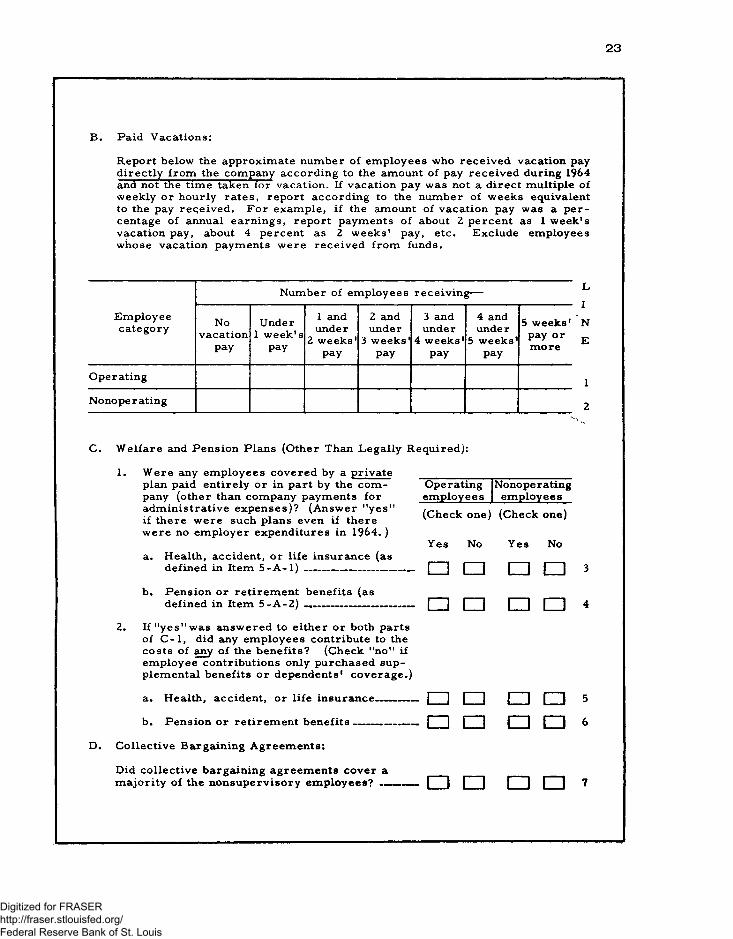
Report below the approximate number of employees who received vacation pay directly from the company according to the amount of pay received during 1964 and not the time taken for vacation. If vacation pay was not a direct multiple of weekly or hourly rates, report according to the number of weeks equivalent to the pay reqeived. For example, if the amount of vacation pay was a percentage of annual earnings, report payments of about 2 percent as 1 week's vacation pay, about 4 percent as 2 weeks' pay, etc. Exclude employees whose vacation payments were received from funds.
Number of employees receiving—
Employeecategory No
vacationpay
Under 1 week's
pay
1 and under
2 weeks' pay
2 and under
3 weeks' pay
3 and under
4 weeks* pay
4 and under
5 weeks' pay
5 weeks' pay or more
Operating
Nonoperating
L1NE
1
2
C. Welfare and Pension Plans (Other Than Legally Required):
1. Were any employees covered by a private plan paid entirely or in part by the company (other than company payments for administrative expenses)? (Answer "y e s " if there were such plans even if there were no employer expenditures in 1964.)
a. Health, accident, or life insurance (asdefined in Item 5 - A - l ) __-______________
b. Pension or retirement benefits (asdefined in Item 5 - A - 2) _______________. . .
Operating Nonoperating employees employees(Check one) (Check one)
Yes No Yes No
□ □ □ □ 3
□ □ □ □ 4
2. If "y e s " was answered to either or both parts of C - l , did any employees contribute to the costs of any of the benefits? (Check "no" if employee contributions only purchased supplemental benefits or dependents1 coverage.)
a.
b.
Health, accident, or life insurance________
Pension or retirement benefits ___________ _
□□
□□
□ □ 5
□ □ 6D. Collective Bargaining Agreements:
Did collective bargaining agreements cover a ___ _ ___ _majority of the nonsupervisory employees? .. — □ □ □ □ 7
Digitized for FRASER http://fraser.stlouisfed.org/ Federal Reserve Bank of St. Louis
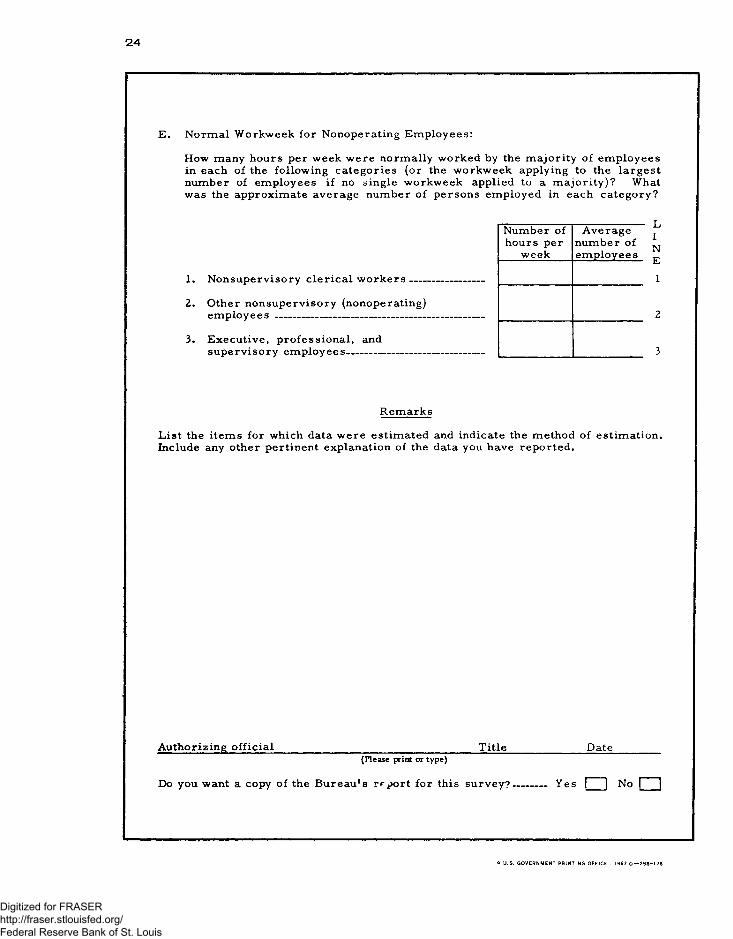
24
E. Normal Workweek for Nonoperating Employees:
How many hours per week were normally worked by the majority of employees in each of the following categories (or the workweek applying to the largest number of employees if no single workweek applied to a majority)? What was the approximate average number of persons employed in each category?
1. Nonsupervisory clerical workers-----
2. Other nonsupervisory (nonoperating)employees -------------------------------------------
3. Executive, professional, andsupervisory employees-----------------------
Number of hours per
week
Average number of employees
Remarks
L»ist the items for which data were estimated and indicate the method of estimation. Include any other pertinent explanation of the data you have reported.
Authorizing official ______________________ Title_______________Date(Please print or type)
Do you want a copy of the Bureau*s rrport for this survey? Yes □ No □
* U.S. GOVERNMENT PRINTING OFFICE : 1967 0-258-176
w z
Digitized for FRASER http://fraser.stlouisfed.org/ Federal Reserve Bank of St. Louis
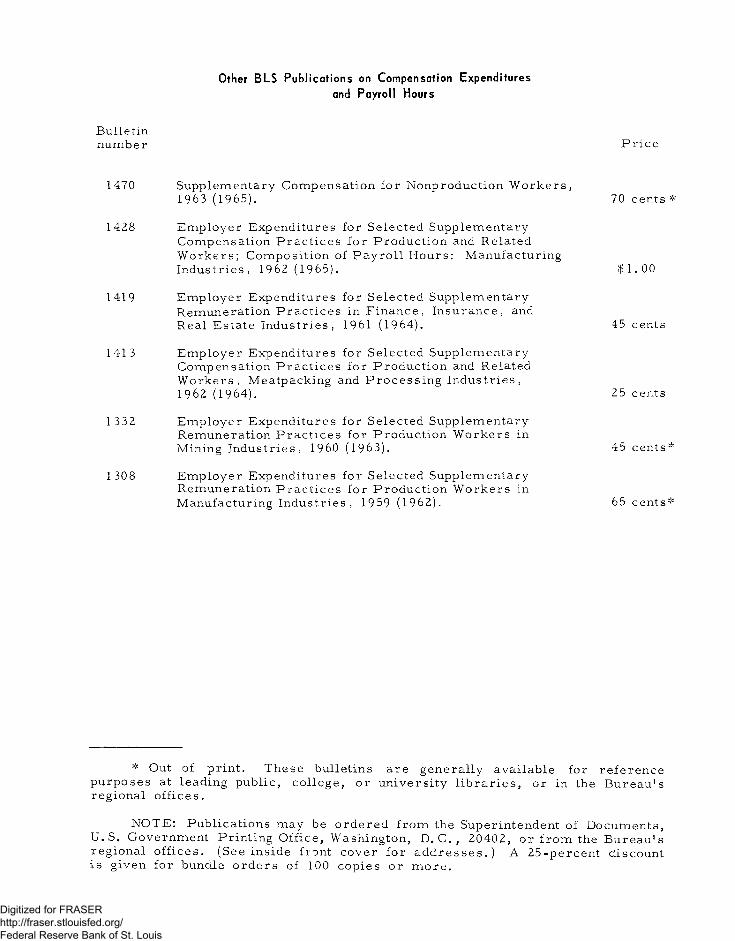
Other BLS Publications on Compensation Expenditures and Payroll Hours
Bu l le t i nn u m b e r P r i c e
1470 S u p p l e m e n t a r y C o m p e n s a t i o n f o r N o n p ro d u c t i o n W o r k e r s ,1963 (1965) . 70 c e n t s *
1428 E m p l o y e r E x p e n d i t u r e s for S e l e c t e d S u p p l e m e n t a r yC o m p e n s a t i o n P r a c t i c e s f o r P r o d u c t i o n and R e l a t e d W o r k e r s ; C o m p o s i t i o n of P a y r o l l H o u r s : M a n u f a c t u r i n gI n d u s t r i e s , 1962 (1965) .
1419 E m p l o y e r E x p e n d i t u r e s fo r S e l e c t e d S u p p l e m e n t a r yR e m u n e r a t i o n P r a c t i c e s in F i n a n c e , I n s u r a n c e , and R e a l E s t a t e I n d u s t r i e s , 1961 (1964) .
1413 E m p l o y e r E x p e n d i t u r e s f o r S e l e c t e d S u p p l e m e n t a r yC o m p e n s a t i o n P r a c t i c e s fo r P r o d u c t i o n and R e l a t e d W o r k e r s , M e a t p a c k i n g and P r o c e s s i n g I n d u s t r i e s ,1962 (1964) .
1 332 E m p l o y e r E x p e n d i t u r e s fo r S e l e c t e d S u p p l e m e n t a r yR e m u n e r a t i o n P r a c t i c e s fo r P r o d u c t i o n W o r k e r s in Mining I n d u s t r i e s , I960 (1963).
1 308 E m p l o y e r E x p e n d i t u r e s f o r S e l e c t e d S u p p l e m e n t a r yR e m u n e r a t i o n P r a c t i c e s f o r P r o d u c t i o n W o r k e r s in M a n u f a c t u r i n g I n d u s t r i e s , 19^9 (1962).
$ 1 . 0 0
45 ce nts
25 ce nts
45 ce nts *
65 c e n t s *
* Out of p r in t . T h e s e b u l l e t in s a r e g e n e r a l l y a v a i l a b l e fo r r e f e r e n c e p u r p o s e s at l e a d in g p u b l i c , c o l l e g e , o r u n i v e r s i t y l i b r a r i e s , o r in the B u r e a u ’ s r e g i o n a l o f f i c e s .
N O T E : P u b l i c a t i o n s m a y be o r d e r e d f r o m the S u p e r i n te n d en t of D o c u m e n t s , U . S . G o v e r n m e n t P r in t in g O ff i ce , Washin gto n, D. C. , 20402, o r f r o m the B u r e a u ’ s r e g i o n a l o f f i c e s . (S e e i n s i d e f ront c o v e r f o r a d d r e s s e s . ) A 2 5 - p e r c e n t d i s co u n t i s g iv en fo r bundle o r d e r s of 100 c o p i e s o r m o r e .
Digitized for FRASER http://fraser.stlouisfed.org/ Federal Reserve Bank of St. Louis