bls_1862_1975.pdf
TRANSCRIPT

Industry Wage Survey: BankingAugust - November 1973
Digitized for FRASER http://fraser.stlouisfed.org/ Federal Reserve Bank of St. Louis

Industry Wage Survey: BankingAugust - November 1973U.S. Department of Labor John T. Dunlop, SecretaryBureau of Labor Statistics Julius Shiskin, Commissioner 1975
Bulletin 1862
For sale by the Superintendent of Documents, U.S. Government Printing Office Washington, D.C. 20402 - Price $1.25
Stock Number 029-001-01402-3
Digitized for FRASER http://fraser.stlouisfed.org/ Federal Reserve Bank of St. Louis

Digitized for FRASER http://fraser.stlouisfed.org/ Federal Reserve Bank of St. Louis

Preface
This report sum m arizes the results o f a Bureau o f L abor Statistics survey o f wages and supplem entary benefits in com m ercia l and savings banks in 28 m e tro politan areas in August—N ovem ber 1973. Separate re lea ses fo r each of the areas included in the survey w ere issued e a r lie r . Copies o f these re lea ses are available from the Bureau o f Labor Statistics, Washington, D .C . 20212, o r any of its regional o ff ic e s .
This study was conducted in the Bureau1 s O ffice o f W ages and Industrial R elations. Philip M. Doyle o f the D ivision of O ccupational Wage Structures prepared the analysis in this bulletin. F ield work fo r the survey was d irected by the B ureau^ A ssocia te A ssistant Regional D irecto rs fo r O perations.
Other reports available from the Bureau1 s p r o gram of industry wage studies, as w ell as the addresses o f the B ureau!s regional o ff ic e s , are listed at the end of this bulletin.
Digitized for FRASER http://fraser.stlouisfed.org/ Federal Reserve Bank of St. Louis

Digitized for FRASER http://fraser.stlouisfed.org/ Federal Reserve Bank of St. Louis

ContentsPage
Sum m ary___________________________________________ 1Industry ch a ra c te r is t ic s _________________________________________________________________ 1
E m ploym ent___________________________________________________________________________ 1P rod u ctiv ity___________________________________________________________________________ 2Method of wage paym ent--------------------------------------------------------------------------------------------- 2U nionization___________________________________________________________________________ 2
Occupational earn in gs____________________________________________________________________ 2Establishm ent p ractices and supplem entary wage p rov is ion s________________________ 5
M inimum entrance sa la ries__________________________________________________________ 5Scheduled w eekly hours and shift p r a c t ic e s ________________________________________ 5O vertim e prem ium p a y ______________________________________________________________ 5Paid h olidays__________________________________________ 5Paid v a ca tion s_________________________________________ 5Health, insurance, and retirem ent p la n s___________________________________________ 6
Text tables:1. A verage stra ight-tim e w eekly earnings fo r selected occupations in BLS
area wage surveys as a percent of averages fo r em ployees in banks, 22 a rea s , selected yea rs____________________________________________________________ 3
2. Earnings differentials between highest and low est paid w orkers in sam ejob and establishm ent, banking industry, August—N ovem ber 1973__________ 4
R eferen ce tables:
A verage w eekly earnings:1. Selected occu p ation s________________________________________________________ 7
Occupational earnings:2. Atlanta, G a___________________________________________________________________ 133. B a ltim ore, M d ______________________________________________________________ 144. B oston, M a s s ________________________________________________________________ 155. C hicago, 111__________________________________________________________________ 166. Cincinnati, Ohio—Ky—Ind____________________________________________________ 177. D allas, T e x __________________________________________________________________ 188. D enver, C o l o ________________________________________________________________ 199. D etroit, M ich ________________________________________________________________ 20
10. H artford , C onn________ 2111. Houston, T e x ________________________________________________________________ 2212. Indianapolis, Ind_____________________________________________________________ 2313. Kansas City, M o.—K an s_____________________________________________________ 2414. Los A ngeles—Long Beach, C a lif____________________________________________ 2515. L ou isv ille , Ky.—In d _________________________________________________________ 2616. M em phis, Tenn.—A r k _______________________ 2717. M iam i, F la ___________________________________________________________________ 28
Digitized for FRASER http://fraser.stlouisfed.org/ Federal Reserve Bank of St. Louis

Contents— ContinuedPage
R eferen ce tables— ContinuedOccupational earnings— Continued
18. M ilwaukee, W is ______________________________________________________________ 2919. M inneapolis—St. Paul, M in n ________________ , ______________________________ 3020. Nassau and Suffolk Counties, N .Y ___.______ 3121. Newark, N .J _________________________ —-------------------------— --------------------------- 3222. New O rleans, La _______ 3323. New Y ork , N.Y ______________________________________________________ 3424. Philadelphia, Pa.—N .J __________________________________________________ 3525. Portland, O reg.—W a sh ________ , _______________________, _____________________ 3626. St. L ou is , M o.—I l l _____________ . _____________________ ________________,______ 3727. San F ra n cisco—Oakland, C a l i f _____________________________________________ 3828. Seattle—E verett, W a sh ________________________ 3929. Washington, D .C .—Md.—V a ___________________________________________ 40
Establishm ent p ractices and supplem entary wage prov is ion s :30. M inimum entrance sa la r ie s : Selected occu p ation s_______________________ 4131. Method of wage paym ent__________________________________ 4332. Scheduled w eekly h o u rs_____________________________________________________ 4433. O vertim e prem ium pay— w eekly o v e rtim e ,,________ 4534* O vertim e prem ium pay— daily o v e r t im e__, _______ 4635. Paid h o lid a ys ,,_________________________________________ ____________ _________ 4736. Paid v a ca tion s_____________________________ ___________-______________________ 4837. Health, insurance, and retirem ent p la n s_____________________*_________ _ 52
Appendixes:A . Scope and method of s u r v e y _______________________________________________ ____ 53B. O ccupational d e scr ip t io n s__________ , __________________ _______ , ________ _______ 56
Digitized for FRASER http://fraser.stlouisfed.org/ Federal Reserve Bank of St. Louis
Banking, August—November 1973
Sum m ary
A verage weekly earnings of co m m ercia l and savings bank em ployees varied con siderab ly both within and among 2 8 m etropolitan areas surveyed in August— N ovem ber 197301 These d ifferen ces r e fle ct the d iversity of w orker skills r e quired by the industry and variations in pay by loca lity and establishm ent, C om puter system s analysts working independently on com plex prob lem s (c la ss A) w ere usually the highest paid bank em p loyees studied in an area ; they often averaged two to three tim es as m uch as file clerks doing routine work (c la ss C), who w ere usually the low est paid. Among the 28 areas studied, average earnings fo r w orkers in the sam e occupation co m m only varied by ,30 to 50 percent. S ecretaries in New York, fo r exam ple, a v e r aged $ 169.50 a week, 46 percent m ore than their counterparts in L ouisville , who averaged $116 a week.
Note te lle rs , generally the highest paid of the five te lle r occupations studied, averaged fro m $103 a week in P hila delphia to $ 167 a week in New York. C om m ercia l-sa v in gs te lle rs , num erica lly the m ost im portant job studied, usually w ere the low est paid among the te lle rs , averaging from $99 in H artford to $132 in New York.
Paid holidays, paid vacations, and at least part of the cost of various health and insurance benefits w ere granted by banks em ploying p ra ctica lly all of the w ork ers in each area; retirem ent pension plans covered at least three-fourths of the w orkers.
Industry C h aracteristics
Em ploym ent. The 1,724 banks within the scope of the survey em ployed an e s tim ated 367, 700 nonsupervisory o ffice w orkers in August—N ovem ber 1973. E m ploym ent c o u n t s varied substantially
1 See appendix A for scope and method of survey and for definitions of terms (nonsupervisory office workers, e tc .) used in this bulletin. See footnote 1, tables 2 through 29, for definitions of areas covered. Earnings data exclude premium pay for overtime and for work on weekends, holidays, and late shifts.
among the 28 m etropolitan areas studied, ranging from few er than 4, 000 w ork ers in Cincinnati, L ou isv ille , and M em phis to nearly 93, 000 w ork ers in New York. Em ploym ent of 20, 000 w ork ers or m ore was a lso record ed in Los A ngeles—Long B each (33 ,000), Chicago (31 ,000), San F ra n cisco—Oakland (23 ,000), and P h ila delphia (20 ,000). Since a sim ilar survey in N ovem ber 1969, em ploym ent in creased in 22 of the 24 areas perm itting com p a rison s; these in creases generally w ere la rgest in Southern a r e a s , where 25- percent to 50 -percen t gains w ere c o m m only re c o rd e d .2
Women occupied about seven-eighths of the jobs covered by the survey, in cluding nearly a ll of the c le r ic a l jobs and approxim ately seven-eighths of the te lle r jo b s .3 Men w ere predom inant only in the com puter occupations, where they made up m ore than fou r-fifth s of the work fo r ce .
Although the survey was p rim a rily designed to provide occupational earnings inform ation in selected areas, shifts in occupational em ploym ent can be observed in the com bined area data fro m this and ea rlie r surveys. In a 1960 survey of 27 areas, m ore than 18,000 w ork ers w ere c la ss ified as bookkeeping m achine operators , com pared with about 3, 000 in 1969 and just over 1, 300 w ork ers in the 1973 survey of 28 areas. This occupation has been la rge ly rep laced by e lectron ic bookkeeping m a c h i n e s and com puters which require substantially few er workers to a ccom plish the sam e tasks.
O verall, the num ber of te llers in creased 2 percent between the 1969 and 1973 surveys. This m odest in crease , how ever, was not shared by all the te lle r groups studied separately; while the num ber of a ll-round te lle rs , who handle a variety of banking transactions, grew by
2 For an account of the earlier survey, see IndustryWage Survey: Banking, November 1969. Bulletin 1703(Bureau of Labor Statistics, 1971).
3 Separate data for men and women are presented for 26 of the 28 areas; a number of Portland and Seattle banks were unable to report occupational earnings by sex. Together, the 26 areas accounted for 97 percent of the nonsupervisory office employees covered by the study.
Digitized for FRASER http://fraser.stlouisfed.org/ Federal Reserve Bank of St. Louis

nearly 70 percent, the number of savings and com m ercia l te llers declined substantially. An industrywide trend towards branch banking m ay partly explain this pattern. T e llers in sm aller branch banks are often required to p e rfo rm a greater variety of duties than their counterparts in large central banks, where sp e c ia lization is m ore practica l. The proportion of wom en in te ller positions, how ever, rem ained relatively constant between the 1969 and 1973 surveys, halting the rising trend observed in ea rlie r studies.
P roductiv ity . T echnologica l changes have perm itted the banking industry to m eet sharply rising d e m a n d s for its se rv ice s with a much sm aller in crease in em ploym ent. Although lim itations in the available data preclude the develop ment of p re c ise m easures of output and productivity in banks, the v o l u m e of c h e c k s p rocessed m ay be used as a partia l indication of industry output. The F edera l R eserve System handled 3.4 b i l lion checks in 1960 com pared with 10.0 b illion in 197 3— an average annual growth rate of 8.3 percent. Total bank em ploym ent in the United States during the sam e p eriod rose at an average rate of 4.5 percent annually— fro m 672,500 to 1.2 m illion .4
Method of wage payment. W orkers in m ost of the areas studied usually w ere paid under form al plans providing a range of rates fo r specified occupations; in 14 areas, such plans applied to m ore than nine-tenths of the w ork fo r ce . (See table 31.) P rog ress ion within the job ra te- ranges was determ ined by m erit review fo r a m ajority of the w orkers in m ost areas. Inform al system s, which based sa la ries p rim a rily on the qualifications of the individual, applied to about th ree - fifths of the w orkers in Dallas and New Orleans and to about one-half in Kansas City and M iam i.
U nionization. Banks with co llective bargaining agreem ents covering a m ajo r ity of their n onsupervisory o ffice em p loyees w ere found in 3 of the 2 8 areas studied. O ne-half of bank em ployees in Milwaukee w ere in such banks, one-th ird in Seattle—Everett, and le ss than one-tenth in Washington. The survey, how ever, was not designed to p re c ise ly m easure
4 See Technological Change and Manpower Trends in Six Industries. Bulletin 1817 (Bureau of Labor Statistics, 1974), pp. 41-53.
unionization in the industry; thus, e s t im ates presented here m ay not re fle c t the actual degree of organization in an area.
Occupational Earnings
The occupations fo r which earnings data w ere developed em ployed about one- third of the nonsupervisory o ffice workers within the scope of the August—N ovem ber 1973 s u r v e y . The occupations w ere chosen to represent the various activ ities p erform ed by bank em ployees and are presented in three broad em ploym ent ca tegories— te lle rs , com puter occupations, and o ffice c le r ic a l occupations.
Occupational earnings usually a v e r aged the highest per week in D etroit or New York, and low est in L ou isv ille or St. Louis. (See table 1.) W orkers in the highest paying area frequently averaged 30 to 50 percent m ore than their cou n terparts in the low est paying area. S e cre ta ries , fo r exam ple, averaged $169«50 a week in New York com pared with $116 in L ou isv ille , a d ifferen ce of 46 percent.
Average straight-tim e-weekly hours— which correspon d to the weekly earnings data developed— w ere usually shortest in New York (ranging from 35 to 36 hours fo r the occupations studied) and longest in D e n v e r , Kansas City, and Seattle (where averages of 40 hours a week w ere predom inant). (See tables 2 through 29.)
C om m ercial-savings te lle rs— engaged in cashing checks, receiv in g deposits on checking and savings accounts, and paying out withdrawals on savings accounts— w ere the la rgest occupational group studied. A verage earnings fo r these w orkers ranged from $99 a week in H artford to $132 in New York. Interarea variations in average straight-tim e weekly earnings, how ever, d iffered considerab ly among the five te ller cla ssifica tion s studied. Note te lle rs , fo r exam ple, averaged from $103 a week in Philadelphia to $167 in New York, a d ifferen ce of 62 percent. On the other hand, the m axim um interarea spread fo r com m ercia l te llers was only 13 percent, from $108.50 in Kansas City and Houston to $ 122.50 in D etroit.
A verage w eekly earnings of em ployees in the com puter occupations studied varied substantially by the com plexity of w ork perform ed and degree of independent judgment involved. In the Nassau—Suffolk
Digitized for FRASER http://fraser.stlouisfed.org/ Federal Reserve Bank of St. Louis

area, fo r exam ple, com puter p rog ra m m ers doing routine w ork (c la ss C) a v eraged $ 157.50 a week, com pared with $261.50 a week for those doing m ore com plex w ork (c la ss A). Among areas, pay d ifferen ces w ere a lso observed for em ployees doing sim ilar work. C om puter operators, class B, num erically the m ost im portant com puter group su rveyed, averaged from $130 a week in M inneapolis—St. Paul and New Orleans to $ 173.50 in San F ra n cisco .
S ecreta ries , as a group, w ere num erica lly the m ost im portant and highest paid c le r ic a l occupation studied in nearly all of the areas. Their average earnings, how ever, varied w idely within individual areas, la rgely based on the position held by their su perv isor. C lass A secre tar ies (those working fo r the chairm an of the board or president of a bank em ploying 100 to 5 ,000 em ployees or other o ffice rs of la rger banks), averaged $228.50 a week in New Y ork, com pared with $154
Text table 1. Average straight-time weekly earnings for selected office occupations in BLS area wage surveys as a percent of averages for employees in banks, 22 areas, selected years
Averages1 in banks = 100
Area File clerks, class B
Keypunch operators,
class BSecretaries Stenographers,
generalTypists, class B
1964 1969 1973 1964 1969 1973 1964 1969 1973 1964 1969 1973 1964 1969 1973
Northeast
Boston, Mass-------------------------------------- 98 101 100 105 103 102 104 101 104 108 110 113 108 107 111Philadelphia, P a ------------------------------- 111 97 104 110 111 118 118 116 118 114 113 124 107 106 106
South
Atlanta, G a -------------------------------------- _ _ 104 107 103 110 114 111 110 113 113 118 107 108 112Baltimore, M d---------------------------------- 107 99 - 120 114 123 120 111 114 119 112 130 109 109 109Houston, T ex------------------------------------ 105 103 101 113 101 101 107 117 112 110 115 117 102 93 -Louisville, Ky. — Ind------------------------- 122 110 - - - 113 118 119 125 122 107 - 115 113 112Memphis, Tenn. —A rk ---------------------- - - - - - 110 104 112 112 110 106 - - - -
Miami, Fla--------------------------------------- 100 101 100 119 110 115 108 107 107 - - 97 100 112 -New Orleans, L a ------------------------------- - - 88 105 108 - 100 105 110 99 101 111 - - -Washington, D. C. — Md. — V a -----------
North Central
105 116 109 113 107 103 106 112 113 136 106 102 103
Chicago, 111-----------------*--------------------- 103 99 108 109 105 110 108 105 108 111 106 116 99 103 107Cincinnati, Ohio—K y.—Ind--------------- 109 107 - 119 109 114 111 111 112 112 109 111 109 107 -Detroit, Mich------------------------------------ 120 106 114 129 122 129 123 116 123 126 114 118 123 105 107Indianapolis, Ind------------------------------ 99 98 - 116 107 - 111 113 123 124 112 - 99 96 -Kansas City, Mo. — Kans-------------------- 106 105 105 108 105 112 115 108 109 110 107 115 107 101 97Milwaukee, Wis--------------------------------- 108 109 - 113 112 112 102 101 109 117 114 120 106 102 102Minneapolis—St. Paul, Minn------------- - - 109 121 110 110 103 101 102 112 111 107 105 105 105St. Louis, M o.—111--------------------------- 121 I l l 115 125 114 124 114 120 123 118 127 143 117 114 116
West
Denver, C olo --------— —--------------------- 107 105 111 109 107 _ 104 106 114 111 120 127 97 102 110Portland, Or eg. —Wash---------------------- - - 113 - - 112 98 104 106 105 119 127 - - -
San Francisco—Oakland, C a lif---------- 101 109 122 108 109 - 106 104 108 - - - 102 106 112Seattle—Everett, Wash---------------------- 117 114 113 114 112 116 110 105 112 116 119 125 111 102 112
1 Averages relate to regular straight-time salaries that are paid for a standard workweek. Data for area wage surveys were adjusted to reflect payroll periods used in the banking survey. Hartford, Conn., is not included in the Bureau's regular area wage survey program. Area definitions used in the surveys are not comparable in Nassau—Suffolk, N. Y., Newark, N. J., New York, N.Y. , Dallas, Tex. , and Los Angeles—Long Beach, Calif.
NOTE: Dashes indicate no data reported or data that do not meet publication criteria.
Digitized for FRASER http://fraser.stlouisfed.org/ Federal Reserve Bank of St. Louis

fo r c la ss D se cre ta r ie s (those working fo r su p erv isors of sm all units or non- su perv isory staff specia lists ).
C lass C file c l e r k s (those doing routine work) generally averaged the least among the survey jobs , ranging from $80 a week in Denver to $105 in New York. Safe-deposit c lerk s , who rent safe-deposit boxes to bank cu stom ers, w ere studied fo r the fir s t tim e in 1973. Found in n e a r l y all areas, the su rvey ’ s 2 ,300 sa fe -d ep osit clerks averaged from $96 a week in New O rleans to $144.50 in New York; m ost com m only, their averages fe ll between $100 and $110.
A verage weekly e a r n i n g s of five c le r ic a l occupations in banks w ere com
pared with the corresponding jobs in the Bureau’ s area wage surveys in 22 a re a s .5 The pay relatives shown in text table 1, which use the average in banks as a base of 100, dem onstrate that the ’ ’all industries" average in 1973 frequently exceeded the bank average by 5 to 15 percent. In C hicago, for exam ple, the all industries w eekly earnings advantage was 16 percent fo r general stenographers;
5 The Bureau's area wage survey program covers establishments in the following broad industry divisions: Manufacturing; transportation, communication, and other public utilities; wholesale trade; retail trade; finance (including banks), insurance, and real estate; and selected services. A r e a wage surveys currently are conducted annually in 70 metropolitan areas throughout the country.
Text table 2. Earnings differentials between highest and lowest paid workers in same job and establishment, banking industry, August—November 1973
NumberNumber of establishments in which differential was-
Occupation and area ofestablishments
Under10
percent
10 percent and under 20 percent
20 percent
30 percent
30 percent
40 percent
40 percent
50 percent
50 percent and over
Proof-machine operators:Atlanta--------------------------------------- 12 2 2 3 2 1 2Boston----------------------------------------- 19 5 5 1 5 3 -
Chicago-------------------------------------- 40 14 9 7 2 7 1Dallas----------------------------------------- 23 11 5 4 - 1 2Los Angeles—Long Beach------------- 14 3 2 1 2 2 4New York------------------------------------ 19 3 2 8 - 1 5Washington-------------------------------- 20 3 9 2 2 2 2
Secretaries, class C:Atlanta--------------------------------------- 8 1 1 - 1 3 2Boston----------------------------------------- 15 4 1 2 6 2 -
Chicago------------------------------------- 23 13 - - 6 2 2Dallas----------------------------------------- 8 3 2 1 1 1 -Los Angeles—Long Beach------------- 11 1 2 2 3 1 2New York------------------------------------ 28 8 4 4 3 5 4Washington-------------------------------- 8 2 1 2 - 2 1
Commercial-savings tellers:Atlanta--------------------------------------- 7 - - 1 2 2 2Boston----------------------------------------- 11 - - 2 2 2 5Chicago-------------------------------------- 11 2 - 1 2 2 4Dallas----------------------------------------- 7 1 2 1 2 1 -Los Angeles—Long Beach------------- 14 - 2 1 3 4 4New York------------------------------------ 14 - - - 2 - 1 12Washington--------------------------------- 6 - - - 4 1 1
All-round tellers:Atlanta-------------------------------------- 12 2 - 2 - 2 6Boston----------------------------------------- 15 1 1 2 5 1 5Chicago-------------------------------------- 33 2 6 9 6 2 8Dallas----------------------------------------- 16 4 5 4 3 - -New York------------------------------------ 6 - - 1 - 1 4Washington-------------------------------- 16 - 1 4 1 2 8
* Establishments were distributed as follows: 2 at 50—60 percent; 7 at 60—70 percent; and 3 at 70—80 percent.
Digitized for FRASER http://fraser.stlouisfed.org/ Federal Reserve Bank of St. Louis

10 percent fo r c la ss B keypunch op era to rs ; 8 percent fo r both class B file c lerk s and secre ta r ie s ; and 7 percen t fo r c la ss B typists.
Individual e a r n i n g s of em ployees varied considerably within the sam e o cc u pation and area in m ost instances. (See tables 2 through 29.) These d ispersion s of earnings re fle c t such fa ctors as d iffe r ences in pay l e v e l s among individual banks and the extensive use of rate-range pay system s f o r sp ecific occupations. The influence of this method of wage payment m a y be observed by com paring sa la ries of em ployees in the same establishm ent. A s text table 2 illu strates, w eekly sa laries of w orkers in the same occupation and establishm ent frequently d iffered by 20 percent or m ore .
Establishm ent P ra ctices and Supplem entary Wage P rov ision s
Inform ation was a lso obtained on the preva lence of m inim um entrance sa laries fo r inexperienced t y p i s t s and savings te lle rs and on the follow ing p ractices and benefits fo r all n onsupervisory o ffice w ork ers : Scheduled weekly hours andshift p ra ctice s ; overtim e prem ium pay; and the incidence of paid holidays, paid vacations, and health, insurance, and retirem ent plans.
M inimum entrance sa la r ie s . Slightly over tw o-fifths of the banks studied in the 2 8 areas com bined reported form ally established m inim um rates fo r in exp erienced typ ists; just under one-fourth r e ported such rates fo r savings te lle rs . (See table 30.) Rates paid inexperienced typists ranged fro m le ss than $65 a week (St. Louis) to $110 or over (New Y ork ); m ost com m only, how ever, they clustered between $85 and $100 a week, with som e variation by area. Entrance rates fo r savings te lle rs usually w ere somewhat higher than those fo r typists. (
Scheduled w eekly h o u r s and shift p ra c t ice s . A m a jority of the nonsuperv iso ry o ffice w orkers in 16 areas w ere in banks with w ork schedules of 40 hours a week. (See table 32.) Shorter .work schedules, com m only 35, 36, or 37 l/z
h o u r s a week, w ere m ost frequently reported in the Northeast, where they applied to at l e a s t tw o-th irds of the w ork ers in each area surveyed. Banks with form a l prov ision s fo r late-sh ift w ork
accounted for a m a jority of the nonsuperv is o ry o f f i c e em ployees in all areas except Cincinnati, Houston, and M iam i. At the tim e of the survey, one-tenth or le ss of the w ork ers in m ost areas w ere actually em ployed on late shifts. The proportion of late-shift w ork ers , how ever, amounted to about one-seventh in B a ltim ore , Indianapolis, and M ilwaukee.
O vertim e prem ium pay. V irtually all of the banks surveyed had form al p rov ision s fo r prem ium pay fo r w eekly overtim e work. (See table 33.) One and one-ha lf tim es the w ork er ’ s regular rate was the usual pay fo r work in ex cess of 40 hours a week in all areas. The p r in cip le of "fluctuating w orkw eek" fo r weekly overtim e was found in only seven a r e a s ;6 it applied to one-half of the w ork ers in New O rleans, and to le ss than one-sixth in D allas, Houston, Kansas City, Memphis, St. Lou is, and W ashington.
Provisions fo r prem ium pay fo r daily overtim e w ork applied to all or nearly a ll of the w o r k e r s in Los Angelesr-Long Beach, Portland, and San F ra n cisco— Oakland; one-third in Boston and St. Louis; one-fourth in D allas; on e-fifth in Seattle— Everett and Washington; and to one-tenth or le ss in each of the rem aining areas. (See table 34.) M ost com m only, w ork ers w ere paid tim e and one-ha lf fo r w ork in excess of 8 hours per day.
Paid holidays. A ll of the banks studied provided paid holidays— ranging from 4 to 13 annually. (See table 35.) T yp ica lly , p rov ision s w ere m ost lib era l in the N ortheastern areas, where all w ork ers rece ived 10 paid holidays or m ore a year, while workers in Atlanta and New O rleans usually rece ived the few est num ber, 6 days annually. Even within individual areas p r o v i s i o n s varied w idely. In Chicago, fo r e x a m p l e , one-fourth of the bank em ployees rece ived 6 days a year while a lm ost th ree-fifth s rece ived 11 days.
Paid vacation s. Paid vacations after qualifying periods w ere provided by a ll of the banks studied. (See table 36.) Typical p rov ision s included 2 w eeks of vacation pay after 1 year of se rv ice ; 3 weeks after 10 yea rs ; and 4 weeks
6 Under the principle of the fluctuating workweek, pay for overtime work is determined by dividing the weekly salary by the total number of hours worked during the week (to obtain the base hourly rate for the week) and then applying the established overtime pay ratio for the overtime hours worked.
Digitized for FRASER http://fraser.stlouisfed.org/ Federal Reserve Bank of St. Louis

after 20 years. P rov ision s for 5 weeks after 30 y e a rs ’ serv ice covered about on e-fifth to tw o-th irds of the w orkers in seven areas.
Health, insurance, and retirem ent p lans,, L ife, hospitalization , surgica l, basic m edica l, and m ajor m edica l in surance benefits w ere provided by banks em ploying th ree-fou rth s or m ore of the w ork ers in all areas. (See table 37.) Paid sick leave— usually fu ll pay and no waiting period— was available to a m ajo r ity of the w orkers in 23 of the 2 8 areas. A ccidental death and d ism em berment insurance covered at least two-fifths of the w orkers in 2 5 areas. The extent to which em ployers financed health and i n s u r a n c e plans varied considerably
among the areas. In both H artford and San F ra n c isco —Oakland, f o r exam ple, a ll w orkers w ere covered by h osp ita lization, s u r g i c a l , basic m edica l, and m ajor m edica l insurance. In H artford, how ever, seven-eighths of the w ork ers w ere under plans financed entirely by the em ployer, in contrast to less than one-tenth in San F ra n cisco—Oakland.
R etirem ent pension benefits (other than F ed era l so c ia l security ), usually financed entirely by the em ployer, w ere provided by banks employing three-fourths of the w orkers or m ore in each area. R etirem ent severance pay plans w ere found in a b o u t one-ha lf of the areas studied and usually covered less than one-fifth of the w ork fo r ce .
Digitized for FRASER http://fraser.stlouisfed.org/ Federal Reserve Bank of St. Louis

Northeast
OccupationBoston Hartford Na s s au—Suffolk Newark New York
Number of employees Averageweekly
earnings
Number of employees Averageweekly
earnings
Number of employees Averageweekly
earnings
Number of employees Averageweekly
earnings
Number of employees Averageweekly
earningsTotal Men Women Total Men Women Total Men Women Total Men Women Total Men Women
Selected c lerica l occupations
Bookkeeping-machine operators,class A _____________________________________ 49 - 49 $140.00 11 - 11 $120.00 18 - 18 $122.50 - - - - 79 - 79 $140.50
Bookkeeping-machine operators,class B _____________________________________ 44 - 44 108.50 - - - - 14 - 14 107.50 17 - 17 $117.50 59 13 46 124.00
C lerk s, file , c lass A ____________________ 20 - 20 121.00 - - - - - - - - - - - - 254 - 254 126.50C lerks, file , c lass B ______________________ 96 1 95 103.00 - - - - - - - - - - - - 463 25 438 112.00C lerk s, file , c lass C ______________________ 74 - 74 97.50 9 - 9 89.50 94 - 94 93.50 178 - 178 97.00 649 6 643 105.00Keypunch operators, c lass A ____________ 117 - 117 117.50 - - - - 38 - 38 123.50 19 - 19 126.50 480 20 460 136.00Keypunch operators, c lass B 46 - 46 115.00 - - - - 68 - 68 116.00 86 - 86 112.00 201 1 200 117.00Proof-m achine operators 274 15 259 109.00 103 - 103 95.00 251 2 249 105.50 199 13 186 105.00 634 97 537 125.00Safe-deposit c le r k s ________________________ 117 60 57 116.50 - - - - 83 9 74 115.50 107 37 70 111.50 531 445 86 144.50S ecreta ries2 _______________________ ___ 760 - 760 148.00 289 - 289 134.00 509 - 509 139.00 392 - 392 146.00 4,700 12 4,688 169.50
Secretaries, c lass A ....................... _ 38 _ 38 177.00 - - - - 18 - 18 200.50 10 - 10 188.50 182 - 182 228.50Secretaries, c lass B ___________________ 177 _ 177 155.00 45 - 45 145.00 49 _ 49 162.50 42 _ 42 160.00 599 2 597 198.00Secretaries, c lass C __________________ 288 - 288 147.50 120 - 120 137.50 134 - 134 156.00 92 - 92 153.50 1,473 4 1,469 176.50Secretaries, c lass D _ ________________ 257 - 257 139.50 - - - - 308 - 308 124.00 188 - 188 137.50 2,446 6 2,440 154.00
Stenographers, general___________________ 55 - 55 116.50 - - - - - - - - 34 - 34 111.50 789 1 788 122.50Stenographers, se n io r __________________ _ 67 - 67 125.50 11 - 11 125.00 143 - 143 125.00 71 - 71 126.50 590 - 590 142.50Switchboard operators, c la ss A _________ 59 - 59 125.50 - - - - - - - - - - - - 57 - 57 155.00Switchboard operators, c lass B_........... 57 - 57 111.00 14 - 14 99.50 52 - 52 116.50 53 - 53 115.50 219 1 218 129.50Typists, class A ____________________________ 78 - 78 114.00 82 - 82 111.00 88 - 88 120.50 - - - - 1,395 12 1,383 124.00Typists, c lass B ____________________________ 123 - 123 97.50 - - - - 173 - 173 104.50 215 - 215 105.50 1,850 9 1,841 112.00
Selected computer occupations
Computer operators, c lass A 94 86 8 173.00 _ _ _ _ 24 24 _ 191.00 _ _ _ _ 218 212 6 194.00Computer operators, c lass B 94 74 20 143.00 20 20 - 150.00 41 40 1 157.00 58 53 5 159.00 321 301 20 167.50Computer operators, class C ____________ 32 30 2 113.50 22 22 - 133.50 38 32 6 131.50 48 47 1 123.50 240 228 12 144.00Computer program m ers, business,
class A _____________________________________ 49 35 14 238.50 - - - - 24 19 5 261.50 9 9 - 238.00 322 260 62 278.50Computer program m ers, business,
class B _____________________________________ 55 39 16 190.00 25 24 1 206.00 22 17 5 219.00 52 38 14 217.50 220 165 55 235.00Computer program m ers, business,
class C ___________________________________ 8 8 - 153.50 - - - - 22 14 8 157.50 22 20 2 175.00 74 56 18 192.00Computer system s analysts,
business, c lass A ________________________ 54 41 13 274.00 - - - - - - - - 8 7 1 278.50 176 147 29 307.00Computer system s analysts,
business, c lass B ________________________ 38 23 15 236.50 - - - - 50 43 7 285.50 10 10 - 261.50 125 88 37 266.50Computer system s analysts,
business, c lass C _________ _____________ 9 8 1 237.50 - “ - “ - - - " - - - - -
Selected teller occupations
T e lle rs , n o te ____________________________ __ 130 18 112 137.50 107 12 95 117.50 138 5 133 134.50 135 32 103 138.00 1,072 358 714 167.00T e lle rs , com m ercial-savin gs __ __ _ 977 253 724 123.00 174 - 174 99.00 1,876 136 1,740 116.00 1,313 210 1,103 108.50 3,693 836 2,857 132.00T e llers , com m ercial . _ - - - - - - - - - - - - 220 25 195 119.50 _ _ - -
T e lle rs , savin gs____________________________ 860 120 740 116.00 160 6 154 102.00 _ _ _ _ 134 18 116 108.00 2,444 659 1,785 126.00T e lle rs , all-round _ _ _ . __ _ . .. 1,219 167 1,052 112.00 905 198 707 134.50
Digitized for FRASER http://fraser.stlouisfed.org/ Federal Reserve Bank of St. Louis

(Number of em ployees and average straight-tim e weekly earnings 1 in selected occupations in banking establishm ents, 28 areas, August—November 1973)
Occupation
Northeast— Continued South
Philadelphia Atlanta Baltimore Dallas Houston
Number of employees Averageweekly
earnings
Number of employees Ave rage weekly
earnings
Number of employees Averageweekly
earnings
Number of em ployees Averageweekly
earnings
Number of employees Averageweekly
earningsTotal Men Women Total Men W omen Total , Men Women Total Men Women Total Men Women
Selected clerical occupations
Bookkeeping-machine operators,class A ______________________________________ _ _ _ _ 23 - 23 $111.50 17 - 17 $106,50 22 - 22 $115.00 15 - 15 $121.00
Bookkeeping-machine operators,class B_______________________________________ 63 _ 63 $103.50 30 _ 30 113.50 34 - 34 93.00 69 - 69 93.00 - - - -
C lerks, file , class A _______________________ 47 2 45 102.00 _ _ _ _ 16 _ 16 93.00 - - - - - - - -C lerks, file, c lass B . . .. . 59 3 56 96.00 57 _ 57 101.50 _ - - - 49 5 44 92.50 21 - 21 102.50C lerks, file , c lass C ....... _ ... 259 _ 259 89.00 29 _ 29 90.50 44 2 42 87,00 159 - 159 85.00 27 - 27 90.00Keypunch operators, class A ______________ 152 _ 152 116.00 49 _ 49 122.00 46 - 46 117.00 51 - 51 119.50 13 - 13 127.00Keypunch operators, class B______________ 94 _ 94 99.50 52 1 51 113.50 72 4 68 97.50 39 - 39 104.50 53 - 53 115.00Proof-m achine operators . 371 4 367 96.00 137 7 130 102.50 211 14 197 98.50 260 - 260 92.50 268 4 264 102.50Safe-deposit c lerk s__________________________ 110 39 71 109.00 20 1 19 118.50 - - - - 43 - 43 101.50 51 1 50 103.50Secretaries 2 _____________________ ____ _______ 1, 067 _ 1, 067 129.00 519 _ 519 141.00 291 - 291 132.00 440 - 440 133.50 679 - 679 137.50
Secretaries, c lass A ___________________ 32 _ 32 179.50 13 _ 13 197.00 13 _ 13 162.00 13 - 13 164.50 17 - 17 184.00Secretaries, class B ___________________ 101 _ 101 146.50 59 _ 59 152.00 64 _ 64 142.00 98 - 98 143.00 188 - 188 143.50Secretaries, class C _ 311 _ 311 127.50 179 _ 179 143.00 160 _ 160 131.00 149 - 149 137.50 289 - 289 134.50Secretaries, c lass D____________________ 343 _ 343 123.00 268 _ 268 134.50 54 - 54 116.50 180 - 180 123.00 185 - 185 132.50
Stenographers, general____________________ 274 _ 274 103.00 21 _ 21 113.00 15 - 15 102.50 58 - 58 115.50 72 - 72 112.00Stenographers, senior______________________ _ _ _ _ 13 _ 13 119.50 27 - 27 120.50 45 - 45 128.00 53 - 53 126.50Switchboard operators, c lass A __________ 24 _ 24 114.50 _ _ _ - - - - - 21 - 21 110.00 6 - 6 110.50Switchboard operators, class B __________ 25 _ 25 104.00 26 _ 26 106.50 22 - 22 111.00 44 - 44 95.00 104 - 104 101.50Typists, class A ________________________ ____ 182 _ 182 98.50 10 _ 10 108.00 98 - 98 100.50 23 - 23 106.00 - - - -Typists, c lass B _____________________________ 267 - 267 98.50 21 21 100.50 97 - 97 93.50 45 45 103.50 " ' -
Selected computer occupations
Computer operators, c lass A _____________ 75 70 5 171.00 22 21 1 167.50 25 21 4 168.00 19 19 _ 160.50 11 11 _ 162.50Computer operators, class B _____________ 120 109 11 149.50 53 53 _ 138.50 52 39 13 144.50 42 41 1 141.50 28 26 2 145.00Computer operators, class C _____________ 45 43 2 116.50 39 36 3 121.00 32 29 3 115.00 - - - - 25 24 1 118.00Computer program m ers, business,
class A -------------- ------------------------------------------ 80 52 28 245.00 37 26 11 239.50 17 13 4 218.00 26 24 2 264.50 - - - -Computer program m ers, business,
class B_______________________________________ 58 44 14 195.50 16 12 4 201.50 35 29 6 184.50 33 28 5 207.00 17 13 4 178.50Computer program m ers, business,
class C ______________________________________ 13 7 6 162.50 14 11 3 190.50 9 9 - 177.50 6 6 - 164.00 - - - -Computer system s analysts,
business, class A _________________________ 18 15 3 287.00 - - - - 11 11 - 269.00 25 23 2 297.00 8 7 1 294.50Computer system s analysts,
business, class B _________________________ 49 46 3 249.50 26 16 10 221.00 31 26 5 251.00 - - - - 27 26 1 250.00Computer system s analysts,
business, c lass C ------------------------------------------------ “ - “ - - - - - 12 10 2 200.00 - - - " -
Selected teller occupations
T e llers , n o te ________________________________________ 61 2 59 103.00 224 4 220 124.00 _ _ _ _ 223 36 187 113,50 396 25 371 118.00T e lle rs , com m ercial-savin gs_____________ 947 121 826 109.00 494 9 485 109.00 369 15 354 104.00 192 - 192 100,50 823 46 7 7 7 107.00T e lle rs , c om m e rcia l_______________________ _ _ _ _ 222 6 216 116.50 _ _ _ - 110 1 109 112.50 79 6 73 108.50T e lle rs , savin gs ------------------------------------------------------- 334 55 279 117.50 _ _ _ _ _ _ - - 30 - 30 102.50 - - - -T e llers , a ll-ro u n d __________________________ 1, 748 115 1, 633 108.50 529 4 525 116.50 1 , 200 38 1, 162 105.00 429 19 410 99.50 165 22 143 112.50
Digitized for FRASER http://fraser.stlouisfed.org/ Federal Reserve Bank of St. Louis

(Number of em ployees and average straight-tim e weekly earnings 1 in selected occupations in banking establishments, 2 8 areas, August-November 1973)
South— Continued
Louisville Memphis Miami New Orleans W ashington
Number of employees Average Number of employees Average Number of employees Average Number of employees Average Number of employees Averageweekly weekly weeklyWccKly
T otal Men Women earnings Total Men Women earnings Total Men Women earnings Total Men W omen earnings Total Men W omen earnings
Selected clerical occupations
Bookkeeping-machine operators,class A ______________________________________ - - - - _ - - 40 _ 40 $127.50 _ _ _ _ _ _ _
Bookkeeping-machine operators,class B --------------------------------------------------------- - - - - - - - _ _ _ - - _ _ _ _ 50 4 46 $100.00
C lerks, file , class A_______________________ - - - - - - _ _ _ _ - _ 8 1 7 $119.00 38 _ 38 113.50C lerks, file , class B_______________________ - - - _ _ - _ _ 44 _ 44 101.00 34 2 32 102.50 100 _ 100 100.50C lerks, file , c lass C_____________________________ 21 _ 21 $81.50 84 2 82 $83.00 42 _ 42 88.50 141 _ 141 84.00 117 1 116 89.50Keypunch operators, class A ________________ 16 - 16 115.50 - ~ - - 11 - 11 118.00 6 _ 6 116.50 17 _ 17 127.50Keypunch operators, c lass B ________________ 65 - 65 99.50 53 - 53 103.50 29 - 29 101.50 - _ _ _ 60 1 59 117.00Proof-m achine operators______________________ 164 - 164 89.00 59 - 59 92.50 211 7 204 107.00 198 8 190 90.00 340 18 322 107.50Safe-deposit c le rk s _______________________________ - - - - 6 - 6 109.00 73 2 71 109.00 12 - 12 96.00 62 10 52 123.50Secretaries 2_________________________________________ 156 - 156 116.00 197 - 197 119.00 250 - 250 139.50 141 _ 141 131.50 367 367 149.00
Secretaries, c I^l ss A ________________________ 9 - 9 147.50 - - - - 22 - 22 174.50 7 _ 7 150.00 10 _ 10 189.00S ecretaries, class B ________________________ 35 - 35 128.50 34 - 34 132.00 71 - 71 145.50 26 _ 26 137.50 62 _ 62 165.50Secretaries, class C ________________________ 61 _ 61 117.50 26 _ 26 137.00 87 _ 87 137.00 _ _ _ _ 142 _ 142 155.00Secretaries, class D ________________________ 51 - 51 99.50 - - - - 70 - 70 126.00 50 _ 50 118.50 153 > 153 135.00
Stenographers, general_________________________ - - - - - - - - 59 - 59 134.00 127 _ 127 103.00 16 _ 16 101.00Stenographers, sen ior___________________________ - - - - - - - - 22 - 22 144.50 7 _ 7 116.50 23 _ 23 136.50Switchboard operators, c lass A_____________ - - - - - _ _ _ 10 - 10 113.00 - _ _ _ 10 _ 10 112.00Switchboard operators, c lass B_____________ 21 - 21 98.50 9 - 9 1 1 1 . 0 0 53 - 53 108.50 43 - 43 101.00 35 _ 35 98.50Typists, c lass A----------------- ---------------------------------- - - - - _ - _ - _ _ _ _ _ _ _ _ 106 1 105 125.00T ypists, class B____________________________________ 29 “ 29 89.50 - - - - - - - - - - - - 240 - 240 110.00
Selected computer occupations
Computer operators, c lass A________________ _ _ _ _ _ _ _ _ _ _ _ _ _ _ _ _ 24 24 . 179.00Computer operators, c lass B________________ 23 18 5 131.00 - - - - 29 22 7 132.50 50 46 4 130.00 34 27 7 139.50Computer operators, c lass C_____________ 18 14 4 114.00 - _ _ - 9 8 1 115.50 9 9 _ 106.50 25 21 4 130.00Computer program m ers, business,
class A ______________________________ ________________ - - - - - - - - - _ - - - - - - 23 19 4 236.50Computer program m ers, business,
class B _______________________________________________ 17 16 1 162.00 - - - - 18 10 8 194.00 41 34 7 191.50 20 14 6 210.00Computer program m ers, business,
class C ------------------------------------------------------------------------- - - - - - - - - - - - - 8 8 . 162.00 13 10 3 167.00Computer system s analysts,
business, class A _______________________________ - - - - - - - - - - - - - - - - 18 14 4 297.00Computer system s analysts,
business, class B _______________________________ - - - - - - - - - - - - - - ! 15 13 2 231.00Computer system s analysts,
business, class C __________________________*____ - - - - - - - " - , - - - -
Selected teller occupations
T e lle rs , note________________________________________ 39 _ 39 121.50 _ _ j _ 144 21 123 123.50 75 11 64 110.00 185 33 152 143.50T e llers , com m e rcia l-sa v in g s____________ 540 31 509 105.00 _ - - - 184 29 155 114.00 364 61 303 100.00 629 89 540 112.50T e llers , com m ercial_______________________ - - _ _ _ _ _ _ 503 63 440 116.00 _ _ _ _ _ _ _T e llers , savings____________________________ - - - - - - - - 74 11 63 120.50 - _ - - _ _ . -T e llers , a ll-rou n d __________________________ 631 10 621 104.50 287 27 260 102.50 1,572 260 1,312 111.00
Digitized for FRASER http://fraser.stlouisfed.org/ Federal Reserve Bank of St. Louis

N orth C en tra l
OccupationChicago Cincinnati Detroit Indianapolis Kansas City
Number of employees Averageweekly
earnings
Number of employees Averageweekly
earnings
Number of employees Average Number of employees Averageweekly
earnings
Number of employees Averageweekly
earningsTotal Men Women Total Men Women Total Men Womenweeklyearnings Total Men Women Total Men Women
Selected clerical occupations
Bookkeeping-machine operators,class A 158 - 158 $119.00 - - - 11 - 11 $125.50 9 - 9 $110.00 24 1 23 $104.00
Bookkeeping-machine operators,class B 125 3 122 100.50 - - - - 41 - 41 106.50 - - - - 25 - 25 94.50
C lerks, file , class A 59 _ 59 109.50 _ _ _ - _ _ - _ - _ _ _ 15 3 12 108.00C lerks, file, class B 127 1 126 107.00 _ - - - 42 1 41 104.00 - - - - 119 2 117 93.50C lerks, file , c lass C 709 - 709 95.50 125 3 122 $ 91.00 139 - 139 97.00 50 - 50 83.50 68 5 63 83.00Keypunch operators, class A ____________ 154 - 154 130.50 - - - - 78 - 78 124.00 56 1 55 117.50 21 - 21 122.50Keypunch operators, class B 184 2 182 116.50 22 - 22 99.50 45 - 45 118.50 - - - - 75 - 75 109.00Proof-m achine operators............... _ 812 8 804 105.50 69 1 68 98.00 396 8 388 110.00 140 - 140 94.50 199 1 198 101.50Safe-deposit clerks ......................... 259 48 211 117.50 20 8 12 109.00 112 6 106 125.50 19 - 19 103.00 77 5 72 104.00S ecretaries2 ___ . . . . . . . . . _ _ 1,467 1 1,466 149.50 171 - 171 138.50 516 _ 516 157.50 244 - 244 133.00 221 - 221 134.50
Secretaries, class A . . . . .... 136 1 135 181.00 10 _ 10 164.50 21 - 21 189.50 12 - 12 171.50 14 - 14 166.00Secretaries, class B . _ __ ...... . 414 _ 414 164.00 44 _ 44 151.00 61 _ 61 178.00 57 - 57 153.50 71 - 71 140.50Secretaries, class C ___________________ 524 _ 524 146.00 52 - 52 143.00 223 - 223 159.00 44 - 44 131.00 59 - 59 127.50Secretaries, c lass D 393 _ 393 127.50 65 - 65 122.50 211 _ 211 146.50 131 - 131 121.50 77 - 77 128.50
Stenographers, general 94 - 94 121.50 25 - 25 109.00 66 - 66 124.50 - - - - 60 - 60 108.00Stenographers, senior _ . . . . 125 - 125 132.00 - - - - 50 - 50 150.00 49 1 48 121.00 109 - 109 122.00Switchboard operators, c lass A _________ 70 - 70 1 2 1 . 0 0 - - - - 21 - 21 133.50 18 - 18 109.50 7 - 7 106.00Switchboard operators, c lass B _________ 190 _ 190 106.50 _ - - - 45 - 45 111.00 - - - - 51 - 51 102.50Typists, class A ____________________________ 283 - 283 116.50 - - - - 88 - 88 133.50 155 1 154 107.00 - - - -Typists, c lass B ____________________________ 267 - 267 108.00 - - - - 260 - 260 116.00 - - - 51 " 51 100.50
Selected computer occupations
Computer operators, c lass A ____________ 114 113 1 186.50 _ _ _ _ 25 24 1 184.00 20 19 1 175.50 16 14 2 168.00Computer operators, c lass B ____________ 140 123 17 153.50 13 12 1 150.50 32 22 10 168.50 25 24 1 155.50 38 30 8 131.50Computer operators, class C __ . _. _ 69 65 4 128.50 10 8 2 135.00 26 20 6 131.00 19 14 5 132.00 21 18 3 112.50Computer program m ers, business,
class A __________________________________ _ 120 79 41 249.50 7 4 3 203.50 43 34 9 267.00 - - - - 18 14 4 232.50Computer program m ers, business,
class B __________________________________ _ 137 88 49 193.00 13 9 4 171.50 28 23 5 219.00 16 15 1 201.50 13 13 - 200.00Computer program m ers, business,
class C _____________________________________ 32 13 19 167.50 - - - - 20 12 8 180.50 - - - - 7 7 - 156.00Computer system s analysts,
business, c lass A ____________________ 108 90 18 285.50 - - - - 34 33 1 311.50 - - - - 14 13 1 292.50Computer system s analysts,
business, c lass B ________________________ 62 46 16 232.50 7 6 1 211.00 23 19 4 264.50 - - - - 13 12 1 261.00Computer system s analysts,
business, class C ________ ______________ . 7 2 5 198.00 - ' - - " - - - ~
Selected teller occupations
T e llers , n o te ______________ ________ ____ 457 119 338 133.00 33 _ 33 114.00 64 7 57 125.50 _ _ _ _ 179 21 158 116.50T e llers , c o m m e rcia l-sa v in g s___ _________ 5 83 87 496 108.50 - - - - 1,261 24 1,237 124.00 - - - - 533 48 485 104.00T e llers , com m ercia l______________________ 513 88 425 118.50 - - - - 70 - 70 122.50 - - - - 56 14 42 108.50T e llers , savings______________ _______ — 367 15 352 118.00 - - - - 74 8 66 110.50 - - - - 7 - 7 114.50T e llers , a ll-ro u n d -------------------------------------- 2,205 261 1,944 109.50 788 82 706 108.00 1,334 68 1,266 118.00 713 13 700 102.50 278 44 234 103.50
Digitized for FRASER http://fraser.stlouisfed.org/ Federal Reserve Bank of St. Louis

(Number of em ployees and average straight-tim e weekly earnings 1 in selected occupations in banking establishm ents, 28 a reas, August—November 1973)
North Central— Continued West
Milwaukee Minneapolis—St. Paul St.. Louis Denver Los Angeles—Long BeachOccupation
Number of employees Average Number of employees Average Number of employees Average Number of employees Average Number of employees Averageweekly weekly
Total Men Women earnings T otal Men Women earnings Total Men Women earnings T otal Men Women earnings Total Men Women earnings
Selected c lerical occupations
Bookkeeping-machine operators,class A _ _ 10 - 10 $114.00 17 - 17 $124.00 32 2 30 $114.50 - - - 32 - 32 $133.00
Bookkeeping-machine operators,class B 18 _ 18 118.00 57 - 57 101.50 49 - 49 102.00 - - - - 22 - 22 119.00
C lerk s, file , class A ______________________ - - - - - - - - - - - 16 - 16 $108.00 - - - -C lerk s, file , c lass B _______________________ - - - - 126 1 125 90.00 229 - 229 90.50 139 - 139 85.50 41 - 41 112.00C lerk s, file , class C _______________________ 44 _ 44 94.50 57 - 57 82.00 132 - 132 81.50 20 - 20 80.00 130 2 128 96.00Keypunch operators, class A _____________ 35 - 35 126.50 26 - 26 119.00 31 1 30 122.50 - - - - 173 1 172 146.00Keypunch operators, class B _____________ 28 - 28 106.00 37 3 34 102.00 88 - 88 98.50 - - - - - - - -Proof-m achine operators______ __________ 146 2 144 95.50 245 3 242 98.50 281 - 281 92.50 165 - 165 96.50 1,076 19 1,057 107.00Safe-deposit c lerks__________________________ 46 2 44 110.50 48 - 48 108.50 112 4 108 100.00 68 4 64 102.00 131 4 127 108.00Secretaries 2 _________________________________ 224 - 224 144.00 228 - 228 143.00 345 - 345 124.00 196 - 196 139.00 1 ,642 - 1, 642 150.50
Secretaries, class A ___________________ 8 - 8 193.50 13 - 13 170.50 29 - 29 152.00 9 - 9 159.00 57 - 57 197.50Secretaries, c lass B . . . . . . . . 32 _ 32 169.50 73 - 73 152.00 100 - 100 131.00 65 - 65 143.00 187 - 187 173.00Secretaries, c lass C ___________________ 66 _ 66 146.00 77 - 77 135.00 161 - 161 120.50 66 - 66 138.00 942 - 942 150.50Secretaries, c lass D ............... . 118 _ 118 133.00 65 - 65 137.00 55 - 55 108.50 - - - - 456 - 456 136.00
Stenographers, gen eral____________________ 84 - 84 104.00 215 - 215 118.00 167 - 167 92.50 32 - 32 107.50 200 - 200 116.00Stenographers, sen ior.__ __________________ 120 - 120 126.00 131 - 131 125.50 52 - 52 108.50 70 - 70 125.00 453 - 453 127.50Switchboard operators, c lass A __________ 11 - 11 124.00 - - - - 20 - 20 120.50 22 - 22 115.00 107 - 107 121.50Switchboard operators, c lass B ___ __ - - - - 33 - 33 104.50 61 - 61 94.00 40 - 40 93.50 147 - 147 101.50T yp ists, c lass A _______ 30 - 30 112.50 60 - 60 104.00 72 - 72 99.50 62 - 62 105.00 392 - 392 111.50T yp ists, class B . . . . . . . . . . . . . . . 25 25 106.00 118 - 118 93.50 157 157 91.00 64 “ 64 93.00 373 - 373 101.50
Selected computer occupations
Computer operators, class A 31 23 8 177.00 - - - - 21 20 1 151.00 11 10 1 170.00 46 46 - 201.00Computer operators, class B ____________ 41 36 5 144.00 23 16 7 130.00 35 30 5 133.50 - - - - 86 71 15 170.50Computer operators, c lass C _____________ 12 9 3 123.00 - - - - 40 34 6 114.50 - - - - 60 52 8 167.50Computer program m ers, business,
class A _____________________________________ 24 17 7 219.50 17 15 2 221.00 - - - - - - - * ~Computer program m ers, business,
class B ______________________________________ - - - - - - - 31 20 11 184.00 - - - 47 32 15 214.00Computer program m ers, business,
class C ______________________________________ - - - - 7 4 3 144.00 14 9 5 151.50 - - - - - -Computer system s analysts,
business, c lass A _________________________ 9 9 - 270.50 - - - 6 - - 243.50 - - - - - -Computer system s analysts,
business, c lass B . . . . . . . . . . . 12 9 3 260.00 - - - 9 8 1 208.00 - - - - - -Computer system s analysts,
business, class C _________________________ 11 8 3 209.00 " - " “ ~ ~ ~ ' ~ "
Selected teller occupations
T e lle rs , note_________________________________ 84 2 82 131.00 71 1 70 121.50 204 30 174 113.00 120 4 116 117.50 815 21 794 127.00T e lle rs , com m ercia l-savin gs_____________ 175 3 172 122.00 - - - - 610 64 546 100.00 563 13 550 101.00 2, 719 95 2 ,6 24 106.50T e lle r s , c o m m e rcia l_______________________ - - - - 69 13 56 110.50 187 26 161 114.50 - - - - - - - -T e lle rs , savin gs____________________________ - - - - 76 - 76 103.50 78 - 78 100.50 - - - - - - - -T e lle rs , a ll-r o u n d __________________________ 433 19 414 100.00 664 33 631 106.50 * 556 46 510 97.00 191 10 181 100.00
Digitized for FRASER http://fraser.stlouisfed.org/ Federal Reserve Bank of St. Louis

(Number of em ployees and average straight-tim e weekly earnings1 in selected occupations in banking establishm ents, 28 areas, August-Novem ber 1973)
Occupation
West— Continued
Portland 3 San Francisco—Oakland Seattle—Everett 3
Number of employees Average we ekly
earnings
Number of employees Averageweekly
earnings
Number of employees Average
Total Men Women Total Men Women Total Men Women earnings
Selected clerical occupations
Bookkeeping-machine operators, c lass A ______ - - - - - - - - - - - -Bookkeeping-machine operators, c lass B ______ - - - - 33 4 29 $113.50 - - ■ "C lerks, file , c lass A _ __ ____ 13 - - $109.50 25 2 23 111.00 9 - - $121.00C lerk s, file , class B . . ............ 43 - - 95.00 53 1 52 103.00 14 - - 98.00C lerks, file , c lass C . . . _ _ - - 109 - 109 100.00 23 - - 90.50Keypunch operators, c lass A . _ . . . . - - - - 83 - 83 158.50 80 - - 114.50Keypunch operators, class B ___ . . . .. 41 - - 108.00 - - - - 26 - - 107.00Proof-m achine operators__________________________ 86 - - 109.50 543 3 540 109.50 143 - - 103.00Safe-deposit c lerks_________________________________ 54 - - 103.00 82 7 75 113.00 28 - - 126.50Secretaries 2 . . . ________ _ _ 319 - - 137.50 832 - 832 155.00 355 - - 143.00
S ecretaries, c lass A ___________________________ 9 - - 184.50 58 - 58 186.00 10 - - 174.50Secretaries, c lass B ___________________________ 47 - - 147.50 121 - 121 171.50 45 - - 156.00Secretaries, c lass C _________________ ________ 108 - - 144.50 482 - 482 150.50 111 - - 147.50Secretaries, c lass D _ ____ __________________ 155 - - 127.00 171 - 171 146.50 189 - - 135.50
Stenographers, general____________________________ 52 - - 110.50 - - - - 92 - - 112.00Stenographers, senior _____________________________ - - - - 574 - 574 130.50 - - - -Switchboard operators, class A __________________ - - - - 44 1 43 129.00 - - - -Switchboard operators, class B __________________ 10 - - 111.00 44 - 44 112.00 12 - - 119.50T ypists, class A ____________________________________ - - - - 42 7 2 425 113.50 - - - -T ypists, class B ____________________________________ - - - 170 " 170 102.00 25 - “ 97.50
Selected computer occupations
Computer operators, class A ____________________ 8 - - 184.00 42 41 1 192.00 18 - - 174.00Computer operators, class B ____________________ 16 - - 165.50 59 54 5 173.50 27 - - 157.50Computer operators, class C ____________________ - - - - 40 - - 157.00 13 - * 137.50Computer program m ers, business, class A __ - - - - - - - - 20 - ■ 231.50Computer program m ers, business, c lass B ___ - - - - - - - - 38 - - 230.00Computer program m ers, busin ess, c lass C __ - - - - - - - - 18 - 173.50Computer system s analysts, business,
class A ________________________ _____________________ - 153 148 5 281.00 6 282.50Computer system s analysts, business,
class B _____________________________________________ 12 - 222.50 110 99 11 225.00 15 259.50Computer system s analysts, business,
class C ________________________________________ ' ~ " ~ “ “ " "
Selected teller occupations
T e lle r s , note________________________________________ 171 . - 126.50 621 26 595 134.00 197 - - 124.50T e lle rs , com m ercial-savin gs____________________ 280 - - 106.50 1 ,436 82 1, 354 109.50 788 - - 103.00T e lle r s , c om m e rcia l______________________________ - - - - - - - - - - - -T e lle rs , savin gs................... ............................................... - - - - 27 2 25 109-50 - - - -T e lle r s , a ll-r o u n d _____________________ ______ _____ 52 121.50 342 6 336 101.50 280 110.50
1 Earnings relate to regular straight-tim e salaries that are paid for standard workweeks and are rounded to the nearest half dollar.2 May include data for other secretaries in addition to those shown separately.3 Insufficient data to warrant publication of separate employment counts for men and women.
NOTE: Dashes indicate no data reported or data that do not meet pviblication criteria .
Digitized for FRASER http://fraser.stlouisfed.org/ Federal Reserve Bank of St. Louis

OccupationNumber
of
Av u a o b Number of workers receiving straight-tim e weekly earnings of-
Weekly hours 2
(standard)
Weeklyearnings'1
(standard)
$ 6 0
andunder
$ 7 0
$ 7 0
$ 8 0
$ 8 0
$ 9 0
$ 9 0
$ 1 0 0
$ 1 0 0
$ 1 1 0
$ 1 1 0
$ 1 2 0
$ 1 2 0
$ 1 3 0
$ 1 3 0
$ 1 4 0
$ 1 4 0
$ 1 5 0
$ 1 5 0
$ 1 6 0
$ 1 6 0
$ 1 7 0
$ 1 7 0
$ 1 8 0
$ 1 8 0
$ 1 9 0
$ 1 9 0
$ 2 0 0
$ 2 0 0
$ 2 1 0
$ 2 1 0
$ 2 2 0
$ 2 2 0
$ 2 4 0
$ 2 4 0
$ 2 6 0
$ 2 6 0
$ 2 8 0
$ 2 8 0
$ 3 0 0
$ 3 0 0
$ 3 2 0
Selected clerical occupations
Bookkeeping-machine operators,class A _ __ ___________ ___ ______ 2 3 4 0 . 0 $ 1 1 1 .5 0 - - - 3 9 8 2 _ _ _ _ 1 _ _ _ _ _ _ _ _
Bookkeeping-machine operators,class B __________________________ __ _ 3 0 3 7 .5 1 1 3 .5 0 - - - 1 16 4 5 3 1 _ _ _ _ _ _ _ _ _ _ _
C lerks, file , class B________________ ____ 5 7 3 9 .0 1 0 1 .5 0 - _ 11 13 2 4 4 4 1 _ _ _ _ _ _ _ _ _ _ _ _C lerks, file , class C_______ __ _________ 2 9 3 9 .0 9 0 .5 0 _ 3 11 12 3 _ _ _ _ _ _ _ _ _ _ _ _ _Keypunch operators, class A__ _ _ 4 9 3 9 .0 1 2 2 .0 0 - - - 2 1 2 0 14 6 5 1 _ _ - _ _ _ _ _ _ _ _Keypunch operators, class B _____________ 5 2 3 9 .5 1 1 3 .5 0 - - - 9 12 14 1 2 4 1 _ _ _ _ _ _ _ _ _ _ _ _Proof-m achine op erators— __ ____ ___ 1 3 7 3 9 .0 1 0 2 .5 0 - - 10 5 4 4 5 1 8 6 3 1 > _ _ _ _ _ _ _ _ _ _ _Safe-deposit clerks __________ _________ 2 0 3 9 .5 1 1 8 .5 0 _ _ 3 _ 4 3 2 5 2 1 _ _ _ _ _ _ _ _ _Secretaries_________________ ____ ___________ 5 1 9 3 9 .0 1 4 1 .0 0 - - 3 6 6 2 9 1 0 3 1 2 8 1 2 4 4 2 3 2 2 3 9 7 2 1 4 _ _ _ _
Class A__ --- -------------------- ---------- 13 3 9 .0 1 9 7 .0 0 - - - _ _ _ _ _ _ 1 2 1 _ 4 1 _ 4 _ _ _ _C lass B__ — ____________ ______ 5 9 3 8 .5 1 5 2 .0 0 - _ 3 - 3 2 1 12 7 5 7 9 6 3 _ 1 _ _ _ _C lass C_ ____ _________ _______________ 1 7 9 3 9 .0 1 4 3 .0 0 - _ - 6 1 5 2 2 4 9 5 1 15 15 11 3 _ 1 _ _ _ _ _ _C lass D_ _____________________________ __ 2 6 8 3 9 .0 1 3 4 .5 0 - _ - 2 2 2 8 0 6 7 6 6 21 8 2 _ _ _ _ _ _ _ _
Stenographers, general_______ _________ 21 3 9 .5 1 1 3 .0 0 - _ - 4 5 4 7 1 _ _ _ _ _ _ _ _ _ _ _ _Stenographers, senior 13 3 7 .5 1 1 9 .5 0 - _ _ _ 7 2 _ 3 1 _ _ _ _ _ _ _ _ _ _Switchboard operators, c lass B__________ 2 6 3 9 .5 1 0 6 .5 0 _ _ _ 10 7 3 6 _ _ _ _ _ _ _ _ _ _Typists, class A- 10 3 9 .5 1 0 8 .0 0 _ _ _ 2 4 3 1 _ _ _ _ _ _ _ _ _ _ _Typists, c lass B____________________________ 2 1 3 8 .5 1 0 0 .5 0 3 - - 4 9 2 3 - - - - - - - - - - - - - -
Selected computer occupations
Computer operators, c lass A_____________ 2 2 3 8 .5 1 6 7 .5 0 _ _ _ _ _ _ _ 1 5 3 2 6 2 3Computer operators, class B__— -_______ 5 3 3 9 .0 1 3 8 .5 0 _ _ _ _ _ 9 8 11 10 11 4 _ _ _ _ _ _ _Computer operators, class C . .... 3 9 3 8 .5 1 2 1 .0 0 _ _ _ _ 9 14 6 4 3 3 _ _ _ _ _ _ _ _ _ _Computer program m ers, business,
class A _____________________________________ 3 7 3 9 .5 2 3 9 .5 0 - - - _ _ _ _ _ _ _ _ 2 1 3 4 12 6 4 2 3Computer program m ers, business,
class R ...... 16 3 9 .0 2 0 1 .5 0 _ - _ _ _ _ _ 2 1 2 1 1 _ 1 2 4 1 1 _ _Computer program m ers, business,
class C --------------------------------------- -------------- 14 3 8 .5 1 9 0 .5 0 - - - _ _ _ _ 1 _ _ 3 2 _ 2 2 2 2 _ _ _ _Computer system s analysts,
business, class B _________ _ _ 2 6 3 9 .0 2 2 1 .0 0 - " " - - - - - - - - 2 1 6 3 2 3 5 3 1 -
Selected teller occupations
T e llers , note___________ _____ ___ _ 2 2 4 3 9 .0 1 2 4 .0 0 _ _ 6 2 5 3 3 2 9 4 5 4 4 2 4 6 8 3 _ 1T e lle rs , com m e rcia l-sa v in g s____________ 4 9 4 3 9 .0 1 0 9 .0 0 - _ 5 9 7 7 1 7 7 8 8 4 4 2 6 11 8 4 _ _ _ _ _ _ _ _ _ _T e llers , com m ercial 2 2 2 3 8 .5 1 1 6 .5 0 - - _ 7 72 5 7 5 9 2 2 5 - _ _ _ _ _ _ _ _ _ _ _T e lle rs , all-roun d__________________ ______ 5 2 9 3 9 .5 1 1 6 .5 0 " 2 16 81 1 1 1 8 7 1 2 7 6 4 2 4 5 10 2 - - - -
1 The Atlanta Standard M etropolita n S ta tistica l A rea co n s is ts of C layton, Cobb, D eK alb, F ulton , and Gwinnett C ounties.Standard h ou rs r e f le c t the w orkw eek fo r w hich e m p loy ees re c e iv e th e ir reg u lar s tra ig h t-t im e sa la r ie s and the earn ings co r re s p o n d to th ese w eek ly h o u rs . A v e ra g e w eek ly hou rs are rounded
to the n e a re s t ha lf hour and a vera g e w eekly earn ings to the n e a re s t half d o lla r .
Digitized for FRASER http://fraser.stlouisfed.org/ Federal Reserve Bank of St. Louis

Occupation
Average N um ber of w o rk e r s re ce iv in g s tra ig h t -t im e w eek ly earn in gs of—
Number0/
workersWeekly,
(Standard)Weekly earnings 1 2
(Standard)
$70andunder$75
$75
$80
$80
$85
$85
$90
$90
$95
$95
$100
$100
$110
$110
$120
$120
$130
$130
$140
$140
$150
$150
$160
$160
$170
$170
$180
$180
$190
$190
$200
$200
$220
$220
$240
$240
$260
$260
$280
$280
$300
$300
$320
17 38.5 $106.50 3 1 9 1 2 1
34 39.5 93.00 _ 8 6 4 5 1 1 6 3 _ . _ _ _ _ . . . . _ .
16 38.5 93.00 - - 2 1 8 4 144 37.0 87.00 2 6 14 10 6 1 546 39.0 117.00 - - - - - 1 9 20 10 672 38.5 97.50 1 5 3 9 8 14 21 10 - 1
211 39.0 98.50 1 1 17 26 16 49 66 34 1291 39.0 132.00 - - - - 3 8 16 40 67 69 44 23 14 4 1 1 1 - - - - -
13 39.0 162.00 - - - - - - - - - 1 2 3 4 1 - 1 1 - - _ _ _
64 39.0 142.00 - - - - - _ - 7 11 16 10 7 9 3 1 _ _ _ - . - -
160 39.0 131.00 - _ - - 3 8 4 13 34 52 32 13 1 - - _ . - _ _ _ _
54 39.5 116.50 - - - - - - 12 20 2215 38.0 102.50 - - - - 5 4 3 - 327 37.0 120.50 - - _ - - - 5 10 8 2 1 _ 122 38.5 1 1 1 . 0 0 - - - - 3 1 6 6 5 198 38.0 100.50 - 2 9 9 7 20 27 18 697 38.0 93.50 ' ' 2 33 31 17 12 2
25 39.0 168.00 1 5 3 6 4 3 1 252 39.0 144.50 - - - - - - - 4 5 11 17 4 8 2 1 - - - - - - -
32 39.5 115.00 - - - - - - 16 5 9 2
17 39.0 218.00 - - - - - - - - - - - - - 2 1 9 2 1 1 1
35 38.0 184.50 - - - - - - - - - - - 3 3 12 5 5 4 1 2 - -
9 38.5 177.50 - - - - - - - - - 1 1 1 1 1 - 1 3 - - - -
11 39.0 269.00 - - - - - 1 - - - 3 3 1 3
31 39.0 251.00 - - - - - 4 7 8 9 3
12 39.5 200.00 - - - - - - - - - 1 - 1 3 2 2 - 3 - -
369 37.0 104.00 8 18 13 11 62 152 53 43 9,200 39.5 105.00 12 91 63 110 567 232 97 27 1
S elected c l e r i c a l occupations
Bookkeeping-machine o p era tors ,c la ss A---------------------------------------------------
Bookkeeping-machine o p era tors ,c la ss B---------------------------------------------------
C lerks , f i l e , c la ss A---------------------------C lerks , f i l e , c la ss C---------------------------Keypunch o p era tors , c la s s A----------------Keypunch op erators , c la ss B----------------Proof-m achine operators------------------------S e cre ta r ie s ---------------------------------------------
C lass A------------------------------------------------C lass B------------------------------------------------C lass C------------------------------------------------C lass D------------------------------------------------
Stenographers, general-------------------------Stenographers, sen ior---------------------------Switchboard o p era tors , c la s s B-----------T yp is ts, c la s s A-------------------------------------T yp is ts , c la s s B-------------------------------------
S elected computer occupations
Computer o p era tors , c la ss A----------------Computer o p era tors , c la ss B---------------Computer op e ra to rs , c la ss C----------------Computer programmers, busin ess,
c la s s A---------------------------------------------------Computer programmers, bu sin ess,
c la ss B---------------------------------------------------Computer programmers, b u sin ess ,
c la ss C---------------------------------------------------Computer systems a n a ly sts , busin ess,
cla ss A----------------------------------------------------Computer systems a n a ly sts , busin ess,
cla ss B---------------------------------------------------Computer systems a n a ly sts , busin ess,
c la ss C----------------------------------------------------
S elected t e l l e r occupations
T e lle r s , com m ercial-savings----------------T e lle r s , a ll-ro u n d ............ - ........................
1 The B a lt im o re Standard M etro p o lita n S ta tistica l A rea co n s is ts o f the c ity o f B a lt im o re and the coun ties o f Anne A ru n del, B a lt im o re , C a rr o ll , H a rfo rd , and H ow ard .2 Standard h ou rs r e f le c t the w o rk w e e k fo r w hich e m p loy ees re c e iv e d th e ir reg u la r s tra ig h t-t im e s a la r ie s and the ea rn in gs co r re s p o n d to th ese w eek ly h ou rs . A v e ra g e w eek ly hou rs are rounded
to the n e a re s t ha lf hour and a v e ra g e w e e k ly earn ings to the n e a re st half d o lla r .
Digitized for FRASER http://fraser.stlouisfed.org/ Federal Reserve Bank of St. Louis
Average NUMBER OF WORKERS RECEIVING STRAIGHT-TIME WEEKLY EARNINGS OF
Occupation Numberof
workers Weekly,hours
(standard)Weekly , earnings(standard)
$80and
under$85
$85
$90
$90
$95
$95
$100
$100
$110
$110
$120
$120
$130
$130
$140
$140
$150
$150
$160
$160
$170
$170
$180
$180
$190
$190
$200
$200
$220
$220
$240
$240
$260
$260
$280
$280
$300
$300
$320
$320
$340
$340
and
over
Selected clerical occupations
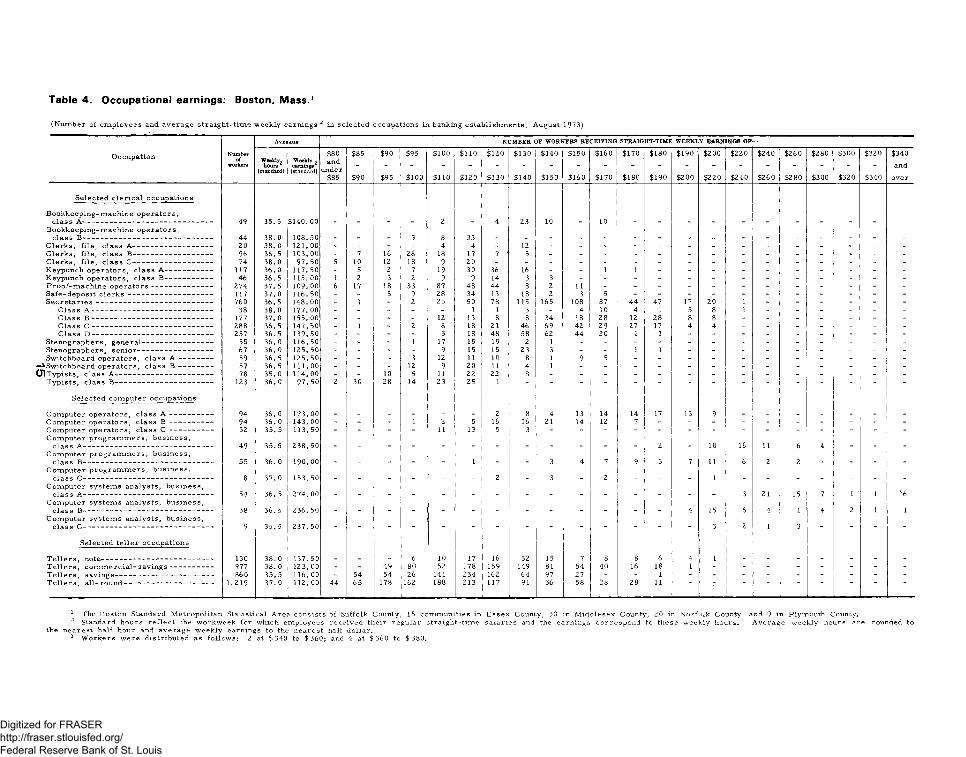
Bookkeeping-machine operators, class A ----------------------------------------------------------- 49 35 .5 $140.00 2 4 23 10 10
Bookkeeping-machine operators, class B----------------------------------------------------------- 44 38. 0 108.50 . _ _ 3 8 33 _ _ _ _ _ _ _ _ _ _ _ _ . . . _
C lerks, file , class A ------------------------------------ 20 38. 0 121.00 - - - - 4 4 - 12 - - - - - - - - - - - - - -C lerks, file , class B------------------------------------ 96 36 .5 103.00 - 7 16 26 18 17 7 ' 5 - - - - - - - - - - - - - -Clerks, file , class C ---------------------------------------------- 74 38. 0 97 .50 5 10 12 18 9 20 - - - - - - - - - - - - - - - -Keypunch operators, class A ---------------------------- 117 36. 0 117.50 - 5 2 7 19 30 36 16 - - 1 1 - - - - - - - - - -Keypunch operators, class B ---------------------------- 46 36 .5 115.00 1 2 3 2 9 9 14 3 3 - - - - - - - - - - - - -Proof-m achine operators ------------------------------------ 274 37 .5 109.00 6 17 18 33 87 48 44 8 2 11 - - - - - - - - - - - -Safe-deposit c le r k s ------------------------------------------------- 117 37. 0 116.50 - - 5 9 28 34 13 18 2 3 5 - - - - - - - - - - -Secretaries ------------------------------------------------------------------- 760 36 .5 148.00 - 1 - 2 25 50 78 115 165 108 87 44 47 17 20 1 - - - - - -
C lass A ---------------------------------------------------------------------- 38 38. 0 177.00 - - - - - 1 1 3 - 4 10 4 1 5 8 1 - - - - - -C lass B ---------------------------------------------------------------------- 177 37. 0 155.00 - - - - 12 13 8 8 34 18 28 12 28 8 8 - - - - - - -C lass C --------------------------------------------------------------------- 288 36.5 147.50 - 1 - 2 8 18 21 46 69 42 29 27 17 4 4 - - - - - - -C lass D ---------------------------------------------------------------------- 257 36 .5 139.50 - - - - 5 18 48 58 62 44 20 1 1 - - - - - - - - -
Stenographers, general----------------------------------------- 55 36 .0 116.50 - - - 1 17 15 19 2 1 - - - - - - - - - - - - -Stenographers, senior -------------------------------------------- 67 36. 0 125.50 - - - - 9 15 15 23 3 - - 1 1 - - - - - - - - -Switchboard operators, c lass A -------------------- 59 36. 5 125.50 - - - 3 12 11 10 8 1 9 5 - - - - - - ~ 1 - - - -
— Switchboard operators, class B -------------------- 57 36 .5 1 1 1 .00 - - - 12 9 20 11 4 1 - - - - - - - - - - - -O lT ypists, c lass A --------------------------------------------------------- 78 35 .0 114.00 - - 10 5 11 22 22 8 - - - - - - - - - - - - - -
Typists, c lass B--------------------------------------------------------- 123 36. 0 97. 50 2 30 28 14 23 25 1 “ - - - - " " " " " " " -
Selected computer occupations
Computer operators, class A ------------------------- 94 36 .0 173.00 2 8 4 13 14 14 17 13 9 _
Computer operators, c lass B -------------------- 94 3 6 .0 143.00 - - - 1 2 5 16 16 21 14 12 7 - - - - - - - - - -Computer operators, c lass C -------------------- 32 35. 5 113.50 - - - - 11 13 5 3 - - - - - - - - - - - - - |Computer program m ers, business,
class A ----------------------------------------------------------- 49 35 .5 23 8 .50 _ _ _ _ _ _ _ _ _ _ _ _ 2 _ 10 16 11 6 4 _ _ _Computer program m ers, business,
class B----------------------------------------------------------- 55 36 .0 190.00 _ _ _ _ 1 _ . 3 4 7 9 3 7 11 6 2 2 . _ _ _Computer program m ers, business,
class C----------------------------------------------------------- 8 37. 0 153.50 _ _ . _ _ _ 2 _ 3 _ 2 _ _ _ 1 _ _ _ _ _ _ _
Computer system s analysts, business, class A ----------------------------------------------------------- 54 36. 5 27 4 .00 _ _ _ _ _ _ _ _ _ _ _ _ _ _ _ 3 21 15 7 1 1 36
Computer system s analysts, business, class B----------------------------------------------------------- 38 36 .5 236.50 _ _ _ _ _ _ . _ _ . _ _ _ 4 15 6 4 1 4 2 1 1
Computer system s analysts, business, class C----------------------------------------------------------- 9 35 .5 23 7 .50 - - - - - - - - - - - - - - 3 2 1 3 - - - -
Selected teller occupations
T e llers , note--------- ------------------------------------------ 130 38. 0 137.50 6 10 17 16 32 15 7 8 8 6 4 1T e llers , com m e rcia l-sa v in g s------------------- 977 38. 0 123.00 - - 49 80 152 178 159 149 81 54 40 16 18 1 - - - - - - - -T e llers , savings--------------------------------------------- 860 35 .5 116.00 - 54 54 26 141 234 162 64 97 27 - - 1 - - - - - - - - -T e llers , a ll-rou n d --------------------------------------------------- 1,219 37 .0 112.00 44 65 178 162 188 213 117 91 36 58 28 28 11 ' " ' " ~ ' ' '
1 The B oston Standard M etro p o lita n S ta tistica l A re a co n s is ts of Suffolk County, 15 com m u n ities in E s se x County, 30 in M id d le se x County, 20 in N o r fo lk County, and 9 in P lym outh County.2 Standard h ou rs r e f le c t the w o rk w eek fo r w hich e m p loy ees re c e iv e d th e ir re g u la r stra ig h t-t im e sa la r ie s and the ea rn in gs co r re s p o n d to th ese w eek ly h ou rs . A v e ra g e w eek ly hours are rounded to
the n e a re s t ha lf hour and a v e ra g e w e e k ly earn ings to the n e a re st half d o lla r .3 W o rk e rs w e re d is tr ib u te d as fo l lo w s : 2 at $ 340 to $ 3 6 0 ; and 4 at $ 360 to $ 380.
Digitized for FRASER http://fraser.stlouisfed.org/ Federal Reserve Bank of St. Louis

OccupationNumber
of
Average NUMBER OF WORKERS RECEIVING STRAIGHT-TIME WEEKLY EARN!INGS OF
Weekly hours 2(standard)
Weekly earnings 2(standard)
$70and
under$75
$75
$80
$80
$85
$85
$90
$90
$95
$95
$100
$100
$110
$110
$120
$120
$130
$130
$140
$140
$150
$150
$160
$160
$180
$180
$200
$200
$220
$220
$240
$240
$260
$260
$280
$280
$300
$300
$320
$320
$340
$340andover
Selected c lerica l occupations
Bookkeeping-machine operators,c lass A _ . 158 37.0 $119.00 - - - - 24 11 18 35 31 15 13 10 1 - - - - - - - -
Bookkeeping-machine operators,c la ss B __________________________________ _ 125 37.0 100.50 - - 45 - 9 14 24 12 10 5 6 - - - - - - - - - - -
C lerk s, file , c lass A ________________________ 59 39.0 109.50 - - - - 1 12 24 7 12 3 - - - - - - - - - - - -C lerks, file , c lass B ____________________ 127 39.0 107.00 - - - - 18 34 26 29 16 2 1 1 - - - - - - - - - -C lerk s, file , c lass C _______ _____________ 709 37.5 95.50 20 39 88 73 140 123 135 60 23 8 - - - - - - - - - - - -Keypunch operators, c lass A __________ 154 38.5 130.50 - - - - - - 9 32 33 38 34 6 2 - - - - - - - - -Keypunch operators, c lass B ______________ 184 38.5 116.50 - 1 - 1 4 2 53 47 56 13 7 - - - - - - - - - - -Proof-m achine o p era to rs___________________ 812 37.0 105.50 8 12 40 59 60 102 249 153 93 32 4 - - - - - - - - - - -Safe-deposit c le r k s __________________ ___ 259 37.5 117.50 - 5 1 15 9 40 40 49 44 18 13 11 11 2 1 - - - - - - -Secretaries________________________ ________ 1,467 38.5 149.50 - - - - 6 - 51 83 200 224 287 154 272 131 48 8 3 - - - - -
C lass A _____ _________________ __________ 136 38.5 181.00 - - - - - - - - 4 4 12 4 46 35 22 6 3 - - - - -C lass B __________________ _________________ 414 38.5 164.00 - - - - - - - 8 17 30 63 65 126 77 26 2 - - - - - -C lass C _________________________ __________ 524 38.5 146.00 - - - - - - 11 11 65 103 150 70 96 18 - - - - - - - -C lass D ___ ________________________________ 393 37.5 127.50 - - - - 6 - 40 64 114 87 62 15 4 1 - - - - - - - -
Stenographers, gen eral___________________ _ 94 38.0 121.50 - 1 1 - - 1 12 36 18 17 - 4 4 - - - - - - - - -
Stenographers, senior ____________________ 125 38.5 132.00 - - - - - - - 27 28 29 35 6 - - - - - - - - - -Switchboard operators, c lass A ________ 70 38.0 121.00 - - - - - 4 9 23 22 1 9 1 1 - - - - - - - - -Switchboard operators, c lass B _______ 190 37.5 106.50 - 1 3 29 10 36 37 33 27 6 8 - - - - - - - - - - -Typists, class A ________________________ 283 39.5 116.50 - - - - - 3 64 138 48 18 11 1 - - - - - - I - - -
Typists, c lass B __________________ _ _ 267 38.0 108.00 - - - 27 44 102 52 32 10 - - " “ _ ~ “ " "
Selected computer occupations !
Computer operators, c lass A ______________ 114 39.0 186.50 - - - - - - - - - - 2 4 40 42 19 6 1 - - - - !
Computer operators, c lass B ______________ 140 38.0 153.50 - - - - - - - 2 5 38 15 30 43 7 - - - - - - - -
Computer operators, c lass C ___________ _ 69 38.5 128.50 - - - - - 13 2 7 16 15 4 6 6 - - - “ - - “ ~ “Computer program m ers, business,
class A ___________________________________ __ 120 39.0 249.50 - - - - - - - - - - - - 1 8 11 28 29 19 17 6 1Computer program m ers, business,
class B _______________________________________ 137 39.0 193.00 - - - - - - - - - - - - 54 43 20 12 4 3 1 -Computer program m ers, business,
c la ss C __________________________________ — - 32 37.5 167.50 - - - - - - - - - - 13 1 9 5 3 1 - - - - -Computer system s analysts,
business, class A _________________________ - 108 39.0 285.50 - - - - - - - - - - - - - 2 8 15 20 28 20 10 5Computer system s analysts,
business, c lass B ---------------------------------- —— 62 38.5 232.50 - - - - - - - - - - - - - 7 21 10 11 6 3 3 1 -Computer system s analysts,
business, class C ------------------------------- — — 7 39.0 198.00 " " " “ _ “ " " “ 2 1 3 " 1 " " " "Selected teller occupations
T e lle rs , note — ---------------------------------- 457 37.5 133.00 _ - _ 38 13 - 31 49 99 61 56 39 46 18 7 - - - - - - -T e lle rs , c o m m e rcia l-sa v in g s-------------------- 583 37.5 108.50 - - 21 50 99 84 104 83 56 35 36 14 - 1 - - - - - - - -
T e lle rs , com m ercia l____________________ ___ 513 36.5 118.50 - 5 18 21 32 20 89 90 121 33 33 28 20 3 - - - - - - - -T e lle rs , savings--------------------------------------------- 367 36.5 118.00 - 7 13 18 10 20 74 64 67 42 19 17 15 1 - - - - - - - -T e lle rs , a ll-ro u n d -------------------------------------— 2,205 37.5 109.50 4 ■ 89 100 101 221 852 353 261 116 57 31 16 4 - " " ‘ "
1 The C h ica g o Standard M e tro p o lita n S ta tis t ica l A r e a co n s is ts of C ook, D uPage, K ane, L ake, M cH enry, and W ill C ounties.2 Standard hou rs r e f le c t the w o rk w e e k fo r w h ich e m p loy ees re c e iv e th eir reg u lar s tra ig h t -t im e sa la r ie s and the earn in gs co r re s p o n d to th ese w eek ly h ou rs . A v e ra g e w eek ly h ou rs a re rounded to
the n e a re s t h a lf hour and a v e ra g e w eek ly ea rn in gs to the n e a re st half d o lla r .
Digitized for FRASER http://fraser.stlouisfed.org/ Federal Reserve Bank of St. Louis

Averaqx NUMBER OF WORKERS RECEIVING STRAIGHT-TIME WEEKLY EARNINGS OF—
Oc cupationNumber
ofworkers
Weekly,hours
(standard)
Weeklyearnings(standard)
$65and
tinder$70
$70
$75
$75
$80
$80
$85
$85
$90
$90
$95
'$95
$100
$100
$110
$110
$120
$120
$130
$130
$140
$140
$150
$150
$160
$160
$170
$170
$180
$180
$190
$190
$200
$200
$210
$210
$220
$220
$230
$230
$240
$240
$25 0
Selected c lerical occupations
r iA r l r a f i la r b s f i P 125 38.5 $91.00 8 21 32 18 26 19 1Keypunch operators, c lass B ___________ _ 22 38.5 99.50 - - 2 5 5 8 1 1Proof-m achine o p e ra to rs ----------------------------- 69 39.0 98.00 - - 2 10 6 15 11 11 8 4 - 2 - - - - - - - _ _ -Safe-deposit c le r k s __________________________ 20 39.0 109.00 - - 1 - 2 - 4 2 9 1 - - - - 1 _ _ _ _ _ _ _Secretaries_________ _ __ _____ ___________ 171 38.5 138.50 - - - - - - 4 10 25 30 23 27 20 16 5 9 1 1 _ _ _ _
C lass A _ _________._______________________ 10 38.5 164.50 - - - - - - - _ _ _ _ 2 2 2 1 3 _ _ _ _ _ _C lass B ____________________________ ______ 4 4 38.5 151.00 - - - - - - _ _ 4 8 3 9 2 6 4 6 1 1 _ _ _ _C lass C ___ ________________________ _______ 52 38.5 143.00 - - - - - - _ 1 5 5 10 9 14 8 _ _ _ _ _ _ _ _C lass D __________________________________ 65 39.0 122.50 - - - - - - 4 9 16 17 10 7 2 _ _ _ _ _ _ _ _ _
S fA n n o r a p lip r a £ A n A r a l 25 38.5 109.00 5 1 3 5 4 2 4 l
Selected computer occupations
Computer operators, c lass B ______________ 13 38.0 150.50 - - - - - - _ - 1 2 1 _ 5 3 1 _ _ _ _ _ _ _Computer operators, c lass C ___________ 10 38.0 135.00 - - - - - - - - 1 3 2 2 2 - - - - - _ _ _ _Computer program m ers,
K iie in o e o r la a a A 7 38.0 203.50 2 1 1Computer program m ers,
13 38 .0 171.50 2 2 1 4Computer system s analysts.busin ess, c lass B ______________________ 7 38.5 211.00 - " " - " " - - * - 1 1 - " 3 1 - 1
Selected teller occupations
T e lle rs , n o te --------------------------------------------------- 33 39.0 114.00 _ 4 _ _ 4 _ 2 3 3 5 5 6 1 _ _ _ _ _ _ _ _ _T e lle rs , a ll-ro u n d ________________________ 788 38.5 108.00 4 4 16 36 50 57 118 176 144 77 57 32 13 3 1 " - -
1 The Cincinnati Standard Metropolitan Statistical Area consists of Clermont, Hamilton, and Warren Counties, Ohio; Boone, Campbell, and Kenton Counties, Ky.; and Dearborn County, Ind.2 Standard hours reflect the workweek for which employees receive their regular straight-tim e salaries and the earnings correspond to these weekly hours. Average weekly hours are rounded to
the nearest half hour and average weekly earnings to the nearest half dollar.
Digitized for FRASER http://fraser.stlouisfed.org/ Federal Reserve Bank of St. Louis

OccupationNumber
ofworkers
Selected clerical occupations
Bookkeeping-machine operators,class A — ------------------------------------------ -------
Bookkeeping-machine operators,class B -------------------------—-------------------——
Clerks, file, class B ----------------------------------Clerks, file, class C ________ ___________ _Keypunch operators, class A _____________Keypunch operators, class B ____ _______Proof-machine operators________________Safe-deposit c lerk s________________________Secretaries _________________________________
Class B _________________________________Class C _________________________________
Stenographers, general__________ ________Stenographers, senior ______________——Switchboard operators, class A ----------------Switchboard operators, class B __________Typists, class A -----------------------------------------Typists, class B -----------------------------------------
22
6949
1595139
26043
4401398
14918058452144 2345
Selected computer occupations
Computer operators, class A ---------------Computer operators, class B — --- --------Computer programmers, business,
class A --------------------------------------------------Computer programmers, business,
class B --------------------------------------------------Computer programmers, business,
class C -------------------------------------------------Computer systems analysts, business,
class A ________________________________
1942
26
33
6
25
Selected teller occupations
Tellers, note---------------------------Tellers, commercial-savingsTellers, commercial_________Tellers, savings----------------------Tellers, all-round------------------ 1
22319211030
429
Avuuas NUMBER OF WORKERS RECEIVING STRAIGHT-TIME WEEKLY EARNINGS OF—
Wwkly hows *
(standard)Waeklyearnings*
(standard)
$65and
under$70
$70
$75
$75
$80
$80
$85
$85
$90
$90
$95
'$95
$100
$100
$110
$110
$120
$120
$130
$130
$140
$140
$150
$150
$160
$160
$180
$180
$200
$200
$220
$220
$240
$240
$260
$260
$280
$280
$300
$300
$320
$321
$341
40.0 $115.00 4 3 7 8
39.5 93.00 _ _ 12 12 4 9 15 14 2 140.0 92.50 - 10 - 3 8 6 7 13 239.0 85.00 5 8 37 10 48 44 3 440.0 119.50 . - - - - - - 7 19 20 539.5 104.50 - - - - 2 4 7 15 8 339.5 92.50 - 16 11 25 58 54 39 37 18 1 139.0 101.50 - - 5 - 2 11 2 7 12 4 - - - - - - - - - - - -39.5 133.50 - - - - - 7 13 34 52 89 86 87 28 39 5 - - - - - - -39.0 164.50 - - - - - - - - - - - 4 - 7 2 - - - - - - -39.5 143.00 _ . - - - - 7 2 4 15 15 22 10 20 3 - - - - - - -39.5 137.50 _ - - - _ _ - 6 9 28 40 42 13 11 - - - - - - - -40.0 123.00 _ _ - - - 7 6 26 39 46 31 19 5 1 - - - - - - - -39.0 115.50 _ _ - - - 4 7 11 16 12 - 8 - - - - - - - - - -40.0 128.00 - . - - - - - 6 6 10 15 7 1 - - - - - - - - -40.0 110.00 - _ - . - 1 2 6 10 239.5 95.00 6 _ 4 - 6 8 2 8 10 - - - - - - - - - - - -40.0 106.00 - - - - - - 7 10 5 1 _40.0 103.50 “ ” " 4 7 6 18 8 2 " "
40.0 160.50 6 5 7 140.0 141.50 - - - - - - 1 5 6 9 8 5 8 - - - " -
40.0 264.50 - - - - - - - - - - - - - - - 3 6 1 7 5 4 -
40.0 207.00 - - - - - - - - - - - - 2 5 9 6 4 6 1 - - -
40.0 164.00 - - - - * - - - - - - 1 2 3 - - - - - - - -
40.0 297.00 1 7 3 11 3
39.5 113.50 6 11 29 12 41 44 35 27 12 639.5 100.50 _ 6 - 12 12 32 38 66 12 5 5 4 - - - - - - - - - -
40.0 112.50 - - - - 2 15 - 37 21 25 10 - - - - - - - - - - -39.0 102.50 _ - - - 1 10 3 8 5 339.5 99.50 - 6 18 16 51 111 48 105 37 11 23 3 ~ ~ “ “ ” ~ “ “ ■
1 The Dallas Standard Metropolitan Statistical Area consists of Collin, Dallas, Denton, Ellis, Kaufman, and Rockwall Counties.2 Standard hours reflect the workweek for which employees receive their regular straight-time salaries and the earnings correspond to these weekly hours. Average weekly hours are rounded to
the nearest half hour and average weekly earnings to the nearest half dollar.
Digitized for FRASER http://fraser.stlouisfed.org/ Federal Reserve Bank of St. Louis

Number of workers receiving straight-tim e weekly earnings of—
OccupationNumber
•rworkers boon(standard) 235 *(standard)
$70and
under$75
$75
$80
$80
$85
$85
$90
$90
$95
$95
$100
$100
$110
$110
$120
$120
$130
$130
$140
$140
$150
$150
$160
$160
$170
$170
$180
$180
$190
$190
$200
$200
$210
Selected clerical occupations
Clerks, file, class A --------------------------------- 16 40.0 $108.00 _ _ _ _ 4 1 4 3 4 _ _ _ _ _ _ . _risrlraj file1 class R 139 40.0 85.50 24 41 41 24 8Clerks, file, class C 20 40.0 80.00 _ 5 15 _ _ _ _ _ _ _ _ _ _ _Proof-machine operators — ___ 165 40.0 96.50 2 - 21 29 44 17 29 11 12 _ _ _ _ _ _ _ _Safe-deposit clerks - 68 40.0 102.00 - 7 - 6 15 4 16 9 8 2 - _ 1 _ _ _ _Secretaries3 — 196 40.0 139.00 - - - - - - 14 24 22 45 38 28 14 5 1 3 2
Class A 9 40.0 159.00 - - - _ . - - _ 2 - 1 _ 2 3 _ 1Class B — — 65 40.0 143.00 - - . . _ _ 12 7 1 7 9 14 8 2 1 3 1Class C - 66 40.0 138.00 - - - - - - 2 13 4 11 18 14 4 _ _ _
Stenographers, general_______- ------------ 32 40.0 107.50 - - - - - 9 12 5 5 1 _ - _ _ _ _ _Stenographers, senior ——______________ __ 70 40.0 125.00 - - - - - - 19 6 19 13 9 2 2 - _ - _Switchboard operators, class A _ _ 22 40.0 115.00 - - - - 4 - 5 3 4 5 1 _ _ _ _ _Switchboard operators, class B —_ 40 40.0 93.50 - 7 1 - 16 7 8 1 _ _ _ _ _ _ _ _ _Typist8, class A _ ___ 62 40.0 105.00 - - 4 2 8 7 19 13 9 _ _ _ _ _ _ _Typists, class B_ _ _ 64 40.0 93.00 - - 34 15 6 5 - 4 - - - - - - - -
Selected computer occupations
Computer operators, class A . .... 11 40.0 170.00 - - - - - - - - - - - - 6 4 1 - -
Selected teller occupations
Tellers, note . ............ . . 120 40.0 117.50 _ _ _ 4 6 8 27 25 21 17 8 4 _ _ _ . _Tellers, commercial-savings _ . 563 40.0 101.00 14 25 12 92 86 88 110 57 43 18 18 _ _ _ _ _Tellers, all-round ... . . __ 191 40.0 100.00 12 15 35 7 31 19 16 29 6 4 7 10 - -
s _i
1 The Denver Standard Metropolitan Statistical Area consists of Adam s, Araphoe, Boulder, Denver, and Jefferson Counties.2 Standard hours reflect the workweek for which employees receive their regular straight-tim e salaries and the earnings correspond to these weekly hours. Average
weekly hours are rounded to the nearest half hour and average weekly earnings to the nearest half dollar.3 Includes workers in classification in addition to those shown separately.
Digitized for FRASER http://fraser.stlouisfed.org/ Federal Reserve Bank of St. Louis

OccupationNumber
ofworkers
Atbbagx NUMBER OF WORKERS RECEIVING STRAIGHT-TIME WEEKLY EARNINGS OF
Weekly hours 2
(standard)Weeklyearnings2(standard)
$70and
under$80
$80
$90
$90
$100
$100
$110
$110
$120
$120
$130
$130
$140
$140
$150
$150
$160
$160
$170
$170
$180
$180
$190
$190
$200
$200
$210
$210
$220
$220
$240
$240
$260
$260
$280
$2 80
$300
$300
$320
$320
$340
$340
$360
Selected clerical occupations
Bookkeeping-machine operators,class A ____________________________________ _ 11 39.0 $125.50 - - - 4 2 - - 5 - - - - - - - - - - - - - -
Bookkeeping-machine operators,c lass B ------------------------------------------------------- _ 41 39.5 106.50 - 6 10 9 4 9 2 - 1 - - - - - - - - - - - - -
C lerks, file , c lass B ________________________ 42 39.0 104.00 - 13 7 4 7 8 2 1 - - - - - - - - - - - - - -C lerk s, file , c lass C ________________________ 139 40.0 97.00 9 18 56 42 10 - 4 - - - - - - - - - - - - - - -Keypunch operators, class A _____________ _ 78 40 .0 124.00 - - - 17 18 19 11 10 3 - - - - - - - - - - - - -Keypunch operators, class B ______________ 45 40.0 118.50 - - 2 2 20 12 7 1 1 - - - - - - - - - - - - -Proof-m achine operators 396 40.0 110.00 48 29 55 83 52 43 37 47 2 - - - - - - - - - - - - -Safe-deposit c le r k s __________________________ 112 40.0 125.50 - 6 2 19 25 13 14 20 13 - - - - - - - - - - - - -Secretaries______________________________ __ _ 516 40.0 157.50 - 11 2 14 13 42 62 59 81 73 51 45 28 10 9 11 5 - - - - -
C lass A __________________________________ 21 40.0 189.50 - - - - 2 - - - 7 - 1 1 1 - 1 5 3 - - - - -C lass B _____________________________________ 61 39.5 178.00 - 4 - 2 2 3 - 1 1 5 2 9 14 8 5 4 1 - - - - -C lass C _____________________________________ 223 40.0 159.00 - 5 - - 3 4 29 28 33 54 40 20 - 1 3 2 1 - - - - -C lass D __________________________________ _ 211 40 .0 146.50 - 2 2 12 6 35 33 30 40 14 8 15 13 1 - - - - - - - -
Stenographers, general_____________________ 66 40 .0 124.50 - - 2 7 21 11 13 12 - - - - - - - - - - - - - -Stenographers, s e n io r ______________________ 50 40 .0 150.00 - - - - - 3 12 11 11 8 5 - - - - - - - - - - -
10 Switchboard operators, c lass A ________ 21 39.5 133.50 - - - - 2 5 6 8 - - - - - - - - - - - - - -O Switchboard operators, c lass B ---------- - 45 40.0 111.00 5 2 - 14 10 6 5 3 - - - - - - - - - - - - - -
T ypists, c lass A ___________________________ 88 39.5 133.50 - - 2 7 7 23 19 9 16 5 - - - - - - - - - - - -T ypists, c lass B ______________________________ 260 40.0 116.00 9 5 81 62 53 49 1 " " “ - - - - ! ~ " - -
Selected computer occupations|
Computer operators, class A --------------- 25 40.0 184.00 - - - - - - - - 3 4 6 1 4 5 1 1 1 - - - -Computer operators, class B --------------- 32 40 .0 168.50 - - - - - - 2 6 1 9 5 4 2 2 1 - ■ - - - -Computer operators, c lass C ----------------- _ 26 40.0 131.00 - - - 5 7 1 - 3 8 1 1 - - - - - - - - - - -Computer program m ers, business,
class A ----------------------------------------------------------- 43 40 .0 267.00 - - - - - - - - - - - - - 2 - 4 8 16 9 4 -Computer program m ers, business,
c la ss B _______________________________________ 28 40.0 219.00 - - - - - - - - - - - 1 6 5 3 8 4 1 - - -Computer program m ers, business,
class C _______________________________________ 20 40.0 180.50 - - - - - 1 3 - 2 2 2 4 1 - 1 3 1 - - - - -Computer system s analysts, business,
class A ----------------------------------------------------------- 34 40 .0 311.50 - - - - - - - - - - - - - - - - 1 3 7 9 11 3Computer system s analysts, business,
c lass B _____________________________ — — 23 40 .0 264.50 - " - " “ - “ - " - 1 1 9 5 6 1 -
Selected teller occupations
T e lle rs , n o te ---------------------------------------------- 64 40 .0 125.50 _ 2 14 _ 11 10 12 5 5 2 2 1 _ _ _ _ _ _ _ _T e llers , c o m m e rcia l-sa v in g s-------------------- 1,261 40 .0 124.00 - 38 115 192 257 187 137 155 160 20 - - - - - - - - - - - -T e lle rs , com m ercia l--------------------------- __ _ 70 40.0 122.50 - 8 - 12 22 8 4 4 4 8 - - - - - - - - - - - -T e lle rs , savin gs______________________________ 74 40.0 110.50 - 12 6 20 16 12 4 4 - - - - - - - - - - - - - -T e lle rs , a ll-ro u n d ----------------------------------------- 1,334 40.0 118.00 7 164 179 174 206 226 111 79 115 73 “ • “ “ " “ " " “ “
1 The Detroit Standard Metropolitan Statistical Area consists of Macomb, Oakland, and Wayne Counties.2 Standard hours reflect the workweek for which employees receive their regular straight-tim e salaries and the earnings correspond to these weekly hours. Average weekly hours are rounded to the
nearest half hour and average weekly earnings to the nearest half dollar.
Digitized for FRASER http://fraser.stlouisfed.org/ Federal Reserve Bank of St. Louis

(Number of em ployees and average straight-time weekly earnings 2 in selected occupations in banking establishments, October 1973)
ArlRAUK NUMBER OF WORKERS RECEIVING STRAIGHT-TIME WEEKLY EARNINGS OF—
OccupationNumber
ofworkers Week*
houn *(standard)
Weekly.j earping*6 (standard)
$75and
unde*$80
$80
$85
$85
$90
$90
$95
$95
$ 100
$100
$110
$ 110
$ 120
$ 120
$ 130
$130
$140
$140
$ 150
$ 150
$ 160
$160
$ 170
$170
$ 180
$180
$190
$190
$200
$200
$210
$210
$220
$220
$230
$230
andover
Selected clerical occupations
Bookkeeping-machine, operators,class A ---------------------------------------------------------- 11 36 .5 $120.00 - - - - 1 3 4 1 - - 2 - - - - - - - -
C lerks, file, class C ----------------------------------- 9 36 .5 89 .50 2 - 1 3 3 - - - - - - - - - - - - - -Proof-m achine o p erators--------------------------- 103 36 .5 95 .00 - 12 26 29 11 18 7 - - - - - - - - - - - -Secretaries 3 -------------------------------------------------- 289 36 .0 134.00 - _ 1 - 3 21 42 52 96 33 18 11 4 5 1 - 1 1 -
C lass B ................................................................... 45 36 .5 145.00 . _ _ _ 8 1 1 4 12 9 4 2 4 _ _ - - -C lass C ------------------------------------------------------ 120 36 .0 137.50 _ _ - _ 1 5 13 73 16 6 5 1 - - - -
Stenographers, senior______________________ 11 36 .5 125.00 _ - - - . . 5 2 2 2 - - - - - - - - -Switchboard operators, class B --------------- 14 36 .5 99 .50 - 4 2 - 2 1 3 2 - - • - - - - - - - -Typists, class A -------------------------------------------- 82 36 .0 111.00 - 1 1 9 33 27 8 2 - 1 - “ - - - -
Selected computer occupations
Computer operators, class B ------------------- 20 36 .0 150.00 - - - _ 2 1 2 6 4 2 2 1 - - - - -Computer operators, class C ------------------- 22 36. 0 133.50 - - - - - - 1 8 9 4 - - - - - - - - -Computer program m ers, business,
8class B---------------------------------------------------------- 25 3 6 .0 206.00 - - - “ - - - “ “ 2 1 4 7 1 2
Selected teller occupations
T e llers , note-------------------------------------------------- 107 36 .5 117.50 1 1 25 8 20 12 10 7 6 7 7 3 . _ - - -T e llers , com m e rcia l-sa v in g s------------------- 174 37 .0 99 .00 - 12 33 39 15 48 9 12 1 5 - - - - - - - -T e llers , savings-------------------------------------------- 160 35. 5 102.00 3 2 16 23 31 59 14 8 4 " " “ “ ' ' ' L _
1 The Hartford Standard Metropolitan Statistical Area consists of the city of Hartford and the towns of Andover, Avon, Bloomfield, Bolton, Canton, Coventry, Cromwell, East Granby, East Hartford, East Windsor, Ellington, Enfield, Farmington, Glastonbury, Granby, Manchester, Newington, Rocky Hill, Simsbury, South Windsor, Suffield, Vernon, W est Hartford, W ethersfield, Windsor, and Windsor Locks.
2 Standard hours reflect the workweek for which employees receive their regular straight-tim e salaries and the earnings correspond to these weekly hours. Average weekly hours are rounded to the nearest half hour and average weekly earnings to the nearest half dollar.
3 Includes workers in classification in addition to those shown separately.
Digitized for FRASER http://fraser.stlouisfed.org/ Federal Reserve Bank of St. Louis

i n u t t Number of workers receiving straight-tim e weekly earnings of—
OccupationNumber
ofworkers T S ? 2(standard) (standard)
$70and
under$80
$80
$90
$90
$100
$100
$110
$110
$120
$120
$130
$130
$140
$140
$150
$150
$160
$160
$170
$170
$180
$180
$190
$190
$200
$200
$210
$210
$220
$220
$240
$240
$260
$260
$280
$280
$300
$300
$320
$320
$340
Selected clerical occupations
Bookkeeping-machine operators,class A ____________________________ 15 38.5 $121.00 - - 6 - 4 - - - 5 - - - - - - - - - - -
Clerks, file, class B __________________ 21 39.5 102.50 - 6 7 2 2 1 3Clerks, file, class C ._________________ 27 39.0 90.00 - 12 14 1 - - - - - - - - - - - - - - - -Keypunch operators, class A . ------- 13 40.0 127.00 - - - 1 2 5 2 3 - - - - - - - - - - - -Keypunch operators, class B . 53 40.0 115.00 - 3 4 20 9 7 3 7 - - - - - - - - - - - -
268 38.5 102.50 10 48 64 68 35 42 1Safe-deposit clerks _________—___________ 51 38!o 1 0 1 .5 0 15 5 17 6 4 4Secretaries— ______________ ____ — 679 39.0 137.50 - 9 32 39 56 137 136 103 49 46 34 22 3 11 2 - - - - -
Class A ______________ __________________ 17 39.5 184.00 - - - - - - - 1 3 1 2 3 1 4 2 - - - - -Class B _____________•— ______ ____ 188 38.5 143.50 - 4 12 - 17 36 28 18 16 20 12 16 2 7 - - - - - -Class C _________________ ______ 289 39.0 134.50 - - 20 22 32 49 55 52 25 13 18 3 - - - - - - - - -Class D_„_____________ _____ 185 39.5 132.50 - 5 - 17 7 52 53 32 5 12 2 - - - - - - - - - -
Stenographers, general. ----------------- 72 39.5 112.00 - 8 9 9 23 16 7Stenographers, senior------- ----- — . 53 40.0 126.50 - - - - 5 39 4 5 - - - - - - - - - - - - -Switchboard operators, class A ---------- 6 39.5 110.50 - 1 1 1 1 1 1Switchboard operators, class B --------------- 104 39.0 101.50 6 23 22 21 23 4 5
Selected computer occupations
Computer operators, class A ____________ 11 40.0 162.50 - - - - - - - 2 3 1 5Computer operators, class B ______ 28 40.0 145.00 - - - 1 1 - 4 13 7 2 - - - - - - - - - - -Computer operators, class C _ -------- . 25 40.0 118.00 - - 1 3 14 4 2 1 - - - - - - - - - - - - -Computer programmers, business.
class B ______________________________ 17 40.0 178.50 - - - - - - - 1 1 3 5 3 2 1 1 - - - - - -Computer systems analysts,
business, class A ------------------------------ 8 40.0 294.50 - - - - - - - - - - - - - - - - 2 - 1 4 1Computer systems analysts,
business, class B __________________ 27 40.0 250.00 - - - " - - - “ ' “ 1 3 4 10 8 1 -
Selected teller occupations
Tellers, note______________ ______ _____ 396 38.5 118.00 20 11 46 67 60 78 78 10 8 9 7 2 _ _ _ _ _ _ - _ _Tellers, commercial-savings ---------- . 823 38.5 107.00 40 n o 118 197 178 102 39 11 18 10 - - - - - - - - - - -Tellers, commercial_____________________ 79 39.0 108.50 - 20 9 9 14 18 6 3 - - - - - - - - - - - - -Tellers, all-round________________________ 165 38.5 112.50 5 35 55 24 15 14 7 5 5 * “ “ “ * “ ~ “ ■
1 The Houston Standard Metropolitan Statistical Area consists of Brazoria, Fort Bend, H arris, Liberty, and Montgomery Counties.2 Standard hours reflect the workweek for which employees receive their regular straight-tim e salaries and the earnings correspond to these weekly hours. Average weekly hours are rounded
to the nearest half hour and average weekly earnings to the nearest half dollar.
Digitized for FRASER http://fraser.stlouisfed.org/ Federal Reserve Bank of St. Louis

(Number of employees and average straight-time weekly earnings 2 in selected occupations in banking establishments, October 1973)
i n u » NUMBER OF WORKERS RECEIVING STRAIGHT-TIME WEEKLY EARNINGS OFTTmiIiii $70 $75 $80 $85 $90 $95 $100 $110 $120 $130 $140 $150 $160 $170 $180 $190 $200 $210 $220 $230 $240 $250
Occupation ■wkm W-kfr, and(staadaupdy {staaftaidl
W$7<5 $80 $85 $90 $95 $100 $110 $120 $130 $140 $150 $160 $170 $180 $190 $200 $210 $220 $230 $240 $250 $260
Selected clerical occupations
Bookkeeping-machine operators.class A _ ........ ................... . 9 38.5 $110.00 1 2 6
Clerks, file, class C _ __ SO 39.5 83.50 l 8 19 16 4 2Keypunch operators, class A _ _ . __ _ 56 39.5 117.50 3 17 13 11 6 5 1 _ _ _ _ _Proof-machine operators _ _ 140 39.0 94.50 - - 29 32 18 15 29 11 4 2 _ _ _ _ _ _ _ _Safe-deposit clerks ____ 19 38.5 103.00 _ _ 5 3 1 1 9Secretaries - -__ ___ — - 244 39.5 133.00 _ - _ 1 5 15 30 23 40 48 27 17 14 11 8 1 4
Class A . 12 40.0 171.50 - - - - - - . 2 1 _ 1 _ 1 I 2 _ 4 _ _ _Class B — 57 39.5 153.50 - - - - - 3 I 1 2 10 4 10 10 9 6 1 _ _ _ _Class C —_ ..................... 44 39.5 131.00 - - - - - 6 4 2 6 9 9 4 3 _ _ _ _ _Class D .............................. 131 39.5 121.50 - - - 1 5 6 25 18 31 29 13 3 _ _ _ _ _
Stenographers, senior . .. . 49 39.0 121.00 - - 1 - 6 9 2 . 9 14 3 4 1 _ _ _ _ _ _ _Switchhoard operators, class A. 18 38.5 109.50 - - - 1 _ 6 4 2 2 2 1 _ _ _ _ _ _ _ _ _ _Typists, class A ---- ..... . ... ... 155 40.0 107.00 - " 2 7 16 24 46 26 22 12 - - - - - - - - - - - -
Selected computer occupations
Computer operators, class A 20 40.0 175.50 _ _ _ _ _ _ _ _ _ I 4 5 2 3 2 2Computer operators, class R_ 25 39.5 155.50 - - - - - . - 1 3 2 3 4 5 5 1 _ 1 _ _ _ _ _Computer operators, class C ........ „ 19 39.5 132.00 - - - - - - 1 4 4 2 6 2 _ _ _ _ _ _ _ _Computer programmers,
business, class B ________________________ 16 39.5 201.50 - - - - - - - - - 1 - 1 - 1 1 1 4 4 1 1 - 1
Selected teller occupations
Tellers, all-round . . . . . . 713 39.0 102.50 32 57 109 91 82 127 87 55 53 16 3 I - - L_ - - - - -
1 The Indianapolis Standard Metropolitan Statistical Area consists of Boone, Hamilton, Hancock, Hendricks, Johnson, Marion, Morgan, and Shelby Counties.2 Standard hours reflect the workweek for which employees receive their regular straight-time salaries and the earnings correspond to these weekly hours. Average weekly hours are rounded to the
nearest half hour and average weekly earnings to the nearest half dollar.
Digitized for FRASER http://fraser.stlouisfed.org/ Federal Reserve Bank of St. Louis

(Number of em ployees and average straight-tim e weekly earnings 2 in selected occupations in banking establishments, September 1973)
OccupationNumber
ofworkers
Avxkaqx NUMBER OP WORKERS RECEIVING STRAIGHT-TIME WEEKLY EARN INGS OF
Weekly 2 hours
(standard)
Weekly 2 earnings
(standard)
$65and
under$70
$70
$75
$75
$80
$80
$85
$85
$90
$90
$95
'$95
$100
$100
$110
$110
$120
$120
$130
$130
$140
$140
$160
$160
$180
$180
$200
$200
$220
$220
$240
$240
$260
$260
$280
$2 80
$300
$300
$320
$320
$340
$340
$360
Selected clerical occupations
Bookkeeping-machine operators,c lass A -------------------------------------- ------------ — ___ 24 40 .0 $104.00 - - - - - 5 6 9 - 3 1 - - - - - ! - - - - -
Bookkeeping-machine operators,c lass B __ _______________ ______ __ 25 40.0 94.50 - - - 8 - 4 2 9 1 1 - - - - - - - - - - - -
C lerks, file , c lass A ___________________ 15 40 .0 108.00 - - - - - - - 9 5 - 1 - - - - - - - - - - -C lerks, file , c lass B ___ ________ __ _ 119 40.0 93.50 - 4 1 3 39 27 28 10 6 - 1 - - - - - - - - - - -C lerk s, file , c lass C __ ___ _______ __ 68 40.0 83.00 10 7 5 13 22 6 - 5 - - - - - - - - - - - - - -Keypunch operators, class A _ 21 40.0 122.50 - - - - - - - 7 2 7 3 - 2 - - - - - - - - -Keypunch operators, c lass B __________ __ 75 40 .0 109.00 - - 1 2 4 7 7 12 25 14 3 - - - - - - - - - - -Proof-m achine o p e ra to rs___ ______________ 199 40.0 101.50 - 1 3 17 14 40 10 68 34 4 5 3 - - - - - - - - - -Safe-deposit c le r k s ______ __ 77 40.0 104.00 - - 5 1 1 12 18 13 17 4 5 1 - - - - - - - - - -Secretaries____________________ ______________ 221 40 .0 134.50 - - - - 2 - 4 6 38 43 60 46 15 6 - 1 - - - - - -
C lass A _ _____ ____________ 14 40 .0 166.00 - - - - - - - - - 1 - 3 7 2 - 1 - - - - - -C lass B _____ _______________________ - ____________ 71 40 .0 140.50 - - - - - - - 2 - 20 19 21 5 4 - - - - - - - -
C lass C ----- ----- ------------- -------- ----- 59 40 .0 127.50 - - - - - - 2 4 19 8 16 7 3 - - - - - - - - - -C lass D _ _ _____________________________ 77 40 .0 128.50 - - - - 2 - 2 - 19 14 25 15 - - - - - - - - - -
Stenographers, general---------------------------------------- 60 40 .0 108.00 - - - 5 - 2 10 27 8 3 1 4 - - - - - - - - - -1 Stenographers, se n io r --------------- _ ------ 109 40.0 122.00 - - - - - 1 5 29 13 41 9 3 7 1 - - - - - - - -* Switchboard operators, c lass A ------ 7 40 .0 106.00 - - - - - - 1 5 - 1 - - - - - - - - - - - -
Switchboard operators, c lass B ------ ------------- 51 40.0 102.50 - - 6 - 12 1 6 8 5 11 1 1 - - - - - - - - -T ypists, c lass B ------ — — 51 40.0 100.50 2 - 1 8 10 7 11 8 2 1 1 - _ “ ~ i ‘ “ “
Selected computer occupations
Computer operators, c lass A ----- --------------- 16 40 .0 168.00 - . - - - - - - - - - 1 4 8 1 2 - - - - - -Computer operators, c lass B -------------------- 38 39.5 131.50 - - - - - - 1 3 8 10 5 6 5 - - - - - - - _Computer operators, c lass C -------------------- 21 40 .0 112.50 - - - - - 1 1 11 4 2 1 1 - - - - I - - “Computer program m ers, business,
c lass A ___________________ .___________________________ 18 40.0 232.50 - - - - - - - - - - - - - 1 5 5 5 2 - - - -Computer program m ers, business,
class B ---------------------------------- -— —--------------- 13 40 .0 200.00 - - - - - - - - - - - - 2 5 3 3 - - - - ! -Computer program m ers, business,
class C —_____________________________________ 7 40 .0 156.00 - - - - - - - - - - 2 2 3 - - - - “ - - -Computer system s analysts,
business, c lass A -------------------------------------- 14 40 .0 292.50 - - - - - - - - - - - - - - - ~ 4 2 3 1 2 2Computer system s analysts,
business, class B ------------------------------- . ----- 13 40 .0 261.00 " “ ~ _ ~ “ ~ " " " " " " 3 2 6 1 1“ “
Selected teller occupations
T e lle rs , note ________________________________ 179 40.0 116.50 _ _ _ 8 3 19 11 30 43 14 34 12 3 2 - - - - - - - -T e lle rs , com m ercial-savin gs ------------- 533 40.0 104.00 - 17 5 4 39 94 83 131 92 38 15 9 6 - - - - - - - - -T e lle rs , c om m e rcia l--------------------------- -------- 56 40 .0 108.50 - - - 3 5 7 6 12 10 4 7 - 1 1 - - - - - - - -T e lle rs , savings-------------------------------------------- 7 40 .0 114.50 - - - - 1 1 - 1 - 2 2 - - - - - - - - - - -T e llers , a ll-ro u n d -------------------------------------— 278 40.0 103.50
'5 24 29 29 37 64 49 28 11 2
1 The Kansas City Standard Metropolitan Statistical Area consists of C ass, Clay, Jackson, and Platte Counties, M o.; and Johnson and Wyandotte Counties, Kans.2 Standard hours reflect the workweek for which employees receive their regular straight-tim e salaries and the earnings correspond to these weekly hours. Average weekly hours are rounded to the
nearest half hour and average weekly earnings to the nearest half dollar.
Digitized for FRASER http://fraser.stlouisfed.org/ Federal Reserve Bank of St. Louis

(Number of em ployees and average straight-tim e weekly earnings 2 in selected occupations in banking establishments, October 1973)
Average NUMBER OF WORKERS RECEIVING STRAIGHT-TIME WEEKLY EARNINGS OF
OccupationNumber
ofworkers
Weekly hours 1 2
(standard)
Weekly earnings (standard)
$70and
under$75
$75
$80
$80
$85
$85
$90
$90
$95
$95
$100
$100
$110
$110
$120
$120
$130
$130
$140
$140
$150
$150
$160
$160
$170
$170
$180
$180
$190
$190
$200
$200
$210
$210
$220
$220
$230
$230
$240
$240
$260
$260
$280
Selected clerical occupations
Bookkeeping-machine operators,class A .... .......... .................. 32 39.0 $133.00 - - - - - - - 1 10 13 5 3 - - - - - - - - - -
C lerks, file, class B ___________________ __ 41 40.0 112.00 - - - 1 2 1 16 11 7 3 - - - - - - - - - - - -C lerks, file, class C ______________________ 130 40.0 96.00 - - 17 31 19 21 30 11 1 - - - - - - - - - - - - -Keypunch operators, c lass A .... . .... 173 40.0 146.00 - - - - - - - ■ - 18 43 52 27 32 1 - - - - - - - -Proof-m achine operators _ 1 ,076 40.0 107.00 2 6 4 20 154 175 323 208 131 49 4 - - - - - - - - - - -Safe-deposit clerks .... _ 131 40.0 108.00 - - 4 11 16 21 20 24 22 11 2 - - - - - - - - - - -Secretaries __ . ....... _ 1, 642 40.0 150.50 - - - - - - 28 48 147 267 3 93 317 207 97 55 23 42 8 10 - - -
C lass A . .............. . 57 39.5 197.50 - - - - - - - - - - 2 - 1 5 12 5 19 6 7 - - -C lass B ___________________________________ 187 40.0 173.00 - - - - - - - 1 - 22 15 16 24 31 35 15 23 2 3 - - -C lass C . . . . 942 40.0 150.50 - - - - - - 1 13 47 138 271 246 164 53 8 1 - - - - - -
| C lass D ..... . _ . . 456 40.0 136.00 - - - - - - 27 34 100 107 105 55 18 8 - 2 - - - - - -Stenographers, general. _ _ 200 40.0 116.50 - - - - - 7 48 77 54 14 - - - - - - - - - - - -Stenographers, senior _ _ 453 40.0 127.50 - - - - - - 29 96 139 126 52 9 2 - - - - - - - - -Switchboard operators, c lass A _________ 107 40.0 121.50 - - - - - 4 14 23 46 11 7 1 1 - - - - - - - - -Switchboard operators, c lass B.._ 147 40.0 101.50 - 2 - 23 34 32 14 28 11 3 - - - - - - - - - - - -Typists, class A ____________________________ 392 40.0 111.50 - - - - - 34 138 143 64 13 - - ■ - - - - - - - - - -Typists, class B ____________________________ 373 40.0 101.50 “ 22 63 109 119 47 11 2 - - - - - - - - - -
Selected computer occupations
Computer operators, class A 46 39.5 201.00 - - - - - - - - - - - - - 2 20 5 5 5 4 1 3 1Computer operators, class B ____________ 86 39.5 170.50 - - - - - - - - - - 7 15 20 20 13 9 2 - - - - -Computer operators, class C .... . 60 40.0 167.50 - - - - - - - - - 10 11 12 14 5 8 - - - - - - -Computer program m ers, business,
class B _____________________________________ 47 40.0 214.00 " • “ " “ " 2 3 1 14 17 “ 5 2 3
Selected teller occupations
T e llers , note ______________________________ 815 40.0 127.00 . _ - _ - 9 84 147 239 203 97 26 8 - 2 - _ _ _ - _ -
T e llers , c o m m e rcia l-sa v in g s___________ 2, 719 40.0 106.50 14 30 362 571 871 530 213 66 44 14 4
1 The Los Angeles—Long Beach Standard Metropolitan Statistical Area consists of Los Angeles County.2 Standard hours reflect the workweek for which employees receive their regular straight-tim e salaries and the earnings correspond to these weekly hours. Average weekly hours are rounded to the
nearest half hour and average weekly earnings to the nearest half dollar.
Digitized for FRASER http://fraser.stlouisfed.org/ Federal Reserve Bank of St. Louis

(Number of em ployees and average straight-tim e weekly earnings 2 in selected occupations in banking establishments, September 1973)
OccupationNumber
of
Average NUMBER OF WORKERS RECEIVING STRAIGHT-TIME WEEKLY EARNINGS OF
Weekly 2(standard)
Weekly , earnings
(standard)
$65and
under$70
$70
$75
$75
$80
$80
$85
$85
$90
$90
$95
$95
$100
$100
$105
$105
$110
$110
$115
$115
$120
$120
$125
$125
$130
$130
$135
$135
$140
$140
$150
$150
$160
$160
$170
$170
$180
$180
$190
$190
$200
$200
$210
Selected clerical occupations
Clerks, file , class C 21 38.5 $81.50 _ 6 3 6 4 2 _ _ . _ _ _ _ _ _ _ _ _ _ _ _ _Keypunch operators, class A 16 38.5 115.50 - - - - - 1 3 - 1 1 3 4 l 1 1 - - - - - - -Keypunch operators, class B _ 65 39.0 99.50 - 1 3 2 4 12 5 18 10 8 1 1 - - - - - - - - - -Proof-m achine operators 164 39.5 89.00 - 9 5 40 45 27 13 20 5 - - - - - - - - - - - - -Secretaries. . . . . 156 38.5 116.00 - - - 7 4 4 14 20 14 15 19 9 16 8 10 8 4 4 - - - -
Class A 9 38.5 147.50 - - - - - - - - 1 - - - - - 1 2 2 3 - - - -Class B .... 35 38.0 128.50 - - - - - - 3 1 1 1 2 2 9 3 5 5 2 1 - - - -C lass C ___________________________________ 61 39.0 117.50 - - - - 2 - 1 2 9 10 13 7 7 5 4 1 - - - - - -C lass D ___________________________________ 51 38.0 99.50 - - - 7 2 4 10 17 3 4 4 - - - - - - - - - - -
Switchboard operators, class B 21 37.5 98.50 - - - - 8 1 1 3 6 1 1 - - - - - - - - - - -Typists, c lass B 29 38.0 89.50 “ - 3 7 9 3 4 2 1 " - - - - “ - - -
Selected computer occupations
Computer operators, class B 23 38.5 131.00 - - - - - - 1 - - - 3 2 7 3 1 4 2 - - - _ -Computer operators, class C 18 37.5 114.00 - - - - - - - 5 3 3 1 4 - 2 - - - - - - - -Computer program m ers, business,
class B . . . . 17 38.5 162.00 " - - - - “ " “ - 3 10 - 1 - 2 1
Selected teller occupations
T ellers, note .. . . 39 37.0 121.50 _ - - _ 1 - - 11 1 6 5 3 2 _ 1 1 8 _ _ _ _ _
T ellers, com m erical- savings 540 38.0 105.00 1 15 14 44 59 67 64 89 68 59 14 19 16 4 1 6
1 The Louisville Standard Metropolitan Statistical Area consists of Jefferson County, Ky.; and Clark and Floyd Counties, Ind.2 Standard hours reflect the workweek for which employees receive their regular straight-tim e salaries and the earnings correspond to these weekly hours. Average weekly hours are rounded to the
nearest half hour and average weekly earnings to the nearest half dollar.
Digitized for FRASER http://fraser.stlouisfed.org/ Federal Reserve Bank of St. Louis

(N um ber o f e m p lo y e e s and a v e ra g e stra ig h t-t im e w eek ly earn ings 2 in s e le c te d o ccu p a tio n s in banking e sta b lish m en ts , N ov e m b e r 197 3)
OccupationNumber
of
Average Number of workers re>ceiving straight-tim e weekly earnings of-
Weeklyhoun
(standard)Weekly earnings 2
(standard)
$70and
under$75
$75
$80
$80
$85
$85
$90
$90
$95
$95
$100
$100
$105
$105
$110
$110
$115
$115
$120
$120
$125
$125
$130
$130
$135
$135
$140
$140
$145
$145
$150
$150
$155
$155
$160
$160
$170
$170
$180
$180
$190
Selected c lerical occupations
C lerks, file , class C ----------------------------------- 84 39.5 $83.00 14 10 30 14 11 5 - _ - - _ - - - _ - - - _ - _Keypunch operators, c lass B _____________ 53 40.0 103.50 - - 1 1 5 11 15 7 4 7 2 - - - - - - - - - -Proof-m achine o p e ra to rs_________________ 59 39.5 92.50 - 3 9 20 8 5 6 3 2 2 - 1 - - - - - - - - -Safe-deposit c le r k s -------------------------------------- 6 40.0 109.00 - - - - - 1 1 3 - - - - 1 - - - - - - - -Secretaries 3 _________________________ _____ 197 40.0 119.00 - - - - 5 12 32 28 17 27 12 12 15 17 6 4 1 2 6 - 1
C lass B __________________________________ 34 40.0 132.00 - - - - - - 2 1 - 3 6 3 5 6 4 - - - 4 - -C lass C ____________________________________ 26 39.5 137.00 - - - - - - - - - 1 - 5 5 10 - 3 - 1 1 - -
Switchboard operators, c lass B __________ 9 40.0 111.00 - - - - - 2 3 " 3 1 “ " - - - " - - -
Selected teller occupations
T e lle rs , a ll-ro u n d ______________________ ___ 631 40.0 104.50 _ 6 24 135 100 133 52 43 66 20 26 20 2 2 1 ~ 1 "
1 The M em p h is Standard M etropolita n S ta tistica l A re a co n s is ts o f Shelby County, T en n .; and C rittenden County, A rk .2 Standard h ou rs r e f le c t the w orkw eek fo r w hich em ploy ees r e c e iv e their reg u lar s tra ig h t -t im e s a la r ie s and the ea rn in gs c o r re s p o n d to th ese w eek ly h o u rs . A v e ra g e w eek ly hours a re rounded
to the n e a re s t half h our and a vera g e w eek ly earn ings to the n e a re st h a lf d o lla r .3 In clu d es w o rk e r s in c la s s i f ic a t io n in addition to th ose shown sep a ra te ly .
Digitized for FRASER http://fraser.stlouisfed.org/ Federal Reserve Bank of St. Louis

Average Number of workers receiving straight-tim e weekly earningi3 Of----
OccupationNumber
of Weekly,hours
(standard)Weeklyearnings
(standard)
$70and
under$75
$75
$80
$80
$85
$85
$90
$90
$95
$95
$100
$100
$110
$110
$120
$120
$130
$130
$140
$140
$150
$150
$160
$160
$170
$170
$180
$180
$190
$190
$200
$200
$210
$210
$220
$220
$230
$230
$240
Selected clerical occupations
Bookkeeping-machine operators,class A 40 39.5 $127.50 - - - - - - 8 5 8 14 - 3 2 - _ _ - - _ _
C lerks, file , c lass B _______________________ 44 38.5 101.00 - - 4 _ 8 7 13 12 _ _ _ _ _ _ _ _ _ _ _ _
C lerks, file , class C _______________________ 42 39.0 88.50 - 10 2 11 10 6 3 _ _ _ _ _ _ _ _ _ _ _ _ _
Keypunch operators, class A _____________ 11 39.5 118.00 - - - - - 1 2 1 5 2 - - - - - - - - - -Keypunch operators, c lass B ... 29 39.5 101.50 - - - 6 6 3 7 7 - - - - - - - - - - - -Proof-m achine operators 211 39.5 107.00 4 6 19 21 21 10 46 23 29 15 13 2 - 2 - - - _ - -Safe-deposit clerks _ 73 39.5 109.00 - - 2 5 8 1 25 8 18 - 4 - 2 - - _ - - _ _S ecretaries___________________________________ 250 39.5 139.50 - - - 1 - 14 5 28 26 52 52 30 16 12 8 3 3 _ _ _
C lass A ..... _ . . . . . . . . . 22 40.0 174.50 - - - - - _ - _ _ 2 3 - 2 4 5 3 3 - _ _C lass B _____________________ ____________ 71 39.5 145.50 - - - - - 2 - 5 2 18 20 3 12 8 1 - _ - _ -C lass C _ ... .... _ 87 39.5 137.00 - - - - - 4 - 11 11 16 20 23 1 - 1 _ _ _ _ _C lass D ________________________________ __ 70 39.5 126.00 - - - 1 - 8 5 12 13 16 9 4 1 - 1 - _ _ _ ' _
Stenographers, general___________________ 59 39.0 134.00 - - - - - - 3 2 13 17 10 13 1 - - - - - - -Stenographers, s e n io r ___________________ 22 40.0 144.50 - - - - - - - 1 - 5 9 5 2 - - - - - - -
Switchboard operators, c lass A 10 40.0 113.00 - - - - 1 - 1 7 - - 1 - - - - - - - _ -
Switchboard operators, class B __________ 53 39.5 108.50 - - 2 4 1 9 18 4 8 2 5 - - - - - - -
Selected computer occupationsI
Computer operators, c lass B ___________ 29 39.5 132.50 - _ _ . _ _ 2 5 3 9 6 3 1 _ _ _ _ _ _
Computer operators, c lass C _____________ 9 39.0 115.50 - - - - - - 2 5 1 1 - - - - - - - - - -
Computer program m ers, business,class B __________________________________ __ 18 39.5 194.00 - - - - - " - - " 2 1 1 10 - 1 1 2
Selected teller occupations
T e lle rs , n o te ------------------------------------------------- 144 39.5 123.50 _ _ _ 4 1 5 13 30 35 36 10 8 _ _ 2 _ _ _ _ _
T e lle rs , com m ercial-savin gs 184 39.5 114.00 - - - - 8 16 37 78 24 6 11 4 - - - - - - - -
T e lle rs , com m ercia l_______________________ 503 40.0 116.00 - 4 16 27 24 35 68 105 91 70 49 14 - - - - - - - -
T e lle rs , savings_____________________________ 74 40.0 120.50 " " " 2 1 6 8 18 21 7 9 2 ~ “ ~ “ “ "
1 The M ia m i Standard M etro p o lita n S ta tistica l A r e a co n s is ts o f Dade County.2 Standard h ou rs r e f le c t the w ork w eek fo r w hich e m p loy ees r e c e iv e th e ir reg u lar s tra ig h t -t im e s a la r ie s and the earn in gs co r re s p o n d to th ese w eek ly h ou rs . A v e ra g e w eek ly hours are
roun ded to the n e a re s t ha lf hour and a v e ra g e w eekly earn ings to the n ea rest h a lf d o lla r .
Digitized for FRASER http://fraser.stlouisfed.org/ Federal Reserve Bank of St. Louis

(Number of em ployees and average straight-tim e weekly earnings 2 in selected occupations in banking establishments, October 1973)
Average NUMBER OF WORKERS RECEIVING STRAIGHT-TIME WEEKLY EARNINGS OF
OccupationNumber
of Weeklyhours
(standard)Weekly 2 earnings
(standard)
$70and
under$75
$75
$80
$80
$85
$85
$90
$90
$95
$95
$100
$100
$110
$110
$120
$120
$130
$130
$140
$140
$150
$150
$160
$160
$170
$170
$180
$180
$200
$200
$220
$220
$240
$240
$260
$260
$280
$280
$300
$300
$320
$320
$340
Selected clerical occupations
Bookkeeping-machine operators,class B ________________________________ _ 18 40.0 $118.00 - - - - - 6 - 6 - - 6 - - - - - - _ _ _ _ _
C lerks, file , class C _______________________ 44 39.5 94.50 3 1 3 4 8 1 18 5 4 - _ _ _ _ _ _ _ _ _ _ _ _ _Keypunch operators, c lass A _____________ 35 39.5 126.50 - - - - - 1 5 7 8 6 4 4 - - - - - - - - _ _Keypunch operators, c lass B _____________ 28 39.0 106.00 - - 3 - 3 1 10 7 3 1 - - - - - - _ _ - _ _ _Proof-m achine operators 146 40.0 95.50 - 6 15 37 30 12 28 10 7 1 - - - - - - _ _ _ _ _ _Safe-deposit c le r k s _________________________ 46 40.0 110.50 - - - 6 1 3 4 24 8 - - - _ _ _ _ _ _ _ _ _ _Secretaries___________________________________ 224 39.0 144.00 - - - - - 1 6 8 43 61 35 22 20 12 7 7 1 1 _ _ _ _
C lass A ____________________________________ 8 39.0 193.50 - - - - - - - - - - 1 - 1 2 1 1 1 1 _ _ _ _Class B ------------------------------------------- 32 39.5 169.50 - - - - - - 1 - _ 2 3 6 8 1 5 6 _ _ _ _ _ _C lass C ____________________________________ 66 39.0 146.00 - - - - - - 3 2 9 14 10 7 11 9 1 _ _ _ - _ _ _C lass D __________________________________ 118 39.5 133.00 - - - - - 1 2 6 34 45 21 9 - - - _ _ _ - _ _ _
Stenographers, general____________________ 84 39.5 104.00 - 1 10 4 2 18 19 22 7 1 - - - - - - - - - - - -Stenographers, se n io r _____________________ 120 39.5 126.00 - - - - - 5 11 25 37 13 20 8 1 - - - - - - - - -
(Q Switchboard operators, class A __________ 11 39.0 124.00 - - - - 1 - - 1 6 1 2 - - _ - - _ - - _ _ _Typists, class A _____________________________ 30 40.0 112.50 - - - - 1 3 10 10 3 1 2 - _ _ _ _ _ _ - _ _ _Typists, c lass B ____________________________ 25 39.0 106.00 - - - 1 6 9 9 - " - - - - - - - -
Selected computer occupations1
Computer operators, class A _____________ 31 39.5 177.00 - _ - - - - - - _ 1 6 3 3 3 7 7 1 _ _ _ _Computer operators, class B _____________ 41 39.5 144.00 - - - - - 3 6 1 3 5 5 3 6 6 3 - - _ - - - -Computer operators, class C _____________Computer program m ers, business,
12 40.0 123.00 " “ " _ " 3 6 - 1 - 1 - 1 - “ - - -
c lass A ______________________________________Computer system s analysts,
24 40.0 219.50 " " " " “ “ " " " ~ 1 8 4 4 4 2 1 "
business, class A _____________________Computer system s analysts,
9 39.0 270.50 " " “ " “ " _ ” “ ~ - 2 " 3 1 “ 1 2
business, class B _________________________Computer system s analysts,
12 39.5 260.00 “ " " “ _ " " " 1 1 1 3 “ 6 " -
business, class C ________________________ 11 39.5 209.00 - - - - - - - 1 ~ - 2 - - 1 1 2 3 1 - - i
Selected teller occupations
T e lle rs , n ote------------------------------------------------- 84 39.5 131.00 _ _ _ _ _ 6 13 15 13 4 9 2 15 7 _ _ _ _ _ _ _T e lle rs , c o m m e rcia l-sa v in g s____________ 175 39.0 122.00 - - - 12 18 23 8 14 24 21 41 6 6 2 _ - _ _ _ _ _ _T e lle rs , a ll-ro u n d __________________________ 433 40.0 100.00 9 27 70 64 48 28 75 42 32 18 8 9 2 1 - - " - - "
1 The Milwaukee Standard Metropolitan Statistical Area consists of Milwaukee, Ozaukee, Washington, and Waukesha Counties.2 Standard hours reflect the workweek for which employees receive their regular straight-tim e salaries and the earnings correspond to these weekly hours. Average weekly hours are rounded to the
nearest half hour and average weekly earnings to the nearest half dollar.3 Worker at $65 to $ 7 0 .
Digitized for FRASER http://fraser.stlouisfed.org/ Federal Reserve Bank of St. Louis

(Number of em ployees and average straight-tim e weekly earnings 2 in selected occupations in banking establishments, October 1973)
OccupationNumber
ofworkers
Avebaqc NUMBER OF WORKERS RECEIVING STRAIGHT-TIME WEEKLY EARNINGS OF-
Weekly 2 hours
(standard)Weekly earnings*
(standard)
$70and
under$75
$75
$80
$80
$85
$85
$90
$90
$95
$95
$100
$100
$110
$110
$120
$120
$130
$130
$140
$140
$150
$150
$160
$160
$170
$170
$180
$180
$190
$190
$200
$200
$210
$210
$220
$220
$230
$230
$240
$240
$250
$250
$260
Selected clerical occupations
Bookkeeping-machine operators,class A _ ______ ___ 17 39.5 $124.00 3 14
Bookkeeping-machine operators,class B _______________________________________ 57 39.0 101.50 - - - 4 4 11 34 - 4 - - - - - - - - - - - - -
C lerks, file , c lass B ________________________ 126 39.5 90.00 - 19 23 38 24 6 4 7 5 - - - - - - - - - - - - -C lerks, file , c lass C ________________________ 57 40.0 82.00 - - 54 3 - - - - - - - - - - - - - - - - - -Keypunch operators, c lass A ______________ 26 38.5 119.00 - - - - - - 9 6 6 3 2 - - - - - - - - - - -Keypunch operators, class B ______________ 37 39.0 102.00 - - - 2 9 5 14 6 1 - - - - - - - - - - - - -Proof-m achine o p e ra to rs ---------------------------- 245 39.5 98.50 1 4 33 42 43 27 28 38 28 1 - - - - - - - - - - - -Safe-deposit c le r k s __________________________ 48 40.0 108.50 - - - - 7 3 20 11 5 - - 2 - - - - - - - - - -S ecretaries__________________________________ 228 39.5 143.00 - - - - - - 22 12 34 37 39 33 29 10 2 8 1 1 - - - -
C lass A ________________________________ 13 39.0 170.50 - - - - - - - - - 2 - 1 5 - - 4 1 - - - - -C lass B __________________________________ - 73 39.5 152.00 - - - - - - 2 2 4 13 19 8 12 6 2 4 - 1 - - - -C lass C -------------------------------------------------------- 77 39.5 135.00 - - - - - - 7 4 22 17 14 9 2 2 - - - - - - - -C lass D -------------------------------------------------------- 65 39.5 137.00 - - - - - - 13 6 8 5 6 15 10 2 - - - - - - - -
Stenographers, gen eral-------------------------------- 215 39.5 118.00 - - 1 7 11 21 44 55 24 16 20 8 8 - - - - - - - - -Stenographers, senior ---------------------------------- 131 39.0 125.50 - - - - - 1 15 31 42 21 17 4 - - - - - - - - - -Switchboard operators, class B ___________ 33 39.5 104.50 - 1 - 3 13 - 1 10 1 4 - - • - - - - - - - - - -Typists, c lass A ________________________ ___ 60 39.5 104.00 - - 1 5 16 4 12 17 3 1 1 - - - - - - - - -Typists, c lass B ______________________________ 118 39.0 93.50 - 1 14 38 27 16 13 " 6 3 - - - - - - "
Selected computer occupations
Computer operators, c lass B ____________ 23 39.0 130.00 - - - - - - 2 4 7 3 4 3 - - - - - - - - - -Computer program m ers, business,
class A ___________________________________ __ 17 39.0 221.00 - - - - - - - - - - - - - - 1 2 4 4 - - 3 3Computer program m ers, business,
class C ___________________________________ 7 39.0 144.00 - " - " " ~ _ 2 1 2 " 1 " 1 “ “ “ '
Selected teller occupations
T e lle rs , n o te --------------------------------------------------- 71 39.5 121.50 . - - - 1 - 18 16 9 21 3 1 1 - 1 - - - - - - -T e lle rs , com m ercia l------------------------------------- 69 39.5 110.50 - - - - 9 3 27 13 11 6 - - - - - - - - - - - -T e llers , savings--------------------------------------------- 76 39.0 103.50 - - - 3 19 15 22 11 5 - 1 - - - - - - - - - - -T e llers , a ll-ro u n d ___________________________ 664 39.5 106.50 “ 18 59 99 84 152 130 78 20 16
"8 -
" ' " " " "“
1 The Minneapolis—St. Paul Standard Metropolitan Statistical Area consists of Anoka, Dakota, Hennepin, Ramsey, and Washington Counties.2 Standard hours reflect the workweek for which employees receive their regular straight-tim e salaries and the earnings correspond to these weekly hours. Average weekly hours are rounded to the
nearest half hour and average weekly earnings to the nearest half dollar.
Digitized for FRASER http://fraser.stlouisfed.org/ Federal Reserve Bank of St. Louis

(Number of em ployees and average straight-tim e weekly earnings1 in selected occupations in banking establishm ents, October 1973)
OccupationNumber
ofworkers Weekly
hours 1 (Standard)
Weeklyearnings1
(Standard)
. $70 and
under $80
$80
$90
$90
$100
$100
$110
$110
$120
$120
$130
$130
$140
$140
$150
$150
$160
$160
$170
$170
$180
$180
$190
$190
$200
$200
$210
$210
$220
$220
$240
$240
$260
$260
$280
$280
$300
$300
$320
$320
$340
Selected clerical occupations
Bookkeeping-machine operators,class A _______________________________________ 18 37.5 $122.50 - _ - 3 3 7 5 _ _ _ _ _ _ _ _ _ _ _ _ _
Bookkeeping-machine operators,class B __________ _________ _ _____ ______ 14 38.0 107.50 2 6 5 1
C lerks, file , class C 94 37.0 93.50 6 30 27 21 7 3Keypunch operators, class A 38 37.5 123.50 3 2 6 13 8 4 2Keypunch operators, class B 68 38.0 116.00 _ - 12 9 15 16 15 1 _ _ _ _ _ _ _ _Proof-m achine operators . 251 38.0 105.50 - - 80 104 33 19 10 5 _ _ _ _ _ _ _ _ _ _ _Safe-deposit c le r k s ________ ________________ 83 39.0 115.50 - _ 5 29 21 11 12 2 3 _ _ _ _ _ _ _ _ _ _ _ _Secretaries_____________________________ _____ 509 38.0 139.00 - - 7 38 103 95 63 52 42 31 19 22 13 9 1 12 2 _ _ _
C lass A-------------------------------------------------------- 18 37.5 200.50 - - _ _ _ _ _ _ _ _ 2 6 3 1 _ 6 _ _ _ _C lass B _ _ .......... ... _. . 49 37.5 162.50 - _ _ _ _ 6 5 6 12 6 2 2 4 _ _ 5 1 _ _ _C lass C_____________________________________ 134 37.5 156.00 - - _ - 2 16 20 27 13 18 12 9 6 8 1 1 1 _ _ _C lass D 308 38.5 124.00 - _ 7 38 101 73 38 19 17 7 3 5 _ _ _ _ _ _ _ _
Stenographers, senior ................... 143 36.5 125.00 22 41 23 16 261
15Switchboard operators, class B___________ 52 37.5 116.50 _ _ _ 23 10 6 12 _ _ _Typists, c lass A_ 88 38.5 120.50 5 13 24 25 11 6 4Typists, class B_____________________________ 173 37.5 104.50 - - 49 76 38 10 - - - - - - - - - - - -
Selected computer occupations
Computer operators, c lass A_ 24 37.0 191.00 _ _ _ _ _ _ _ _ 1 1 1 8 9 3 1Computer operators, c lass B_________________ 41 38.5 157.00 - _ - _ _ _ 1 12 11 9 5 2 1 _ _ _Computer operators, c lass C 38 37.5 131.50 4 5 7 8 8 6Computer program m ers, business, 1
class A ________________________________________________ 24 37.5 261.50 - - _ - _ _ _ _ _ _ _ _ _ 3 _ 7 10 4 _ _Computer program m ers, business,
class B _______________________________________ 22 37.0 219.00 - - - - - - _ _ _ _ _ 2 1 4 3 9 3 _ _ _Computer program m ers, business,
class C __________________________ __________ 22 38.5 157.50 - - - - _ - 4 1 5 10 1 1 _ _ _ _ _ _ _ _Computer system s analysts,
business, class B _ 50 38.0 285.50 - " - - - - - - - - - - - - 1 9 12 13 9 6
Selected teller occupations
T e llers , n ote_________________________________ 138 38.5 134.50 _ _ _ 12 17 28 27 29 11 7 3 4 _T e lle rs , com m ercial-savin gs 1, 876 38.0 116.00 211 513 499 26 2 193 106 47 28 12 4 1
'“ ” “ ~ "
1 Standard hours reflect the workweek for which employees receive their regular straight-tim e to the nearest half hour and average weekly earnings to the nearest half dollar.
;alaries and the earnings correspond to these weekly hours. Average weekly hours are rounded
Digitized for FRASER http://fraser.stlouisfed.org/ Federal Reserve Bank of St. Louis

Average Number of workers receiving straight-tim e weekly earnings of-
OccupationNumber
ofworkers Weekly
hours z (Standard)
Weeklyearnings2
(Standard)
$75and
under$80
$80
$85
$85
$90
$90
$95
$95
$100
$100
$110
$"110
$120
$120
$130
$130
$140
$140
$150
$150
$160
$160
$170
$170
$180
$180
$190
$190
$200
$200
$220
$220
$240
$240
$260
$260
$280
$280
$300
$300
$320
Selected clerical occupations
Bookkeeping-machine operators,class B _ . . . . . . ____ 17 36.5 $117.50 - _ - 1 - 4 5 7 - _ - _ - _ _ _ _ _ _ _ _
C lerks, file , class C_ ______________________ 178 37.0 97.00 1 10 13 50 47 39 15 3 _ _ _ _ _ _ _ _ _ _ _ _ .Keypunch operators, class A ______________ 19 35.5 126.50 - - - - 1 - 3 8 6 1 - - - - - - - _ _ _ _Keypunch operators, class B ______________ 86 37.5 112.00 - - - 1 19 26 11 18 7 2 2 - - - - - - - _ _ _Proof-m achine operators 199 36.0 105.00 - 11 5 31 30 59 38 21 6 1 - - - _ _ _ _ _ _ _ _Safe-deposit c le rk s__________________________ 107 36.0 111.50 - _ 4 9 2 34 29 18 10 _ 1 _ _ _ _ _ _ _ _ _ _Secretaries3 __________________________________ 392 36.0 146.00 - - - - - 6 15 52 81 77 64 55 31 7 1 1 1 1 _ _ _
C lass A-------------------------------------------------------- 10 36.5 188.50 _ _ _ _ _ _ _ _ _ _ 1 1 4 1 1 _ 1 1 _ _ _Class B_____________________________________ 42 36.0 160.00 _ - _ - _ _ - 1 1 4 10 18 6 2 _ _ _ _ _ _ _C lass C ___________________________________ 92 35.5 153.50 _ _ _ _ _ _ 2 5 17 14 19 16 14 4 _ 1 _ _ _ _ _Class D_____________________________________ 188 36.5 137.50 - - - - - 6 9 34 52 51 29 6 1 _ - _ _ _ _ _ _
Stenographers, general_____________________ 34 35.5 111.50 - - - 2 6 8 9 6 3 - - - - - - - - - - - -Stenographers, sen ior---------------------------------- 71 36.0 126.50 - - - 6 - 14 6 18 10 7 3 - 5 2 - - - - - - _Switchboard operators, c lass B----------------- 53 36.5 115.50 - - - - 1 5 32 11 4 - - - - - - - - - - _ -Typists, c lass B--------------------------------------------- 215 35.5 105.50 - 2 20 27 38 44 47 21 11 3 2 - - - - - - - -
Selected computer occupations
Computer operators, class B--------------------- 58 37.0 159.00 _ _ _ _ _ _ _ 1 8 7 14 13 10 4 1 _ _ _ _ _ _Computer operators, class C______________ 48 36.5 123.50 - - - - - 3 22 5 7 9 2 - - - - - - - - -Computer program m ers, business,
class A ---------------------------------------------------------Computer p rogram m ers, business,
9 38.0 238.00 " ~ ~ ~ ~ " " " " ~ 1 4 4 - ~
class B ----------------------------------------------------------- 52 36.5 217.50 - - - - - - - - - - 2 3 4 4 6 6 14 6 6 - 1Computer program m ers, business,
class C -----------------------------------------------------------Computer system s analysts,
22 36.5 175.00 • “ ~ " ■ ~ 2 " 4 2 6 3 3 1 1 ~ ~ ”
business, class A __________________________Computer system s analysts,
8 37.0 278.50 _ - “ ' ' " “ “ ~ " " “ ~ “ 1 5 " 2
busin ess, c lass B ------------------------------------- 10 36.5 261.50 - - - - - - " - - - - 2 5 - 2 1
Selected teller occupations
T e lle rs , note-------------------------------------------------- 135 36.0 138.00 _ _ _ _ _ 4 34 16 21 22 15 10 8 2 3 _ _ _ _ _ _T e lle rs , com m e rcia l-savin gs-------------------- 1, 313 36.5 108.50 - 35 83 140 231 299 230 103 105 51 23 11 2 - - - - - - - -T e lle rs , com m ercial------------------------------------- 220 35.5 119.50 - - 8 - 3 42 62 55 31 12 7 - - - - - - - - - -T e lle rs , savings--------------------------------------------- 134 36.5 108.00 “ - - 14 11 51 34 14 8 2 - ~ " - - " "
1 The Newark Standard Metropolitan Statistical Area consists of E ssex , M orris , and Union Counties.2 Standard hours reflect the workweek for which employees receive their regular straight-tim e salaries and the earnings correspond to these weekly hours. Average weekly hours are rounded
to the nearest half hour and average weekly earnings to the nearest half dollar.3 Includes workers in classification in addition to those shown separately.
Digitized for FRASER http://fraser.stlouisfed.org/ Federal Reserve Bank of St. Louis
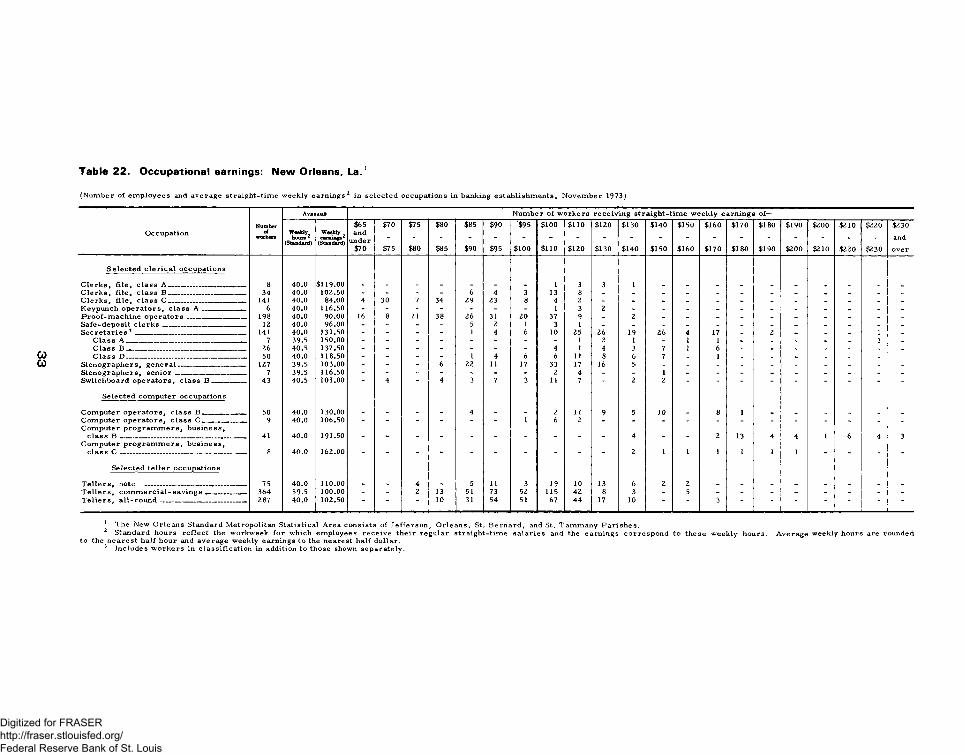
(Number of em ployees and average straight-tim e weekly earnings 2 in selected occupations in banking establishm ents, November 1973)
Anuoi Number of workers receiving straight-tim e weekly earnings of—
OccupationNumber
ofworkers Weekly
hours * (Standard)
Weekly 2(StMMhud)
$65and
under$70
$70
$75
$75
$80
$80
$85
$85
$90
$90
$95
'$95
$100
$100
$110
$110
$120
$120
$130
$130
$140
$140
$150
$150
$160
$160
$170
$170
$180
$180
$190
$190
$200
$200
$210
$210
$220
$220
$230
$230andover
Selected clerical occupations
C lerk s, file , c lass A ___ ____________ __ 8 40.0 $119.00 _ _ _ _ _ _ 1 3 3 1 _ _ _ _ _ _ _ _ _C lerk s, file , c lass B ------------ --------------- 34 40.0 102.50 - - - - 6 4 3 13 8 - - _ _ - _ _ _ _ _ _ _C lerks, file , c lass C ____________ _ _ 141 40.0 84.00 4 30 7 34 29 23 8 4 2 - - - _ _ - _ - - _ _ _Keypunch operators, c lass A 6 40.0 116.50 - - - - - - - 1 3 2 - - - - - - - _ _ - -Proof-m achine o p e ra to rs__________________ 198 40.0 90.00 16 8 11 38 26 31 20 37 9 - 2 - - - _ - - _ - - _Safe-deposit clerks _ ____ ________ 12 40.0 96.00 - - - - 5 2 1 3 1 - - - - _ _ - _ _ _ _ _S ecretaries3 _________________________________ 141 40.0 131.50 - - - - 1 4 6 10 25 26 19 26 4 17 _ 2 - - _ 1 _
C lass A _____ _______________________ _ 7 39.5 150.00 - - - - - - - - 1 2 1 - 1 1 - - - - - 1 -C lass B _ ________________________ ______ _ 26 40.5 137.50 - - - - - - - 4 1 4 3 7 1 6 - - - - - - -C lass D ----------------------------------------- --------— 50 40.0 118.50 - - - - 1 4 6 6 11 8 6 7 - 1 - - - - - - -
Stenographers, general------------------------------- 127 39.5 103.00 - - - 6 22 11 17 33 17 16 5 - - - - - - - - - -Stenographers, senior _____ ________ 7 39.5 116.50 - - - - - - - 2 4 - - 1 - - - - - - - - -Switchboard operators, c lass B __________
Selected computer occupations
43 40.5 101.00 4 4 3 7 3 11 7 2 2
Computer operators, c lass B„___ __ 50 40.0 130.00 _ _ _ _ 4 _ _ 2 11 9 5 10 _ 8 1 _ _ _ _ _ _Computer operators, c lass C _____________ 9 40.0 106.50 - - - - - - 1 6 2 - - - ■ - - - - - - - - -Computer program m ers, business,
class B ____________________________________ 41 40.0 191.50 - - - - - - - - - - 4 - - 2 13 4 4 1 6 4 3Computer program m ers, business,
c lass C — ___________ __ __ ____ 8 40.0 162.00 - - " “ - - - - - 2 1 1 1 1 1 1 " - -
Selected teller occupations
T e lle rs , note ---------------------------------------------- 75 40.0 110.00 - _ 4 _ 5 11 3 19 10 13 6 2 2 _ _ _ _ _ _ _T e lle rs , com m ercial-savin gs _______ _ 364 39.5 100.00 - - 2 13 51 73 52 115 42 8 3 - 5 - - - - - - - -T e lle rs , a ll-ro u n d --------------------------------------- 287 40.0 102.50 “ ■ ■ 10 31 54 51 67 44 17 10 " 3 - - - “ "
1 The New Orleans Standard Metropolitan Statistical Area consists of Jefferson, Orleans, St. Bernard, and St. Tammany Parishes.2 Standard hours reflect the workweek for which employees receive their regular straight-tim e salaries and the earnings correspond to these weekly hours. Average weekly hours are rounded
to the nearest half hour and average weekly earnings to the nearest half dollar.3 Includes workers in classification in addition to those shown separately.
Digitized for FRASER http://fraser.stlouisfed.org/ Federal Reserve Bank of St. Louis

Avebaqe Number of workersi receiving straight-tim e weekly earning s of—
OccupationNumber
of Weekly.,
(Standard)
Weekly earnings 2
(Standard)
$80and
under$90
$90
$100
$100
$110
$110
$120
$120
$130
$130
$140
$140
$150
$150
$160
$160
$170
$170
$180
$180
$190
$190
$200
$200
$220
$220
$240
$240
$260
$260
$280
$2 80
$300
$300
$320
$320
$340
$340
$360
$360
$380
$380and
over
Selected clerical occupations
Bookkeeping-machine operators,$140.50class A ______________________________________
Bookkeeping-machine operators,79 35.0 " 1 8 12 21 15 5 9 8 “ " " " " * "
class B ______________________________________ 59 35.5 124.00 - 1 13 5 26 3 6 5 - - - - - - - - - - - - - -C lerk s, file , c lass A _______________________ 254 35.0 126.50 - 11 28 43 58 64 40 9 - 1 - - - - - - - - - - - -C lerk s, file , c lass B _______________________ 463 35.0 112.00 12 55 154 127 66 32 4 5 8 - - - - - - - - - - - - -C lerks, file , class C _______________________ 649 35.5 105.00 16 225 193 121 66 28 - - - - - - - - - - - - - - - -Keypunch operators, c lass A _____________ 480 35.0 136.00 - - 8 46 112 132 103 47 30 2 - - - - - - - - - - - -Keypunch operators, class B _____________ 201 35.5 117.00 - 8 60 53 49 18 7 6 - - - - - - - - - - - - - -Proof-m achine o p era to rs__________________ 6 34 35.5 125.00 22 46 51 125 107 113 108 55 6 1 - - - - - - - - - - - -Safe-deposit c le r k s _________________________ 531 35.5 144.50 - 20 21 34 46 112 85 76 46 43 23 18 7 - - - - - - - - -S ecretaries____________________________________________ 4,700 35.0 169.50 - 3 17 47 187 377 626 672 643 585 450 393 410 207 50 17 8 4 - 2 2 -
C lass A ____________________________________ 182 35.5 228.50 - - - - - - - 4 7 8 10 1 24 76 31 12 5 - - 2 2 -C lass B ____________________________________ 599 35.0 198.00 - - - - - - 10 18 43 68 99 90 152 88 19 5 3 4 - - - -Class C ____________________________________ 1,47 3 35.5 176.50 - - - 2 18 26 118 215 201 248 190 220 192 43 - - - - - - - -C lass D _____________________________________________ 2,446 35.0 154.00 - 3 17 45 169 351 498 435 392 261 151 82 42 - - - - - - - - -
Stenographers, general____________________ 789 35.5 122.50 - 6 135 236 185 126 61 18 8 4 - 5 5 - - - - - - - - -CD Stenographers, se n io r ___________________ _^ Switchboard operators, c lass A ----------------
590 35.5 142.50 - - 7 58 90 118 122 82 70 29 14 - - - - - - - - - - -57 35.5 155.00 - - - 1 - 8 11 8 12 16 - 1 - - - - - - - - - -
Switchboard operators, class B __________ 219 36.0 129.50 - - 19 33 62 58 27 16 4 - - - - - - - - - - - - -Typists, c lass A _____________________________ 1,395 35.0 124.00 - 31 181 347 376 275 119 48 14 4 - - - - - - - - - - - -T ypists, c lass B _____________________________ 1,850 35.5 112.00 5 266 525 565 300 165 18 6 - - - - - - - - " " -
Selected computer occupations
Computer operators, class A ____________ 218 35.0 194.00 - - - - - - - 6 18 38 41 30 52 28 4 1 - - - - - -Computer operators, class B _____________ 321 35.0 167.50 - - - - - 14 39 63 85 49 30 18 16 5 2 - - - - - - -Computer operators, c lass C _____________Computer program m ers, business,
240 35.5 144.00 ■ 6 22 16 37 21 42 34 15 20 7 13 7 ~ ~ “ “ “ _ " "_
cla ss A ______________________________________Computer program m ers, business,
322 35.0 278.50 * " ~ - “ ~ ” 4 13 37 35 62 77 54 32 4 4
class B _______________________________________________Computer program m ers, business,
220 35.5 235.00 " ~ “ “ ~ '6 6 9 22 27 52 38 34 22 3 1
class C ______________________________ ____________Computer system s analysts,
74 35.5 192.00 “ ~ " ~ 1 4 9 11 13 9 14 11 1 1
•46business, c lass A ------------------------------------------------Computer system s analysts,
176 35.0 307.00 - ~ ' , ‘ " " " " "1
12
4 7 25 36 26 16 10 5
business, c lass B ------------------------------------------------- 125 35.0 266.50 - - - ■ - " ~ _ ■ 2 1 10 30 27 25 9 6 3 “ “
Selected teller occupations
T e llers , n o te ________________________________ 1,072 35.0 167.00 _ - _ 4 18 70 98 210 211 233 111 43 51 23 - - - - - - - -
T e lle rs , co m m e rcia l-sa v in g s------------------- 3,693 35.5 132.00 90 175 271 407 731 772 553 340 188 95 47 10 14 - - - - - - - - -T e lle rs , savin gs------------------------------------------- - 2,444 36.0 126.00 - 187 301 578 470 295 256 151 91 66 38 11 - - - - - - - - - -T e lle rs , a ll-ro u n d ______________________ 905 36.5 134.50 132 177 126 97 84 55 33 31 9 18 31 64 39 9
1 The New York Standard Metropolitan Statistical Area consists of New York City (Bronx, Kings, New York, Queens, and Richmond Counties) and Rockland and W estchester Counties.2 Standard hours reflect the workweek for which employees receive their regular straight-tim e salaries and the earnings correspond to these weekly hours. Average weekly hours are rounded to the
nearest half hour and average weekly earnings to the nearest half dollar.
Digitized for FRASER http://fraser.stlouisfed.org/ Federal Reserve Bank of St. Louis

OccupationNumber
ofworkers
Avkbaqb Number of workers receiving straight-tim e weekly earnings of—
Weeklyhours 2
(Standard)Weekly tunings 2
(Standard)
$65and
under$70
$70
$75
$75
$80
$80
$85
$85
$90
$90
$95
’$95
$100
$100
$110
$110
$120
$120
$130
$130
$140
$140
$150
$150
$160
$160
$180
$180
$200
$200
$220
$220
$240
$240
$260
$260
$280
$280
$300
$300
$320
$320andover
Selected clerical occupations
Bookkeeping-machine operators,class B _______________________________________ 63 39.0 $103.50 - - - 2 2 9 11 21 16 1 1 - - _ - _ - _ _ _ _ _
C lerks, file , c lass A ________________________ 47 37.5 102.00 - - - - 1 10 15 8 9 2 2 _ _ _ _ _ _ _ _ _ _ _C lerks, file , c lass B _________ ______________ 59 37.5 96.00 - - 1 6 15 9 6 16 5 _ 1 _ _ _ _ _ _ _ _ _ _C lerks, file, c lass C ________________________ 259 38.5 89.00 6 - 10 88 54 33 23 29 16 _ _ _ _ _ _ _ _ _ _ _ _Keypunch operators, c lass A ........ 152 38.0 116.00 - - - - - 3 3 38 46 48 11 2 _ 1 _ _ _ _ _ _ _ _Keypunch operators, c lass B 94 37.5 99.50 - - - 2 6 16 26 29 14 1 - - - _ - - - _ _ _ _ _Proof-m achine o p e ra to rs___________________ 371 38.5 96.00 6 - 5 54 51 70 50 75 47 8 4 1 - _ _ _ - _ _ _ _ _Safe-deposit c le r k s __________________________ 110 38.0 109.00 - - - - 2 4 20 40 26 12 3 2 1 _ _ _ _ _ _ _ _Secretaries3 _ . _ ____ _ _ 1,067 37.5 129.00 - - - - 2 13 18 139 170 245 204 128 75 52 14 4 1 1 _ _ _ 1
C lass A __________________________________ _ 32 38.5 179.50 - - - - - - - - - 2 2 2 1 13 5 4 1 1 _ _ _ 1C lass B _____________________________________ 101 38.5 146.50 - - - - - - - 1 4 9 17 30 18 16 6 _ _ _ _ _ _ _C lass C _____________________________________ 311 38.0 127.50 - - - - - 6 8 38 55 72 58 32 26 13 3 _ _ _ _ _ _ .C lass D . . 343 38.0 123.00 - - - - 1 2 8 56 69 97 70 25 13 2 _ _ _ _ _ _ _ _
Stenographers, general __ . ... . _ 274 38.0 103.00 6 - - - 8 41 46 101 41 28 3 - - _ _ _ _ _ _ _ _ _fi) Switchboard operators, class A ____ 24 38.5 114.50 - - - - - 2 1 9 4 6 1 _ - 1 _ . _ _ _ _ _ _Q] Switchboard operators, c lass B . 25 39.0 104.00 - - - - 2 8 2 2 7 4 - - - _ _ _ _ _ _ _ _ _
Typists, class A _ 182 38.0 98.50 - - - 3 28 45 29 48 22 5 1 1 _ _ _ _ _ _ _ _ _ _Typists, c lass B .... 267 38.5 98.50 - - 4 8 55 44 46 61 29 12 8 - - - - - - - - - - -
Selected computer occupations1
Computer operators, c lass A 75 38.0 171.00 _ _ _ _ _ _ _ _ _ 2 2 4 11 33 21 2 _ _ _ . .Computer operators, c lass B _ 120 37.5 149.50 - - - - - - 2 1 6 19 17 11 21 33 9 1 _ _ _ _ _ .Computer operators, c lass C . . 45 38.5 116.50 - - - 1 1 1 5 9 11 7 1 4 2 3 _ _ _ _ _ _ _Computer program m ers, business,
class A _______________________________________ 80 38.5 245.00 - - - - - - - - - - - _ _ 2 16 22 16 12 9 1 !; 2Computer program m ers, business, (
class B .. _ _ _ .... _ 58 37.5 195.50 - - - - - - - - - _ _ _ 1 9 25 17 6 _ _ _ _Computer program m ers, business,
class C _______________________________________ 13 37.5 162.50 - - - - - - - - - - 2 1 1 8 1 _ _ _ _ _Computer system s analysts,
business, class A _ ___... . . 18 37.5 287.00 - - - - - - - - - _ _ _ _ _ 3 5 4 5 1Computer system s analysts,
business, class B _ .... ... _ ___ . ... 49 37.0 249.50 - “ - - - - - - - - 1 2 4 9 19 8 4 - 2
Selected teller occupations
T e llers , n o te ______________________ ___________ 61 37.0 103.00 _ _ 6 _ 5 16 1 7 13 8 3 2 _ _ _ _ _ _ _T e llers , com m ercial-savin gs . 947 38.0 109.00 - 12 - 3 47 97 122 235 219 103 68 38 3 _ _ _ _ _ _ _ _ _T e llers , savings_____ _______________________ 334 36.5 117.50 - - - - - 28 23 67 90 62 25 15 10 13 1 _ _ _ _ _ _ _T e llers , all-round ....................... . __ 1,748 38.5 108.50 " “ 44 139 103 118 156 380 349 212 126 77 28 16 - - - - - - - -
1 The Philadelphia Standard Metropolitan Statistical Area consists of Bucks, Chester, Delaware, Montgomery, and Philadelphia Counties, P a.; and Burlington, Camden, and Gloucester Counties, N.J. Standard hours reflect the workweek for which employees receive their regular straight-tim e salaries and the earnings correspond to these weekly hours. Average weekly hours are rounded to the
nearest half hour and average weekly earnings to the nearest half dollar.3 Includes workers in classification in addition to those shown separately.
Digitized for FRASER http://fraser.stlouisfed.org/ Federal Reserve Bank of St. Louis
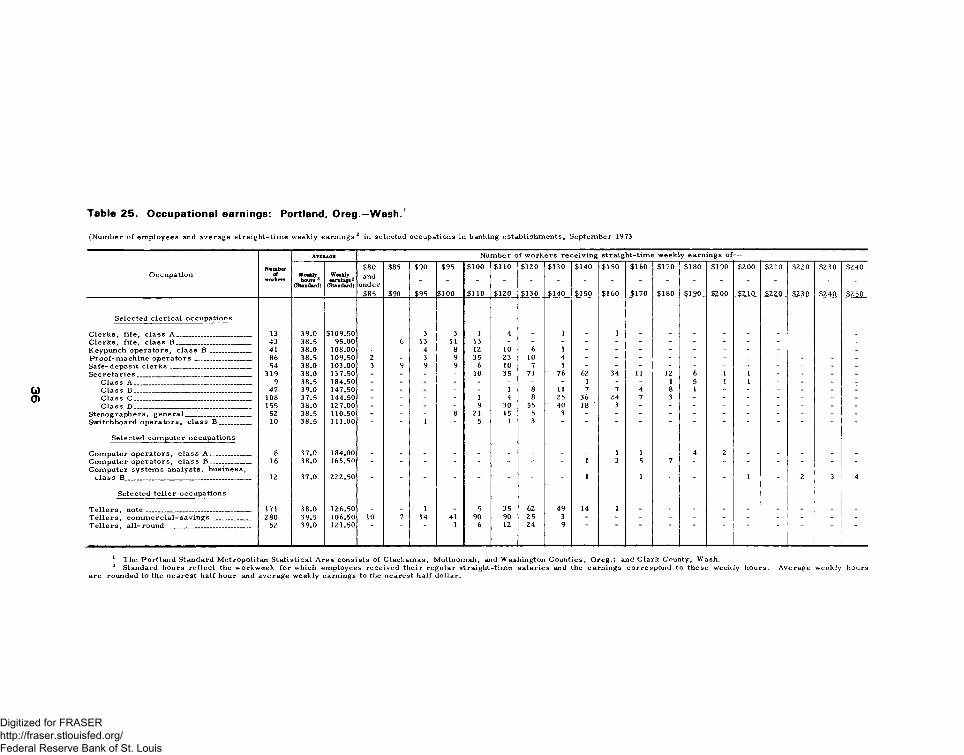
(Number of employees and average straight-tim e weekly earnings2 in selected occupations in banking establishm ents, September 1973
OccupationNumber
of
Average Number of workers receiving straight-tim e weekly earnings of-
Weekly(Standard)
Weeklyearnings(Standard)
$80and
under$85
$85
$90
$90
$95
$95
$100
$100
$110
$110
$120
$120
$130
$130
$140
$140
$150
$150
$160
$160
$170
$170
$180
$180
$190
$190
$200
$200
$210
$210
$220
$220
$230
$230
$240
$240
$2 50
Selected clerical occupations
C lerks, file , class A _ _ 13 39.0 $109.50 _ _ 3 3 1 4 - 1 - 1 - - - - - - - _ _C lerks, file , class B . . . . . . _ 43 38.5 95.00 - 6 13 11 13 - - - - - - - - - - - - - -Keypunch operators, class B ____________ 41 38.0 108.00 - - 4 8 12 10 6 1 - - - - - - - - - - -Proof-m achine o p era to rs_________________ 86 38.5 109.50 2 - 3 9 35 23 10 4 - - - - - - - - - - -Safe-deposit clerks ................. 54 38.0 103.00 3 9 9 9 6 10 7 1 - - - - - - - - - - -Secretaries____________________ ____________ 319 38.0 137.50 - - - - 10 35 71 76 62 34 11 12 6 1 1 - - - -
C lass A ... _ 9 38.5 184.50 - - - - - - - - 1 - - 1 5 1 1 - - - -C lass B ___________________________________ 47 39.0 147.50 - - - - - 1 8 11 7 7 4 8 1 - - - - -C lass C _________________ ________________ 108 37.5 144.50 - - - - 1 4 8 25 36 24 7 3 - - - - - - -C lass D _____________ _____ _________ __ 155 38.0 127.00 - - - - 9 30 55 40 18 ’ 3 - - - - - - - - -
Stenographers, g e n e ra l.................... 52 38.5 110.50 - - - 8 21 15 5 3 - - - - - - - - - - -Switchboard operators, class B _________ 10 38.5 111.00 " 1 ~ 5 1 3 " ~ " “ ~ ■ “ -
Selected computer occupations
Computer operators, c lass A ____________ 8 37.0 184.00 - - - - - - - - - 1 1 - 4 2 - - - - -Computer operators, class B ________ __ 16 38.0 165.50 - - - - - - - - 1 3 5 7 - - - - - - -Computer system s analysts, business,
class B ....... . . . . . . 12 37.0 222.50 - - " - - " ' 1 " 1 - - " 1 2 3 4
Selected teller occupations
T e llers , n o te _______________________________ 171 38.0 126.50 _ . 1 - 9 35 62 49 14 1 - - - - - - - - _T e llers , com m ercial-savin gs 280 39.5 106.50 10 7 14 41 90 90 25 3 - - - - - - - - - - -T e llers , all-round ... 52 39.0 121.50 1 6 12 24 9
1 The Portland Standard Metropolitan Statistical Area consists of Clackamas, Multnomah, and Washington Counties, O reg.; and Clark County, Wash.2 Standard hours reflect the workweek for which employees received their regular straight-tim e salaries and the earnings correspond to these weekly hours. Average weekly hours
are rounded to the nearest half hour and average weekly earnings to the nearest half dollar.
Digitized for FRASER http://fraser.stlouisfed.org/ Federal Reserve Bank of St. Louis

OccupationNumber
ofworkers
Avkraoc Number of workers receiving straight-tim e weekly earnings of—
Weekly hours 2
(Standard)
Weekly earnings2
(Standard)
$60and
under$65
$65
$70
$70
$75
$75
$80
$80
$85
$85
$90
$90
$95
$95
$100
$100
$110
$110
$120
$120
$130
$130
$140
$140
$150
$150
$160
$160
$170
$170
$180
$180
$200
$200
$220
$220
$240
$240
$260
$260
$2 80
Selected clerical occupations
Bookkeeping-machine operators,class A _________________________________________ __ 32 37.0 $114.50 - - - - - - 1 8 7 1 10 3 - - 2 - - - - - -
Bookkeeping-machine operators,class B _________________________________ ____ 49 37.5 102.00 - - - 3 2 12 4 10 4 6 - 4 4 - - - - - - - -
C lerks, file , c lass B _____________________ _ 229 38.5 90.50 - - - 41 24 79 27 20 24 10 4 - - - - - - - - - -Clerks, file , c lass C ____________________ 132 37.5 81.50 7 10 20 13 24 39 5 10 4 - - - - - - - _ _ _ -Keypunch operators, c lass A --------------------------- 31 39.0 122.50 - - - - - - - 1 4 10 8 5 3 - - - - - - - -Keypunch operators, class B --------------------------- 88 39.0 98.50 - - - 2 8 8 13 24 23 8 2 - - - - - - - - - -Proof-m achine o p e ra to rs _______________________ 281 37.5 92.50 - - 6 8 55 47 52 37 62 13 1 - - - - - - - - - -Safe-deposit c le r k s _______________________ _ 112 38.5 100.00 - - - - 18 26 9 11 26 5 5 12 - - - - - _ - - -Secretaries_______________________________ — 345 37.5 124.00 - - - 6 - 5 8 16 56 64 60 49 46 19 10 6 - - - _ -
Class A ______________________________________________ 29 37.0 152.00 - - - - - - - - - 1 4 2 6 4 7 5 _ _ _ _ _C lass B ______________________________________________ 100 37.5 131.00 - - - 6 - - - 2 6 8 23 18 21 12 3 1 _ _ _ _ _C lass C ----------------------------------------------------------- 161 38.0 120.50 - - - - - 2 - 12 36 34 26 29 19 3 _ - _ _ _ _ _C lass D ___________________________________________ _ 55 36.5 108.50 - - - - - 3 8 2 14 21 7 - - _ - - _ - - _ _
Stenographers, general___________________ 167 36.5 92.50 - - - 9 34 40 25 15 34 10 - - - - - - - - - - -Stenographers, se n io r ______________________ 52 38.0 108.50 - - - - - 7 9 5 13 5 9 - - 4 - - - - - - -Switchboard operators, c la ss A ___________ _ 20 37.0 120.50 - - - - - - - - 4 2 8 6 - - - - - - - - -Switchboard operators, c lass B ___________ 61 38.5 94.00 - - - - 12 3 21 7 18 - - - - - - - _ _ - _ -Typists, c lass A ____________ ____ ______ 72 37.0 99.50 - - - - 1 13 15 9 28 2 1 3 _ - - _ - - _ -T ypists, c lass B --------------------------------------------- 157 37.5 91.00 - " 11 7 18 39 32 19 25 6 - - - - - - - - * - -
Selected computer occupations
Computer operators, c lass A ______________ _ 21 39.5 151.00 - - - - _ - - - - _ _ 4 5 7 5 _ - _ _ . _Computer operators, c lass B ______________ 35 38.0 133.50 - - - - - - - - - 7 7 12 8 - - 1 - - - - -Computer operators, c lass C _________ __ 40 38.5 114.50 - - - - - - - 5 18 4 4 9 - - - - - - - - -Computer program m ers, business,
class B ----------------------------------------------------------- -------- 31 38.5 184.00 - - - - - - - - - - - - - 1 6 6 15 2 1 -Computer program m ers, business,
class C _____________________________________________ ___ 14 38.5 151.50 - - - - - - - - - - 2 2 2 3 5 - - - - - -Computer system s analysts,
business, c lass A _____________________________ _ 6 40.0 243.50 - - - - - - - - - - - - - - - - 1 1 3 1Computer system s analysts,
business, class B ________________________________ 9 38.0 208.00 - - - - - - - - - - - 3 5 1 - -
Selected teller occupations
T e lle rs , n o te __________________________________________ 204 38.0 113.00 _ _ _ 3 19 13 16 12 52 13 21 24 13 4 10 2 1 1 _ _ _T e lle rs , co m m e rcia l-sa v in g s-------------------- 610 37.5 100.00 - - 14 14 86 56 110 58 142 43 40 37 10 - _ _ _ _ _ _ _T e lle rs , com m ercia l________________________ 187 38.5 114.50 - - 3 6 6 11 16 22 24 23 11 41 13 10 - 1 - _ _ _ _T e llers , savin gs_________________________ __ 78 38.5 100.50 - - - 10 4 11 5 6 24 7 10 1 - - - _ - _ _ _ -T e llers , a ll-ro u n d ___________________________ 556 37.5 97.00 " 5 42 34 67 101 64 48 90 29 31 34 4 - - " 7 - - -
1 The St. Louis Standard Metropolitan Statistical Area consists of the city of St. Louis; the counties of Franklin, Jefferson, St. Charles, and St, Louis, M o.; and the counties of Madison and St. C lair, 111.
2 Standard hours reflect the workweek for which employees receive their regular straight-tim e salaries and the earnings correspond to these weekly hours. Average weekly hours are rounded to the nearest half hour and average weekly earnings to the nearest half dollar.
Digitized for FRASER http://fraser.stlouisfed.org/ Federal Reserve Bank of St. Louis

(Number of em ployees and average straight-tim e weekly earnings2 in selected occupations in banking establishm ents, September 1973)
Average Number of workers receiving straight-tim e weekly earning s of—
OccupationNumber
ofworkers Weekly
hours 2 (Standard)
Weeklyearnings2
(Standard)Under$80
$80and
under$85
$85
$90
$90
$95
$95
$100
$100
$105
$105
$1 10
$110
$115
$115
$120
$120
$130
$130
$140
$140
$150
$150
$160
$160
$170
$170
$180
$180
$200
$200
$220
$220
$240
$240
$260
$260
$2 80
$280
$300
$300andover
Selected clerical occupations
Bookkeeping-machine operators,class B ________________________________ ______ 33 39.0 $113.50 - - - 4 1 4 1 4 3 16 - - - - - - - - - - - -
C lerk s, file , class A ________________________ 25 39.5 111.00 - - - 2 2 4 4 7 2 - 4 - - - - - - - - - - -C lerk s, file , c lass B ________________________ 52 40.0 103.00 - - 2 6 13 13 9 4 3 1 1 - - - - - - - - - - -C lerks, file , class C ________________________ 109 40.0 100.00 - - 33 8 26 7 3 7 25 - - - - - - - - - - - - -Keypunch operators, class A ______________ 83 40.0 158.50 - - - - - - - - - - 5 13 26 34 5 - - - - - - -Proof-m achine o p e ra to rs___________________ 543 39.5 109.50 - - 23 33 78 100 61 62 75 84 22 5 - - - - - - - - - -Safe-deposit c le r k s __________________________ 82 40.0 113.00 - - 1 3 8 10 5 14 21 13 7 - - - - - - - - - - -S ecretaries_________________________________ _ 832 40.0 155.50 - - - - - - - 3 14 50 n o 185 161 150 66 79 11 3 - - - -
C lass A _____________________________________ 58 40.0 186.00 - - - - - - - - - - - - 2 5 15 29 5 2 - - - -C lass B _____________________________________ 121 40.0 172.00 - - - - - - - - 6 - l 10 16 17 24 40 6 1 - - - -C lass C _____________________________________ 482 40.0 150.50 - - - - - - - - 6 25 76 142 114 88 25 6 - - - - - -
» - C lass D _____________________________________VAi Stenographers, se n io r ______________________
Switchboard operators, class A ___________
171 39.5 146.50 - - - - - - - 3 2 25 33 33 29 40 2 4 - - - - - -574 40.0 130.50 - - - - - - 5 15 64 222 149 83 25 11 - - - - - - - -
44 40 .0 129.00 - - - 1 1 - 2 3 6 6 19 4 - 2 - - - - - - - -Switchboard operators, class B ___________ 44 40.0 112.00 - - - 8 2 3 1 8 9 11 1 1 - - - - - - - - - -Typists, class A _____________________________ 427 40.0 113.00 - - - - 31 59 115 67 50 63 27 10 5 - - - - - - - - -T ypists, class B ______________________________ 170 40.0 102.00 - - 9 65 56 16 15 8 1 - - - - - - - “ "
Selected computer occupations
Computer operators, c lass A ______________ 42 39.0 192.00 - - - - - - - - - - - 8 2 - 4 10 7 10 1 - - -Computer operators, class B ______________ 59 40.0 173.50 - - - - - - - - - - - 4 8 13 12 22 - - - - - -Computer operators, c lass C ______________ 40 39.5 157.00 - - - - - - - 4 - - 2 6 11 5 3 9 - - - - - -Computer system s analysts, business,
46 28class A _______________________________________ 153 40.0 281.00 - - - - - - - - - - - - - - - - 2 40 3 37Computer system s an alysts, business, 1
class B ________________________ 110 40.0 225.00 " - " - " - - - " " “ - _ 7 56 31 3 5 1 7
Selected teller occupations
T e llers , n o te _________________________________ 621 40.0 134.00 _ _ _ _ 5 13 20 30 48 139 161 111 56 19 9 10 - _ . - _ _T e lle rs , c o m m e rcia l-sa v in g s-------------------- 1,436 40.0 109.50 - - 3 87 205 273 198 204 237 166 54 7 2 - - - - - - - - -T e lle rs , savings_____________________________ 27 40.0 109.50 - - - 1 7 7 4 3 - 2 - 2 - 1 - - - - - - - -T e lle rs , a ll-ro u n d _________________________ 342 38.0 101.50 28 25 54 38 38 23 8 8 62 43 15
1 The San Francisco—Oakland Standard Metropolitan Statistical Area consists of Alameda, Contra Costa, Marin, San Francisco, and San Mateo Counties.2 Standard hours reflect the workweek for which employees receive their regular straight-tim e salaries and the earnings correspond to these weekly hours. Average weekly hours are rounded to the
nearest half hour and average weekly earnings to the nearest half dollar.3 W orkers were distributed as follows: 15 at $ 300 to $ 320; 13 at $ 320 to $ 340; 8 at $ 340 to $ 360; and 1 at $ 360 to $ 380.
Digitized for FRASER http://fraser.stlouisfed.org/ Federal Reserve Bank of St. Louis

(Number of em ployees and average straight-tim e weekly earnings2 in selected occupations in banking establishments October 1973)
OccupationNumber
ofworkers
Avibaqi Number of workers receiving straight-tim e weekly earnings of
Weeklyhours2
(Standard)
Weeklyearnings2
(Standard)
$70and
under$75
$75
$80
$80
$85
$85
$90
$90
$95
$95
$100
$100
$110
$110 1
$120
$120
$130
$130
$140
$140
$150
$150
$160
$160
$170
$170
$180
$180
$190
$190
$200
$200
$220
$220
$240
$240
$260
$260
$280
$280
$3 00
Selected clerical occupations
C lerks, file , class A________ „ __________ 9 40.0 $121.00 _ _ _ _ _ 3 4 1 1 _ _ _ _C lerk s, file , c lass B________________________ 14 40.0 97.50 _ - - 2 4 2 6 _ _ _ _ _ _ _ _ _ _ _ _ _ _C lerk s, file , class C________________________ 23 39.5 90.50 _ 7 4 2 _ 4 3 3 _ - _ _ _ _ _ _ _ _ _ _ _Keypunch operators, class A__ __ ---------- 80 40 .0 114.50 - - - - 4 6 24 19 16 8 3 - _ _ _ _ _ _ _ _ _Keypunch operators, class B ______________ 26 40.0 107.00 - - - 1 2 2 9 11 1 - _ - - - _ - _ _ _ _ _Proof-m achine op erators_________ _______ 143 40.0 103.00 - - - 33 22 18 25 24 13 6 2 - - - _ _ _ _ _ _ _Safe-deposit c le r k s__________________________ 28 40.0 126.50 - - - _ _ 1 3 5 5 9 5 - - - _ - _ _ _ _ _Secretaries— ________________________________ 355 40.0 143.00 - - - - - _ 1 29 56 87 72 52 20 23 8 3 4 _ _ _ _
C lass A_____________________________________ 10 40.0 174.50 _ _ _ _ _ _ _ _ ■ _ _ 3 _ 1 1 2 1 2 _ _ _ _C lass B_____________________________________ 45 40.0 156.00 - - - - - _ - _ 3 12 8 5 5 2 6 2 2 _ _ _ _C lass C___________________________________ 111 40.0 147.50 - - - _ - _ - 4 14 18 30 17 9 19 _ _ _ _ _ _ _C lass D_____________________________________ 189 40.0 135.50 - - - - _ _ 1 25 39 57 31 30 5 1 _ _ _ _ _ _ _
Stenographers, general_____________________ 92 40.0 112.00 - - - - 6 7 31 26 12 7 3 - - - - - - - _ _ -Switchboard operators, class B___________ 12 40.0 119.50 - - - - - - 5 1 2 4 - - - - - - - - _ _ _Typists, class B______________________________ 25 39.5 97.50 - - 3 6 8 8 - - - - - - - - - - - - -
Selected computer occupations
Computer operators, class A---------------------- 18 40.0 174.00 _ _ _ _ _ _ _ _ _ _ 1 4 2 5 2 2 2 _ _ _ _Computer operators, class B______________ 27 40.0 157.50 - - - - - - - - - 1 12 5 3 4 1 1 - - _ _ _Computer operators, c lass C______________ 13 40.0 137.50 - - - - - - - 1 5 1 3 2 1 - - - - - _ _ _Computer program m ers, business,
class A --------------------------- --------------------------- 20 40.0 231.50 - - - - - - - - - _ - - - - - 4 3 6 3 3 1Computer p rogram m ers, business,
class B ------------ -------------------------------------------- 38 40.0 230.00 - - - - - - - - - - - - _ _ 1 4 12 5 9 7 _Computer program m ers, business,
class C --------------------------------------------------------- 18 40 .0 173.00 - - - - - _ - - - _ 1 3 2 7 2 2 1 _ _ _ _Computer system s analysts, business,
class A ______________________________________ 6 40.0 282.50 - - - - - - - - - - - - - - - - _ - _ 3 3Computer system s analysts, business,
class B ----------------------------------------------------------- 15 40.0 259.50 - - - - " - - - - - - - - - 1 6 8 -
Selected teller occupations
T e lle rs , n ote_________________________________ 197 40.0 124.50 _ _ _ _ 7 11 26 38 45 33 16 9 7 5 _ _ _ _ _ _ _T e lle rs , com m e rcia l-sa v in g s_____________ 788 40.0 103.00 - - - 20 142 189 281 108 35 10 3 - _ _ _ _ _ _ _ _ _T e lle rs , a ll-rou n d ___________________________ 280 40.0 110.50 7 7 28 14 21 7 34 60 59 38 5
'
1 The Seattle—Everett Standard Metropolitan Statistical Area consists of King and Snohomish Counties.2 Standard hours reflect the workweek for which employees receive their regular straight-tim e salaries and the earnings correspond ti
to the nearest half hour and average weekly earnings to the nearest half dollar.these weekly hours. Average weekly hours are rounded
Digitized for FRASER http://fraser.stlouisfed.org/ Federal Reserve Bank of St. Louis

Occupation
S e lected c l e r i c a l occupations
Bookkeeping-machine operators ,c la s s B------------------------------------------
C lerks , f i l e , c la s s A------------------C lerks , f i l e , c la s s B------------------C lerks , f i l e , c la s s C------------------Keypunch o p era tors , c la ss A-------Keypunch op e ra to rs , c la s s B-------Proof-m achine op erators---------------S a fe -d ep osit c le rk s ----------------------S e cre ta r ie s -------------------------------------
C lass A---------------------------------------C lass B---------------------------------------C lass C---------------------------------------C lass D---------------------------------------
Stenographers, g en era l----------------Stenographers, s e n io r ------------------Switchboard o p e ra to rs , c la s s A-- Switchboard o p e ra to rs , c la s s B--T yp is ts , c la ss A-------------------------- -T yp is ts , c la ss B----------------------------
S e lected computer occupations
Computer op e ra to rs , c la s s A----------------Computer op e ra to rs , c la ss B----------------Computer op e ra to rs , c la ss C----------------Computer programmers, busin ess,
c la s s A---------------------------------------------------Computer programmers, b u sin ess,
c la s s B---------------------------------------------------Computer programmers, business,
c la s s C---------------------------------------------------Computer systems a n a ly sts , b u sin ess,
c la ss A------ ---------------------------------------------Computer systems a n a ly sts , bu sin ess,
c la s s B---------------------------------------------------
S e lected t e l l e r occupations
T e lle r s , n o te ---------------------------T e lle r s , com m ercial-savings- T e lle r s , a ll -ro u n d ------------------
Average Number of workers receiving straight-tim e hourly earnings ofNumber
Weekly Weekly $75 $80 $85 $90 $95 $100 $110 $120 $130 $140 $150 $160 $170 $180 $190 $200 $220 $240 $260 $280 $300 $320
workers hours2 earnings1 2 3 nnHf T( Standard) (Standard) $80 $85 $90 $95 $100 $110 $120 $130 $140 $150 $160 $170 $180 $190 $200 $220 $240 $260 $280 $300 $320 over
50 40.0 $100.00 10 15 5 6 8 4 238 36.5 113.50 - - - - 4 10 10 12 2 -
100 37.0 100.50 - - 9 22 24 40 5117 39.0 89.50 30 3 30 30 13 11
17 39.0 127.50 - - - - - - 1 13 2 160 38.0 117.00 - - - 1 8 9 13 25 3 1
340 38.5 107.50 - 5 22 26 59 93 83 34 12 1 4 162 38.5 123.50 - - 1 - 9 6 11 16 6 11 2
367 38.0 149.00 - - - 5 - 4 20 48 70 51 53 49 31 16 10 10 - - - - - -10 37.5 189.00 1 4 1 1 3 - - - - - -62 37.5 165.50 - - - - - - 5 3 6 6 6 9 5 8 7 7 - - - - - -
142 38.5 155.00 - - - - - - 6 4 19 25 27 34 19 6 2 - - - - - - -153 38.0 135.00 - - - 5 - 4 9 41 45 20 20 5 3 1 - - - - - - - -
16 40.0 101.00 - - - 5 8 - - 323 40.0 136.50 - - - - - 1 2 8 1 2 910 39.0 112.00 - - - - - 1 8 1 - - -35 39.0 98.50 - - 3 15 11 - 3 3
106 38.5 125.00 - - - - - 2 44 27 17 12 4240 38.0 110.00 ' ~ 6 4 24 105 65 26 8 1 1
24 38.5 179.00 3 1 1 9 4 1 4 134 37.5 139.50 - - - - - 7 1 14 2 6 3 - - 1 - - - - - - -25 39.5 130.00 - - - - - 5 9 4 4 3
23 38.0 236.50 - - - - - - - - - - - - - - 1 4 10 3 3 2
20 38.5 210.00 - - - - - - - - - - - 1 4 1 5 7 2 - - -
13 39.0 167.00 - - - - - - - - 1 3 1 2 1 4 1 - - - - - -
18 38.5 297.00 1 4 9 1 33
15 37.5 231.00 4 - 5 5 - 1 - -
185 38.5 143.50 3 18 26 31 30 42 19 12 2 2629 38.0 112.50
39 21432
14287 204
296163 86 37 15 5
24
1 The Washington Standard Metropolitan Statistical Area consists of the District of Columbia; the cities of Alexandria, Loudoun, and Prince W illiam , V a .; and Montgomery and Prince Georges, Md.
2 Standard hours reflect the workweek for which employees received their regular straight-tim e salaries and the earning: to the nearest half hour and average weekly earnings to the nearest half dollar.
3 W orkers were distributed as follows: 1 at $ 320 to $ 340; 1 at $ 340 to $ 360; and 1 at $ 380 to $ 400.
Fairfax, and F alls Church, V a.; and the counties of Arlington, Fairfax,
s correspond to these weekly hours. Average weekly hours are rounded
Digitized for FRASER http://fraser.stlouisfed.org/ Federal Reserve Bank of St. Louis

(Distribution of banking establishm ents studied by minimum entrance salary for inexperienced typists and savings te lle rs , 28 areas, August—November 1973)
Minimum weekly straight-tim e sa la ry 1
Northeast South
Boston Hartford Nassau—Suffolk Newark New
York Philadelphia Atlanta Baltimore Dallas Houston Louisville Memphis Miami NewOrleans W ashington
Inexperienced typists
Establishments studied__________________ 30 10 12 19 31 21 14 12 23 28 9 8 21 11 20
Establishments having a specifiedm in im u m _________________ ___________________ 12 8 7 7 21 13 8 6 7 3 5 1 9 3 9
Under $ 6 5 _______________________________________ _ _ _ . _ . . _ _ _ _ _$ 65 and under $ 70 _____________ ___ ______ _ _ _ _ _ _ 1 _ _ _ _ _ _ 2 _$ 70 and under $ 7 5 ______________ — -------------- _ _ _ - _ _ 1 _ _ _ 1 _ 1 1 _$ 75 and under $ 80 ------------------------------------------- - - - _ _ 2 - _ - _ 2 1 _ _ _$ 80 and under $ 8 5 ____________________________ 2 3 - - 4 - 3 1 1 - 3 - -
$ 85 and under $ 90______________________________ 5 1 1 3 2 4 1 5 _ 2 1 _ _ . 2$ 90 and under $ 9 5 _____________________________ 2 2 4 3 4 3 1 1 4 _ - _ 2 _ 2$ 95 and under $ 100____________________________ 2 2 2 1 6 _ 2 _ _ _ _ _ 2 _ 1$ 100 and under $ 105 ____________ ___________ 1 - - _ 5 _ 2 - _ _ _ _ 1 _ 2$ 105 and under $ 11 0 ---------------------------------------- _ - - _ 3 _ _ _ _ _ _ _ _ _ 1$ 110 and over __________________________________ " - - - 1 " - " - - - - - 1
Establishm ents having no specifiedminimum________________________________________ __ 1 1 7 1 2 3
Establishments which do not hireem ployees in this category___________________ 17 2 5 11 3 8 5 6 14 25 4 7 12 8 8
T e llers , savings
Establishments studied______ _______________ 30 10 12 19 31 21 14 12 23 28 9 8 21 11 20
Establishments having a specifiedminimum___________________________________ _____ 11 5 2 5 13 4 6 2 9 2
Under $ 6 5 _______________________________________ _ _ _ _ _ _ _ _ _ _ _ _$ 65 and under $ 70 ____________________________ _ 1 _ _ _ _ _ _ _ _ _ _ _ 1$ 70 and under $ 7 5 _____________________ _____ _ _ _ _ _ _ _ _ _ _ _ _ 1 _$ 75 and under $ 80 _________ _________________ _ _ _ _ _ _ _ _ _ 1 _ _ _ _$ 80 and under $ 85 _____________ ___________ 1 1 - 1 2 - - 1 1 - " 2 1 -
$ 85 and under $ 9 0 __________________________ 3 1 _ _ _ 1 _ _ 1 _ _ _ 1$ 90 and under $ 95 _______________ ___________ 2 1 _ 4 5 1 _ _ 3 _ _ _ 1 _ _$ 95 and under $ 100_____________________ ___ . _ 1 1 1 1 _ _ _ _ _ _ _ 1 _ _$ 100 and under $ 105___________________________ 5 _ 1 _ 3 _ _ _ 1 _ _ _ _ _ _$ 105 and under $ 110__________________________ - - - - 1 - _ - _ - - _ 2 _ _$ 110 and o v e r ----------------------------------------------------- - - - " 2 - " - - - - - 1 -
Establishments having no specifiedminimum----------------------------------------------------------------- 1 5 1 4 2
Establishments which do not hireem ployees in this category_____________________ 19 5 10 13 13 17 13 12 13 26 9 8 10 9 19
See footnotes at end of table.
Digitized for FRASER http://fraser.stlouisfed.org/ Federal Reserve Bank of St. Louis

(Distribution of banking establishm ents studied by minimum entrance salary for inexperienced typists and savings te lle rs , 28 areas, August—November 1973)
Minimum weekly straight-tim e sa la ry 1
North Central West
Chicago Cincinnati Detroit Indianapolis KansasCity Milwaukee Minneapolis—
St. Paul St. Louis Denver Los A ngeles- Long Beach Portland
SanF rancisco—
OaklandSeattle-Everett
Inexperienced typists
Establishments studied_______________________ 46 11 15 11 32 18 25 31 18 16 9 15 11
Establishments having a specifiedm in im u m ___________________________________________ 20 4 7 5 12 4 10 17 8 9 2 7 6
Under $ 6 5 ------------------------------------------------------------- _ _ _ _ _ _ 1 _ _ _ _$ 65 and under $ 7 0 ______________________________ - 1 1 - - 5 - 1 - - -$ 70 and under $ 7 5______________________________ - - - 2 1 - 4 1 - - - -$ 75 and under $ 8 0 ______________________________ _ - 1 1 - 1 1 1 1 - 1 - -$ 80 and under $ 8 5 ______ ______________________ 2 1 2 2 5 - 4 4 3 - -
$ 85 and under $ 9 0 ______________________________ 2 3 1 3 1 2 2 3 2 - 4 4$ 90 and under $ 95 _____________________________ 4 - - - 1 - 3 - - 3 1 2 2$ 95 and under $ 100. ----------------------------------------- 7 - 2 - - 1 - - - 2 - 1 -$ 100 and under $ 105------------------------------------------ 4 - 1 - - - - - - 1 - - -$ 105 and under $ 110------------------------------------------ - - 1 - - - - - - - - - -$ 110 and o v e r------------------------------------------------------ " - " " - " - ~
Establishm ents having no specifiedm in im u m __________________________ __________ — 3 1 2 3 1 4 2 4
Establishm ents which did not hireem ployees in this category---------------------------------- 23 7 7 6 18 11 14 10 10 5 7 4 4
T e lle rs , savings
Establishm ents studied----------------------------------- 46 11 15 11 32 18 25 31 18 16 9 15 11
Establishments having a specifiedminimum____________________________________________ 11 1 1 5 2 8 22 2 2 2 2 2
Under $ 6 5 ________________________________________ _ _ _ _ _ - - 1 - - - - -$ 65 and under $ 7 0 ---------------------------------------------- - - - - - - - 7 - 1 - - -$ 70 and under $ 7 5 ---------------------------------------------- - - - - - - - 6 - - - - -$ 75 and under $ 8 0 ---------------------------------------------- 1 - - - - - - 2 - - - - -$ 80 and under $ 8 5 ---------------------------------------------- 2 - 1 " 3 1 - 3 - - ~ -
$ 85 and under $ 9 0 ----- -------------------------------------- _ _ . 1 1 1 2 - 1 - 2 - 1$ 90 and under $ 9 5 ---------------------------------------------- 3 - - - - - 5 2 - - - 1 1$ 95 and under $ 100--------------------------------------------- 1 - - - 1 - - - - 1 - 1 -$ 100 and under $ 105------------------------------------------ 1 - - - - - 1 1 - - - - -$ 105 and under $ 110------------ --------------------------- - - - - - - - - - - - - -$ 110 and over —---------------------------------------------------- 3 - - - - - 1 1 ~ _ “
Establishments having no specifiedminimum------------------------------------------------------------------- 3 2 3 2 1 8 1 3
Establishments which did not hireem ployees in this category---------------------------------- 32 11 12 10 24 14 16 1 16 13 7 10 8
Relates to form ally established starting (hiring) salaries that are paid for standard workweeks.
Digitized for FRASER http://fraser.stlouisfed.org/ Federal Reserve Bank of St. Louis

Table 31. Method of wage payment
Area
Form al tim e-rate system s
IndividualdeterminationSingle-rate
Range of rates
Total
Advancement based on—
Length of service M erit reviewCombination of
length of service and m erit review
Northeast:B oston________ ______________________________ - 91 - 91 - 9H artfo rd ...... ............ . - 94 - 93 1 6Nas sau—Suffolk_____________ ______________ __ - 76 - 76 - 24Newark ........ ...................... . .. - 93 4 72 17 7New York . ................... ....... _ - 76 - 71 5 24Philadelphia.................................. 89 2 80 8 11
South:Atlanta ...... .... - 94 15 38 41 6Baltimore ..... ... ...... ............ - 93 22 71 - 7Dallas . . .. . . .. .. .... ... - 42 - 37 5 58Houston ... ____ _ . - 61 4 54 3 39L ou isville ..... ................ ....... . ........... . - 92 - 14 78 8Memphis . ... .... ._ - 87 - 87 - 13Miami __ ____________________________ ________ - 48 - 48 - 52New Orleans - 41 41 - 59Washington . 84 77 7 16
North Central:Chicago 4 77 74 3 19Cincinnati_______________________________________ - 92 87 4 8D e tro it_________________________________________ - 92 68 24 8Indianapolis .. ._ ... ....... . - 97 - 68 30 3Kansas Citv . . . . . . - 53 - 49 4 47Milwaukee ........ . ......................... ........ - 88 - 22 66 12Minniapolis—St. Paul - 77 2 41 34 23St. L o u is________________________________________ ~ 64 2 56 6 36
W est:Denver - 92 - 81 12 8Los Angeles—Long Beach - 99 97 2 1Portland .... _________ ___ - 99 56 42 1San Francisco—Oakland_______________________ - 97 - 96 1 3Seattle—Everett .... . .. ................. . 93 51 42 7
See appendix A for description of methods of wage payment.
Digitized for FRASER http://fraser.stlouisfed.org/ Federal Reserve Bank of St. Louis

W eekly hours 1
Northeast South
Boston Hartford Nassau—Suffolk Newark New
York Philadelphia Atlanta Baltimore Dallas Houston Louisville Memphis Miam i NewOrleans Washington
A ll em ployees________ _______________________ 100 100- 100 100 100 100 100 100 100 100 100 100 100 100 100
Under 35 h ou rs________________________________ . 2 2 . . _ _ _ _ _35 h ou rs. ___________________________________________ 37 11 12 51 84 2 - - 3 4 5 - - - 153 5 V2 h ou rs_______ __________________________________ _ _ _ _ - _ - - - - - - - - -36 hours ______________________ _ _ _ ____ 2 40 4 - 3 - 3 - 5 - - - - - 4Over 36 and under 37 hours ______________________ 9 42 6 2 4 16 _ 4 - - - - 5 - -37 hours ____________________ ____________________ _ _ _ 13 3 1 - - 2 3 - - 5 - -37V3 hours __________________________________________ _ _ 6 6 _ _ - - - - - - - - -3 7 V2 h ou rs___________________________________________ 19 4 42 27 5 54 9 26 5 15 51 5 3 6 20373/4 or 374/5 h ours_________________________________ - - - - - - - - - - - - - - -38 h ou rs__________________________________________ 20 - _ - - - - - - 19 - - 5 - 6Over 38 and under 39 h o u r s ______________________ _ - _ 2 - 2 38 14 - 2 - - - - -39 and under 40 h o u rs______________________________ _ _ _ _ _ - _ - - - 12 6 - - -40 h ou rs____________________________________________ 12 3 30 _ _ 26 50 53 86 54 33 89 83 92 55Over 40 hours________________________________ ___ " " " - " “ " 3 ~ “ " 2
“
A ll em ployees----------------
Under 35 h o u rs______________35 h ou rs_______________________3 5 V2 h ou rs____________________36 h ou rs_______________________O ver 36 and under 37 hours.37 h ou rs_______________________37V3 h ou rs____________________37V2 h ou rs____________________373/4 or 374/5 h ou rs__________38 h ou rs_______________________Over 38 and under 39 hours39 and under 40 h ou rs---------40 h ou rs_______________________O ver 40 hours________________
N orth C en tra l W est
C h icago C incinnati D etro it Indianapolis K ansasC ity M ilw aukee M in n ea polis—
St. P aul St. L ou is D en ver L o s A n g e le s - L ong B each P ortla n d
SanF r a n c is c o —
O aklandSeattle—E v erett
100 100 100 100 100 100 100 100 100 100 100 100 100
4 2 2 _ _ 2 _7 3 _ _ 1 _ _ 23 _ - 2 - -_ _ _ _ _ _ 2 2 _ - - - -3 - 2
13
3 - - - 3 - - - - “
1 - - - 3 - 10 - - - - -
14 54 5 3 : 3 5 17 _ 1 79 2 22 _ _ _ _ 3 _ - - - - - -9 9 _ 2 _ _ _ 2 - - - - -
36 _ _ 34 _ 41 21 2 - - - - -_ _ 38 _ _ _ 18 4 - - - - -24 35 44 56 9 9 51 54 35 100 99 19 96 98
1 Data relate to the predominant work schedule of full-tim e day-shift employees in each establishment.
NO TE: Because of rounding sums of individual items may not equal 100.
Digitized for FRASER http://fraser.stlouisfed.org/ Federal Reserve Bank of St. Louis

ItemNortheast South
Boston Hartford Nassau—Suffolk Newark New
York Philadelphia Atlanta Baltimore Dallas Houston Louisville Memphis Miami NewOrleans Washington
A ll e m p lo y e e s-------------------------------------------------- 100 100 100 100 100 100 100 100 100 100 100 100 100 100 100
Em ployees in establishm ents providingweekly overtim e pay 1 ___________________________ 100 100 100 100 100 100 100 100 100 100 100 100 100 100 93
Time and o n e-h a lf______________________________ 100 100 100 100 100 100 100 100 85 87 100 98 100 50 83
Effective after:32 V2 h o u r s_______________________________ 2 - - - - - - - - - - - - - -35 h ou rs___________________________________ 3 - 2 - 13 - - - - - - - - - -36 h ours___________________ _____________ - - - - - - 3 - - - - - - - -37 h ours____________________ — — ------ 5 - - - 1 - - - - - - - - - -37V2 h ou rs------------- — ----------------------- 3 4 - - - - 9 - - - - - - - -3 8 h ou rs___________________________________ - - - - - - - - - - - - - - -40 h ours___________________________________ 87 96 98 100 86 100 88 100 85 87 100 91 100 50 83
Fluctuating workweek principle 1 2 - _ - - - - - - - 15 13 - 8 - 50 10
Em ployees in establishm ents with noprovisions for weekly overtime pay___________ ■ " ~ ■* ■ “ “ “ “
"7
A ll em p lo y ee s_______________ — ___________
North Central West
Chicago Cincinnati Detroit Indianapolis KansasCity Milwaukee Minneapolis—
St. Paul St. Louis Denver Los A n g e le s- Long Beach Portland
SanFrancisco—
OaklandSeattle—Everett
100 100 100 100 100 100 100 100 100 100 100 100 100
Em ployees in establishm ents providingweekly overtim e pay 1 ------------------------------------------ 100 100 100 100 100 100 100 100 100 100 100 100 100
Tim e and o n e-h alf______________________________ 100 100 100 100 93 100 100 98 100 100 100 100 100
Effective after:32Ve h ours____________________ ________ - - - - - - - - - - - - -35 h ou rs___________________________________ - - - - - - - - - - - - -36 h ours___________________________________ - - - - - - - - - - - - -37 hours____________________ _____________ - - - - - - - - - - - - -37V2 h ours__________ ___________________ - - 2 - - - - - - 1 - - -38 h ours----------------------------------------------------- - - - - - - 3 - - - - - -40 h ours___________________________________ 100 100 98 100 93 100 97 98 100 99 100 100 100
Fluctuating workweek principle 2___________ - - - - 7 - - 2 - - - -
Employees in establishments with noprovisions for weekly overtim e pay___________
1 Graduated provisions for premium pay are classified under the first effective premium rate. For example, a plan calling for no pay or pay at regular rate after 37V2 hours and time andone-half after 40 hours would be considered as time and one-half after 40 hours.
2 Under the principle of the fluctuating workweek, pay for overtime work is determined by dividing the weekly salary by the total number of hours worked during the week (to obtain the base hourlyrate for the week) and then applying the established overtime pay ratio for overtime hours worked. Thus, the hourly rate of pay for overtime decreases as the number of hours worked increases. For exam ple, an employee with a salary of $120-a-w eek who worked 45 hours and had an overtime rate of time and one-half for hours worked over 40 would receive his base salary of $120 and $6 .68overtime premium pay [$120 4- 45 hours = $2.67 (base hourly rate). (5 hours x $2 .67)4 - 2 = $6 .68 (overtime prem ium )]. The pay for the same employee working 60 hours in a week would be $120plus $20 overtim e premium pay [$120 4- 60 hours = $2 . (20 hours x $2 )4 - 2 0 = $ 2 0 ],
Digitized for FRASER http://fraser.stlouisfed.org/ Federal Reserve Bank of St. Louis

Table 34. Overtime premium pay—daily overtime
Item
Northeast South
Boston Hartford Nassau-Suffolk Newark New
York Philadelphia Atlanta Baltimore Dallas Houston Louisville Memphis M iami NewOrleans Washington
A ll emplovees __ . 100 100 100 100 100 100 100 100 100 100 100 100 100 100 100
Employees in establishments providingdaily overtim e p ay1 ..... _ 32 4 2 6 10 23 19
Tim e and one-half .... _ ... ....... 32 4 2 6 10 23 - 19
Effective after:7 hours ,.............. . _ _ 2 - 2 - 10 - - - - - - - - - -7 V? hours ... . ...... . ... 3 - - - - - - - - - - - - - -8 hours ....... . .. 22 4 - 6 - - - - - - - - - - 198 Vs hours ............. 5 - - - - - - - - - - - - - -9 hours ........ ......... - - - - - 23 - " "
Employees in establishments providingno overtim e pay ._ ... . . 68 96 98 94 90 100 100 100 77 100 100 100 100 100 81
A ll em p loyee s________________ _________
North Central W est
Chicago Cincinnati Detroit Indianapolis KansasCity Milwaukee Minneapolis—
St. Paul St. Louis Denver Los A n geles- Long Beach Portland
SanF rancisco-
Oakland
Seattle—Everett
100 100 100 100 100 100 100 100 100 100 100 100 100
Employees in establishments providingdaily overtim e p ay1______ _ _____ ___ _____ 4 6 5 5 36 100 99 100 19
Tim e and one-half .. 4 6 5 5 36 100 99 100 19
Effective after:7 hours ............... . ._ ... ......... - - - - - - - - - - - - -7 V? hours ....... _ .... .. . .......... - - - - - - - - - 1 - - -8 hours ______ ______ 4 - 6 - - 5 5 36 - 99 99 100 198 V? hours - - - - - - - - - - - - -9 hours __ - - - " " - - - - "
Employees in establishments providingno overtim e pay_______ __ __ __ __ __ 96 100 94 100 100 95 95 64 100 1 81
1 Graduated provisions for prem ium pay are classified under the first effective prem ium rate. For example, a plan calling for time and one-half after 8 hours and double time after 10 hours a day, would be considered time and one-half after 8 hours.
NOTE: Because of rounding, sums of individual items may not equal 100.
Digitized for FRASER http://fraser.stlouisfed.org/ Federal Reserve Bank of St. Louis

Number of paid holidays
Northeast South
Boston Hartford N assau -Suffolk Newark New
York Philadelphia Atlanta Baltimore Dallas Houston Louisville Memphis M iam i NewOrleans W ashington
A ll em ployees________________________________ 100 100 100 100 100 100 100 100 100 100 100 100 100 100 100
Em ployees in establishments providingpaid h olidays__ __________________________________ 100 100 100 100 100 100 100 100 100 100 100 100 100 100 100
4 days ____________________________________________ _ _ _ _ _ _ _ _ _ _ _ _ _ _ _6 d ays________ ________________________________ - - - - - - 100 - - - 88 - - 100 -6 days plus 1 half day---------------------------------------- - - - - - - - - - - - - - - -6 days plus 2 or 3 half days___________________ - - - - - - - - — - - - - - -7 d ays_______ ________________________________ - - - - - - - - - - - - - - -
7 days plus 1 half day---------------------------------------- - - - - - - - - - - - - - - -8 d ays____________________________________________ - - - - - - - - 1 - 3 2 100 - 28 days plus 1 ,2 , or 3 half d ays_______________ - - - _ - - - - - - - - - - -9 days_____________________________________________ - - - - - - - - 84 100 - 98 - - 649 days plus 1 or 2 half days___________________ - - - - - - - - - - - - - - -
10 days __ __ ____ __ __ ____________ „ 38 - - - - - - 96 15 - - - - - 3410 days plus 1 or 2 half d ays_________________ - _ - _ - - - - - - - - - - -
11 d a y s ... ___ __________ _____ ______________ 62 100 100 _ 96 - - 4 - - - - - - -
12 days__ _ ____________________________________ - - - 100 - 100 - - - - - - - - -
13 days________ ______ _________________________ - - - - 4 - - " - 9 - - - "
North Central W est
Chicago Cincinnati Detroit Indianapolis KansasCity Milwaukee Minneapolis—
St. Paul St. Louis Denver Los A n ge le s- Long Beach Portland
SanF rancisco—
OaklandSeattle—Everett
A ll em ployees__________________________________ 100 100 100 100 100 100 100 100 100 100 100 100 100
Em ployees in establishm ents providingpaid h olidays______ ______________________________ 100 100 100 100 100 100 100 100 100 100 100 100 100
4 days_____________________________________________ _ _ _ _ 6 _ _ _ _ _ _ _ _6 d ays_____________________________________________ 24 11 - 5 3 - - - - _ - - _6 days plus 1 half d a y __________________________ 2 - - 63 - _ - _ - _ - _ _6 days plus 2 or 3 half days__________________ - - - 32 - - _ _ _ _ _ _ _7 days __ ____ ________________________ 6 - - - - - 6 2 - _ 95 _ _7 days plus 1 half day - - - - - _ - _ - _ - 1 _8 days _ ............. .... ..................... ................... 7 8 - - 13 - 26 3 _ 2 _ 3 648 days plus 1 ,2 , or 3 half days ______________ - - - - - - - _ - 77 - 49 -9 d ays___________________ ________________________ 1 59 _ _ 75 1 68 89 100 21 1 25 369 days plus 1 or 2 half days... - - _ _ _ 46 _ 4 - _ 4 1 _10 days_________________________ _______________ 4 22 98 _ 4 _ _ 2 - _ _ 21 _
10 days plus 1 or 2 half days ....... . _ _ _ _ _ 53 _ _ _ _ _ _ _11 days_________ _________ ______ _ __________ 56 . 2 _ _ _ _ _ _ _ _ _ _
12 days___________________________ _______________ _ . _ _ _ _ _ _ _ _ _ _ _
13 days_ _ _ _ __ . .
NO TE: Because of rounding, sums of individual item s may not equal 100,
Digitized for FRASER http://fraser.stlouisfed.org/ Federal Reserve Bank of St. Louis

Vacation policy
Northeast South
Boston Hartford Nassau—Suffolk Newark New
York Philadelphia Atlanta Baltimore Dallas Houston Louisville Memphis Miami NewOrleans Washington
A ll em ployees ........... ....... _ 100 100 100 100 100 100 100 100 100 100 100 100 100 100 100
Method of payment
Employees in establishments providingpaid vacations ._ ....... .... ___ 100 100 100 100 100 100 100 100 100 100 100 100 100 100 100
L ength-of-tim e payment . . . ... ....... _ 100 100 100 100 100 100 100 100 100 100 100 100 100 100 100
Amount of vacation p a y 1
After 6 months of service:Under 1 w e e k ____________________________________ - - - 10 - - - 3 - - - - - - 131 week __ . ___ 58 51 59 19 47 69 98 88 75 52 86 59 73 56 61Over 1 and under 2 weeks .... ... 2 9 6 20 - 10 - - 4 - 14 - 5 - 42 weeks . . . .......... . _. _ 39 36 35 48 51 20 1 7 - - - 4 9 5 -
After 1 year of service:1 week ................. . - 4 - 3 - - - 2 - 3 - 2 - - -2 weeks . . ... 98 96 100 97 97 100 100 98 100 97 100 98 100 100 96Over 2 and under 3 weeks __ 1 - - - 1 - - - - - - - - - 43 weeks ...... . ....... ..... 1 - - - 2 - - - - - - - - - -4 weeks - - - - - - - - - - - - - - -
A fter 3 years of service:1 week _____ - - - - - - - - - - - 2 - - -2 weeks . .. 78 100 82 100 87 96 100 100 100 100 100 98 88 100 96Over 2 and under 3 w eeks. 1 - - - 1 - - - - - - - - - 43 w ee k s.... .... ... 21 - 18 - 12 4 - - - - - - 12 - -4 weeks - - - - - - - - - - - - - - -
A fter 5 years of service:1 w e e k ______________ __ ___ __ „ __ ___ - - - - - - - - - - - 2 - - -2 w eeks__________ ____ ______ _____ 12 100 59 84 8 96 100 78 100 96 100 98 67 100 74Over 2 and under 3 weeks . . ... - - 6 - - - - - - - - - - - 43 weeks _____ __ _____ __ __ ______ 88 - 35 17 93 4 - 22 - 4 - - 28 - 23Over 3 and under 4 w eeks_____________________ - - - - - - - - - - - - - - -4 weeks ................ . .. _ - - - - - - - - - - - - 5 - -
After 10 years of service:1 week ____________ _____ - - - - - - - - - - - 2 - - -2 weeks . ........ .... _ . - 14 9 2 1 24 4 3 40 36 17 9 3 94 3Over 2 and under 3 weeks .... - - 6 - - - - - - - - - - - -3 weeks _ . ......................... ........ 90 86 85 92 95 72 96 97 60 64 83 89 92 6 97Over 3 and under 4 w eeks______________________ - - - - 1 - - - - - - - - - -4 w eeks. __ _______ __ ___ __ __ _ 10 - - 6 3 4 - - - - - - 5 - -
After 15 years of service:1 week __ __ _ _____ _ ______ __ - - - - - - - - - - - 2 - - -2 weeks .... _ ____ - 12 - - 1 1 4 3 29 32 3 9 3 68 -Over 7 and under 3 weeks - - - - - - - - - - - - - - -3 w eeks______ __ _ __ __ _ _ ____ 87 88 82 61 19 75 35 75 71 64 97 89 77 33 74Over 3 and under 4 weeks - - - - - - - - - - - - - - 44 w eeks__ __ _____ 13 - 19 40 77 24 62 22 - 4 - - 20 - 23Over 4 and under 5 w eeks______ - - - - 1 - - - - - - - - - -5 w eeks____ __ __ — _ __ __ __ _ - - - - 1 - - - - - - - - - -
A fter 20 years of service:1 w e e k ____________________________________________ - - - - - - - - - - - 2 - - -2 w eeks_______________ _____ _________ ______ - 12 - - 1 1 4 3 29 32 3 9 - 22 -Over 2 and under 3 w eeks___________________ _ - - - - - - - - - - - - - - -3 w eeks----------------- --------------------------- ---------- - 24 86 33 55 4 21 3 15 16 44 14 42 66 78 35Over 3 and under 4 w eeks____ ____________ - - - - - - - - - - - - - - 44 w eeks_______________ _____ — — - -------- 76 3 67 41 92 69 93 82 55 24 83 47 34 - 62Over 4 and under 5 w eeks_____________________ - - - 4 1 4 - - - - - - - - -5 w eeks. _ -------- ------------- _ _ --------- - - - - - 6 - - - - - - - - -6 w eeks____ __ -------- ---------- ---------------- — _ 1
Digitized for FRASER http://fraser.stlouisfed.org/ Federal Reserve Bank of St. Louis

Northeast South
Vacation policyBoston Hartford Nassau—
Suffolk Newark NewYork Philadelphia Atlanta Baltimore Dallas Houston Louisville Memphis Miami New
Orleans Washington
Amount of vacation p a y 1— Continued
After 25 years of service:1 w ee k ____________________________________________ - - - - - - - - - - - 2 - - -2 w eeks___________________________________________ - 12 - - 1 1 4 3 29 32 3 9 - 22 -Over 2 and under 3 w eeks_____________________ - - - - - - - - - - - - - - -3 w eeks___________________________________________ 14 8 33 21 3 14 3 15 16 23 14 42 66 78 31Over 3 and under 4 w eeks_____________________ - - - - - - - - - - - - - - 44 w eeks___________________________________________ 86 80 67 66 91 70 93 82 55 45 83 47 34 - 66Over 4 and under 5 w eeks_____ ______________ - - - 4 - 6 - - - - - - - - -5 w eeks___________________________________________ - - - 10 4 10 - - - - - - - - -Over 5 and under 6 w eeks_____________________ - - - - - - - - - - - - - - -6 w eeks___________________________________________ - - - - 1 - - - - - - - - - -
After 30 years of service:1 w e e k ___________________ ________________________ - - - - - - - - - - - 2 - - -2 weeks ___ ________ _ _ ______________ - 12 - - 1 1 4 3 29 32 3 9 - 22 -Over 2 and under 3 w eeks_____________________ - - - - - - - - - - - - - - -3 weeks ___ __ __ 14 8 33 21 3 14 3 15 16 23 14 42 66 78 31Over 3 and under 4 w eeks_____________________ - - - - - - - - - - - - - - 44 w eeks________________________________________ __ 86 80 67 66 74 70 93 82 55 45 83 47 34 - 66Over 4 and under 5 w eeks_____________________ - - - 4 - 6 - - - - - - - - -5 w eeks___________________________________________ - - - 10 20 10 - - - - - - - - -Over 5 and under 6 w eeks_____________________ - - - - - - - - - - - - - - -6 w eeks___________________________________________ - - - - 1 - - - - - - - - - -
Maximum vacation available:1 w ee k ____________________________________________ - - - - - - - - - - - 2 - - -2 w eeks___________________________________________ - 12 - - 1 1 4 3 29 32 3 9 - 22 -Over 2 and under 3 w eeks_____________________ - - - - - - - - - - - - - - -3 w eeks___________________________________________ 14 8 33 21 3 14 3 15 16 23 14 42 66 78 31Over 3 and under 4 w eeks____________________ - - - - - - - - - - - - - - 44 w eeks___________________________________________ 86 80 60 66 46 70 93 82 55 45 83 47 34 - 66Over 4 and under 5 w eeks_____________________ - - - 4 - 6 - - - - - - - - -5 w eeks___________________________________________ - - 7 10 49 10 - - - - - - - - -Over 5 and under 6 w eeks_____________________ - - - - - - - - - - - - - - -6 w eeks___________________________________________ 1
See footnotes at end of table.
Digitized for FRASER http://fraser.stlouisfed.org/ Federal Reserve Bank of St. Louis

North Central West
Vacation policyChicago Cincinnati Detroit Indianapolis Kansas
City Milwaukee Minneapoli s— St. Paul St. Louis Denver Los A n g e le s-
Long Beach PortlandSan
F rancisco— Oakland
Seattle—Everett
A ll em ployees 100 100 100 100 100 100 100 100 100 100 100 100 100
Method of payment
Employees in establishments providing100 100paid vacations ... 100 100 100 100 100 100 100 100 100 100 100
Length-of-tim e payment ______________________ 100 100 100 100 100 100 100 100 100 100 100 100 100
Amount of vacation pay 1
After 6 months of service:Under 1 w e e k ___ __ _______ __ ______________ 1 - 2 - - - - - - - - - -1 week _________ _____________________________ 74 42 54 95 29 96 69 47 23 92 99 98 39Over 1 and under 2 w eeks__________________ 1 23 39 - 19 - 10 2 - - - - 162 w eeks___________________________________________ 9 - 1 - 1 - 18 4 - 1 - - -
After 1 year of service:1 w e e k _____________ ______________________ ____ - 12 - 3 2 7 - 4 - - - - -2 w eeks________________ ______________________ 97 88 100 97 74 93 97 94 100 100 100 99 100Over 2 and under 3 w eeks_____________________ 2 - - - - - - - - - - 1 -3 weeks _ ____ _ _ -------------------- 1 - - - 25 - 4 - - - - - -4 w eeks________ _ ____ _____________________ - - - - - - - 2 - - "
After 3 years of service:1 week __ ______________________________________ - - - - - - - - - - - -2 weeks _ _______________________ 97 100 100 100 75 100 97 98 100 100 100 99 100Over 2 and under 3 w eeks____________________ 2 - - - - - - - - - - 1 -3 w eeks___________________________________________ 1 - - - 25 - 4 - - - - - -4 weeks __________________________________________ - - - - - - - 2 - - - - ■
After 5 years of service:1 w e e k ____________________________________________ - - - - - - - - - - - - -2 w eeks----------------- ---------------------- ------------------ 94 100 88 95 71 94 92 98 92 44 58 9 82Over 2 and under 3 weeks ___ -------------------- 2 - - - 3 6 - - - 4 - - -3 weeks _________________________________________ 4 - 12 5 9 - 4 - 8 53 42 91 19Over 3 and under 4 w eeks-------------------------------- - - - - 17 - - - - - - - -4 w eeks___________________________________________ - - - - - - 4 2 - - " - -
After 10 years of service:1 w ee k ____________________________________________ - - - - - - - - - - - - -2 weeks __ _______________________________________ 10 31 2 3 38 7 11 29 7 1 2 1 -Over 2 and under 3 w eeks_____________________ - - - - 3 - - - - - - - -3 weeks __ __ ___________________ _______ 90 69 97 93 42 90 86 69 93 88 99 93 97Over 3 and under 4 w eeks_____________________ - - - - 17 3 - - - - - - -4 w eeks--------------- --------------------------------------------- - - 1 5 - - 4 2 - 11 - 6 3
After 15 years of service:1 w e e k ------------------ --------------------------------------------- - - - - - - - - - - - - -2 w eeks___________________________________________ 1 5 2 - 20 3 7 10 2 1 2 1 -Over 2 and under 3 w eeks_____________________ - - - - 2 - - - - - - - -3 w eeks----------------------- -------------------------------------- 76 46 86 95 62 75 58 86 95 52 62 27 82Over 3 and under 4 w eeks_____________________ - - - - 17 15 23 - - - - - -4 w eeks__ __ — ----- -------------------- 23 49 12 - - 8 13 2 2 47 37 73 19Over 4 and under 5 w eeks------------------------------- - - - - - - - - - - - - -5 w eeks__________________________________________ - - - 5 - - - 2 - - - - -
After 20 years of service:1 w e e k ____________________________________________ - - - - - - - - - - - - -2 w eeks___________________________________________ 1 5 2 - 20 3 7 6 2 1 2 1 -Over 2 and under 3 w eeks-------------------------------- - - - - 2 - - - - - - - -3 w eeks----------------------- --------------------------------------- 44 21 8 18 37 13 7 45 40 51 5 22 5Over 3 and under 4 w eeks. --------------------------- - - - - 15 - - - - - - - -4 w eeks_________ _______________________________ 56 52 90 77 28 43 83 47 58 48 94 78 85Over 4 and under 5 w eeks-------------------------------- - - - - - 38 - - - - - - -5 w eeks___________________________________________ - 22 - 5 - 3 3 2 - - - - 116 w eeks___________________________________________
Digitized for FRASER http://fraser.stlouisfed.org/ Federal Reserve Bank of St. Louis

North Central West
Vacation policyChicago Cincinnati Detroit Indianapolis Kansas
City Milwaukee Minneapolis— St. Paul St. Louis Denver Los A n geles-
Long Beach PortlandSan
F rancisco— Oakland
Seattle—Everett
Amount of vacation pay— Continued
After 25 years of service:1 w ee k ______________ ___________________________ - - - - - - - - - - -2 w eeks___________________________________________ 1 5 2 - 20 3 7 6 2 1 2 1 -Over 2 and under 3 weeks __________________ - - - - 2 - - - - - - - -3 w eeks___________________________________________ 32 21 5 16 26 10 5 39 29 13 5 4 2Over 3 and under 4 w eeks_____________________ - - - - 2 - - - - - - - -4 w eeks___________________________________________ 48 52 84 80 51 22 85 48 68 86 93 96 63Over 4 and under 5 w eeks_____________________ 20 - - - - 12 - 5 - - - - -5 w eeks___________________________________________ - 22 9 5 - 54 3 2 - - 1 - 24Over 5 and under 6 weeks _____ ______________ - - - - - - - - - - - - -6 w eeks_______ ________________ __________________ - - - - - - - - - - - - 11
After 30 years of service:1 week __ .... __ _ - - - - - - - - - - - - -2 w eeks______________________ ____________________ 1 5 2 - 20 3 7 6 2 1 2 1 -Over 2 and under 3 w eeks____ ________ _____ - - - - 2 - - - - - - - -3 weeks __________________________________________ 32 21 5 16 26 10 5 39 29 13 5 4 2Over 3 and under 4 weeks ___ ________________ - - - - 2 - - - - - - - -4 weeks . ........ 48 52 65 80 50 19 63 48 68 86 54 96 63Over 4 and under 5 weeks __ _________________ 20 - - - - - - 5 - - - - -5 weeks ... _ _ _ - 22 28 5 1 68 25 2 - - 40 - 24Over 5 and under 6 w eeks____________________ - - - - - - - - - - - - -6 w eeks__________________________________________ - - - - - - - - - - - - 11
Maximum vacation available:1 week _ . . . . . . - - - - - - - - - - - - -2 w eeks___________________________________________ 1 5 2 - 20 3 7 6 2 1 2 1 -Over 2 and under 3 w eeks_________ _________ - - - - 2 - - - - - - - -3 w ee k s_______________________________________ . . . 32 21 5 16 26 10 5 39 29 13 5 4 2Over 3 and under 4 w eeks_____________________ - - - - 2 - - - - - - - -4 w eeks___________________________________________ 48 52 65 80 50 19 63 48 68 85 54 96 63Over 4 and under 5 weeks ____________________ 20 - - - - - - 5 - - - - -5 w eeks_____________________ ___________________ - 22 28 5 1 68 25 2 - 1 40 - 24Over 5 and under 6 w eeks__________________ _ - - - - - - - - - - - - -6 w eeks___________________________________________ 11
1 Periods of service were arbitrarily chosen and do not necessarily reflect the individual establishment provisions for progression. For example the changes in proportions indicated at 10 years of service may include changes in proportions occurring between 5 and 10 years.
NOTE: Because of rounding, sums of individual items may not equal 100.
Digitized for FRASER http://fraser.stlouisfed.org/ Federal Reserve Bank of St. Louis

No rtheast South
Boston Hartford Nassau—Suffolk Newark New
York Philadelphia Atlanta Baltimore Dallas Houston Louisville Memphis Miami NewOrleans Washington
100 100 100 100 100 100 100 100 100 100 100 100 100 100 100
100 100 100 100 100 100 100 100 100 100 100 100 100 100 100100 64 100 80 75 97 57 23 78 75 38 81 68 88 93
40 100 80 62 48 45 84 79 46 62 25 19 100 100 8438 64 80 57 37 40 40 17 40 31 25 6 68 88 77
77 100 56 100 82 77 48 72 69 97 66 94 62 79 994 12 36 61 25 46 6 50 17 76 15 36 13 36 284 12 36 59 25 46 2 11 13 48 6 36 5 29 28
77 97 27 83 63 57 41 40 56 85 53 53 58 49 99
6 3 . _ _ _ 6 _ _ _100 100 94 100 100 99 100 89 100 100 74 100 100 100 10042 86 53 60 83 46 57 63 37 51 3 50 68 73 85
100 100 94 100 90 99 100 95 100 100 74 100 100 100 10042 86 53 60 73 46 57 69 37 51 3 50 68 73 85
100 100 100 100 87 99 100 95 100 100 74 100 100 100 10042 86 66 60 56 46 57 69 37 51 3 50 68 73 85
100 100 100 100 100 96 100 100 100 98 100 100 100 100 8744 88 66 76 42 57 57 74 37 49 83 50 68 73 72
99 97 100 91 98 93 94 98 77 75 100 89 91 94 8790 97 93 90 98 93 94 98 74 70 86 87 91 94 8768 - 18 - 1 6 - 19 5 2 ~ _ “ “ "
Type of benefit and financing 1
A ll em ployees__________________________Em ployees in establishments providing:Life insurance______________________________
Noncontributory p lans__________________Accidental death and
dism em berm ent insurance______________Noncontributory plans__________________
Sickness and accident insuranceor sick leave or both1 2___________________
Sickness and accident insurance______Noncontributory p lan s______________
Sick leave (full pay, nowaiting period)_________________________
Sick leave (partial pay orwaiting period)_________________________
Hospitalization insurance__________________Noncontributory p lans__________________
Surgical insurance__________________________Noncontributory p lans__________________
M edical insurance__________________________Noncontributory p lan s__________________
M ajor m edical insurance__________________Noncontributory p lans__________________
Retirement plans:Retirem ent p en sio n ____________________
Noncontributory p lan s______________Retirement severance pay_____________
A ll em ployees-Em ployees in establishments providing:Life insurance_______________________________
Noncontributory p lans----------------------------Accidental death and
dism em berm ent insurance-----------------------Noncontributory p lans-----------------------------
Sickness and accident insuranceor sick leave or both2-------------------------------
Sickness and accident insurance_______Noncontributory p lan s-----------------------
Sick leave (full pay, nowaiting period)__________________________
Sick leave (partial pay orwaiting period)__________________________
Hospitalization insurance-----------------------------Noncontributory plans-----------------------------
Surgical insurance___________________________Noncontributory plans-----------------------------
M edical insurance___________________________Noncontributory plans-----------------------------
M ajor m edical insurance-----------------------------Noncontributory plans-----------------------------
Retirement plans:Retirement pension .
Noncontributory plans . . . Retirement severance pay..
North Central W est
Chicago Cincinnati Detroit Indianapolis K ansas City Milwaukee Minneapolis—
St. Paul St. Louis Denver Los A n geles- Long Beach Portland
SanF rancisco—
OaklandSeattle—Everett
100 100 100 100 100 100 100 100 100 100 100 100 100
99 100 100 100 95 97 100 98 100 100 100 100 10078 100 97 97 83 83 74 79 79 83 95 69 84
83 51 61 54 80 84 57 65 54 60 45 37 6462 51 58 52 63 77 31 62 51 46 40 31 19
71 87 97 100 67 92 37 74 88 99 99 100 10049 _ 9 71 28 8 17 29 10 32 80 33 3944 - 6 69 19 8 8 15 8 - 80 3 33
59 85 90 100 51 88 30 69 88 98 62 100 100
3 2 5 _ 3 4 . . _ 1 _ _ _
100 100 100 100 95 100 100 96 100 100 100 100 10036 60 94 71 43 100 7 76 51 38 82 9 13
100 100 100 100 95 100 100 96 100 100 100 100 10036 60 94 71 43 100 7 76 51 38 82 9 13
100 100 100 100 95 100 100 96 100 100 100 100 10036 60 94 71 43 100 7 76 51 38 82 9 13
100 100 93 100 91 100 100 90 90 100 100 100 10036 60 90 71 44 99 7 84 51 38 82 9 19
80 97 97 100 74 89 90 83 95 93 100 96 9878 97 81 80 70 84 85 78 93 88 87 96 9211 - 15 45 - 2 " 9 - 15 ~
1 Includes only those plans for which at least part of the cost is borne by the employer and excludes legally required plans, such as w orkers' compensation and social security; however, plans required by State tem porary disability laws are included if the employer contributes m ore than is legally required or the em ployees receive benefits in excess of the legal requirements. "Noncontributory plans" include only those plans financed entirely by the em ployer,
2 Unduplicated total of em ployees receiving sick leave or sickness and accident insurance shown separately.Digitized for FRASER http://fraser.stlouisfed.org/ Federal Reserve Bank of St. Louis

Appendix A. Scope and Method of Survey
Scope o f su rvey
The s u r v e y inc luded c o m m e r c ia l and stock savings banks a n d trust c om p a n ies engaged in the b u s in ess o f a ccep ting d ep os its f r o m the public and extending c r e d it by m ean s o f loans and in vestm en ts , and savings banks operating on a mutual b a s is , without capita l s tock (Industries 602 and 603, as defined in the 1967 edition o f the Standard Industria l C la ss i f ica t io n M anual, p re p a re d by the B ureau o f the Budget, now the O ff ice o f M anagement and Budget). Mutual saving banks are lo ca ted ch ie f ly in the N ortheast .
The estab l ish m en ts studied w e re se le cted f r o m banks em p loy in g 20 w o r k e r s or m o r e at the tim e o f r e fe r e n c e o f the data used in c o m piling the u n iv erse l is ts (unem ploym ent in s u r ance lis t ings p re p a re d by the va r iou s States).
T able A - l shows the num ber o f e s ta b l ish m en ts and w o r k e r s est im ated to be within the s cop e o f the su rvey , as w e l l as the num ber actually studied by the Bureau.
Method o f study
Data w e re obtained by p e rso n a l v is i ts o f the B u rea u 's f ie ld staff to a rep resen ta t ive sam ple o f e s tab l ish m en ts within the scope o f the su rvey . To obtain appropr ia te a c c u r a c y at m in im u m c o s t , a g re a te r p rop or t ion o f la rg e t h a n o f sm a l l estab lish m en ts w a s studied. In com bin in g t h e data, h ow ever , all e s tab l ishm ents w e re given the ir a p p ro priate weight. A l l e s t im a tes are p resen ted , t h e r e fo r e , as re lating to all e stab l ishm ents in the industry , excluding only those be low the m in im u m s ize at the tim e o f r e fe r e n c e o f the u n iverse data.
E m ploym ent
E st im ates o f t h e num ber o f w o r k e r s within s cop e o f the study are intended as a gen era l guide to the s ize and co m p o s i t io n o f the in d u stry 's la b or f o r c e rather than as p r e c is e m e a s u r e s o f em ploym ent .
Non s u p e r v is o r y o f f i c e e m p lo y e e s
The t e r m "n o n s u p e rv is o ry o f f i c e e m p lo y e e s , " as used in this bulletin , in c ludes n on su p e r v is o r y e m p lo y e e s such as t e l l e r s , g e n e r a l o f f ic e c le r k s , o f f i c e m ach ine o p e r a to r s , and s ten ograp h ers . W o rk e rs engaged in n on o f f ic e functions, such as m aintenance and cu stod ia l w ork , w ere exc luded .
O ccupations se le c te d fo r study
The occu pation a l c la s s i f i c a t io n was based on a u n iform set o f jo b d e sc r ip t io n s designed to take account o f in te res ta b l ish m en t and in te ra rea va r ia t ion s in duties within the sam e jo b . (See appendix B fo r these d e s c r ip t io n s . )
The c r i t e r ia fo r s e le c t ion o f the o c c u p a tions w e r e : The num ber o f w o r k e r s in theoccupation ; the u se fu ln ess o f the data in c o l le c t iv e bargain ing; and appropr ia te r e p r e s e n tation o f the entire job sca le in the industry . W o r k i n g s u p e r v is o r s , le a r n e r s , b eg in n ers , t ra in e e s , and handicapped, p a r t - t im e , t e m p o ra ry , and p rob a t ion a ry w o r k e r s w e re not re p o r te d in the data fo r se le c te d o ccu p a t ion s .Wage d a ta .
In form ation on w ages re la tes to stra ight- t im e w eek ly earn in gs , excluding p re m iu m pay fo r o v e r t im e and fo r w ork on w eekends, h o l idays , and late shifts . A v e r a g e w eek ly e a r n ings re late to s a la r ie s that are paid fo r standard w ork schedules and are rounded to the n ea res t half d o l la r . C o s t - o f - l i v i n g bonuses w ere included as part o f the w o r k e r 's regu lar pay, but paym ents such as C h r is tm a s o r y e a r - end bonuses w e re exc luded .
A ve r a g e (mean) w eek ly earn ings fo r each occupation w ere ca lcu la ted by weighting each rate (or w eek ly earn ings) by the num ber o f w o r k e r s r e ce iv in g t h e ra te , tota ling , and dividing by the num ber o f ind iv idua ls .Minimum entrance sa la r ie s
Tabulations re la te to fo r m a l ly es tab l ish ed p o l i c ie s f o r m in im u m w eek ly h ir ing s a la r ie s fo r in e x p er ien ced typ is ts and savings t e l l e r s o f the banks included in the B u rea u 's sam ple . F o r p u rp oses o f this study, in ex p e r ie n ce d w o r k e r s are defined as those who, at the t im e o f em ploym ent , e ither lack any p rev iou s e x p e r ie n ce , or lack e x p e r ie n ce that m a y be t r a n s fe ra b le to the jo b fo r which they are h ired .
| Method o f wage payment
Tabulations by m ethod o f wage payment re late to the n um ber o f w o r k e r s paid under the va r iou s t im e -r a t e s y s te m s . F o r m a l rate s tru ctu res fo r t im e -r a t e d w o r k e r s p rov ide single rates o r a range o f ra tes fo r individual jo b ca te g o r ie s . In the absen ce o f a fo r m a l rate s tru ctu re , pay ra tes are d eterm in ed p r i m a r i ly by the qua lif ica t ion s o f the indiv idual w o rk e r . A single rate stru ctu re is one in which the sam e rate is paid to a ll e x p e r ie n ce d w o r k e r s in the sam e jo b c la s s i f i c a t io n .
Digitized for FRASER http://fraser.stlouisfed.org/ Federal Reserve Bank of St. Louis

Table A-1. Estimated number of establishments and employees within scope of survey and number studied
in the banking industry, 28 areas, August—November 1973
Number of establishments 2 Employees in establishments
Area 1 Payroll Within scope of survey
Within scope of survey Actuallystudied
period Actuallystudied T o ta l3
Nonsupervisory office
employeesT o ta l3
Total, 28 areas------- ------------- --------- ----------------- 1, 724 527 477 ,14 6 367,654 377,436
Northeast
B osto n _______________________________________________ August 122 30 2 4 ,274 18,670 17, 649Hartford ________________ ___________ ____ _________ October 18 10 5 ,4 10 4, 361 4, 993Nassau—Suffolk_____________________________________ October 38 12 12, 129 9, 691 8 ,7 90Newark ______________________________________________ October 54 19 12,371 9, 874 8, 906New York ___________________________________________ October 108 31 115,405 92, 805 97 ,250Philadelphia................... ................. ..................................... October 52 21 25 ,194 19, 700 21 ,495
South
Atlanta-------------------- --------------------- ---------- ----------------- October 37 14 12,070 9, 831 10,710B altim ore___________________________________________ September 24 12 8 ,8 38 6, 783 8, 138Dallas ------------------------------------------------------------------------ September 85 23 8, 917 6, 330 6, 183Houston______________________________________________ October 109 28 10,269 7, 541 5 ,8 17L ou isville___________________________________________ September 16 9 4, 815 3,805 4,461Memphis_____________________________________________ November 11 8 5 ,2 28 3, 961 5, 054M iam i________________________________________________ October 69 21 7, 613 5, 685 3, 903New Orleans_________________________________________ November 24 11 5,041 4, 046 3, 524W ashington--------------- -------------- ------ ------------------------- September 51 20 11,350 8, 350 8, 346
North Central
Chicago______________________________________________ October 271 46 4 2 ,4 9 9 31,291 2 6 ,097Cincinnati___________________________________________ October 21 11 4, 986 3, 508 4, 522D etroit....................................... ............ ...................... ........... October 41 15 2 0 ,054 14,801 16,293Indianapolis................................................................. ........... October 27 11 6, 617 4, 788 5 ,8 54Kansas C ity ....................................... ...................... ............ September 90 32 7,480 5, 665 5 ,0 60Milwaukee................... .......................................... ..............— October 58 18 7, 718 5, 758 5 ,7 39Minneapolis—St. P a u l............................ ......................... October 94 25 9, 790 7,489 6, 558St. Louis.......................................... .......................... .............. September 115 31 10,946 8, 308 6, 134
West
Denver_______________________________________________ September 63 18 7, 854 6, 163 5, 049Los Angeles—Long Beach_________________________ October 52 16 43 ,682 32 ,830 37,534Portland_________________ _________ __________________ September 16 9 6, 958 5, 397 6 ,468San Francisco—Oakland----------------------------- -------- September 35 15 30 ,344 23 ,425 28 ,425Seattle—E verett.................................. ............... ............ . October 23 11 9,294 6, 798 8 ,4 84
1 For definition of areas, see tables 2 through 29.2 Includes only establishments with 20 employees or more at the time of reference of the universe data.3 Includes executive, professional, and other employees excluded from the nonsupervisory office employee category.
5 $3 - 6 7 5 1 5 9 54Digitized for FRASER http://fraser.stlouisfed.org/ Federal Reserve Bank of St. Louis

L e a rn e rs o r p robat ionary w o r k e r s m a y be paid a cco rd in g to rate schedules which start b e low the single rate and p e rm it the w o r k e r s to a ch ieve the fu ll job rate o v e r a p e r io d o f t im e . An e x p e r ie n ce d w o rk e r o c c a s io n a l ly m ay be paid above o r be low the single rate fo r sp e c ia l r e a so n s , but such paym ents are ex cep t ion s . R a n g e -o f - r a t e plans are those in which the m in im u m , m a x im u m , or both o f these rates paid e x p e r ie n ce d w o r k e r s fo r the sam e jo b are sp ec i f ied . S pecif ic rates o f individual w o r k e r s within the range m ay be determ in ed by m e r i t , length o f s e r v i c e , o r a com binat ion o f these .Scheduled w eek ly hours
Data on w eek ly hours r e fe r to the p r e dominant w ork schedule fo r fu l l - t im e non- su p e r v is o r y o f f ic e w o r k e r s em p loyed on the day shift.O vert im e p rem iu m pay
P r o v is io n s fo r o v e r t im e prem iu m pay w e re c o n s id e re d as applying to all n on su p er - v i s o r y o f f ic e w o r k e r s in an estab l ishm ent i f half o r m o r e o f such w o r k e r s w ere c o v e r e d . W eekly o v e r t im e r e f e r s to w ork in e x c e s s o f a sp ec i f ied num ber o f hours per w eek r e g a r d le s s o f the day on w hich it is p e r fo r m e d , the n um ber o f hours per day, o r num ber o f days w ork ed . Daily o v e r t im e r e f e r s to w ork in e x c e s s o f a sp e c i f ie d num ber o f hours a day, r e g a r d le s s o f the num ber o f hours w orked on a p rev iou s day of the pay p er iod .Supplem entary benefits
Supplem entary benefits in an e s ta b l is h m ent w ere c o n s id e re d app licab le to a ll o f f ic e w o r k e r s i f they applied to ha lf o r m o r e o f such w o r k e r s in an estab l ish m en t. S im ilar ly , i f fe w e r than half o f the w o r k e r s w ere c o v e re d , the benefit was c o n s id e r e d nonexistent in the es tab lishm ent. B eca u se o f le n g th -o f - s e r v i c e and other e l ig ib i l i ty re q u ire m e n ts , the prop ort ion o f w o r k e r s re ce iv in g the ben efits m a y be sm a l le r than est im ated .
Paid h o l id a y s . Paid holiday p r o v is io n s re la te to fu l l -d a y and h a lf -d ay holidays p r o v ided annually.
Paid v a c a t io n s . The su m m a r ies o f v a c a tion plans are l im ited to f o r m a l a r r a n g e m en ts , excluding in fo rm a l plans w h ereby tim e o f f with pay is granted at the d is c r e t io n o f the e m p lo y e r o r s u p e rv is o r . P aym ents not on a t im e b a s is w e re con v er ted ; fo r exam ple , a payment o f 2 percen t o f annual earn ings was c o n s id e r e d the equivalent o f 1 w e e k ’ s pay. The p er io d s o f s e r v i c e fo r which data are p resen ted re p re se n t the m o s t c o m m o n p r a c t i c e s , but they do not n e c e s s a r i l y r e f le c t individual estab l ishm ent p r o v is io n s fo r p r o g r e s s io n . F o r exa m p le , changes in p r o p o r tions ind icated at 10 y e a rs o f s e r v ic e m a y include changes which o c c u r r e d between 5 and 10 y e a r s .
Health, in su ra n ce , and re t irem en t p la n s . Data are p resen ted fo r health, in su ra n ce , pension , and re t irem en t sev era n ce plans fo r which the e m p lo y e r pays a ll o r part o f the c o s t , excluding p r o g r a m s req u ired by law, such as w o r k e r s ' com pen sation and s o c ia l se cu r ity . A m ong the plans inc luded are those underw ritten by a c o m m e r c ia l in su ran ce c o m pany and those paid d ir e c t ly by the e m p lo ye r f r o m his cu rren t operating funds o r f r o m a fund set aside fo r this p u rp ose .
Death benefits are included as a fo r m o f l i fe in su ra n ce . S ickness and acc ident in s u r ance is l im ited to that type o f in su ran ce under which p re d e te rm in e d cash paym ents are m ade d ire c t ly to the in su red on a w eek ly o r m onthly bas is during i l ln e s s o r a cc ident d isab i l ity . In form ation is p resen ted fo r a ll such plans to which the e m p lo y e r con tr ibutes at least part o f the c o s t . H ow ever , in New Y ork and New J e r s e y , w here t e m p o r a r y d isab i l ity in su ran ce laws req u ire e m p lo y e r con tr ibu t ion s , 1 plans are included only i f the e m p lo y e r (1) c o n t r i butes m o r e than is leg a l ly r e q u ired , o r (2) p ro v id e s the e m p lo y e e s with benefits which e x ce e d the re q u ire m e n ts o f the law.
Tabulations o f paid s ick leave plans are l im ited to fo r m a l plans which p rov id e full pay o r a p rop or t ion o f the w o r k e r 's pay during absen ce f r o m w ork beca u se o f i l ln e s s ; in f o r m a l a rran gem en ts have been om itted . Separate tabulations are p rov id ed fo r (1) plans which prov ia^ fu ll pay and no waiting p e r io d , and (2) plans prov id ing e ither p artia l pay o r a waiting p er iod .
M ed ica l in su ran ce r e f e r s to plans p r o viding fo r com p le te o r p artia l paym ent o f d o c t o r s ' f e e s . Such plans m a y be u n d er written by a c o m m e r c ia l in su ran ce com pan y o r a nonprofit o rgan iza t ion , o r they m a y be a fo r m o f s e l f - in s u r a n c e .
M a jor m e d i c a l in su ra n ce , s o m e t im e s r e f e r r e d to as extended m e d ic a l in su ra n ce , in c ludes the plans designed to c o v e r e m p lo y e es fo r s ick n ess o r i n j u r y involv ing an expense which e x ce e d s the n o rm a l c o v e r a g e o f hosp ita l iza tion , m e d ic a l , and su rg ica l p lans.
Tabulations o f re t i re m e n t pen s ion s are l im ited to plans which p rov id e regu lar p a y m ents fo r the rem a in d er o f the r e t i r e e 's li fe . Data are p resen ted separa te ly fo r r e t irem en t sev era n ce pay (one payment or s e v e ra l o v e r a sp ec i f ied p e r io d o f t im e) m ade to e m p lo y e e s on re t irem en t . E stab lishm ents p r o v i d i n g re t irem en t se v e ra n ce paym ents and pensions to em p lo y e e s w e re c o n s id e r e d as having both re t irem en t p ensions and re t i r e m e n t sev era n ce plans; h ow ev er , e s t a b l i s h m e n t s having optional plans prov id ing e m p lo y e e s a ch o ice o f e ither re t i re m e n t se v e ra n ce paym ents or pensions w e r e c o n s id e r e d as having only re t irem en t pension benefits .
1 Temporary disability insurance laws in California and Rhode Island do not require employer contributions.
Digitized for FRASER http://fraser.stlouisfed.org/ Federal Reserve Bank of St. Louis

Appendix B. Occupational Descriptions
The p r im a r y p u rpose o f p repar in g jo b d e scr ip t io n s fo r the B u r e a u ^ wage su rveys is to ass is t its f ie ld staff in c la ss i fy in g into appropriate occupations w o r k e r s who are em p loyed under a va r ie ty o f p a y ro l l t i t les and d ifferent w ork arrangem ents f r o m establishm ent to estab l ishm ent and f r o m a rea to area . This c la s s i f i c a t io n p e rm its the grouping of occupational wage rates represen tin g com p a ra b le job content. B eca u se o f this em ph asis on in terestab lishm ent and in te ra rea com p a ra b i l i ty of occupational content, the B u rea u 's jo b d escr ip t ion s m ay d if fe r s ign ificantly f r o m those in individual estab l ishm ents or those p r e p a re d fo r other p u rp o s e s . In applying th ese job d e sc r ip t io n s , the B u rea u 's f ie ld staff is in s tru cted to exc lude working s u p e r v is o r s , a p p rent ices , l e a r n e r s , b e g in n e rs , t r a in e e s , and handicapped, p a r t - t im e , t e m p o r a r y , and probat ionary w o r k e r s .
S E L E C T E D C L E R IC A L OCCUPATIONS
B ook k eep in g -m a ch in e op era tor
O perates a bookkeeping m ach ine (with or without a typ ew r ite r keyboard ) to keep a r e c o r d of b u s in ess tra n sa c t ion s .
C la ss A . K eeps a set of r e c o r d s r e quiring a knowledge of and ex p e r ie n ce in b a s ic bookkeeping p r in c ip le s and fam il ia r ity with the s tructure of the p a r t icu la r a c counting sy s te m used. D eterm in es p ro p e r r e c o r d s and d istribution o f debit and cred it item s to be used in each phase of the w ork . May p re p a re con so l ida ted r e p o r ts , ba lance sheets , and other r e c o r d s by hand.
C lass B . K eeps a r e c o r d o f one or m o r e phases or sect ion s of a set o f r e co rd s usually requ ir ing little knowledge of b a s ic bookkeep ing . P h a ses or sect ions include accounts payable , p a y ro l l , c u s t o m e r s ' accounts (not including a s im ple type o f b illing d e s c r ib e d under b i l l e r , m a ch in e ) , c o s t d istr ibution , expense d is tr ibution , inventory co n tro l , e tc . M a y check or a ss is t in p reparation o f tr ia l b a lan ces and p re p a re co n tro l sheets fo r the accounting departm ent.
C le rk , f i leF i l e s , c la s s i f i e s , and re tr ie v e s m a te r ia l
in an es tab l ish ed filing sys tem . May p e r f o r m c l e r i c a l and manual tasks req u ired to maintain f i le s . P o s it io n s are c la s s i f i e d into leve ls on the bas is o f the fo l low ing defin itions.
C lass A. C la s s i f ie s and indexes f i le m a te r ia l such as c o r r e s p o n d e n c e , r e p o r t s , te ch n ica l d ocum ents , e t c . , in an e s ta b l ish ed filing s y s t e m containing a n um ber o f v a r ie d sub ject m atter f i le s . May a lso fi le this m a ter ia l . May keep
r e c o r d s o f var iou s types in con junction with the f i le s . May lead a sm all group of lo w e r leve l fi le c le r k s .
C lass B . S or ts , c o d e s , and f i le s unc la s s i f i e d m a te r ia l by s im p le (sub ject m atter ) headings or partly c la s s i f i e d m a te r ia l by f in er subheadings. P r e p a r e s s im p le re la ted index and c r o s s - r e f e r e n c e aids. As requ ested , lo ca tes c le a r ly id en t i f ied m a ter ia l in f i l e s and fo rw a rd s m a te r ia l . May p e r f o r m re la ted c l e r i c a l tasks req u ired to maintain and s e r v i c e f i le s.
C lass C . P e r f o r m s routine fi l ing of m a te r ia l that has a lready been c la s s i f i e d or which is ea s i ly c la s s i f i e d in a s im p le s e r ia l c la s s i f i ca t io n sy s te m (e .g . , a lphab e t ica l , c h r o n o lo g ic a l , or n u m e r ica l ) . As req u ested , lo ca te s read ily available m a te r ia l in f i le s and fo rw a rd s m a te r ia l ; m ay f i l l out w ithdrawal ch a rg e . May p e r f o r m s im p le c l e r i c a l and manual tasks re q u ire d to maintain and s e r v i c e f i le s .
Keypunch op era torO perates a keypunch m ach ine to r e c o r d
or v e r i f y alphabetic a n d /o r n u m e r ic data on tabulating ca rd s or on tape.
P o s it io n s are c la s s i f i e d into le v e ls on the b a s is of the fo l low ing defin itions.
C la ss A . W ork re q u ire s the app lication o f ex p e r ie n ce and judgm ent in s e lect ing p r o c e d u r e s to be fo l lo w e d and in search in g fo r , in terpret in g , s e le c t in g , or cod ing item s to be keypunched f r o m a va r ie ty of s o u rce docum ents . On o c c a s io n m ay a lso p e r f o r m som e routine keypunch w ork . May tra in in ex p er ien ced keypunch o p e ra to rs .
Digitized for FRASER http://fraser.stlouisfed.org/ Federal Reserve Bank of St. Louis

C lass B . W ork is routine and re p e t it ive . Under c lo s e su p erv is ion or fo l l o w ing s p e c i f i c p r o c e d u r e s o r in s tru c t ion s , w ork s f r o m v a r iou s standard ized so u rce docum ents w hich have been co d ed , fo l low s s p e c i f ie d p r o c e d u r e s w h i c h have been p r e s c r ib e d in detail and req u ire little o r no se le c t in g , cod in g , o r in terpret in g o f data to be r e c o r d e d . R e fe r s to s u p e r v is o r p r o b le m s ar is ing f r o m e r ro n e o u s item s or c o d e s or m iss in g in form ation .
P r o o f -m a c h in e o p e ra to r
Under gen era l su p e rv is io n , o p e r a t e s a sort ing m ach ine to sort c h e ck s , deb its , c r e d i t s , and other ite m s . R e c o r d s totals o f s p e c i f i c i t em s in appropria te le d g e r s . M a chine o p e ra to r m ay a lso p re p a re ch eck s and d eposits fo r p r o c e s s in g by com p u ter (function fo r m e r ly done by cod ing c le r k s ) . May a lso p e r f o r m additional c l e r i c a l duties in c o n n e c tion with sort ing and cod ing .
S a fe -d e p o s i t c le r k
Rents s a fe -d e p o s i t b o x e s to bank c u s t o m e r s . Duties invo lve m o s t o f the fo l lo w in g : In terv iew ing c u s to m e r s to obtain n e c e s s a r y in form ation ; typing rental con tra c t and o b taining c u s t o m e r ’ s s ignature; c o l le c t in g rental fe e s and w riting re c e ip t s ; keeping s a fe -d e p o s i t r e c o r d s such as signature c a r d s , rental f i l e s , and a c c e s s s l ip s ; o rd er in g rep la cem en ts fo r lo s t keys and re p a ir s fo r s a fe -d e p o s i t box lo ck s . May a lso admit c u s to m e r s to bank v ault.
S e c re ta ry
A ss ig n ed as p e r s o n a l s e c r e t a r y , n o rm a lly to one individual. Maintains a c lo s e and highly r e s p o n s i v e r e l a t i o n s h i p to the d a y - t o - d a y w ork of the s u p e r v is o r . W o rk s fa ir ly in d e pendently r e ce iv in g a m in im u m of detailed su p erv is ion and guidance. P e r f o r m s v a r ie d c l e r i c a l and s e c r e t a r ia l duties , usually in cluding m o s t o f the fo l low ing:
a. R e c e iv e s te lephone c a l l s , p e r sonal c a l l e r s , and in com in g m a i l , answ ers routine in q u ir ie s , and routes the te ch n ica l inqu ir ies to the p r o p e r p e r s o n s ;
b. E s ta b l ish e s , m ainta ins , and r e v i s e s the s u p e r v i s o r ’ s f i le s ;
c . Maintains the s u p e r v i s o r ’ s c a l endar and m a k e s a p p o i n t m e n t s as instructed ;
d. R e lays m e s s a g e s f r o m s u p e rv i so r to subord inates ;
e. R ev iew s c o r r e s p o n d e n c e , m e m oranda, and r e p o r ts p re p a re d by o thers fo r the s u p e r v i s o r ’ s s ignature to assu re p ro c e d u r a l and typograph ic a c cu ra cy ;
f. P e r f o r m s s tenograph ic and typing w ork .
May a lso p e r f o r m other c l e r i c a l and s e c re ta r ia l tasks of c o m p a r a b l e nature and d ifficu lty . The w ork ty p ica l ly re q u ire s know ledge of o f f ic e routine and understanding of the organ iza tion , p r o g r a m s , and p r o c e d u r e s r e lated to the w ork of the s u p e rv is o r .
E xc lu s ion s
Not all p os it ion s that are t it led ’ ’ s e c r e ta r y ” p o s s e s s the above c h a r a c t e r i s t i c s . E xam p les of p os it ion s w h ich are exc lu ded f r o m the definition are as fo l lo w s :
a. P o s it io n s w hich do not m e e t the ’ ’p e r s o n a l ” s e c r e ta r y con cep t d e s c r ib e d above;
b. S tenographers not fu lly tra in ed in s e c r e t a r ia l type duties;
c . S tenographers serv in g as o f f ice ass istants to a group o f p r o fe s s io n a l , te ch n ica l , or m a n a g er ia l p e r s o n s ;
d. S e c re ta ry pos it ion s in which the duties are e ither substantia lly m o r e ro u tine o r substantia lly m o r e co m p le x and re sp o n s ib le than those c h a r a c te r iz e d in the definition ;
e. A ss is tan t type pos it ion s which in vo lve m o r e d ifficu lt o r m o r e re sp o n s ib le te ch n ica l , ad m in istra t ive , s u p e r v is o r y , or s p e c ia l iz e d c l e r i c a l d u t i e s w hich are not typ ica l o f s e c r e ta r ia l w ork .NOTE: The t e r m ’ ’ c o r p o r a te o f f i c e r , ”
used in the lev e l defin itions fo l low in g , r e f e r s to those o f f ic ia ls who have a s ign ificant c o m panywide p o l icym ak in g ro le with r e g a r d to m a jo r bank a c t i v i t i e s . The title ’ ’v ic e p r e s i d e n t , ” though n o rm a lly i n d i c a t i v e of this r o le , does not in all c a s e s identify such p os it ion s . V ic e p res id en ts w h o s e p r im a r y re sp o n s ib i l i ty is to act p e rs o n a l ly on in d iv id ual c a s e s or tra n sa ct ion s (e .g . , approve or deny indiv idual loan or c r e d it a ct ions ; adm inis t e r individual trust a ccou nts ; d ir e c t ly s u p e r v is e a c l e r i c a l staff) are not c o n s id e r e d to be ’ ’ c o rp o ra te o f f i c e r s ” fo r p u rp o se s o f applying the fo l low ing le v e l de f in it ion s .
C lass Aa. S e c re ta ry to the ch a irm an o f the
b o a rd o r p r e s i d e n t o f a bank that e m p lo y s , in all , ov e r 100 but fe w e r than 5, 000 p e r s o n s ; o r
b. S e c r e ta r y to a c o r p o r a te o f f i c e r (other than the cha irm an of the b o a rd or p res id en t) o f a ibank that em p loys ov e r 5 ,0 0 0 p e r s o n s .
C lass Ba. S e c r e ta r y to the cha irm an of the
b o a rd o r p res id en t of a bank that e m p lo y s , in a ll , f e w e r than 100 p e r s o n s ; or
b. S e c r e ta r y to a c o r p o r a te o f f i c e r (other than ch a irm an of the b o a r d or p res id en t ) o f a bank that e m p lo y s , in all, ov er 100 but fe w e r than 5, 000 p e r s o n s ; o r
Digitized for FRASER http://fraser.stlouisfed.org/ Federal Reserve Bank of St. Louis

c. S e c r e ta r y to the head ( im m e d i ately b e low the c o r p o r a te o f f i c e r le v e l ) o v er e ither a m a jo r com panyw ide fu n c tional activ ity (e .g . , m ark et in g , r e s e a r c h , op era t ion s , industria l re la t ion s , e tc . ) o r a m a jo r geog ra p h ic or o rgan izational s e g ment (e .g . , a reg ion a l headquarters ; a m a jo r d iv is ion ) o f a bank that em p loys , in a l l , o v e r 5 ,0 0 0 but fe w e r than 25 ,0 0 0 e m p lo y e e s .
Glass GS e c r e ta r y to an executive o r m a n a
g e r ia l p e rs o n w hose resp on s ib i l i ty is not equivalent to one of the s p e c i f i c le v e l situations in the definition fo r c la s s B , but w hose subordinate staff n o rm a lly n um bers at least s e v e ra l dozen e m p lo y e e s and is usually d iv ided into organ izationa l s e g m ents w hich are often, in turn, fu rther subdivided. In som e banks, this le v e l includes a wide range of organ izationa l e ch e lon s ; in o th ers , only one o r two.
Glass Da. S e c re ta ry to the s u p e rv is o r or
head o f a sm all organ izationa l unit (e .g . , fe w e r than about 25 o r 30 p e r s o n s ) ; or
b. S e c r e ta r y t o a n on s u p erv is o ry staff s p e c ia l is t , p r o fe s s io n a l e m p lo y e e , a d m i n i s t r a t i v e o f f i c e r , or assistant, sk il led tech n ic ian , or e x p e r t . (NOTE: Many banks assign s ten og ra p h ers , rather than s e c r e t a r i e s as d e s c r ib e d above , to this le v e l o f su p e rv is o ry or n o n s u p e rv i s o ry w o r k e r . )
Specia l c la s s i f i ca t io nS e c r e ta r ie s in p os it ion s with w ork
c h a r a c te r is t i c s as d e s c r ib e d , and within the range of defined le v e l s , should be r e p o r te d under this c la s s i f i ca t io n when the in form ation needed to c la s s i fy s e c r e t a r i e s a ccord in g to the le v e l definitions is not available .
S tenographerP r im a r y duty is to take dictation using
shorthand, and to t r a n s c r ib e the dictation . May a lso type f r o m written copy . May o p e r ate f r o m a s tenograph ic poo l . May o c c a s iona lly t r a n s c r ib e f r o m v o ic e r e co rd in g s .
NOTE: This jo b is d ist inguished f r o m that o f a s e c r e ta r y in that a s e c r e ta r y n o rm a lly w ork s in a con fidentia l re la t ionsh ip with only one m an ager or execu tive and p e r fo r m s m o r e r e sp o n s ib le and d is c re t io n a ry tasks as d e s c r ib e d in the s e c r e ta r y job definition.
S tenographer, gen era lDictation invo lves a n o rm a l routine v o
cabu lary . May maintain f i l e s , keep s im p le r e c o r d s , o r p e r f o r m other re la t ive ly routine c l e r i c a l tasks .
Stenographer, sen io rDictation in vo lves a v a r ie d te ch n ica l or
s p e c ia l iz e d v o ca b u la ry such as in lega l b r ie f s or rep orts on s c ie n t i f i c r e s e a r c h . May a lso set up and maintain f i l e s , keep r e c o r d s , e tc .
ORP e r f o r m s sten ograph ic duties requ ir ing
s ign ificantly g r e a te r independence and r e s p o n sib i l i ty than sten ograph er , g en era l , as e v i denced by the fo l low ing : W ork re q u ire s ahigh d eg ree o f s tenograph ic speed and a c c u ra cy ; a thorough w ork ing know ledge o f gen e r a l b u s in ess and o f f ice p r o c e d u r e and of the s p e c i f i c b u s in ess op era t ion s , o rgan ization , p o l i c ie s , p r o c e d u r e s , f i l e s , w ork f low , e t c . U ses this know ledge in p e r fo r m in g s ten o graph ic duties and re sp o n s ib le c l e r i c a l tasks such as maintaining fo l low up f i le s ; a ssem blin g m a t e r i a l f o r r e p o r t s , m e m o ra n d u m s , and le t te r s ; co m p o s in g s im p le le t te rs f r o m gen e r a l in stru ct ion s ; reading and routing in com in g m a i l ; answ ering routine q u est ion s , etc .
Sw itchboard o p e ra to r , c la s s AO p erates a s in g le - o r m u lt ip le -p o s it io n
te lephone sw itch board handling in com in g , outgoing, intraplant, o r o f f ic e ca l ls . P e r f o r m s full te lephone in form ation s e r v ic e o r handles c o m p le x c a l l s , such as c o n fe r e n c e , c o l l e c t , o v e r s e a s , o r s im ila r c a l l s , e ither in addition to doing routine w o rk as d e s c r ib e d fo r sw itch b o a r d o p e r a to r , c la s s B , o r as a fu l l - t im e ass ignm ent. ( ' ’F u l l " t e l e p h o n e in form ation s e r v i c e o c c u r s when the estab l ishm ent has v a r ie d functions that are not read ily u n d er standable f o r telephone in form ation p u r p o s e s , e .g . , b e ca u se o f over lapp ing o r in terre la ted fu n ct ion s , and consequently p resen t frequent p r o b le m s as to w hich extensions are a p p ro pr ia te f o r c a l l s . )
Sw itchboard o p e ra to r , c la s s BO perates a s in g le - o r m u lt ip le -p o s it io n
te lephone sw itch board handling in com in g , outgoing , intraplant, and o f f ice c a l ls . May handle routine lo n g -d is ta n ce ca l ls and r e c o r d to l ls . May p e r f o r m l im ite d telephone in form ation s e r v i c e . ( " L im it e d " t e l e p h o n e in form ation s e r v i c e o c c u r s i f the functions o f the e s tab lishm ent s e r v i c e d are read ily understandable fo r telephone in form ation p u rp o s e s , or i f the requ ests are routine , e .g . , g iving e x tension n um bers when s p e c i f ic nam es are furn ished , o r if c o m p le x ca l ls are r e f e r r e d to another o p e ra to r . )
T ypi st
U ses a ty p e w r ite r to m ake co p ie s o f v a r ious m a te r ia ls or to m ake out b i l ls a fter c a l cu lations have been m ade by another p e rso n . May include typing o f s te n c i ls , m a ts , or s i m i la r m a te r ia ls fo r use in duplicating p r o c e s s e s . May do c l e r i c a l w ork involving little
Digitized for FRASER http://fraser.stlouisfed.org/ Federal Reserve Bank of St. Louis

sp ec ia l tra in ing, such as keeping s im ple r e c o r d s , fi ling r e c o r d s and re p o r t s , o r sorting and d istributing incom ing m ail .
C lass A . P e r f o r m s one or m o r e of the fo l low in g ; Typing m a te r ia l in final f o r m when it in vo lves com bin ing m a te r ia l f r o m se v e ra l s o u r c e s ; o r re sp on s ib i l i ty f o r c o r r e c t spe ll ing , sy llab ica t ion , pu nctuation, e t c . , o f t e ch n ica l o r u n u s u a l w ord s or fo re ig n language m a te r ia l ; or planning layout and typing of co m p l ica te d
S E L E C T E D COM PC om puter o p era tor
M on itors and opera tes the con tro l co n so le o f a digital com p u ter to p r o c e s s data a c c o r d ing to operating in s tru ct ion s , usually p r e p a re d by a p r o g r a m m e r . W ork inc ludes m o s t of the fo l low in g : Studies in stru ction s to determ ineequipment setup and op era t ions ; loads equ ip ment with req u ired item s (tape r e e l s , c a r d s , e tc . ) ; sw itches n e c e s s a r y auxiliary equipment into c i r c u i t , and starts and opera tes com p u ter ; m akes adjustm ents to com p u ter to c o r r e c t operating p r o b le m s and m e e t sp ec ia l c o n dit ions; r ev iew s e r r o r s m ade during operation and d eterm in es cause or r e f e r s p r o b le m to s u p e r v is o r or p r o g r a m m e r ; and maintains operating r e c o r d s . May test and a ss is t in c o r r e c t in g p r o g r a m .
F o r wage study p u r p o s e s , com p u ter op e r a to r s are c la s s i f i e d as fo l low s :
C lass A . O perates independently , or under only gen era l d ire c t ion , a com pu ter running p r o g r a m s with m o s t of the fo l l o w ing c h a r a c te r is t i c s : New p r o g r a m s arefrequently te s ted and in trodu ced ; s c h e d uling req u irem en ts are of c r i t i c a l i m p ortan ce to m in im iz e downtim e; the p r o g ra m s are of c o m p le x design so that identification o f e r r o r s o u rce often r e qu ires a w ork ing knowledge o f the total p r o g r a m , and alternate p ro g r a m s m ay not be availab le . May g ive d irect ion and guidance to low er lev e l o p e ra to rs .
C lass B . O perates independently , or under only gen era l d ire c t io n , a com p u ter running p ro g r a m s with m o s t of the f o l l o w ing c h a r a c t e r i s t i c s : M ost of the p r o g ra m s are estab lished p roduction runs, ty p ica l ly run on a reg u la r ly r e cu rr in g b a s is ; th ere is little or no testing o f new p r o g r a m s req u ired ; alternate p ro g r a m s are p ro v id e d in ca se or ig in a l p r o g r a m needs m a jo r change or cannot be c o r r e c te d within a reason ab le t im e . In c o m m on e r r o r s ituations, d iagnoses cause and takes c o r r e c t i v e action. This usually invo lves applying p re v io u s ly p r o g r a m m e d c o r r e c t i v e s teps , or using standard c o r rect ion techniques .
ORO perates under d ire c t su p erv is ion a
com p u ter running p r o g r a m s o r segm ents
stat ist ica l tab les to maintain uniform ity and ba lance in spacing . May type ro u tine f o r m le t te r s , vary ing details to suit c i r c u m s ta n c e s .
Gla ss B . P e r f o r m s one or m o r e of the fo l lo w in g : Copy typing f r o m rough orc le a r d ra fts ; o r routine typing o f f o r m s , in su ran ce p o l i c i e s , e tc ; or s e t t i n g up s im p le standard tabulations; or copying m o r e co m p le x tab les a lready set up and sp a ced p r o p e r ly .
OCCUPATIONSof p r o g r a m s with the c h a r a c te r is t i c s d e s c r ib e d fo r c la s s A. May a ss is t a h igher le v e l op era tor by independently p e r f o r m ing le s s d if ficu lt tasks ass ign ed , and p e r fo rm in g difficu lt tasks fo l low ing deta iled in structions and with frequent rev iew of operations p e r fo r m e d .
C la ss C . W orks on routine p r o g r a m s under c lo s e su p erv is ion . Is ex p ec ted to develop w ork ing know ledge o f the c o m puter equipment used and ability to d e tect p r o b le m s in vo lved in running routine p r o g r a m s . Usually has r e c e iv e d som e fo r m a l training in com p u ter operation . May a ss is t h igher leve l op era tor on c o m p lex p r o g r a m s .
C om puter p r o g r a m m e r , b u s in ess
C onverts statem ents of b u s in ess p r o b le m s , ty p ica l ly p r e p a r e d by a sy s te m s analyst, into a sequence of deta iled in stru ction s w hich are req u ired to so lve the p r o b le m s by autom at ic data p r o c e s s in g equipm ent. W orking f r o m charts o r d ia g ra m s , the p r o g r a m m e r develops the p r e c i s e in s tru ct ion s w hich , when entered into the com p u ter sy s te m in cod ed language, cause the m anipulation o f data to achieve d e s ir e d resu lts . W ork in vo lves m os t of the fo l low in g : A pp lies know ledge o f c o m puter ca p a b i l i t ie s , m a th e m a tic s , lo g i c e m p loyed by co m p u te rs , and p a rt icu la r sub ject m atter in vo lved to analyze charts and d ia g ra m s of the p r o b le m to be p r o g r a m m e d ; d e ve lop s sequence o f p r o g r a m steps ; w r ite s d e ta i led f low charts to show o r d e r in which data w ill be p r o c e s s e d ; con v er ts these charts to coded in stru ct ion s f o r m ach ine to fo l low ; tests and c o r r e c t s p r o g r a m s ; p r e p a r e s in structions fo r operating p e rso n n e l during p rodu ction run; ana lyzes , r e v ie w s , and a lters p r o g r a m s to in c r e a s e operating e f f i c ie n c y or adapt to new req u irem en ts ; m aintains r e c o r d s of p r o g r a m developm ent and r e v is io n s . (NOTE: W o rk e rsp e r fo rm in g both sy s te m s analys is and p r o g ram m in g should be c la s s i f i e d as sys tem s analysts i f this is the sk il l used to determ ine th e ir p a y . )
D oes not include e m p lo y e e s p r im a r i ly re sp o n s ib le fo r the m anagem ent o r s u p e r v is ion of other e le c t r o n ic data p r o c e s s in g e m p lo y e e s , or p r o g r a m m e r s p r im a r i ly c o n c e r n e d with sc ie n t i f i c a n d /o r engineer ing p r o b le m s .
Digitized for FRASER http://fraser.stlouisfed.org/ Federal Reserve Bank of St. Louis

F o r wage study p u r p o s e s , p r o g r a m m e r s are c la s s i f i e d as fo l lo w s :
C lass A. W ork s independently , o r under only gen era l d ire c t io n , on com p le x p r o b le m s which requ ire c om p eten ce in all p hases o f p ro g ra m m in g c o n c e p t s and p r a c t i c e s . W orking f r o m d iagram s and charts which identify the nature of d e s ir e d re su lts , m a jo r p r o c e s s in g steps to be a c co m p l ish e d , and the re la t ionsh ips betw een var iou s steps of the p r o b le m solv ing routine, plans the full range o f p ro g ra m m in g actions needed to e f f ic ien t ly utilize the com p u ter sy s te m in achieving d e s ir e d end p rod u cts .
At this le v e l , p ro g ra m m in g is d i f f i cult b eca u se co m p u te r equipment m ust be orga n ized to p rod u ce se v e ra l in te rre la ted but d iv erse p rod u cts f r o m n um erous and d iv e rs e data e lem en ts . A wide v a r ie ty and extensive num ber o f internal p r o ce s s in g actions m ust o c c u r . T his r e qu ires such actions as deve lopm ent o f co m m o n operations which can be r e used , estab lishm ent o f linkage points b e tween op era t ion s , adjustm ents to d a t a when p r o g r a m req u irem en ts e x c e e d c o m puter storage ca p a c ity , and substantial manipulation and re sequencing o f data e lem ents to f o r m a highly in tegrated p r o g r a m .
May p rov id e functional d ire c t ion to low er le v e l p r o g r a m m e r s who are a s signed to ass is t .
C lass B . W ork s independently , or under only gen era l d ire c t io n , on re la t iv e ly s im p le p r o g r a m s , or on s im p le segm en ts o f c o m p le x p r o g r a m s . P r o g r a m s (or s e g m en ts ) usually p r o c e s s in form ation to p rod u ce data in two or three v a r ie d s e qu ences o r f o r m a ts . R eports and l ist ings are p rod u ced by re fin ing, adapting, a r ray ing , o r making m in o r additions to o r delet ions f r o m input data which are read ily available . W hile n um erous r e c o r d s m a y be p r o c e s s e d , the data have been re fined in p r io r actions so that the a c cu ra cy and sequencing of data can be te s ted by using a few routine ch e ck s . T y p ica l ly , the p r o g r a m deals with routine re co rd k e e p in g type o p era t ion s .
ORW ork s on co m p le x p r o g r a m s (as d e
s c r ib e d fo r c la s s A) under c lo s e d i rect ion o f a h igher le v e l p r o g r a m m e r or s u p e r v is o r . May a s s is t h igher le v e l p r o g r a m m e r by independently p e r f o r m i n g le s s d if ficu lt tasks ass ign ed , and p e r fo rm in g m o r e difficu lt tasks under fa ir ly c lo s e d irect ion .
May guide or instruct lo w e r le v e l p r o g r a m m e r s .
C lass C . M akes p r a c t i c a l a p p lica tions o f p ro g ra m m in g p r a c t i c e s and c o n cep ts usually lea rn ed in f o r m a l training
c o u r s e s . A ss ign m en ts are des ign ed to deve lop com p e te n ce in the application o f standard p r o c e d u r e s to routine p r o b le m s . R e c e iv e s c l o s e su perv is ion on new a s p ec ts o f a ss ign m en ts , and w ork is r e v iew ed to v e r i f y its a c c u r a c y and co n fo rm a n ce with req u ired p r o c e d u r e s .
C om puter sy s te m s analyst, bu s in ess
A nalyzes bu s in ess p r o b le m s to fo rm ula te p r o c e d u r e s f o r so lv ing th em by use of e l e c t r o n ic data p r o c e s s in g equipm ent. D eve lops a com p le te d e s c r i p t i o n o f all sp e c i f ica t io n s n eeded to enable p r o g r a m m e r s to p re p a re r e q u ire d digital co m p u te r p r o g r a m s . W ork in vo lves m o s t of the fo l lo w in g : A nalyzess u b je c t -m a tte r operations to be automated and identif ies conditions and c r i t e r ia r e q u ire d to ach ieve sa t is fa c to ry resu lts ; s p e c i f ie s num ber and types o f r e c o r d s , f i l e s , and docum ents to be used; outlines actions to be p e r fo r m e d by p e rso n n e l and co m p u te rs in su ff ic ient detail fo r presen ta t ion to m anagem ent and fo r p r o g ram m in g (typ ica lly this invo lves prepara t ion of w ork and data flow ch a rts ) ; c oo rd in a tes the deve lopm ent of test p r o b le m s and p art ic ip a tes in t r ia l runs of new and r e v is e d s y s te m s ; and re c o m m e n d s equipm ent changes to obtain m o r e e f fe c t iv e o v e ra l l opera tions . (NOTE: W o r k e r s p e r fo rm in g both sy s te m s analysis and p ro g ra m m in g should be c la s s i f i e d as s y s tem s analysts i f this is the sk il l u sed to de term in e th e ir pay .)
D oes not include e m p lo y e e s p r im a r i ly r e sp o n s ib le fo r the m anagem ent or s u p e r v i sion of other e le c t r o n ic data p r o c e s s in g e m p lo y e e s , o r sy s tem s analysts p r i m a r i l y c o n c e r n e d with s c i e n t i f i c o r engineer ing p r o b le m s .
F o r wage study p u r p o s e s , s y s te m s analysts are c la s s i f i e d as fo l low s :
C lass A . W ork s independently , or under only gen era l d ire c t ion , on co m p le x p r o b le m s involv ing all phases of sy s te m s ana lys is . P r o b le m s are c o m p le x b e ca u se o f d iv e rs e s o u r c e s o f input data and m u lt ip le -u s e r eq u irem en ts of output data. (F o r ex a m p le , d eve lops an in tegrated p r o duction scheduling , inventory c o n tr o l , c o s t a n a lys is , and sa les analysis r e c o r d in w h ich e v e r y i tem of each type is autom a t ica l ly p r o c e s s e d through the fu ll s y s t e m o f r e c o r d s and appropria te fo l low up actions are in itiated by the c o m p u te r . ) C on fers with p e r s o n s c o n c e r n e d to d e te rm in e the data p r o c e s s in g p r o b le m s and adv ises s u b je c t -m a tte r p e rso n n e l on the im p lica t ion s of new or r e v is e d s y s te m s of data p r o c e s s in g opera t ions . M akes r e com m en d a t ion s , if needed , fo r approva l o f m a jo r sy s te m s installations o r changes and fo r obtaining equipm ent.
May p ro v id e functional d ire c t ion to lo w e r l e v e l sy s te m s analysts who are a s s igned to ass is t .
Digitized for FRASER http://fraser.stlouisfed.org/ Federal Reserve Bank of St. Louis

C lass B t W orks independently , or under only g en era l d ire ct ion , on p r o b le m s that are re la t ive ly u ncom p lica ted to analyze , plan, p r o g r a m , and operate . P r o b le m s are of l im ited com p lex ity b e cause s o u r c e s of input data are h o m o geneous and the output data are c lo s e ly related. (F or exa m p le , deve lops sy s tem s fo r maintaining d ep os ito r accounts in a bank, maintaining accounts r e ce iv a b le in a retail es tab l ish m en t , or maintaining in ven tory accounts in a manufacturing or w h o lesa le estab l ish m en t.) C on fers with p e rs o n s c o n ce rn e d to determ ine the data p r o c e s s in g p ro b le m s and advises su b je c t - m atter person n e l on the im p lica t ion s of the data p r o c e s s in g sy s tem s to be applied.
ORW ork s on a segm ent of a com p le x
data p r o c e s s in g sch em e or sy s tem , as d e
s c r ib e d fo r c la s s A. W orks independently on r o u t i n e a s s i g n m e n t s and r e c e iv e s i n s t r u c t i o n and g u i d a n c e on co m p le x a s s i g n m e n t s . W ork is r e v iew ed fo r a c c u r a c y of judgm ent, c o m p liance w i t h in s tru ct ion s , a n d to in sure p r o p e r alignment with the o v era l l system .
C la ss C. W o r k s under im m ed ia te su p erv is ion , c a r ry in g o u t analysis as a ss ign ed , usually o f a single activity . A ss ign m en ts a r e des ign ed t o deve lop and expand p r a c t i c a l e x p e r i e n c e in the a p p l i c a t i o n of p r o c e d u r e s and sk il ls re q u ire d fo r s y s t e m s analysis w ork . F o r e x a m p le , m a y a s s i s t a h igher le v e l sy s te m s analyst by p e r - paring t h e deta iled sp ec i f ica t ion s r e qu ired by p r o g r a m m e r s f r o m in fo r m ation d eve loped by t h e h igher le v e l analyst.
S E L E C T E D T E L L E R OCCUPATIONST e l l e r , note
C o lle c ts exchange ch a rg es and paym ents on n otes , d ra fts , ren ts , and con tra c ts fo r deeds . May accept and g ive r e ce ip ts fo r co l la te ra l on m aturity notes . Is in charge of sending out n o t ice s of m aturity . R e c e iv e s renew al n otes . P r o te s t s item s when it is n e c e s s a r y . C auses notes to be p resen ted at other p la c e s , when p la ce of paym ent is other than the bank. F o l lo w s up on the value of co l la te ra l . In the ca se of rea l estate n otes , sees that m o rtga g e s are p r o p e r ly r e c o r d e d and ch ecks c e r t i f i c a t e s of tit le . Checks f ire insurance c o v e r a g e . Must be fa m il ia r with Negotiable Instrum ents Act and standard terms of extension agreem en ts . Included in this c la ss i f i ca t io n are t e l l e r s sp ec ia l iz in g in r e lated functions such as: Exchange t e l l e r s , d iscount t e l l e r s , and rea l estate t e l l e r s .
T e l l e r , c o m m e r c ia l and savingsC ashes c u s t o m e r s ’ p e rs o n a l o r other
ch eck s and r e c e i v e s deposits on check ing a n d /o r savings a c c o u n t s a n d /o r pays out w i t h d r a w a l s on savings accounts . Makes en tr ie s in c u s t o m e r s ’ account b o o k s or p ro v id e s re ce ip ts fo r depos its . W r ites up or signs deposit s lips to be u sed la ter in
balancing b ook s . May r e c o r d the daily t r a n s actions and ba lance a ccounts . M ay su p erv ise one or m o r e c le r k s who r e c o r d details of t ra n sa c t ion s , such as n a m e s , dates, s e r ia l n u m b ers , and amounts in vo lved so that p e r t i nent data m ay be d istr ibuted among the s e v e ra l departm ents fo r r e c o r d in g , f i l ing , and c lea r in g .
F o r wage study p u r p o s e s , t e l l e r s , c o m m e r c ia l and sav ings , are c la s s i f i e d on the b a s is of m a jo r duties, as fo l low s :
T e l l e r , c o m m e r c ia l - s a v in g sT e l l e r , c o m m e r c ia lT e l l e r , savings
T e l l e r , a l l - rou n dR e c e iv e s deposits and pays out w ith
drawals on savings a ccounts ; r e c e iv e s d e pos its and ca sh es ch ecks f o r check ing a c counts; and r e c e iv e s paym ents on n otes , e tc . May r e c o r d daily tra n sa ct ion s and ba lance accounts . May s u p erv ise one or m o r e c le rk s who r e c o r d details o f tra n sa c t io n s , such as n a m es , dates, s e r ia l n u m b e rs , and amounts involved so that pertinent data m ay be d is tr ibuted among the s e v e ra l departm ents fo r r e co rd in g , f i l ing , and c le a r in g . Includes c o m bination note and c o m m e r c ia l and savings t e l l e r s .
Digitized for FRASER http://fraser.stlouisfed.org/ Federal Reserve Bank of St. Louis

Industry Wage Studies
The m o s t r e ce n t re p o r ts p rov id in g o c c u pational w age data fo r industries included in the B u reau 's p r o g r a m o f industry wage su rveys s in ce I960 are l is ted be low . C opies are fo r sa le f r o m the Superintendent o f D o c um ents, U.S. G overnm ent P rin ting O ff ice , W ashington, D .C . 20402, o r f r o m any o f its
M anufacturing
B a s ic Iron and Steel, 1972.BLS Bulletin 183 9
Candy and Other C o n fe c t io n e ry P ro d u c ts ,1970. BLS Bulletin 1732
C igar M anufacturing, 1972.BLS Bulletin 1796
C igarette M anufacturing, 1971.BLS Bulletin 1748
F a b r ica te d Structural Steel, 1969.BLS Bulletin 1695
F e r t i l i z e r M anufacturing, 1971.BLS Bulletin 1763
F lo u r and Other Grain M il l P ro d u c ts , 1972.BLS Bulletin 1803
F lu id M ilk Industry, 1964.B LS Bulletin 1464 1
F o o tw ea r , 1971. BLS Bulletin 1792 H o s ie ry , 1970. BLS Bulletin 1743 Industrial C h e m ica ls , 1971.
BLS Bulletin 1768 Iron and Steel F ou n d r ies , 1967.
BLS Bulletin 1 6 2 6 1L eather Tanning and F in ish ing, 1973.
BLS Bulletin 1835 M ach in ery M anufacturing, 1973.
BLS Bulletin 1859 M eat P ro d u c ts , 1969.
BLS Bulletin 1677M e n ’ s and B o y s ' S e p a r a te T r o u s e r s , 1971 .
BLS Bulletin 1752 M en 's and B o y s ' Shirts
(E xcept W ork Shirts) and Nightwear, 1971. B LS Bulletin 1794
M en 's and B o y s ' Suits and C oats , 1973.BLS Bulletin 1843
M isce l la n eou s P la s t i c s P ro d u c ts , 1969.BLS Bulletin 1690
M<5>tor V e h ic le s and P a r ts , 1969.BLS Bulletin 1679
N on ferrou s F ou n d r ies , 1970.BLS Bulletin 172 6
Paints and V a rn ish es , 1970.BLS Bulletin 1739
P a p e rb o a rd C ontainers and B oxes , 1970.BLS Bulletin 1719
P e tr o le u m R efining, 1971. BLS Bulletin 1741 P r e s s e d o r Blown Glass and
G la s s w a r e , 1970 BLS Bulletin 1713
Pulp, P a p e r , and P a p e rb o a rd M il ls , 1972. BLS Bulletin 1844
Southern Sawm ills and Planing M il ls , 1969. BLS Bulletin 1694
reg iona l sa les o f f i c e s , and f r o m the reg ion a l o f f i c e s o f the B ureau o f L a b or Statistics shown on the inside back c o v e r . C opies that are out o f s tock are availab le fo r r e fe r e n c e p u rp o se s at leading p u b lic , c o l l e g e , o r u n iv e r sity l i b r a r ie s , o r at the B ureau 's Washington o r reg iona l o f f i c e s .
M anufacturing— Continued
Structural C lay P r o d u c t s , 1969.BLS Bulletin 1697
Synthetic F ib e r s , 1970. BLS Bulletin 1740 T ex t ile Dyeing and F in ish ing , 1970.
BLS Bulletin 1757 T e x t i le s , 1971. BLS Bulletin 1801 W est C oast Sawm illing , 1969.
BLS Bulletin 1704W om en 's and M is s e s ' Coats and Suits, 1970.
BLS Bulletin 1728W o m e n 's and M is s e s ' D r e s s e s , 1971.
BLS Bulletin 1783 1 Wood Household F urn iture ,
E xcept U pholstered , 1971.BLS Bulletin 1793
W ork Clothing, 1972. BLS Bulletin 1858
N onm anufacturing
A ppliance R ep a ir Shops, 1972.BLS Bulletin 1838
Auto D ea le r R epa ir Shops, 1969.BLS Bulletin 1689
Banking, 1969. BLS Bulletin 1703 Bituminous C oal Mining, 1967.
BLS Bulletin 1583C om m u n ica t ions , 1973. BLS Bulletin 1854 C ontract Cleaning S e r v ic e s , 1971.
BLS Bulletin 1778Crude P e t r o le u m and Natural Gas P rod u ct ion ,
1972. BLS Bulletin 1797 Educational Institutions:
Nonteaching E m p lo y e e s ,1968-69 . BLS Bulletin 1671
E le c t r i c and Gas U til i t ies , 1972.BLS Bulletin 1834
H osp ita ls , 1972. BLS Bulletin 182 9 Laundry and Cleaning S e r v ic e s , 1968.
BLS Bulletin 1 6 4 5 1L ife Insurance , 1971. B LS Bulletin 1791 Metal Mining, 1972. BLS Bulletin 1820 M otion P ic tu re T heaters , 1966.
BLS Bulletin 1 5 4 2 1N ursing H om es and Related F a c i l i t i e s ,
1967 -68 . BLS Bulletin 1638 Scheduled A ir l in e s , 1970. BLS Bulletin 1734 W ages and Tips in R estaurants and H ote ls ,
1970. BLS Bulletin 1712
Bulletin out of stock.
☆ U. S. GOVERNMENT PRINTING OFFICE : 1975 O - 583-675 (159)
Digitized for FRASER http://fraser.stlouisfed.org/ Federal Reserve Bank of St. Louis

BUREAU OF LABOR STATISTICS REGIONAL OFFICES
R e g i o n I1603 JFK Federal Building Government Center Boston. Mass. 02203 Phone: (617) 223-6761
R e g i o n IISuite 3400 1515 Broadway New York, N.Y. 10036 Phone: (212) 971-5405
R e g i o n I I IP.0. Box 13309 Philadelphia. Pa. 19101 Phone: (215) 597-1154
R e g i o n I V1371 Peachtree Street, N.E. Atlanta, Ga. 30309 Phone: (404) 526-5418
R e g i o n V9th FloorFederal Office Building 230 S. Dearborn Street Chicago , III. 60604 Phone: (312) 353-1880
R e g i o n V ISecond Floor555 Griffin Square Building Dallas. Tex. 75202 Phone: (214) 749-3516
R e g i o n s V I I a n d V I I I *911 Walnut Street Kansas Citv. Mo. 64106 Phone: (816) 374-2481
R e g i o n s I X a n d X * *450 Golden Gate Avenue Box 36017San Francisco, Calif. 94102 Phone: (415) 556-4678
* Regions VII and VIII are serviced by Kansas City ** Regions IX and X are serviced by San Francisco
Digitized for FRASER http://fraser.stlouisfed.org/ Federal Reserve Bank of St. Louis