bls_employnews_196603.pdf
TRANSCRIPT
NEWS from U.S. DEPARTMENT OF LABORW. Willard Wirtz, Secretary
USDL - 7145
FO R R E LE A SE : IM M ED IATET u esday , A p r il 5, 1966
U. S. D epartm ent of L a bor BLS, 961 - 2634
THE E M P L O Y M E N T SITUATION: M ARCH 1966
W id esp rea d jo b gains in M arch w e re r e fle c te d in an in c r e a s e o f 500, 000
in non farm p a y ro ll em p loym en t, the U. S. D epartm ent of Labor* s B ureau o f
L a b or S ta tistics re p o rte d today. The in cre a s e e x ce e d e d sea son a l exp ecta tion s
by 300, 000 and c a r r ie d the sea son a lly ad justed p a y ro ll em p loym en t fig u re to
an a llt im e high. At the sam e tim e , fa c to r y w ork ers* w eek ly and h ou rly
earn in gs edged up to r e c o r d le v e ls . U nem ploym ent show ed litt le change o v er
the m onth.
The unem ploym ent rate w as 3, 8 p e rce n t co m p a re d w ith 30 7 p e rce n t in February® The M arch rate w as in line w ith the steady dow ntrend o f 0 ,1 p ercen ta ge point per m onth w h ich began la st August® In the f i r s t qu a rter o f 1966, the rate a v era ged 3C8 p e rce n t, a sharp im p rov em en t o v e r the 4® 2 p e rce n t in the la s t qu arter o f 1 9 6 5 --the f i r s t tim e s in ce 1953 that a q u a rte r ly av era ge has fa lle n below 4 p e rce n t0 S ince M a rch 1965, unem ploym ent is dow n by 700, 000, total non farm p a y ro ll em p loym en t is up by 2® 9 m illio n , and fa c to r y w ork ers* a v era ge w eek ly earn in gs a re up $4® 50 to a r e c o r d $111, 22,
Industry E m p loym en t T ren d s
N onfarm p a y ro ll em p loym en t r o s e by 520, 000 to 61, 7 m illio n in March®The advance e x ce e d e d sea son a l exp ecta tion s by 3 0 0 ,0 0 0 and w as the la r g e s t fo r th is p e r io d s in ce 1950. The in c r e a s e w as b roa d ly b ased , w ith g r e a te r -th a n - sea son a l ga ins in con stru ctio n , m anufacturing, trad e , m is ce lla n e o u s s e r v ic e s , and gov ern m en t. (T hese data exclu d e the s e lf -e m p lo y e d , unpaid fa m ily w o r k e r s , and p rivate h ou seh old w o r k e r s , who are in cluded in the total em p loym en t figures® )
Digitized for FRASER http://fraser.stlouisfed.org/ Federal Reserve Bank of St. Louis

The E m ploym en t SituationPage 2A p r il 5, 1966
The m anufacturing in d u stries w ere highly s u c ce s s fu l at h iring add itional em p lo y e e s in M arch . The jo b in c re a s e fr o m F e b ru a ry --1 2 5 , 0 0 0 --w a s three tim es the ex p ected season a l r is e and c a r r ie d m anufacturing em p loym en t to an a lltim e high o f 18. 6 m illio n , up 1. 0 m illio n ov e r the y e a r . A lm o s t 80 p e rce n t of the advance o c c u r r e d am ong the durable g ood s in d u str ies , w h ere the fiv e m a jo r m eta ls and m e ta l-u s in g in d u stries show ed an in cre a s e of 650 ,0 0 0 fr o m M arch 1965c
In M arch, jo b strength w as p a r ticu la r ly evident in three in d u str ies w hich have been on a strong uptrend m o st o f the y e a r . Taken toge th er , tra n sp orta tion equipm ent, fa b r ica te d m e ta ls , and e le c t r ic a l equipm ent a ccou n ted fo r tw o -th ird s o f the F e b r u a r y -to -M a r c h im p rov em en t in m anufacturing. T h ese sam e in d u str ie s have added 520 ,000 jo b s s ince M arch 1965. O v e r -th e -m o n th d eve lop m en ts in the rem ain ing in d u str ies w ere g en era lly s ligh tly better than sea son a l, c o n tinuing the a c r o s s - th e -b o a r d uptrend w hich ch a ra c te r iz e d m anufacturing throughout 1965.
An im portan t fea tu re o f the re ce n t uptrend in m anufacturing em p loym en t has been the heavy con cen tra tion o f gains am ong p rod u ction w o r k e r s . At a le v e l o f 13o 8 m illio n in M arch , p rod u ction w o rk e r em p loym en t w as up n ea rly 800, 000 fr o m a y e a r e a r lie r and at the h ighest M arch le v e l s in ce 1953. A fte r season a l ad justm ent, p rod u ction w o rk e r em p loym en t w as at the h ighest le v e l fo r any m onth s in ce August 1953 and only 300, 000 jo b s short o f the peak attained during the K orean co n flic t .
W ith the retu rn of fa v ora b le w eath er, co n stru ction em p loym en t r o s e by 150, 000 to 3. 0 m il l io n - -a n in c r e a s e o f 200, 000 fr o m M arch 1965. The F e b ru a r y - to -M a rch in c r e a s e w as double the exp ected season a l r is e .
D esp ite the strong jo b ga ins in m anufacturing and co n stru ctio n , the m a jo r ity o f the 2. 9 m illio n new jo b s c re a te d sin ce M arch 1965 w e re in the s e rv ic e -p r o d u c in g in d u s tr ie s . State and lo c a l govern m en t and trade p rov id ed a total o f m o re than 1 m illio n new jo b s , w hile m isce lla n e o u s s e r v ic e s a ccou n ted fo r an additional 430, 000.
F a cto ry H ours and E arn in gs
The fa c to r y w ork w eek m oved up sea son a lly by 0. 2 hour to 41. 5 h ou rs in M a rch . Included in the av era ge w ork w eek w as 3. 9 hou rs o f o v e r t im e , the h ighest ov e rtim e fig u re fo r M a rch s in ce the s e r ie s began in 1956. In co m p a r is o n w ith M a rch 1965, the w ork w eek w as up 0 .3 h our. H ours continued at r e la t iv e ly high le v e ls in m o st in d u s tr ie s , w ith the lon g est w ork w eek s in m a ch in e ry and tran sp orta tion equ ipm ent.
F a c to r y w o r k e r s 1 av era ge h ou rly earn in gs edged up 1 cen t to $2 . 6 8 - -a n a lltim e high. W ith the in c r e a s e s in both the w ork w eek and a v era ge h ou rly ea rn in g s , w eek ly earn in gs r o s e n ea rly 1 d o lla r to a r e c o r d $111. 22 in M a rch .
Digitized for FRASER http://fraser.stlouisfed.org/ Federal Reserve Bank of St. Louis

The E m ploym en t SituationPage 3A p r il 5, 1966
The in cre a s e fr o m a y ea r ago am ounted to $4 . 50, o r 40 2 percento A p p rox im a te ly o n e -th ird o f the in c re a s e fro m M arch 1965 w as attributable to a lon g er w ork w eekand m o re o v e r t im e 0
U nem ploym ent
The unem ploym ent ra te , at 3. 8 p ercen t in M arch , w as v ir tu a lly unchanged fro m the 30 7 p ercen t in F e b ru a ry . The d eclin e o f 120, 000 in unem ploym ent ov er the m onth fe ll s ligh tly short of the usual season a l d rop . An apparent in c r e a s e in unem ploym ent am ong 14 to 17 y e a r -o ld youth o ffs e t a d eclin e la s t m onth; this is a sm a ll g rou p w here p r e c is e m ea su rem en t is d ifficu lt and m on th -to -m o n th changes m ay not be s ign ifican t.
U nem ploym ent ra tes fo r adult m en and m a r r ie d m en w e re unchanged o v e r the m onth at the v e r y low le v e ls o f 20 6 and 1, 9 p ercen t, r e s p e c t iv e ly . T h ese ra tes have rem ain ed at low le v e ls since D e ce m b e r but are dow n sh arp ly fr o m a yea r ago. The jo b le s s rate fo r w om en rem ain ed at its F e b ru a ry le v e l o f 3. 6 p e rce n t, fo llow in g a steady im p rov em en t s ince N ovem ber 1965.
The teenage unem ploym ent rate m oved up to 11. 7 p ercen t in M a rch , about equaling the January figu re but down sharp ly fr o m a y e a r ag o . W ith the ex ce p tio n o f F e b ru a ry , the teenage rate w as at its lo w e st le v e l s in ce late 1957..
The 30 0 m illio n u nem ployed in M arch in clu d ed 1. 4 m illio n adult m en , a ll but 125, 000 o f them seeking fu ll-t im e w ork . H ow ever, unem ploym ent am ong m en in M arch is s till c lo s e to a season a l peak and can be e x p ected to d rop sh arp ly in the next 2 m onths becau se of the pickup in ou tdoor w ork . T h ere w ere 900, 000 u nem ployed w om en in M arch , n early 20 p ercen t seeking p a r t -t im e jo b s . N early h a lf o f the 7 50 ,00 0 unem ployed teen a g ers w ere in s ch o o l and seeking on ly p a r t -t im e w ork .
D evelop m en ts in other im portan t la b o r fo r c e grou ps p a ra lle le d the o v e r -a l l pattern , showing little or no change ov er the m onth but strong im p r o v e m ent fr o m a y ea r ago. U nem ploym ent am ong nonw hites tota led o v er 600, 000 in M a rch , accounting fo r about o n e -fifth o f total unem ploym ent,. T h e ir jo b le s s ra te , at 70 2 p ercen t, w as down 1. 4 p ercen ta ge points fr o m M arch 1965.S im ila r ly , unem ploym ent ra tes fo r b lu e -c o l la r w o rk e rs and fo r fu ll-t im e w o r k e r s , at 4. 2 and 3. 4 p e rce n t r e s p e c t iv e ly , w ere down a fu ll p ercen ta ge point fr o m a y e a r e a r l ie r .
L o n g -te rm unem ploym ent am ounted to 750 ,0 0 0 in M a rch 1966, a red u ction o f 270 ,00 0 fro m a y e a r ago and the lo w e st le v e l fo r the m onth s in ce 1957.
State in su red unem ploym ent fe l l by 265, 000 to 1. 4 m illio n in M a rch . The red u ction w as p r im a r ily attributable to a pickup in co n s tru ctio n and oth er ou td oor w ork and to red u ced jo b le s s n e s s am ong ap p are l in d u stry w o r k e r s . A ll States
Digitized for FRASER http://fraser.stlouisfed.org/ Federal Reserve Bank of St. Louis

The Employment SituationPage 4April 5, 1966
re p o rte d d e c lin e s , w ith the la r g e s t o c cu rr in g in New Y o rk , P en n sy lvan ia , O hio, and C a lifo rn ia 0
T ota l E m p loym en t and L a b or F o r c e
O ver the m onth, tota l c iv ilia n em p loym en t advanced by 500, 000 to 72. 0 million*, At that le v e l, tota l em p loym en t w as up 1. 9 m illio n fr o m M arch 1965. N on agricu ltu ra l em p loym en t, at 68. 2 m illio n , w as up 2C1 m illio n , w hile the lo n g -te r m d eclin e in a g r icu ltu ra l em p loym en t continued, showing a d rop of 200, 000 ov e r the y e a r .
In addition to the strong jo b ga in s, there is ev id en ce that the N ation1 s e m p loy ed w o rk e rs a re being u tilized m o re fu lly . The num ber o f w o rk e rs on part tim e fo r e co n o m ic re a so n s d ropped by 340, 000 over the y e a r to 1. 6 m illio n in M a rch .
E m p loym en t ga ins fr o m a y ea r ago am ounted to 900, 000 fo r te e n a g e rs , 725, 000 fo r w om en , and 250, 000 fo r m en . T h ese in c r e a s e s e x ce e d e d the num ber added to the la b or fo r c e in each group , bringing com m en su ra te red u ction s in unem ploym ent. M o r e o v e r , the bulk of the em p loym en t gain o c c u r r e d am ong fu ll-t im e w o rk e r s , accounting fo r the sharp d rop in the fu ll -t im e unem ploym ent rate (from 4 .4 to 3. 4 p e r c e n t ) .
In the f ir s t qu arter o f 1966, the tota l la b o r fo r c e a v era g ed 7 7 .7 m illio n , an in c r e a s e o f 1, 450, 000 fr o m the com p a ra b le p e r io d in 1965. A lthough the A rm e d F o r c e s have been r is in g , the bulk of the in c r e a s e took p la ce in the c iv ilia n la b or f o r c e , w h ich r o s e by 1. 2 m illio n to 74. 8 m illio n .
# 5{c # sj*
M ore d eta iled a n a ly ses and s ta tis t ics w ill be p resen ted in E m ploym en t and E a rn in gs and M onthly R e p o rt on the L a bor F o r c e , w hich w ill b ecom e a va ilab le on A p r il 13, 1966.
This r e le a s e p resen ts and an a lyzes s ta tis t ic s fro m two m a jo r su rv ey s . Data on labor fo r c e , total em ploym ent^ and unem ploym ent are d er iv ed fro m the sam ple su rvey of h ouseholds conducted and tabulated by the B ureau of the C ensus fo r the Bureau o f L a bor S ta tistics . S tatistics on industry em ploym en t, h ou rs , and earn ings are c o lle c te d by State a g en cies fr o m p a yro ll r e c o r d s of e m p lo y e rs and are tabulated by the B ureau of L abor S ta tistics . A d e scr ip t io n o f the two su rveys appears in the B L S p u blication E m ploym en t and E a r n i n g s and M onthly R ep ort on the L a bor F o r c e .
Digitized for FRASER http://fraser.stlouisfed.org/ Federal Reserve Bank of St. Louis
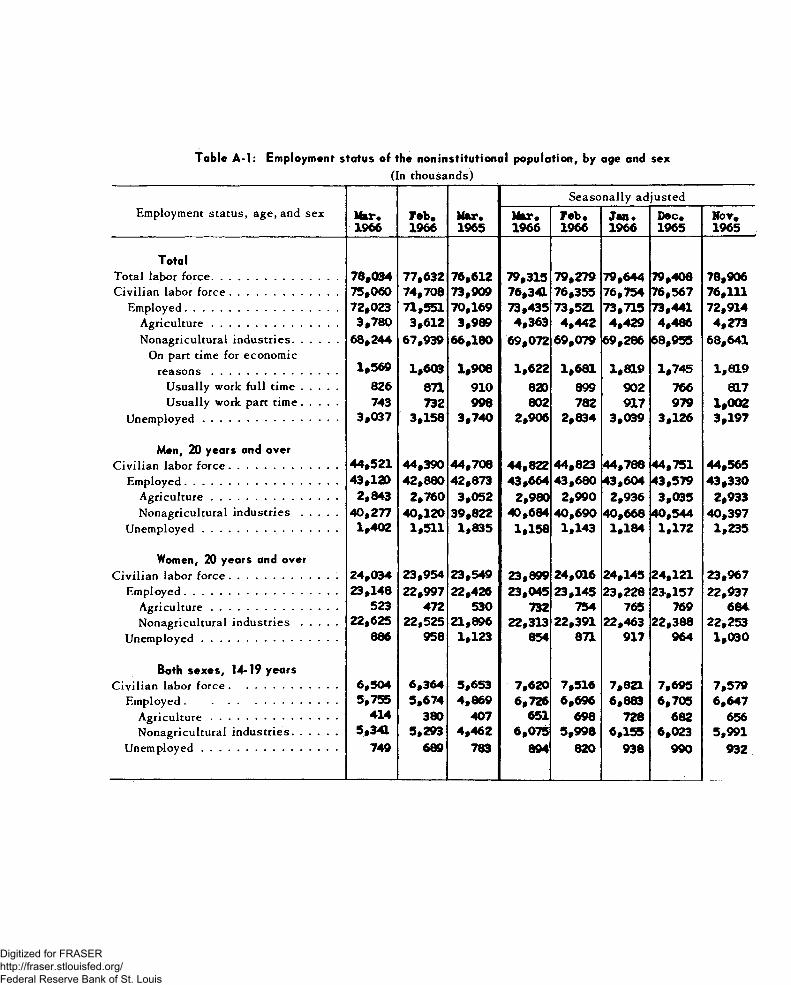
Table A - l : Employment status of the noninstitutional population, by age and sex(In thousands)
Employment status, age, and sex Mar.1966
feb.1966
Mur.1965
Seasonally adjustedMar.1966
F eb .1966
Jan .1966
Dec*1965
Not*1965
TotalTotal labor force...................................... 76,094 77,632 76,612 79,315 79,279 79,644 79,408 78,906Civilian labor force................................ 75*060 74,708 73,909 76,341 76,355 76,754 76,567 76,111
Employed.............................................. 72,023 71,551 70,169 73,435 73,521 73,715 73,441 72,914Agriculture...................................... 3 ,78 0 3 ,612 3 ,989 4 ,363 4 ,44 2 4 ,42 9 4 ,486 4 ,273Nonagricultural industries............. 68,244 67,939 66,180 69,072 69,079 69,286 68,955 68,641
On part time for economicrea son s ................ ............. .. 1 ,569 1 ,603 1 ,906 1 ,62 2 1 ,6 8 1 1 ,819 1 ,745 1 ,819
Usually work full tim e........... 826 871 910 820 899 902 766 817Usually work part time . . . . . 743 732 998 802 782 917 979 1 ,00 2
Unemployed............. .................. .. 3 ,037 3 ,158 3 ,7 4 0 2,906 2 ,834 3 ,039 3 ,126 3 ,197
Men, 20 years and overCivilian labor force . .............................. 44 ,521 44,390 44 ,708 44,822 44,823 44 ,788 44,751 44,565
Employed.............................................. 43,120 42 ,880 42,673 43 ,664 43 ,680 43,604 43,579 43 ,330Agriculture...................................... 2,843 2 ,760 3 ,052 2 ,980 2 ,990 2 ,936 3 ,095 2,933Nonagricultural industries........... 40,277 40,120 39,822 40,684 40 ,690 40 ,668 40,544 40,397
Unemployed........................................ 1 ,402 1 ,511 1 ,835 1 ,158 1,143 1 ,184 1 ,172 1 ,235
Women, 20 years and overCivilian labor force................................ 24,034 23,954 23,549 23,899 24,016 24,145 24,121 23,967
Employed . ■ . . . . , ................................ 23,148 22,997 22,426 23,045 23,145 23,228 23 ,157 22,937Agriculture..................................... 523 472 530 732 754 765 769 684.Nonagricultural industries........... 22,625 22,525 21,896 22,313 22,391 22,463 22,388 22,253
Unemployed.................................. .. . 886 958 1,123 854 871 917 964 1 ,0 9 0
Both sexes, 14-19 yearsCivilian labor force................... ............. 6 ,504 6 ,364 5 ,653 7 ,620 7 ,516 7,821 7 ,695 7 ,579
Employed . ..................... .. 5,755 5 ,674 4 ,869 6 ,726 6 ,696 6,883 6 ,705 6 ,64 7Agriculture . . ................................. 414 380 407 651 698 728 682 656Nonagricultural industries............. 5,341 5,293 4 ,4 6 2 6 ,07 5 5 ,9 9 8 6 ,155 6,023 5 ,991
Unemployed......................................... 749 689 783 894 820 938 990 932
Digitized for FRASER http://fraser.stlouisfed.org/ Federal Reserve Bank of St. Louis
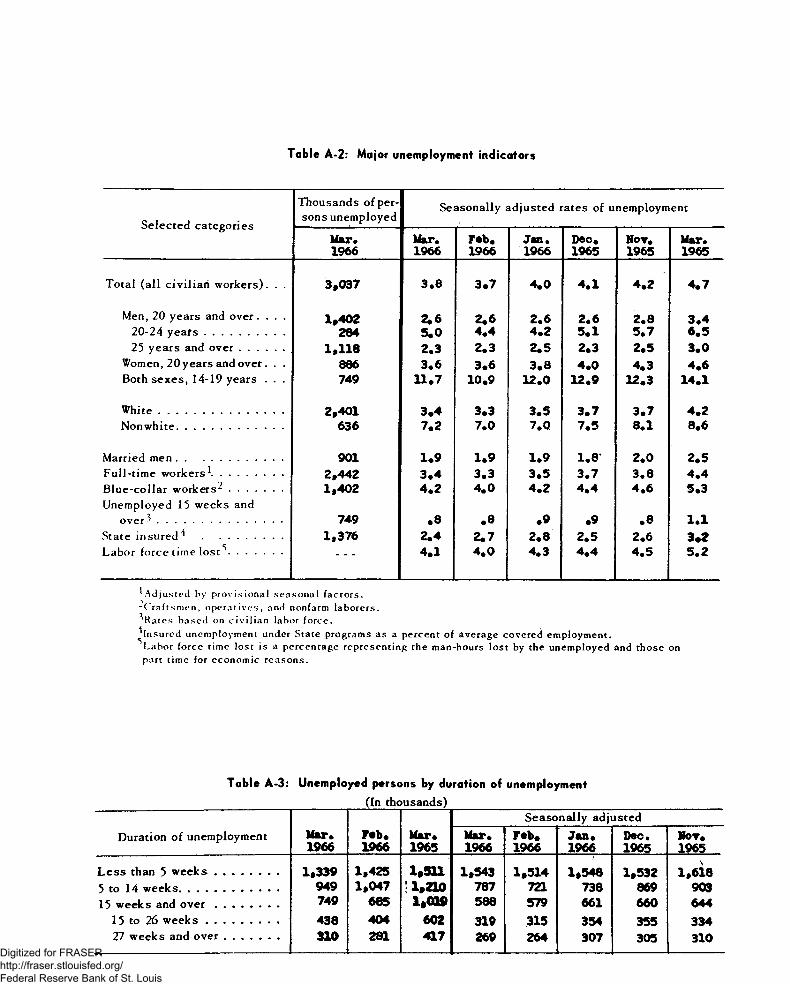
Table A-2: Major unemployment indicators
Selected categories
Thousands of persons unemployed
Seasonally adjusted rates of unemployment
Mar.1966
Mar.1966
F*b#1966
Jan.1966
Deo*1965
No t.1965
Mar.1965
Total (all civilian workers). . . 3,037 3.8 3.7 4.0 4.1 4.2 4.7
Men, 20 years and over. . . . 1,402 2.6 2.6 2.6 2.6 2.8 3.420-24 years........................ 284 5.0 4.4 4.2 5.1 5.7 6.525 years and over............. 1,118 2.3 2.3 2.5 2.3 2.5 3.0
Women, 20 years and over. . . 886 3.6 3.6 3.8 4.0 4.3 4.6Both sexes, 14-19 years . . . 749 11.7 10.9 12.0 12.9 12.3 14.1
White..................................... 2,401 3.4 3.3 3.5 3.7 3.7 4.2Nonwhite................................ 636 7.2 7.0 7.0 7.5 8.1 8.6
Married men................................ 901 1.9 1.9 1.9 1. 8* 2.0 2.5Full-time workers1..................... 2,442 3.4 3.3 3.5 3.7 3.8 4.4Blue-collar workers-................Unemployed 15 weeks and
1,402 4.2 4.0 4.2 4.4 4.6 5.3
over^ ..................................... 749 .8 •8 .9 •9 .8 1.1State insured7* ........................ 1,376 2.4 2.7 2.8 2.5 2.6 3*2Labor force time l o s t ................ " " “ 4.1 4.0 4.3 4.4 4.5 5.2
^Adjusted by provisional seasonal factors.-Craftsmen, operatives, and nonfarm laborers.^Ratcs based on civilian labor force.^Insured unemployment under State programs as a percent of average covered employment.
Labor force time lost is a percentage representing the man-hours lost by the unemployed and those on part time for economic reasons.
Table A-3: Unemployed persons by duration of unemployment_______________________ (In thousands)_______________________
Duration of unemployment Mar.1966
m .1966
Mar.1965
Seasonally adjustedMar.1966
r«b.1966
Jan.1966
Deo.1965
No t .1965
Less than 5 w eek s................... 1,339 1,425 1,511 1,543 1,514 1,548 1,532 1,63.85 to 14 weeks.............................. 949 1,047 ! 1,210 787 721 738 869 90315 weeks and o v e r ................... 749 685 M ao 588 579 661 660 644
15 to 26 w eek s...................... 438 404 602 319 315 354 355 33427 weeks and over................ 310 281 417 269 264 307 305 310
Digitized for FRASER http://fraser.stlouisfed.org/ Federal Reserve Bank of St. Louis

Table A-4: Unemployed persons by age and sex
Age and sex
Thousands of persons Seasonally adjusted unemployment rates
TotalLooking for full
time work
Looking for part- time work
Mar.1966
Feb.1966
Jan.1966
Deo.1965
Mar.1965
Total, 14 years and over........................ 3,037 2,442 595 3 .8 3.7 4 .0 4.1 4.7
14 to 17 years...................................... 390 135 256 13.1 11.7 12.7 14.7 13.814 and 15 years . . . . ................... 51 ( l ) ( l ) 6.7 7.8 8.7 32.4 6.316 and 17 y e a rs ........... .. 339 128 211 16.3 13.5 14.7 35.8 17.2
18 years and o v e r .............................. 2,647 2,306 341 3.3 3.3 3.5 3.5 4.318 and 19 y e a rs ........... ................. 359 264 95 10.4 10.3 11.2 11.6 14.220 to 24 years ................................. 477 431 47 5.2 5 .0 5 .4 5 .6 6.925 years and ov er ........................... 1,611 1,611 199 2.6 2.6 2.7 2.7 3.4
25 to 54 years........... .................. 1,390 1,254 134 2.6 2.6 2.7 2.8 3.455 years and o v e r ...................... 420 357 65 2.7 2.8 2.8 2.8 3.4
Males, 18 years and o v e r ...................... 1,995 1,474 120 2.9 2.9 2.9 3.0 3.8
18 and 19 years................................... 193 149 44 9.9 9.3 9 .7 9.9 12.620 to 24 years...................................... 284 256 28 5.0 4.4 4 .2 5.1 6.525 years and o v e r .............................. 1,118 1,069 48 2.3 2.3 2.5 2.3 3.0
25 to 54 years . . . . . . . . . . . . . 813 803 8 2.1 2.2 2.3 2.2 2.855 years and ov e r ........................... 306 266 40 2.9 3.0 3.0 2.7 3.5
Females, 18 years and over................... 1,052 832 221 4.1 4.1 4 .4 4 .7 5.3
18 and 19 years................................... 166 115 51 11.1 11.5 33.1 13.6 16.220 to 24 years...................................... 193 175 19 5.5 5.9 7.1 6.3 7.725 years and o v e r .............................. 693 542 151 3.3 3.2 3.3 3 .6 4.1
25 to 54 years ................................. 577 451 126 3.5 3.4 3.5 3.9 4 .655 years and ov er ........................... 114 91 25 2.5 2.4 2.4 2.9 3.2
’I TVirtually all are looking for part-time work.
Digitized for FRASER http://fraser.stlouisfed.org/ Federal Reserve Bank of St. Louis

Table A-5: Employed persons by age and sex
(In thousands)
Age and sex TotalVoluntarypart-timeemployed1
Seasonally adjustedMar.1966
m .1966
si Deo.1965
Hot.1965
Total, 14 years and o v e r ....................... 72,023 9 ,591 73,435 73,5ZL 73,715 73,441 72,914
14 to 17 years........................................ 2 ,711 2 ,374 3 ,382 3 ,39 7 3 ,546 3 ,406 3 ,40114 and 15 y e a r s ............................... 940 898 1 ,223 1 ,14 2 1 ,221 1 ,155 1 ,19816 and 17 y e a r s ............................... 1 ,771 1 ,476 2 ,159 2 ,255 2 ,325 2 ,251 2,203
18 years and o v e r ............................... 69 ,312 7 ,219 70,101 70,172 70,256 70,106 69,49318 and 19 y e a r s ................................ 3 ,04 4 1 ,00 9 3 ,392 3 ,347 3 ,424 3 ,370 3 ,22620 to 24 y e a r s .................................. 7 ,71 0 807 7 ,850 7 ,792 7 ,759 7,739 7 ,73825 years and o v e r ............................. 58,558 5 ,403 58,859 59,033 59,073 58,997 58,529
25 to 44 years................................ 30,050 2 ,249 30,244 30,392 30,397 30,410 30 ,11845 years and o v e r ....................... 28,508 3 ,154 28,615 28,641 28,676 28,587 28,411
Males, 18 years and o v e r ....................... 4 4 ,7 60 2 ,1 7 7 45 ,538 45,530 45,501 45,418145,110
18 and 19 years..................................... 1 ,640 629 1 ,874 1 ,850 1 ,897 1,839 | 1 .78020 to 24 years ........................................ 4 ,455 388 4 ,59 5 4 ,549 4 ,553 4 ,543 ' 4 ,56 925 vears and o v e r ............................... 38,665 1 ,160 39,069 39,131 39 ,051 39,036 36,761
25 to 44 v e a r s .................................. 20,339 225 20,576 20,633 2 0 .5 3 0 i 2 0 .546 20,44545 years and o v e r ............................. 18,326 935 18,493 18,498
-W ~ — - j18,521 '18 ,4 90 18,316
Females, 18 years and over.................... 24,552 5 ,042 24,563 24,642 24,755 24,688 24,383
18 and 19 years..................................... 1 ,404 380 1 ,518 1 ,497 1 ,527 1 ,531 1 ,44620 to 24 years....................... ................. 3 ,255 419 3 ,25 5 3 ,243 3 ,206 3 ,196 3,1692 ̂ years and o v e r ................................ 19,893 4 ,243 19 ,790 19,902 20,022 19,961 19,768
25 to 44 y e a r s .................................. 9 ,711 2 ,024 9 ,66 8 9 ,759 9 ,86 7 9 ,864 9 ,67345 years and o v e r ............................. 10,182 2 ,219 10,122 10,143 10,155 10,097 10,095
*■ Includes a proportionate number of persons with a job but not at work.
Digitized for FRASER http://fraser.stlouisfed.org/ Federal Reserve Bank of St. Louis

Table A-6: Unemployment rates by industry and occupation
Industry or occupation Mar*1966
Mar.1965
Mar.1964
Industry
T o ta l.................................... ...................... . ................ . . 4 .0 5 .1 5 .9Experienced wage and salary workers..................................... 3 .9 4 .9 5 .9
A gricu ltu re ............, ................................................... .. 9 .5 1 0 .6 1 4 .6Nonagricultural industries ...................................................... 3 .8 4 .8 5 .7
Mining, forestry, fisheries. .............................................. 4 .3 9 .5 9 .1C onstruction .............. .. ......................... .. ...................... .. 9 .9 1 3 .7 1 3 .6Manufacturing..................................... .. .............................. 3 .5 4 .2 5 .7
Durable goods ........................................ ...................... 3 .0 3 .8 5 .7Nondurable g o o d s ......................................................... 4 .0 4 .7 5 .8
Transportation and public utilities ................................ 2 .5 2 .9 4 .4Wholesale and retail trade................................................ 5 .0 5 .8 6 .9Finance, insurance, and real e s ta te ............................ 1 .7 2 .4 2 .9Service industries................. ............................................. 3 .0 4 .0 4 .1Public administration............ .. .......................................... 1 .4 2 .1 3 .1
Self-em ployed and unpaid family w orkers.............. .. .............. .7 1 .3 1 .5
Occupation
T o ta l.................... .. ....................................... ...................... 4 .0 5 .1 5 .9W hite-collar w orkers................. ................................................... 1 .9 2 .5 2 .8
Professional and technical ................................................. 1 .2 1 .4 1 .5Managers, officials, and proprietors .......................... 1 .1 1 .7 1 .8Clerical workers ...................................... ............................ 2 .6 3 .5 4.3Sales workers........................... ..................... ....................... 2 .7 3 .7 3.3
Blue-collar w orkers................................................................. 5 .1 6 .5 8 .0Craftsmen and foremen........... .. .................................. .. 3.7 5 .1 5 .7Operatives . ........................ .................................................. 5 .0 6 .2 7 .6Non farm laborers............. .......................................... .. 8 .9 1 0 .9 1 4 .8
Service workers................ .. .................................................. 4.7 5 .6 6.4Private household workers................................................... 2 .8 4 .4 4 .8
5 .2 5 .9 6.92 .8 3 .4 4 ,4
Farmers and farm managers . ................... .......................... .1 •6 •3Farm laborers and foremen................................................... 6 .6 7 .3 9.9
Digitized for FRASER http://fraser.stlouisfed.org/ Federal Reserve Bank of St. Louis

Table A-7: Fu ll- and part-time status of the civilian labor force(In thousands)
Full- and part-time employment status Mar.
1966Ta b .1966
Mar.1965
Mar.1964
Full Time
Civilian labor force. .......................... ................... 64,878 64,796 64,586 63,391Employed:
Full-time schedules1 ................................... 60,618 60,388 59,276 57,465Part time for econom ic re a so n s ............... 1,818 1,843 2,176 2,330
Unemployed, looking for full-time work. . . . 2,442 2,565 3,134 3,596Unemployment ra te ..................................... 3 .8 4 .0 4 .9 5 .7
Part Time
Civilian labor force................................................. 10,181 9,912 9,324 9,419Employed (voluntary part tim e)1 .............. 9,586 9 ,3 2 0 8,719 8,718
Unemployed, looking for part-time work . . . 595 592 605 701Unemployment ra te ................................................. 5 .8 6 .0 6 .5 7 .4
* Employed persons with a job but not at work are distributed proportionately among the full- and part-time employed categories.
Digitized for FRASER http://fraser.stlouisfed.org/ Federal Reserve Bank of St. Louis

Table B-l: Employees on nonagriculturol payrolls* by industry
(In thousands)
Industry hfcLT.1966
Feb.1966
J a n .1966
Melt.1965
Change from Seasonally adjusted
M r.1966
Feb.1966
J a n .1966
Changefrom
Feb.1966
Feb.1966
Mr.1965
TOTAL ........................................ 61,722 61,202 61,01+1 58,784 520 2,938 62,809 62,1+88 62,148 321
MINING................................................... 6lk 612 61? 615 2 -1 631 630 632 1
CONTRACT CONSTRUCTION_____ 3,ooi 2,8L8 2,974 2,820 153 181 3,**5 3,370 3,383 75
MANUFACTURING................................ 18,531+ 18,1+61 18,271+ 17,578 123 1,006 18,776 “18,693 18,522 83Production w orkers .................... 13,033 13,731 13,571 13,049 102 78* 1*,007 13,9** 13,801 63
D U R A B L E G O O D S .................................... 10,905 10,817 10,697 10,114 88 791 10,991 10,922 10,805 69Production u orkers .................... 8,101 8,031 7,929 7,481 70 620 8,179 8,131 8,027 *8
Ordnance and scce sso r ie s ............. 256.6 254*7 250.8 229.5 1.9 27.1 257 255 250 2Lumber and wood products............ 599*1 598.li 597.7 583.1 .7 16.0 631 631 633 0Furniture and fix tu res .................... ***.9 1+M+.3 1+1+2.0 421.4 .6 23.5 *1+9 **9 447 0Stone, clay, and glass products . . 615.9 608.1+ 611.7 599.8 7.5 16.1 61+0 63B 644 2Primacy metal industries................. 1,300.5 1,290.1+ 1,272.7 1,289.5 10.1 11.0 1,296 1,291 1,263 5
1,316.7 1,339.2 1,301.2 1,206.2 7.5 110.5 1,33* 1,326 1,314 8Machinery........................................... 1,313.3 1,799.7 1,778.7 1,689.6 13.6 123.7 1,800 1,800 1,783 0Electrical equipment....................... 1,327.5 1,818.0 1,796.2 1,612.7 9.5 21*.8 1,81+1 1,825 1,794 16Transportation equipment............... 1,895.3 1,871.1 1,81+0.1+ 1,703.5 2*.7 192.3 1,892 1,862 1,822 30Instruments and related products . U09.U 1.07.2 1+02.5 376.3 2.2 33.1 *11 *09 405 2Miscellaneous manufacturing. . . . 1+25.I 1.16.0 1+03.0 402.2 9.1 22.9 *1+0 1+36 430 1+
N O N D U R A B L E G O O D S .......................... 7,679 7,61* 7,577 7,464 35 215 7,785 7,771 7,717 1*Production w orkers .................... 5,732 5,700 5,61+2 5,568 32 161+ 5,828 5,813 5,774 15
Food and kindred produ cts............ 1,655.0 1,654.3 1,670.1 1,655.5 • 7 - 5 1,7*6 1,7*8 1,743 -2Tobacco manufactures.................... 75.9 79.0 81.6 77.8 -3.1 -1.9 8* 82 83 2Textile mill products....................... 939.5 933-2 927.0 907.2 6.3 32.3 9*5 9*2 939 3Apparel and related products. . . . 1,1+01.1 1,388.5 1,329.* 1,353.1 12.6 1+8.0 1,387 1,383 1,355 *Paper and allied products . . . . . . 651.3 648.9 61+7.6 625-7 2.1+ 25.6 658 658 654 0Printing and publishing................. 1,000.5 1,000.1 993.0 967.2 .1+ 33.3 1,003 1,005 998 -2Chemicals and allied products. . . 930.7 920.1 912.7 891.5 10.6 39.2 932 928 922 *Petroleum and related products . . 172.8 172.8 172.8 176.5 0 -3.7 175 176 177 -1Rubber and plastic products . . . . 1+87.9 483.6 I+8I+.3 453.8 *•3 3**1 *91 1+87 485 1+Leather and leather products. . . . 361+.2 363.0 358.1 355.4 1.2 8.8 36* 362 361 2
TRANSPORTATION AND PUBLICUTILITIES........................................... i+,oi+9 4,034 *,025 3,965 15 8* *,102 *,10* 4,090 -2
WHOLESALE AND RETAIL TRADE. 12,696 12,622 12,716 12,167 7* 529 13,010 12,9*7 12,909 63
W H O L E S A L E T R A D E ....................... 3,306 3,302 3,303 3,189 1+ 117 3,350 3,339 3,323 11R E T A I L T R A D E ................................... 9,390 9,320 9,*13 8,978 70 1+12 9,660 9,608 9,586 52
FINANCE, INSURANCE, ANDREAL ESTATE......................... 3,071 3,054 3,0*9 2,999 17 72 3,096 3,082 3,080 1*
serv ice and misccllancous. . 9,093 9,025 8,959 8,662 68 *31 9,231 9,200 9,142 31
GOVCRNMCNT.............................. 10,61* 10,546 10,1+27 9,978 68 636 10,518 10,*62 10,390 56
F E D E R A L ................................................ 2,**i 2,431 2,*06 2,326 10 U5 2, *58 2, *51 2*425 7S T A T S A N O L O C A L .......................... 8,173 8,115 8,021 7,652 58 521 8,060 8,011 7,965 *9NOTE: Data for 2 most recent mooch* sis preliminary.
Digitized for FRASER http://fraser.stlouisfed.org/ Federal Reserve Bank of St. Louis

Table B-2: Average weekly hours of production workers on manufacturing payrolls, by-industry
Industry Mar.1966
F eb .1966
J a n .1966
m r .1965
Change from Seasonallyr adjusted
Mur.1966
F eb .1966
Jan .1966
Change from . F eb . 1966
F eb .1966
Mur.1965
MANUFACTURING. ............................. i a . 5 1*1.3 1*1.2 1*1.2 0 .2 0 .3 1*1.6 1*1.6 4 1 .5 0Overtime homes............................. 3 .9 3 .8 3 .7 3 .5 .1 .1* 1*.2 1*.2 4 .0 0
DURABLE GOODS............................... 1*2. U 1*2.2 1*2.1 1*2.1 .2 •3 1*2.5 1*2.5 1*2.4 0Overtime homes............. ............... 4 .3 1+.2 l* .l 3 .8 M •5 l*.5 1*.6 l*.l* -0 .1
NONDURABLE GOODS....................... 1*0.2 1*0.1 39 .8 1*0.0 .1 .2 1*0.1* 1*0.5 1*0.2 - . 1Overtime homes............................. 3 .3 3 .3 3 .1 3 .0 0 .3 3 .5 3 .5 3 .4 0
Dmrmhle goodsOrdnance and accessonea. . . . 1*2.2 1*2.3 1*2.7 1*1.1* - . 1 .8 0 1*2.3 1*2.1* 4 2 .4 - . 1Lumber and wood product*.............. 1*0.6 1*0.3 1*0.9 1*0.5 • 3 .1 1*1.1 1*1.0 4 1 .5 .1Furniture and fixture*..................... 1*1.7 1*1.1 1*1.0 1*1.3 .6 .1* 1*2.2 1*1.6 1*1.7 • 6Stone, clay, and glass products . . 1*2.2 4 1 .5 1*1.6 1*1.2 .7 1 .0 1*2.9. 1*2.5 4 2 .7 .1*Primary a ra l industries................ 1*2.2 1*2.0 1*1.9 1*2.5 .2 - . 3 !*2.0 1*2.0 4 1 .9 0Fabricated metal products. ' . . . . 1+2.2 1*2.2 1*2.0 1*2.3 0 - . 1 1*2.5 1*2.6 4 2 .6 - . 1Machinery ............................. 1*1*. 3 1*1*.0 1*3.7 1*3.1* • 3 .9 l*l*.l M*.0 4 3 .9 .1Electrical equipment ..................... 1*1.5 * a .5 1*1.3 1*1.1 0 .1* 1*1.6 1*1.7 4 1 .5 - . 1Transportation equipment.............. ^ 3 .3 1*2.9 1*3.3 1*3.3 .1* 0 1*3.5 1*3.1* 4 3 .5 .1Instrument* and related products. . 1*2.3 1*2.3 1*2.0 1*1.2 0 1 .1 1*2.6 1*2.6 1*2.2 0Miscellaneous manufacturing . . . . 1*0.1* 1*0.2 39 .6 39 .9 .2 .5 1*0.3 1*0.3 1*0.0 0
Nomdmrehle goodsFood and kindred producM........... 1*0.6 1*0.8 1*0.7 1*0.5 - . 2 .1 1*1.2 1*1.6 1*1.2 -.1*.Tobacco manufactures................... 3-2.0 39 .3 38 .1 37 .2 -1 .3 .8 39 .1 1*1.1 39 .1 -2 .0Textile aull producM. . . . . . . . . 1*2.3 1*2.3 1*1.8 1*1.8 0 .5 1*2.1* 1*2.5 1*2.1* - . 1Apparel and related producM . . . . 36 .9 36 .6 35 .7 37 .0 .3 - . 1 36.5 36 .6 3 6 .3 - . 1Paper and allied producM . . . . . . 1*3.2 i* 3 .l 1*2.8 1*2.9 .1 • 3 1*3.1* 1*3.5 4 3 .2 - . 1Printing gad publishing ................ 3 2 .G 38 .5 38 .1 38 .7 •3 .1 38 .7 38 .7 38 .5 0Chemicals and allied products . . . 1*2.2 1*1.9 1*1.7 1*1.8 .3 .1* 1*2.3 1*2.2 4 2 .0 .1Petroleum and related producM. . . 1*1.6 1*1.6 1*1.8 1*1.5 0 .1 1*2.2 1*2.7 4 2 .0 - . 5Rubber and plastic producM........... 1*2.0 1*2.0 1*2.1 1*2.0 0 0 1*2.2 1*2.3 4 2 .4 - . 1Leather and leather producM . . . . __ 2 § -7 .___ 39 .2 38 .8 3 8 .2 - .5 ______ — J g r7 38 .9 38 .2 - . 2
NOTE: Dam for die 2 most receot months are preliminary.
Table B-3: Average hourly and weekly earnings of production workers on manufacturing payrolls, by industry
Industry
Average hourly earnings Average weekly earnings
M&r.19 66
Feb.1966
Ja n .1966
Mu-.' 1965
Change from Mar.1966
Feb.1966
Ja n .1966
th r .196$
Change fromFeb.1966
M ir .1965
Feb.1966
S r .196$
AANUPACTURING........................ $ 2 .6 8 $2.67 $2.67 $2.59 $0.01 $0.09 $111.22 $110.27 ♦no. 00 ♦106.71 $0.95 $4.51
0URABLS GOOOS......................... 2 .8 7 2.86 2.85 2.78 .01 ,09 121.69 120.69 U9.99 n7.0k 1.00 4.65Ordnance and accessories............. 3.15 3.15 3.17 3.10 0 .05 132.93 133.25 135-36 128.3k -3 2 4.59Lumber and wood products............. 2.19 2.18 2.17 2.12 .01 .07 88.91 87.85 88.75 85.86 1.06 3.05Furniture and fixtures................... 2.16 2.15 2.15 2.09 .01 .07 90.07 88.37 88.1$ 86.32 1.70 3.75Stone, clay, and giaae ptodacw . . 2.69 2.67 2.66 2.57 .02 .12 113.52 110.81 n o . 66 10$.88 2.71 7.64Primary amtal in Jus tries. ............. 3.26 3.21* 3.23 3.17 .02 .09 137.57 136.08 135.3k 13k.73 1.49 2.84Fabricated metal prodnem. . . . . . 2.83 2.82 2.81 2.73 .01 .10 119.43 119.00 n8.02 U $.k8 .43 3.95Machinery.................................... 3.05 3.01* 3*03 2.93 .01 .12 135.12 133.76 132.1*1 127.16 1.36 7.96Electrical equipment.................... 2.63 2.62 2.62 2.56 .01 .07 109.15 108.73 108.21 10$.22 .42 3.93Tinnspntcnrion equipment............. 3.30 3.29 3.29 3.19 .01 .11 142.89 141.14 11*2.1*6 138.13 1.75 4.76laatrumenM and feinted prodacM.. 2.67 2.66 2.66 2.60 .01 .07 112.94 112.52 i n .72 107.12 .42 5.82Miscellaneous manufacturing. . . . 2.20 2.21 2.20 2.13 -.01 .07 8 8 .8 8 88.84 87.12 8k.99 .04 3.89HONOURABLE GOODS................ 2.41 2.41 2.40 2.33 0 .08 96.88 96.64 95.52 93.20 .24 % 3.68
Fond nod kindled prodacM.. . . . . 2.51 2.49 2.48 2.43 .02 .08 101.91 101.59 100.9k 98. 1*2 • 32 3.49Tobacco manufactures.................. 2.20 2.23 2.16 2.13 -.03 .07 83.60 87.64 82.30 79.2k -4.04 4.36Textile arill prodacta............. 1.92 1.92 1-91 1.84 0 .08 81.22 81.22 79.8k 76.91 0 4.31Apparel and related prodneta . . . . 1.87 1.88 1.85 1.82 -.01 .09 69.OO 68.81 66.0$ 67.3k .19 1.66Paper and allied prodacM............. 2.71 2.70 2.69 2*j6l .01 .10 117.07 116.37 n $.13 111.97 .70 5.10Printing and publishing................ 3.12 3.11 3.09 3.03 •01 .09 121.06 119.74 117.73 U7.26 1.32 3.80Chemicals and allied paodbete . . . 2.92 2.93 2.93 2.84 -.01 .08 123.22 122.77 122.18 118.71 .45 4 * 5 1Petrakam and related prodneta.. . 3.36 3.37 3.37 3.23 -.01 .13 139.78 140.19 lkO.87 13k.05 -.41 5.73Rubber and plastic prodneta.......... 2.64 2.64 2.64 2.58 0 •06 110.88 110.88 m.Uk 108.36 0 2.52
1.93 1.91 1.91 1.87 .02 .06 74.69 74.87 7k .n 71.*3 -.1 8 3*26
NOTE: Dam for the 2 most recenc months are pselimianiy.
Digitized for FRASER http://fraser.stlouisfed.org/ Federal Reserve Bank of St. Louis