bls_employnews_197111.pdf
TRANSCRIPT

NEWS OFFICE OF INFORMATION, WASHINGTON, 0. C. 20210II. S. DEPARTMENT OF LABDR
USDL - 71-643Bureau of Labor StatisticsTelephones:(202) 961-2530, 961-2633, 961-2472
Transm iss ion Em bargo 9:30 A. M.Friday , D ecem ber 3, 1971
THE E M P L O Y M E N T S ITUATION : NO VEM BER 1971
Unemployment moved up in Novem ber but employment continued to
gain and reached 80 m ill ion fo r the f i r s t time, the U. S. Department of
L a b o r1 s Bureau of Labor Statistics reported todayG Tota l employment ha
r isen substantially since the summer, The unemployment rate was 6.0 p e r
cent in Novem ber, com pared with 50 8 percent in October. The o ve ra l l jo b
less rate has fluctuated c lose to the 6-percent m ark since last Novem ber.
Nonagricultural payro ll employment rose slightly in Novem ber, as
employment in most m ajor industry d ivisions edged up from their October
le ve ls .
Unemployment
The number of unemployed persons totaled 4. 8 m ill ion in Novem ber.
A fte r allowance for the usual seasonal changes, unemployment was up
210, 000 between October and Novem ber, with v irtua lly a ll of the increase
occurring among young adults. The bulk of the ove ra ll r is e in job lessness
stemmed from job loss (rather than from the entry or re -en try of jobseekers
into the labor fo r c e ) .
The o ve ra l l job less rate was 6. 0 percent in Novem ber, compared with
5. 8 percent in October and 6. 0 percent in September. Although unemploy
ment rates fo r a few m ajor labor fo rce groups changed over the month, the
job less situation fo r most w orkers was not significantly d ifferen t in N ovem
ber from the patterns that have genera lly preva iled during 1971.
Unemployment rates fo r a ll adult men (4. 4 percent) and teenagers
(17. 0 percent) showed little or no change from their October leve ls . The
adult m ale rate continued within the re la t iv e ly narrow 4. 2-4. 5 percent range
in evidence since the beginning of the year . The teenage job less rate stood
at the 17-percent m ark fo r the fourth consecutive month and has shown no
Digitized for FRASER http://fraser.stlouisfed.org/ Federal Reserve Bank of St. Louis

- 2 -
c lea r trend since ris ing sharply in late summer and ea r ly fa l l of 1970o F o r
m arr ied men, however, the job less rate (3.4 percent) was up significantly
over the month, fo llow ing a drop in October. Th e ir rate has also shown no
m arked change during the course of the year .
The unemployment rate fo r adult women rose from 5. 5 to 5C 8 percent
over the month but was little d ifferen t from the leve ls that have preva iled
throughout 1971. The O ctober- to -N ovem ber r is e p r im ar i ly re f lec ted
increased job lessness among 20-24 y e a r -o ld s 0
Table A. Highlights of the employment situation(Seasonally adjusted)
Selected categoriesN o v .
1971Oct. 1971
3rdQtr1971___
2ndQtr
__ 1Q71__
1stQtr
__ 1Q71__
4thQtr1 Q7f1__
(M illions o f persons)
C iv ilian labor f o r c e ..................................................... 85.2 84.8 84.2 83.7 83.6 83.4Tota l e m p lo ym e n t................................................. 80.0 79.8 79.2 78.7 78.6 78.6U n e m p lo y m e n t......................................................... 5.2 4.9 5.0 5.0 5.0 4.9
(Percent of labor force)
U nem ploym ent rates:A ll w orkers ................................ 6.0 5.8 6.0 6.0 5.9 5.9A d u lt m e n .................................. 4.4 4.3 4.5 4.4 4.3 4.3A d u lt w o m e n ............................................................ 5.8 5.5 5.7 5.8 5.7 5.5Teenagers .................................. 17.0 17.0 16.S 16.8 17.4 17.5White ............................................................................... 5.7 5.3 5.5 5.5 5.5 5.4Negro and other r a c e s ...................................... 9.3 10.7 10.1 9.9 9.5 9.2M arried m e n ................................................................ 3.4 3.0 3.2 3.2 3.2 3.2Fu ll-tim e w o r k e r s ................................................. 5.8 5.4 5.5 5.5 5.5 5.5State insured .............................. 4.2 4.5 4.2 4.2 3.8 4 .4
(Millions of persons)
N onfarm payroll e m p lo y m e n t ........................... 70.9 70.8 70.6 70.7 70.4 70.1Goods-producing industries ....................... 22.4 22.4 22.4 22.5 22.5 22.6Service-producing industries ....................... 48.5 48.5 48.3 48.1 47.9 47.5
(Hours o f w ork )
Average w eek ly hours:To ta l private n o n f a r m ...................................... 37.2 37.1 36.8 37.0 37.0 36.9M an ufactu ring ............................................................ 40.1 39.8 39.8 39.9 39.8 39.5M anufacturing overtim e .............................. 2.9 3 .0 2.9 2.9 2 .8 2.7
N o te : P a y ro l l e m p lo y m e n t an d h o u rs f ig u re s fo r la te s t 2 m o n th s are p r e l im in a r y . S o u rc e s : T a b le s A -1 , A - 3 , B -1 , B -2 .
Digitized for FRASER http://fraser.stlouisfed.org/ Federal Reserve Bank of St. Louis

- 3 -
The Novem ber increase in unemployment occurred a lm ost en tire ly
among fu ll- t im e w orkers , whose rate rose from 5. 4 percent in October to
5. 8 percent in November,, The job less rate for part-t im e w orkers was
essentia lly unchanged over the month.
White w orkers accounted for all of the Novem ber increase in job less -
nesso The ir unemployment rate, which had edged down between August and
October, rose from 5. 3 to 5. 7 percent in Novem ber, a return to the le ve ls
prevailing during much of 1971. The job less rate for N egroes , on the other
hand, dropped over the m on th -- from 10.7 percent to 9o 3 p e rcen t--a fte r
drifting upward since the beginning of the year*.
Among the m a jor industries, the job less rate for manufacturing w orkers
moved up in Novem ber fo llow ing a decline in October,, A t 60 8 percent, the
job less rate for fac to ry w orkers has shown litt le change thus fa r in 1971.
The unemployment rate fo r w orkers in wholesale and re ta il trade also rose
over the month, a fter inching downward since May. In contrast, the job less
rate fo r w orkers in construction dropped from 10o 3 to 8. 9 percent in
Novem ber; this rate had hovered around the 10-percent m ark in recent
months, fo llow ing a decline from even higher leve ls e a r l ie r in the y e a r c
With the exception of a small increase in the rate fo r w h ite -co lla r w orkers ,
unemployment rates fo r most m ajor occupational groups showed litt le change
over the month,,
For w orkers covered by State unemployment insurance program s, the
job less rate moved down from 40 5 to 4.2 percent in Novem ber (seasonally
adjusted). The decline returned the State insured rate to the August leve l,
a fter sm all increases in the intervening months.
The increase in job lessness in Novem ber resulted in a r is e in the
number of w orkers unemployed less than 5 weeks, which, in turn, was
partly responsib le fo r lowering the average duration of unemployment to
11.7 weeks, seasonally adjusted. Since May, the average duration of unem
ployment has fluctuated narrow ly around 12 weeks, some 3 weeks above yea r-
ago le ve ls .
The number of w orkers on part time for economic reasons (those who
want fu ll- t im e work but have been able to find only a part-t im e job or have
had their workweek reduced because of economic factors affecting their jobs )
Digitized for FRASER http://fraser.stlouisfed.org/ Federal Reserve Bank of St. Louis

rose from 2. 5 to 2. 6 m illion (seasonally adjusted) in November*, This ser ies
had hovered around the 2C 5-m illion m ark since last Decem ber, but the
Novem ber increase brought the number of such w orkers to a 10-year highQ
C iv il ian Labor F o rce and T o tal Employment
The Nation1 s c iv ilian labor fo rce rose by 390, 000 in Novem ber, sea
sonally adjusted, to an alltime high of 85e 2 m illion . The over-the-m onth
increase, confined la rge ly to adult women and teenagers, continued the
rapid expansion of the c iv il ian labor force in evidence since late summer,
Total employment has also r isen substantially since the summer. The
increase in recent months has been concentrated among adult women.
Vietnam Era Veterans
A fte r dropping substantially in October, unemployment among V ie t
nam Era veterans 20 to 29 years old returned to the le ve l that had prevailed
throughout the third quarter of 19710 A total o f 3 20, 000 war veterans w ere
unemployed in Novem ber, 50, 000 m ore than in October, while the number
employed held steady at 3. 6 m illion . (Data are not seasonally adjusted; see
table A - 7. ) Compared with Novem ber 1970, unemployment was little
changed, but employment increased by 500,000; the number of 20-29 yea r-
old Vietnam Era veterans in the population rose 590,000 over the year.
The unemployment rate for veterans rose from 70 0 to 8, 2 percent
over the month. The ve te rans1 rate in Novem ber exceeded the rate fo r non
veterans in this age group, as was the case in most months of 1971. For
nonveterans, both the leve l (570,000) and rate of unemployment (7.0 p e r
cent) in Novem ber w ere essentia lly unchanged from October.
Industry Employment Developments
Nonagricultural payro ll employment rose 80, 000, seasonally adjusted,
in Novem ber, fo llow ing a month of litt le change,. The Novem ber increase
brought the number of payro ll jobs to within 23 5, 000 of the a llt im e high set
in March 1970c Small over-the-m onth employment gains w ere posted in
both the goods- and serv ice-producing sectors.
Employment in manufacturing increased by 40, 000, seasonally
adjusted, between October and Novem ber. At 18.6 m illion , factory em p loy
ment was up by 135, 000 from the recent low reached this past August but
was stil l 1.7 m ill ion below the a llt im e high of July 1969o Half of the over-
the-month increase took place in the food processing industry, where
- 4 -
Digitized for FRASER http://fraser.stlouisfed.org/ Federal Reserve Bank of St. Louis

employment rose 20,000, fo llow ing a decline of s im ila r magnitude in the
previous month. There w ere no substantial employment changes in the
other manufacturing industries.
In contract construction, employment rose for the third month in ««
row, increasing by 10, 000 (seasonally adjusted) in Novem ber. A fte r
declining during the spring and summer, construction employment has
returned to the leve ls of late 1970, although remaining w e ll below the r e
cord highs reached in late 1969 and early 1970. Mining employment was
unchanged at its low October leve l, due to the continuation of the bituminous
coal strike (which was settled after the survey week).
Employment in the service-producing industries rose by 40,000 in
November, as increases in finance, insurance, and rea l estate (20, 000),
se rv ices (40,000), and State and loca l government (30,000) m ore than off-
set a decline in wholesale and re ta il trade (50, 000). Employment in trans
portation and in Federa l government remained virtually unchanged in
Novem ber.
Hours of Work
The average workweek for all rank-and-file workers on private non-
agricultural payrolls edged up 0.1 hour, seasonally adjusted, in Novem ber
to 37. 2 hours. This small r ise in seasonally adjusted hours resulted from
the shift of the Veterans Day holiday—which in previous years had usually
occurred during the Novem ber survey week—to the fourth Monday of
October. As a result of this change in the holiday schedule, the typical
decline in hours did not take place this year.
In manufacturing, the workweek moved up by 0. 3 hour in Novem ber
to 40.1 hours (seasonally adjusted), with gains being posted in most
industries. This increase also la rge ly resulted from the e ffect of the shift
in Veterans Day.
The la rges t over-the-month increase in hours occurred in contract
construction (1. 5 hours, seasonally adjusted) and may be attributable to
exceptionally good weather in the survey week as w e ll as to the e ffect o f
the Veterans Day shift. The workweek in transportation and public utilities,
trade, and serv ices a ll edged up 0.1 hour in Novem ber.
Facto ry overt im e hours edged down 0.1 hour in Novem ber to 2. 9
hours. The contraction in overt im e was centered in the nondurable goods
-5 -
Digitized for FRASER http://fraser.stlouisfed.org/ Federal Reserve Bank of St. Louis

- 6 -
industries. O vert im e hours in manufacturing have continued in the Z. 8 to
3. 0 hours range since the beginning of the year.
Earnings
A verage hourly earnings o f production and nonsupervisorv w orkers on
private nonagricultural payro lls w ere $ 3. 47 in Novem ber, a decline of
Z cents from October. Compared with a year ago, hourly earnings have
r isen 18 cents or 5. 5 percent.
As a result of the drop in hourly earnings, average weekly earnings
in Novem ber w ere down 74 cents over the month to $1Z8. 74. Gains in
weekly earnings in manufacturing and serv ices w ere m ore than o ffset by
declines in mining, contract construction, and finance, insurance, and rea l
estate. Compared with Novem ber 197 0, average weekly earnings w ere up by
$7. 67 or 6. 3 percent. During the latest 1Z month period fo r which the Con
sumer P r ic e Index is ava ilab le—October 1970 to October 1971—consumer
p r ices rose by 3. 8 percent.
This release presents and analyzes statistics from two major surveys. Data on labor force, total employment, and unemployment are derived from the sample survey of households conducted and tabulated by the Bureau of the Census for the Bureau of Labor Statistics. Statistics on payroll employment, hours, and earnings are collected by State agencies from payroll records of employers and are tabulated by the Bureau of Labor Statistics. A description of the two surveys appears in the BLS publication Em ploym ent and Earnings.
Digitized for FRASER http://fraser.stlouisfed.org/ Federal Reserve Bank of St. Louis

Ta b le A-1: Employment status of the noninstitutional population by sex a n d a g e
(In thousands)
Employment status, age, and sez Nov.1971
Oct.1971
Nov.1970
Seasonally adjustedNOV.1971
Oct.1971
Sept.1971
Aug.1971
J u ly1971
Total
Total labor force .................................. .. • • 87,715 87,352 86,386 87,868 87,500 87,347 87,087 86,626Civilian labor force .................................... 85,019 84,635 83,347 85,172 84,783 84,598 84,312 83,829
Employed................................................. 80,204 80,065 78,741 80,022 79,845 79,525 79,197 78,941Agriculture............................................. 3,262 3 ,470 3,226 3,393 3,369 3,356 3,415 3,367Nonagricultural industries....................... 76,942 76,595 75,515 76,629 76,476 76,169 75,782 75,574
On part time for economic reasons........... 2,311 2,246 2,353 2,616 2,507 2,260 2,469 2,450Usually work full time......................... 1,120 1,080 1,250 1,250 1,161 1,056 1,173 1,134Usually work part time ....................... 1,191 1,166 1,103 1,366 1,346 1,204 1,296 1,316
Unemployed............................................... 4,815 4 ,570 4,607 5,150 4,938 5,073 5,115 4,888
Men, 20 years and over
Civilian labor force...................................... 48,013 48,003 47,335 •48,238 48,176 48,194 48,074 47,956Employed................................................. 46,090 46,247 45,520 46,101 46,104 46,004 45,903 45,888Agriculture................................ ............ 2,440 2,531 2,418 2,495 2,474 2,426 2,472 2,458Nonagricultural industries ........................ 43,650 43,717 43,102 43,606 43,630 43,578 43,431 43,430
Unemployed............................................... 1,923 1,755 1,815 2,137 2,072 2,190 2,171 2,068
Women, 20 years and over
Civilian labor force ................. ............... 29,762 29,540 29,057 29,276 29,108 28,995 28,859 28,525Employed ................................................. 28,114 27,886 27,500 27,568 27,515 27,376 27,172 26,897Agriculture............................................. 529 595 523 525 521 551 543 516Nonagricultural industries....................... 27,584 27,291 26,977 27,043 26,994 26,825 26,629 26,381
Unemployed............................................... 1,648 1,654 1,557 1,708 1,593 1,619 1,687 1,628
Both sexes, 16-19 years
Civilian labor force...................................... 7,244 7,093 6,955 7,658 7,499 7,409 7,379 7,348Employed................................................. 6,000 5,932 5,720 6,353 6,226 6,145 6,122 6,156Agriculture........................................... 293 344 285 373 374 379 400 393Nonagricultural industries....................... 5,707 5,588 5,435 5,980 5,852 5,766 5,722 5,763
Unemployed............................................... 1,244 1,161 1,235 1,305 1,273 1,264 1,257 1,192
T a b le A -2 : Full- and part-tim e statu s of the c iv ilia n lab or force by se x a n d a g e
(Numbers in thousands)
Full- and part-time employment status, sez,
and ageNov.1971
Nov.1970
Seasonally adjusted
Nov.1971
Oct.1971
Sept.1971
Aug.1971
J u ly1971
Nov.1970
Full time
Total, 16 years and over:Civilian labor force.................................... 71,969 70,724 73,100 72,534 72,419 72,232 72,006 71,815
Employed............................................... 68,395 67,302 68,896 68,614 68,320 68,242 68,161 67,789Unemployed............................................. 3,575 3,422 4,204 3,920 4,099 3,990 3,845 4,026Unemployment rate.................................. 5 .0 4 .8 5 .8 5 .4 5.7 5 .5 5 .3 5 .6
Men, 20 years and over:Civilian labor force.................................... 45,606 44,951 45,939 45,750 45,790 45,697 45,738 45,268
Employed....................... ....................... 43,865 43,315 43,953 43,804 43,773 43,669 43,819 43,402Unemployed........................................... 1,740 1,635 1,986 1,946 2,017 2,028 1,919 1,866Unemployment rate .................................. 3 .8 3 .6 4 .3 4 .3 4 .4 4 .4 4 .2 4 .1
Women, 20 years and over:Civilian labor force.................................... 23,106 22,603 23,015 22,759 22,810 22,620 22,315 22,514
Employed............................................... 21,859 21,390 21,643 21,507 21,454 21,339 21,049 21,178Unemployed........................................... 1,247 1,214 1,372 1,252 1,356 1,281 1,266 1,336Unemployment rate . ................................ 5 .4 5 .4 6 .0 5 .5 5 .9 5 .7 5.7 5 .9
Part Hme
Total, 16 years and over:Civilian labor force......................... .......... 13,049 12,624 12,128 12,166 12,346 12,222 11,960 11,736
Employed............................................... 11,810 11,439 11,089 11,140 11,326 11,089 10,924 10,746Unemployed............................................. 1,240 1,185 1,039 1,026 1,020 1,133 1,036 990Unemployment rate................. ............. 9 .5 9 .4 8 .6 8 .4 8 .3 9 .3 8 .7 8 .4
NOTE: Persons on part-time schedules for economic reasons are included in the full-time employed category; unemployed persons are allocated by whether seeking full- or
Digitized for FRASER http://fraser.stlouisfed.org/ Federal Reserve Bank of St. Louis
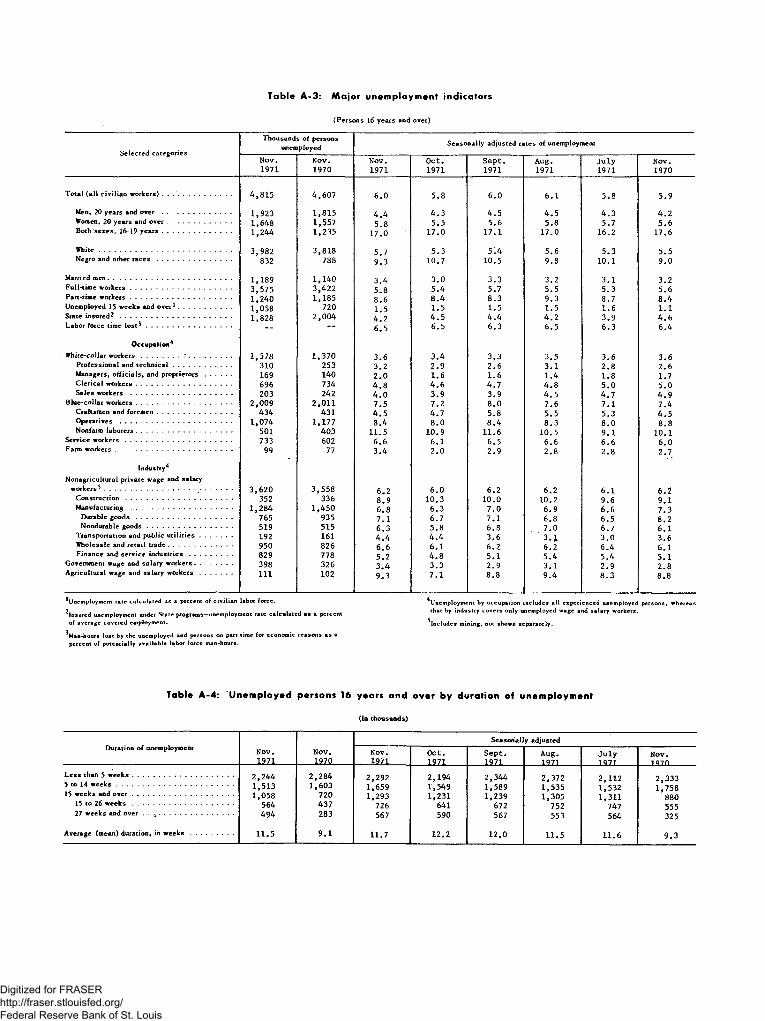
Table A-3: Major unemployment indicators
(Persons 16 years and over)
Selected categories
Thousands of persons unemployed
Seasonally adjusted rates of unemployment
Nov.1971
Nov.1970
Nov.1971
Oct.1971
Sept.1971
Aug.1971
Ju ly1971
Nov.1970
Total (a ll civilian workers) . . .......................... 4 ,815 4 ,607 6 .0 5 .8 6 .0 6 .1 5 .8 5 .9
Men, 20 years and o v e r .................................. 1 ,923 1 ,815 4 .4 4 .3 4 .5 4 .5 4 .3 4 .2Women, 20 years aind o v e r ............................... 1 ,648 1,557 5 .8 5 .5 5 .6 5 .8 5 .7 5 .6Both sexes, 16-19 years ................................. 1 ,244 1,235 17.0 17 .0 17 .1 17 .0 16.2 17.6
W hite................................................................ 3 ,982 3 ,818 5 .7 5 .3 5 .4 5 .6 5 .3 5 .5Negro and other r a c e s .......... ......................... 832 788 9 .3 10.7 10.5 9 .8 10.1 9 .0
Married men............................................................ 1 ,189 1,140 3 .4 3 .0 3 .3 3 .2 3 .1 3 .2Full-time workers................................................. 3 ,575 3,422 5 .8 5 .4 5 .7 5 .5 5 .3 5 .6Part-time workers................................................. 1 ,240 1,185 8 .6 8 .4 8 .3 9 .3 8 .7 8 .4Unemployed 15 weeks and over1.......................... 1 ,058 720 1 .5 1 .5 1 .5 1 .5 1 .6 1 .1State insured2 ...................................................... 1 ,828 2 ,004 4 .2 4 .5 4 .4 4 .2 3 .9 4 .6Labor force time lo s t^ ......................................... - - — 6 .5 6 .5 6 .3 6 .5 6 .3 6 .4
Occupation^
White-collar w orkers.................. ..................... 1 ,378 1 ,370 3 .6 3 .4 3 .3 3 .5 3 .6 3 .6Professional and techn ica l............................. 310 253 3 .2 2 .9 2 .6 3 .1 2 .8 2 .6Managers, officials, and proprietors............. 169 140 2 .0 1 .6 1 .6 1 .4 1 .8 1.7Clerical workers.............................................. 696 734 4 .8 4 .6 4 .7 4 .8 5 .0 5 .0Sales workers ................................................. 203 242 4 .0 3 .9 3 .9 4 .5 4 .7 4 .9
Blue-collar workers............................................... 2 ,009 2 ,011 7 .5 7 .2 8 .0 7 .6 7 .1 7 .4Craftsmen and foremen.................................... 434 431 4 .5 4 .7 5 .8 5 .5 5 .3 4 .5Operatives ...................................................... 1 ,074 1,177 8 .4 8 .0 8 .4 8 .3 8 .0 8 .8Nonfarm laborers.............................................. 501 403 11.5 10 .9 11.6 10 .5 9 .1 10.1
Service w orkers .................................................... 733 602 6 .6 6 .1 6 .5 6 .6 6 .6 6 .0Farm workers......................................................... 99 77 3 .4 2 .0 2 .9 2 .8 2 .8 2 .7
Industry'*
Nonagricultural private wage and salaryworkers 5 ............................................>................. 3 ,620 3 ,558 6 .2 6 .0 6 .2 6 .2 6 .1 6 .2
Construction.................................................... 352 336 8 .9 10.3 10 .0 10.2 9 .6 9 .1Manufacturing ................................................. 1 ,284 1 ,450 6 .8 6 .3 7 .0 6 .9 6 .6 7 .3
Durable g o o d s ............................................... 765 935 7 .1 6 .7 7 .1 6 .8 6 .5 8 .2Nondurable g o o d s ......................................... 519 515 6 .3 5 .8 6 .8 7 .0 6 .7 6 .1
Transportation and public u til it ie s ................ 192 161 4 .4 4 .4 3 .6 3 . . i 3 .0 3 .6Wholesale and retail trade............................... 950 826 6 .6 6 .1 6 .2 6 .2 6 .4 6 .1Finance and service industries..................... 829 778 5 .2 4 .8 5 .1 5 .4 5 .4 5 .1
Government wage and salary workers.................. 398 326 3 .4 3 .3 2 .9 3 .1 2 .9 2 .8Agricultural wage and salary w orkers ................ 111 102 9 .3 7 .1 8 .8 9 .4 8 .3 8 .8
^Unemployment rate calculated as a percent of civilian labor force.
^Insured unemployment under State programs—unemployment rate calculated as a percent of average covered employment.
4Unemployment by occupation includes all experienced unemployed persons, whereas that by industry covers only unemployed wage and salary workers.
^Includes mining, not shown separately.
^Man-hours lost by the unemployed and persons on part time for economic reasons as a percent of potentially available labor force man-hours.
Table A -4 : 'U nem ployed p ersons 16 years and over by duration of unem ploym ent
(In thousands)
Duration of unemployment Nov.1971
Nov.1970
Seasonally adjusted
Nov.1971
Oct.1971
Sept.1971
Aug. 1 971
Ju ly 1 Q71
Nov. 1 Q70
Less than 5 w eeks................................................. 2 ,244 2 ,284 2,292 2 ,194 2 ,344 2,372 2 ,112 2 ,3335 to 14 w eek s ......................................................... 1 ,513 1 ,603 1,659 1,549 1,589 1,535 1,532 1,75815 weeks and o v e r .................. .............................. 1 ,058 720 1,293 1,231 1,239 1,305 1,311 880
15 to 26 w e e k s ................................................. 564 437 726 641 672 752 747 55527 weeks and over . . ................ ................ 494 283 567 590 567 553 564 325
Average (mean) duration, in w e e k s ..................... 11 .5 9 .1 11.7 12.2 12 .0 11.5 11 .6 9 .3
Digitized for FRASER http://fraser.stlouisfed.org/ Federal Reserve Bank of St. Louis
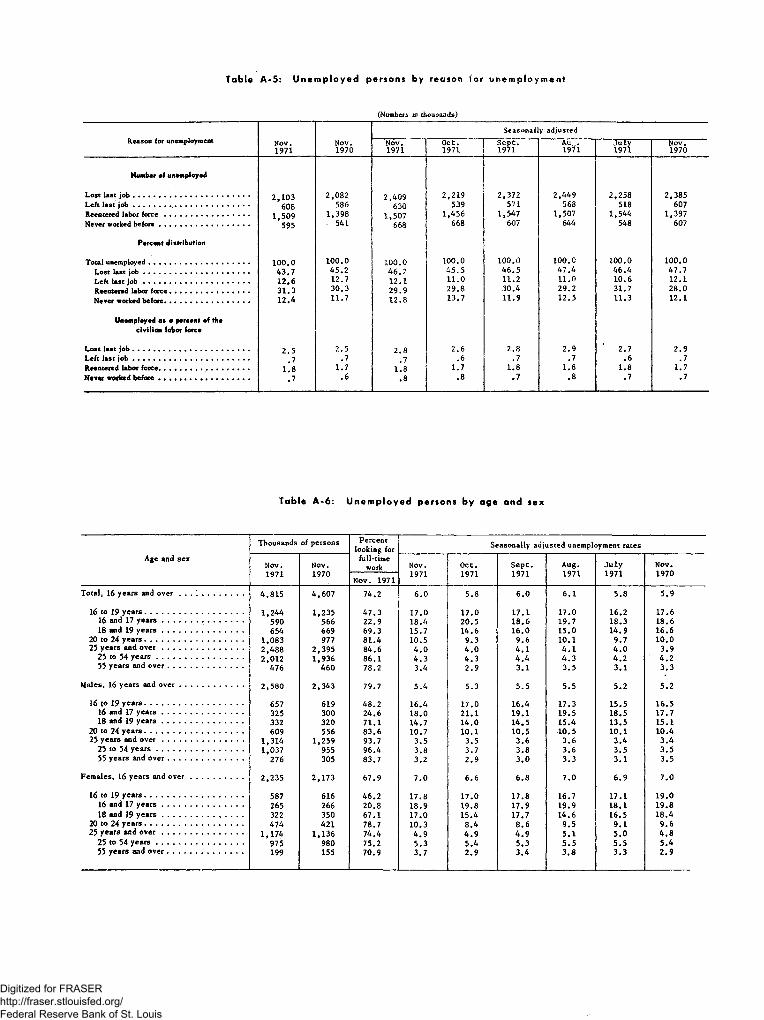
Table A-5: U n e m p lo y e d persons by reason lor u nem ploym ent
(Numbers in thousands)
Reason for unemployment Nov.1971
Nov.1970
Seasonally adjusted
Nov.1971
O ct.1971
Sept.1971
Auw.1971
J u ly1971
Nov.1970
Number of unemployed
Lost last jo b ........................................................ 2 ,103 2,082 2,409 2,219 2,372 2,449 2,258 2,385
608 586 630 539 571 568 518 607Reentered labor force ......................................... 1 ,509 1,398 1,507 1,456 1,547 1,507 1,544 1,397Never worked b e fo re ........................................... 595 • 541 668 668 607 644 548 607
Percent distribution
Total unemployed......................................... .. 100 .0 100.0 100.0 100.0 100.0 100.0 100.0 100.0
Lost last jo b ................................................... 43 .7 45 .2 46 .2 45 .5 46 .5 47 .4 46 .4 47.7
Left last job .................................... .............. 12 .6 12.7 12.1 11.0 11.2 11.0 10.6 12.1
Reentered labor force....................................... 31 .3 30.3 29 .9 29.8 30.4 29.2 31.7 28.0
Never worked before................................. 12.4 11.7 12.8 13.7 11.9 12.5 11.3 12.1
Unemployed os a percent of thecivilian labor force
Lost last jo b ........................................................ 2 .5 2 .5 2 .8 2 .6 2 .8 2 .9 2.7 2 .9Left last j o b ........................................................ .7 .7 .7 .6 .7 .7 .6 .7Reentered labor force........................................... 1 .8 1.7 1.8 1.7 1.8 1.8 1.8 1.7Never worked b e fo re ....................... .................... .7 .6 .8 .8 .7 .8 .7 .7
T a b le A - 6 : U n e m p lo y e d p e rso n s by ag e an d s e x
Age and sex
Thousands of persons Percent looking for
full-time work
Seasonally adjusted unemployment rates
Nov.1971
Nov.1970
Nov.1971
O ct.1971
S ep t.1971
Aug.1971
Ju ly1971
Nov.1970
Nov. 1971
Total, 16 years and over . . . .................... 4 ,815 4,607 74.2 6 .0 5.8 6 .0 6 .1 5 .8 5 .9
16 to 19 y ea rs ................................................ 1,244 1,235 47 .3 17.0 17.0 17.1 17.0 16.2 17.616 and 17 y e a r s ....................................... 590 566 22.9 18.4 20.5 18.6 19.7 18.3 18.618 and 19 y e a r s ....................................... 654 669 69.3 15.7 14.6 16.0 15.0 14.9 16.6
20 to 24 yea rs ................................................ 1,083 977 81.4 10.5 9 .3 9 .6 10.1 9.7 10.025 years and o v e r ....................................... 2 ,488 2,395 84.6 4 .0 4 .0 4 .1 4 .1 4 .0 3 .9
25 to 54 y e a r s .......................................... 2 ,012 1,936 86.1 4 .3 4 .3 4 .4 4 .3 4 .2 4 .255 years and o v e r ..................................... 476 460 78.2 3 .4 2 .9 3.1 3 .5 3 .1 3 .3
Males, 16 years and o v e r ............................... 2 ,580 2,343 79.7 5 .4 5.3 5 .5 5 .5 5 .2 5 .2
16 to 19 y ea rs ................................................ 657 619 48.2 16.4 17.0 16.4 17.3 15.5 16.516 and 17 y e a r s ...................................... 325 300 24.6 . 18.0 21.1 19.1 19.5 18.5 17.718 and 19 y e a r s ....................................... 332 320 71.1 14.7 14.0 14.5 15.4 13.5 15.1
20 to 24 y ea rs ................................................ 609 556 83 .6 10.7 10.1 10.5 10.5 10.1 10.425 years and o v e r ....................................... 1 ,314 1,259 93.7 3.5 3 .5 3 .6 3 .6 3 .4 3 .4
25 to 54 y e a r s .......................................... 1,037 955 96.4 3.8 3.7 3 .8 3 .6 3 .5 3 .555 years and o v e r .................................... 276 305 83.7 3.2 2 .9 3 .0 3 .3 3 .1 3 .5
Females, 16 years and o v e r ......................... 2 ,235 2,173 67.9 7 .0 6 .6 6 .8 7 .0 6 .9 7 .0
16 to 19 yea rs ................................................ 587 616 46 .2 17.8 17.0 17.8 16.7 17.1 19.016 and 17 y e a r s ....................................... 265 266 20.8 18.9 19.8 17.9 19.9 18.1 19.818 and 19 y e a r s ......................... .. . . . . 322 350 67.1 17.0 15.4 17.7 14.6 16.5 18.4
20 to 24 y ea rs ................................................ 474 421 78.7 10.3 8 .4 8 .6 9 .5 9 .1 9 .625 years and o v e r ....................................... 1 ,174 1,136 74.4 4 .9 4 .9 4 .9 5 .1 5 .0 4 .8
25 to 54 y e a r s .......................................... 975 980 75.2 5 .3 5 .4 5 .3 5 .5 5 .5 5 .455 years and o v e r ..................................... 199 155 70.9 3 .7 2 .9 3 .4 3 .8 3 .3 2 .9
Digitized for FRASER http://fraser.stlouisfed.org/ Federal Reserve Bank of St. Louis
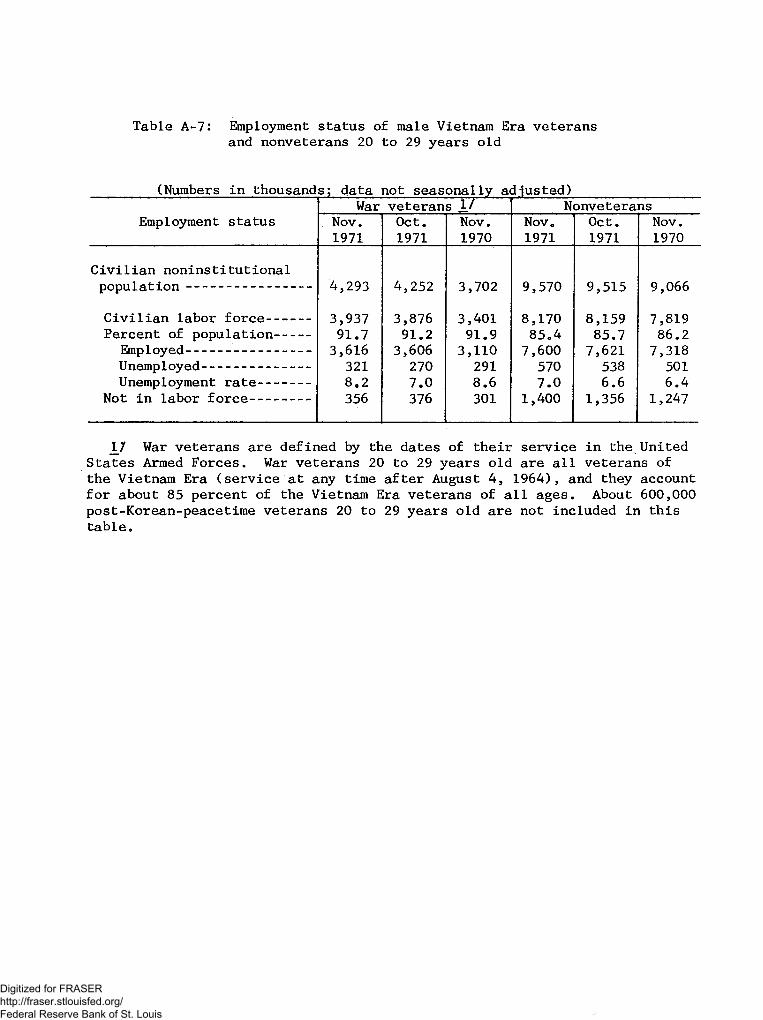
Table A-7: Employment status of male Vietnam Era veteransand nonveterans 20 to 29 years old
(Numbers in thousands; data not seasonally adjusted)War veterans 1/ Nonveterans
Employment status Nov.1971
Oct.1971
Nov.1970
Nov.1971
Oct.1971
Nov.1970
C iv i l ia n noninstitutional population ----------------------- 4,293 4,252 3,702 9,570 9,515 9,066
C iv i l ia n labor fo r c e -------- 3,937 3,876 3,401 8,170 8,159 7,819Percent of population------- 91.7 91.2 91.9 85.4 85.7 86.2
Employed----------------------- 3,616 3,606 3,110 7,600 7,621 7,318Unemployed-------------------- 321 270 291 570 538 501Unemployment ra te ---------- 8.2 7.0 8.6 7.0 6.6 6.4
Not in labor fo r c e ----------- 356 376 301 1,400 1,356 1,247
17 War veterans are defined by the dates of the ir service in the United States Armed Forces, War veterans 20 to 29 years old are a l l veterans of the Vietnam Era (se rv ice at any time a fte r August 4, 1964), and they account fo r about 85 percent of the Vietnam Era veterans of a l l ages. About 600,000 post-Korean-peacetime veterans 20 to 29 years old are not included in this table.
Digitized for FRASER http://fraser.stlouisfed.org/ Federal Reserve Bank of St. Louis
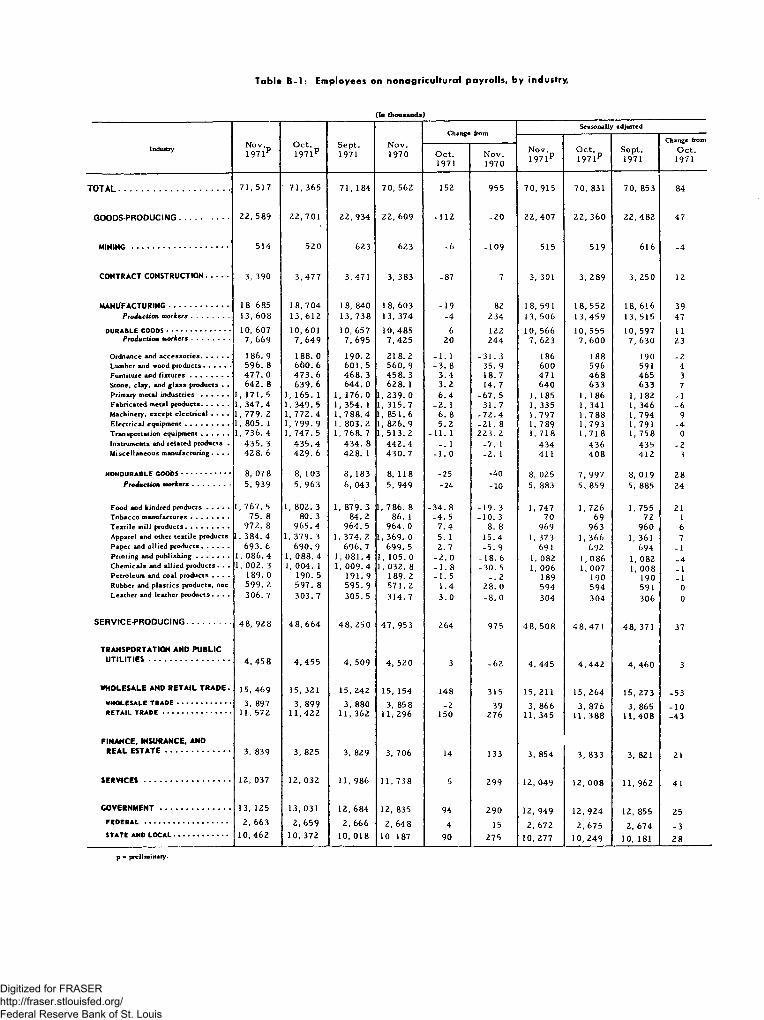
Table B-1: Employees on nonagriculturcrl payrolls, by industry,
(In thousands)
ChangeSeasonally adjusted
N ° V .
i 9 7 r
O c t .1971p
S e p t.1971
N o v .1970
Change from
IndustryO c t .1971
N o v .1970
N o v .1971P
O c t . 1 9 7 1P
S ep t.1971
O c t .1971
TO TA L............................................................ 71, 517 7 1 ,3 6 5 71, 184 70 , 562 152 955 70 , 915 70, 831 70, 853 84
G O O D S -P R O D U C IN G ........................... 22, 589 2 2 ,7 0 1 2 2 ,9 3 4 2 2 ,6 0 9 -1 1 2 -2 0 22 , 407 2 2 ,3 6 0 22, 482 47
M IN IN G ................................................ 514 5 20 623 623 -6 -1 0 9 515 519 616 -4
CON TRACT CO N STRUCTIO N ............ 3, 390 3, 477 3, 471 3, 383 -8 7 7 3, 301 3, 289 3, 250 12
M AN UFACTURIN G................................. 18 685 18, 704 18, 840 18, 603 -1 9 82 18, 591 18, 552 18, 616 39Production w orkers.................. 13, 608 1 3 ,6 1 2 13, 738 13, 374 -4 234 13, 506 1 3 ,4 5 9 13, 515 47
D URABLE G O O D S...................................... 10, 607 10, 601 10, 657 1 0 ,4 8 5 6 122 10, 566 1 0 ,5 5 5 1 0 ,5 9 7 11Production w orkers .................. 7, 669 7 ,6 4 9 7, 695 7 ,4 2 5 20 244 7, 623 7, 600 7, 630 23
O rdn ance and a c c e s s o r ie s ................. 186. 9 188. 0 190. 2 218 . 2 - 1 . 1 - 3 1 .3 186 188 190 -2Lum ber and w ood p ro d u c ts ................. 596. 8 6 6 0 . 6 6 0 1 .5 560 . 9 - 3 . 8 35. 9 600 596 591 4Furn itu re and f i x t u r e s ....................... 4 7 7 . 0 4 7 3 . 6 4 6 8 . 3 4 5 8 . 3 3 .4 18. 7 471 4 6 8 465 3S ton e , c la y , and g la s s p rod u c ts . . 642. 8 639 . 6 644 . 0 628 . 1 3 .2 14. 7 640 633 633 7P rim ary m eta l i n d u s t r i e s ................. 1, 171. 5 1, 165. 1 1, 176. 0 1, 239 . 0 6 .4 -6 7 . 5 1, 185 1, 186 1, 182 -1F a b r ic a te d m eta l p ro d u c ts ................. 1, 3 4 7 .4 1, 349 . 5 1, 354. 1 1 ,3 1 5 .7 - 2 . 1 3 1 .7 1, 335 1, 341 1, 346 -6M ach in ery , e x c e p t e le c t r ic a l . . . . 1 ,7 7 9 . 2 1, 7 7 2 .4 1, 7 8 8 .4 1, 8 5 1 .6 6 . 8 - 7 2 .4 1, 797 1 ,7 8 8 1, 794 9E le c t r ic a l equ ipm en t . . . . . . . . . 1, 799 . 9
1, 747 . 51, 803. 2 1, 768 . 7
1, 826. 9 1, 513 . 2
5 .2 -2 1 . 8 223 . 2
1, 789 1, 718
1 ,7 9 3 1 791 _4T ra n sp o r ta tio n e q u ip m e n t ................. 1, 736 . 4 -1 1 . 1 11 71 8 l ! 758 0Instrum ents and r e la te d p rod u c ts . 4 35 . 3 4 3 5 .4 4 3 4 . 8 4 4 2 .4 - . 1 -7 . 1 434 436 435 -2M is c e lla n e o u s m an u fac tu rin g . . . . 42 8. 6 4 2 9 . 6 4 2 8 . 1 4 3 0 . 7 - 1 . 0 -2 . 1 411 4 0 8 412 3
N O ND U RABLE G O O D S............................. 8, 07 8 8, 103 8 , 183 8, 118 -25 -40 8, 025 7 ,9 9 7 8, 019 28Production w orkers .................. 5, 939 5, 963 6, 043 5, 949 -24 -10 5, 883 5, 859 5, 885 24
F o o d and k in d red p r o d u c t s ............. 1, 767 . 5 1, 802 . 3 1, 879. 3 1, 786 . 8 -3 4 . 8 -1 9 . 3 1, 747 1 ,7 2 6 1, 755 21T o b a c c o m a n u fa c tu re s ....................... 75. 8 80. 3 84. 2 86. 1 - 4 . 5 - 1 0 .3 70 69 72 1T e x t i l e m ill p ro d u c ts .......................... 972 . 8 9 6 5 .4 964 . 5 964 . 0 7 .4 8. 8 969 963 960 6A p p a re l and other t e x t i le p rodu cts 1 ,3 8 4 .4 1, 379 . 3 1, 374. 2 1, 369 . 0 5. 1 1 5 .4 1, 373 1, 366 1, 361 7P a p e r and a l l ie d p ro d u c ts ................. 693 . 6 690 . 9 696 . 7 699 . 5 2. 7 - 5 . 9 691 692 694 _ i
P r in t in g and p u b l i s h in g .................... 1 ,0 8 6 .4 1, 0 8 8 .4 1, 0 8 1 .4 1, 105. 0 - 2 . 0 - 1 8 .6 1, 082 1 ,0 8 6 1, 082 -4C h e m ic a ls and a l l ie d p ro d u c ts . . . 1 ,0 0 2 .3 1, 004 . 1 1, 009. 4 1, 032 . 8 -1 . 8 -3 0 . 5 1, 006 1 ,0 0 7 1, 008 -1P e tro leu m and c o a l p rod u c ts . . . . 189. 0 190. 5 191. 9 189. 2 - 1 . 5 - . 2 189 190 190 -1R ubber and p la s t ic s p rodu cts , n ec 599. 2 597 . 8 5 9 5 .9 571. 2 1 .4 28. 0 594 594 591 0L e a th e r and le a th er p roducts . . . . 306. 7 303. 7 305. 5 314 . 7 3. 0 -8 . 0 304 304 306 0
S E R V IC E - P R O D U C IN G ........................ 48, 928 4 8 , 664 4 8 , 250 4 7 ,9 5 3 264 975 4 8 ,5 0 8 4 8 , 471 48 , 371 37
TRANSPORTATION AND P U B LICU T I L I T I E S ............................................. 4 ,4 5 8 4 ,4 5 5 4, 509 4, 520 3 -6 2 4, 445 4 , 442 4, 460 3
W HOLESALE AND R E T A IL T R A D E . 15, 469 1 5 ,3 2 1 1 5 ,2 4 2 1 5 ,1 5 4 148 315 1 5 ,2 1 1 1 5 ,2 6 4 1 5 ,2 7 3 -5 3W HOLESALE T R A D E ................................ 3, 897 3, 899 3, 880 3, 858 -2 39 3, 866 3, 876 3, 865 -1 0R E T A IL T R A D E ......................................... 1 1 ,5 7 2 1 1 ,4 2 2 1 1 ,3 6 2 1 1 ,2 9 6 150 276 1 1 ,3 4 5 1 1 ,3 8 8 1 1 ,4 0 8 -4 3
FIN AN CE, INSURANCE, ANDR E A L E S T A T E .................................... 3, 839 3, 825 3, 829 3, 706 14 133 3, 854 3, 833 3, 821 21
S E R V I C E S ................................................ 12, 037 1 2 ,0 3 2 11, 986 1 1 ,7 3 8 5 299 1 2 ,0 4 9 12, 0 08 11, 962 41
GOVERNM ENT ....................................... 13, 125 1 3 ,0 3 1 1 2 ,6 8 4 12, 835 94 290 1 2 ,9 4 9 1 2 ,9 2 4 12, 855 25F E D E R A L .................................................. 2, 663 2, 659 2 ,6 6 6 2, 648 4 15 2, 672 2, 675 2, 674 -3S T A T E AND L O C A L ................................ 10, 462 1 0 ,3 7 2 10, 018 10 187 90 275 1 0 ,2 7 7 10, 249 10, 181 28
p = preliminary.
Digitized for FRASER http://fraser.stlouisfed.org/ Federal Reserve Bank of St. Louis

T a b le B-2: A v e r a g e w eek ly hours off production or nonsu perv isory w o rk erson p r iv a te n o n a g r icu ltu ra l p a y ro l l s , by industry
Industry N o v , 1971 P
O c t . 1971 p
S e p t .1971
N o v .1970
Change from Seasona lly adjusted
N o v .p1971
O c t . p 1971
S e p t .1971
Change from
O c t .1971
O c t .
1971N o v .1970
TOTAL PRIVATE................................. 37. 1 37. 1 37. 0 36. 8 0 . 0 0. 3 37. 2 37 . 1 3 6 .7 0 . 1
M IN IN G ....................................................... 4 2 . 7 4 2 . 9 4 2 . 1 4 2 . 7 - . 2 0 4 2 .7 4 2 . 6 4 1 . 9
CO N TRA CT C O N STRU CTIO N ............. 38. 1 38. 3 3 6 .9 36. 2 - . 2 1 .9 39 . 2 37 . 7 35 . 7 1. 5
M A N UFA CTURIN G .................................. 4 0 . 2 4 0 . 0 39. 8 39 . 7 . 2 . 5 4 0 . 1 39 . 8 39. 5 . 3O v e r t im e h o u r s ................................ 3. 0 3. 1 3. 1 2 . 8 - . 1 . 2 2 .9 3. 0 2 . 8 - . 1
D U R AB LE G O O D S...................................... 4 0 . 8 4 0 . 5 4 0 . 0 4 0 . 1 . 3 . 7 4 0 . 7 4 0 . 3 39. 7 .4O v e r t im e h o u rs ................................. 3. 0 3. 0 3. 0 2 .6 0 . 4 2 .9 2. 8 2 . 7 . 1
O rdn an ce and a c c e s s o r i e s ................. 4 1 .6 4 1 . 7 4 1 . 9 4 0 . 5 - . 1 1 . 1 4 1 . 5 4 1 . 7 4 1 . 7 - . 2L u m b er and w o o d p ro d u c ts .............. 4 0 . 5 4 0 . 9 4 0 . 4 3 9 .6 - . 4 .9 4 0 . 7 4 0 .6 4 0 . 1 . 1F u rn itu re and f i x t u r e s ....................... 4 0 . 3 4 0 . 3 4 0 . 0 39. 7 0 . 6 39 . 9 3 9 .6 3 9 .4 . 3S to n e , c la y , and g la s s p ro d u c ts . . 4 2 . 1 4 2 . 1 4 1 . 9 4 1 . 1 0 1 . 0 4 2 . 1 4 1 . 8 4 1 .4 . 3P rim a ry m eta l i n d u s t r i e s ................. 3 9 .6 3 9 .7 3 9 .5 3 9 .4 - . 1 . 2 39 . 8 4 0 . 1 39 . 5 - . 3F a b r ic a te d m e ta l p ro d u c ts . . . . . . 4 0 . 7 4 0 .4 3 9 .9 4 0 . 3 . 3 . 4 4 0 . 5 4 0 .2 39 . 3 . 3M ach in ery , e x c e p t e le c t r ic a l . . . . 4 1 . 2 4 0 . 7 4 0 . 6 4 0 .6 . 5 .6 4 1 . 2 4 0 . 7 4 0 .5 . 5E le c t r ic a l e q u ip m e n t ........................... 4 0 .4 4 0 . 2 4 0 . 0 4 0 . 0 .2 . 4 4 0 . 1 4 0 . 0 3 9 .6 . 1
T ra n s p o r ta t io n e q u ip m e n t ................ 4 1 .6 4 1 . 0 39. 1 4 0 . 6 .6 1 . 0 4 1 . 0 4 0 . 5 38 . 5 . 5In stru m en ts and r e la te d p ro d u c ts . 4 0 . 7 4 0 . 0 4 0 . 0 4 0 . 2 . 7 . 5 4 0 .4 39 . 8 39. 7 . 6M is c e l la n e o u s m a n u fa c tu r in g . . . . 3 9 .6 39 . 3 38 . 9 3 8 .9 . 3 . 7 39 . 2 3 8 .9 38 . 7 . 3
N O N D U R AB LE G O O D S ........................ 3 9 .5 39 . 3 3 9 .5 39 . 1 . 2 . 4 3 9 .4 39 . 2 39 . 1 . 2O v e r t im e h o u r s ..................................... 3. 0 3. 2 3 .4 2 .9 - . 2 . 1 2 .9 3. 0 3. 1 - . 1
F o o d and k in d red p r o d u c t s .............. 4 0 . 0 4 0 . 0 4 0 . 9 4 0 . 6 0 - . 6 3 9 .9 3 9 .9 4 0 . 5 0T o b a c c o m a n u fa c tu re s ....................... . 3 5 . 3 36. 8 37. 8 38 . 5 - 1 . 5 - 3 . 2 35 . 2 3 5 . 5 3 6 .6 - . 3T e x t i l e m ill p r o d u c ts ........................... 4 1 . 3 4 1 . 0 4 0 . 6 4 0 . 0 . 3 1. 3 4 1 . 0 4 0 . 8 4 0 .4 . 2A p p a re l and o th e r t e x t i le p ro d u cts 3 6 .4 35. 9 35 . 5 3 5 .4 . 5 1 . 0 3 6 . 3 36 . 0 3 5 .4 . 3P a p e r and a l l ie d p ro d u c ts ................. 4 2 .4 4 2 . 3 4 2 . 2 4 1 . 8 . 1 . 6 4 2 . 3 4 2 . 0 4 1 .9 . 3P r in t in g and p u b l i s h in g .................... 37. 8 37 . 5 37 . 7 37 . 5 . 3 . 3 37 . 8 3 7 .4 3 7 .4 . 4C h e m ic a ls and a l l i e d p ro d u c ts . . . 4 1 . 8 4 1 . 4 4 2 . 1 4 1 .5 . 4 . 3 4 1 . 6 4 1 .4 4 2 . 1 . 2P e tro le u m and c o a l p ro d u cts . . . . 4 2 . 1 4 2 .4 4 2 . 8 4 3 . 1 - . 3 - 1 . 0 4 1 . 8 4 2 . 2 4 2 . 9 - . 4R u b b er and p la s t ic s p ro d u cts , n ec 4 0 . 6 4 0 .6 4 0 . 5 39. 7 0 . 9 4 0 .4 4 0 . 3 4 0 . 0 . 1
L e a th e r and le a th e r p ro d u c ts ,. . . . 38 . 2 3 7 .6 3 6 .9 3 7 .2 . 6 1 . 0 38. 1 37 . 8 37 . 3 . 3
TRAN SPORTATION AND P U B L ICU T I L I T I E S .............................................. 4 0 . 8 4 0 . 7 4 0 . 8 4 0 . 5 . 1 . 3 4 0 .6 4 0 .5 4 0 .6 . 1
W H O LESALE AND R E T A IL T R A D E . 35 . 0 35 . 0 35 . 2 3 4 .9 0 . 1 3 5 . 3 3 5 .2 35 . 1 . 1
W H O LESALE T R A D E ................................. 4 0 . 0 3 9 .9 3 9 .7 3 9 .7 . 1 . 3 4 0 . 1 3 9 .9 3 9 .7 . 2R E T A IL T R A D E .................................. 33 . 5 33 . 5 3 3 .7 3 3 .4 0 . 1 3 3 .8 3 3 .8 3 3 .6 0
FIN A N C E, IN SURAN CE, ANDR E A L E S T A T E ..................................... 37 . 1 37 . 1 3 6 .9 36 . 8 0 . 3 37 . 0 37 . 0 3 7 . 0 0
S E R V I C E S ................................................. 3 4 .2 34 . 1 34 . 1 34 . 2 . 1 0 34 . 3 34 . 2 3 4 .2 . 1
*Data relate to production workers in mining and manufacturing: to construction workers in contract construction: and to nonsupervisory* workers in transportation and public utilities; wholesale and retail trade; finance, insurance, and real estate; and services. These groups account for approximately four-fifths of the total employment on private nonagricultural payrolls,
p - preliminary.
Digitized for FRASER http://fraser.stlouisfed.org/ Federal Reserve Bank of St. Louis

Ta b le B-3: A v e r a g e hourly a n d w eek ly ea rn in g s of production or n o n su p e rv iso ry w orkers
on private n on ag r icu ltu ra l payro l ls , by industry
Average hourly earnings Average weekly earnings
Industry N o v . 1971 P
O c t . 1 9 7 1P
S e p t .1971
N o v .1970
Change fromN o v . O c t .
1971pS e p t .1971
N o v .1970
Change from
O c t .1971
N o v .1970
1971 p O c t .1971
N o v .1970
TOTAL PR IVATE................................ $ 3 .4 7 $3 . 49 $3 . 49 $ 3 .2 9 - $ 0 . 0 2 $0 . 18 $ 1 2 8 .7 4 $ 1 2 9 .4 8 $ 129 . 13 $ 1 2 1 .0 7 - $ 0 . 74 $7. 67
M IN IN G .................................................... 3 .9 2 3 .9 1 4 .1 $ 3 .9 7 .0 1 - . 0 5 1 6 7 .3 8 1 6 7 .7 4 1 7 4 .7 2 169. 52 - . 36 - 2 . 14
CO N TRA CT C O N STRU CTIO N ------ 5 .8 9 5 .8 9 5 .8 6 5 .4 6 0 .4 3 2 2 4 .4 1 2 2 5 .5 9 2 1 6 .2 3 1 9 7 .6 5 - 1 . 18 2 6 . 76
M A N UFA CTURIN G.............................. 3 .6 0 3 .6 0 3 .6 0 3. 39 0 .2 1 1 4 4 .7 2 1 4 4 .0 0 143. 28 1 3 4 .5 8 . 72 10. 14
DURABLE GOODS............................ 3 .8 3 3 .8 2 3 .8 3 3 .5 7 . 0 1 .2 6 1 5 6 .2 6 1 5 4 .7 1 1 5 3 .2 0 143. 16 1. 55 13. 10
O rdn an ce and a c c e s s o r ie s .............. 3 .9 1 3 .9 1 3. 90 3 .7 3 0 . 18 1 6 2 .6 6 1 6 3 .0 5 1 6 3 .4 1 1 5 1 .0 7 - . 3 9 11. 59Lu m ber and w o od p r o d u c ts .............. 3. 19 3. 20 3 .2 1 3 .0 5 - . 0 1 . 14 1 2 9 .2 0 1 3 0 .8 8 1 2 9 .6 8 1 2 0 .7 8 - 1 . 6 8 8 .4 2Fu rn itu re and f i x t u r e s .................... 2 .9 3 2 .9 2 2 .9 5 2 .8 1 . 0 1 . 12 1 1 8 .0 8 1 1 7 .6 8 1 1 8 .0 0 111 . 56 .4 0 6 .5 2S ton e , c la y , and g la s s p ro d u cts . 3. 72 3 .7 3 3. 75 3 .5 0 - . 0 1 . 2 2 1 5 6 .6 1 1 5 7 .0 3 157 . 13 1 4 3 .8 5 - . 4 2 12 . 76P rim ary m eta l i n d u s t r i e s ............. 4 . 37 4 . 35 4 . 35 3 .9 8 .0 2 .3 9 1 7 3 .0 5 1 7 2 .7 0 1 7 1 .8 3 1 5 6 .8 1 .3 5 1 6 .2 4F a b r ic a te d m eta l p ro d u c ts .............. 3. 76 3 .7 7 3 .7 7 3 . 54 - . 0 1 .2 2 1 5 3 .0 3 1 5 2 .3 1 1 5 0 .4 2 1 4 2 .6 6 .7 2 10. 37M ach in ery , e x c e p t e le c t r ic a l . . . 4 .0 3 4 . 04 4 . 04 3 .8 2 - . 0 1 .2 1 1 6 6 .0 4 1 6 4 .4 3 1 6 4 .0 2 1 5 5 .0 9 1 .6 1 1 0 .9 5E le c t r ic a l e q u ip m e n t ....................... 3 .5 1 3 .5 2 3 .5 2 3 . 34 - . 0 1 .1 7 1 4 1 .8 0 1 4 1 .5 0 1 4 0 .8 0 1 3 3 .6 0 .3 0 8 .2 0T ra n s p o r ta t io n e q u ip m e n t .............. 4 .4 6 4 .4 5 4 .4 2 4 .0 1 .0 1 .4 5 1 8 5 .5 4 1 8 2 .4 5 1 7 2 .8 2 1 6 2 .8 1 3 .0 9 22 . 73Instru m en ts and r e la te d p rod u cts 3 .5 3 3. 56 3 .5 7 3 .4 2 - . 0 3 .1 1 1 4 3 .6 7 1 4 2 .4 0 1 4 2 .8 0 1 3 7 .4 8 1. 27 6 .1 9M is c e l la n e o u s m a n u fa c tu r in g . . . 2 .9 5 2 .9 6 2 .9 6 2 .8 7 - . 0 1 .0 8 1 1 6 .8 2 1 1 6 .3 3 1 1 5 .1 4 1 1 1 .6 4 .4 9 5 . 18
NONDURABLE GOODS........................... 3. 29 3 .2 9 3 . 31 3 .1 5 0 . 14 1 2 9 .9 6 129 . 30 1 3 0 .7 5 123. 17 .6 6 6 .7 9
F o o d and k in d red p rod u cts . . . . 3. 39 3. 38 3 . 38 3 . 24 .0 1 . 15 1 3 5 .6 0 1 3 5 .2 0 1 3 8 .2 4 1 3 1 .5 4 .4 0 4 .0 63 .0 1 3 .0 4 3 .0 3 2 .9 3 - . 0 3 . 0 8 1 0 6 .2 5 1 1 1 .8 7 1 1 4 .5 3 1 1 2 .8 1 - 5 . 6 2 - 6 . 56
T e x t i l e m ill p ro d u c ts ....................... 2 .6 0 2 .5 9 2 . 58 2 .5 2 .0 1 .0 8 1 0 7 .3 8 1 0 6 .1 9 1 0 4 .7 5 1 0 0 .8 0 1 .1 9 6 .5 8A p p a re l and o th er t e x t i le p rod u c ts 2 .5 3 2 . 52 2 .5 3 2 .4 3 .0 1 . 1 0 9 2 . 09 9 0 .4 7 8 9 .8 2 8 6 .0 2 1. 62 6 .0 7P a p e r and a l l ie d p r o d u c ts ............. 3 .7 2 3 .7 3 3 .7 7 3 .5 3 - . 0 1 .1 9 1 5 7 .7 3 1 5 7 .7 8 1 5 9 .0 8 1 4 7 .5 5 - . 0 5 1 0 .1 8P r in t in g and p u b l i s h in g ................. 4 .2 6 4 . 26 4 .2 8 4 .0 2 0 .2 4 1 6 1 .0 3 1 5 9 .7 5 161. 36 1 5 0 .7 5 1 .2 8 1 0 .2 8C h e m ic a ls and a l l ie d p rod u cts . . 4 .0 1 4 .0 0 4 .0 3 3 .7 9 .0 1 .2 2 1 6 7 .6 2 1 6 5 .6 0 1 6 9 .6 6 1 5 7 .2 9 2 .0 2 10 . 33P e tro le u m and c o a l p ro d u cts . . . 4 .6 2 4 .6 5 4 .6 6 4 .3 4 - . 0 3 . 28 1 9 4 .5 0 1 9 7 .1 6 1 9 9 .4 5 1 8 7 .0 5 - 2 .6 6 7 .4 5R u bber and p la s t ic s p ro d u c ts , n ec 3 .4 5 3 .4 6 3 .4 8 3. 29 - . 0 1 . 16 1 4 0 .0 7 1 4 0 .4 8 1 4 0 .9 4 130 . 61 - . 4 1 9 .4 6L e a th e r and le a th e r p rod u c ts . . . 2 .6 2 2 .6 3 2 .6 2 2 .5 1 - . 0 1 .1 1 1 0 0 .0 8 98 .8 9 9 6 .6 8 9 3 . 37 1. 19 6 .7 1
TRAN SPORTATION AND P U B LICU T I L I T I E S ........................................... 4 . 30 4 .3 1 4 . 33 3 .9 6 - . 0 1 .3 4 1 7 5 .4 4 1 7 5 .4 2 1 7 6 .6 6 160. 38 . 0 2 1 5 .0 6
W H O LESALE AND R E T A IL TR A D E 2 .9 0 2 . 90 2 . 90 2 .7 7 0 .1 3 1 0 1 .5 0 1 0 1 .5 0 1 0 2 .0 8 9 6 .6 7 0 4 .8 3
WHOLESALE TRADE ........................ 3 .7 2 3 .7 1 3 .7 2 3 .5 2 .0 1 .2 0 1 4 8 .8 0 1 4 8 .0 3 1 4 7 .6 8 1 3 9 .7 4 .7 7 9 .0 6RETAIL TRAD E............................... 2 . 59 2 . 60 2 .6 0 2 .4 9 - . 0 1 . 1 0 8 6 .7 7 8 7 . 10 8 7 .6 2 8 3 . 17 - .3 3 3 .6 0
FIN A N CE, IN SURAN CE, ANDR E A L E S T A T E .................................. 3. 29 3 . 31 3 . 30 3 . 15 - . 0 2 . 14 1 2 2 .0 6 1 2 2 .8 0 1 2 1 .7 7 1 1 5 .9 2 - . 7 4 6 . 14
S E R V I C E S .............................................. 3 .0 3 3 .0 3 3 .0 4 2 .9 0 0 . 13 1 0 3 .6 3 1 0 3 .3 2 1 0 3 .6 6 9 9 . 18 .3 1 4 .4 5
Sco footnote 1, table B-2.
p - preliminary.
Digitized for FRASER http://fraser.stlouisfed.org/ Federal Reserve Bank of St. Louis

CIVILIAN LABOR FORCE, EMPLOYMENT AND UNEMPLOYMENT— HOUSEHOLD SURVEYSEASONALLY ADJUSTED
1 . C IV IL IA N LABOR FORCE 2 . TOTAL UNEMPLOYMENT
THOUSANDS THOUSANOS
3 . TOTAL EMPLOYMENT 4 . EMPLOYMENT OF AOULT MEN
THOUSANOS THOUSANOS
S . EMPLOYMENT OF AOULT WOMEN
THOUSANOS
6 . EMPLOYMENT OF TEENA6ERS
THOUSANOS
Digitized for FRASER http://fraser.stlouisfed.org/ Federal Reserve Bank of St. Louis

UNEMPLOYMENT RATES— HOUSEHOLD SURVEYSEASONALLY ADJUSTED
7 . ALL C IV IL IA N WORKERS
PERCENT
8 . ADULT HEN
PERCENT
9 . AOULT WOMEN
PERCENT
11 . MARRIED MEN
PERCENT
10 . TEENA6ERS
PERCENT
1 2 . STATE 1N5UREO
PERCENT
Stat* programs at a parcant of avaraga covarad ampfoymant and ara
Digitized for FRASER http://fraser.stlouisfed.org/ Federal Reserve Bank of St. Louis

UNEMPLOYMENT— HOUSEHOLD SURVEYSEASONALLY aHJUSTED
13 . WhITE WORKERS(UNEHPLOYMENT RATE)
PERCENT PERCENT
14. NEGRO RNO OTHER RACES( UNEMPLOYMENT RATE)
I S . FU LL-T IM E WORKERS(UNEMPLOYMENT RATE)
16 . PART-TIME WORKERS(UNEMPLOYMENT RATE)
PERCENT PERCENT12*S
10.0
7.S
S.O
2 .S
17 . JOB LOSERS(NUMBER OF UNEMPLOYED)
THOUSANDS
19 . REENTRANTS(NUMBER OF UNEMPLOYED)
THOUSANDS17S0
1500
12S0
1000
SOO
18 . JOB LEAVERS(NUMBER OF UNEMPLOYED)
THOUSANDS
2 0 . NEW ENTRANTS(NUMBER OF UNEMPLOYED)
THOUSANDS
Digitized for FRASER http://fraser.stlouisfed.org/ Federal Reserve Bank of St. Louis

NONAGRICULTURAL EMPLOYMENT AND HOURS— ESTABLISHMENT SURVEYSEASONALLY ADJUSTED
2 1 . TOTAL NONAGRICULTURAL EMPLOYMENT
THOUSANDS
2 3 . EMPLOYMENTGOOOS-PROOUCING INDUSTRIES
THOUSANOS
2 5 . MAN-HOURSPRIVATE NONFARM
M ILLIO N S
2 7 . AVERAGE WEEKLY HOURSMANUFACTURING
HOURS
2 2 . EMPLOYMENTSERVICE-PRODUCING IN DUSTRIES
THOUSANOS
24- EMPLOYMENT IN MANUFACTURING
THOUSANDS
2 6 . AVERAGE WEEKLY HOURSPRIVATE NONFARM
HOURS
2 8 . AVERAGE OVERTIME HOURSMANUFACTURING
HOURS
NOTE: Charts 25 and 26 relate to production or nonsupervisory workers; charts 27 and 28 relate to production workers. Data for the 2 most recent months are preliminary in charts 21*28.
Digitized for FRASER http://fraser.stlouisfed.org/ Federal Reserve Bank of St. Louis