bls_employnews_197212.pdf
TRANSCRIPT
USDL - 73-862FOR RELEASE: T ran sm ission Em bargo
Bureau o f Labor StatisticsJ. E. B regger (202) 961-2633K. D. Hoyle (202) 961-29139:30 A .M . (EST)
Friday, January 5, 1973 hom e: 333-1384
THE EM PLOYM ENT SITUATION: DECEMBER 1972
Total em ploym ent ro se in D ecem ber and unem ploym ent was unchanged, the U. S.
Departm ent o f Labor' s Bureau of Labor Statistics announced today. The Nation' s
unem ploym ent rate was 5. 2 percent, the same as the 27-m onth low reg istered in
N ovem ber and down from 6. 0 percen t a year ago.
Total em ploym ent in crea sed by 280, 000 to 82. 8 m illion in D ecem ber (seasonally
ad ju sted ), continuing the strong upward trend in evidence since m id -1971. Over the
past year, em ploym ent has expanded by 2. 4 m illion .
The number o f nonagricultural payroll jobs was unchanged in D ecem ber but was
up substantially fro m a year ago.
UnemploymentTotal job le ssn ess declined in line with usual N ovem ber-D ecem ber m ovem ents,
and, a fter seasonal adjustment, both the level and rate o f unem ploym ent w ere unchanged,
at 4. 5 m illion and 5. 2 percent, resp ective ly . However, the number o f person s unem
ployed has d ecreased by 600, 000 from D ecem ber a year ago.
Unem ploym ent rates fo r all o f the m ajor dem ographic g rou p s--a d u lt m en (3. 4
p ercen t), adult wom en (5. 1 percent) , teenagers (16. 0 percent) , whites (4. 6 percent) ,
N egroes (9. 6 percent) , m a rried m en (2. 4 p ercen t), and household heads (2. 9 percent) - -
w ere either unchanged or little charlged from N ovem ber. Jobless rates a lso rem ained
about the sam e over the month for fu ll- and part-tim e w ork ers . With the exception of
p art-tim e jobseek ers , rates fo r each of these groups have declined during the course o f 1972.
Am ong the m ajor occupational categories , the w h ite -co lla r unem ploym ent rate,
which had fallen sharply in N ovem ber, rose from 3. 1 to 3. 4 percent in D ecem ber.
This in crea se occu rred among profession a l and technical and c le r ica l w ork ers and
was partia lly o ffset by a decline among m anagers and adm inistrators. Although the
jo b le ss rate fo r b lu e -co lla r w ork ers (5. 7 percent) was about the same as in the
prev ious month, it was down nearly 2 percentage points since D ecem ber 1971.
There was essen tia lly no change in the unem ploym ent rates o f the m ajor industry groups in D ecem ber. Of particu lar note, the rate for factory w ork ers rem ained at a
Digitized for FRASER http://fraser.stlouisfed.org/ Federal Reserve Bank of St. Louis

- 2 -
2 -1 /2 -y e a r low of 4. 7 percent, m ore than 2 percentage points below the y ea r -a g o level.
F or w ork ers cov ered by State unem ploym ent insurance program s, the jo b le ss rate,
at 3. 2 percent, edged up from the 32-m onth low reg is tered in N ovem ber.
The average (mean) duration o f unemployment, at 11. 2 weeks in D ecem ber (sea son
ally adjusted) , was essen tia lly unchanged at its low est level since A pril 1971. The num
ber of lon g -term unem ployed (15 w eeks and over) edged down for the fourth straight
month to 1 m illion , the low est leve l in 2 years.
Table A. Highlights of the employment situation (seasonally adjusted data)
4th 3rd 2nd 1st 4thSelected categories . D e c . N o v . Oct. Qtr. Qtr. Qtr. Qtr. Qtr.
1972 1972 1972 1972 1972 1972 1972 1971(Millions of persons)
Civilian labor force1............................. 87.3 8 7 . 0 87.3 87.2 8 6 . 8 86.4 85.9 8 5 . 0Total employment1........................ 82.8 82.5 82.5 82.6 82.0 81.4 80.8 8 0 . 0
Adult m e n ................................. 47.5 47.3 47.3 47.3 47.1 46.7 4 6 .4 4 6 .1Adult w om en............................. 28.4 28.3 28.3 28.3 28.2 27.9 27.9 27.5Teenagers................................... 7 .0 6 .9 6.9 6.9 6 . 6 6 . 8 6 . 6 6 .3
Unem ploym ent............................... 4-5 4 .5 4 .8 ^.•6 4*3 5.0 5.0 5 .0(Percent of labor force)
Unemployment rates:A ll w orkers..................................... 5.2 5.2 5.5 5 .3 5 .6 5.7 5.8 5.9Adult m en........................................ 3.4 3 .6 3.9 3 .6 3 .9 4 .2 4 .1 4 .3Adult women................................... 5.1 5.0 5.5 5 .2 5 .6 5.6 5.3 5.7Teen agers........................................ 16.0 15.4 15.3 1 5 .6 1 6 .1 15.8 18.2 16.9White .............................................. 4 .6 4 .6 5.0 4 .7 5 .0 5.3 5.3 5.4Negro and other race s.................... 9 .6 9.8 10.1 9 .8 9 .9 9 .9 10.6 10.1Household heads............................. 2.9 2.9 3.4 3 .1 3 .3 3.5 3.4 3 ;6Married m e n ................................... 2.4 2 .4 2.8 2 .6 2 .7 2.9 2.9 3 .2Full-time w o rkers........................... 4 .7 4 .6 5.0 4 .8 5 .1 5.3 5.4 5.6State insured?................................. 3.2 3.1 3.3 3 .2 3 .5 3 .6 3.5 4 .2
(Weeks)
Average duration ofunem ploym ent................................. 1 1 . 2 11.3 11.6 11.4 12.0 12.8 12.2 11.9
(Millions of persons)
Nonfarm payroll em ploym ent........... 7 3 .9P 73.9P 73.6 73 .8p 72.9 72.5 71.8 71.1Goods-producing industries ......... 23.4P 2 3 .5p 23.4 23.4p 23.1 23.0 22.7 22.6Service-producing industries......... 50 .5P 50.4p 50.2 50 .4p 49.9 49.5 49.0 48.5
(Hours of work)
Average weekly hours:Total private nonfarm .................... 3 7 .2p 37 .2p 37.3 37 .2p 37.2 37.1 37.1 37.1Manufacturing................................. 41 .Op 4 0 .9p 40.7 4 0 . 9p 40.7 40.7 40.3 4 0 .1Manufacturing o vertim e............... 3.8p 3.8P 3 .6 3.7p 3.5 3.4 3.1 3.0
(1967 = 100)Hourly Earnings index, private
nonfarm:In current dollars .......................... 141.9p 140.7p 140.5 1 4 1 .Qp 138.5 136.8 135.0 132.4In constant dollars.......................... M 110.8p 1 1 1 . 0 M 110.2 109.8 109.0 107.91 Civilian labor force and total employment figures for periods 2 For calculation of this rate. see table A-3, footnote 2,
prior to January 1972 should be raised by about 300,000 to be comparable Mth subsequent data. Sec box above table A-1.
p=preliminary.SOURCE: Tables A-1, A-3, A-4, B-1, B-2, and B-4.
Digitized for FRASER http://fraser.stlouisfed.org/ Federal Reserve Bank of St. Louis
- 3 -
P erson s who lost their last jobs continued to account for a little over tw o-fifths
o f the total unem ployed in D ecem ber. Over the year, however, the number of job losers
declined by 425, 000 to 1. 9 m illion . (See table A - 5, )
.Clyi.li.an .Labor. Force.andJTotal Employ me_ntThe civ ilian labor fo r ce in creased by 300, 000 in D ecem ber, reaching a leve l of
87. 3 m illion . Over the year, the labor fo rce has risen by 1. 8 m illion (after eliminating
the e ffe cts of the 1970 Census population control adjustment introduced in January 1972) .
Total em ploym ent advanced by 280, 000 in D ecem ber to a seasonally -adjusted
leve l o f 82. 8 m illion . The entire in crease occu rred among fu ll-tim e w orkers, with
adult mpn and wom en accounting fo r nearly all of the gain. Com pared with D ecem ber
a year ago, total em ploym ent has risen by 2. 4 m illion ; adult men made up a little over
half of this advance, with adult wom en and teenagers accounting for 640, 000 and
500, 000, resp ectively .
The number of nonagricultural w ork ers on part-tim e schedules for econom ic
reason s (those who want fu ll-tim e w ork but have either been able to find only a part-
tim e job or have had their workw eek reduced because o f econ om ic fa ctors affecting
their jobs) declined 100, 000 to 2. 2 m illion in D ecem ber, Their level was down sub
stantially from the 10-year high of 2, 6 m illion reached in N ovem ber 1971 and was at
its low est point since Septem ber 1970.
y ifitnam.gr a, .VeteransThe em ploym ent situation fo r veterans 2 0 -to -2 9 y ears old continued to im prove
in D ecem ber. At 5. 5 percent, their job le ss rate was below the 6 -p ercen t level for the
fir s t tim e in nearly 3 years. (See table A - 7 . )
The gap between the unem ploym ent rates fojr veterans and nonveterans c losed
d ec is iv e ly during the last few months of 1972. A year ea rlie r , the veterans' rate was
appreciab ly higher than that of nonveterans. By D ecem ber 1972, the situation was
reversed , with the veterans’ rate a full percentage point below the nonveteran rate
o f 6. 5 percent. This elim ination of the gap a lso un derscores the fact that the veterans'
unem ploym ent rate has declined far m ore sharply over the pa:st y e a r - -2 , 9 v ersu s 1. 2
percentage points fo r nonveterans.
In D ecem ber 1972, 4. 1 m illion veterans 2 0 -to -29 years old w ere em ployed and
230, 000 w ere unem ployed (not seasonally adjusted) . Veterans' em ploym ent in creased
by 440, 000 since D ecem ber 1971, absorbing all of the in crease in the labor fo rce and
reducing the number unem ployed by 90, 000. The age com position of the 20-29 y ear-
old veterans has been changing, with a greater proportion now in ages 25-29. This
re fle cts both the considerable slowdown in d ischarges of young men frpm m ilitary
Digitized for FRASER http://fraser.stlouisfed.org/ Federal Reserve Bank of St. Louis

- 4 -
serv ice in 1972 and the growing number who have been out of the serv ice for several
years .
Industry P ayro ll Em ploym ent
The number of nonagricultural payroll jobs was v irtually unchanged in D ecem ber
from the rev ised N ovem ber level of 73, 9 m illion (season ally adjusted) . However, pay
ro ll em ploym ent was up 2. 6 m illion from D ecem ber 1971.
Although the payroll job total did not change in D ecem ber, som e industries showed
m arked m ovem ents. O ver-the-m onth em ploym ent gains in durable goods m anufacturing
(a lm ost all of which occu rred in m achinery and e le c tr ica l equipment) , se rv ice s , and
State and loca l governm ent w ere o ffset by reductions in contract construction and
reta il trade. The decline in contract construction (85, 000) was due in part to unusually
bad weather conditions prevailing in many parts o f the country. Em ploym ent in reta il
trade rose le ss than seasonally expected over the month and, after seasonal adjustment,
was down by 35, 000. It is noteworthy, however, that em ploym ent in this sector had
in crea sed m arkedly in N ovem ber, an indication o f earlier-than^usual hiring for the
holiday buying season.
H ours o f W ork
The average workw eek for ran k -an d-file w ork ers rose by 0t 3 hour, but this was
in line with the usual N ovem ber-D ecem ber m ovem ent. A fter adjustm ent fo r season a l
ity, the w orkweek was unchanged at 37? 2 hours: F or the second month in a row, w eekly
hours in contract construction w ere down sharply, a developm ent that a lso stem m ed
from bad weather conditions.
In m anufacturing, w eekly hours w ere about unchanged fro m the prev ious month
but, at 41. 0 hours (season a lly adjusted) , w ere at their highest level in m ore than 4
years. Com pared with D ecem ber 1971, fa ctory hours have in crea sed by 0. 8 hour.
O vertim e hours in m anufacturing w ere unchanged over the month at 3. 8 hours but
w ere a lso up 0. 8 hour from a year ago.H ourly and W eekly Ear nings
A verage hourly earnings of production or nonsupervisory personnel on nonfarm
p ay ro lls w ere $3. 7 3 in D ecem ber, the same leve l as in N ovem ber. This was an in crea se o f 21 cents, or 6. 0 percent, from a year ago.
Because of an in crea se in the actual workweek, average weekly earnings rose by
$1.12 to $139. 50. A fter seasonal adjustment, the in crease w^s considerably l e s s - r 37
cents. C om pared with D ecem ber a year ago, average w eekly earnings have risen
$8. 20 or 6. 2 percent. During the latest 12-m onth period for which the Consum er
P r ice Index is ava ila b le --N ovem b er 1971 to N ovem ber 1972*--con su m er p r ice s rose
Digitized for FRASER http://fraser.stlouisfed.org/ Federal Reserve Bank of St. Louis

- 5 -
3. 5 percent.
H ourly Earnings Index
The Bureau* s H ourly Earnings Index, seasonally adjusted, was 141. 9 (1967=100)
in D ecem ber, 0. 9 percent higher than in N ovem ber, accord ing to p re lim in ary figures.
The index was 6. 2 percent above D ecem ber a year ago. (See table B -4 . ) A ll indus
tr ies posted in crea ses in 1972, ranging from 5. 0 percent in w holesale and reta il trade
to 9. 6 percent in transportation and public u tilities. During the 12-m onth p eriod ending
in N ovem ber, the Hourly Earnings Index in do llars o f constant purchasing pow er rose
3. 1 percent.
The Year in R eview
The Nation' s em ploym ent situation during 1972 was highlighted by strong labor
fo r ce and em ploym ent gains and a m oderate decline in unem ployment. The overa ll
job le ss rate, which had hovered c lo se to the 6 -percen t m ark during 1971, declined
gradually during 1972 and at year.end stood at 5. 2 percent. The follow ing sections
d escrib e developm ents in the em ploym ent situation during the cou rse o f 1972, with
specia l em phasis on quarterly m ovem ents.
-Ciyilian Labor Force ,and.Total EmpjQyrrtetttGrowth of the Nation* s civilian labor fo rce , which had resum ed at a rapid pace
in mid-1971, p ers is ted during 1972. By the fourth quarter of the year, the labor fo rce
had reached 87. 2 m illion , exceeding its mid-1971 level by nearly 3. 2 m illion (after
elim inating the e ffects o f the 1970 Census population control adjustm ent introduced
in January 1972) . On an annual average basis, the labor fo rce gain amounted to 2. 1
m illion , com pared with in crea ses of 1. 3 m illion in 1971 and 2. 0 m illion in each of the
prev ious 2 years. In addition to norm al population growth, the 1972 upsurge was
attributable to the continued reductions in the A rm ed F o rce s and to rising partic ipa
tion of adult wom en and teenagers.
Total em ploym ent advanced strongly during the cou rse of 1972, continuing the
expansion evident since mid-1971. Job gains averaging m ore than half a m illion each
quarter brought em ploym ent to an alltim e high o f 82. 6 m illion in the final quarter of
the year, 3. 6 m illion above mid-1971. On an annual average basis, em ploym ent rose
by 2. 3 m illion , in m arked contrast to in crea ses of 490, 000 in 1971 and 730, 000 in 1970.
The 1972 job pickup represented the largest annual expansion in the post-W orld War II
period ; it was m ost pronounced among adult w ork ers 25 years of age and over. How
ever, em ploym ent o f young adults and teenagers a lso posted im p ress ive gains.
Digitized for FRASER http://fraser.stlouisfed.org/ Federal Reserve Bank of St. Louis

- 6 -
U nem ploym ent
Despite the resu rgen ce in em ploym ent growth during the past year and a half, the
reduction in the number o f jo b le ss w ork ers was m odest. F or 1972 as a whole, unem ploy -
ment averaged 4. 8 m illion , down nearly 200, 000 from the 1971 level. The overa ll job le ss
rate was 5. 6 percent, com pared with 5. 9 percent in 1971 but still above the annual rates
o f 4. 9 percent in 1970 and 3. 5 percent in 1969.
Although the overa ll jo b le ss rate did not show a large change on an annual basis
fro m 1971, there was an appreciab le downtrend in job lessn ess during the cou rse o f the
year. The overa ll job le ss rate edged down in every quarter beginning with the last
quarter o f 1971, fo lloy in g 3 consecutive quarters at 6. 0 percent. By the fourth quarter
o f 1972, the rate was down to 5. 3 percent, its low est point since the third quarter of
1970.
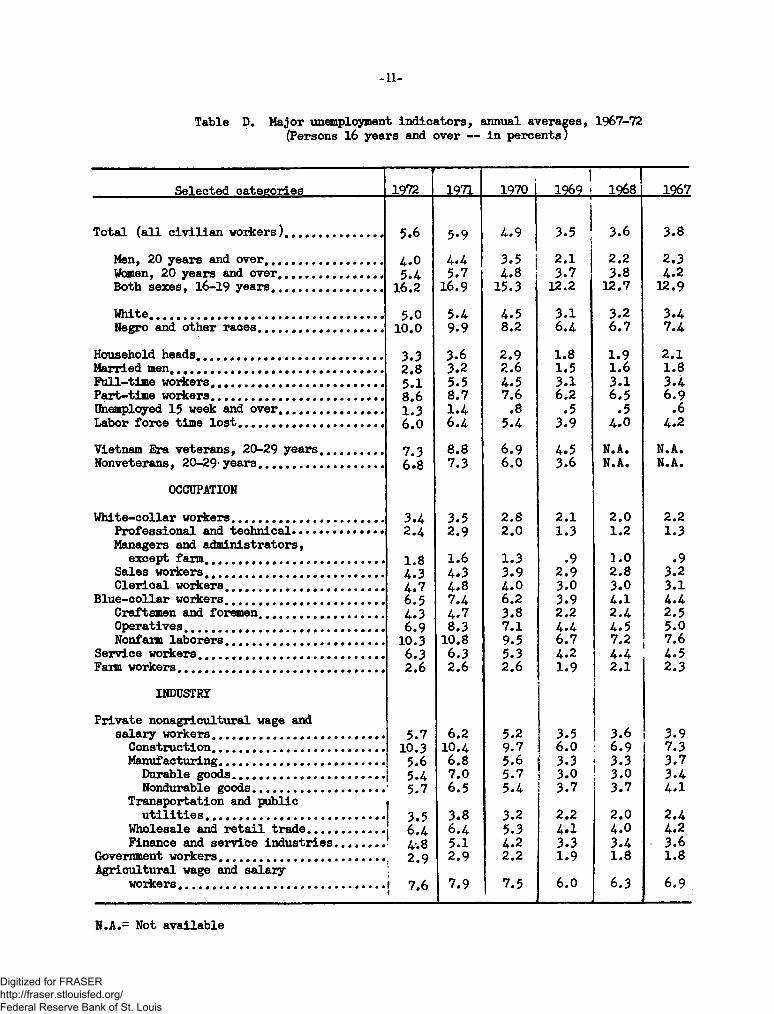
P ara lle ling the m ovem ents in the Nation' s overa ll jo b le ss rate, the rates for m ost
o f the m ajor dem ographic groups in the labor fo r ce a lso dim inished from re la tive ly high
leve ls in 1970 and 1971. (See table D .)
The unem ploym ent rate fo r adult men, which had stayed above 4 percen t from
late 1970 through m id-1972, dropped to 3. 6 percen t by the last quarter. On an annual
basis , the adult-m ale rate averaged 4. 0 percent in 1972, down from 4. 4 percen t in 1971.
The unem ploym ent rate fo r adult women, on the other hand, showed le ss im p rov e
ment. A fter m oving within the 5. 5-5 . 8 percent range since late 1970, it declined to
5. 3 percen t in the f ir s t quarter o f 1972. In the next 2 quarters, how ever, it reverted
to the higher 1971 leve ls and then reced ed again in the last quarter, to 5. 2 percent. On
an annual basis, their rate was 5. 4 percent, com pared with 5. 7 percent in 1971.
Teenage unem ploym ent did not begin to decrease until the second quarter of 1972.
In the f ir s t quarter of the year, in fact, the teenage rate had soared to 18. 2 percent,
surpassing the prev ious p ost-W orld War II high re cord ed in 1963. By the fourth quarter
o f the year, their rate was down to 15. 6 percent, the low est point since the sum m er o f 1970.
The unem ploym ent rate fo r household heads declined substantially during 1972,
m oving from 3. 6 percent in the last quarter o f 1971 to 3. 1 percen t by the end of 1972;
on an annual basis, their rate was 3. 3 percent, com pared with 3. 6 percent in 1971.
The rate for m arried men, which had m ore than doubled in 1970-71 after attaining
a re co rd low of 1. 4 percent in 1969, edged down gradually during 1972, reaching 2. 6
percen t in the fourth quarter. F or the year as a whole, their job le ss rate averaged
2. 8 percent, down from 3. 2 percent in 1971, and only half as high as the rate for all
w ork ers .
Digitized for FRASER http://fraser.stlouisfed.org/ Federal Reserve Bank of St. Louis
- 7 -
The job le ss rate for N egro w ork ers held c lose to the 10-percent m ark during the
cou rse o f 1972, while the rate fo r white w ork ers edged downward. On an annual basis,
the N egro job le ss rate, at 10. 0 percent, was v irtually the same as their 1971 rate (9. 9 percent) . By contrast, the rate fo r white w ork ers m oved down, from 5. 4 to 5. 0 p e r
cent. A s a result, the overa ll N egro-w hite jo b le ss rate ra tio --w h ich had been below
2 to 1 in 1970 and 1971, averaging 1. 8 to 1 in each y e a r - - returned to the 2 - t o - l d iffe ren
tial in 1972.
The unem ployment rate fo r fu ll-tim e w ork ers, which had held within the 5. 4-5 . 6
percen t range from late 1970 through early 1972, drifted downward during the year,
reaching 4. 8 percent in the fourth quarter. The rate fo r all part-tim e w ork ers, on
the other hand, was little changed over the 2 -y ea r span, averaging 8. 6 percent in 1972.
Among w ork ers in the m ajor industries, the job le ss a ate for manufacturing
w ork ers declined by a considerable amount in 1972, after reaching a high of 7. 1 percent
in the fourth quarter of 1970 and rem aining near that point throughout m ost o f 1971. By
the last quarter of 1972, the fa ctory w orker rate had fallen below 5 percent; this im p rov e
ment was particu larly prom inent among w ork ers engaged in durable goods production.
F or w ork ers in the construction industry, the unem ploym ent rate showed only a m ild
downtrend since reaching a 6 -year high of 11. 6 percent in the third quarter of 1970,
keeping c lose to the 10-percent m ark since early 1971.
There w ere a lso m arked reductions in 1972 among som e o f the key occupational
groups. The job le ss rate for w ork ers in b lu e -co lla r occupations, which had reached
an 8 -y ea r high of 7. 5 percent in late 1970 and had rem ained at this level throughout
1971, dropped steadily after the fir s t quarter o f 1972, reaching 5. 8 percent by the end
of the year. Their annual average rate was 6. 5 percent in 1972, com pared with 7. 4
percent in 1971. Much of the b lu e -co lla r im provem ent o ccu rred among sem i-sk illed
operatives, whose rate fe ll from 8. 3 to 6. 9 percent on an annual basis . F or w hite-
co lla r w orkers, the 1972 unem ploym ent rate held c lose to the 3 -1 /2 -p e r ce n t level that had prevailed since late 1970. There was, how ever, a substantial reduction
among profession a l and technical w orkers, a group that had experienced particu larly
sharp unem ploym ent in crea ses in 1970 and early 1971. Their rate had been at a p ost-
W orld War II high of a little over 3 percent in early 1971 but receded to an average of
2. 4 percent in 1972.
Although the number of jo b le ss w orkers declined between 1971 and 1972, the
average period o f time w ork ers rem ained unemployed, at 12. 1 weeks, was a bit
longer than in 1971. The number of lon g -term unem ployed --those who were job less
Digitized for FRASER http://fraser.stlouisfed.org/ Federal Reserve Bank of St. Louis

- 8 -
fo r 15 or m ore w eek s--a v era g ed 1. 2 m illion in 1972. They represented 24 percent
o f all unem ployed persons and 1. 3 percent of the civ ilian labor fo rce , about the same
proportion s as in 1971.
The sm all reduction in unem ploym ent on an annual basis between 1971 and 1972 was
attributable p rim a rily to a drop in the number of w ork ers losing their jobs. There was
a m odest upturn in the number of unem ployed who w ere in search o f their fir s t jobs as
w ell as among those who had voluntarily quit their last job.
Vietnam E ra V eterans
The number of 2 0 -to -2 9 y e a r -o ld veterans in the labor fo rce averaged 4. 2 m illion
in 1972, about 490, j000 m ore than in 1971. A ll of this in crea se was in em ploym ent, as
their unem ploym ent leve l rem ained c lo se to 300, 000. The average unem ploym ent rate
fo r veterans dropped from 8. 8 to 7. 3 percent, a stronger y e a r -to -y e a r decline than for
the nonveterans, whose rate fe ll from 7. 3 to 6. 8 percent. Over the cou rse o f 1972, the
veterans' rate declined from over 8 percent ea rly in the year to about 6 percen t by the
last quarter.
The reduction in the veterans' unem ploym ent rate la rge ly re flected the im proved
econ om ic situation and specia l nationwide e fforts to help in the em ploym ent of veterans.
In addition, the tapering o ff o f m ilita ry d isch arges from a m onthly peak of nearly 100, 000
at the beginning of 1972 to le ss than 50, 000 at the end m eant that the econ om y had to
absorb few er of the inexperienced young veterans than in each year since 1969. A lso ,
a la rger proportion of V ietnam Era veterans in 1972 had been out of the A rm ed F o rce s
fo r severa l years and thus had m ore labor m arket experien ce and le ss vu lnerability
to unem ploym ent.
The gap between the average unem ploym ent rate o f veterans and nonveterans
narrow ed in 1972. During the fir s t half, the veterans rate was 1 percentage point
higher than the nonveteran rate. By the last few months, however, the gap disappeared
altogether, and in D ecem ber the veterans' rate dropped below that for nonveterans.
At the c lose o f 1972, there w ere about 6 m illion m ale Vietnam Era veterans of a ll ages in the population; 1. 8 m illion w ere in ages 20 to 24, 2. 8 m illion w ere 25 to
29, and 825, 000 w ere 30 to 34. The 3 0 -to -3 4 year age group w ill continue to in crea se
in size over the next few y ea rs ; in 1972, about 97 percent w ere in the labor fo rce , and
their unem ploym ent rate o f 2. 9 percent was roughly the same as fo r nonveterans.
Industry D evelopm ents
Total nonagricultural p ayro ll em ploym ent showed im p ress ive growth in 1972,
rising by 2.1 m illion from the 1971 leve l to 7 2 -3 /4 m illion . This gain follow ed 2 con secutive years of a lm ost no em ploym ent growth. The 1971-72 upturn was paced by
Digitized for FRASER http://fraser.stlouisfed.org/ Federal Reserve Bank of St. Louis

- 9 -
the continued expansion of the serv ice -p rod u cin g sector but was also w ell supported by
a renewal o f growth in the goods-producing industries.
The turnaround in goods-producing jobs was led by the resurgent manufacturing industries. F actory em ploym ent had been hit hard by the 1969-70 re cess ion and cutbacks
in defense and aerospace expenditures and did not begin to recover until the end of 1971;
it rose in ev ery quarter of 1972, however, with the 360, 000 in crease in the last quarter
being the largest single qu arter-to -qu arter gain in m ore than 6 years. For the year as
a whole, manufacturing em ploym ent averaged 18. 9 m illion , a gain of 400, 000 from 1971
but still 1. 2 m illion short of the alltim e high reached in 1969. The manufacturing
em ploym ent gain was centered in the durable goods industries, with the largest gains
being reg istered in e le c tr ica l equipment, m achinery, and fabricated m etals.
Among the other goods-producing industries, em ploym ent in mining held constant,
and em ploym ent in contract construction rose by 110, 000. The construction gain stem m ed
from a surge in hom ebuilding to re co rd levels, bringing the em ploym ent level to an a ll-
tim e high of 3. 5 m illion jobs .
Although em ploym ent gains w ere record ed in each of the m ajor serv ice -p rod u cin g
industry ca tegories with the exception of Federal governm ent, the 1. 6 m illion o v er -th e -
year in crease was concentrated in three industries: retail trade, serv ices , and State
and loca l governm ent.
Despite the rapid econ om ic expansion and large em ploym ent gains recorded during
the year, the average w orkweek for production or nonsupervisory w ork ers on private
nonfarm payrolls rose only m arginally, averaging 37. 2 hours as com pared with 37. 0
hours in 1971 and 37. 1 hours in 1970.
In the manufacturing sector, however, the large em ploym ent gains w ere jc c o m -
panied by a significant in crease in the workweek. Continuing the rise which began in
the last quarter o f 1971, average hours in manufacturing m oved up throughout 1972,
averaging 40. 6 hours for the year. This represented an increase of 0. 7 hour fr o r . .
1971. F actory overtim e, an im portant indicator o f the pulse o f econom ic activity,
averaged 3. 5 hours in 1972, a m arked im provem ent over the 2. 9 -hours average of 1971.
This release presents and analyzes statistics from two major surveys. Data on
labor force, total employment, and unemployment are derived from the sample sur
vey of households conducted and tabulated by the Bureau of the Census for the
Bureau of Labor Statistics. Statistics on payroll employment, hours, and earnings
are collected by State agencies from payroll records of employers and are tabulated
by the Bureau of Labor Statistics. A description of the two surveys appears in the
BLS publication Employment and Earnings.
Digitized for FRASER http://fraser.stlouisfed.org/ Federal Reserve Bank of St. Louis

- 10 -
Table B. Employment status o f the noninstitutione.l population 16 years and over, annual averages, 1970-72
(In thousands)
Employment status i 1972 ...: 1971 1970 jChaj
1971-721nge1970-71
Total labor fo r c e ................................................. 88,991 86,929 85,903 1,729 1,026Aimed fo r c e s ....................................... ................ 2,449 2,817 3,188 -368 -371C ivilian labor fo r c e ....................................... 86,542 84,113 82,715 2,096 1,398
Employed............................................................ 81,702 79,120 78,627 2,281 493A griculture................................................. 3,472 3,387 3,462 72 -75Nonagricultural in du stries ................... 78,230 75,732 75,165 2,210 567
Unemployed........................................................ 4,840 4,993 4,088 -185 905Unemployment rate 1 (percent) ..................... 5.6 5.9 4 .9 -0 .3 1 .0
Not in labor fo r c e ................................................ 56,785 55,666 54,280 665 1,386
1 / Changes shown incorporate the d ifferences stemming from the introduction o f the 1970 Census population con trols in to the Current Population Survey estimation procedures. They thus w ill d i f fe r from the arithm etic d ifferen ce in each o f the 1971-72 changes by the amount o f the s p e c if ic d ifferen ce (see tables 1 and 3 in "Revisions in Current Popula tion Survey" in the February 1972 issue o f Employment and Earnings).
Table C. Unemployed persons 16 years and over by duration o f unemployment, annual averages, 1970-72
Duration o f unemployment
1 1972 ___________ 1921________:L________ 1970_______ 'Thousands
o fpersons
PercentThousands
o fpersons
PercentThousands
o fpersons
Percent
T ota l............................... 4 ,8 4 0 1 0 0 .0 4 ,9 9 3 1 0 0 .0 4,088 1 0 0 .0Less than 5 weeks............. 2 ,2 2 3 4 5 .9 2 ,2 3 4 4 4 .7 2,137 52 .35 to 14 weeks..................... 1,458 3 0 .1 1,578 3 1 .6 1,289 3 1 .515 weeks and over............. 1,158 2 3 .9 1,181 2 3 .7 662 1 6 .2
15 to 26 weeks............. 597 1 2 .3 665 1 3 .3 427 1 0 .427 weeks and ov er ..• . 562 n . 6 517 1 0 .4 235 5 .7
Average (mean) duration.1 12.11
— 11.4 — 8.8]1
Digitized for FRASER http://fraser.stlouisfed.org/ Federal Reserve Bank of St. Louis
- 1 1 -
Table D. Major unemployment in d ica tors, annual averages, 1967-72 (Persons 16 years and over — in percents)
Selected categories----------- r
1972 1971 1970]
1969 ; 1968 1967
Total (a l l c iv i l ia n workers)............................. 5.6 5-9 4 .9 3.5 i 3.6 3.8
Men, 20 years and over................................... 4 .0 4 .4 3.5 2 .1 2 .2 2 .3Women, 20 years and ov e r ,............................. 5 .4 5.7 4.8 3 .7 3.8 4.2Both sexes, 16-19 years................................. 1 6 .2 16.9 15.3 1 2 .2 12.7 12.9
White...................................................................... 5.0 5.4 4.5 3.1 3.2 3.4Negro and other races................... . ................ 1 0 .0 9.9 8 .2 6 .4 6 .7 7 .4
Household heads,...................................................... 3.3 3-6 2 .9 1 .8 1 .9 2 .1Married men................................................................ 2 .8 3.2 2 .6 1.5 1 .6 1 .8Full-tim e workers.................................................... 5.1 5.5 4.5 3.1 3.1 3 .4Part-time workers.................................................... 8 .6 8 .7 7.6 6 .2 6 .5 6 .9Unemployed 15 week and over............................... 1 .3 1.4 .8 .5 .5 .6Labor fo rce time l o s t ........................................... 6 .0 6 .4 5.4 3.9 4 .0 4.2
Vietnam Era veterans, 20-29 years................... 7.3 8 .8 6 .9 4.5 N.A. N.A.Nonveterans, 20-29 years..................................... 6 .8 7.3 6 .0 3.6 N.A. N.A.
OCCUPATION
W hite-collar workers............................................. 3 .4 3.5 2 .8 2 .1 2 .0 2 .2Professional and tech n ica l........................... 2.A 2 .9 2 .0 1.3 1 .2 1.3Managers and adm inistrators,
except fa rm ,,................................................. 1 .8 1 .6 1.3 .9 1 .0 .9Sales w ork ers,,................................................. 4 .3 4.3 3 .9 2 .9 2 .8 3.2C lerica l workers, _ , ....................................... 4 .7 4.8 4 .0 3.0 3.0 3.1
B lu e-co lla r workers............................................... 6 .5 7.4 6 .2 3.9 4.1 4 .4Craftsmen and foremen., , ............................... 4 .3 4 .7 3.8 2 .2 2 .4 2.5O peratives., . . , .................................................. 6 .9 8.3 7.1 4*4 4.5 5.0Nonfarm laborers............................................... 10.3 1 0 .8 9.5 6 .7 7.2 7.6
Service w orkers,..................................................... 6 .3 6.3 5.3 4.2 4 .4 4.5Farm workers.............................................................. 2 .6 2 .6 2 .6 1.9 2 .1 2 .3
INDUSTRYi
Private nonagricultural wage andsalary workers................................................... 5.7 6 .2 5.2 3.5 3 .6 3.9
Construction................................................... 10.3 10.4 9 .7 6 .0 : 6 .9 7.3Manufacturing.................................................. 5.6 6 .8 5.6 i 3.3 j 3.3 3 .7
Durable goods............................................. 5.A 7.0 5.7 1 3.0 ! 3 .0 3 .4Nondurable goods....................................... ' 5 .7 6.5 5.4 3 .7 3.7 4.1
Transportation and publicu t i l i t i e s ...................................................... 3.5 3.8 3.2 2.2 2 .0 2 .4
Wholesale and r e ta il trade....................... 6 .4 6 .4 5.3 4.1 4 .0 4.2Finance and service in du stries............... 4 .8 5.1 4.2 3.3 3.4 3.6
Government workers................................................. 2 .9 2 .9 2.2 1.9 1.8 1.8Agricultural wage and salary-
workers .............................................................. i 7.6 7.9 7.5 6 .0 6.3 6 .9
N.A.= Not available
Digitized for FRASER http://fraser.stlouisfed.org/ Federal Reserve Bank of St. Louis

- 1 2 -
Table E . E m ployees on nonagricultural p a y ro lls , by industry, annualaverages, 1970-72
(In thousands)
Industry 1972 P 1971 1970Change
1971-72 1970-71
T o t a l .............................. .. 72 ,750 70, 645 70, 593 2, 105 52
G oods-producing. . . . . . . . ............................ 23,055 22, 542 23,352 513 -810M ining • • •..................................................... 607 602 623 5 -21C ontract construction ............................... 3, 520 3,411 3, 381 109 30M anufacturing . . . . . ..................... .......... 18,928 18,529 19, 349 399 -820
Durable g ood ^ ...................................... 10, 881 10, 565 11, 195 316 -630Ordnance and a c ce s s o r ie s . • • • 187.4 192. 1 241 .9 j - 4 .7 -4 9 .8Lum ber and w ood produ cts. • • • 612 .0 580.8 572.7 ! 31 .2 8 .1Furniture and fix tu res ............ .. • 49 2 .9 458. 5 4 59 .8 i 3 4 .4 -1 .3Stone, clay , and g lass prod u cts. 660 .0 633.7 640 .2 ; 26. 3 -6 .5P rim a ry m etal industries. • • • • 1234.5 1 ,227.4 1,315.6 7. 1 -8 8 .2F abricated m etal products . . . . 1370.5 1 ,328.2 1 ,380 .4 42. 3 -5 2 .2M achinery, except e le c t r ic a l . . 1863.4 1,805.3 1,982.1 58. 1 -1 7 6 .8E le c tr ica l eq u ip m en t.................. 1833.0 1,768.5 1 ,917 .0 6 4 .5 -1 4 8 .5Transportation equipment . . •. j!1 7 4 4 .3 1 ,723.9 1,799.1 2 0 .4 -7 5 .2Instruments and related . . . . . . : 45 5 .9 437 .0 4 6 0 .4 ; 18 .9 -2 3 .4M iscellaneous m anufacturing • • j 42 5 .4 409 .6 425 .7 15 .8 -1 6 .1
Nondurable goods .............. ............... i 8 ,048 7, 964 8, 154 84 -190F ood and kindred products . . • • j 1750.3 1,758.3 1,782.8 -8 . 0 -2 4 .5T obacco m anufactures. • ............ : 71 .8 | 76 .3 82. 9 -4 . 5 ; -6 .6Textile m ill p r o d u c t s ................. 990 .9 i! 957 .0 975 .9 1 33. 9 1! -1 8 .9A p p a r e l ............ .......................... .. 1335.6 1,335.7 1 ,364.6 j - .1 -2 8 .9P aper and a llied prod u cts .......... 696 .8 i 683 .6 705 .5 ; 13.2 -2 1 .9Printing and publishing . . . . . . * 1079.2 1,071.2 1,101.6 8 . 0 . -3 0 .4C hem icals and a llied products. • 1002.4 ,; 1, 008.2 1 ,049 .0 - 5 .8 -4 0 .8P etroleu m and coa l products • . . j 189.7 ' 190.6 190.8 ; - . 9 i - . 2Rubber •••••••••••••••••••••; 626 .8 ii 580.9 580. 1 • 45. 9 I .8Leather and leather products • • 3 0 4 .5 ;; 302 .4 320.4 2 .1 j -1 8 .0
S erv ice -p rod u cin g •••••••••••••••••••j 49, 695 48, 103 ] 47 ,242 * 1, 592 I 861Transportation and public u t i l it ie s .. . = 4, 495 4 ,442 i 4, 493 ! 53 ; -51W holesale and reta il trade ••••••••• 15, 679 15, 142 | 14,914 • 537 228
W holesale tra d e ......................... .. 3 ,918 3,.809 j 3 ,812 109 -3R etail t r a d e .............. ............... ........... 11, 760 11,333 11, 102 427 231
F inance, insurance, and rea l estate. • 3, 926 3,796 3, 688 ( 130 108S erv ices ...................•••••••••••••••• 12, 309 11,869 11,612 : 440 257Governm ent ................................................. 13,287 12,856 i 12,535 431 321
F edera l ................... ...................... •••• 2, 649 2 ,664 < 2,705 -15 -41State and l o c a l ...........••••••••••• 10,639 10, 191 9,830 448 361
p=prelim inary
Digitized for FRASER http://fraser.stlouisfed.org/ Federal Reserve Bank of St. Louis

NOTE: Figures for periods prior to January 1972 in the tables and charts are not strictly, comparablewith current data because of the introduction of 1970 Census data into the estimation procedures. For example, the civilian labor force and employment totals were raised by m ore than 300, 000 as a result of the census adjustment. An explanation of the changes and an indication of the differences appear in "Revisions in the Current Population Survey" in the February 1972 issue of Employment and Earnings.
TabU A-1: Employment status of tha noninstitutional population by sox and ago
(In thousands)
Employment status, age, and sexDec.1972
Nov.1972
Dec.1971
Seasonally adjusted
Dec.1972
Nov.1972
Oct.1972
Sept.1972
Aug.1972
Total
Total labor f o r c e .......................................... ; . . 89,437 89,400 87,541 89,777 89,468 89,691 89,454 89,256Civilian labor force ............................................. 86,997 86,969 84,883 87,337 87,037 87,276 87,049 86,860
Employed............................................................. 82,881 82,703 80,188 82,812 82,531 82,482 82,222 81,973Agriculture....................................................... 3,163 3,363 2,948 3,639 3,524 3,660 3,575 3,625Nonagricultural industries............................. 79,719 79,340 77,240 79,173 79,007 78,822 78,647 78,348
On part time for economic reasons............. 1,990 2,011 2,198 2,165 2,266 2,302 2,340 2,488Usually work full time . ........................... 917 946 1,045 951 1,067 1,0a 1,058 1,082Usually work part t im e ............................. 1,073 1,065 1,153 1,214 1,199 1,261 1,282 1,406
Unemployed.......................................................... 4,116 4,266 4,695 4,525 4,506 4,794 4,827 4,.887
Mm , 20 years and aver
Civilian labor force................................................ 48,921 48,882 47,990 49,113 49,031 49,227 49,083 48,954Employed....................................................... .. . 47,263 47,309 45,907 47,451 47,285 47,303 47,204 47,063
Agriculture........................................*•............ 2,464 2,532 2,266 2,652 2,597 2,663 2,629 2,550Nonagricultural industries................ .. 44,799 44,777 43,6a 44,799 44,688 44,640 U , 575 44,513
Unemployed.......................................................... 1,657 1,573 2,083 1,662 1,746 1,924 1,879 1,891
Women, 20 years and aver
Civilinn labor f o r c e ..................... ................... 30,291 30,328 29,628 29,908 29,802 29,958 29,915 29,990Employed ............................................................. 28,980 28,864 28,182 28,373 28,308 28,322 28,296 28,334
Agriculture....................................................... 445 534 434 561 533 575 561 604Nonagricultural industries............................. 28,535 28,330 27,748 27,812 27,775 27,747 27,735 27,730
Unemployed.......................................................... 1,311 1,463 1,445 1,535 1,494 1,636 1,619 1,656
Both sexes, 16-19 years
Civilian labor force................................................ 7,786 7,759 7,266 8,316 8,204 8,091 8,051 7,916Employed............................................................. 6,638 6,530 6,099 6,988 6,938 6,857 6,722 6,576
Agriculture..................................................... .. 253 296 248 426 394 422 385 471Nonagricultural industries............................. 6,384 6,233 5,851 6,562 6,544 6,435 6,337 6,105
Unemployed.......................................................... 1,148 1,229 1,167 1,328 1,266 1,234 1,329 1,340
Table A-2: Full- and part-time status of the civilian labor force by sex and age
(Numbers in thousands)
Digitized for FRASER http://fraser.stlouisfed.org/ Federal Reserve Bank of St. Louis
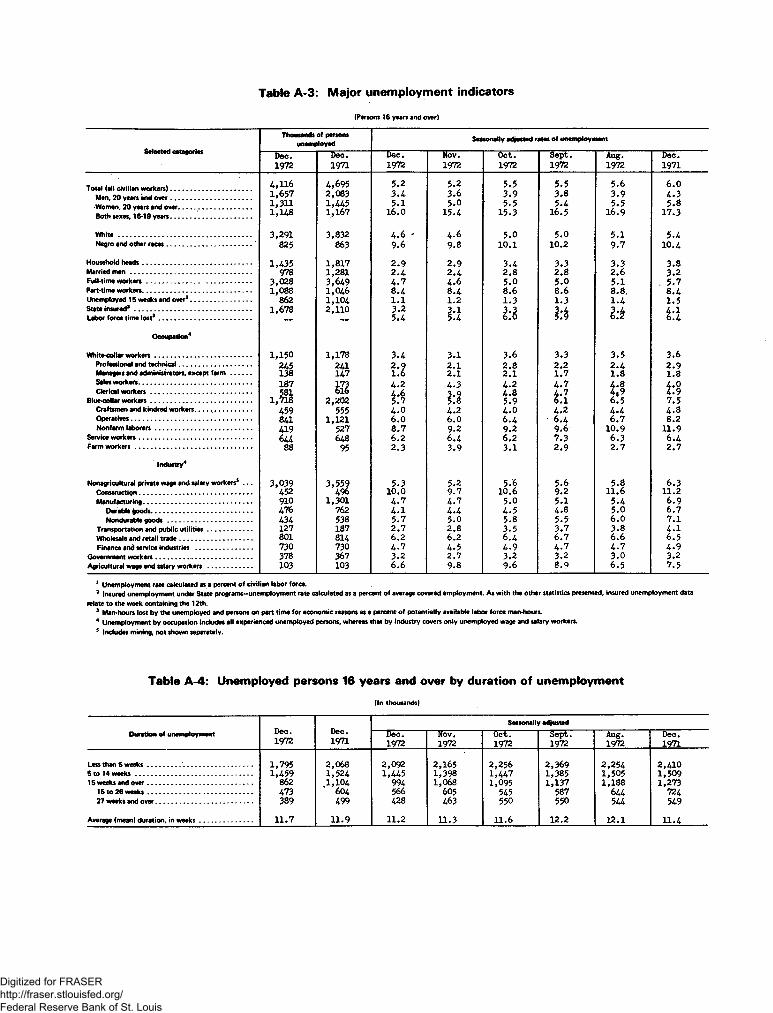
Table A-3: Major unemployment indicators
(Persons 16 years and over)
Selected categories
Total (all civilian workers). . . Men, 20 years and over. . . •Women, 20 years and over. Both sexes, 16-19 years.. .
Thousands o f persons unemployed
Dec. Dec. Dec Nov.1972 1971 1972 1972
4,1161,6571,3111,148
4,6952,0631,4451,167
5.23.45.1
16.0
5.23.65.0
15.4
Seasonally adjusted rates o f unemployment
Oct.1972
5.5 3.95.5
15.3
Sept.1972
5.53.85.4
16.5
Aug.1972
5.63.95.5
16.9
Dec.1971
6.04.35.8
17.3
White .........................Negro and other races
3,291 3,832825 863
4.69.6
4.69.8
5.010.1
5.010.2
5.1 5.49.7 10.4
Household heads.........................Married m e n ................................Full-time w orkers......... .............Part-time workers.........................Unemployed 15 weeks and over1State insured3 .............................Labor force time lost3 ................
1,435978
3,0281,088
8621,678
1,8171,2813,6491,0461,1042,110
2.92.4 4 .78.4 1.1 3.25.4
2.92.4 4.68.41.2
3.42.85.08.61.31:3
3.3 2.8 5.0 8.61.3l-A
3.3 2.6 5.1 8. 8.1.4I'M
3.83.25.78.41.5
Occupation4
White-collar workers........................................Professional and technical...........................Managers and administrators, except farmSales workers.................................................Clerical w orkers..........................................
Blue-collar workers..........................................Craftsmen and kindred workers.........Operatives.....................................................Nonfarm laborers........................................
Service workers.................................................Farmworkers...................................................
1,150245138187
i.?34598414196U
88
1,178
5ft111
2,202 555
1,121 527 648
95
3.4
5:24.2
4.06.08.76.22.3
Industry4
3.12.1 2.14.3
4.26.09.2 6.4 3.9
3.62.82.14.24.85.94.0 6.49.26.23.1
3.32.21.74.7
4.2 6.4 9.67.3 2.9
3.52.41.8
U6.5 4 .46.7
10.96.32.7
3.62.91.8
7.54.88.2
11.96.42.7
Nonagricultural private wage and salary workers3 . . .Construction...............................................................Manufacturing............................................................
Durable goods........................................................Nondurable g o o d s ...............................................
Transportation and public utilities.........................Wholesale and retail trade.........................................Finance and service industries ...............................
Government workers.................. ...................................Agricultural wage and salary workers .........................
3,039452910476434127801730378103
3,55?496
1,301762538187814730367103
5.310.04.74.15.72.76.24.7 3.2 6.6
5.2 5.69.7 10.64.7 5.04.4 4.55.0 5.82.8 3.56.2 6.44.5 4 .92.7 3.29.8 9.6
5.6 5.89.2 11.65.1 5.44.8 5.05.5 6.03.7 3.86.7 6.64.7 4 .73.2 3.08.9 6.5
6.311.26.9 6.77.14.16.54.93.27.5
1 Unemployment rate calculated as a percent of civilian labor force.3 Insured unemployment under State programs—unemployment rate calculated as a percent o f average covered employment. As with the other statistics presented, insured unemployment data
relate to the week containing the 12th.3 Man-hours lost by the unemployed and persons on part time for economic reasons as a percent of potentially available labor force man-hours.4 Unemployment by occupation includes all experienced unemployed persons, whereas that by industry covers only unemployed wage and salary workers.3 Includes mining, not shown separately.
Table A-4: Unemployed persons 16 years and over by duration of unemployment(In thousands)
Duration of unemployment Dec.1972
Dec.1971
Seasonally adjustedDec.1972
Nov.1972
Oct.1972
Sept.1972
Aug.1972
Dec.1971
Less than 5 w eeks.................. .................................... 1,795 2,068 2,092 2,165 2,256 2,369 2,254 2,4105 to 14 w eeks................................................................. 1,459 1,524 1,445 1,398 1,447 1,385 1,505 1,50915 weeks and over.......................................................... 862 1,104 994 1,068 1,095 1,137 1,188 1,273
15 to 26 weeks.......................................................... 473 604 566 605 545 587 644 72427 weeks and over...................................................... 389 499 428 463 550 550 544 549
Average (mean) duration, in w eeks............................. 11.7 11.9 11.2 11.3 11.6 12.2 12.1 11.4
Digitized for FRASER http://fraser.stlouisfed.org/ Federal Reserve Bank of St. Louis

Table A -5 : U n e m p lo ye d persons by reason lo r unem ploym ent
(Numbers in thousands)
Reason for unemploymentDec, Dec. Seasonally adjusted*
1972 1971Dec.1972
— Nov:--------1972
uct.1972.
sept.1972
ffugT1972
Decl1971
Number of unemployed
Lost last jo b ............................................... 1,897 2,322 1,932 1,893 1,942 2,121 2,244 2,365Left last j o b .......................................................... 581 551 702 650 666 635 644 666Reentered labor force ........................................... 1,129 1,257 1,286 1,362 1,490 1,452 1,427 1,432Never worked before............................................. 509 566 662 628 649 649 640 736
Percent distribution
Total unemployed............................................. 100.0 100.0 100.0 100.0 100.0 100.0 100.0 100.0Lost last j o b ..................................................... 46.1 49.4 42.2 41.8 40.9 43.7 45.3 45.5Left last j o b ..................................................... U . l 11.7 15.3 14.3 14.0 13.1 13.0 12.8Reentered labor force........................................ 27.4 26.8 28.1 30.0 31.4 29.9 28.8 27.5Never worked before........................................... 12.4 12.1 14.4 13.9 13.7 13.4 12.9 14.2
Unemployed os o percent of the civilian labor forco
Lost last jo b .......................................................... 2.2 2.7 2.2 2.2 2.2 2.4 2.6 2.8Left last j o b .......................................................... .7 .6 .8 .7 .8 .7 .7 .8Reentered labor force............................................ 1.3 1.5 1.5 1.6 1.7 1.7 1.6 1.7Never worked before................................ ............. .6 .7 .8 .7 .7 .7 .7 .9
Table A-6: Unemployed persons by age and sex
Age and sex
Thousands of persons Percent looking for full-time
work
Seasonally adjusted unemployment rates
Dec.1972
Dec.1971
Dec.1972
Nov.1972
Oct.1972
Sept.1972
Aug.1972
Dec.1971
Total) 16 years and o v e r ........................... 4,116 4,695 73.6 5.2 5.2 5.5 5.5 5.6 6.0
16 to 19 years.................................. 1,148 1,167 48.6 16.0 15.4 15.3 16.5 16.9 17.316 and 17 years.................................. 545 550 24.0 . 17.4 18.2 18.3 19.9 20.5 18.818 and 19 years.................................. 603 617 70.8 15.0 13.3 13.2 U . l H.O 16.3
20 to 24 years......................................... 898 987 82.4 8.8 8.6 9.1 9.1 9.0 10.125 years and o v e r .................................. 2,070 2,541 83.5 3.3 3.3 3.6 3.5 3.6 4.125 to 54 years..................................... 1,645 2,055 86.5 3.4 3.5 3.7 3.7 3.7 4.355 years and over................................ 425 486 72.0 3.0 2.8 3.5 3.1 3.7 3.4
Males, 16 years and over........................... 2,328 2,784 78.1 4.4 4.6 4.8 4.9 4.9 5.416 to 19 years........................ ................ 671 701 48.1 15.6 15.5 U . l 15.9 16.5 17.316 and 17 years.................................. 330 337 24.2 17.6 17.9 17.5 20.8 20.0 19.0
18 and 19 years.................................. 342 364 71.3 14.0 13.5 11.7 12.3 13.2 16.020 to 24 years......................................... 523 611 85.1 8.4 8.7 8.9 8.6 8.5 10.525 years and o v e r .................................. 1,134 1,471 92.7 2 .7 2.7 3.1 3.0 3.1 3.525 to 54 years.......... .......................... 851 1,175 97.2 2.5 2.8 3.0 3.0 3.0 3.6■ 55 years and over................................ 283 296 79.5 2.9 2 .7 3.6 3.3 3.4 3.0
Females, 16 years and o v e r ...................... 1,788 1,911 67.6 6.4 6.1 6.6 6.7 6.8 7.0
16 to 19 years......................................... 477 466 49.3 16.4 15.3 16.7 17.3 17.5 17.316 and 17 years............ ..................... 215 213 24.2 17.2 18.5 19.3 18.6 21.3 18.518 and 19 years...................... .. . . . . 262 253 69.8 16.1 13.1 15.0 16.3 14.9 16.7
20 to 24 years......................................... 375 376 78.7 9.2 8.5 9.5 9.6 9.5 9.625 years and ov e r .................................. 936 1,070 72.5 4.3 4.2 4.5 4.5 4.6 5.0
25 to 54 years..................................... 793 880 75.2 4.8 4.6 4.8 4.9 4.8 5.455 years and over................................ 142 190 58.5 3.1 3.0 3.4 2 .9 4.3 3.9
Digitized for FRASER http://fraser.stlouisfed.org/ Federal Reserve Bank of St. Louis
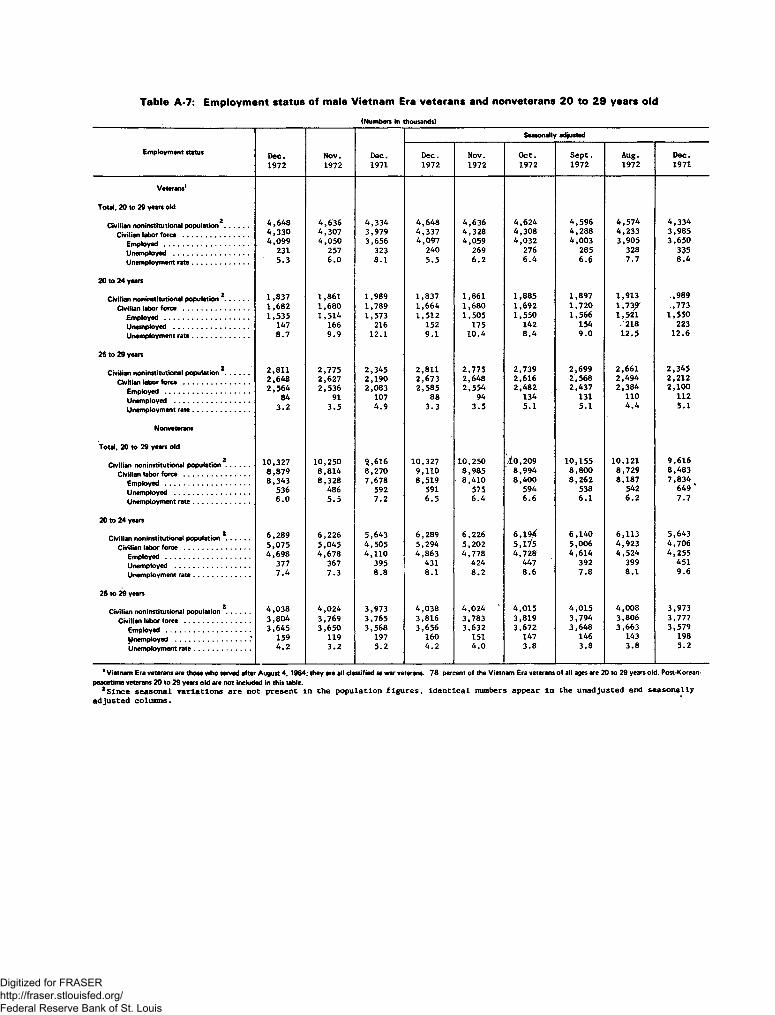
Table A>7: Employment status of male Vietnam Era veterans and nonveterans 20 to 29 years old
(Numbers in thousands)
Seasonally adjusted
Employment status D e c. N ov. D ec. D e c . N ov. O c t . S e p t . A ug. D e c .1972 1972 1971 1972 1972 1972 1972 1972 1971
Veterans'
Total, 20 to 29 years old
Civilian noninstitutional population2 ............. 4 ,6 4 8 4 ,6 3 6 4 ,3 3 4 4 ,6 4 8 4 ,6 3 6 4 ,6 2 4 4 ,5 9 6 4 ,5 7 4 4 ,3 3 44 ,3 3 0 4 ,3 0 7 3 ,9 7 9 4 ,3 3 7 4 ,3 2 8 4 ,3 0 8 4 ,2 8 8 4 ,2 3 3 3 ,9 8 54 ,0 9 9 4 ,0 5 0 3 ,6 5 6 4 ,0 9 7 4 ,0 5 9 4 ,0 3 2 4 ,0 0 3 3 ,9 0 5 3 ,6 5 0
Unemployed .......................................... 231 257 323 240 269 276 285 328 3355 .3 6 .0 8 .1 5 .5 6 .2 6 .4 6 .6 7 .7 8 .4
20 to 24 years
Civilian noninstitutional population 2 ........... 1 ,8 3 7 1 ,8 6 1 1 ,9 8 9 1 ,8 3 7 1 ,8 6 1 1 ,8 8 5 1 ,8 9 7 1 ,9 1 3 .,9 8 9
Civilian labor force ..................................... 1 ,6 8 2 1 ,6 8 0 1 ,7 8 9 1 ,6 6 4 1 ,6 8 0 1 ,6 9 2 1 ,7 2 0 1 ,7 3 ^ .,7 7 3E m p loyed ............................................... 1 ,5 3 5 1 ,5 1 4 1 ,5 7 3 1 ,5 1 2 1 ,5 0 5 1 ,5 5 0 1 ,5 6 6 1 ,5 2 1 1 ,5 5 0Unemployed . ..................................... 147 166 216 152 175 142 154 /2 1 8 223Unemployment rate................................ 8 .7 9 .9 1 2 .1 9 .1 1 0 .4 8 .4 9 .0 1 2 .5 1 2 .6
25 to 29 years
Civilian noninstitutional population2.............Civilian Immi .....................
2 ,8 1 12 ,6 4 8
2 ,7 7 52 ,6 2 7
2 ,3 4 52 ,1 9 0
2 ,8 1 12 ,6 7 3
2 ,7 7 52 ,6 4 8
2 ,7 3 92 ,6 1 6
2 ,6 9 92 ,5 6 8
2 ,6 6 12 ,4 9 4
2 ,3 4 52 ,2 1 2
E m ployed ...............................................Unemployed ..........................................Unemployment rate................................
2 ,5 6 4 2 ,5 3 6 2 ,0 8 3 2 ,5 8 5 2 ,5 5 4 2 ,4 8 2 2 ,4 3 7 2 ,3 8 4 2 ,1 0 084
3 .291
3 .51074 .9
8 83 .3
943 .5
1345 .1
1315.1.
1104 .4
1125 .1
Nonveterans
Total, 20 to 29 years old
Civilian noninstitutional population2. ........... 1 0 ,3 2 7 1 0 ,2 5 0 3 ,6 1 6 1 0 ,3 2 7 1 0 ,2 5 0 /10 ,2 0 9 1 0 ,1 5 5 1 0 ,1 2 1 9 ,6 1 6
Civilian labor force ..................................... 8 ,8 7 9 8 ,8 1 4 8 ,2 7 0 9 ,1 1 0 8 ,9 8 5 8 ,9 9 4 8 ,8 0 0 8 ,7 2 9 8 ,4 8 3
E m ployed ...............................................Unemployed ..........................................
8 ,3 4 3 8 ,3 2 8 7 ,6 7 8 8 ,5 1 9 8 ,4 1 0 8 ,4 0 0 8 ,2 6 2 8 ,1 8 7 7 ,8 3 4536 486 592 591 575 594 538 542 6 49 *
Unemployment rate................................ 6 .0 5 .5 7 .2 6 .5 6 .4 6 .6 6 .1 6 .2 7 .7
20 to 24 years
Civilian noninstitutional population 2 ........... 6 ,2 8 9 6 ,2 2 6 5 ,6 4 3 6 ,2 8 9 6 ,2 2 6 6 ,1 9 .4 6 ,1 4 0 6 ,1 1 3 5 ,6 4 3
Civilian lahor force ..................................... 5 ,0 7 5 5 ,0 4 5 4 ,5 0 5 5 ,2 9 4 5 ,2 0 2 5 , r / 5 5 ,0 0 6 4 ,9 2 3 4 ,7 0 6
Employed ............................................... 4 ,6 9 8 4 ,6 7 8 4 ,1 1 0 4 ,8 6 3 4 ,7 7 8 4 ,7 2 8 4 ,6 1 4 4 ,5 2 4 4 ,2 5 5Unemployed .......................................... 377 367 395 431 424 447 392 399 451Unemployment rate............................... 7 .4 7 .3 8 .8 8 .1 8 .2 8 .6 7 .8 8 .1 9 .6
25 to 29 years
Civilian noninstitutional population 2 ........... 4 ,0 3 8 4 ,0 2 4 3 ,9 7 3 4 ,0 3 8 4 ,0 2 4 ’ 4 ,0 1 5 4 ,0 1 5 4 ,0 0 8 3 ,9 7 3Civilian labor force ..................................... 3 ,8 0 4 3 ,7 6 9 3 ,7 6 5 3 ,8 1 6 3 ,7 8 3 3 ,8 1 9 3 ,7 9 4 3 ,8 0 6 3 ,7 7 7
E m ployed ............................................... 3 ,6 4 5 3 ,6 5 0 3 ,5 6 8 3 ,6 5 6 3 ,6 3 2 3 ,6 7 2 3 ,6 4 8 3 ,6 6 3 3 ,5 7 9Unemployed ....................................... .* 159 119 197 160 151 147 146 143 198Unemployment rate............................. 4 .2 3 .2 5 .2 4 .2 4 .0 3 .8 3 .8 3 .8 5 .2
1 Vietnam Era veterans are those who served after August 4,1964; they are all classified as war veterans. 78 percent of the Vietnam Era veterans o f all ages are 20 to 29 years old. Post-Korean- peacetime veterans 20 to 29 years old are not included in this table.
2Since seasonal variations are not present in the population figures, identical numbers appear in the unadjusted and seasonally adjusted columns.
Digitized for FRASER http://fraser.stlouisfed.org/ Federal Reserve Bank of St. Louis

Table B-1: Employees on nonagricultural payrolls, by industry
(la thousands)
Industry Dec.19?2P
Nov.1972p
Oct.1972
Dec.1971
Change fromSeasonally adjusted
Dec.-1972P
Nov.1972p
Oct.1972
Change fromNov.1972
Nov.1972
Dec.1971
T O T A L ................................................ 74, 643 74, 413 74,118 72, 039 230 2, 604 73, 892 73, 868 73, 589 24
GOODS-PRODUCING..................... 23, 328 23, 649 , 23, 750 22,515 -321 813 23, 404 23, 459 23, 397 -55
MINING.......................................... ' 599 607 609 607 -8 -8 603 609 610 -6
CONTRACT CONSTRUCTION......... 3, 366 3, 635 3, 782 3, 388 -269 -22 3,445 3, 529 3, 568 -84
MANUFACTURING.......................... 19, 363 19,407 19, 359 18, 520 -44 843 19, 356 19,321 19,219 35Production workers............... 14, 237 14, 274 14, 225 13, 467 -37 770 14,218 14, 183 14, 083 35
DURABLE GOODS............... 11,249 11, 227 11,165 10,558 22 691 . 11, 240 11, 191 11,127 49Production workers................ 8,256 • 8,235 8, 173 7, 622 21 634 8, 239 8, 198 8, 131 41
Ordnance and accessories............. 191. 2 194. 7 190.5 184. 3 • -3 . 5 6 .9 190 193 191 -3Lumber and wood products.............. 614.3 621. 1 623. 1 593. 2 -6 .8 21. 1 622 622 616 0Furniture and fixtures................... 513.3 512.4 508.6 477.6 .9 35. 7 509 506 503 3Stone, clay, and glass products . . 665.9 676. 2 679.4 632.6 -10. 3 33.3 672 674 673 -2Primary metal industries.............. 1, 267. 7 1, 261. 6 1,255.0 1, 172. 0 6. X 95.7 1,281 1, 281 1,279 0Fabricated metal products.............. 1, 412.0 1,411. 6 1, 403. 0 1, 338. 2 .4 73. 8 1, 402 1,399 1, 392 3Machinery, except electrical *« •. . 1, 943.4 1, 918. 2 1, 899. 4 1, 803. 5 25. 2 139.9 1,949 1. 932 1, 915 17Electrical equipment . . . . . . . . . 1, 920. 1 1, 904.2 1, 889.4 1, 785. 7 15.9 134.4 1, 912 1, 889 1, 882 23Transportation equipment . . . . . . 1, 812.4 1, 808. 7 1, 801. 6 1, 721. 7 3. 7 90. 7 1, 794 1, 793 1, 782 1Instruments and related products . 474. 1 471. 5 466.4 440. 1 2. 6 34. 0 472 471 466 1Miscellaneous manufacturing. . . . 434. 4 446. 9 448. 9 409.4 -12. 5 25.0 437 431 428 6
NONDURABLE GOODS .................... 8, 114 8, 180 8, 194 7, 962 -66 152 8, 116 8, 130 8, 092 -14Production workers............. 5, 981 6,039 6, 052 5, 845 -58 136 5, 979 5, 985 5, 952 -6
Food and kindred products........... 1, 712. 9 1, 766. 7 1, 815. 3 1, 738. 7 -53* 8 -2 5 .8 1, 728 1, 746 1, 742 -18Tobacco manufactures................... 71.6 76. 7 76. 6 76. 2 -5. 1 -4. 6 68 71 66 -3Textile mill products..................... 1, 018. 8 1, 012. 8 1, 003.2 971. 9 6.0 46. 9 1,016 1, 009 1, 002 7Apparel and other textile products 1, 347. 3 1, 361. 5 1, 356. 8 1, 327. 9 -14 .2 19.4 1, 350 1, 3§1 1, 342 -1Paper and allied products............. 709. 3 710. 1 705. 6 689. 9 -. 8 19.4 705 707 707 -2Printing and publishing . . . . . . . 1, 091. 9 1, 093. 4 1, 088.4 1, 074. 6 - l l 5 17.3 1, 085 1,089 1,086 -4Chemicals and allied products. . . 1,012. 8 1 ,010.5 1, 007. 8 995. 1 2 .3 17. 7 1, 017 1, 014 1, Oil 3Petroleum and coal products . . . . * 189.0 188. 9 189. 7 189. 3 . 1 - .3 191 189 189 2Rubber and plastics products, nec 659.4 655. 5 647. 4 596. 5 3. 9 62. 9 657 652 643 5Leather and leather products . . . . 300. 7 303. 9 302. 8 302. 3 -3 .2 -1 .6 299 302 304 -3
SERV ICE-PRO D U CIN G ................... 51, 315 50, 764 50, 368 49, 524 551 1, 791 50, 488 50, 409 50, 192 79
TRANSPORTATION AND PUBLICU T IL IT IE S ................................... 4,551 4, 555 4, 549 4, 432 -4 119 4, 551 4, 550 4, 540 1
WHOLESALE AND RETAIL TRADE. 16, 634 16, 143 15, 887 16, 061 491 573 15, 914 15, 935 15, 835 -21WHOLESALE TR A D E ............. 4, 002 3, 988 3, 982 3, 867 14 135 3, 974 3, 960 3, 954 14RETAIL T R A D E ................. 12,632 12,155 11, 905 12, 194 477 438 11, 940 11, 975 11, 881 -35
FINANCE, INSURANCE, ANDREAL E S T A T E ............................ 3, 962 3, 965 3, 957 3, 836 -3 126 3, 982 3, 981 3, 969 1
SE R V IC E S ..................................... 12, 469 12,476 12, 463 11, 970 -7 499 12, 544 12,501 12, 451 43
GOVERNMENT ............................... 13, 699 13, 625 13, 512 13,225 74 474 13, 497 13, 442 13, 397 55FEDERAL .................... 2, 657 2, 631 2, 627 2, 684 26 -27 2, 640 2, 642 2, 630 -2STATE AND LOCAL........... 11, 042 10,994 10, 885 10, 541 48 501 10, 857 10, 800 10, 767 57
p * preliminary.
Digitized for FRASER http://fraser.stlouisfed.org/ Federal Reserve Bank of St. Louis

Table B-2: A v e ra ge w eekly hours of production or nonsupervisory w o rke rs1on private non agricu ltu ra l p a y ro lls , by industry
Industry Dec. _ 1972 p
Nov. 1972 p
Oct.1972
Dec. . 1971
Change from- Seasonally adjusted
Dec. _ 1972 p
Nov. 1972 p
Oct.1972
Change from Nov. 1972
Nov.1972
Dec.1971
TOTAL PRIVATE............................. 37.4 37. 1 37. 3 37. 3 0. 3 0. 1 37.2 37.2 37.3 0 .0
MINING.......................................... 41 .9 42 .6 42 .9 42.7 - .7 - . 8 41 Jo 42 .6 42 .6 -1 .0
CONTRACT CONSTRUCTION.......... 35.2 36. 0 38.2 36.4 - . 8 -1 .2 35.6 37.0 37.6 -1 .4
MANUFACTURING.......................... 41.5 41 .0 40. 8 40 .7 .5 . 8 4,1.0 40 .9 40 .7 . 1Overtime hours.......................... 4 .0 3.9 3 .8 3.2 .1 .8 3 .8 3 .8 3.6 0
DURABLE GOODS............... 42 .4 41. 8 41. 5 41 .4 .6 1 .0 41 .9 41 .7 41 .4 .2Overtime h o u rs ...................... 4. 3 4. 1 4 .0 3.2 .2 1.1 4 .1 4 .0 3. 8 . 1
Ordnance and accessories........... 43. 8 42 .4 42 .4 42 .4 1.4 1.4 43 .3 42 .3 42 .4 1.0Lumber and wood products............ 39.9 40 .8 41 .4 40. 8 - .9 - .9 39 .8 40 .9 41. 1 -1 .1Furniture and fix tu re s ..................... 40 .7 40 .9 40. 8 40 .9 - .2 - .2 39 .8 40 .5 40 .2 - .7Stone, clay, and glass products . . 41 .8 41 .9 42.5 41 .6 - . 1 .2 4 1 .8 4 1 .8 42 .2 0Primary metal in d u str ies ............... 44. 1 42.4 41 .7 41 .0 1.7 3. 1 4 4 .0 42 .9 42 .3 1. 1Fabricated metal products............... 42 .2 41.7 41.5 41.3 .5 .9 4 1 .8 41 .6 41 .3 .2Machinery, except electrical . . . . 43 .5 42 .7 42. 3 41 .9 .8 1.6 4 2 .8 42 .7 42 .3 . 1Electrical equipment........................ 40 .9 41.1 40. 8 40. 8 - .2 . 1 40 .3 4 0 .8 40 .6 - .5Transportation equipment............... 44 .6 42.5 42 .0 42.5 2. 1 2 .1 43 .6 42 .0 41 .5 1.6Instruments and related products . 41.1 40 .9 40. 7 40. 8 .2 . 3 40 .7 40 .5 40 .6 .2Miscellaneous manufacturing. . . . 39.7 39.7 39.5 39.5 0 .2 39.4 39.3 39.2 . 1
NONDURABLE GOODS .................... 40 .2 40 .0 39. 8 39.8 .2 . 4 39.9 39.9 39.7 0Overtime hours.......................... 3.5 3.6 3.6 3.1 1 . 4 3 .4 3.5 3 .4 - . 1
Food and kindred produ cts............ 40 .9 40.5 40 .4 40 .6 . 4 . 3 40 .6 4 0 .4 4 0 .4 .2Tobacco manufactures..................... 33.9 35.0 36. 8 36.1 -1 .1 -2 .2 3 3 . 3 35.0 35 .8 -1 .7Textile mill products........................ 41 .9 41.7 41 .4 41.5 .2 . 4 41 .4 41 .4 41 .2 0Apparel and other textile products 36.3 36.4 36.2 35.9 - . 1 . 4 36.3 36.2 36.2 . 1Paper and allied products........... 43 .7 43. 3 43. 1 42. 8 . 4 .9 43 .3 43 .2 42 .9 . 1Printing and pu blish ing ............. 38.4 38.3 38.0 38.0 . 1 . 4 37.9 38.3 38.0 - . 4Chemicals and allied products. . . 42 .5 41 .9 42 .0 41 .9 .6 .6 42 .2 4 1 .8 42 .0 . 4Petroleum and coal products . . . . 42 .9 42.3 42 .7 42.3 .6 .6 43 .2 42 .2 42 .4 1 .0Rubber and plastics products, nec 41.5 41.7 41 .4 41 .2 - .2 . 3 41.1 41 .6 41 .2 - .5Leather and leather products,. . . . 37.5 38.0 37.5 38. 8 - .5 -1 . 3 36.7 37 .8 37.7 -1 .1
TRANSPORTATION AND PUBLICU T IL IT IE S ................................... 40 .5 40.3 40. 6 40.6 .2 - . 1 40 .3 40.1 40 .4 . 2
WHOLESALE AND RETAIL TRADE. 35.4 34.7 34. 9 35.5 .7 - . 1 35.2 35.0 35.1 . 2
WHOLESALE TR A D E ....................... 40.1 39.8 39. 8 40.2 .3 - . 1 39.7 39.9 39 .8 - . 2RETAIL T R A D E .............................. 34.0 33.2 3 3 . 3 34.1 .8 - . 1 33 .8 33.5 33.5 . 3
FINANCE, INSURANCE, ANDREAL E S T A T E ............................ 37. 1 37.1 37. 3 37.0 0 . 1 37.1 37. 1 37.3 0
S E R V IC E S ..................................... 34. 1 34.0 34. 1 34.2 . 1 - . 1 34.1 34.1 34.2 0
JData relate to production workers in mining and manufacturing: to construction workers in contract construction: and to nonsupervisory' workers in traieportation and public utilities; wholesale and retail trade; finance, insurance, and real estate; and services. These groups account for approximately fair-fifths o f the total employment on private nonagricultural payrolls.
p = preliminary.
Digitized for FRASER http://fraser.stlouisfed.org/ Federal Reserve Bank of St. Louis

Tab le B-3: A verage hourly and w eekly e arn in gs of production or no n su p e rv iso ry w orkerson private no n agricu ltu ra l payro lls, by industry
Industry
Average hourly earnings Average weekly earnings
Dec.1972p
Nov.1972P
Oct.1972
Dec.1971
Change from Dec.1972P
Nov.1972p
Oct.1972
Dec.1971
Change fromNov.1972
Dec.1971
Nov.1971
Dec.1971
TOTAL PRIVATE........................... $3. 73 $3. 73 $3. 74 $3. 52 $0. 00 $0. 21 $139. 50 $138. 38 $139. 50 $131. 30 $1. 12 $8. 20Seasonally adjusted........................ 3. 74 3. 73 3. 73 3. 53 .01 .21 139. 13 138. 76 139. 13 130.96 . 37 8. 17
MINING.............. ......................... 4.53 4. 46 4.41 4 .28 .07 .25 189. 81 190.00 189. 19 182.76 -. 19 7.05
CONTRACT CONSTRUCTION------ 6.29 6. 23 6. 22 5. 90 .0 6 .3 9 -221.41 224. 28 237. 60 214.76 -2 . 87 6. 65
MANUFACTURING........................ 3. 95 3. 89 3. 86 3.69 .06 .26 163.93 159. 49 157.49 150. 18 4. 44 13. 75
DURABLE GOOOS.............. 4.21 4. 14 4. 11 3.92 .0 7 .29 178. 50 173.05 170. 57 162.29 5.45 16. 21
Ordnance and accessories........... 4. 18 4. 13 4. 13 3. 98 .05 .20 183.08 175.11 175.11 168. 75 7. 97 14. 33Lumber and wood products........... 3. 35 3. 40 3.37 3. 19 -.0 5 . 16 133. 67 138. 72 139.52 130.15 -5 .05 3. 52Furniture and fixtures................ 3. 14 3. 12 3. 12 2. 98 .02 . 16 127. 80 127. 61 127. 30 121. 88 . 19 5. 92Stone, clay, and glass products . 4. 01 4. 00 4. 02 3. 74 .01 .2 7 167. 62 167. 60 170. 85 155. 58 .02 12. 04Primary metal industries........... 4. 85 4. 79 4. 74 4.49 .06 .3 6 213. 89 203.10 197. 66 184.09 10. 79 29. 80Fabricated metal products........... 4. 12 4.07 4. 05 3. 86 .05 .26 173. 86 169.72 168.08 159. 42 4. 14 14. 44Machinery, except electrical . . . 4. 43 4.37 4. 35 4. 15 .0 6 .2 8 192.71 186. 60 184.01 173. 89 6. 11 18. 82Electrical equipment................... 3. 79 3. 73 3. 71 3. 58 .0 6 .21 155.01 153. 30 151.37 146. 06 1. 71 8. 95Transportation equipment........... 4. 98 4. 87 4. 81 4. 59 . 11 .39 222.11 206. 98 202.02 195.08 15. 13 27.03Instruments and related products 3. 77 3. 75 3. 73 3. 61 .02 . 16 154. 95 153.38 151.81 147.29 1.57 7. 66Miscellaneous manufacturing. . . 3. 20 3. 16 3. 13 3. 06 .0 4 . 14 127. 04 125.45 123.64 120. 87 1.59 6. 17
NONDURABLE GOODS .................... 3. 57 3. 54 3. 52 3. 37 . 03 .20 143.51 141. 60 140. 10 134. 13 1.91 9. 38
Food and kindred products . . . . 3. 73 3. 66 3. 63 3. 52 . 07 .21 152.56 148.23 146.65 142. 91 4. 33 9. 65Tobacco manufactures................ 3. 57 3. 48 3. 38 3.29 .0 9 .2 8 121.02 121. 80 124. 38 118.77 -. 78 2. 25Textile mill products................... 2. 83 2. 78 2. 76 2. 62 .05 .21 118.58 115. 93 114.26 108. 73 2. 65 9. 85Apparel and other textile products 2. 68 2. 68 2. 67 2. 54 0 . 14 97. 28 97.55 96. 65 91. 19 -. 27 6.09Paper and allied products........... 4. 06 4. 03 4. 02 3. 80 . 03 .26 177. 42 174.50 173.26 162.64 2.92 14. 78Printing and publishing.............. 4. 56 4. 57 4.55 4. 36 -. 01 .20 175. 10 175. 03 172.90 165. 68 . 07 9. 42Chemicals and allied products. . 4. 33 4.29 4. 28 4. 06 . 04 .2 7 184. 03 179. 75 179. 76 170.11 4. 28 13. 92Petroleum and coal products . . . 5. 03 5. 01 5. 01 4. 64 . 02 .3 9 215. 79 211.92 213. 93 196. 27 3. 87 19. 52Rubber and plastics products, nec 3. 71 3.69 3. 69 3. 51 . 02 . 20 153.97 153. 87 152.77 144. 61 . 10 9. 36Leather and leather products. . . 2. 73 2. 73 2. 72 2. 65 0 . 08 102. 38 103. 74 102.00 102. 82 -1. 36 -. 44
TRANSPORTATION AND PUBLICU T IL IT IE S ................................. 4. 82 4. 81 4. 80 4. 40 . 01 .42 195. 21 193. 84 194. 88 178. 64 1. 37 16. 57
WHOLESALE AND RETAIL TRADE 3. 06 3. 07 3. 06 2. 91 -.01 . 15 108. 32 106.53 106. 79 103. 31 1. 79 5.01
WHOLESALE T R A D E ............ 3. 99 3. 95 3. 93 3. 78 .0 4 . 21 160.00 157. 21 156.41 151. 96 2. 79 8. 04RETAIL T R A D E ............... 2. 73 2. 75 2. 74 2.61 -.0 2 . 12 92. 82 91. 30 91.24 89. 00 1.52 3. 82
FINANCE, INSURANCE, ANDREAL E S T A T E .......................... 3.51 3.48 3. 48 3. 34 .03 . 17 130.22 129. 11 129. 80 123. 58 1. 11 6. 64
S E R V IC E S ................................... 3. 26 3.25 3. 24 3. 09 .01 . 17 111. 17 110.50 110.48 105.68 . 67 5.49
*See footnote 1, table B~2. p * preliminary.
Digitized for FRASER http://fraser.stlouisfed.org/ Federal Reserve Bank of St. Louis

Table B-4. Hourly Earnings Index for production or nonsupervisory workers in private nonfarm industries, seasonally adjusted
Sept.1972
Aug.1972
July1972
Dec.1971
Percent change over month and year
Industry Dec.p1972
Nov.P1972
Oct.1972 Nov. 1972-
Dec. 1972Dec. 1971- Dec. 1972
Total private nonfarm:
Current dollars........................................... U 1.9 140.7 140.5 139.3 138.3 137.8 133.6 .9 6.2
Constant (1967) dollars ........................... NA 110.8 111.0 110.4 110.1 110.0 108.6 -1/ 2 /
Mining.............................................................. L U .3 137.8 137.5 138.1 137.8 137.3 132.8 2.5 6.4
Contract construction.................................... 152.1 149.9 149.3 147.8 U 6.8 145.6 142.2 1.5 7.0
Manufacturing................................................. 139.4 137.8 137.5 136.7 135.9 135.3 131.3 1.2 6.2
Transportation and public utilities................ 149.1 148.5 148.3 145.6 145.1 144.0 136.0 .4 9.6
Wholesale and retail trade ............................. 138.3 137.2 137.2 136.3 135.6 135.3 131.7 .8 5.0
Finance, insurance, and real estate ............. 136.2 135.0 135.5 134.8 133.6 133.9 129.5 .9 5.2
Services............................................................ 142.0 141.1 140.9 . 139.9 138.0 138.0 ' 134.6 .7 5.5
1/ Percent change was-0.2 from October 1972 to November 1972, 2/ Percent change was 3.1 from November 1971 to November 1972, NA Indicates data are not available. p>Preliminary.
the latest D.onth available, the latest month available.
TOTE: All series are in current dollars except where indicated. The index excludes e ffects o f two types o f changes that areunrelated to underlying wage-rate developments: Fluctuations in overtime premiums in manufacturing (the only sector for whichovertime data are available) and the effects o f changes in the proportion o f workers in high-wage and low-wage industries. The seasonal adjustment eliminates the e ffe ct o f changes that normally occur at the same time and in about the same magnitude each year.
Digitized for FRASER http://fraser.stlouisfed.org/ Federal Reserve Bank of St. Louis

LABOR FORCE. EMPLOYMENT > UNEMPLOYMENTHOUSEHOLD DATA - SEASONALLY ADJUSTED
1. LABOR FORCE AND EMPLOYMENT____ civilian labor force.... TOTAL EMPLOYMENT____ nonagricultural employment
THOUSANOS
1963 1964 196S 1966 196*7 1966 1969 19*70 19*71 19*76
2. TOTAL EMPLOYMENT____ AOULT MEN.... AOULT WOMEN____ TEENAGERS
THOUSANOS
1963 1964 196S 1966 196*7 1966 1969 19*70 19*71 1972
3. UNEMPLOYMENT____ ALL CIVILIAN WORKERS.... FULL-TIME WORKERS____ HARRIED MEN
THOUSANOS
4. UNEMPLOYMENTAOULT MEN AOULT WOMEN TEENAGERS
THOUSANOS2250
21900
1750
1500
1250
1000
750
1963 1964 1965 1966 196*7 1968 1969 19*70 19*71 1972 1963 1964 1965 1966 1967 1966 1969 1970 1971 19725 0 0
Digitized for FRASER http://fraser.stlouisfed.org/ Federal Reserve Bank of St. Louis

UNEMPLOYMENT RATESHOUSEHOLD DATA - SEASONALLY ADJUSTED
5. UNEMPLOYMENT RATES 6. UNEMPLOYMENT RATESALL CIVILIAN WORKERS STATE INSURED « MARRIED MEN
TEENAGERS AOULT WOMEN ADULT MEN
PERCENT7 .0
6.0
5 .0
4 .0
3 . 0
2.0
1 .01963 1964 1965 1966 1 967 I 9 6 0 1 96 9 197 0 1971 1972
7. UNEMPLOYMENT RATES 8. UNEMPLOYMENT RATES
NEGRO ANO OTHER RACES WHITE
PART-TIME WORKERS FULL-TIME WORKERS
1 96 3 1964 1 965 1966 1967 1968 1 96 9 1 97 0 1971 1972 1 963 1 964 1 965 1 966 196 7 I 9 6 0 1 96 9 1 97 0 1971 1972
• State insured unemployment rate pertains to the week including the 12th of the month and represents the insured unemployed under State programs as a percent of average covered employment. The figures are derived from administrative records of unemployment insurance
systems.Digitized for FRASER http://fraser.stlouisfed.org/ Federal Reserve Bank of St. Louis

UNEMPLOYMENTHOUSEHOLD DATA - SEASONALLY ADJUSTED
9. UNEMPLOYMENT RATES____ BLUE COLLAR WORKERS____ SERVICE WORKERS.... WHITE COLLAR WORKERS
PERCENT
1 963 1964 196S 1 966 196*7 1 960 1 969 1 97 0 1971 1972
10. UNEMPLOYMENT RATES____ CONSTRUCTION... MANUFACTURING
PERCENT
1 96 3 1964 1 96 5 1966 1 967 1 968 196 9 1 9 7 0 1971 1972
11. AVERAGE DURATION OF UNEMPLOYMENT
1963 1964 1965 1966 1967 1968 1969 1970 1971 1972
12. UNEMPLOYMENT BY REASON____ JOB LOSERS.... REENTRANTS.... NEW ENTRANTS____ JOB LEAVERS
1967 1968 1969 1970 1971 1972
3 0 0 0
2 5 0 0
2000
1S00
1000
50 0
0
Digitized for FRASER http://fraser.stlouisfed.org/ Federal Reserve Bank of St. Louis

NONflGRI CULTURAL EMPLOYMENT AND HOURSESTABLISHMENT DATA - SEASONALLY ADJUSTED
13. EMPLOYMENT____ TOTAL NONAGRI CULTURAL.... SERVICE-PRODUCING.... GOODS-PROOUCING____ MANUFACTURING
THOUSANDS
1 96 3 1 964 1 96 5 1 966 1 967 196 6 196 9 1 9 7 0 1971 1972
14. MAN-HOURS___ TOTAL PRFVRTE NONAGRICULTURAL___ PRIVATE SERVICE-PRODUCING
GOOOS-PROOUCING____ MANUFACTURING
1 96 3 1 964 196 5 196 6 1 967 1 96 8 1 9 6 9 1 97 0 1971 1972
2000
1750
1500
125 0
1000
7 5 0
500
2 5 0
15. AVERAGE WEEKLY HOURS 16MANUFACTURING TOTAL PRIVATE
HOURS4 2 . 0
41 . 0
4 0 . 0
3 9 . 0
3 8 . 0
3 7 . 0
3 6 . 0
AVERAGE WEEKLY OVERTIME HOURS IN MANUFACTURING
1 963 1964 1 96 5 1 96 6 1967 1 96 6 1 9 6 9 1 97 0 1971 1972
N O TE: Charts 14 and 15 relate to production or nonsupervisory workers; chart 16 relates to production workers. Data for the 2 most recent months are preliminary in charts 13*16.
Digitized for FRASER http://fraser.stlouisfed.org/ Federal Reserve Bank of St. Louis

VETERANS AND NONVETERANS, 20-29 YEARS HOUSEHOLD DATA - SEASONALLY ADJUSTEO
17. CIVILIAN LABOR FORCE 18. EMPLOYED
VIETNAM ERR VETERANS NONVETERRNS
1 969 1 9 7 0 1971 1972
10000
7 5 0 0
50 0 0
2 5 0 0
0
VIETNAM ERR VETERANS NONVETERRNS
1969 1 9 7 0 1971 1 972
10000
7 5 0 0
5 0 0 0
2 5 0 0
0
19. UNEMPLOYED 20. UNEMPLOYMENT RATE
____ VIETNAM ERR VETERANS.... NONVETERRNS
THOUSRNOS800
700
6 0 0
500
400
300
200
100
01969 1970 1971 1972
VIETNAM ERR VETERANS NONVETERRNS
1969 1970 1971 1972
1 2 . 5
10 .0
7 . 5
5 . 0
2 . 5
Digitized for FRASER http://fraser.stlouisfed.org/ Federal Reserve Bank of St. Louis