blue chip share in bangladesh.. (premier university)
DESCRIPTION
In Bangladesh, there is no name called blue chip share.. "A" category share is called blue chip share....actually we have prepared this report on the basis of CSE 30 and DSE 20 listed companies. we have analyzed this topic and have shown the future of blue chip share in Bangladesh... its a very new topic ..no other university students have prepared any report on this topic.. we are first.. we have tried our level best to show the present situation of blue chip share in Bangladesh..TRANSCRIPT

A REPORT ON
Blue Chip Share in Bangladesh
Submitted to
Mrs. Tanbina Tabassum
Lecturer of Finance,
Premier university, Chittagong
Submitted by:
Section A
Department of Finance& Banking
Serial No. Name ID no Program
01. MunMun Dev Nath 0816112271 BBA
02. Susmita Sen 0816112275 BBA
03. Sudeshna Das 0816112280 BBA
04. Farjana Karim 0816112289 BBA
05. Prasenjit Roy Chowdhury 0816112308 BBA

Table Of Contents
Serial no. Particulars1 Letter of transmittal
2 Acknowledgement
3 Objectives of the study, scope of the study, limitation of the study, Data collection, Data analysis.
4 Overview of the SEC5 Discussion about CSE.
CSE initiatives in market development
CSE imitative in expansion
6 Potential of capital market in Bangladesh7 Expansion of the Capital Market and Its
Future:
8 Share Categorization: A, B, G, N & Z
9 Criteria for Share Categorization: A, B, G, N &
Z
10 What is blue chip stock?11 Features of blue chip stocks12 How to invest in blue chip stocks13 Feature of blue chip company14 History15 Blue chip shares in Bangladesh
16 CSE-30, Criteria for a Selective Index.
17 Stock market index
18 How to calculate stock market index
19 DSE-20

20
21 SECTOR WISE SELECTED 30 SHARES IN
CSE:
22 Analysis of stocks23 Analysis of 10 companies & results24 Beta factors analysis25 Benefits of blue chip shares26 Disadvantages of blue chip shares27 Futures of blue chip shares28 Misconceptions29 Suggestions30 Conclusion
31 Bibliography

Letter of transmittal
A Report on blue chip share.
June 24.06.12
Mrs. Tanbina Tabassum
Department of Finance & Banking
Premier University
Subject: Submission of the Report.
Honorable Madam,
It is our great pleasure to submit the report titled `Report on Blue chip shares in Bangladesh to you.
We have prepared this report, as a part of the course Money and Capital Market. To make this
report up to the standard we tried our best to fulfill the requirements by implementing the
knowledge we have gather from the course. Thank you very much for providing us this type of
opportunity and giving us the necessary guidance and direction needed for preparing the
report.We have tried our level best to make this report holistic and informative enough. Besides
this,there may be some shortcomings. I would be grateful if you consider those from excusable
point.
Sincerely yours
MunMun Dev Nath
Susmita Sen
Sudeshna Das
Farjana Karim
Prasenjit Roy Chowdhury
Batch16, 8th Semester Section #A
Department of Finance and Banking
Premier University
At first we want to express our great gratitude to our honorable Teacher to give us such a good topic for making a assignment. She gave us her helpful hand to do this assignment. Her class lecture & advice help us to prepare our assignment very much which was very fruitful to us. So we are grateful to her.
.At the very beginning, a special note of acknowledgement is due to our course teacher, Mrs Tanbina tabassum, for giving us the permission to prepare the report on this topic. She was very generous and friendly toward us while conducting the course and was the person who has guided us throughout preparing the report. Her teaching method was really effective and interesting.
We would like to thank God for keeping everything on right track. Finally, we would like to thank our parents and friends without whose support it was impossible for us to complete the project.
We are-
Intake: 8th semester
Section: A
Program: BBA
Department of Finance and Banking
Premier University

Blue chip companies are usually financially sound and are thought to be relatively low-risk
investments. They tend to be less volatile than other companies and to provide
solid growth to portfolios. Similarly, the stocks of blue-chip companies are highly valued due to
their consistent financial soundness. A regular dividend is expected from blue-chip stocks even
in bad financial times in the stock market. Due to stock market crash now investors are very
much worried about price volatility so that they are searching low risky shares so blue chip
shares will be suitable for investors. Day by day popularity of blue chip shares are increasing
because of their performance. For Investors who are fully depend on share market blue chip
shares create opportunities for increasing their earning profits by creating scope of low risk
investments. We have analyzed 10 blue chip companies in our report.

DEDICATION
We would like to dedicate all of our efforts to complete this report to our beloved parents and
respected teacher MrsTanbinaTabassum..

OBJECTIVES OF THE STUDY
The main objective to prepare this report is to know about the blue chip shares in stock market by taking CSE as
base. In order to achieve the main objective I have to considersome specific and vital objectives which are given
below:
To highlight the position of blue chip share in Bangladesh.
To analyze the benefit of blue chip share
To evaluate the impact of blue chip share in Bangladesh economy
To evaluate the behavior of investors in blue chip share
To identify the problems and prospects associated with blue chip share in Bangladesh.
SCOPE OF THE STUDY
This report is prepared on the basis of CSE-30 and DSE-20. It shows the practical situations about blue chip
shares prevailed in the stock market. The investors will get practical knowledge and idea about the benefits of the
blue chip shares and will be able to determine the best way to employ their capital. The study extends to cover the
price changes ,dividend policy,issued capital,Beta analysis,EPS,price earnings ratio and price risk (volatility) of
few CSE and DSE listed companies. To illustrate the recent affect we used the data for the year of 2009, 2010 and
2011.

LIMITATION OF THE STUDY
Information is the primary prerequisite to prepare a good report. Information’s are not rich
enough or many update data are not available in the market. The report deals with some CSE and DSE listed
companies, but not in detail. To show the present situations of blue chip in Bangladesh we used most of our
practical knowledge but if the data about blue chip share were available we could practically learn theirinfluence
on the price volatility of stock market. The limitation of the study at a glance:
In Bangladesh, there have no share named blue chip share
Time constraints
all data are not available for all users
complex calculation method
METHODOLOGY OF THE STUDY
All the information provided in this report has been collected through 3 stages.
Data collection
Data analysis
DATA COLLECTION
Data has been collected directly from the brokerage house and CSE CSE Bazar Parikrama, CSE website and
company annual reports.
DATA ANALYSIS
Data has been analyzed with the help of the mathematical and graphical expressions. In the report we have
analyzed of 10 listed companies of CSE and DSE including their average return.
ORGANIZATION OF DATA
To prepare this report I have organized the data in 5 chapters along with problems and recommendations related to
the subject matter of this report

Overview of stock exchange commission
Securities and Exchange Commission (SEC) was established on 8 June 1993 through enactment
of the Securities and Exchange Commission Act, 1993. The objectives of the SEC are to develop
the securities markets and to frame necessary rules and regulations of capital markets and issues
and dealings in securities with a view to provide for protection of investors. After establishment,
the Commission has played significant role in the overall development of the capital market and
legal infrastructure in the capital market, introduction of automated trading system for securities
transaction, deposit and transfer of securities electronically through establishment of Central
Depository Bangladesh Limited, opportunity of getting real time market price of securities and
index information, etc. Consequently,
investors have been ensured to invest in the capital market with confidence, and similarly
entrepreneurs of different industries have picked the capital market as the main source of long-
term financing.
At present, the capital market of Bangladesh is passing through a critical juncture. In the
backdrop of recent volatility and economic scenario look at national and global levels, concerted
efforts are needed to restore the confidence of investors and bringing stability in the market. All
market participants such as merchant bankers, brokers/dealers, asset management companies,
auditors, credit rating agencies, private entrepreneurs, state owned enterprises, stock exchanges
and regulatory organizations have to work together more professionally in order to achieve the
ultimate goal of the Capital Market. Likewise, investors have to be more aware about the capital
market and need to enhance their knowledge in related areas.

The Dhaka Stock Exchange (DSE):
Dhaka Stock Exchange Ltd (DSE) is the oldest and largest stock exchange in Bangladesh.
Though DSE was established in 28 April 1954 but its commercial operation started in 1956.The
board of directors consisting of 24 members directs the activities of DSE. Out of them, 12
directors are elected by direct votes of DSE members and other 12 directors are nominated by the
elected members from non-DSE members upon approval of the Commission. At present, there
are 238 members in DSE of which 22 members are registered by the Commission for conducting
securities business.
DSE has expanded its on-line trading network to many district towns like Gazipur, Narayanganj,
Comilla, Feni,Habiganj, Maulvibazar, Mymensingh, Chittagong, Khulna, Sylhet, Kushtia,
Barisal, Rajshahi and Bogra including the divisional towns. As on 30 June 2011 total number of
listings in DSE was 490 against which issued capital was Tk. 80683.90 crore and the market
capitalization was Tk. 285389.22 crore.

The Chittagong Stock Exchange (CSE) at a glance:
The Chittagong Stock Exchange Ltd (CSE), the second stock exchange, was established in 1995.
The board of directors consisting of 24 members directs the activities of CSE. Out of them, 12
directors are elected by direct votes of CSE members and other 12 directors are nominated by the
elected members from non-CSE members upon approval of the Commission. Now there are 135
members in CSE of which 120 members are registered by the Commission for conducting
securities business. As on June 30, 2011 total number of securities in CSE was 215 against which
issued capital was Tk. 20677.39 crore and market capitalization was Tk. 225978.00 crore.
Over -the-Counter Market or OTC Market:
Securities are traded without intermediaries through mutual understanding in the OTC market,
which are outside the stock exchanges. In CSE stock exchange’s OTC market, there are
opportunities of securities trading. Under Securities and Exchange Commission (Over-the-
Counter) Rules, 2001, OTC market was established in CSE. Securities de-listed from the
exchanges and securities not listed with the exchanges but issued obtaining consent from the
Commission can be traded in the OTC market. Dhaka Stock Exchanges Ltd started OTC market
in line with the direction of the Commission on 6th September, 2009. Settlement procedure of
the OTC market is like the public market.

CSE initiatives in market development
CSE was very keen on development activities in 2008. From the very beginning CSE tried to get
along with the investors. On the continuation second CSE capital market fair was organized in
Sylhet. The first one was organized in Chittagong in 2005. CSE also organized a monthly
training program about capital market for the third time in March. The fourth and fifth was
arranged in Juneand the sixth and seventh in September. In the same time CSE arranged a five-
day certificationcourse in collaboration with National Stock Exchange of India Ltd. to make
people working in brokerage firms and financial institutions aware of financial derivatives. In the
year 2008, CSEextended its network to Khulna, Moulovibazar, Sylhet, Chhatak, and Hathazary
in Chittagong.Up tonow CSE trading network is extended to 11 cities and 4 upazillas.Now CSE
trading 30 blue chip shares.
The Mission
To create an effective, efficient and transparent market atmosphere of international standard to
save and invest in Bangladesh in order to facilitate the competent entrepreneurs to raise fund and
accelerate industrial growth for overall benefit of the economy.

The Potential of the Bangladesh Capital Market
The capital market is the engine of growth for an economy, and performs a critical role in acting
as an intermediary between savers and companies seeking additional financing for business
expansion.
Vibrant capital is likely to support a robust economy. While lending by commercial banks
provides valuable initial support for corporate growth, a developed stock-market is an important
pre-requisite for moving into a more mature growth phase with more sophisticated
conglomerates. Today, with a $67 billion economy and per capita income of roughly $500,
Bangladesh should really focus on improving governance and developing advanced
market products, such as derivatives, swaps etc. Despite a challenging political environment and
widespread poverty, Bangladesh has achieved significant milestones on the social development
side. With growth reaching 7 percent in 2006, the economy has accelerated to an impressive
level. It is noting worthy that the leading global investment banks; Citi, Goldman Sachs, JP
Morgan and Merrill Lynch have all identified Bangladesh as a key investment opportunity. The
Dhaka Stock Exchange Index is at a 10-year high, how ever, the capital market in Bangladesh is
still underdeveloped and its development is imperative for full realization of the country's
development potential. It is encouraging to see that the capital market of Bangladeshis growing,
albeit at a slower pace than many would like, with market development still at a nascent stage.
The market has seen a lot of developments since the inception of the Securities and Exchange
Commission (SEC) in 1993. After the bubble burst of 1996, the capital market has attracted a lot
more attention, importance and awareness that have led to the infrastructure we have in the
market today.

Expansion of the Capital Market and Its Future:
The capital market of Bangladesh is an emerging market. Although the capital market started in
1956, the establishment of the Securities and Exchange Commission in 1993 quickened the pace
of growth of the securities market by strengthening the role of the market participants. While in
2000 the market capitalization was only around 2.24% of the country’s GDP, at the end of June,
2011 it stood around 41.22%. The average daily turnover of the country’s main stock exchange.
The trading network has expanded to the six divisions of the country transcending the periphery
of Dhaka and Chittagong. The network is also expanding to district towns and other important
places gradually. But expansion of the trading network is not enough; it requires expansion of
investment related knowledge especially for the investors and development of trend in investing
based on fundamentals, which will help investors to protect themselves in many ways from
unexpected loss.
SEC, DSE, CSE and merchant bankers arrange regular training programs for the investors in
related areas. Booklets and brochures have also been published in this regard. To conduct more
extensive level of training, an institute named Bangladesh Institute of Capital Market has got
approval recently.
For the sake of the depth of the capital market, efforts are underway to launch activities for the
development of bond market and derivatives market. It is expected that in the next 5 years
considerable development will take place in these areas.
Actions have been initiated to launch a full-fledged separate automated clearing house, which is
expected to reduce settlement time and thus improve overall market efficiency.

Share Categorization: A, B, G, N & Z
The prime bourse of the company introduced “Group A” and “Group B” from July 2, 2000 based
on its financial strength and performance to give clear information to investors for taking
informed decision. DSE has further categorized the securities by introducing “Group Z” which
came into effect from September 26, 2000. The Stock Exchange introduced another company
category “Group G” on June 30, 2002. The categorization helps a lot the investors in choosing
companies before making investment decision. N Category- the newest one was launched
through an order of SEC on July 3, 2006.
Listed securities are categorized into “A”, “B”, “Z”, “N” and “G” based on profitability ,
commercial operation, holding of AGM and accumulated loss exceeding paid up capital etc. This
categorization helps investors to know the qualities of securities before making investment
decision.
During the reporting FY, number of “A” category companies has increased compared to the last
FY. The number of “B” category companies has increased and “Z” category companies have
decreased compared to the last FY.

Criteria of the Share Category is as follows:
“A’ Category Companies: Companies which are regular in holding the Annual General
Meetings and have declared dividend at the rate of 10 percent or more in a calendar year.
(Mutual Funds, Debentures & Bond are being traded in this category).
“B’ Category Companies: Companies which are regular in holding the Annual General
Meetings but have failed to declare dividend at least at the rate of 10 percent in a calendar year.
“G’ category and their settlement systems would be like B-category companies. Category
Companies: Companies which have failed to hold the Annual General Meetings or failed to
declare any dividend or which are not in operation continuously for more than six months or
whose accumulated loss after adjustment of revenue reserve, if any, is negative and exceeded its
paid up capital.
“N’ Category Companies: Greenfield Companies.
“Z’ Category Companies: All newly listed companies except Greenfield companies will be
placed in this
Category P/E
Category name P/E Ratio Category Cap. Category Earning
A 13.54 1,749,721,283,585 129,207,923,513
B 38.42 10,600,188,612 275,927,924
Z 49.94 73,507,118,503 1,471,775,251
N 20.49 13,740,120,000 670,736,000

Blue Chip Stock
The stocks of well-established companies, leading in their sector, with consistent profit growth
over a long period and steady dividend payment are called "blue chip stocks". The term "blue
chip" gets its name from the game of poker where a blue chip has the highest value.
Blue chip companies are usually financially sound and are thought to be relatively low-risk
investments. They tend to be less volatile than other companies and to provide
solid growth to portfolios. Similarly, the stocks of blue-chip companies are highly valued due to
their consistent financial soundness. A regular dividend is expected from blue-chip stocks even
in bad financial times in the stock market.

Blue chip stocks have a lot of prestige as an investment asset class. They are perceived to be the
best stock for long-term investment. Blue-chip companies are the leaders in their sector, and are
known for their sheer size and reputation - in products, services and company governance.
Features of Blue Chip Stocks
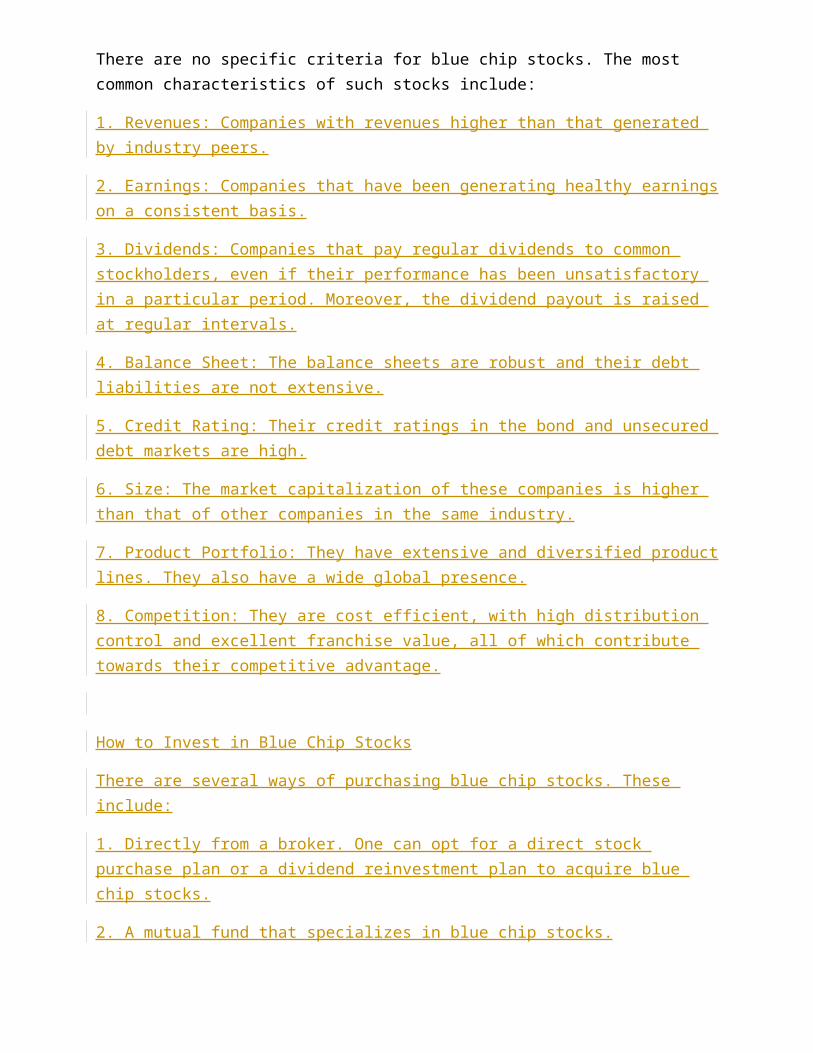
There are no specific criteria for blue chip stocks. The most common characteristics of such stocks include:
1. Revenues: Companies with revenues higher than that generated by industry peers.
2. Earnings: Companies that have been generating healthy earnings on a consistent basis.
3. Dividends: Companies that pay regular dividends to common stockholders, even if their performance has been unsatisfactory in a particular period. Moreover, the dividend payout is raised at regular intervals.
4. Balance Sheet: The balance sheets are robust and their debt liabilities are not extensive.
5. Credit Rating: Their credit ratings in the bond and unsecured debt markets are high.
6. Size: The market capitalization of these companies is higher than that of other companies in the same industry.
7. Product Portfolio: They have extensive and diversified product lines. They also have a wide global presence.
8. Competition: They are cost efficient, with high distribution control and excellent franchise value, all of which contribute towards their competitive advantage.
How to Invest in Blue Chip Stocks
There are several ways of purchasing blue chip stocks. These include:
1. Directly from a broker. One can opt for a direct stock purchase plan or a dividend reinvestment plan to acquire blue chip stocks.
2. A mutual fund that specializes in blue chip stocks.
3. Investing in the Diamond, a popular ETF (exchange traded fund). By buying a share of the Diamond, you purchase a fraction of all the thirty stocks in the US-based Dow Jones Industrial Average (DJIA) index. Given their low expense ratio, limited management fee and high tax efficiency, the Diamonds are preferred to blue chip mutual funds.

Features of a Blue Chip Company
Here are some aspects of a blue-chip company: -
Leaders in their sectors, with significant competitive advantage.
Steady earnings over a long period of time.
Large market capitalisation.
High public confidence due the quality of its products and services.
Ability to face both good and bad financial times, including recession.
Examples in the Bangladesh include Grameen Phone and Square Pharma. An index such as
the DSE 20 tracks blue chip stocks.
History
The term "blue chip stock" was coined by the Dow Jones' Oliver Dingold in the early 1920's
(source: Wikipedia). The phrase refers to a blue poker chip, which is the highest and most
valuable piece. A blue chip stock is classified as the stock of a large company that is an industry
leader and provides consistent, steady investment returns. Blue chip stocks are traditionally
thought to be a safe investment since the prices do not tend to vary wildly.
To compensate for slower growth, blue chip stocks pay investors dividends at regular intervals.
Often, the amount paid out in dividends increases over time.

Blue chip share in Bangladesh
There is no share named blue chip share in Bangladesh. But DSE has 155 “A” category shares of
which 20 shares fulfill the requirements of blue chip shares. CSE has 135 “A” category shares of
which 30 shares fulfill the requirements of blue chip shares .The blue chip companies of the
country are playing vital role in this growth. We have put together a brief profile of the top 10
blue chip companies. They are well-known names of Bangladesh Inc and have played a vital role
in the success of Bangladesh economy.
Most blue chip stocks pay regular dividends, even when business is faring worse than usual.
They are valued by investors seeking relative safety and stability, though prices per share are
usually high. Typically, such stocks are perceived to
offer reliable returns, low yield, and low risk.
CSE-30 DSE-20
1 ACI
2 AMCL(PRAN)
3 APEXTANRY
4 BATASHOE
5 BATBC
6 BDLAMPS
7 BXPHARMA
8 DHAKABANK
9 GQBALLPEN
10 ISLAMIBANK
11 LINDEBD
12 MEGHNACEM
13 MONNOCERA
14 NBL
15 PRIMEBANK
16 SINGERBD
17 SOUTHEASTB
18 SQUARETEXT
19 SQURPHARMA
20 UTTARAFIN

CSE SELECTIVE INDEX (CSE - 30)
1 ABBANK
2 ACI
3 AFTABAUTO
4 APEXTANRY
5 ASIAINS
6 BAYLEASING
7 BEXIMCO
8 CONFIDCEM
9 EBL
10 FAREASTLIF
11 HEIDELBCEM
12 IDLC
13 IFIC
14 ISLAMIBANK
15 JAMUNAOIL
16 LANKABAFIN
17 MPETROLEUM
18 NBL
19 NAVANACNG
20 PLFSL
21 PRIMEBANK
22 PRIMEFIN
23 PUBALIBANK
24 SINGERBD
25 SQURPHARMA
26 SQUARETEXT
27 SAPORTL
28 UNIONCAP
29 UTTARABANK
30 UTTARAFIN

At the beginning of new millennium a selective Index will be introduced, which is found to be
very popular in almost all the developed exchanges worldwide. Here the selection criteria play a
very important role in forming an index.
Criteria for a Selective Index
It provides a discussion about the important criterion for an index, which is to be used as a
benchmark of performance. The criterion is that the movement of the index fully represents the
aggregate movement of the index's constituent assets and that the index's returns are realizable
by an investor who has held a portfolio identical to the asset mix of the index. Value-Weighted
Index satisfies the above criterion.
Selection of stocks for the benchmark index should be such that it represents the whole market.
In addition it will be guaranteed that the constituent stocks have high percentage coverage of the
market in terms of market value. This will make it difficult if not possible for a few investors to
manipulate the movement of the index.
CRITERIA FOR CSE-30 INDEX
Two layer methods are followed for selection of listed companies in the CSE-30 Index. In the
first layer method, basic criteria are considered for primary selection.
BASIC CRITERIA

Must be listed with the Chittagong Stock Exchange Limited.
In case of IPO/New Issue, this should be on listing either with DSE or CSE for a
minimum period of 2 years or remained in Commercial Production in Bangladesh for the
minimum same period prior to its listing.
Companies that did not hold their Annual General Meetings regularly will not be
considered.
Minimum market capitalization must be Tk. 200 million and at least two times of paid-up
capital.
Must have at least 20% free floating share capital. Free floating share capital shall mean
the share capital which will exclude Govt's holding (other than ICB), Sponsors/Directors
& their Associates' holding plus other locked-in portions.
Must have positive revenue reserve/ retained earnings.
Must be traded for at least 50% trading days of the six monthly review period.
Paid dividend in any of the last 2 years.
Company having negative Earning Per Share (EPS) for last two consecutive years will
not be considered.
Company falling under settlement category 'Z' will not be considered.
Financial Institution falling under the problem list of Bangladesh Bank will not be
considered provided such information is available from an acceptable source.
Company failing to pay the listing fees and/or penalty imposed under the Listing
Regulations of CSE for a period of 2 years will not be considered.
At least one company from each sector having minimum seven companies will be taken
in the index if the scrip satisfies the above criteria and achieves the minimum point (50
points) as evaluated on the basis of the following Selection Criteria. The sector having
less than seven companies will be considered to be a part of Miscellaneous Sector.
On being qualified on the basis of the Basic Criteria, the companies are required to meet the
following further Selection Criteria to have the final berth in CSE-30 Index.
SELECTION CRITERIA
Higher Net Assets Value (NAV) per share
Higher rate of Earning Per Share (EPS)
Higher rate of Dividend
Lower Price Earning (PE) Ratio
Higher Dividend Yield (DY)
Higher rate of free floating in equity
Larger number of shareholders
Higher liquidity in terms of trading day
Higher liquidity in terms of number of contract
Longer duration of continuous remaining in the CSE-30 Index
Regular payment of listing fees
Conditions to be followed while forming the selective Index:
Only the active scrips will be considered for calculating the index.
Mutual Funds and Debt securities will not be considered in this index.
Only normal public market trades will be considered.
Selective Index will be refreshed after 3 minutes time interval during online trade.
At the time of update the Selective Index will consider the Weighted Average Price for
each constituent stock. (Example annexed)
No changes in number of shares will be allowed during the bussiness sessions.

Index committee will review the index - its criteria, performance, calculation method
after every six month.
Index Base Date is 30th December 1999
Base Day index is set to be 1000.
CSE-30
The construction principle of this index based on Laspeyres method like other two CSE indices ,
CSE All Share Price Index and CSE-30 Index. It may be mentioned here that the base value of
these two indices was also set to 1000 with a base date 30th December 1999. The current values
(as on 11th February 2004) of CSE All Share Price Index and CSE-30 Index are 1601.54 and
1483.60 respectively.
Selected 30 Companies
SL Scrip Code LTP High Low YCPClose
Price Change Trade Volume
1 ABBANK 43.7 44.2 43.1 43.9 43.6 -0.2 231 77,430
2 ACI 175.0 175.0 170.1 180.0 175.0 -5 2 150
3 AFTABAUTO 140.5 141.0 138.2 140.9 140.0 -0.4 242 50,776
4 APEXTANRY 100.3 101.0 100.1 105.0 100.3 -4.7 6 1,200
5 ASIAINS 39.8 40.7 39.8 40.5 40.3 -0.7 16 913,562
6 BAYLEASING 47.9 48.0 47.0 48.5 47.7 -0.6 34 17,966
7 BEXIMCO 90.5 91.5 89.9 91.3 90.7 -0.8 437 136,838
8 CONFIDCEM 118.3 118.9 116.8 118.6 118.7 -0.3 62 10,065
9 EBL 40.4 40.7 39.8 40.6 40.3 -0.2 79 50,920

10 FAREASTLIF 195.0 195.0 190.2 193.6 195.0 1.4 7 2,300
11 HEIDELBCEM 236.0 236.0 236.0 236.1 236.0 -0.1 1 100
12 IDLC 117.6 118.0 116.2 119.5 117.9 -1.9 9 1,687
13 IFIC 45.6 45.9 45.5 46.0 45.7 -0.4 12 1,690
14 ISLAMIBANK 42.9 43.2 42.8 43.2 43.0 -0.3 88 38,051
15 JAMUNAOIL 255.2 255.2 250.1 255.6 254.5 -0.4 31 4,900
16 LANKABAFIN 88.2 89.5 86.9 88.8 88.2 -0.6 144 101,500
17 MPETROLEUM 214.8 214.8 209.0 213.5 213.0 1.3 53 59,900
18 NBL 29.6 30.0 29.5 29.9 29.6 -0.3 260 159,838
19 NAVANACNG 97.0 98.0 96.1 98.0 96.9 -1 90 24,444
20 PLFSL 45.5 46.2 44.8 46.1 45.5 -0.6 266 88,400
21 PRIMEBANK 35.0 35.2 34.9 34.9 35.0 0.1 33 21,836
22 PRIMEFIN 62.1 62.9 61.5 63.0 62.4 -0.9 84 14,000
23 PUBALIBANK 32.4 32.6 32.1 32.6 32.4 -0.2 139 72,148
24 SINGERBD 180.0 180.5 180.0 180.0 180.3 0 4 700
25 SQURPHARMA 256.3 262.0 255.4 262.1 256.6 -5.8 258 107,890
26 SQUARETEXT 105.9 105.9 102.9 103.0 105.3 2.9 20 12,706
27 SAPORTL 41.0 41.1 40.4 41.4 40.9 -0.4 26 5,907
28 UNIONCAP 39.7 39.7 38.6 39.7 39.7 0 7 3,527
29 UTTARABANK 45.5 46.0 45.4 46.0 45.7 -0.5 65 28,556
30 UTTARAFIN 110.6 111.0 108.0 110.1 109.5 0.5 27 4,200
Stock market indexA stock market index is a method of measuring a section of the stock market. Many indices are
cited by news or financial services firms and are used as benchmarks, to measure the
performance of portfolios such as mutual funds.

Alternatively, an index may also be considered as an instrument (after all it can be traded) which
derives its value from other instruments or indices. The index may be weighted to reflect the
market capitalization of its components, or may be a simple index which merely represents the
net change in the prices of the underlying instruments.
There are many different ways of constructing an index. One of the most common methods is
illustrated by the following simple example.The values of a market portfolio at the close of
trading on Day 1 and Day 2 are recorded below:
Trading days Value of portfolio Index
DAY 1 (base day) Tk 20,000 1000
DAY 2 Tk 21,000 1050
We take Day 1 as the base day. The index on that day will be taken as a standard. The value
assigned to the base day index is 1000 in this example. On Day 2 the value of the portfolio has
changed from Tk 20,000 to Tk 21,000, a 5% increase. Therefore, the value of the index on Day 2
will change to indicate a corresponding 5% increase in market value. The computation follows
the procedure below:
2's portfolio value
Day 2's index = ------------------------------------------------- * Base Day's (Day 1) index
Base Day's (Day 1) portfolio value
Tk 21,000
= ---------------- * 1000
Tk 20,000
= 1050

Day 2's index is 1050 as compared to the 1000 of day 1. The above illustration only serves as an
introduction to how a particular index is constructed. The daily computation of an index is more
involved especially when there are changes in market capitalization of constituent stocks, e.g.,
rights offers, stock dividend etc. The primary objective of constructing market indices is to
measure the performance of the market. The indices provide vital information about the current
and historical behavior of the market. Stock market indices differ from one to another basically
in their sampling and/or weighting methods.
Highest
value :
16564.04
Lowest
value :
9995.5619
Date
From :
18 Jun,
2011
Date To :
18 Jun,
2012
Trading
Days :
241

SECTOR WISE SELECTED 30 SHARES IN CSE:
Banking & Financial sector: Islami Bank Bangladesh Limited ( ISBNK), Prime Bank Limited (
PMBNK ), Dhaka Bank Limited ( DHBNK ), South East Bank Limited ( SEBNK ), National
Bank Limited ( NBL ), National Credit & Commerce Bank ( NCCBL ), Al-Arafat Islami Bank
Limited ( AIBL ). Pharmacy & Chemical sector: Square Pharmaceuticals Limited ( SQPH ),
Beximco Pharmaceuticals Limited ( BXPH ), Advanced Chemicals Industries Limited ( ACL ),
Keya Cosmetics Limited ( KECOS ).Textiles & Clothing Sector: Square Textiles limited
( SQTEX ), Padma Textiles Limited ( PDTEX ), Beximco Synthetics Limited ( BXSYN ), Prime
Textile Spinning Mills Ltd ( PRTEX ), Apex Weaving & Finishing Mills Ltd. ( APXWV ),
Beximco Textiles Limited ( BXTEX ). Food & Agriculture sector: Agricultural Marketing
Company limited ( AMCL ). Engineering & Electrical Sector: Singer Bangladesh Limited
( SINGR ), Eastern Cables Limited ( ESTCB ), Quasem Drycells Limited ( QUSDR ), Olympic
Industries Limited ( OLIND ). Cement Sector: Heidelberg Cement Bangladesh Ltd. ( HBCM ),
Confidence Cement Ltd ( CNFCM ), Meghna Cement Mills Ltd ( MGHCM ).
Leather & Footwear Sector: Apex Tannery Limited ( APXTN ). Services & Construction
Sector: Eastern Housing Limited ( EHL ). Information Technology: BOC Bangladesh Limited
( BOC ).Ceramic Sector: Fu-Wang Ceramic Industry limited ( FWCR ). Miscellaneous Sector:
Aramit limited ( ARMIT ).
DSE-20 Index:

The index was introduced on January 01, 2001. The index comprises leading 20 shares with a
base of 1000. The criteria taken into account in formulating the index were market capitalization,
free float shares in public hands, minimum payment of 10 percent dividend for the last three
consecutive years and 95 percent trading days liquidity in terms of trading during the last six
months. Subjective criteria such as good corporate governance, regular holding of Annual
General Meetings and sectoral representation were the other key factors for becoming eligible
for inclusion in the index.
DSE 20 Share By Company Name On May 30, 2012 at 14:36:46
# Trading Code
Last
trading
price
High LowClose
PriceYCP Change Trade Volume Value(mn)
1 ACI 180.8 181.0 177.1 0.0 176 4.80 25 1900 0.34
2 AMCL(PRAN) 120.5 123.7 120.5 0.0 120.4 0.10 11 1300 0.16
3 APEXTANRY 103.0 104.6 103.0 0.0 102.8 0.20 39 7700 0.80
4 BATASHOE 499.9 499.9 499.9 0.0 498 1.90 8 800 0.40
5 BATBC 600.0 602.0 600.0 0.0 601.5 -1.50 42 28450 17.07
6 BDLAMPS 141.0 142.0 139.7 0.0 139.5 1.50 48 5000 0.70
7 BXPHARMA 63.4 64.1 63.0 0.0 62.7 0.70 478 149350 9.50
8 DHAKABANK 30.4 31.0 30.4 0.0 30.5 -0.10 146 136600 4.17
9 GQBALLPEN 196.1 198.0 191.5 0.0 191.7 4.40 546 79150 15.48
10 ISLAMIBANK 43.5 43.9 43.4 0.0 43.4 0.10 402 340200 14.81
11 LINDEBD 532.0 544.0 530.0 0.0 529.2 2.80 21 2200 1.18
12 MEGHNACEM 153.1 153.1 149.9 0.0 147.1 6.00 670 160600 24.39
13 MONNOCERA 41.9 42.0 41.0 0.0 40.9 1.00 31 5900 0.25
14 NBL 30.5 31.0 30.1 0.0 30.3 0.20 927 834000 25.39
15 PRIMEBANK 34.8 34.8 34.3 0.0 34.5 0.30 108 128750 4.45
16 SINGERBD 180.9 183.4 178.5 0.0 178.4 2.50 80 8100 1.47

17 SOUTHEASTB 21.8 21.8 21.3 0.0 21.6 0.20 115 300500 6.49
18 SQUARETEXT 102.8 104.9 102.8 0.0 102.8 0.00 108 24350 2.52
19 SQURPHARMA 252.0 254.9 250.9 0.0 250.3 1.70 931 80520 20.36
20 UTTARAFIN 109.3 110.0 105.7 0.0 104 5.30 412 73850 8.02
Analysis of stocks
Stock analysis is the process of screening a company’s fundamentals and investigating market
trends in order to identify stocks that can deliver high profits at low risk. Stock markets are
volatile and go through bull and bear phases, with share prices moving up or down. Stock market
analysis helps investors identify these phases. There are two distinct methodologies for stock
analysis, namely fundamental analysis and technical analysis.
Analysis of 10 companies:
SECTOR DETAILS
Sector: Bank
Sector PE: 10.27
Sector Cap 511552005945.00
Sector Earnings: 49834736609.20
Sector Beta: 0.89
BASIC INFO

Lot: 50
No Of Securities: 442333668
Listing Year: 1983
Reserve: 10460.8
Last AGM Held: 02/05/2012
Paidup Capital: 4423 M
Market Capital: 22619.315 M
Trade % of MCAP: 0.02%
Public Securities 160301721
Public Cap 8197M
Capital Details
SHARE DRISTRIBUTION
Director: Public: Govt: Inst: Foriegn:
13.9% 36.24% 0.57% 49.29% 0%
EPS
Last EPS: Quarter: Annu EPS: P/E:
1.14 Q1 4.56 9.34
52 WEEK HIGHAdj price: 75.13
52 WEEK LOW Adj price: 31.17

Financial Performance
Performance Year
Basic EPS Basic EPS (restated)
Net Asset Value
Per Share
Restated Net Asset Value
Per Share
Net Profit After Tax (mn)
% Dividen
d
% Dividend Yield Based on Based on
Continuing
operations
Including Extra-Ordinar
y Income
Continuing
operations
Including Extra-Ordinar
y Income
Continuing
operations
Including Extra-Ordinar
y Income
2006 93.08 NA 0 NA 481.7
4 0 532.19 NA 30 0
2007 256.1 NA 85.37 NA 807 202.33 1903.49 NA 200 0
2008 103.18 NA 89.72 NA 301.4
9 262.16 2300.62 NA 15 1.82
2009 133.26 0 106.61 0 399 318.87 3417.19 0 20 1.7
2010 12.45 0 10.82 0 44.14 38.38 3989.52 0 10 0.63
2011 NA NA NA NA NA NA NA NA NA NA
2012 NA NA NA NA NA NA NA NA NA NA

SECTOR DETAILS
Sector: Pharmaceuticals
& Chemicals
Sector PE: 17.86
Sector Cap 154955418232.00
Sector
Earnings:
8676994879.92
Sector Beta: 0.66
BASIC INFO
Lot: 50
No Of
Securities:
23773833
Listing
Year:
1976
Reserve: 3883.72
Last AGM
Held:
12/06/2012
Capital Details
Paidup
Capital:
238 M
Market
Capital:
2933.238 M
Trade % of
MCAP:
0.01%
Public
Securities
7431700
Public Cap 917M

SHARE DRISTRIBUTION
Director: Public: Govt: Inst: Foriegn:
34.2% 31.26% 0% 34.54% 0%
EPS
Last EPS: Quarter: Annu EPS: P/E:
0.10 Q1 0.40 429.50
52 WEEK HIGHAdj price: 252.8352 WEEK LOW Adj price: 124.25

Dividend
Dividend(%) Dividend payout ratio
2007 85 4.68
2008 100.00,20%B 1.92
2009 105 2.35
2010 120 3.22
2011 80,20%B 3.87

SECTOR DETAILS
Sector: Miscellaneous
Sector PE: 8.01
Sector Cap 50729782832.50
Sector
Earnings:
6331036466.76
Sector Beta: 0.86
BASIC INFO
Lot: 100
No Of
Securities:
363565109
Listing
Year:
1989
Reserve: 15361.8
Last AGM
Held:
30/06/2011
Capital Details
Paidup
Capital:
3636 M
Market
Capital:
1339.559 M
Trade % of
MCAP:
1.25%
Public
Securities
277945526
Public Cap 1024M
SHARE DRISTRIBUTION
Director: Public: Govt: Inst: Foriegn:
13.25% 76.45% 0% 0% 10.3%
EPS
Last EPS: Quarter: Annu EPS: P/E:
3.53 Q1 14.12 6.26
52 WEEK HIGH
Adj price: 198.00
52 WEEK LOW
Adj price: 61.60

Financial Performance
Performance Year
Basic EPS Basic EPS (restated)
Net Asset Value
Per Share
Restated Net Asset Value
Per Share
Net Profit After Tax (mn)
% Dividen
d
% Dividend Yield Based on Based on
Continuing
operations
Including Extra-Ordinar
y Income
Continuing
operations
Including Extra-Ordinar
y Income
Continuing
operations
Including Extra-Ordinar
y Income
2006 0 NA 3.65 NA 34.81 0 132.19 NA 15 0
2007 1.53 NA 1.01 NA 32.9 23.13 55.4 NA 15 0
2008 19.08 NA 11.11 NA 72.35 43.4 1047.36 NA 10 0.54
2009 34.59 0 21.62 0 101.9
6 63.73 3259.8 0 60 0
2010 NA NA NA NA NA NA NA NA NA NA
2011 NA NA NA NA NA NA NA NA NA NA
2012 NA NA NA NA NA NA NA NA NA NA

SECTOR DETAILS
Sector: Bank
Sector PE: 10.27
Sector Cap 511552005945.00
Sector
Earnings:
49834736609.20
Sector Beta: 0.89
BASIC INFO
Lot: 100
No Of
Securities:
466759413
Listing
Year:
2000
Reserve: 2989.27
Last AGM
Held:
29/03/2012
Capital Details
Paidup
Capital:
4668 M
Market
Capital:
9508.787 M
Trade % of
MCAP:
0.06%
Public
Securities
140074500
Public Cap 2854M

SHARE DRISTRIBUTION
Director: Public: Govt: Inst: Foriegn:
50.53% 30.01% 0% 19.46% 0%
EPS
Last EPS: Quarter: Annu EPS: P/E:
0.90 Q1 3.60 8.19
52 WEEK HIGHAdj price: 37.96
52 WEEK LOW Adj price: 24.58

Dividend declaration
year Dividend
2007 25%
2008 15%
2009 25%
2010 35%
2011 30%

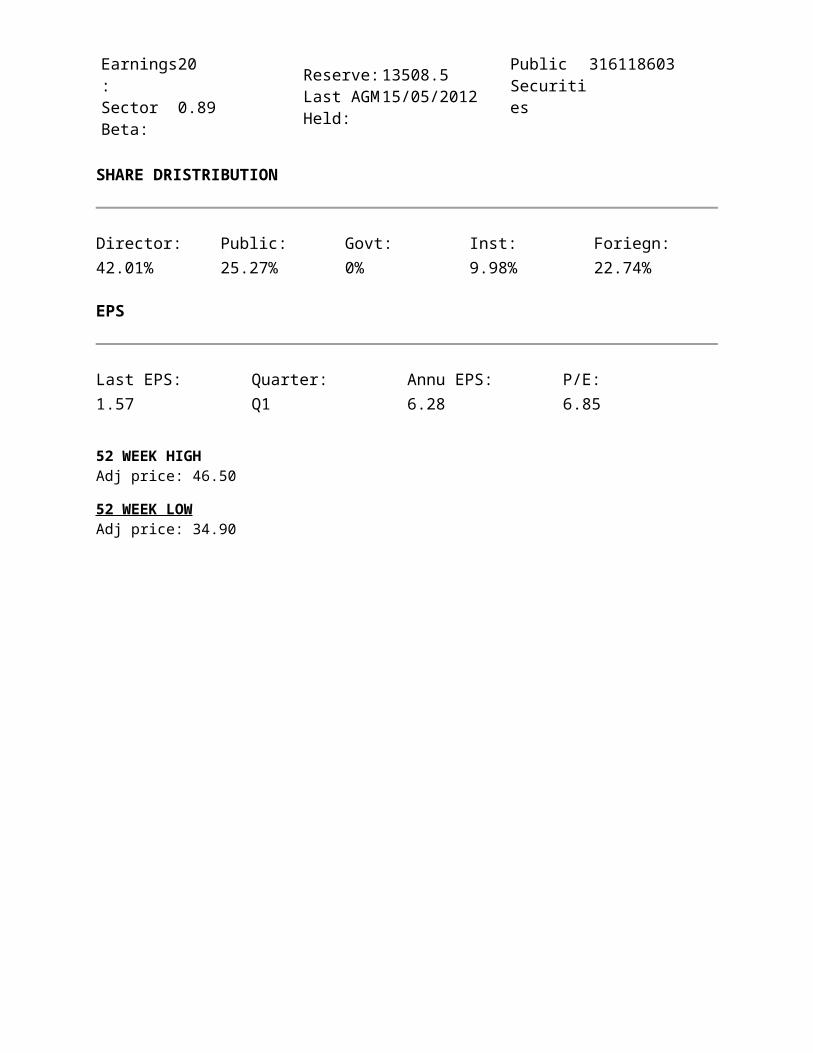
SECTOR DETAILS
Sector: Bank Sector PE: 10.27 Sector Cap 511552005945.0
0 Sector Earnings:
49834736609.20
Sector Beta:
0.89
BASIC INFO
Lot: 100 No Of Securities:
1250964000
Listing Year:
1985
Reserve: 13508.5 Last AGM Held:
15/05/2012
Capital Details
Paidup Capital:
12510 M
Market Capital:
21341.232 M
Trade % of MCAP:
0.05%
Public Securities
316118603
SHARE DRISTRIBUTION
Director: Public: Govt: Inst: Foriegn: 42.01% 25.27% 0% 9.98% 22.74%
EPS
Last EPS: Quarter: Annu EPS: P/E: 1.57 Q1 6.28 6.85
52 WEEK HIGHAdj price: 46.50
52 WEEK LOW Adj price: 34.90

Dividend
year dividend
2007 25%
2008 30%
2009 30%
2010 35%
2011 25%


SECTOR DETAILS
Sector: Engineering
Sector PE: 19.18
Sector Cap 86804872441.30
Sector
Earnings:
4526302475.00
Sector Beta: 0.99
BASIC INFO
Lot: 100
No Of
Securities:
49658400
Listing
Year:
2009
Reserve: 482.35
Last AGM
Held:
22/09/2011
Capital Details
Paidup
Capital:
497 M
Market
Capital:
M
Trade % of
MCAP:
0.00%
Public
Securities
18666593
Public Cap 0M
SHARE DRISTRIBUTION
Director: Public: Govt: Inst: Foriegn:
42.5% 37.59% 0% 19.91% 0%
EPS
Last EPS: Quarter: Annu EPS: P/E:
3.76 Q3 5.01 18.87
52 WEEK HIGH
Adj price: 159.82

52 WEEK LOW
Adj price: 48.60

SECTOR DETAILS
Sector: Engineering
Sector PE: 19.18
Sector Cap 86804872441.30
Sector
Earnings:
4526302475.00
Sector Beta: 0.99
BASIC INFO
Lot: 50
No Of
Securities:
39267580
Listing
Year:
1983
Reserve: 2747.84
Last AGM
Held:
30/04/2012
Capital Details
Paidup
Capital:
393
Market
Capital:
3290.582 M
Trade % of
MCAP:
0.04%
Public
Securities
6282813
Public Cap 526M
SHARE DRISTRIBUTION
Director: Public: Govt: Inst: Foriegn:
75% 16% 0% 9% 0%
EPS
Last EPS: Quarter: Annu EPS: P/E:
2.33 Q1 9.32 19.24
52 WEEK HIGH
Adj price: 309.00
52 WEEK LOW
Adj price: 165.90


SECTOR DETAILS
Sector: Pharmaceuticals & Chemicals
Sector PE: 17.83
Sector Cap 154731079433.00
Sector Earnings:
8676994879.92
Sector Beta: 0.66
BASIC INFO
Lot: 10
No Of Securities:
264834760
Listing Year:
1995
Reserve: 11279.9
Last AGM Held:
21/09/2011
Capital Details
Paidup Capital:
2648 M
Market Capital:
31564.436 M
Trade % of MCAP:
0.09%
Public Securities
103656325
Public Cap 12354M
SHARE DRISTRIBUTION
Director: Public: Govt: Inst: Foriegn:
54.16% 39.14% 0% 0% 6.7%
EPS
Last EPS: Quarter: Annu EPS: P/E:
11.21 Q3 14.95 17.19
52 WEEK HIGH
Adj price: 286.00
52 WEEK LOW
Adj price: 175.50

Dividend
year dividend(%)
2007 50%
2008 40%
2009 40%
2010 35%
2011 30%


SECTOR DETAILS
Sector: Financial Institutions
Sector PE: 27.17
Sector Cap 191637970524.00
Sector Earnings:
7052330754.44
Sector Beta: 0.90
BASIC INFO
Lot: 200
No Of Securities:
123750000
Listing Year:
1992
Reserve: 2696.44
Last AGM Held:
28/03/2012
Capital Details
Paidup Capital:
1238 M
Market Capital:
3020 M
Trade % of MCAP:
0.22%
Public Securities
26655750
Public Cap 651M
SHARE DRISTRIBUTION
Director: Public: Govt: Inst: Foriegn:
35.99% 21.54% 0% 42.47% 0%
EPS
Last EPS: Quarter: Annu EPS: P/E:
1.71 Q1 6.84 17.30
52 WEEK HIGH
Adj price: 190.40

52 WEEK LOW
Adj price: 65.12

SECTOR DETAILS
Sector: Bank
Sector PE: 10.28
Sector Cap 512363794719.00
Sector Earnings:
49834736609.20
Sector Beta: 0.89
BASIC INFO
Lot: 250
No Of Securities:
935771469
Listing Year:
2000
Reserve: 7175.58
Last AGM Held:
29/03/2012
Capital Details
Paidup Capital:
9358 M
Market Capital:
19985.875 M
Trade % of MCAP:
0.01%
Public Securities
341275855
Public Cap 7289M
SHARE DRISTRIBUTION
Director: Public: Govt: Inst: Foriegn:
40.75% 36.47% 0% 20.95% 1.83%
EPS
Last EPS: Quarter: Annu EPS: P/E:
0.52
52 WEEK HIGHAdj price: 43.00
52 WEEK LOW Adj price: 27.17
Q1 2.08 16.59

Analysis of Beta Coefficient
What Does Beta Mean?
A measure of the volatility, or systematic risk, of a security or a portfolio in comparison to the
market as a whole. Beta is used in the capital asset pricing model (CAPM), a model that
calculates the expected return of an asset based on its beta and expected market returns.
Beta is calculated using regression analysis, and you can think of beta as the tendency of a
security's returns to respond to swings in the market. A beta of 1 indicates that the security's
price will move with the market.
A beta of less than 1 means that the security will be less volatile than the market. A beta of
greater than 1 indicates that the security's price will be more volatile than the market. For
example, if a stock's beta is 1.2, it's theoretically 20% more volatile than the market.
ACI:
Beta Coefficient of ACI = 0.792108337923
Covariance = 3.41940671414
Variance = 4.3168422177
Beta Coefficient of BEXIMCO = 0.929687655672
Covariance = 4.0461473953
Variance = 4.3521578141
Beta Coefficient of DHAKABANK = 0.927159897464
Covariance = 3.99236619145
Variance = 4.30601690428
Beta Coefficient of SINGERBD = 0.680546393985
Covariance = 2.9588146789
Variance = 4.34770458716
Beta Coefficient of ISLAMIBANK = 0.745086809377
Covariance = 3.22945178389
Variance = 4.33432956167
Beta Coefficient of ABBANK = 1.01335264579
Covariance = 4.38138309572
Variance = 4.3236509165
Beta Coefficient of SQURPHARMA = 0.535334352303

Covariance = 2.31094185336
Variance = 4.31681965377
Beta Coefficient of IDLC = 0.863711100588
Covariance = 3.67306439471
Variance = 4.25265391658
MARKET YIELD
Company Last Price
Dividend Yield
Payout Ratio
Declaration(C)Declaration Date
ABBANK 39.2 1.276 % 13.228 % 5 % 01-03-2012
IFIC 41.8 1.196 % 6.550 % 5 % 17-05-2012
ISLAMIBANK 41.8 1.675 % 11.626 % 7 % 24-04-2012
PUBALIBANK 31.6 1.582 % 14.793 % 5 % 06-03-2012
UCBL 24.9 4.819 % 16.000 % 12 % 03-04-2012
UTTARABANK 40.9 4.890 % 34.722 % 20 % 05-04-2012
IDLC 109.8 3.188 % 15.823 % 35 % 10-03-2011
ULC 36.7 2.044 % 32.468 % 7.5 % 18-03-2012
PRIMEBANK 32.6 3.067 % 14.493 % 10 % 05-03-2012
SOUTHEASTB 20.1 7.463 % 64.378 % 15 % 29-02-2012
DHAKABANK 28 1.786 % 8.000 % 5 % 28-02-2012
BATASHOE 481 2.183 % 24.741 % 105 % 26-04-2012
MONNOSTAF 165 0.606 % 37.313 % 10 % 13-05-2012

6THICB 45.9 19.608 % 9.926 % 90 % 11-08-2011
8THICB 49.5 18.182 % 72.993 % 90 % 11-08-2011
AIMS1STMF 33.7 8.309 % 595.745 % 28 % 08-09-2011
ICBAMCL1ST 39.7 13.854 % 7.771 % 55 % 31-07-2011
ICBISLAMIC 19 18.947 % 863.309 % 36 % 31-07-2011
GRAMEEN1 45.4 5.507 % 26.624 % 25 % 29-09-2011
AFTABAUTO 131.9 1.516 % 10.199 % 20 % 05-12-2011
BDLAMPS 135.8 2.577 % 40.854 % 35 % 24-04-2011
ECABLES 58.9 1.698 % 40.486 % 10 % 12-06-2012
SINGERBD 174.2 1.722 % 19.634 % 30 % 20-03-2012
RENWICKJA 75.7 2.642 % 3.695 % 20 % 14-11-2011
NTLTUBES 57.5 4.348 % -349.650 % 25 % 11-11-2010
APEXFOODS 63.3 2.212 % 74.074 % 14 % 07-09-2011
BATBC 600.1 6.166 % 87.038 % 370 % 14-03-2012
LINDEBD 528.2 1.893 % 22.779 % 100 % 20-03-2012
DELTASPINN 28.4 3.521 % 72.307 % 10 % 21-11-2011
HRTEX 27.2 1.838 % 19.157 % 5 % 24-02-2011
SQUARETEXT 98.4 1.626 % 22.989 % 16 % 30-04-2012
MALEKSPIN 17.2 5.814 % 58.140 % 10 % 2010-11-14
ACI 169.1 4.731 % 66.061 % 80 % 16-05-2012
SQURPHARMA 248.7 1.206 % 18.067 % 30 % 16-08-2011
AMCL(PRAN) 119 2.605 % 54.520 % 31 % 03-11-2011
CONFIDCEM 108.8 1.838 % 27.064 % 20 % 14-05-2012
MEGHNACEM 123.9 2.018 % 84.459 % 25 % 05-06-2011
NAVANACNG 89.7 2.007 % 26.049 % 18 % 07-08-2011

Results:
From above discussion, these companies are in excellent financial condition and are leading
players in its sector.so these are blue chip stock in Bangladesh. These high-quality stocks are
considered a lower risk investment, which are much preferable for risk-averse investors in
Bangladesh. These companies pay regular dividends to common stockholders, although their
performance has been unsatisfactory in a particular period. Their dividend payout is rising at
regular intervals. These Companies have been generating healthy earnings on a consistent basis.
In this way Before investing in any blue chip company, investors have to carefully read and
analyze all information available about the company , its history, nowadays reality and outlook
for the future. No one knows what's going to happen in the next few months and the every-year-
growing stock doesn't have to follow its twenty years history.
Benefits
Since blue chip companies are industry leaders, the company is likely to have a long standing
record of successful business. Most industry leaders have low debts and healthy balance sheets,
which leads to consistent and increased dividends for shareholders. Unlike more volatile stocks,
blue chip stocks are likely to ride out dips in the economy without dropping substantially. For
example, a recession would likely have a stronger negative impact on other stocks than it would
the blue chip companies (although it is worth noting that in a recession, nearly all stock prices
will dip at least somewhat).

Here are some advantages of investing in blue chip stocks:
The main reason why blue chip shares are much sought after is due to the perception of
safety. Blue chip stocks are perceived to be less risky than other stocks.
The preference for quality among investors is another reason that blue chip stocks are
valued. High value blue chip stocks are said to be worth possessing for long-term
investment purposes.
The prospect of steady dividends, irrespective of market conditions, is a factor of
attraction in blue chip stock for investors. They are a preferred choice for those seeking
recession-proof investment and are considered to be great dividend stocks.
A stock portfolio should consist of a mixed bag of investments - there should be diversity
in assets. Instead of putting all eggs in one basket, it is better to diversify and dedicate a
percentage to large-caps or blue chip stocks, and the rest to other asset classes. This
would create a balance between stability and risk in a stock portfolio.
Disadvantages of Blue Chip SharesBlue chip shares are investments in well-established companies and leaders in their respective
industries. Blue chip companies in general are financially stable with a history of solid earnings.
Investors buy blue chip shares for investment safety, predictable returns, consistent dividend
payments and their defensive nature in market downturns. However, investors may have to trade
the benefits of owning blue chip shares for certain disadvantages such as low returns, slow
growth, little volatility and expensive pricing, which can also become disincentives to some
investors when considering blue chip shares.
The share market is prone to ups and downs. Blue chip stocks are not immune to those
fluctuations, although they are in a better position to weather any financial storms and pay
consistent dividends.

As lot of investors flock to blue chip stocks as to a refuge of stability, the dividend returns from
such stocks tend to be lower, although consistent.
Low Returns
Like any investment, returns on blue chip shares are commensurate with their risk.
Providing a high degree of investment safety from their predictable, steady business
operations, blue chip shares are low-risk investments, and thus returns are normally low
as well. Because of this disadvantage, blue chip shares are not suitable for investors who
have a high level of risk tolerance and are more aggressive in their investment
approaches.
Slow Growth
Blue chip shares are comprised of large-cap companies with maturing businesses and markets,
compared with small- and mid-cap companies that are still in their development stages and have
a high potential for growth. Nevertheless, blue chip share may yet deliver earnings increases over
time, but the growth is likely to be small and steady. While blue chip shares may be ideal for
investors seeking value accumulation over the long-term, their slow growth presents a particular
disadvantage to growth investors who expect above-average growth and large share price moves
in a short period of time.
Little Volatility
Large price swings in trading are uncommon with blue chip shares, as their respective companies
are financially stable with smooth operations. Little volatility can be a plus for some investors
who desire consistent investment returns, but this is actually considered a disadvantage to others
seeking varied trading gains. While many value investors choose blue chip shares based on

fundamental analysis, the lack of volatility makes them unsuitable in technical trading for quick,
short-term profits.
Pricing
Blue chip shares tend to commend higher valuation in market trading supported by investor
demand. Blue chip investors may include those who invest in blue chip shares for consistent
long-term returns, switch to blue chip shares for investment safety during economic downturns
and favor blue chip shares for predictable dividend payments. As a result, prices of blue chip
shares are more expensive, which creates a disadvantage for the investor who may not be
particularly interested in blue chip shares, but mainly needs them to spread his investments
among various share classes for diversification purposes.
Misconceptions
Inexperienced investors can make the mistake of thinking blue chip stocks are a safe, sure bet
with guaranteed dividends. However, this is not always the case. The state of the economy,
industry news, and company mergers & acquisitions can all cause the price of a stock to fall,
irregardless of how well established the company behind it is. Also, investors must make sure to
diversify their portfolios. Even holding multiple blue chip stocks is not enough of a
diversification; safer investments like Treasury bonds and established, steady yield mutual funds
should be included to mitigate risk. However, mutual funds do exist that invest primarily in blue
chip stocks; these are a good starting point of investment for the inexperienced or conservative
investor.

Suggestions to improve the activities of blue chip shares
To introduce automated monitoring system that may control price manipulation,
malpractices and inside trading of blue chip shares.
To introduce full computerized system for settlement of transactions of blue chip
shares.
To force the blue chip companies to publish their annual reports with actual and
proper information that can ensure the interests of investors.
Although blue chip shares are not suitable for investors who have a high level of risk
tolerance and are more aggressive in their investment approaches so in that case risk
averse people are suitable for blue chip share. So blue chip companies should try to
attract risk adverse investors.
Blue chip companies should have rapid growth for the long term existence.
For quick, short term profits blue chip companies should increase their price volatility
which will be suitable in technical trading.
Blue chip companies need to spread their investments among various share classes for
diversification purposes by decreasing their share price.
Future of blue chip shares
“There’s never been a better time to buy blue chip
shares”
Due to stock market crash now investors are very much worried about price
volatility so that they are searching low risky shares so blue chip shares will be
suitable for investors.

Day by day popularity of blue chip shares are increasing because of their
performance.
For Investors who are fully depend on share market blue chip shares create
opportunities for increasing their earning profits by creating scope of low risk
investments.
After analyzing their performance it is clear that blue chip shares will play a
vital role in our share market besides Bangladesh economy.
Conclusion:
From above discussion it is clear that Blue chip stocks are selective stocks those are most
valuable and primarily larger companies' stock. The blue chip shares are the engine of growth for
an economy, and perform a critical role in acting as an intermediary between savers and
companies seeking additional financing for business expansion but for those who are risk averse.
Blue chip companies usually have a long operating history, steady earnings and a good
reputation. As they are selected to be enlisted in DSE-20 or CSE-30 index those companies are
reviewed every six month based on a company has market capitalization at least Taka 200
million, company's free float stock in the market at least 20% shares of the company remains in
the hands of general public, a company provide payout to investors at least 10% of dividend for
the last three consecutive years, a company maintains a minimum trade of 95% trading days in
the last six month. In addition, other subjective criteria like good corporate governance, regular
holding of annual general meetings have been also considered.

Bibliography:
www.msn.com
www.google.com
www.wikipedia.com
www.scribd.com
www.globaloneness.com
www.cse.com.bd
www.dsebd.org
www.secbd.org
www.stockbd.com
, http://www.investopedia.com/search/default.aspx?
q=total+impac t+of+volatility+on+stock+market , http://www.investopedia.com/search/default.aspx?
q=e valuate+the+behavior+of+investors+in+stock+market
www.biasl.net
CSE Bazaar porikroma (magazine)