blue dart express - moneycontrol.com
TRANSCRIPT
ICIC
I S
ecurit
ies –
Retail E
quit
y R
esearch
MO
ME
NT
UM
PIC
K
Research Analysts
Nitin Kunte, CMT
Vinayak Parmar
Dharmesh Shah
Pabitro Mukherjee
Ninad Tamhanekar, CMT
Gladiator Stocks
September 29, 2020
Open Recommendations
Momentum Picks
Click here to know more…
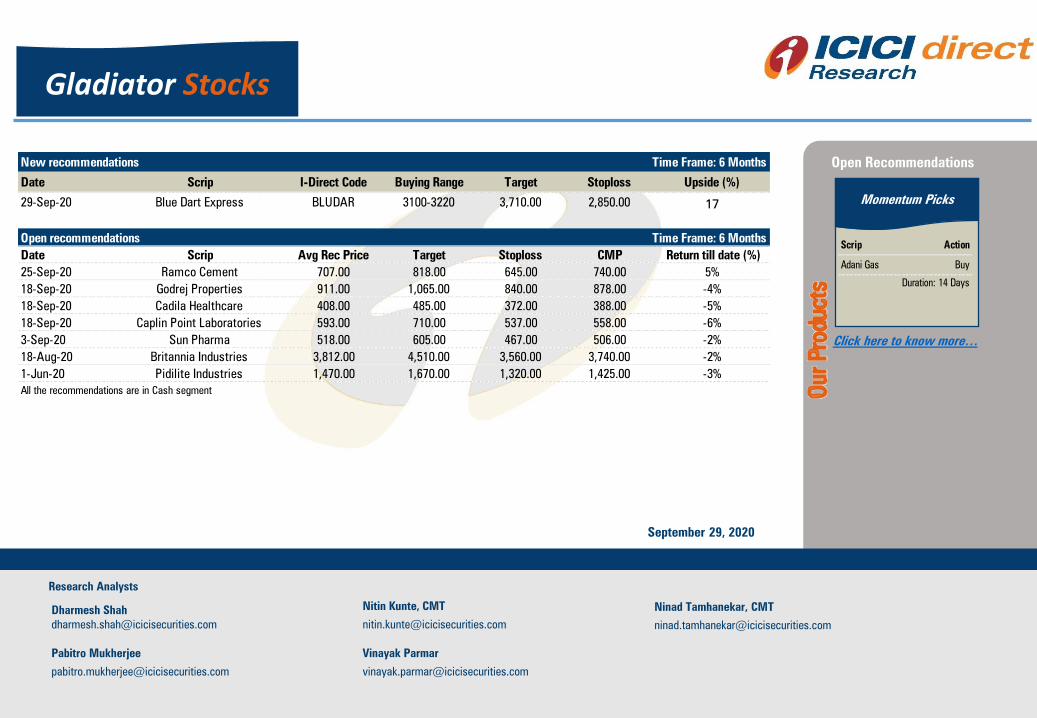
New recommendations
Date Scrip I-Direct Code Buying Range Target Stoploss Upside (%)
29-Sep-20 Blue Dart Express BLUDAR 3100-3220 3,710.00 2,850.00 17
Open recommendations
Date Scrip Avg Rec Price Target Stoploss CMP Return till date (%)
25-Sep-20 Ramco Cement 707.00 818.00 645.00 740.00 5%
18-Sep-20 Godrej Properties 911.00 1,065.00 840.00 878.00 -4%
18-Sep-20 Cadila Healthcare 408.00 485.00 372.00 388.00 -5%
18-Sep-20 Caplin Point Laboratories 593.00 710.00 537.00 558.00 -6%
3-Sep-20 Sun Pharma 518.00 605.00 467.00 506.00 -2%
18-Aug-20 Britannia Industries 3,812.00 4,510.00 3,560.00 3,740.00 -2%
1-Jun-20 Pidilite Industries 1,470.00 1,670.00 1,320.00 1,425.00 -3%
All the recommendations are in Cash segment
Time Frame: 6 Months
Time Frame: 6 MonthsScrip Action
Adani Gas Buy
Duration: 14 Days
ICIC
I S
ecurit
ies –
Retail E
quit
y R
esearch
MO
ME
NT
UM
PIC
K
September 29, 2020 ICICI Securities Ltd. | Retail Equity Research 2
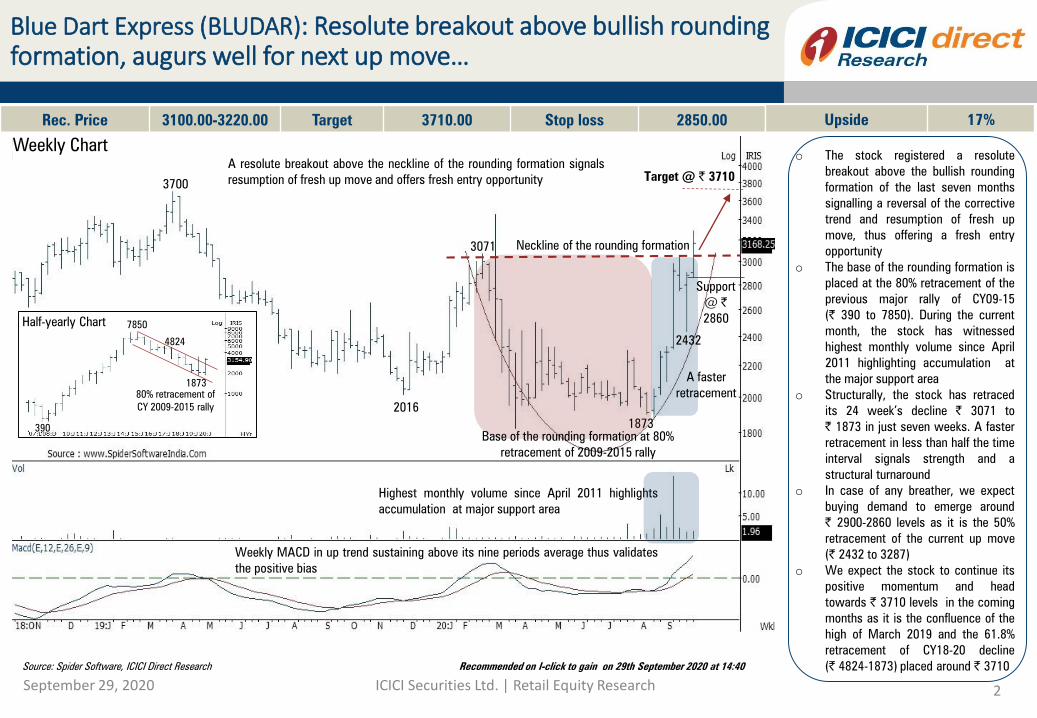
Weekly Chart
Blue Dart Express (BLUDAR): Resolute breakout above bullish rounding formation, augurs well for next up move…
Rec. Price 3100.00-3220.00 Target 3710.00 Stop loss 2850.00 Upside 17%
o The stock registered a resolute
breakout above the bullish rounding
formation of the last seven months
signalling a reversal of the corrective
trend and resumption of fresh up
move, thus offering a fresh entry
opportunity
o The base of the rounding formation is
placed at the 80% retracement of the
previous major rally of CY09-15
(| 390 to 7850). During the current
month, the stock has witnessed
highest monthly volume since April
2011 highlighting accumulation at
the major support area
o Structurally, the stock has retraced
its 24 week’s decline | 3071 to
| 1873 in just seven weeks. A faster
retracement in less than half the time
interval signals strength and a
structural turnaround
o In case of any breather, we expect
buying demand to emerge around
| 2900-2860 levels as it is the 50%
retracement of the current up move
(| 2432 to 3287)
o We expect the stock to continue its
positive momentum and head
towards | 3710 levels in the coming
months as it is the confluence of the
high of March 2019 and the 61.8%
retracement of CY18-20 decline
(| 4824-1873) placed around | 3710
Highest monthly volume since April 2011 highlights
accumulation at major support area
Source: Spider Software, ICICI Direct Research Recommended on I-click to gain on 29th September 2020 at 14:40
Target @ | 3710
A resolute breakout above the neckline of the rounding formation signals
resumption of fresh up move and offers fresh entry opportunity
3071
Support
@ |
2860
1873
3700
A faster
retracement
Weekly MACD in up trend sustaining above its nine periods average thus validates
the positive bias
2016
Neckline of the rounding formation
Base of the rounding formation at 80%
retracement of 2009-2015 rally
2432
Half-yearly Chart
390
7850
4824
80% retracement of
CY 2009-2015 rally
1873
ICIC
I S
ecurit
ies –
Retail E
quit
y R
esearch
MO
ME
NT
UM
PIC
K
September 29, 2020 ICICI Securities Ltd. | Retail Equity Research 3Source: Bloomberg, ICICI Direct Research
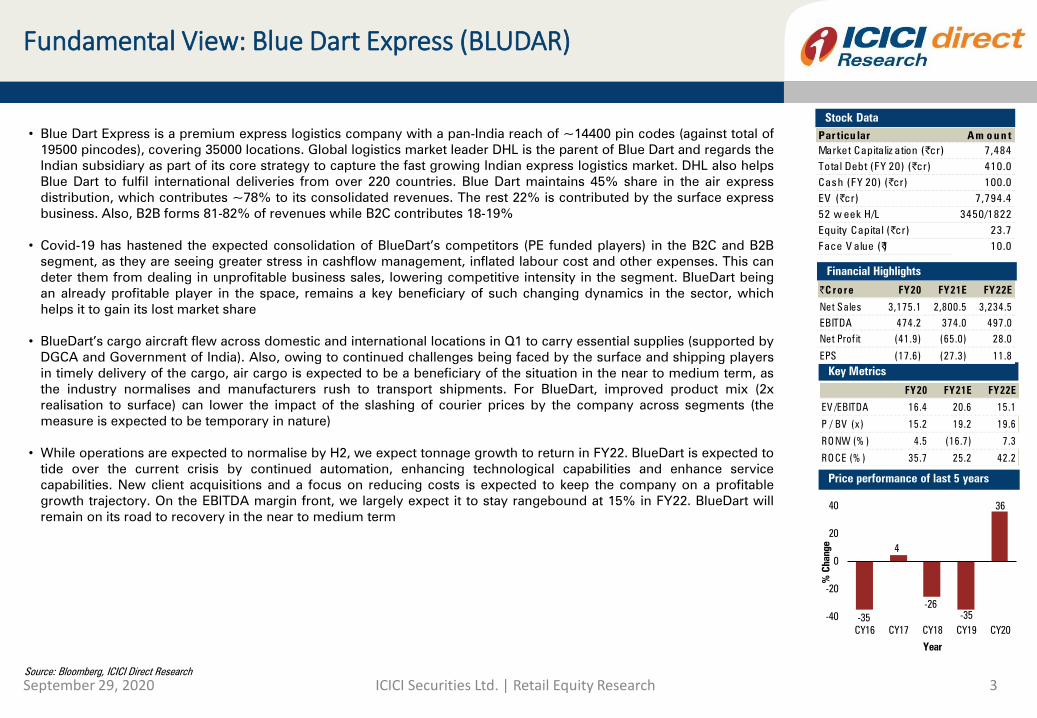
Fundamental View: Blue Dart Express (BLUDAR)
Stock Data
Price performance of last 5 years
Financial Highlights
Key Metrics
• Blue Dart Express is a premium express logistics company with a pan-India reach of ~14400 pin codes (against total of
19500 pincodes), covering 35000 locations. Global logistics market leader DHL is the parent of Blue Dart and regards the
Indian subsidiary as part of its core strategy to capture the fast growing Indian express logistics market. DHL also helps
Blue Dart to fulfil international deliveries from over 220 countries. Blue Dart maintains 45% share in the air express
distribution, which contributes ~78% to its consolidated revenues. The rest 22% is contributed by the surface express
business. Also, B2B forms 81-82% of revenues while B2C contributes 18-19%
• Covid-19 has hastened the expected consolidation of BlueDart’s competitors (PE funded players) in the B2C and B2B
segment, as they are seeing greater stress in cashflow management, inflated labour cost and other expenses. This can
deter them from dealing in unprofitable business sales, lowering competitive intensity in the segment. BlueDart being
an already profitable player in the space, remains a key beneficiary of such changing dynamics in the sector, which
helps it to gain its lost market share
• BlueDart’s cargo aircraft flew across domestic and international locations in Q1 to carry essential supplies (supported by
DGCA and Government of India). Also, owing to continued challenges being faced by the surface and shipping players
in timely delivery of the cargo, air cargo is expected to be a beneficiary of the situation in the near to medium term, as
the industry normalises and manufacturers rush to transport shipments. For BlueDart, improved product mix (2x
realisation to surface) can lower the impact of the slashing of courier prices by the company across segments (the
measure is expected to be temporary in nature)
• While operations are expected to normalise by H2, we expect tonnage growth to return in FY22. BlueDart is expected to
tide over the current crisis by continued automation, enhancing technological capabilities and enhance service
capabilities. New client acquisitions and a focus on reducing costs is expected to keep the company on a profitable
growth trajectory. On the EBITDA margin front, we largely expect it to stay rangebound at 15% in FY22. BlueDart will
remain on its road to recovery in the near to medium term
Par ticu lar Am o u n t
Market Capita liz ation (| cr) 7,484
Tota l Debt (FY 20) (| cr) 410.0
Cash (FY 20) (| cr) 100.0
EV (| cr) 7,794.4
52 w eek H/L 3450/1822
Equity Capita l (| cr) 23.7
Face V alue (|) 10.0
| C ro re FY20 FY21E FY22E
Net Sales 3,175.1 2,800.5 3,234.5
EBITDA 474.2 374.0 497.0
Net Prof it (41.9) (65.0) 28.0
EPS (17.6) (27.3) 11.8
FY20 FY21E FY22E
EV /EBITDA 16.4 20.6 15.1
P / BV (x) 15.2 19.2 19.6
RO NW (% ) 4.5 (16.7) 7.3
RO CE (% ) 35.7 25.2 42.2
-35
4
-26
-35
36
-40
-20
0
20
40
CY16 CY17 CY18 CY19 CY20
% C
hange
Year
ICIC
I S
ecurit
ies –
Retail E
quit
y R
esearch
MO
ME
NT
UM
PIC
K
September 29, 2020 ICICI Securities Ltd. | Retail Equity Research 4Source: ICICI Direct Research
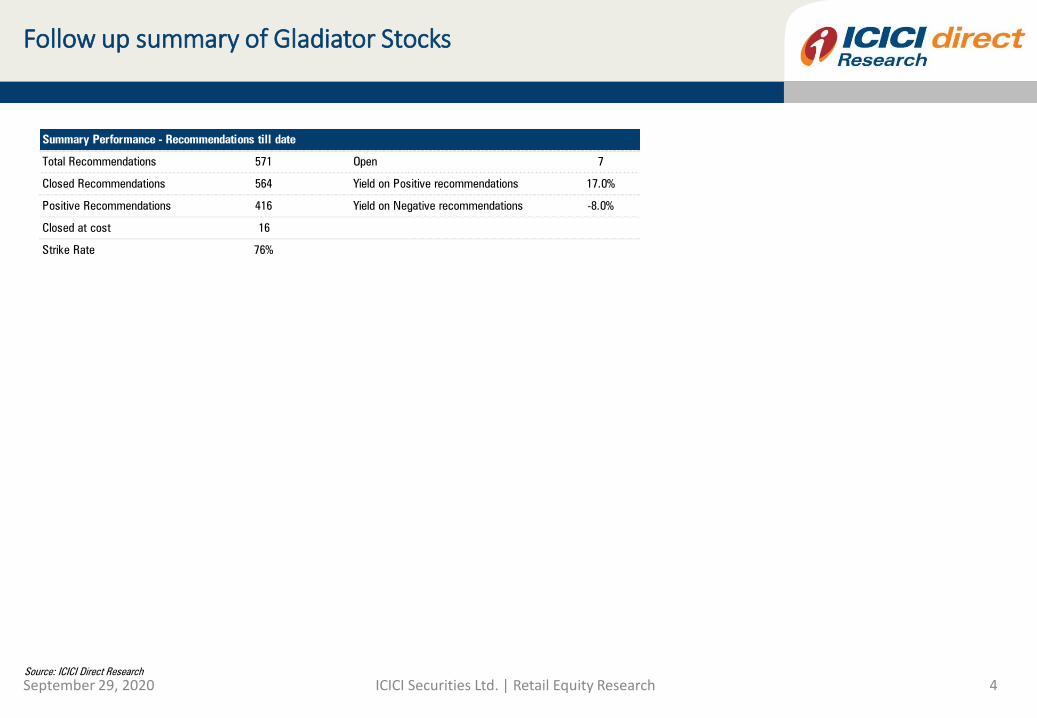
Follow up summary of Gladiator Stocks
Summary Performance - Recommendations till date
Total Recommendations 571 Open 7
Closed Recommendations 564 Yield on Positive recommendations 17.0%
Positive Recommendations 416 Yield on Negative recommendations -8.0%
Closed at cost 16
Strike Rate 76%
ICIC
I S
ecurit
ies –
Retail E
quit
y R
esearch
MO
ME
NT
UM
PIC
K
September 29, 2020 ICICI Securities Ltd. | Retail Equity Research 5
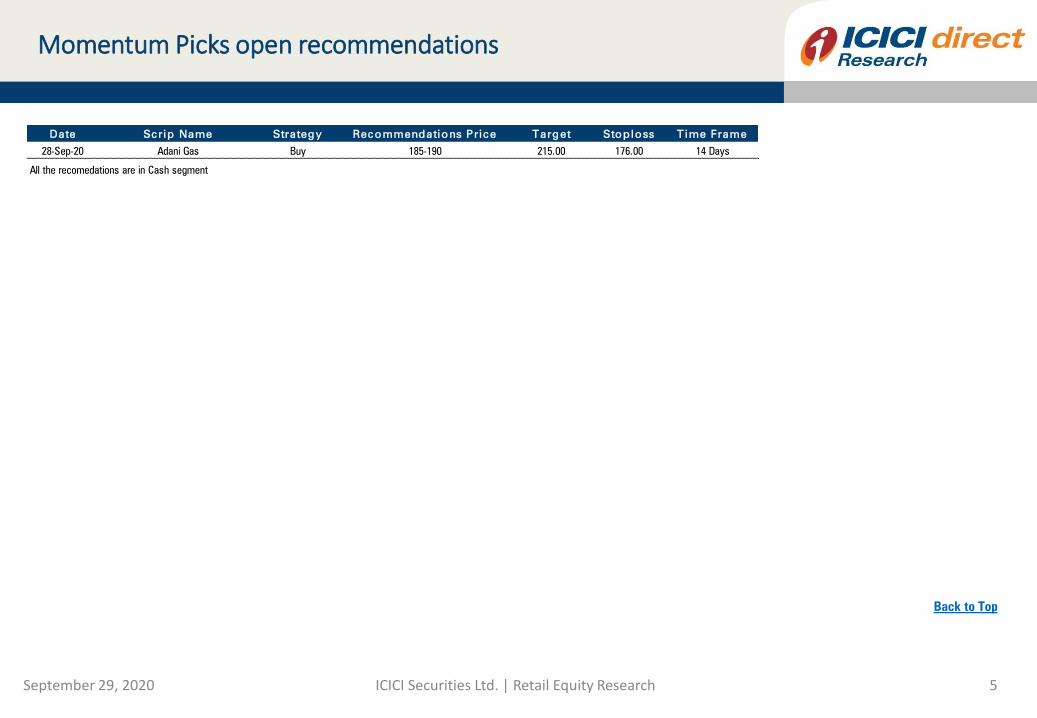
Momentum Picks open recommendations
Back to Top
Date Scrip Name Strategy Recommendations Price Target Stoploss Time Frame
28-Sep-20 Adani Gas Buy 185-190 215.00 176.00 14 Days
All the recomedations are in Cash segment
ICIC
I S
ecurit
ies –
Retail E
quit
y R
esearch
MO
ME
NT
UM
PIC
K
September 29, 2020 ICICI Securities Ltd. | Retail Equity Research 6Source: Spider Software. ICICI Direct Research
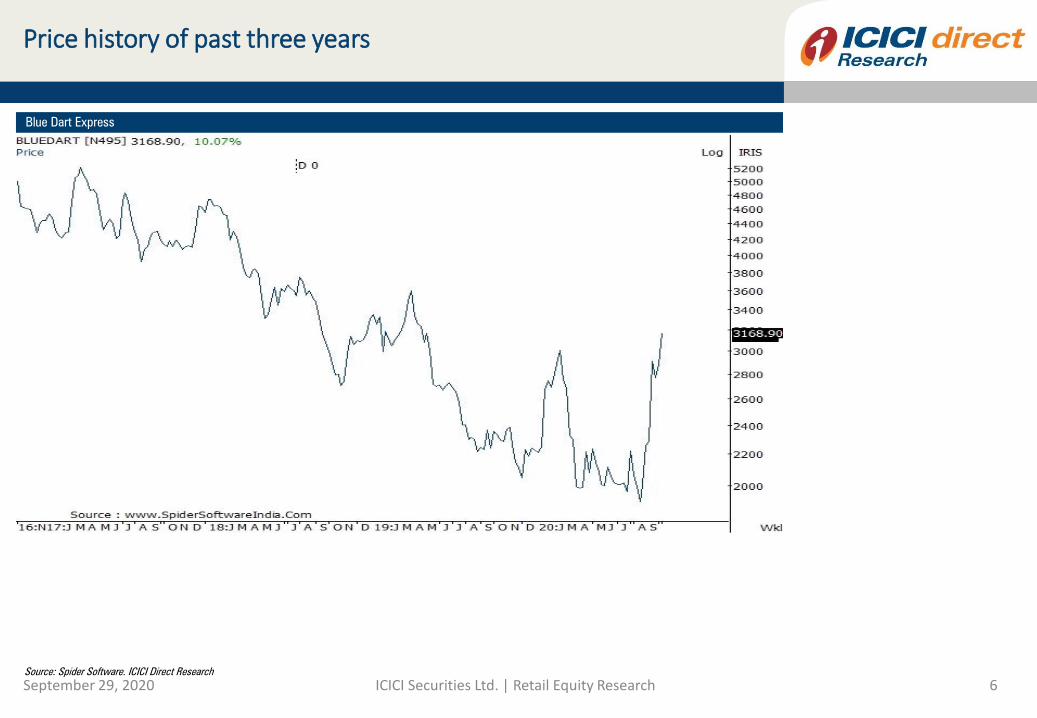
Price history of past three years
Blue Dart Express
ICIC
I S
ecurit
ies –
Retail E
quit
y R
esearch
MO
ME
NT
UM
PIC
K
September 29, 2020 ICICI Securities Ltd. | Retail Equity Research 7Source: ICICI Direct Research
Product Guidelines......
• It is recommended to enter in a staggered manner within the prescribed range provided in the report
• Once the recommendation is executed, it is advisable to keep strict stop loss as provided in the report
on closing basis
• The recommendations are valid for six months and in case we intend to carry forward the position, it
will be communicated through separate mail
Trading portfolio allocation
• It is recommended to spread out the trading corpus in a proportionate manner between the various
technical research products
• Please avoid allocating the entire trading corpus to a single stock or a single product segment
• Within each product segment it is advisable to allocate equal amount to each recommendation
• For example: The ‘Momentum Picks’ product carries 2 intraday recommendations. It is advisable to
allocate equal amount to each recommendation
ICIC
I S
ecurit
ies –
Retail E
quit
y R
esearch
MO
ME
NT
UM
PIC
K
September 29, 2020 ICICI Securities Ltd. | Retail Equity Research 8Source: ICICI Direct Research
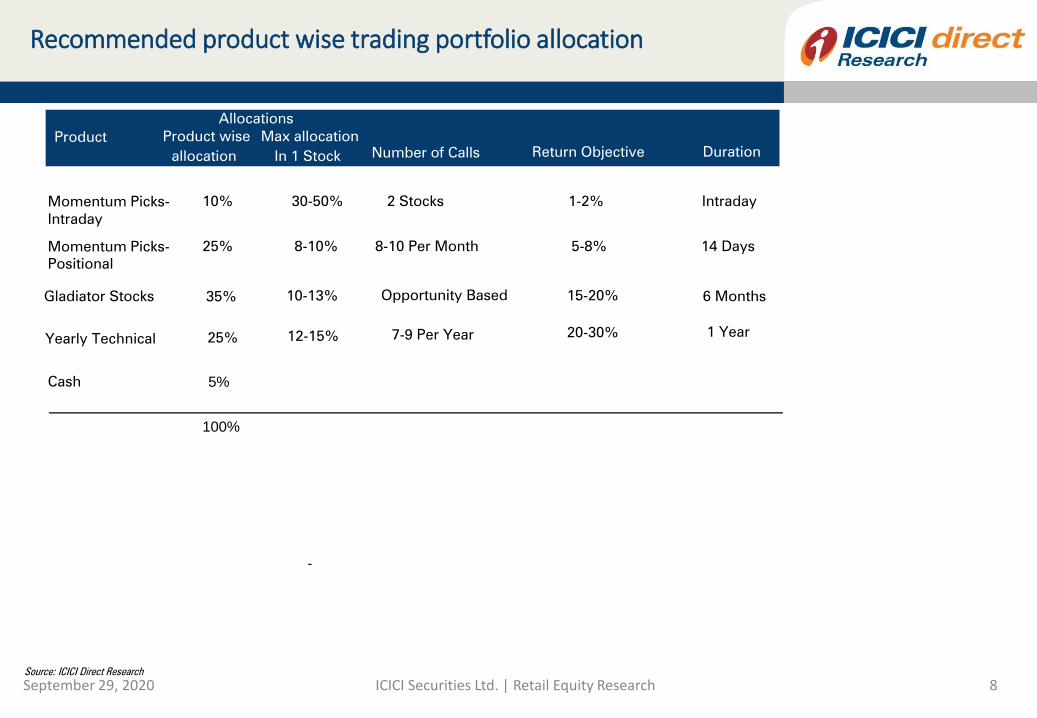
Recommended product wise trading portfolio allocation
Duration
Momentum Picks-
Intraday
10% 30-50% 2 Stocks 1-2% Intraday
Momentum Picks-
Positional
25% 8-10% 8-10 Per Month 5-8% 14 Days
Yearly Technical 25% 12-15% 7-9 Per Year 20-30% 1 Year
Gladiator Stocks 35% 10-13% 15-20% 6 Months
Cash 5%
-
100%
Number of Calls Return Objective
Product Product wise
allocation
Allocations
Max allocation
In 1 Stock
Opportunity Based

ICIC
I S
ecurit
ies –
Retail E
quit
y R
esearch
MO
ME
NT
UM
PIC
K
Pankaj Pandey Head – Research [email protected]
ICICI Direct Research Desk,
ICICI Securities Limited,
1st Floor, Akruti Trade Centre,
Road No 7, MIDC,
Andheri (East)
Mumbai – 400 093
September 29, 2020 ICICI Securities Ltd. | Retail Equity Research 9
ICIC
I S
ecurit
ies –
Retail E
quit
y R
esearch
MO
ME
NT
UM
PIC
K
We /I, Dharmesh Shah, Nitin Kunte, Ninad Tamhanekar, Pabitro Mukherjee, Vinayak Parmar Research Analysts, authors and the names subscribed to this report, hereby certify that all of the views expressed in this research report accurately reflect our views about the
subject issuer(s) or securities. We also certify that no part of our compensation was, is, or will be directly or indirectly related to the specific recommendation(s) or view(s) in this report. Analysts are not registered as research analysts by FINRA and are not associated
persons of the ICICI Securities Inc. It is also confirmed that above mentioned Analysts of this report have not received any compensation from the companies mentioned in the report in the preceding twelve months and do not serve as an officer, director or employee
of the companies mentioned in the report.
Terms & conditions and other disclosures:
ICICI Securities Limited (ICICI Securities) is a full-service, integrated investment banking and is, inter alia, engaged in the business of stock brokering and distribution of financial products. ICICI Securities Limited is a SEBI registered Research Analyst with SEBI
Registration Number – INH000000990. ICICI Securities Limited SEBI Registration is INZ000183631 for stock broker. ICICI Securities is a subsidiary of ICICI Bank which is India’s largest private sector bank and has its various subsidiaries engaged in businesses of
housing finance, asset management, life insurance, general insurance, venture capital fund management, etc. (“associates”), the details in respect of which are available on www.icicibank.com
ICICI Securities is one of the leading merchant bankers/ underwriters of securities and participate in virtually all securities trading markets in India. We and our associates might have investment banking and other business relationship with a significant percentage of
companies covered by our Investment Research Department. ICICI Securities generally prohibits its analysts, persons reporting to analysts and their relatives from maintaining a financial interest in the securities or derivatives of any companies that the analysts cover.
Recommendation in reports based on technical and derivative analysis centre on studying charts of a stock's price movement, outstanding positions, trading volume etc as opposed to focusing on a company's fundamentals and, as such, may not match with the
recommendation in fundamental reports. Investors may visit icicidirect.com to view the Fundamental and Technical Research Reports.
Our proprietary trading and investment businesses may make investment decisions that are inconsistent with the recommendations expressed herein.
ICICI Securities Limited has two independent equity research groups: Institutional Research and Retail Research. This report has been prepared by the Retail Research. The views and opinions expressed in this document may or may not match or may be contrary
with the views, estimates, rating, target price of the Institutional Research.
The information and opinions in this report have been prepared by ICICI Securities and are subject to change without any notice. The report and information contained herein is strictly confidential and meant solely for the selected recipient and may not be altered in
any way, transmitted to, copied or distributed, in part or in whole, to any other person or to the media or reproduced in any form, without prior written consent of ICICI Securities. While we would endeavour to update the information herein on a reasonable basis,
ICICI Securities is under no obligation to update or keep the information current. Also, there may be regulatory, compliance or other reasons that may prevent ICICI Securities from doing so. Non-rated securities indicate that rating on a particular security has been
suspended temporarily and such suspension is in compliance with applicable regulations and/or ICICI Securities policies, in circumstances where ICICI Securities might be acting in an advisory capacity to this company, or in certain other circumstances.
This report is based on information obtained from public sources and sources believed to be reliable, but no independent verification has been made nor is its accuracy or completeness guaranteed. This report and information herein is solely for informational
purpose and shall not be used or considered as an offer document or solicitation of offer to buy or sell or subscribe for securities or other financial instruments. Though disseminated to all the customers simultaneously, not all customers may receive this report at the
same time. ICICI Securities will not treat recipients as customers by virtue of their receiving this report. Nothing in this report constitutes investment, legal, accounting and tax advice or a representation that any investment or strategy is suitable or appropriate to your
specific circumstances. The securities discussed and opinions expressed in this report may not be suitable for all investors, who must make their own investment decisions, based on their own investment objectives, financial positions and needs of specific recipient.
This may not be taken in substitution for the exercise of independent judgment by any recipient. The recipient should independently evaluate the investment risks. The value and return on investment may vary because of changes in interest rates, foreign exchange
rates or any other reason. ICICI Securities accepts no liabilities whatsoever for any loss or damage of any kind arising out of the use of this report. Past performance is not necessarily a guide to future performance. Investors are advised to see Risk Disclosure
Document to understand the risks associated before investing in the securities markets. Actual results may differ materially from those set forth in projections. Forward-looking statements are not predictions and may be subject to change without notice.
ICICI Securities or its associates might have managed or co-managed public offering of securities for the subject company or might have been mandated by the subject company for any other assignment in the past twelve months.
ICICI Securities or its associates might have received any compensation from the companies mentioned in the report during the period preceding twelve months from the date of this report for services in respect of managing or co-managing public offerings,
corporate finance, investment banking or merchant banking, brokerage services or other advisory service in a merger or specific transaction.
ICICI Securities encourages independence in research report preparation and strives to minimize conflict in preparation of research report. ICICI Securities or its associates or its analysts did not receive any compensation or other benefits from the companies
mentioned in the report or third party in connection with preparation of the research report. Accordingly, neither ICICI Securities nor Research Analysts and their relatives have any material conflict of interest at the time of publication of this report.
Compensation of our Research Analysts is not based on any specific merchant banking, investment banking or brokerage service transactions.
ICICI Securities or its subsidiaries collectively or Research Analysts or their relatives do not own 1% or more of the equity securities of the Company mentioned in the report as of the last day of the month preceding the publication of the research report.
Since associates of ICICI Securities are engaged in various financial service businesses, they might have financial interests or beneficial ownership in various companies including the subject company/companies mentioned in this report.
ICICI Securities may have issued other reports that are inconsistent with and reach different conclusion from the information presented in this report.
Neither the Research Analysts nor ICICI Securities have been engaged in market making activity for the companies mentioned in the report.
We submit that no material disciplinary action has been taken on ICICI Securities by any Regulatory Authority impacting Equity Research Analysis activities.
This report is not directed or intended for distribution to, or use by, any person or entity who is a citizen or resident of or located in any locality, state, country or other jurisdiction, where such distribution, publication, availability or use would be contrary to law,
regulation or which would subject ICICI Securities and affiliates to any registration or licensing requirement within such jurisdiction. The securities described herein may or may not be eligible for sale in all jurisdictions or to certain category of investors. Persons in
whose possession this document may come are required to inform themselves of and to observe such restriction.
September 29, 2020 ICICI Securities Ltd. | Retail Equity Research 10
Disclaimer