bmc bioinformatics biomed...
TRANSCRIPT

BioMed CentralBMC Bioinformatics
ss
Open AcceMethodology articleApplying Support Vector Machines for Gene ontology based gene function predictionArunachalam Vinayagam*1, Rainer König2, Jutta Moormann1,3, Falk Schubert2, Roland Eils2, Karl-Heinz Glatting1 and Sándor Suhai1Address: 1Department of Molecular Biophysics, Deutsches Krebsforschungszentrum (DKFZ), TP3, Im Neuenheimer Feld 580, Heidelberg, D-69120, Germany, 2Theoretical Bioinformatics, Deutsches Krebsforschungszentrum (DKFZ), TP3, Im Neuenheimer Feld 580, Heidelberg, D-69120, Germany and 3Institut für Medizinische Biometrie, Epidemiologie und Informatik (IMBEI), Johannes Gutenberg-Universität Mainz, 55101, Mainz, Germany
Email: Arunachalam Vinayagam* - [email protected]; Rainer König - [email protected]; Jutta Moormann - [email protected]; Falk Schubert - [email protected]; Roland Eils - [email protected]; Karl-Heinz Glatting - [email protected]; Sándor Suhai - [email protected]
* Corresponding author
AbstractBackground: The current progress in sequencing projects calls for rapid, reliable and accuratefunction assignments of gene products. A variety of methods has been designed to annotatesequences on a large scale. However, these methods can either only be applied for specific subsets,or their results are not formalised, or they do not provide precise confidence estimates for theirpredictions.
Results: We have developed a large-scale annotation system that tackles all of these shortcomings.In our approach, annotation was provided through Gene Ontology terms by applying multipleSupport Vector Machines (SVM) for the classification of correct and false predictions. The generalperformance of the system was benchmarked with a large dataset. An organism-wise cross-validation was performed to define confidence estimates, resulting in an average precision of 80%for 74% of all test sequences. The validation results show that the prediction performance wasorganism-independent and could reproduce the annotation of other automated systems as well ashigh-quality manual annotations. We applied our trained classification system to Xenopus laevissequences, yielding functional annotation for more than half of the known expressed genome.Compared to the currently available annotation, we provided more than twice the number ofcontigs with good quality annotation, and additionally we assigned a confidence value to eachpredicted GO term.
Conclusions: We present a complete automated annotation system that overcomes many of theusual problems by applying a controlled vocabulary of Gene Ontology and an establishedclassification method on large and well-described sequence data sets. In a case study, the functionfor Xenopus laevis contig sequences was predicted and the results are publicly available at ftp://genome.dkfz-heidelberg.de/pub/agd/gene_association.agd_Xenopus.
Published: 26 August 2004
BMC Bioinformatics 2004, 5:116 doi:10.1186/1471-2105-5-116
Received: 11 May 2004Accepted: 26 August 2004
This article is available from: http://www.biomedcentral.com/1471-2105/5/116
© 2004 Vinayagam et al; licensee BioMed Central Ltd. This is an open-access article distributed under the terms of the Creative Commons Attribution License (http://creativecommons.org/licenses/by/2.0), which permits unrestricted use, distribution, and reproduction in any medium, provided the original work is properly cited.
Page 1 of 14(page number not for citation purposes)

BMC Bioinformatics 2004, 5:116 http://www.biomedcentral.com/1471-2105/5/116
BackgroundOngoing genome sequencing and recent developments incDNA sequencing projects have led to an exponential risein the amount of sequence information. This hasincreased the need for acquiring knowledge fromsequences as to their biological function. Annotating asingle sequence is the gateway to interpreting its biologi-cal relevance. However, the usefulness of these annota-tions is highly correlated with their quality. Accurateannotation has traditionally been maintained manuallywith the experience of individual experts and the experi-mental characterisation of sequences. However, theincreasing gap between the amount of sequence dataavailable and the time needed for their experimental char-acterisation demands computational function predictionin complementing manual curation [1-4]. Commonly,computational functional assignment is based on homo-logues identified from database searches [5]. Such anautomated annotation process provides comparableresults due to a uniform analysis of all query sequencesacross the same databases and the possibility of repeatingthe annotation to updated sequence data [6]. However,crucial aspects for consideration in automated annotationare i) the problems associated with the databases them-selves: sequence errors, erroneous annotation due tospelling ambiguities, incomplete functional annotation,inconsistent functional annotation across databases, con-sistent but wrong annotation across databases, and ii) theproblems associated with the inference, i.e. false positives,where an assignment is made on the basis of a wronglyinferred homology [3,7,8]. A number of excellent annota-tion systems have been developed to tackle these prob-lems, e.g. RiceGAAS [9], GAIA [10], Genotator [11],Magpie [12], GeneQuiz [6], GeneAtlas [13] and PEDANT[14]. However, little has been done to quantify the anno-tation accuracy by defined benchmarks and establish amethod to provide a confidence value for eachannotation.
The current annotation, written in a rich, non-formalisedlanguage also complicates this automated process. Weaddressed this problem by applying a controlled vocabu-lary from Gene Ontology (GO) [15-17]. GO provides con-sistent descriptions of gene products in a species-independent manner. The GO terms are organised instructured, controlled vocabularies (ontologies) todescribe gene products in terms of their associated biolog-ical processes, cellular components and molecular func-tions. An increasing number of GO-mapped sequencedatabases make it possible to replace traditional databasesearches with GO-related searches. These include data-bases such as GenBank [18], SWISS-PROT [18], Swiss-PROT/TrEMBL [19], the TIGR Gene Index [20] and severalother genome databases. Many annotation approacheshave now been developed based on Gene Ontology. The
uncharacterised sequences are searched across GO-mapped protein databases and assigned with GO terms ofthe best hits [21,22]. Jensen and co-workers used neuralnetworks to predict specific subsets of GO terms [23]. Fur-thermore, Schung et al predicted GO terms by intersectingdomain profiles [24]. The SwissPROT/TrEMBL entrieswere associated with GO terms by an automated processcoupled with manual verification [19]. Text mining andsimilarity searches were combined to annotate SWISS-PROT and GenBank entries with GO terms [18]. However,these approaches were either applied to specific GO sub-sets or did not provide defined benchmarks and confi-dence values for their predictions.
We have developed an automated system for large-scalecDNA function assignment, designed and optimised toachieve a high-level of prediction accuracy without anymanual refinement. Our system assigns molecular func-tion GO terms to uncharacterised cDNA sequences anddefines a confidence value for each prediction. The cDNAsequences were searched against GO-mapped proteindatabases and the GO terms were extracted from thehomologues. In the training phase, these GO terms werecompared to the GO annotation of the query sequencesand labelled correspondingly. We applied Support VectorMachines (SVMs) as the machine learning method to clas-sify whether the extracted GO terms were appropriate tothe cDNA sequence or not. In order to classify the GOterms we used a broad variety of elaborated features(attributes) including sequence similarity measures, GOterm frequency, GO term relationships between homo-logues, annotation quality of the homologues, and thelevel of annotation within the GO hierarchy. To enhancethe reliability of the prediction, we used multiple SVMsfor classification and applied a committee approach tocombine the results with a voting scheme [25]. Theconfidence values for the predicted GO terms wereassigned based on the number of votes i.e. number ofSVMs predicting particular GO term as correct. The per-formance of the system was benchmarked with 36,771GO-annotated cDNA sequences derived from 13 organ-isms. It achieved 80% precision for 74% of the testsequences. We applied our annotation system to predictthe function for Xenopus laevis, a widely studied modelorganism in developmental biology. Because manyresearchers are now focussing on the functional genomicsof this organism, a demand exists for a quality annotation[26]. Therefore we applied our system to improve thequality and coverage of the existing annotation. We pre-dicted the function for 17,804 Xenopus laevis contigsequences (from TIGR Gene Indices) yielding annotationwith good confidence values for more than half of thesesequences.
Page 2 of 14(page number not for citation purposes)

BMC Bioinformatics 2004, 5:116 http://www.biomedcentral.com/1471-2105/5/116
ResultsGeneral workflow of training and classificationThe classifier (SVM) needs to specify attribute values (fea-tures) for a broad list of samples and a class label for eachof these samples. Through the training samples it learnsthe feature patterns and tries to group them according totheir class labels. After training, the algorithm assigns classlabels to new samples according to the class that they bestmatch.
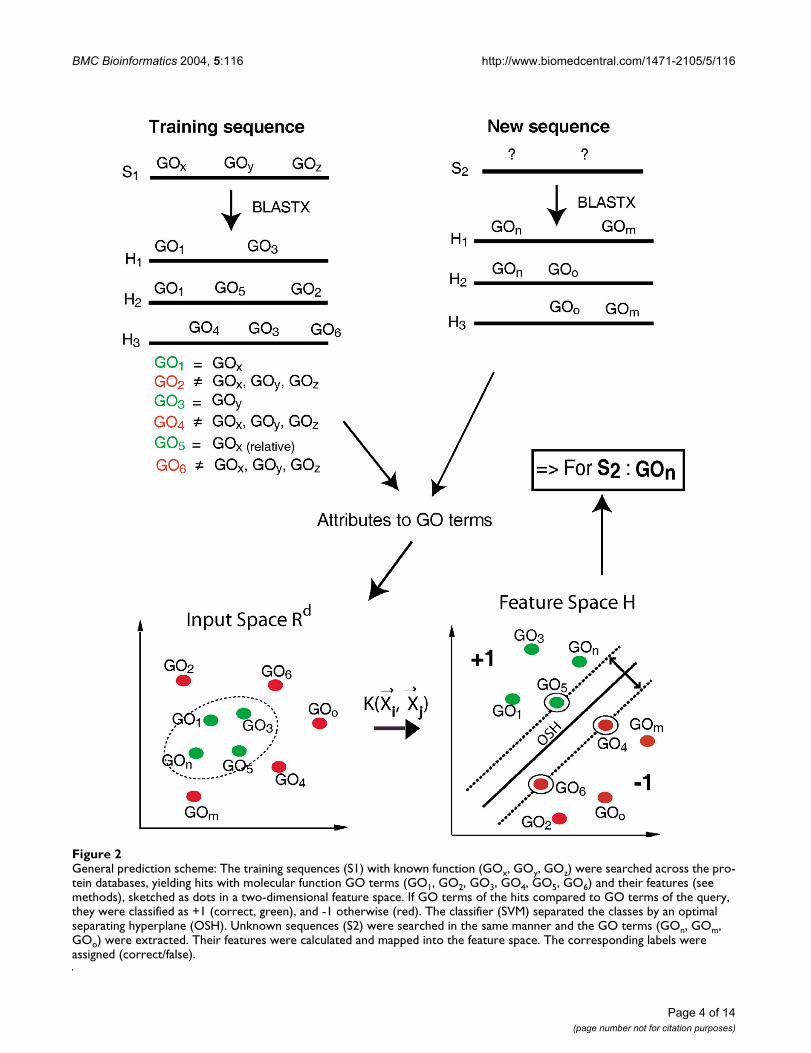
We selected GO-annotated cDNA sequences for trainingthe SVM classifier. The nucleotide sequences weresearched against GO-mapped protein databases and GO-annotations were extracted from the significant hits. Then,each GO term obtained was utilized as a sample for thefeature table. The sample GO terms were then labelled aseither correct ("+1") or false ("-1") by comparing them tothe original annotation. Note that we applied the relation-ships of the GO terms based on their graph structure:"Correct" was assigned not only if they were exact matchesbut also if the GO terms were related as either "parent" or"child" (Figure 1). Next, the samples were attached withtheir features or attributes, calculated from the BLAST [27]results. With this data, the classifier was trained to distin-guish between the attribute patterns that contributed toclass +1 (correct prediction of a GO term) and class-1(false prediction). To predict the function of unknownsequences, the same procedure was applied as for thetraining sequences in order to obtain their GO terms andcorresponding attribute values. According to theseattribute values, the classifier assigned a class for every GOterm of the BLAST hits (Figure 2).
Datasets for training and testing SVMFor training and testing the SVM, we selected 39,740 GO-annotated cDNA sequences from the following organ-isms: Saccharomyces cerevisiae (yeast), Drosophila mela-nogaster (fly), Mus musculus (mouse), Arabidopsis thaliana(Arabidopsis), Caenorhabditis elegans (worm), Rattus nor-vegicus (rat), Danio rerio (fish), Leishmania major (Leishma-nia), Bacillus anthracis Ame (Bacillus), Coxiella burnetii RSA493 (Coxiella), Shewanella oneidensis MR-1 (Shewanella),Vibrio cholerae (Vibrio) and Plasmodium falciparum (Plasmo-dium) (Table 1). From these, 55.3% of the cDNAsequences were contributed by Arabidopsis, mouse and fly(22.1%, 18%, and 15.2% respectively). Prokaryotic bacte-ria (Bacillus, Coxiella, Shewanella and Vibrio) contributed20.6% and the remaining 24.1% of the sequences camefrom rat, fish, worm, Plasmodium, Leishmania and yeast.Yeast and fly are purely manually annotated datasets.Where as Bacillus, Coxiella, Vibrio, Shewanella, Leishmaniaand Plasmodium are mostly manually, and the rest mostlyautomatically annotated datasets. Manual annotationtends to be conservative and sparse, since the GO termsare assigned only if the annotator is highly confident.Therefore, a GO term may be missed due to a poor defini-tion of a false negative. To reduce this critical problems,yeast and fly annotations are accompanied by an"unknown molecular function" term for sequences withquestionable further functions. To reduce false negatives,we discarded all sequences with these tags for training andtesting (yeast: 2999 discarded out of 6355, fly: 8495 outof 14335).
A schematic representation of possible GO term relationshipsFigure 1A schematic representation of possible GO term relationships: A: GO1 is a "parent" of GO2 in a single path relationship. B: GO1 is a "parent" of GO2 in a multiple path relationship. C: GO1 is a "child" of GO2 in a single path relationship. D: GO1 is a "child" of GO2 in a multiple path relationship. E: GO1 and GO2 are "siblings" in a single path relationship. F: GO1 and GO2 are "siblings" in a multiple path relationship. MF denotes the molecular function node (root).
Page 3 of 14(page number not for citation purposes)
BMC Bioinformatics 2004, 5:116 http://www.biomedcentral.com/1471-2105/5/116
General prediction schemeFigure 2General prediction scheme: The training sequences (S1) with known function (GOx, GOy, GOz) were searched across the pro-tein databases, yielding hits with molecular function GO terms (GO1, GO2, GO3, GO4, GO5, GO6) and their features (see methods), sketched as dots in a two-dimensional feature space. If GO terms of the hits compared to GO terms of the query, they were classified as +1 (correct, green), and -1 otherwise (red). The classifier (SVM) separated the classes by an optimal separating hyperplane (OSH). Unknown sequences (S2) were searched in the same manner and the GO terms (GOn, GOm, GOo) were extracted. Their features were calculated and mapped into the feature space. The corresponding labels were assigned (correct/false).
Page 4 of 14(page number not for citation purposes)

BMC Bioinformatics 2004, 5:116 http://www.biomedcentral.com/1471-2105/5/116
The cDNA sequences were searched across the proteindatabases covering a wide range of organisms fromprokaryotes to eukaryotes and SWISSPROT. For 36,771sequences we got hits with GO terms, contributing to856,632 sample GO terms and yielding an average of23.29 GO terms per query sequence (Table 1). These856,632 samples were used to train our classifier. Gener-ally, the number of GO terms per sequence was less forprokaryotes than for eukaryotes. Rat had the maximumnumber of GO terms per sequence (36.9), followed byfish (32.1) and worm (27.13). In contrast, Shewanella,Coxiella and Vibrio sequences had the lowest number ofGO terms per sequence (10.78, 12.33 and 12.54,respectively).
SVM training and testingSVM trainingWe set up multiple classifiers by splitting the whole data-set (856,632 samples) into 99 equal subsets. Note that,amongst these 99 subsets, 96 contained data from a singleorganism and the remaining 3 from two organisms each.Subsequently, we built 99 classifiers with these subsets.Since the training sets were created organism-wise, theclassifiers were trained from different ranges of data,based on purely manual annotation (yeast, fly), mostlyautomated annotation or a mixture of both. For trainingeach of these classifiers, we performed a model selection(parameter optimisation by cross-validation; seeMethods), which yielded varying accuracy values rangingfrom 78.81% to 96.03%, with an average accuracy of85.11%.
SVM testingTo test the classifiers performance, we prepared 13 test sets(each set corresponding to a single organism) using thesame 856,632 sample GO terms. The prediction quality ofall 99 classifiers were assessed by an organism-wise cross-validation approach, i.e. for each organism (test set), weused all the classifiers for prediction except those that cor-responded to the same organism. With this approach, wewere able to simulate the annotation of a new organism.The number of classifiers used for predictions variedhighly across organisms (maximum: Plasmodium andLeishmania, 98 classifiers; minimum: Arabidopsis, 74 classi-fiers). The quality of the predictions was estimated bycomparing the predicted terms with the original annota-tion and the results were expressed in terms of precisionand accuracy values (see Methods). The average-accuracyrefers to the average of the accuracy values attained by allclassifiers used for the prediction. The maximum average-accuracy was achieved for fly (81.51%), followed by yeast(80.50%), and the minimum for mouse (76.0%).
Additionally, we compared the classification efficiency ofthe classifier derived from automatic annotation (mouse,worm and Arabidopsis) with the manually annotated testsequences (yeast and fly). The prediction of the yeast andfly sequences with the 20 classifiers from the mousesequences produced an average-accuracy of 79% and 80%respectively. Similar results were acquired with the 25classifiers from Arabidopsis (79% and 80%). Likewise, theworm classifiers (11 classifiers) yielded the average-accu-racy of 82% for yeast and 83% for fly. These values werecomparable with the average-accuracy of 81% achieved byboth, using yeast as test sequences against fly classifiers(16 classifier) and vice-versa (fly test sequences against
Table 1: Training and test dataset: Datasets used for training and testing the support vector machines. The columns are: 1. The number of cDNA sequences for training. 2. The number of cDNA sequences with BLAST hits having GO molecular function terms. 3. The average number of GO molecular function terms per cDNA sequence of the BLAST-hits. 4. The classification of GO terms coming from the hits, positive if the GO terms were similar to original annotation, negative otherwise.
Organisms Number of cDNAs cDNA with MF GO Number of GO/cDNA Class distribution% Positive % Negative
Rat 1039 1036 36.90 25.7 74.3Fish 1061 1044 32.10 39.2 60.8Fly 5840 5574 25.47 23.4 76.6Worm 4272 3458 27.13 39.5 60.5Plasmodium 274 271 23.67 28.0 72.0Leishmania 82 82 20.51 35.1 64.9Yeast 3356 2972 18.60 23.7 76.3Bacillus 2729 2577 13.63 35.4 64.6Coxiella 931 900 12.33 37.0 63.0Shewanella 2413 2303 10.78 33.0 67.0Vibrio 1832 1804 12.54 31.9 68.1Arabidopsis 8807 8120 26.66 30.2 69.8
Page 5 of 14(page number not for citation purposes)

BMC Bioinformatics 2004, 5:116 http://www.biomedcentral.com/1471-2105/5/116
yeast classifiers). Likewise, we classified the mouse testsequences against yeast classifiers (5 classifier) and flyclassifiers yielding 69% and 71% average-accuracyrespectively.
Combining multiple classification results by the committee approachThough we already achieved a good accuracy with some ofthe classifiers, our intention was to improve the precisionand, furthermore, to obtain confidence values for the pre-dicted GO terms. To this end, we combined the predic-tions of multiple classifiers by the committee approach. Ifa classifier predicted a particular GO term as correct, itcontributed a vote. Votes were collected from all classifiersand summed up to yield a final score value. If no vote sup-ported a GO term as correct, it was assigned with the label"false". Otherwise, the number of votes provided a meas-ure of the reliability. Figure 3 shows precision and accu-racy versus the number of votes. If we made predictionswith a minimum of one vote, we were able to achieve 43%precision and 59% accuracy. When the stringency wasraised to 25 votes, a minimum of 25 votes was required to
classify a GO term as correct, yielding an accuracy of 84%and precision of 75%. At a cut-off value of 74 votes, weattained 91% precision and 71% accuracy. A cut-off valueof 94 votes gave 100% precision and 67% accuracy. Ouraccuracy reached a plateau at 20 votes. However, itdecreased slightly for stringencies of more than 30 votes.Note, that this was due to the increasing number of falsenegatives. The relation between the precision and thenumber of votes (Figure 3) was used as a means of cali-brating to assign the confidence values for newpredictions.
For each threshold value of the votes, we calculated thesensitivity and the false positive rate to obtain a ReceiverOperating Characteristic plot (ROC; Figure 4). The graphshows that the classification performance was comparablefor different classes of organisms like prokaryotes, singlecell eukaryotes and multi-cellular eukaryotes, whichreflect the organism-independent performance of ourmethod. Note that for fish, worm, Plasmodium and Leish-mania the classification performance was particularlygood due to the low number but well characterised testsequences.
Accuracy and precision against the number of votesFigure 3Accuracy and precision against the number of votes: The accuracy and precision values of the test data is plotted against the number of votes. An increasing number of votes increased the precision monotonically. Higher stringency yielded a sparse lowering of the accuracy due to the rate of false negatives. The relation between the precision and the number of votes was used for assigning confidence values for new predictions.
ROC plots for the classifiers performanceFigure 4ROC plots for the classifiers performance: ROC plots for the results of all organisms tested and the average of all test sequences. The classification performance for different classes of organisms like multi-cellular eukaryotes, single-cell eukaroyotes and the prokaryotes were compared.
Page 6 of 14(page number not for citation purposes)

BMC Bioinformatics 2004, 5:116 http://www.biomedcentral.com/1471-2105/5/116
We compared the prediction performance for GO termsannotated with the evidence code IEA (automated anno-tation) and non-IEA (manually verified annotation). Allsequences from Bacillus, Coxiella, Vibrio, Shewanella, yeast,Leishmania, and Plasmodium were non-IEA annotated and99.5% of the fly GO terms were non-IEA annotated. Incontrast, all sequences from fish and worm were IEAannotated. The remaining test organisms were mostly IEAannotated (rat: 88%, Arabidopsis: 79.4%, and mouse:69.5%). The classification performances revealed by theROC plots were comparable between IEA and non-IEAannotated test organisms (Figure 4). Therefore, the classi-fier could reproduce the annotation of other automatedsystems as well as high-quality manual annotation. Wewere interested in the coverage of sequences with respectto the average precision of the annotations (shown in Fig-ure 5). Considering 1 vote as the cut-off value, weobtained 52% average precision for 98% coverage. Weobtained 80% average precision for 74% coverage (cut-off: 34 votes), and 90% average precision for 42% cover-age (cut-off: 65 votes). These coverage values varied whenregarding the test organisms individually. The coveragefor different test organisms at 80% average precision were:fish 97%, Coxiella 89%, worm 88%, Vibrio 86%, rat 85%,Bacillus 83%, Plasmodium 81%, mouse 78%, Leishmania76%, Shewanella 74%, Arabidopsis 69%, fly 66% and yeast57%.
Xenopus annotationWe extracted all Xenopus laevis contig sequences from theTIGR Xenopus laevis Gene Index (XGI) [28] and got a total
of 35,251 contig sequences, excluding singletons. Weapplied our method to predict functional GO terms forthese contig sequences. We predicted the function for17,804 sequences with an average of 12.16 GO terms persequence. In total, 23.4% of all the GO terms were pre-dicted with less than 50% confidence value, 51.5% ofthem were between 50% to 80% confidence and theremaining 25% with a predicted confidence value ofabove 80%. At 80% stringency (predicted if the GO termpossessed a confidence value of 80% or more), we madepredictions for 9,510 contig sequences including 55,994GO terms, yielding on average 5.88 GO terms persequence.
To compare the functional abundance of the expressedgenome across the organisms, we mapped the predictedGO terms (with at least one vote) to the high-level, i.e.more generalised or high-level terms of the molecularfunction ontology ("GO slim" for molecular function)[29]. These molecular function GO slim nodes were takenfrom the second level of the molecular function ontology.The distribution of higher-level GO terms were comparedbetween Xenopus, fly, yeast and mouse (Figure 6). Notethat some of the deeper-level terms had multiple paths.They were mapped to two or more higher-level nodes, sothat the total sum of the higher-level nodes exceeded100%.
Comparison to the TIGR Xenopus annotationTIGR provides a GO mapping for Xenopus contigs (TIGRXenopus laevis gene indices). We compared our annotationwith the TIGR GO annotation for molecular function.From 35,251 contig sequences, TIGR annotated 5,444contigs with a total of 16,432 molecular function GOterms. In contrast, our approach was able to predict func-tion terms for 17,804 contigs, i.e. more than three timesthat of TIGR sequences. Our procedure did not annotate295 contigs from the TIGR annotated contigs. For theremaining 5,149 contigs, 85% of all TIGR terms werefound to be exact with those using our method; 3.2% ofthe TIGR terms were at a higher-level of the GO tree thanour annotation, so in this case we provided annotation ata deeper level; in 0.9% of the cases our annotation was ata higher-level; 8.3% of the cases were completely differ-ent; and 0.6% of the TIGR terms were obsolete. We com-pared the quality of TIGR and that of our annotations bya raising stringency and found that when we applied aconfidence threshold of 80% for our annotation, we lost46.6% of the sequences. This included 1,492 sequencesholding equivalent TIGR annotation or 27.4% of the totalTIGR annotation. With this stringency, our system anno-tated 9,510 contig sequences, i.e. twice the TIGR annota-tion at this quality.
Precision against the sequence coverageFigure 5Precision against the sequence coverage: Average precision against sequence coverage for all 13-test organisms (circles). The red line denotes a fitting curve.
Page 7 of 14(page number not for citation purposes)

BMC Bioinformatics 2004, 5:116 http://www.biomedcentral.com/1471-2105/5/116
We were interested in novel annotated sequences with thehighest confidence values and found we could predict GOterms for 557 contigs with a confidence value of 100% (allvotes matched). Interestingly, 192 of these lacked any GOannotation by TIGR. Out of these, 184 had got a descrip-tive TIGR annotation and the rest had not got any. Table2 shows the novel annotation for these eight sequences.Our novel predictions are as follows: 1) TC212171 andTC196381 are predicted to display endopeptidase activityand more specifically serine-type peptidase activity (98%and 97% confidence respectively). 2) TC209487 andTC190605 are predicted to be aminopeptidases, howeverfor the latter the more specific prediction of prolyl ami-nopeptidase activity is assigned with 86% confidence. 3)TC199713 is predicted as glutathione peroxidase at 100%confidence and TC194305 is annotated as protein kinasewith the same confidence. 4) Both TC187949 andTC210151 are transmembrane receptors but the latter one is
classified as frizzled receptor with 82% confidence. In mostof these examples the functional assignment andassociated confidence were recorded in multiple levels ofgranularity.
DiscussionIn this paper, we presented an automatic annotation sys-tem that is able to cope with the expanding amount ofbiological sequence data. Our approach efficiently com-bines the ongoing efforts of Gene Ontology and the avail-ability of GO-mapped sequences with a profoundmachine learning system. The GO-mapped databases pro-vide annotation described in a controlled vocabulary andalso a measure of reliability, as these GO entries arelabelled with their type of origin. Furthermore, GO termsare structured hierarchically, which allow us a twofold useof the information: i) the level within the tree is taken asa classification criterion to distinguish low from high-
Comparison of GO slims between Xenopus, fly, yeast and mouseFigure 6Comparison of GO slims between Xenopus, fly, yeast and mouse: Distributions of higher-level GO terms (,,GO slim", see text) for Xenopus, fly, yeast and mouse. The sum of all high-level terms may exceed the total number of the annotated terms, since some terms may have more than one high-level "parent" terms due to multiple paths.
Page 8 of 14(page number not for citation purposes)

BMC Bioinformatics 2004, 5:116 http://www.biomedcentral.com/1471-2105/5/116
level annotations during the learning procedure, and, ii)the hierarchical structure allows us to extend hits byslightly moving up and down within a restricted local areaof the tree. This may overcome fluctuations of the annota-tion levels coming from varying annotation experts.
Our annotation system exploits the different combina-tions of attributes and yields functional transitivity: SVMlearning and prediction are organism-independent andcomparable to manual annotation, which may be sup-ported by the nature of the attributes we utilise. Subsetsand overlaps are counted in a balanced fashion to avoidbiases due to the complexity of an organism and a poten-tially correlated complexity of its sequences. The commit-tee approach allows us to improve the prediction qualityas well as to assign confidence values for the new predic-tions in a straightforward manner. Our classifiersperformance is hardly limited by the varying quality of thetraining data, whether manual or automatic annotated.The prediction results of manually annotated test sets withthe classifiers based on automated annotation as well asclassifiers based on manual annotation were comparable.Regarding the outcome of the overall classifiers, we
achieve consistency with existing annotation from auto-matic annotations. This is the less complex part of ourwork and shows a comparable efficiency of our system.Additionally, our system reproduces annotation of purelymanually annotated datasets (fly, yeast, etc). However,the performance results for these datasets are low in termsof recall, i.e. 47.4% recall with 80% precision compared to60.6% recall with the same precision of the complete testset. Note that manual annotation tends to be conservativeand sparse, yielding stringent true positive definitions,whereas automatically annotated sequences may accumu-late information to a greater extent.
We were interested in annotating Xenopus since it is afamiliar model organism. However, the sequences werenot very well annotated. Our system was applied to anno-tate the Xenopus contig sequences from TIGR. Through ourapproach, we annotated 50.5% of all contig sequencesavailable at present, and associated a confidence value foreach prediction, yielding roughly three times moresequences as compared to the currently available GOannotation. However, the coverage of annotation to neworganism like Xenopus is crucial. We were able to attain
Table 2: The novel predictions with high confidence values (100%). The columns correspond to TC (TIGR-id) number, GO term level in GO-structure, the confidence values and the GO number and GO terms.
TC Numbers GO level Confidence value GO ID GO terms
TC212171 4 100% GO:0008233 peptidase activity5 100% GO:0004175 endopeptidase activity5 98% GO:0008236 serine-type peptidase activity3 98% GO:0016787 hydrolase activity
TC196381 5 100% GO:0004175 endopeptidase activity4 98% GO:0008233 peptidase activity3 98% GO:0016787 hydrolase activity5 97% GO:0008236 serine-type peptidase activity
TC209487 2 100% GO:0003824 enzyme activity3 100% GO:0016787 hydrolase activity5 90% GO:0004177 aminopeptidase activity4 85% GO:0017171 serine hydrolase activity
TC187949 4 100% GO:0004888 transmembrane receptor activity3 97% GO:0004872 receptor activity
TC194305 2 100% GO:0003824 enzyme activity3 99% GO:0016740 transferase activity3 99% GO:0016301 kinase activity6 97% GO:0004672 protein kinase activity
TC210151 3 100% GO:0004872 receptor activity4 97% GO:0004888 transmembrane receptor activity6 82% GO:0004928 frizzled receptor activity
TC199713 6 100% GO:0004602 glutathione peroxidase activity3 98% GO:0016491 oxidoreductase activity5 85% GO:0004601 peroxidase activity
TC190605 2 100% GO:0003824 enzyme activity3 100% GO:0016787 hydrolase activity4 87% GO:0017171 serine hydrolase activity6 86% GO:0016804 prolyl aminopeptidase activity
Page 9 of 14(page number not for citation purposes)

BMC Bioinformatics 2004, 5:116 http://www.biomedcentral.com/1471-2105/5/116
predictions for 50.5% of all Xenopus contig sequences (nosingletons). This compares to the applied databases thatcontained 53% satisfactory annotation for their sequences(not regarding sequences with unknown function terms),and better than the organism specific databases (36%).Obviously, improving the quality and quantity of annota-tion within the available databases goes along with thecoverage exploit of machine learning algorithms for neworganisms. In future we want to extend our method withthe information from other sources such as domain data-bases and protein family databases.
ConclusionsWe developed an automated annotation system to assignfunctional GO terms to an unknown sequence. We usedthe well-established technique of Support VectorMachines (SVM) for the classification of correct and incor-rect GO terms. Our approach benefited from the broadvariety of potential attributes used for the functional tran-sitivity and a vast amount of data used for training andvalidating. The committee scheme exploited in our systemprovided a means to assign confidence values in astraightforward manner. Our system performance wasrobust, organism-independent and reproduced the high-quality manual annotation. When applying it to Xenopuslaevis contig sequences, we obtained a remarkablyenhanced annotation coverage compared to the existingannotation.
MethodsQuality criteria for assessing the performance of the classifierWe used the following statistical terms [30,31].
Accuracy was the rate of correct predictions compared toall predictions,
Accuracy: = (TP + TN) / (TP + FP + TN + FN), (1)
where TP denotes true positives, FP false positives, TN truenegatives and FN false negatives. Precision was the portionof true positives with respect to all positives,
Precision: = TP / (TP + FP). (2)
Also used were sensitivity := TP / (TP + FN), specificity := TN/ (FP + TN), and false positive rate := 1 - specificity. Wedefined the term "coverage-of-sequences" as the portion ofquery sequences for which the classifier delivers a predic-tion; "Precision-per-sequence" the (average) portion of cor-rect GO terms for a single query sequence, with respect toall GO terms assigned to it. Note that these terms weredefined within our model, i.e. a good "accuracy" meantgood consistency with respect to our training and test sets.
Defining the GO term relationshipsWe focused on the molecular function terms from GO,because the information extracted from the gene productsis usually more predictive for determining molecularfunctions than for biological processes or cellular compo-nents. The functional terms and their hierarchy wereobtained from the web pages of the Gene Ontology Con-sortium [29] (version of June 2003). In our study, rela-tionships "is-a" and "part-of" were not distinguished.Note, that the "part-of" relationship is rare in the molecu-lar function ontology (26 out of 6521 child-parent rela-tionships). The annotation level varies across databasesdepending on the curator's individual knowledge aboutthe gene product. To consider varying levels of annotationin the databases for similar gene products, we traced therelationships to match GO terms of different granularityfor the same function. To find a relationship between twoterms, the whole path of a GO term was traced back to theroot (the root is the "molecular function" node,GO:0003674). We defined the distance between two GOterms as the distance of the shortest path. GO terms areorganised in directed acyclic graphs, i.e. a child (more spe-cialised term) may have multiple parents (less specialisedterms). Therefore, we defined single path and multiplepath relationships. In the case of single path relationships,GO terms had only one possible path to the root. Therelationship of the term GO1 with respect to GO2 was clas-sified as "parent", "child", "sibling" or "different" (Figure1) according to the following rules:
GO2 is a "parent" of GO1 if their respective paths P2 and P1intersect in such a manner that
P1 ⊂ P2, (3)
Pi denotes the set of nodes from GOi to the root
GO2 is a "child" of GO1 if their paths P2 and P1 intersectsuch that
P1 ⊃ P2, (4)
GO2 is a "sibling" of GO1 if a common parent exists with adistance of one to GO1 and GO2 (Figure 1E). To avoidambiguities for less differentiated terms, the sibling rela-tionship was set only, if GO1 and GO2 were at least 5nodes away from the root.
The relationship "different" was set if none of the previ-ously stated criteria was fulfilled.
We could apply the single path relationship for most ofthe GO terms (3665 out of 5391). However, for theremaining 1726 terms more than one path to the rootwere found. For these cases we defined multiple path rela-
Page 10 of 14(page number not for citation purposes)

BMC Bioinformatics 2004, 5:116 http://www.biomedcentral.com/1471-2105/5/116
tionships and each path was considered individually. Thesingle path relationship was applied to each possible pairof these paths (path for GO1 and GO2, respectively) and ishenceforth referred to as "path-pairs". This method couldyield a list of several relations. To select the appropriaterelation from this list, we considered the parent relation-ship to be most relevant, followed by the childrelationship, and the sibling was considered least relevant.We implemented the following order:
1. The parent relationship was set if at least one of thepath-pairs gave a (single path) parent relationship;
2. The child relationship was set if at least one of the path-pairs gave a child relationship. To avoid a bias due to anoverwhelming number of path-pairs that did not match,we set a threshold: we considered this relationship only, ifthe number of path-pairs with no child relationship wasequal or less than four times the number of path-pairswith child relationship;
3. The sibling relationship was set if at least one of thepath-pairs gave a sibling relationship. We again set athreshold: we considered this relationship only, if thenumber of path-pairs with no sibling relationship wasequal or less than twice the number of pairs with siblingrelationship;
4. If none of these criteria could be applied, the relation-ship "different" was set.
Note that we also implemented the hierarchy of theserelations by tuning the stringencies for the fractions ofpath-pairs that must match (parent: no threshold, child:1/4, sibling: 1/2).
Data basis used for this studySince the function transitivity at the protein level is morereliable, we used GO-mapped protein databases forsearching homologues. Gene association files wereobtained via the Gene Ontology Consortium. By combin-ing the gene association files with correspondingsequence databases we created the unified protein data-bases. The following organisms were used: yeast, fly,mouse, Arabidopsis, worm, rat, fish, Leishmania, Bacillus,Coxiella, Shewanella, Vibrio, Plasmodium, Oryza sativa,Trypanosoma brucei, and Homo sapiens. Apart from this, theSWISS-PROT database was also included [32]. For SVMtraining and testing we selected 39,740 cDNA sequencesfrom 13 organisms. These cDNA sequences were collectedfrom the following organisms: yeast, fly, mouse, Arabidop-sis, worm, rat, fish, Leishmania, Bacillus, Coxiella,Shewanella, Vibrio and Plasmodium (see Table 1). Out of allthe known cDNA sequences we extracted 39,740 with GOmolecular function terms, discarding incompletely anno-
tated ones, i.e. sequences assigned with the GO term"molecular function unknown" (GO:0005554).
Computing the attributesEach cDNA sequence was searched across the proteindatabases, using BLASTX within the HUSAR system [33].A query sequence was not searched within the database oftheir own organism. In case of SWISSPROT, hits corre-sponding to the query (cDNA) organism were filtered out.The BLAST files were parsed using the BLAST parser mod-ules from W3H [34] and a low-stringent e-value cut-off of0.01 was applied to yield a high number of possible hits.Multiple high scoring segment pairs were combined asdescribed elsewhere [35] and used for computing thealignment features. GO terms for each database hit wereextracted by considering only GO terms corresponding tothe molecular function and by discarding GO terms thatwere prefixed with NOT (annotators state that a particulargene product is NOT associated with a particular GOterm), or corresponding to "molecular functionunknown" (GO:0005554). These steps reduced our data-set to 36,771 sequences, contributing to 856,632 samples.Each GO term that occurred in the hits represented a sam-ple entry in the feature table. Below it will be referred to as"sample GO term". If a GO term occurred several times inthe hits, it was considered only once. We defined 31attributes for each GO term, representing 5 major classesof information (A)- E)):
A) GO level and path: The GO structure was exploited toderive the first two attributes,
A.1.GO level: the distance of the sample GO term to theroot (molecular function node);
A.2. GO path: the number of paths from the sample GOterm to the root.
B) Alignment quality criteria: These attributes are basedon the BLAST alignments. For attributes B.1 - B.4, the bestvalue for the corresponding attribute was taken, if a GOterm occurred in more than one hit,
B.1. Expectation value: the expectation value ("E-value")from BLASTX;
B.2. Bit score: the bit score value provided by BLASTX;
We wanted to award alignment length and quality bycombining features. This was done with respect to thelength of the query and the hits to offset biases due to dif-ferent complexities of the query and subject organisms.Attributes B.3, B.4, C.3 and D.3 were obtained from initialtrials with a small dataset (6270 cDNA sequences, data
Page 11 of 14(page number not for citation purposes)

BMC Bioinformatics 2004, 5:116 http://www.biomedcentral.com/1471-2105/5/116
not shown) and applying parameter optimisation to dis-tinguish the samples.
B.3. Query coverage score (QCS): Combined measure ofalignment size and quality concerning the querysequence,
QCS := (AL / QL) × (I + S), (5)
where AL denotes the alignment length, QL the length ofthe query sequence, I the number of identities in thealignment, and S the number of positively contributingresidues in the alignment;
B.4. Subject coverage score (SCS): as in B.3, however onlywith respect to the corresponding subject sequence (data-base hit),
SCS := (AL / SL) × (I + S), (6)
where SL denotes the length of the subject sequence;
Additionally, we decomposed these attributes into the fol-lowing further six attributes (B.5 - B.10). For theseattributes, we considered the hit with the best coveragescore if a GO term occurred in more than one hit (querycoverage score for attributes B.5, B.7, B.9, and subject cov-erage score for B.6, B.8, B.10).
B.5. Query percentage (QPC): Percentage of coverage of thealignment region in the query sequence (with respect toQCS), i.e.
QPC := (AL / QL) × 100; (7)
B.6. Subject percentage (SPC) Percentage of coverage of thealignment region in the corresponding subject sequence(with respect to SCS), i.e.
SPC := (AL / SL) × 100; (8)
B.7. Query identity (QI): Percentage of identical residues inthe BLASTX alignment (with respect to QCS);
B.8. Subject identity (SI): Percentage of identical residues inthe BLASTX alignment (with respect to SCS);
B.9. Query similarity (QS): Percentage of similar or posi-tively contributing residues in the alignment (with respectto QCS);
B.10.Subject similarity (SS): Percentage of similar or posi-tively contributing residues in the alignment (with respectto SCS).
C) GO frequency related attributes: We extracted informa-tion about the frequency of GO terms in the hits by thefollowing attributes:
C.1.GO frequency (FG): the number of hits that containedthe sample GO term.
C.2.Number of hits (TH): the total number of hits for thequery.
C.3. Frequency score (FS): the number of hits that containedthe sample GO term. Unlike C.1, we limited this score toemphasize differences in queries with few hits:
C.4.Species frequency: The number of organisms contribut-ing to a sample GO term for a single query sequence;
C.5.Total GO (TG): total number of GO terms from all hits.
C.6. Unique GO (UG): as C.5, except, that GO terms occur-ring more than once (in the hits) were counted only once.
D) GO frequency by considering relationships: For theseattributes we applied the structure of the Gene Ontologygraph. Not only perfectly matching terms were consid-ered, but also their defined parents, children or siblings:
D.1.Relative frequency for all (RA): the relationships for thesample GO term with all GO terms that occurred in thehits were calculated. The sum of non-"different" relation-ships i.e. parent, child, or sibling was used for thisattribute;
D.2.Relative frequency for unique (RU): similar to attributeD.1, with the exception that GO terms occurring morethan once were counted only once.
D.3.Relative frequency for all (limited) (RAlim): same asattribute D.1, however this score was limited to empha-size differences of queries with few hits:
D.4.Relative frequency for unique (limited) (RUlim): same asattribute D.2, however this score was limited to empha-size differences of queries with few hits:
F
F T
F
Telse
s
g h
g
h
: .=
≤
( )
if 5
59
R
R R
R
Telse
A
A A
A
G
lim : .=≤
( )if 10
1010
Page 12 of 14(page number not for citation purposes)

BMC Bioinformatics 2004, 5:116 http://www.biomedcentral.com/1471-2105/5/116
E) Annotation quality related attributes: Quality attributeswere selected from the evidence codes provided by thegene association tables of the GO-mapped sequence data-bases. We selected 9 commonly used evidence codes (TAS,NAS, ISS, IPI, IMP, IGI, IEP, IEA, IDA), resulting inattributes E.1 to E.9. The entries of these attributes foreach sample GO term were calculated by summing theoccurrences of the corresponding evidence codes of allhits.
Training and testing the classifierBefore training, normalisation was performed. We nor-malised the attributes by taking the logarithm (log) andlog of log if necessary. We used log values for 16 attributes(B.3-B.10, C.3, C.4, D.1, D.2, D.4 and E.1) and log of logfor 8 attributes (B.2, C.1, E.2, E.4-E.8). Furthermore, weconverted the attribute values into mean 0 and standarddeviation 1 by applying the Z-transformation. The featuretable contained 856,632 samples and 31 attributes. Wesplit the dataset into 99 training subsets. Each subset com-prised of approximately 1% of the samples i.e. 8,566 GOterms. This resulted in 96 organism specific subsets and 3hybrid subsets. We applied the support vector machinesin the implementation of LIBSVM [36], which supports aweighted SVM for unbalanced data. We used a higher pen-alty (5 instead of 1) for false positives (FP) for the modelselection and also the training process to support a highspecificity of the resulting classifiers. Also note, that ourtraining set contained a high portion of negative samples(see Table 1) due to our relaxed E-value threshold. Weutilised the radial basis function kernel and set the param-eter epsilon (tolerance of termination criterion) to 0.01.The parameter C (regularisation term, cost for false classi-fication) and gamma (kernel width) of the SVM were opti-mised using a grid search. The grid search determined thecombination of C (log2-range: 13 to 15, step 1) andgamma (log2-range: 10 to 15, step 1) with the lowest clas-sification error according to a five-fold cross validationsuch that each of the 99 data subsets was subdivided intoa training set (90%) and a validation set (10%). The vali-dation sets were used to estimate the parameters C andgamma for each of the 99 classifiers individually. Finally,the parameters from the classifier selection were appliedto train each of the classifiers with 90% of each data set,respectively. The testing was based on the same 13 organ-isms and 856,632 GO terms corresponding to 36,771sequences as described above. We performed the testingby an organism-wise cross-validation so that one organ-
ism was used as test set and the remaining ones as thetraining set.
Data availabilityThe annotation for Xenopus laevis contig sequences isdownloadable at ftp://genome.dkfz-heidelberg.de/pub/agd/gene_association.agd_Xenopus. We followed thestandard GO annotation style (using Gene ontologyguideline). The evidence code is always IEA. The confi-dence value is included for each GO term.
Authors' contributionsThe main work was carried out by AV. RK and KG con-ceived the idea of the study. AV and RK drafted themanuscript. FS developed and JM applied the machinelearning strategy. KG implemented the databases in SRS.RE and SS supervised the work. All authors participated inreading, approving and revising the manuscript.
AcknowledgmentsWe thank the Gene Ontology Consortium and all groups that established GO association databases for making their data available through the web. This work was funded by the German Cancer Research Center (DKFZ), the Deutsche Krebshilfe and the Nationales Genom-Forschungs-Netz (NGFN). We also thank Suresh Kumar Swaminathan and Coral del Val for their suggestions during the preparation of the manuscript, and Andrea Mclntosh-suhr and Christopher Previti for proofreading.
References1. Lewis S, Ashburner M, Reese MG: Annotating eukaryote
genomes. Curr Opin Struct Biol 2000, 10:349-354.2. Searls DB: Using bioinformatics in gene and drug discovery.
Drug Discov Today 2000, 5:135-143.3. Bork P, Koonin EV: Predicting function from protein sequence:
Where are the bottlenecks? Nat Genet 1998, 18:313-318.4. Smith TF: Functional genomics – bioinformatics is ready for
the challenge. Trends Genet 1998, 14:291-293.5. Bork P, Gibson TJ: Applying motif and profile searches. Methods
Enzymol 1996, 266:162-184.6. Andrade MA, Brown NP, Leroy C, Hoersch S, de Daruvar A, Reich
C, Franchini A, Tamames J, Valencia A, Ouzounis C, Sander C: Auto-mated genome sequence analysis and annotation. Bioinformat-ics 1999, 15:391-412.
7. Bork P, Bairoch A: Go hunting in sequence databases but watchout for the traps. Trends Genet 1996, 12:425-427.
8. Galperin MY, Koonin EV: Sources of systematic errors in func-tional annotation of genomes: domain rearrangements, non-orthologous gene displacement, and operon distribution. InSilico Biol 1998, 1:0007 [http://www.bioinfo.de/isb/1998/01/0007/].
9. Sakata K, Nagamura Y, Numa H, Antonio BA, Nagasaki H, IdonumaA, Watanabe W, Shimizu Y, Horiuchi I, Matsumoto T, Sasaki T, HigoK: RiceGAAS: an automated annotation system and data-base for rice genome sequence. Nucleic Acids Res 2002,30:98-102.
10. Bailey LC, Fischer S Jr, Schug J, Crabtree J, Gibson M, Overton GC:GAIA: framework annotation of genomic sequence. GenomeRes 1998, 8:234-250.
11. Harris NL: Genotator: a workbench for sequence annotation.Genome Res 1997, 7:754-762.
12. Gaasterland T, Sensen CW: MAGPIE: automated genomeinterpretation. Trends Genet 1996, 12:76-78.
13. Kitson DH, Badretdinov A, Zhu ZY, Velikanov M, Edwards DJ, Olsze-wski K, Szalma S, Yan L: Functional annotation of proteomicsequences based on consensus of sequence and structuralanalysis. Brief Bioinform 2002, 3:32-44.
R
R R
R
Uelse
U
U U
U
G
lim : .=≤
( )if 10
1011
Page 13 of 14(page number not for citation purposes)

BMC Bioinformatics 2004, 5:116 http://www.biomedcentral.com/1471-2105/5/116
Publish with BioMed Central and every scientist can read your work free of charge
"BioMed Central will be the most significant development for disseminating the results of biomedical research in our lifetime."
Sir Paul Nurse, Cancer Research UK
Your research papers will be:
available free of charge to the entire biomedical community
peer reviewed and published immediately upon acceptance
cited in PubMed and archived on PubMed Central
yours — you keep the copyright
Submit your manuscript here:http://www.biomedcentral.com/info/publishing_adv.asp
BioMedcentral
14. Frishman D, Albermann K, Hani J, Heumann K, Metanomski A, Zoll-ner A, Mewes HW: Functional and structural genomics usingPEDANT. Bioinformatics 2001, 17:44-57.
15. The Gene Ontology Consortium: Gene Ontology: tool for theunification of biology. Nat Genet 2000, 25:25-29.
16. The Gene Ontology Consortium: Creating the gene ontologyresource: design and implementation. Genome Res 2001,11:1425-1433.
17. Hill DP, Blake JA, Richardson JE, Ringwald M: Extension and Inte-gration of the Gene Ontology (GO): Combining GO vocabu-laries with external vocabularies. Genome Res 2002,12:1982-1991.
18. Xie H, Wasserman A, Levine Z, Novik A, Grebinskiy V, Shoshan A,Mintz L: Large-Scale Protein Annotation through GeneOntology. Genome Res 2002, 12:785-794.
19. Camon E, Magrane M, Barrell D, Binns D, Fleischmann W, Kersey P,Mulder N, Oinn T, Maslen J, Cox A, Apweiler R: The Gene Ontol-ogy Annotation (GOA) project: implementation of GO inSWISS-PROT, TrEMBL, and InterPro. Genome Res 2003,13:662-672.
20. TIGR Gene Indices [http://www.tigr.org/tdb/tgi.shtml]21. Zehetner G: OntoBLAST function: from sequence similarities
directly to potential functional annotations by ontologyterms. Nucleic Acids Res 2003, 31:3799-3803.
22. Hennig S, Groth D, Lehrach H: Automated Gene Ontologyannotation for anonymous sequence data. Nucleic Acids Res2003, 31:3712-3715.
23. Jensen LJ, Gupta R, Staerfeldt HH, Brunak S: Prediction of humanprotein function according to Gene Ontology categories. Bio-informatics 2003, 19:635-642.
24. Schug J, Diskin S, Mazzarelli J, Brunk BP, Stoeckert CJ Jr: PredictingGene Ontology Functions from ProDom and CDD ProteinDomains. Genome Res 2002, 12:648-655.
25. Bauer E, Kohavi R: An Empirical Comparison of Voting Classi-fication Algorithms: Bagging, Boosting, and Variants. MachineLearning 1999, 36:105-139.
26. Peiffer DA, Cho KWY, Shin Y: Xenopus DNA Microarrays. CurrentGenomics 2003, 4:665-672.
27. Altschul SF, Madden TL, Schäffer AA, Zhang J, Zhang Z, Miller W, Lip-man DJ: Gapped BLAST and PSI-BLAST: a new generation ofprotein database search programs. Nucleic Acids Res 1997,25:3389-3402.
28. TIGR Xenopus laevis Gene Index [http://www.tigr.org/tdb/tgi/xgi/]. Release 7.0; January 8, 2004
29. Gene Ontology Consortium [http://www.geneontology.org]30. Hand D, Mannila H, Smyth P: Principles of Data Mining,. MIT
Press, Cambridge, London; 2001. 31. Hastie T, Tibshirani R, Friedman J: The Elements of Statistical
Learning,. Springer, New York, Berlin, Heidelberg; 2001. 32. Swiss-Prot [http://www.ebi.ac.uk/ebi_docs/swissprot_db/swiss
home.html]33. Senger M, Flores T, Glatting K, Ernst P, Hotz-Wagenblatt A, Suhai S:
W2H: WWW interface to the GCG sequence analysispackage. Bioinformatics 1998, 14:452-457.
34. Ernst P, Glatting KH, Suhai S: A task framework for the webinterface W2H. Bioinformatics 2003, 19:278-282.
35. Del Val C, Glatting KH, Suhai S: cDNA2Genome: A tool for map-ping and annotating cDNAs. BMC Bioinformatics 2003, 4(1):39.
36. LIBSVM; version 2.4 [http://www.csie.ntu.edu.tw/~cjlin/libsvm/index.html]
Page 14 of 14(page number not for citation purposes)