bmc evolutionary biology biomed central - pàgines...
TRANSCRIPT

BioMed CentralBMC Evolutionary Biology
ss
Open AcceResearch articleThermal evolution of gene expression profiles in Drosophila subobscuraHafid Laayouni1,2, Francisco García-Franco1, Blanca E Chávez-Sandoval1, Vincenzo Trotta3, Sergi Beltran4,5, Montserrat Corominas4 and Mauro Santos*1Address: 1Departament de Genètica i de Microbiologia, Grup de Biologia Evolutiva (GBE), Universitat Autònoma de Barcelona, 08193 Bellaterra (Barcelona), Spain, 2Unitat de Biologia Evolutiva, Departament de Ciències de la Salut i de la Vida, Universitat Pompeu Fabra, Doctor Aiguader 80, 08003 Barcelona, Spain, 3Dipartimento di Biologia Evoluzionistica Sperimentale, Università di Bologna, Via Selmi 3, 40126 Bologna, Italy, 4Departament de Genètica, Facultat de Biologia, Universitat de Barcelona, Av. Diagonal 645, edifice annex, 1a planta, 08028 Barcelona, Spain and 5Centre de Regulació Genòmica (CRG), Doctor Aiguader 88, 08003 Barcelona, Spain
Email: Hafid Laayouni - [email protected]; Francisco García-Franco - [email protected]; Blanca E Chávez-Sandoval - [email protected]; Vincenzo Trotta - [email protected]; Sergi Beltran - [email protected]; Montserrat Corominas - [email protected]; Mauro Santos* - [email protected]
* Corresponding author
AbstractBackground: Despite its pervasiveness, the genetic basis of adaptation resulting in variation directly or indirectlyrelated to temperature (climatic) gradients is poorly understood. By using 3-fold replicated laboratory thermalstocks covering much of the physiologically tolerable temperature range for the temperate (i.e., cold tolerant)species Drosophila subobscura we have assessed whole-genome transcriptional responses after three years ofthermal adaptation, when the populations had already diverged for inversion frequencies, pre-adult life historycomponents, and morphological traits. Total mRNA from each population was compared to a reference poolmRNA in a standard, highly replicated two-colour competitive hybridization experiment using cDNAmicroarrays.
Results: A total of 306 (6.6%) cDNA clones were identified as 'differentially expressed' (following a falsediscovery rate correction) after contrasting the two furthest apart thermal selection regimes (i.e., 13°C vs . 22°C),also including four previously reported candidate genes for thermotolerance in Drosophila (Hsp26, Hsp68, Fst, andTreh). On the other hand, correlated patterns of gene expression were similar in cold- and warm-adaptedpopulations. Analysis of functional categories defined by the Gene Ontology project point to anoverrepresentation of genes involved in carbohydrate metabolism, nucleic acids metabolism and regulation oftranscription among other categories. Although the location of differently expressed genes was approximately atrandom with respect to chromosomes, a physical mapping of 88 probes to the polytene chromosomes of D.subobscura has shown that a larger than expected number mapped inside inverted chromosomal segments.
Conclusion: Our data suggest that a sizeable number of genes appear to be involved in thermal adaptation inDrosophila, with a substantial fraction implicated in metabolism. This apparently illustrates the formidable challengeto understanding the adaptive evolution of complex trait variation. Furthermore, some clustering of genes withininverted chromosomal sections was detected. Disentangling the effects of inversions will be obviously requiredin any future approach if we want to identify the relevant candidate genes.
Published: 19 March 2007
BMC Evolutionary Biology 2007, 7:42 doi:10.1186/1471-2148-7-42
Received: 14 November 2006Accepted: 19 March 2007
This article is available from: http://www.biomedcentral.com/1471-2148/7/42
© 2007 Laayouni et al; licensee BioMed Central Ltd. This is an Open Access article distributed under the terms of the Creative Commons Attribution License (http://creativecommons.org/licenses/by/2.0), which permits unrestricted use, distribution, and reproduction in any medium, provided the original work is properly cited.
Page 1 of 15(page number not for citation purposes)

BMC Evolutionary Biology 2007, 7:42 http://www.biomedcentral.com/1471-2148/7/42
BackgroundTemperature is a fundamental feature that affects all livingorganisms. Each species, particularly ectotherms, has anon-stressful thermal tolerance range and responds totemperature by physiological, biochemical, and molecu-lar level adjustments that underlie adaptation. Forinstance, many latitudinal clines exist in Drosophila forallele frequencies at allozyme loci, chromosomal inver-sions, and microsatellites; as well as for traits like starva-tion resistance, desiccation resistance, and body sizewhere the differences between populations have a geneticbasis and can even persist for many generations under lab-oratory reared conditions [1-4]. By and large, the empiri-cal evidence suggests that variation in these markers andtraits are directly or indirectly related to temperature (cli-matic) gradients. Perhaps the most pertinent examplecomes from recent studies on chromosomal inversionpolymorphisms showing that the genetic constitution ofpopulations is responding to contemporary rapid globalwarming [5-8].
The native Palearctic fly Drosophila subobscura spans morethan 30° latitude in the Old World: from North Africa toScandinavia. As a result, its populations experience astrong climatic gradient [9]. In the late 1970s and early1980s the species invasively spread in North and SouthAmerica and nowadays spans about 15° latitude on eachcontinent [10,11]. Remarkably enough, latitudinal clinesin the New World for inversion polymorphism and bodysize parallel to the long standing ones in the native geo-graphic area were evident after a few years since the Amer-ican colonization. This 'replicated time series experimentof evolution in action' [12,13] strongly suggests that thosetraits are indeed subject to selection from temperature-related factors. However, a laboratory natural selectionexperiment (i.e., an experimental protocol where stocks oforganisms are reared under different conditions andallowed to evolve by natural selection over many genera-tions [14]) specifically designed to test the putative role oftemperature per se in the evolution of these clines foundresults conflicting to those expected from the latitudinalgradients for both inversions and body size [3,15,16].Certainly, laboratory experiments are not the best way tomirror what is happening at different latitudes and toreconstruct natural clines. But at present it is unclearwhether temperature alone drives the clines. What typesof genetic changes are needed for an organism to adapt tonew thermal conditions?
A number of authors (e.g. [17,18]) have argued thatchanges in the transcriptome constitute a major compo-nent of the genetic basis for phenotypic evolution. Geneexpression profiling by means of microarrays has becomea popular way of finding candidate genes of trait variationand is providing new insights into some old but funda-
mental questions in evolutionary biology [19-22]. Herewe examine global gene expression by measuring the rel-ative abundance of mRNAs in third instar larvae of D. sub-obscura from 3-fold replicated laboratory thermalselection stocks -derived from the estimated Chilean epi-centre (Puerto Montt) of the original New World invasion[15]- that had evolved at three constant temperatureregimes during 3 years: cold (13°C), optimum (18°C)and warm (22°C). The connection between the very highdimensional nature of the gene-expression data and themultivariate whole organism phenotype, however, is notstraightforward and detailed functional and ecologicalanalyses of candidate genes will obviously be required tounderstand the genetic basis for thermal adaptation (e.g.,[23]).
In holometabolous insects like Drosophila many adapta-tions to changing environments involve changes in larvalbehaviour and physiology that may impinge on otherphases of the life cycle (e.g. [24-26]). For this reason weused third instar larvae for the microarray experiment. Apossible drawback was that both sexes were mixed, so wehave overlooked any sex-specific thermal response thatmight have been present. Total mRNA from each popula-tion was compared to a reference pool mRNA independ-ently derived from the optimum (P18) populations (seeMethods) in a standard two-colour competitive hybridi-zation using cDNA microarrays with D. melanogasterclones [27]. Heterologous hybridization to study geneexpression profiles has been validated between closelyrelated species (divergence time < 10 Mya), and consistentdata are also obtained for less closely related taxa (diver-gence time ~65 Mya; [28]). Drosophila subobscura belongsto the D. obscura group, and the divergence time betweenthe D. melanogaster and D. obscura groups has been esti-mated to be ~25 Mya [29]. This apparently offers a reason-able warranty to use D. melanogaster arrays inheterologous hybridization with D. subobscura. In addi-tion, we carried out some preliminary tests in order tooptimize the experimental conditions. Highly reproduci-ble and consistent gene profiling, comparable to thatobtained with homologous hybridization by using someD. subobscura clones added to the arrays (see Methods),was observed.
It is also important to remark here that the lower andupper thermal regimes used in the experiment are notstressful: the temperature range likely covers much of thephysiologically tolerable range in this species [9]. Obvi-ously, the constant thermal regimes and light:dark periodwhere the populations have evolved (see Methods) do notmirror the seasonal changes experience by natural popu-lations, but with this experimental protocol we can con-trol that temperature is the only factor differing betweenthe thermal stocks. The thermal stocks had already
Page 2 of 15(page number not for citation purposes)

BMC Evolutionary Biology 2007, 7:42 http://www.biomedcentral.com/1471-2148/7/42
diverged for inversion frequencies, pre-adult life historycomponents, and morphological traits [3,16]. The experi-mental design equated to a four-way factorial analysis ofvariance (ANOVA) with thermal selection regime and cya-nine dyes (Cy3, Cy5) in a flip dye design as fixed effects,replicated populations as a random factor nested in ther-mal selection regime, and slide (spotted microarray) as arandom factor nested in thermal selection, dye, and repli-cate. The analysis allowed identifying quantitative differ-ences in larval gene expression between cold- (P13) andwarm-adapted (P22) populations.
The candidate genes were assigned a biological functionand/or biological process when information was availa-ble. Also important, a number of genes were mapped byin situ hybridization to the polytene chromosomes of D.subobscura. The karyotype of this species consists of fiveacrocentric chromosomes and a dot chromosome (seeMethods). What is crucial here is that D. subobscura har-bours one of the richest inversion polymorphisms in thegenus, with a total of 92 chromosomal arrangements(produced from 66 inversions located on all major chro-mosomes) recorded in the native Palearctic region [9,30].This number reduces to 18 arrangements in colonizingpopulations of the New World, all of them but one segre-gating in the thermal stocks [16]. Variation in some traitsis known to be tied to inversion polymorphisms in Dro-sophila (e.g. [31,32]), and quantitative associationsbetween larval gene expression and thermal adaptationcould be due to position effects (e.g., the inversion of achromosomal segment can remove or exchange the regu-latory sequences of a gene and alter its expression pattern[33]) or hitchhiking arisen from linkage disequilibrium.In view of the rapidly and consistently evolved latitudinalclines in chromosome inversion polymorphism followingthe New World invasion by the species [12], and the shiftsin inversion frequencies in response to laboratory thermaladaptation [16] and to climate change [7], we expect thata large number of genes will be included inside invertedchromosome segments. Linkage with inversions willhighly complicate the identification of chromosomeregions that are targets of selection.
Results and discussionOverall patterns of gene expression in the thermal linesAn important point in the experiment was that the parentsof treatment larvae had also been reared at the same tem-perature of 18°C to control for the possibility of non-genetic parental effects on offspring (see Methods). Inorder to generate a reliable data set we analyzed mRNAabundance from a highly replicated experiment: fourindependent batches of 250 optimum-reared larvae each-amounting to 9,000 larvae in total (i.e., 250 larvae × 4slides per population × 9 experimental populations)-whose mRNAs were competitively hybridized to a refer-
ence pooled mRNA from 9,000 control larvae on contigu-ous duplicated gene spots using a dye-reversalexperimental design, thus providing up to 72 gene expres-sion values for each probe. Furthermore, some genes werespotted (in duplicated) several times on the slides, whichhelped to confirm the quality and consistency of the dataas there was a clear correspondence among different spots[see Additional file 1: summary of the microarray results].
The distribution of normalized measures for valid relativegene expression levels in the g = 11,767 cDNA clones isshown in Fig. 1. All clones with less than 57 valid expres-sion observations were excluded from further analysesand, therefore, we will only focus on the right part of Fig.1 just after the x-axis scale break. As a result, 4,651 cDNAclones (4,310 non-redundant genes) were allowed for dif-ferential gene expression analysis and their microarray sig-nature, plotted as expression ratio versus fluorescenceintensity, is shown in Fig. 2a. For each clone g = 1, �,4,651 the dye-reversal experimental design was subjectedto a least squares ANOVA model as that shown in Table 1for (e.g.) gene CG12236. A key premise in the experimen-tal design with 2 degrees of freedom for the main fixed fac-tor temperature was to define a priori the linear contrastbetween the two furthest apart thermal selection regimes:warm (22°C) vs. cold-adapted (13°C) populations (eachcomparison or contrast between two means has onedegree of freedom).
A total of 419 (9%) cDNA clones were identified as 'differ-entially expressed' when considering a p-value (from
Distribution of valid gene expression levelsFigure 1Distribution of valid gene expression levels. For a given probe g the maximum number of valid gene expression val-ues for each thermal selection regime was N = 72. All probes with N < 57 (left part just before the x-axis scale break) were excluded from the statistical analysis.
0 4 8 12 16 20 24 28 32 36 40 44 48 52 56 60 64 68 72
Valid N
0
400
800
1200
1600
2000
2400
Fre
quency
g = 11,767
Page 3 of 15(page number not for citation purposes)

BMC Evolutionary Biology 2007, 7:42 http://www.biomedcentral.com/1471-2148/7/42
10,000 rounds of permutation) cut-off of 5% for the tem-perature factor with 2 degrees of freedom (see Table 1),but none of them was labelled as truly significant in termsof the false discovery rate (FDR; [34]) method used indetecting differential gene expression (q-value thresholdof 5%; see Methods). On the other hand, from the permu-tation p-values obtained after the linear contrasts betweenthe two furthest apart thermal selection regimes thenumber of 'differentially expressed genes' rose up to 950
(20.4%), with 306 (6.6%) remaining significant after aFDR correction (recall that a q-value threshold of 5%means that among all genes considered as significant, 5%of these are truly null on average [35]). Fig. 2 also showsthe averages for the expression ratio versus fluorescenceintensity of the identified 306 genes differing in geneexpression (Fig. 2a), together with the corresponding box-plots (Fig. 2b). The reason why the linear contrasts com-paring P22 vs. P13 populations yielded more differen-
Table 1: ANOVA of relative intensity ratios for gene CG12236.
Source of variation d.f. Sum of Squares Mean Square F p-value (parametric) p-value (permutation)
Temperature (T) 2 1.3882 0.6941 11.475 0.009 0.008P22 vs. P13 1 1.2829 1.2829 21.210 0.004 0.002
Replicatea 6 0.3629 0.0605 0.346 0.905Dye (D) 1 3.5337 3.5337 20.193 < 0.001T × D 2 0.0392 0.0196 0.112 0.895Slideb 24 4.1998 0.1750 11.816 < 0.001Errorc 36 0.5332 0.0148
Temperature stands for the fixed effects due to thermal selection regime (13, 18 and 22°C), replicate for the random effect of replicated populations (R1, R2 and R3) nested in thermal regime, dye for the fixed effect of cyanine dye Cy3 (green) or Cy5 (red) in the flip dye design, and slide for the random effect of cDNA microarray glass slide nested in thermal regime, replicate and dye.a Error term for temperature and for the planned contrast comparing warm- (P22) vs. cold-adapted (P13) populations. b Error term for replicate, dye, and temperature × dye interaction. c Error term for slide.
Microarray signatureFigure 2Microarray signature. Gene expression profiles in the three thermal regimes. (a) Expression ratio versus fluorescence intensity of the 316,229 spots (black dots) from the 4,651 clones approved for statistical analyses. The averages for those probes identified as differentially expressed when contrasting the two extreme thermal regimes (i.e.,13°C vs. 22°C) are in blue (P13), green (P18) and red (P22). (b) Box-plots of the average expression ratios for the differentially expressed genes.
a b
Page 4 of 15(page number not for citation purposes)

BMC Evolutionary Biology 2007, 7:42 http://www.biomedcentral.com/1471-2148/7/42
tially expressed genes was because the averages of log 2relative intensity ratios for optimum (P18) populationswere normally in between the averages for P13 and P22populations. Therefore, a substantial proportion of thesum of squares for the temperature factor with 2 degreesof freedom in the ANOVAs was accounted for by the lin-ear contrast (e.g., ~92% in Table 1).
A far more informative plot is shown in Fig. 3, where geneexpression values are sorted according to the contrast esti-mates. It is clear that those populations that have evolvedat the optimum thermal regime (18°C) ranged inbetween, and that the average gene expression differencebetween warm- and cold-adapted populations was gener-ally low: from 0.6 for CG4183 (heat shock protein 26;Hsp26) to 1.7 for CG4867 (bc10).
Gene expression grouped by cellular function and biological processAnalysis of functional categories defined by the GeneOntology project [36] using the GOToolBox [37] revealed
that our reference dataset (the 4,651 cDNA clones with4,310 non-redundant genes that were allowed for differ-ential gene expression analysis) includes 989 annotatedgenes, and only 66 out of 306 genes labelled as 'differen-tially expressed' were annotated. These genes could beassigned to different cellular or molecular functions: overtwo-thirds are involved in metabolism processes (41genes), in transport processes (14 genes), and in regula-tion of transcription (8 genes). (Note that many genesbelong to more than one category.) For each functionalcategory, we compared the actual number of occurrenceswith the expected one under the null hypothesis that allcategories should be equally represented. Namely, theprobability of obtaining by chance a number n of anno-tated genes for a given term among a dataset of size N,knowing that the reference dataset contains m such anno-tated genes out of G genes, is calculated. This test followsthe hypergeometric distribution and the GOToolBoxallows for FDR correction, pointing at statistically relevantover- or underrepresented terms within a dataset. Theresults obtained are shown in Fig. 4 and indicate an over-
Transcriptome changes following thermal adaptationFigure 3Transcriptome changes following thermal adaptation. Scatterplots of the average log2 relative intensity ratio for the 306 'differentially expressed genes' detected from the linear contrasts between the two furthest apart thermal selection regimes (i.e., 13°C vs. 22°C) and sorted according to the difference between warm- and cold-adapted (i.e., P22 – P13) popula-tions. The sorted CG names of genes are given at the bottom (1, 3, 5, �) and top (2, 4, 6, �) axes. For each gene, the points in blue (P13), green (P18) and red (P22) give the average log2 relative intensity ratio for the different thermal regimes. The cor-responding points have been connected by polynomial fitting to enhance visibility.
CG
4183
CG10846
CG
6129
CG
10091
CG
17489
CG
4264
CG17521
CG
5711
CG
3269
CG
8364
CG
7448
CG1987
CG
7874
CG
1708
CG
10688
CG
4018
8
CG15105
RH
44608
RH
05415
CG
31411
CG
4875
GH14469
CG
5595
CG
5394
CG
4758
CG
3256
0
CG32548
CG
6713
RH
66048
LP03565
CG
1290
7
CG9847
CG
6497
CG
10293
CG
13130
CG
8636
CG2028
CG
11063
CG
10021
CG
8920
CG
1333
3
CG31774
CG
11504
CG
31321
LP02809
CG
5505
CG13124
CG
3917
LD
08227
CG
3989
RH
181
59
CG8444
RH
69921
CG
3054
CG
12287
CG
8617
RH08258
CG
16838
CG
4452
RH
69856
CG
7375
CG11409
CG
1934
CG
3613
CG
7372
CG
301
47
CG1975
CG
4655
CG
31045
CG
10605
CG
327
93
CG32707
CG
12236
CG
9285
CG
7154
CG
3208
7
CG5441
RE
38449
CG
32940
CG
4551
CG
2151
CG1623
CG
8426
CG
9640
CG
32341
CG
367
9
CG17184
CG
1273
CG
2049
CG
8773
CG
184
8
CG7951
SD
07336
CG
5575
CG
32031
CG
408
0
CG
3836
CG
3658
CG
9249
CG
9389
CG
3694
CG3065
CG
3702
CG
9441
CG
32026
CG
304
27
CG30183
CG
9764
CG
5064
CG
32810
CG
108
98
CG6746
CG
9749
CG
3210
CG
17836
CG
463
0
CG
6384
CG
6447
CG13906
LD
02884
CG
795
6
CG4798
CG
4316
CG
18408
CG
32096
CG
183
0
LD16247
CG
10936
LD
15891
CG
3870
CG
132
52
CG
32223
CG
7110
SD
25571
CG
5353
CG
315
30
CG
7525
CG
6072
CG31973
CG
1066
CG
318
14
CG
5263
CG
3048
RH
39341
CG
17759
CG
304
92
CG16901
CG
14066
CG
18437
CG
2005
CG
377
7
CG
11100
CG
6606
CG
11512
CG
3121
RH
0716
4
CG9450
CG
12911
CG
142
13
CG
16884
CG
7362
CG
3186
CG
6104
AT0326
3
CG11099
CG
4972
CG
4381
CG
3376
CG
1426
5
CG7180
CG
18290
CG
5723
CG
14141
CG
3274
4
CG31240
CG
14200
CG
116
61
CG
32601
CG
32075
CG11676
CG
17669
LP
0816
5
CG10067
CG
1840
CG
10849
CG
12175
CG
3046
3
GH07331
CG
12123
LD
327
91
CG
6045
CG
1739
0
CG13096
CG
14996
CG
321
00
CG
5920
CG
4170
CG5003
CG
8981
CG
122
30
CG8111
CG
31728
CG
2865
CG
1358
CG
8735
CG10959
CG
30267
CG
3682
CG
11388
CG
12869
CG4494
CG
8472
CG
3305
CG
8637
CG
10315
CG
8839
CG
18599
CG
646
0
CG17273
CG
7107
CG
10011
CG
5670
CG
970
6
CG14216
CG
5581
CG
3322
CG
1632
CG
14290
CG8213
CG
13643
CG
13503
CG
9379
CG
2849
CG
1240
CG
2095
CG
301
32
CG
6203
CG
14814
CG
13550
CG
1213
CG
2229
CG3645
CG
12372
CG
3838
CG
17064
CG
3153
4
CG5650
CG
3373
CG
998
5
CG
3618
CG
10728
CG
1275
CG
13847
CG
187
69
CG11988
CG
6091
CG
11927
CG
7915
AT1858
3
CG32355
CG
8649
CG
17800
CG
9575
CG
2989
CG3743
CG
5242
CG
649
8
CG
5304
CG
15544
CG8938
CG
1866
CG
445
3
CG10710
CG
9854
CG
31712
CG
10497
GH
1136
6
CG10712
CG
13338
LD
13080
CG
15444
CG
8502
CG8593
CG
11537
CG
7280
CG
1759
GH
16383
CG32428
CG
4825
CG
176
86
CG4285
CG
5760
CG
8552
CG
31182
CG
2257
CG14948
CG
3095
CG
9212
CG
9214
CG
1570
1
CG12181
CG
4656
CG
17930
CG
16953
CG
9924
CG
4867
-0.8
-0.6
-0.4
-0.2
0.0
0.2
0.4
0.6
0.8
log
2 r
ela
tive inte
nsity r
atio
P13
P18
P22
P22 - P13
Page 5 of 15(page number not for citation purposes)

BMC Evolutionary Biology 2007, 7:42 http://www.biomedcentral.com/1471-2148/7/42
representation of genes involved in carbohydrate metabo-lism, nucleic acids metabolism and regulation oftranscription among other categories. Two categories areapparently underrepresented: organic acid and carboxylicacid metabolism [see Additional file 2: molecular func-tion gene ontology categories of differentially expressedgenes].
It seems reasonable that genetic adjustments to environ-mental differences may involve changes in metabolism.Thus, when inbred and non-inbred D. melanogaster linesare reared under benign and stressful (high temperature)environmental conditions gene expression patterns ofmetabolic genes are strongly affected by both inbreedingand temperature stress [38]. Furthermore, previous stud-ies on thermal evolution using the same Drosophila specieshave shown that differences between cold- and warm-
adapted populations can be due to differences in the effi-ciency of larval growth [24,39]. In our thermal stocks withD. subobscura we have shown that cold-adapted (P13)populations had longer development times in the wholerange of developmental temperatures assayed, and thatwarm-adapted (P22) populations seem to have evolvedfaster development [3]. Together with the lack of diver-gence for adult body size, it seems that cold-adapted D.subobscura stocks achieve the 'target' size by growing moreslowly. This apparently agrees with their lower level ofgene expression for genes involved in metabolic processeswhen compared to their warm-adapted counterparts.
Candidate genes for thermotolerance in DrosophilaExpression levels for genes of the heat shock proteingroup (Hsps) that act as molecular chaperones and areimportant for cellular housekeeping are known to covary
Genes grouped by gene ontology (GO) termsFigure 4Genes grouped by gene ontology (GO) terms. For all statistical significance categories, the bars in the reference set plot the subset frequencies of annotated genes in the cDNA microarrays belonging to a particular class with valid gene expression data for statistical analysis (Fig. 1), and the bars in the dataset represent those frequencies in the group of genes labeled as 'dif-ferentially expressed' when contrasting the two extreme thermal regimes. Two categories are apparently underrepresented (organic acid and carboxylic acid metabolism), whereas the rest are overrepresented in the dataset [see Additional file 2].
0.00 0.04 0.08 0.12 0.16 0.20 0.24
Frequency
actin filament organization
carbohydrate metabolism
cell communication
polysaccharide metabolism
regulation of transcription, DNA-dependent
transcription, DNA-dependent
regulation of nucleobase, nucleoside,
regulation of transcription
organic acid metabolism
carboxylic acid metabolism
regulation of nucleobase, nucleoside,
nucleotide and nucleic acid metabolism
Reference set
Dataset
Page 6 of 15(page number not for citation purposes)

BMC Evolutionary Biology 2007, 7:42 http://www.biomedcentral.com/1471-2148/7/42
with the thermal regimes experience by populations, spe-cies and higher taxa [40]. Hsp70 appears to be the primaryprotein involved in thermotolerance in D. melanogaster[41] -though apparently not in other Drosophila species[42]-, and Hsp70 allele frequencies show latitudinal clinesand change in response to thermal evolution in the labo-ratory [43]. In addition, Hsp23 and Hsp26 latitudinal var-iation in the D. melanogaster Australian cline [44], andcorrelated responses to selection for knockdown resist-ance at 39°C for Hsp68 [45], have also been found.Besides Hsps, other candidate genes for adaptation tothermal extremes (summarized in [46]) are: Hsrω (heat-shock RNA ω, which produces two RNA products but noknown protein product [47]), Hsf (heat-shock transcrip-tion factor), Tot (Turandot), mth (methuselah, also a candi-date aging gene [48,49]), Dca (Drosophila cold acclimationgene), Fst (frost; involved in recovering from cold shock[50]), Drs (drosomycin), shark (involved in a signalingpathway for epithelial cell polarity [51]), anon-23Da(encoding a protein with currently unknown function),desat2 (desaturase2; [52]), period (clock gene that deter-mines biological rhythmicity in Drosophila [53]), Ddc(dopa decarboxylase; involved in the catecholamine bio-synthesis pathway, which has been implicated in theresponse to various stressors including temperature [54]),and various metabolic enzymes as Adh (alcoholdehydro-genase; e.g., [55,56]), Gpdh (Glycerol 3 phosphate dehy-drogenase; [56]), Gdh (NAD-dependent glutamatedehydrogenase; [57]) and Treh (trehalase; [57]).
We had valid gene expression values (i.e., N ≥ 57 in Fig. 1)for all but 6 of the formerly listed genes; namely, Hsp70,Hsp23, Hsp26, Hsp68, Hsf, Fst, shark, anon-23Da, period,Ddc, Gpdh (D. subobscura clone added to the microarrays),Gdh and Treh. (We also had valid expression data fordesat1 but not for desat2.) Differential gene expressionwith the q-value cut-off chosen for the linear contrastsbetween cold- (P13) and warm-adapted (P22) popula-tions was found only for Hsp26, which showed increasedexpression levels in P13 populations. However, the q-value thresholds for Hsp68 (0.058; P13 > P22), Fst (0.061;P13 < P22), and Treh (0.061; P13 < P22) were low enoughas to suggest that these three candidate genes also divergedin gene expression levels in our populations. (q-valuethresholds for the other genes were: Hsp70, 0.506; Hsf,0.505; shark, 0.293; anon-23Da, 0.135; desat1, 0.148;period, 0.505; Dcd, 0.353; Gdh, 0.096 [see Additional file1].) It seems, therefore, that our survey in D. subobscuraapparently links thermal adaptation in a temporally stableenvironment to some specific candidate genes (Hsp26,Hsp68, Fst, and Treh) previously associated to thermotol-erance in D. melanogaster. It is also worth saying that theHsp60 gene had a q-value threshold of 0.082 (P13 > P22)and might have also been associated with thermal adapta-tion. On the other hand, Hsp83 is known to be expressed
during normal development in D. subobscura butincreased transcription occurs when flies are reared atheat-shock temperatures from 26 to 34°C [58]. Consist-ent with this finding we did not observe a statistically sig-nificant differential gene expression between cold- andwarm-adapted populations for Hsp83 (q-value threshold0.467).
Mapping of differentially expressed genes by in situ hybridization and correlated expression patternsIn situ hybridizations to the polytene chromosomes wereroutinely carried out after crossing wild-type D. subobscuramales with virgin females from the ch-cu marker strain. Atotal of 106 genes out of 306 differing in gene expressionas concluded from the a priori contrasts were used asprobes, and most of them (83%) yielded hybridizationsignals [see Additional file 3]. In all cases the negativeresults were due to failures in the amplifications. In noinstance an exchange of genes among the different chro-mosomal elements of D. melanogaster and D. subobscurahas been detected, which agrees with the well supportedevidence for the established chromosomal homologiespreviously proposed for each Muller/Sturtevant/Novitskielement [59]. The order of genes within each chromo-somal element, however, is known to have widelychanged among different species via the fixation of para-centric inversions (e.g.; [60-62]).
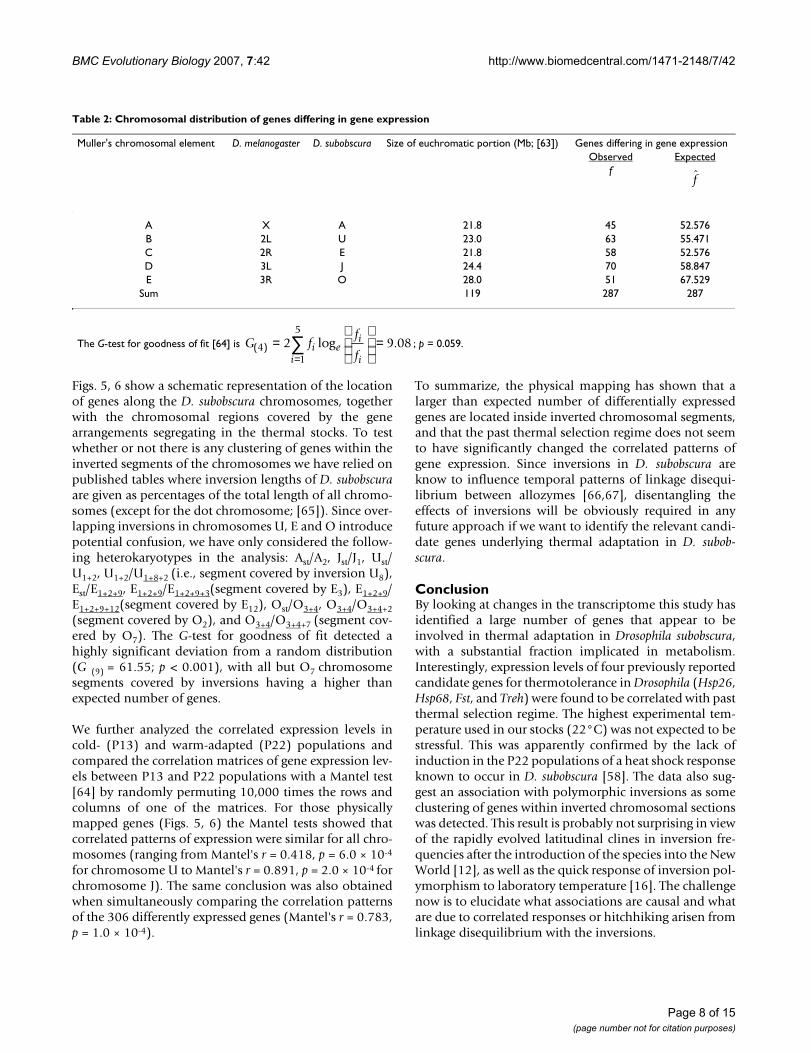
From the chromosomal homologies between D. mela-nogaster and D. subobscura [59], and the distribution of the~120-megabase euchromatic portion of the D. mela-nogaster genome on each chromosomal arm [63], wetested the null hypothesis that the location of genes differ-ing in gene expression between warm- and cold-adaptedpopulations on the different D. subobscura chromosomeswas at random (Table 2). The G-test for goodness of fit[64] detected a marginally nonsignificant random distri-bution (p = 0.059. If candidate genes Hsp68 and Fst onchromosome O, Hsp60 on chromosome U, and Treh onchromosome E are included, then p = 0.076), with chro-mosome J apparently being overrepresented and chromo-some O underrepresented. It seems interesting to contrastthese results with the previously reported chromosomalinversion shifts in the thermal populations [16]. Inver-sions on chromosomes J, E and, to a lesser extent, chro-mosomes A and O showed clear shifts in frequencyaccording to the thermal regime, whereas those on chro-mosome U showed no trend whatsoever. It is not at allevident how the distribution of the differentiallyexpressed genes on chromosomes matches with these pat-terns as, for example, chromosome E and U are well rep-resented in Table 2 but their behaviour after two years ofthermal evolution was completely different.
Page 7 of 15(page number not for citation purposes)
BMC Evolutionary Biology 2007, 7:42 http://www.biomedcentral.com/1471-2148/7/42
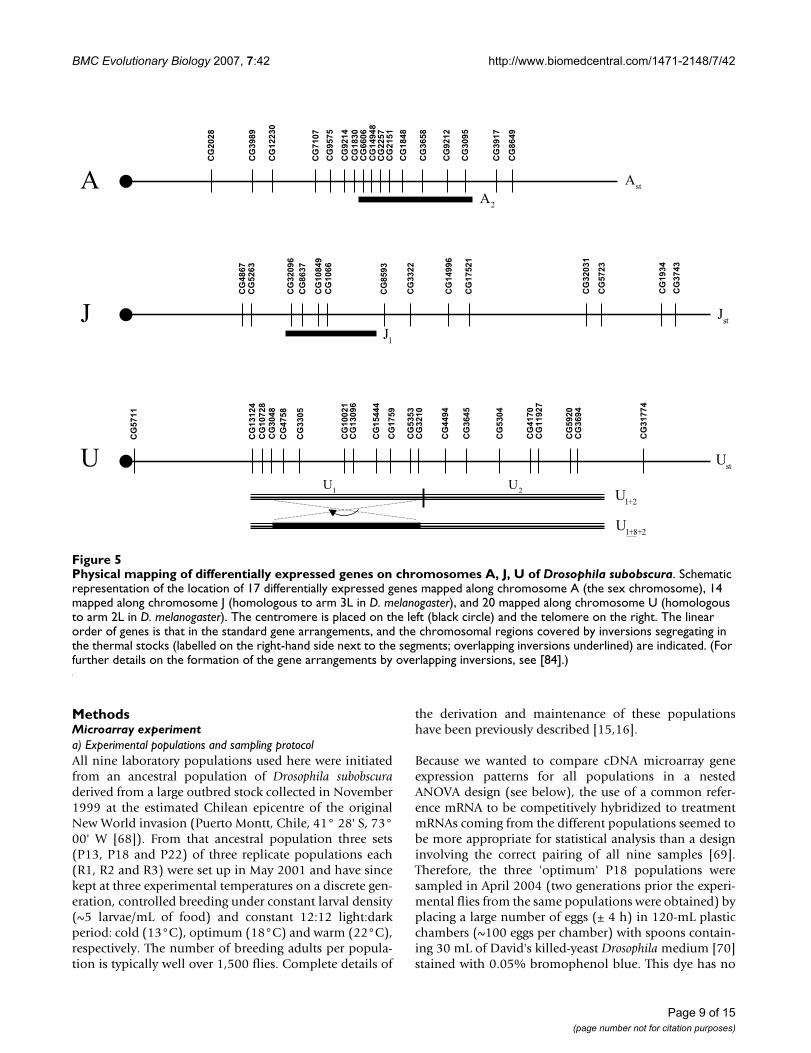
Figs. 5, 6 show a schematic representation of the locationof genes along the D. subobscura chromosomes, togetherwith the chromosomal regions covered by the genearrangements segregating in the thermal stocks. To testwhether or not there is any clustering of genes within theinverted segments of the chromosomes we have relied onpublished tables where inversion lengths of D. subobscuraare given as percentages of the total length of all chromo-somes (except for the dot chromosome; [65]). Since over-lapping inversions in chromosomes U, E and O introducepotential confusion, we have only considered the follow-ing heterokaryotypes in the analysis: Ast/A2, Jst/J1, Ust/U1+2, U1+2/U1+8+2 (i.e., segment covered by inversion U8),Est/E1+2+9, E1+2+9/E1+2+9+3(segment covered by E3), E1+2+9/E1+2+9+12(segment covered by E12), Ost/O3+4, O3+4/O3+4+2(segment covered by O2), and O3+4/O3+4+7 (segment cov-ered by O7). The G-test for goodness of fit detected ahighly significant deviation from a random distribution(G (9) = 61.55; p < 0.001), with all but O7 chromosomesegments covered by inversions having a higher thanexpected number of genes.
We further analyzed the correlated expression levels incold- (P13) and warm-adapted (P22) populations andcompared the correlation matrices of gene expression lev-els between P13 and P22 populations with a Mantel test[64] by randomly permuting 10,000 times the rows andcolumns of one of the matrices. For those physicallymapped genes (Figs. 5, 6) the Mantel tests showed thatcorrelated patterns of expression were similar for all chro-mosomes (ranging from Mantel's r = 0.418, p = 6.0 × 10⁻⁴
for chromosome U to Mantel's r = 0.891, p = 2.0 × 10⁻⁴ forchromosome J). The same conclusion was also obtainedwhen simultaneously comparing the correlation patternsof the 306 differently expressed genes (Mantel's r = 0.783,p = 1.0 × 10⁻⁴).
To summarize, the physical mapping has shown that alarger than expected number of differentially expressedgenes are located inside inverted chromosomal segments,and that the past thermal selection regime does not seemto have significantly changed the correlated patterns ofgene expression. Since inversions in D. subobscura areknow to influence temporal patterns of linkage disequi-librium between allozymes [66,67], disentangling theeffects of inversions will be obviously required in anyfuture approach if we want to identify the relevant candi-date genes underlying thermal adaptation in D. subob-scura.
ConclusionBy looking at changes in the transcriptome this study hasidentified a large number of genes that appear to beinvolved in thermal adaptation in Drosophila subobscura,with a substantial fraction implicated in metabolism.Interestingly, expression levels of four previously reportedcandidate genes for thermotolerance in Drosophila (Hsp26,Hsp68, Fst, and Treh) were found to be correlated with pastthermal selection regime. The highest experimental tem-perature used in our stocks (22°C) was not expected to bestressful. This was apparently confirmed by the lack ofinduction in the P22 populations of a heat shock responseknown to occur in D. subobscura [58]. The data also sug-gest an association with polymorphic inversions as someclustering of genes within inverted chromosomal sectionswas detected. This result is probably not surprising in viewof the rapidly evolved latitudinal clines in inversion fre-quencies after the introduction of the species into the NewWorld [12], as well as the quick response of inversion pol-ymorphism to laboratory temperature [16]. The challengenow is to elucidate what associations are causal and whatare due to correlated responses or hitchhiking arisen fromlinkage disequilibrium with the inversions.
Table 2: Chromosomal distribution of genes differing in gene expression
Muller's chromosomal element D. melanogaster D. subobscura Size of euchromatic portion (Mb; [63]) Genes differing in gene expressionObserved Expected
f
A X A 21.8 45 52.576B 2L U 23.0 63 55.471C 2R E 21.8 58 52.576D 3L J 24.4 70 58.847E 3R O 28.0 51 67.529
Sum 119 287 287
The G-test for goodness of fit [64] is ; p = 0.059.
f̂
G ff
fi
ie
i
i( ) log .4
1
52 9 08=
=
=∑
Page 8 of 15(page number not for citation purposes)
BMC Evolutionary Biology 2007, 7:42 http://www.biomedcentral.com/1471-2148/7/42
MethodsMicroarray experimenta) Experimental populations and sampling protocolAll nine laboratory populations used here were initiatedfrom an ancestral population of Drosophila subobscuraderived from a large outbred stock collected in November1999 at the estimated Chilean epicentre of the originalNew World invasion (Puerto Montt, Chile, 41° 28' S, 73°00' W [68]). From that ancestral population three sets(P13, P18 and P22) of three replicate populations each(R1, R2 and R3) were set up in May 2001 and have sincekept at three experimental temperatures on a discrete gen-eration, controlled breeding under constant larval density(~5 larvae/mL of food) and constant 12:12 light:darkperiod: cold (13°C), optimum (18°C) and warm (22°C),respectively. The number of breeding adults per popula-tion is typically well over 1,500 flies. Complete details of
the derivation and maintenance of these populationshave been previously described [15,16].
Because we wanted to compare cDNA microarray geneexpression patterns for all populations in a nestedANOVA design (see below), the use of a common refer-ence mRNA to be competitively hybridized to treatmentmRNAs coming from the different populations seemed tobe more appropriate for statistical analysis than a designinvolving the correct pairing of all nine samples [69].Therefore, the three 'optimum' P18 populations weresampled in April 2004 (two generations prior the experi-mental flies from the same populations were obtained) byplacing a large number of eggs (± 4 h) in 120-mL plasticchambers (~100 eggs per chamber) with spoons contain-ing 30 mL of David's killed-yeast Drosophila medium [70]stained with 0.05% bromophenol blue. This dye has no
Physical mapping of differentially expressed genes on chromosomes A, J, U of Drosophila subobscuraFigure 5Physical mapping of differentially expressed genes on chromosomes A, J, U of Drosophila subobscura. Schematic representation of the location of 17 differentially expressed genes mapped along chromosome A (the sex chromosome), 14 mapped along chromosome J (homologous to arm 3L in D. melanogaster), and 20 mapped along chromosome U (homologous to arm 2L in D. melanogaster). The centromere is placed on the left (black circle) and the telomere on the right. The linear order of genes is that in the standard gene arrangements, and the chromosomal regions covered by inversions segregating in the thermal stocks (labelled on the right-hand side next to the segments; overlapping inversions underlined) are indicated. (For further details on the formation of the gene arrangements by overlapping inversions, see [84].)
CG
1830
CG
1494
8
CG
2151
CG
2028
CG
3989
CG
1223
0
CG
7107
CG
9575
CG
9214
CG
6606
CG
2257
CG
1848
CG
3658
CG
9212
CG
3095
CG
3917
CG
8649
A2A
stA
CG
4867
CG
5263
CG
1084
9
CG
1066
CG
3322
CG
1499
6
CG
1752
1
J
CG
3209
6
CG
8637
CG
3203
1
CG
5723
CG
1934
stJ
1J
CG
3743
CG
8593
CG
1312
4
CG
1072
8
CG
1002
1
CG
1544
4
CG
1309
6
CG
1759
CG
5353
CG
3210
CG
4494
CG
3645
CG
5304
U
CG
5711
CG
3048
CG
4758
CG
3305
CG
4170
CG
1192
7
CG
5920
CG
3694
CG
3177
4
1+2U
1+8+2U
stU
1U
2U
Page 9 of 15(page number not for citation purposes)

BMC Evolutionary Biology 2007, 7:42 http://www.biomedcentral.com/1471-2148/7/42
effect on larval growth and allows for accurate staging ofthird instar larvae just prior to pupation at their maximumsize [71]. Larvae with clean guts that stopped feeding andstarted to wander on the wall of the plastic chambers weregently removed with a spatula, cleaned several times withdistilled water, placed in bunches with 25 larvae eachinside microcentrifuge tubes containing 500 µL of TRIReagent® (Molecular Research Center, Inc.), and immedi-ately homogenized and stored at -80°C. These larvae(hereafter referred to as C18) provided the mRNA used asreference.
Subsequently, samples from all nine populations wereobtained in May-June 2004 (25 generations at 13°C, 35 at18°C, and 46 at 22°C) by placing eggs into twelve 130-mL bottles (~200–250 eggs per bottle). These bottles werecultured at 18°C and emerging adults were dumped into
Plexiglas cages for egg collections. Eggs for the experimentwere collected over a six days period by placing Petridishes containing non-nutritive agar with a generoussmear of live yeast in the cages. As before, ~100 eggs (± 4h) were placed at 18°C in 120-mL plastic chambers withstained Drosophila medium to sample the treatment thirdinstar larvae for further mRNA extraction.
b) RNA extraction and gene expression analysisTotal RNA was extracted from the frozen homogenizedlarvae by using TRI Reagent® (MRC, Inc.), and mRNA wasextracted by using Promega PolyATtract® isolation systemfollowing the manufacturer's specifications. Three mRNAextractions were performed from 9,000 C18 reference lar-vae (i.e., 3,000 larvae from each replicated population) toobtain a single reference pooled mRNA, and four inde-pendent extractions from 250 larvae each were made for
Physical mapping of differentially expressed genes on chromosomes E and O of Drosophila subobscuraFigure 6Physical mapping of differentially expressed genes on chromosomes E and O of Drosophila subobscura. Sche-matic representation of the location of 20 differentially expressed genes mapped along chromosome E (homologous to arm 2R in D. melanogaster), and 16 mapped along chromosome O (homologous to arm 3R in D. melanogaster). The centromere is placed on the left (black circle) and the telomere on the right. The linear order of genes is that in the standard gene arrange-ments, and the chromosomal regions covered by inversions segregating in the thermal stocks are indicated (labelled on the right-hand side next to the segments; overlapping inversions underlined). Inversions O5 and O7 were also sporadically found but are ignored here: the first is associated to a lethal gene and the second is probably the result of a recombination event in the O3+4+7/Ost heterokaryotype [16]).
CG
5581
CG
9854
CG
1775
9
CG
1031
5
CG
3870
CG
4798
CG
8472
E
CG
8364
CG
1237
2C
G3269
CG
1825
9
CG
1975
CG
5575
CG
9450
CG
1706
4
CG
9985
CG
2049
1+2+9E
1+2+9+3E
1+2+9+12E
stE
CG
3186
CG
3014
7
CG
3013
2
CG
3613
CG
1009
1
CG
6072
CG
4316
CG
9379;CG14066
CG
3294
0
CG
1690
1;
CG14066
CG
5394
O
CG
5650
CG
9764
CG
5670
CG
9749
CG
1198
8
CG14066
CG
6203
CG
5595
CG14066
3+4O
3+4+8O
3+4 2O
3+4 7O
2O
7O
CG
18290
CG
1866
stO
Page 10 of 15(page number not for citation purposes)
BMC Evolutionary Biology 2007, 7:42 http://www.biomedcentral.com/1471-2148/7/42
each treatment population. This procedure ensured truereplication in the experiment; namely, the referencemRNA was always hybridized with treatment mRNAscoming from independent larvae and extractions.
Relative mRNA levels were determined by parallel two-colour hybridization to cDNA microarrays from the Cana-dian Drosophila Microarray Centre (CDMC D12Kv1;[72]). The arrayed elements in these slides representapproximately 10,500 D. melanogaster genes to whichseven D. subobscura genes were added as positive controls.As previously discussed, we were confident that the use ofD. melanogaster arrays in heterologous hybridization withD. subobscura could offer a reasonable warranty to obtain-ing reliable data. However, the divergence between bothspecies (~25 Mya; [29]) may have been the reason for therelatively high number of genes that failed to hybridize(Fig. 1), even though other factors like lack of gene expres-sion in third instar larvae may have also been important.1 µg of poly(A)+-enriched RNA was labelled using theSuperScript Indirect cDNA labelling system (InvitrogenCorporation, California, USA). mRNA concentrations andcDNA synthesis were checked with Agilent 2100 bioana-lyzer (Agilent Technologies, California, USA). Equalamounts of labelled cDNA were combined with 10 µg ofyeast tRNA, speed vac dried and re-suspended in 230 µlDig Easy Hyb solution (Boehringer-Roche). The solutionwas incubated at 65°C for 10 min to denature the probes.
Hybridizations and washes were performed using theautomatic system Lucidea SlidePro (Amersham, UK). Thehybridization was allowed to proceed for 15 h at 25°C,and the slides were sequentially washed three times at50°C for 10 min with medium stringency buffer (1 × SCC,0.1% SDS), twice at room temperature for 1 min withhigh stringency buffer (1 × SCC), post wash buffer (0.1 ×SCC) and air dried. Then each slide was scanned using anAxon GenePix 4000B microarray scanner (Axon Instru-ments, Union City, California, USA). Data were extractedfrom the scanned images using GenePix® Pro (AxonInstruments) microarray image analysis. Labelling,hybridization and scanning were carried out at the Plata-forma de Transcriptòmica from the Parc Cientific de Bar-celona and Universitat de Barcelona (PCB-UB; [73]).
The raw data were adjusted using lowess normalizationsoftware (TIGR MIDAS ver. 2.19; [74]) with a tri-cubeweight function and 0.33 smooth parameter applied tothe C18 reference mRNA dye-labelled green (Cy3) or red(Cy5). For each experimental population four microarrayswere independently hybridized and scanned, adding to 36arrays in total. There were 14,440 duplicated spots oneach array, and only the spots that passed a quality controlof image analysis (i.e., array elements with intensities sig-nificantly different from background) were used in the
differential expression analysis. The gene spots were fur-ther filtered by excluding those with less than 57 out of 72(i.e., <79%) valid expression observations (Fig. 1), leaving4,651 probes for differential gene expression analysis. Thedata acquired from these procedures were relative meas-ures of gene expression independent of larval size differ-ences among the thermal stocks.
c) Experimental design and data analysis
The unit of analysis here is the population, and the threereplicated populations (R1, R2 and R3) of each thermalselection stock were treated as a random factor nestedwithin experimental temperature (13, 18 and 22°C),which was a fixed effect [64]. Given any treatment popu-lation pop = 13R1, 13R2,�, 22R3, and any probe g = 1, �,G for which valid expression levels were obtained, we use
notation , to denote normalized and
background adjusted gene expression from the referenceC18 mRNA sample that was dyed green (G) or red (R);
and , for gene expression intensities
obtained from the treatment mRNAs dyed green or red.
For each treatment population / ,
/ are the relative intensity ratios measured
from the corresponding slides. The fully balanced dye-reversal experimental design can be written as the linearmodel:
where for probe g, µg is the overall grand mean of the log
2 relative intensity ratios; is the fixed effect of the ith
experimental treatment (P13, P18, P22); is the ran-
dom effect of the jth replicate population (R1, R2, R3)
within treatment i; is the fixed effect of dye k (Cy3,
Cy5); is the interaction term; is the random
effect of slide l = 1, 2 within treatment i, replicate j and dye
k; and is the residual error associated with the cor-
responding log 2 relative intensity ratio of the ijklmthspot. This linear model easily allows partitioning allsources of experimental variation: biological (temperatureand replicated population effects) and technical (dye andslide effects).
Zcontg
( )G Zcontg
( )R
Zpopg
( )G Zpopg
( )R
Zpopg
( )G Zcontg
( )R
Zpopg
( )R Zcontg
( )G
y T D TDijklmg g
ig
j ig
kg
ikg
l ijkg
ijklmg= + + + + + + ( )µ ε ( ) ( ) , 1
Tig
j ig( )
Dkg
TDikg l ijk
g( )
εijklmg
Page 11 of 15(page number not for citation purposes)

BMC Evolutionary Biology 2007, 7:42 http://www.biomedcentral.com/1471-2148/7/42
Notice that for the treatment effect we are interested in
(i.e., the component due to thermal adaptation) the
linear model (1) can be conveniently reduced to the fol-lowing two-level nested ANOVA model:
where the sum of squares for the error term is simply
the sum of the sum of squares for the remainder terms in(1). The usefulness of this model reduction is obvious toefficiently perform randomization tests to test the nullhypothesis about treatment effects in a randomized (i.e.,random assignment) experiment [75]. Permutation testsare far less sensitive to the presence of outliers and are par-ticularly necessary with unequal sample sizes; i.e., whensome data points are missing as is usually the case withmicroarray experiments. The null hypothesis of no treat-ment or evolutionary thermal regime effect was testedhere after performing random permutations among repli-cate and selection temperature for the among selectiontemperature F-statistics. Each test used 10,000 randompermutations of the log 2 relative intensity ratios (recall
that when N = 72 there are
possible assignments of observations).
A planned comparison between the two treatment meansfrom the stocks at the two extreme thermal regimes (i.e.,P13 vs. P22) that had already diverged for 71 generationswas also performed for each probe g. The permutationtests were performed following [76]; namely, we first cal-
culated the statistic for the observed data and next the
residuals of the log 2 relative intensity ratios from thepopulations at P13 and P22 were randomly allocated toboth treatment temperatures. From B = 10,000 random
permutations we got a set of null statistics , b = 1,2, ...,
B; and the p-value was computed as:
Given the high-dimensionality of the data set the p-valueswere adjusted based on the concept of false discovery rate(FDR; [34]). If no probe g is differentially expressed the p-values will follow a U (0,1), where U stands for 'uniformdistribution'. The so-called Mixture Distribution Parti-tioning (MDP) methodology assumes that the distribu-
tion of p-values consists of a set of null p0 and alternativep1 components. This partition forms the basis for estimat-ing various quantities as for example the q-values, whichwere obtained here with the QVALUE software [35]. Theproblem now is to select a threshold of significance toidentify a set of genes likely to be differentially expressed.As an unsupervised criterion we used a q-value cut-off ≤0.05 for the P13 vs. P22 planned comparisons, meaningthat the maximum expected proportion of false positivesincurred when calling a particular gene 'differentiallyexpressed' is 5%.
d) Computer software for statistical analysisThe computer programs used for statistical data analyseswere MATLAB algebra program environment (ver. 7.0.4[77]) together with the collection of tools supplied by theStatistics Toolbox (ver. 5.0.2 [78]). The statistical softwarepackages STATISTICA version 6 [79] and SPSS version 13[80] were also used.
Mapping of candidate genesThe flies used for physical mapping of candidate geneswere collected from a natural population in Bordils (70Km North-east of Barcelona, Spain; 42° 3' N, 2° 54' E).About 150 males were individually crossed to three orfour virgin females from the ch-cu marker strain to help inthe identification of polymorphic inversions (the geneticbackground of this strain is highly homogeneous andfixed for the standard arrangements in all major acrocen-tric chromosomes but chromosome O, where it is fixedfor arrangement O3+4.
DNA isolation, DNA amplification, polytene chromo-some preparation and in situ hybridization were carriedout using standard techniques [81]. The karyotype of D.subobscura consists of five acrocentric chromosomes and adot chromosome. Following [82] the large chromosomesin this species are traditionally named as A (= X, the sexchromosome), J (= chromosomal element D of Mueller/Sturtevant/Novitski and homologous to arm 3L in Dro-sophila melanogaster [59]), U (= chromosomal element Band homologous to arm 2L), E (= chromosomal elementC and homologous to arm 2R), and O (= chromosomalelement E and homologous to arm 3R). The five majoracrocentric chromosomes and the dot chromosome aredivided into 100 sections (A: 1 – 16; J: 17 – 35; U: 36 – 53;E: 54 – 74; O: 75 – 99; Dot :100), and each section into 3–5 subsections (A, B, ...) [83].
Authors' contributionsHL sampled the thermal populations, made the RNAextractions, participated in the design of the experiment,carried out statistical analysis, Gene Ontology searches,and drafted the manuscript. FG-F, BEC-S and VT designedprimers, carried out in situ hybridizations on the polytene
Tig
y T eijkg g
ig
j ig
ijkg= + + + ( )µ ( ) , 2
eijkg
7224 24 24 2 56 1032!
( ! ! !) .≈ ×
Fg1
Fgb0
pF F F
Bg
g gb
g
b
B=
≥{ }
+( )
=∑
# ,.
1 0 1
1 13
Page 12 of 15(page number not for citation purposes)

BMC Evolutionary Biology 2007, 7:42 http://www.biomedcentral.com/1471-2148/7/42
chromosomes of D. subobscura, and read all salivary glandsquashes from the in situ hybridizations. SB and MC coor-dinated the microarray experiments for generating theoriginal data. MS set up and maintained the thermal pop-ulations, designed the study, carried out statistical analy-ses and drafted the final version of the manuscript. Allauthors read and approved the final manuscript.
Additional material
AcknowledgementsWe thank Lidia Sevilla from Parc Científic de Barcelona for her invaluable technical assistance with the microarray experiment, Victor Moreno and Miguel Pignatelli for helpful discussions with the experimental design and Gene Ontology classification, and Elias Zintzaras for useful discussions on statistical analysis. We would also like to acknowledge the critical and con-structive comments of two anonymous reviewers which have helped to improve the article significantly. This work was supported by grants BOS2003-05904-C02 and CGL2006-13423-01/BOS from the Ministerio de Ciencia y Tecnología (Spain), 2001SGR-00207 from the Direcció General de Recerca (Generalitat de Catalunya) to the GBE, grant GEN2001-4846-C05-02 from the Ministerio de Educación y Ciencia (Spain), and by Fun-dación Ramón Areces (Spain).
References1. Gockel J, Kennington WJ, Hoffmann AA, Goldstein DB, Partridge L:
Nonclinality of molecular variation implicates selection inmaintaining a morphological cline of Drosophila mela-nogaster. Genetics 2001, 158:319-323.
2. de Jong G, Bochdanovits Z: Latitudinal clines in Drosophila mel-anogaster: body size, allozyme frequencies, inversion fre-quencies, and the insulin-signalling pathway. J Genet 2003,82:207-223.
3. Santos M, Brites D, Laayouni H: Thermal evolution of pre-adultlife history traits, geometric size and shape, and develop-
mental stability in Drosophila subobscura. J Evol Biol 2006,19:2006-2021.
4. Hoffmann AA, Weeks AR: Climatic selection on genes andtraits after a 100 year-old invasion: a critical look at the tem-perate-tropical clines in Drosophila melanogaster from east-ern Australia. Genetica 2007, 129:133-147.
5. Umina PA, Weeks AR, Kearney MR, McKechnie SW, Hoffmann AA:A rapid shift in a classic clinal pattern in Drosophila reflectingclimate change. Science 2005, 308:691-693.
6. Levitan M, Etges WJ: Climate change and recent genetic flux inpopulations of Drosophila robusta. BMC Evol Biol 2005, 5:4.
7. Balanya J, Oller JM, Huey RB, Gilchrist GW, Serra L: Global geneticchange tracks global climate warming in Drosophila subob-scura. Science 2006, 313:1773-1775.
8. Van Heerwaarden B, Hoffmann AA: Global warming: fly popula-tions are responding rapidly to climate change. Curr Biol 2007,17:R16-R18.
9. Krimbas CB: Drosophila subobscura: Biology, Genetics and Inversion Poly-morphism Hamburg, Germany: Verlag Dr. Kovac; 1993.
10. Prevosti A, Ribó G, Serra L, Aguadé M, Balañá J, Monclús M, MestresF: Colonization of America by Drosophila subobscura: Experi-ment in natural populations that supports the adaptive roleof chromosomal-inversion polymorphism. Proc Natl Acad SciUSA 1988, 85:5597-5600.
11. Huey RB, Gilchrist GW, Hendry AP: Using invasive species tostudy evolution. In Species Invasions: Insights to Ecology, Evolution andBiogeography Edited by: Sax DF, Gaines SD, Stachowicz JJ. Sunderland:Sinauer Associates; 2005:139-164.
12. Balanyà J, Serra L, Gilchrist GW, Huey RB, Pascual M, Mestres F, SoléE: Evolutionary pace of chromosomal polymorphism in colo-nizing populations of Drosophila subobscura: an evolutionarytime series. Evolution 2003, 57:1837-1845.
13. Gilchrist GW, Huey RB, Balanyà J, Pascual M, Serra L: A time seriesof evolution in action: a latitudinal cline in wing size in SouthAmerican Drosophila subobscura. Evolution 2004, 58:768-780.
14. Rose MR, Nusbaum TJ, Chippendale AK: Laboratory evolution:the experimental wonderland and the Cheshire Cat syn-drome. In Adaptation Edited by: Rose MR, Lauder GV. San Diego:Academic Press; 1996:221-241.
15. Santos M, Fernández Iriarte P, Céspedes W, Balanyà J, Fontdevila A,Serra L: Swift laboratory thermal evolution of wing shape (butnot size) in Drosophila subobscura and its relationship withchromosomal inversion polymorphism. J Evol Biol 2004,17:841-855.
16. Santos M, Céspedes W, Balanyà J, Trotta V, Calboli FCF, FontdevilaA, Serra L: Temperature-related genetic changes in labora-tory populations of Drosophila subobscura: evidence againstsimple climatic-based explanations for latitudinal clines. AmNat 2005, 165:258-273.
17. Rifkin SA, Kim J, White KP: Evolution of gene expression in theDrosophila melanogaster subgroup. Nat Genet 2003, 33:138-144.
18. Wray GA, Hahn MW, Abouheif E, Balhoff JP, Pizer M, Rockman MV,Romano LA: The evolution of transcriptional regulation ineukaryotes. Mol Biol Evol 2003, 20:1377-419.
19. Khaitovich P, Weiss G, Lachmann M, Hellmann I, Enard W, MuetzelB, Wirkner U, Ansorge W, Pääbo S: A neutral model of transcrip-tome evolution. PLoS Biol 2004, 5:682-689.
20. Michalak P, Noor MAF: Association of misexpression with ste-rility in hybrids of Drosophila simulans and D. mauritiana. J MolEvol 2004, 59:277-282.
21. Gibson G, Weir B: The quantitative genetics of transcription.Trends Genet 2005, 21:616-623.
22. Ranz JM, Machado CA: Uncovering evolutionary patterns ofgene expression using microarrays. Trends Ecol Evol 2006,21:29-37.
23. Feder ME, Walter J-C: The biological limitations of transcrip-tomics in elucidating stress and stress responses. J Evol Biol2005, 18:901-910.
24. Partridge L, Barrie B, Fowler K, French V: Thermal evolution ofpre-adult life-history traits in Drosophila melanogaster. J EvolBiol 1994, 7:645-663.
25. Joshi A, Mueller LD: Density-dependent natural selection inDrosophila: trade-offs between larval food acquisition andutilization. Evol Ecol 1996, 10:463-474.
Additional file 1Summary of microarray results from the 4,651 cDNA clones with valid expression observations. The details for the different columns are explained within the file itself.Click here for file[http://www.biomedcentral.com/content/supplementary/1471-2148-7-42-S1.xls]
Additional file 2Molecular function GO categories for the differentially expressed genes. Analysis of functional categories defined by the Gene Ontology project [36] using the GOToolBox [37].Click here for file[http://www.biomedcentral.com/content/supplementary/1471-2148-7-42-S2.xls]
Additional file 3Physical map of differentially expressed genes. Localization by in situ hybridization on the salivary gland chromosomes of Drosophila subob-scura of 88 differentially expressed genes.Click here for file[http://www.biomedcentral.com/content/supplementary/1471-2148-7-42-S3.pdf]
Page 13 of 15(page number not for citation purposes)

BMC Evolutionary Biology 2007, 7:42 http://www.biomedcentral.com/1471-2148/7/42
26. Santos M, Borash DJ, Joshi A, Bounlutay N, Mueller LD: Density-dependent natural selection in Drosophila: evolution ofgrowth rate and body size. Evolution 1997, 51:420-432.
27. Eisen MB, Brown PO: DNA arrays for analysis of geneexpresión. Methods Enzymol 1999, 303:179-205.
28. Renn SCP, Aubin-Horth N, Hofmann HA: Biologically meaningfulexpression profiling across species using heterologoushybridization to a cDNA microarray. BMC Genomics 2004, 5:42.
29. Russo CA, Takezaki N, Nei M: Molecular phylogeny and diver-gence times of drosophilid species. Mol Biol Evol 1995,12:391-404.
30. Krimbas CB, Loukas M: The inversion polymorphism of Dro-sophila subobscura. Evol Biol 1980, 12:163-234.
31. Betrán E, Santos M, Ruiz A: Antagonistic pleiotropic effect ofsecond-chromosome inversions on body size and early life-history traits in Drosophila buzzatii. Evolution 1998, 52:144-154.
32. Hoffmann AA, Sgrò CM, Weeks AR: Chromosomal inversion pol-ymorphism and adaptation. Trends Ecol Evol 2004, 19:482-488.
33. Frischer LE, Hagen FS, Garber RL: An inversion that disrupts theAntennapedia gene causes abnormal structure and localiza-tion of RNAs. Cell 1986, 47:1017-1023.
34. Benjamini Y, Hochberg Y: Controlling the false discovery rate –A practical and powerful approach to multiple testing. J RoyStat Soc Series B-Methodol 1995, 57:289-300.
35. Storey JD, Tibshirani R: Statistical significance for genomewidestudies. Proc Natl Acad Sci USA 2003, 100:9440-9445.
36. Ashburner M, Ball CA, Blake JA, Botstein D, Butler H, Cherry JM,Davis AP, Dolinski K, Dwight SS, Eppig JT, Harris MA, Hill DP, Issel-Tarver L, Kasarskis A, Lewis S, Matese JC, Richardson JE, Ringwald M,Rubin GM, Sherlock G: Gene ontology: tool for the unificationof biology. The Gene Ontology Consortium. Nat Genet 2000,25:25-29.
37. GOToolBox: Functional Investigation of Gene DatasetsGenome Biol 2004, 5(12R101 [http://crfb.univ-mrs.fr/GOToolBox].
38. Kristensen TN, Sørensen P, Pedersen KS, Kruhøffer M, Loeschcke V:Inbreeding by environmental interactions affect geneexpression in Drosophila melanogaster. Genetics 2006,173:1329-1336.
39. Bochdanovits Z, de Jong G: Experimental evolution in Dro-sophila melanogaster: interaction of temperature and foodquality selection regimes. Evolution 2003, 57:1829-1836.
40. Feder ME, Hofmann GE: Heat-shock proteins, molecular chap-erones and the stress response: evolutionary and ecologicalphysiology. Annu Rev Physiol 1999, 61:243-282.
41. Parsell DA, Taulien J, Lindquist S: The role of heat-shock proteinsin thermotolerance. Phil Trans Roy Soc London Series B 1993,339:279-286.
42. Krebs RA: A comparison of Hsp70 expression and thermotol-erance in adults and larvae of three Drosophila species. CellStress Chaperones 1999, 4:243-249.
43. Bettencourt BR, Kim I, Hoffmann AA, Feder ME: Response to nat-ural and laboratory selection at the Drosophila hsp 70 genes.Evolution 2002, 56:1796-1801.
44. Frydenberg J, Hoffmann AA, Loeschcke V: DNA sequence varia-tion and latitudinal associations in hsp23, hsp26 and hsp27from natural populations of Drosophila melanogaster. Mol Ecol2003, 12:2025-2032.
45. McColl G, Hoffmann AA, McKechnie SW: Response of two heatshock genes to selection for knockdown heat resistance inDrosophila melanogaster. Genetics 1996, 143:1615-1627.
46. Hoffmann AA, Sorensen JG, Loeschcke V: Adaptation of Dro-sophila to temperature extremes: bringing together quanti-tative and molecular approaches. J Therm Biol 2003, 28:175-216.
47. Anderson AR, Collinge JE, Hoffmann AA, Kellett M, McKechnie SW:Thermal tolerance tradeoffs associated with the right arm ofchromosome 3 and marked by the Hsromega gene in Dro-sophila melanogaster. Heredity 2003, 90:195-202.
48. Lin YJ, Seroude L, Benzer B: Extended life-span and stress resist-ance in the Drosophila mutant methuselah. Science 1998,282:943-946.
49. Duvernell DD, Schmidt PS, Eanes WF: Clines and adaptive evolu-tion in the methuselah gene region in Drosophila mela-nogaster. Mol Ecol 2003, 12:1277-1285.
50. Goto SG: A novel gene that is up-regulated during recoveryfrom cold shock in Drosophila melanogaster. Gene 2001,270:259-264.
51. Ferrante AW Jr, Reinke R, Stanley ER: Shark, a Src homology 2,ankyrin repeat, tyrosine kinase, is expressed on the apicalsurfaces of ectodermal epithelia. Proc Natl Acad Sci USA 1995,92:1911-1915.
52. Greenberg AJ, Moran JR, Coyne JA, Wu CI: Ecological adaptationduring incipient speciation revealed by precise gene replace-ment. Science 2003, 302:1754-1757.
53. Costa R, Peixoto AA, Barbujani G, Kyriacou CP: A latitudinal clinein a Drosophila clock gene. Proc R Soc London B 1992, 250:43-49.
54. Morgan TJ, Mackay TFC: Quantitative trait loci for thermotol-erance phenotypes in Drosophila melanogaster . Heredity 2006,96:232-242.
55. Oakeshott JG, Gibson JB, Anderson PR, Knibb WR, Chambers GK:Alcohol dehydrogenase and glycerol-3-phosphate dehydro-genase clines in Drosophila melanogaster on different conti-nents. Evolution 1982, 36:86-96.
56. Oakeshott JG, McKechnie SW, Chambers GK: Population geneticsof the metabolically related Adh, Gpdh, and Tpi polymor-phisms in Drosophila melanogaster. I. Geographic variation inGpdh and Tpi allele frequencies in different continents. Genet-ica 1984, 63:21-29.
57. Sezgin E, Duvernell DD, Matzkin LM, Duan YH, Zhu CT, Verrelli BC,Eanes WF: Single-locus latitudinal clines and their relationshipto temperate adaptation in metabolic genes and derivedalleles in Drosophila melanogaster. Genetics 2004, 168:923-931.
58. Arbona M, De Frutos R, Tanguay RM: Transcriptional and trans-lational study of the Drosophila subobscura hsp83 gene in nor-mal and heat-shock conditions. Genome 1993, 36:694-700.
59. Powell JR: Progress and Prospects in Evolutionary Biology. The DrosophilaModel New York: Oxford University Press; 1997.
60. Hartl DL, Lozovskaya ER: The Drosophila Genome Map: A PracticalGuide New York: Springer-Verlag; 1995.
61. Segarra C, Ribó G, Aguadé M: Differentiation of Muller's chro-mosomal elements D and E in the obscura group of Dro-sophila. Genetics 1996, 144:139-146.
62. Ranz JM, Casals F, Ruiz A: How malleable is the eukaryoticgenome? Genome Res 2001, 11:230-239.
63. Adams MD, Celniker SE, Holt RA, Evans CA, Gocayne JD, Amanati-des PG, Scherer SE, Li PW, Hoskins RA, Galle RF, George RA, LewisSE, Richards S, Ashburner M, Henderson SN, Sutton GG, WortmanJR, Yandell MD, Zhang Q, Chen LX, Brandon RC, Rogers YHC, BlazejRG, Champe M, Pfeiffer BD, Wan KH, Doyle C, Baxter EG, Helt G,Nelson CR, Miklos GLG, Abril JF, Agbayani A, An HJ, Andrews-Pfann-koch C, Baldwin D, Ballew RM, Basu A, Baxendale J, Bayraktaroglu L,Beasley EM, Beeson KY, Benos PV, Berman BP, Bhandari D, BolshakovS, Borkova D, Botchan MR, Bouck J, Brokstein P, Brottier P, BurtisKC, Busam DA, Butler H, Cadieu E, Center A, Chandra I, Cherry JM,Cawley S, Dahlke C, Davenport LB, Davies A, de Pablos B, DelcherA, Deng ZM, Mays AD, Dew I, Dietz SM, Dodson K, Doup LE,Downes M, Dugan-Rocha S, Dunkov BC, Dunn P, Durbin KJ, Evange-lista CC, Ferraz C, Ferriera S, Fleischmann W, Fosler C, GabrielianAE, Garg NS, Gelbart WM, Glasser K, Glodek A, Gong FC, GorrellJH, Gu ZP, Guan P, Harris M, Harris NL, Harvey D, Heiman TJ, Her-nandez JR, Houck J, Hostin D, Houston DA, Howland TJ, Wei MH,Ibegwam C, Jalali M, Kalush F, Karpen GH, Ke ZX, Kennison JA,Ketchum KA, Kimmel BE, Kodira CD, Kraft C, Kravitz S, Kulp D, LaiZW, Lasko P, Lei YD, Levitsky AA, Li JY, Li ZY, Liang Y, Lin XY, LiuXJ, Mattei B, McIntosh TC, McLeod MP, McPherson D, Merkulov G,Milshina NV, Mobarry C, Morris J, Moshrefi A, Mount SM, Moy M,Murphy B, Murphy L, Muzny DM, Nelson DL, Nelson DR, Nelson KA,Nixon K, Nusskern DR, Pacleb JM, Palazzolo M, Pittman GS, Pan S,Pollard J, Puri V, Reese MG, Reinert K, Remington K, Saunders RDC,Scheeler F, Shen H, Shue BC, Siden-Kiamos I, Simpson M, Skupski MP,Smith T, Spier E, Spradling AC, Stapleton M, Strong R, Sun E, SvirskasR, Tector C, Turner R, Venter E, Wang AHH, Wang X, Wang ZY,Wassarman DA, Weinstock GM, Weissenbach J, Williams SM,Woodage T, Worley KC, Wu D, Yang S, Yao QA, Ye J, Yeh RF,Zaveri JS, Zhan M, Zhang GG, Zhao Q, Zheng LS, Zheng XQH, ZhongFN, Zhong WY, Zhou XJ, Zhu SP, Zhu XH, Smith HO, Gibbs RA,Myers EW, Rubin GM, Venter JC: The genome sequence of Dro-sophila melanogaster. Science 2000, 287:2185-2195.
64. Sokal RR, Rohlf FJ: Biometry 3rd edition. New York: Freeman; 1995. 65. Krimbas CB, Loukas M: Drosophila subobscura: lengths of chro-
mosome segments heterozygotes for inversions, to be usedin IFR calculations. Eur Dros Pop Biol Group Bull 1979, 3:4-11.
Page 14 of 15(page number not for citation purposes)

BMC Evolutionary Biology 2007, 7:42 http://www.biomedcentral.com/1471-2148/7/42
Publish with BioMed Central and every scientist can read your work free of charge
"BioMed Central will be the most significant development for disseminating the results of biomedical research in our lifetime."
Sir Paul Nurse, Cancer Research UK
Your research papers will be:
available free of charge to the entire biomedical community
peer reviewed and published immediately upon acceptance
cited in PubMed and archived on PubMed Central
yours — you keep the copyright
Submit your manuscript here:http://www.biomedcentral.com/info/publishing_adv.asp
BioMedcentral
66. Fontdevila A, Zapata C, Alvarez G, Sánchez L, Méndez J, Enríquez I:Genetic coadaptation in the chromosomal polymorphism ofDrosophila subobscura. I. Seasonal changes of gametic dise-quilibrium in a natural population. Genetics 1983, 105:935-955.
67. Rodríguez-Trelles F: Seasonal cycles of allozyme-by-chromo-somal-inversion gametic disequilibrium in Drosophila subob-scura. Evolution 2003, 57:839-848.
68. Brncic D, Budnik M: Colonization of Drosophila subobscura Col-lin in Chile. Dros Inf Serv 1980, 55:20.
69. Kerr MK, Churchill GA: Statistical design and the analysis ofgene expresión microarray data. Genet Res 2001, 77:123-128.
70. David J: A new medium for rearing Drosophila in axenic con-ditions. Dros Inf Serv 1962, 36:128.
71. Andres AJ, Thummel CS: Methods for quantitative analysis oftranscription in larvae and prepupae. In Drosophila melanogaster:Practical Uses in Cell and Molecular Biology. Methods in Cell Biology Volume44. Edited by: Goldstein L, Fyrberg E. New York: Academic Press;1994:565-573.
72. Canadian Drosophila Microarray Centre [http://www.flyarrays.com]
73. Parc Científic de Barcelona [http://www.pcb.ub.es/homePCB/live/en/p126.asp]
74. Saeed AI, Sharov V, White J, Li J, Liang W, Bhagabati N, Braisted J,Klapa M, Currier T, Thiagarajan M, Sturn A, Snuffin M, Rezantsev A,Popov D, Ryltsov A, Kostukovich E, Borisovsky I, Liu Z, Vinsavich A,Trush V, Quackenbush J: TM4: A free, open-source system formicroarray data management and analysis. Biotechniques 2003,34:374-378.
75. Edgington ES: Randomization Tests 3rd edition. New York: MarcelDekker; 1995.
76. Manly BFJ: Randomization, Bootstrap and Monte Carlo Methods in Biology2nd edition. London: Chapman & Hall; 1997.
77. The MathWorks Inc: : MATLAB, version 7.0.4. The Language ofTechnical Computing 2005 [http://www.mathworks.com].
78. The MathWorks Inc: Statistics Toolbox for use with MATLAB,version 5.0.2. 2005 [http://www.mathworks.com].
79. StatSoft Inc: STATISTICA (data analysis software system), ver-sion 6. 2003 [http://www.statsoft.com].
80. SPSS Inc: SPSS for Windows. 2004 [http://www.spss.com].81. Laayouni H, Santos M, Fontdevila A: Toward a physical map of
Drosophila buzzatii: Use of randomly amplified polymorphicDNA polymorphisms and sequence-tagged site landmarks.Genetics 2000, 156:1797-1816.
82. Mainx F, Koske T, Smital E: Untersuchungen über die chromo-somale Struktur europäischer Vertreter der Drosophilaobscura Gruppe. Zeitschrift für inducktive Abstammungs- und Ver-erbungslehre 1953, 85:354-372.
83. Kunze-Mühl E, Müller E: Weitere Untersuchungen über diechromosomale Struktur und natürlichen Strukturtypen vonD. subobscura. Chromosoma 1958, 9:559-570.
84. Krimbas CB: The inversion polymorphism of Drosophila subob-scura. In Drosophila Inversion Polymorphism Edited by: Krimbas CB,Powell JR. Boca Raton: CRC Press; 1992:127-220.
Page 15 of 15(page number not for citation purposes)