bmo global equity weekly 11-18-2011
TRANSCRIPT

8/3/2019 BMO Global Equity Weekly 11-18-2011
http://slidepdf.com/reader/full/bmo-global-equity-weekly-11-18-2011 1/4
ECONOMICR E S EAR CH
Robert Kavcic, Economist November 18, 20
1-800-613-0205 • www.bmonesbittburns.com/economics
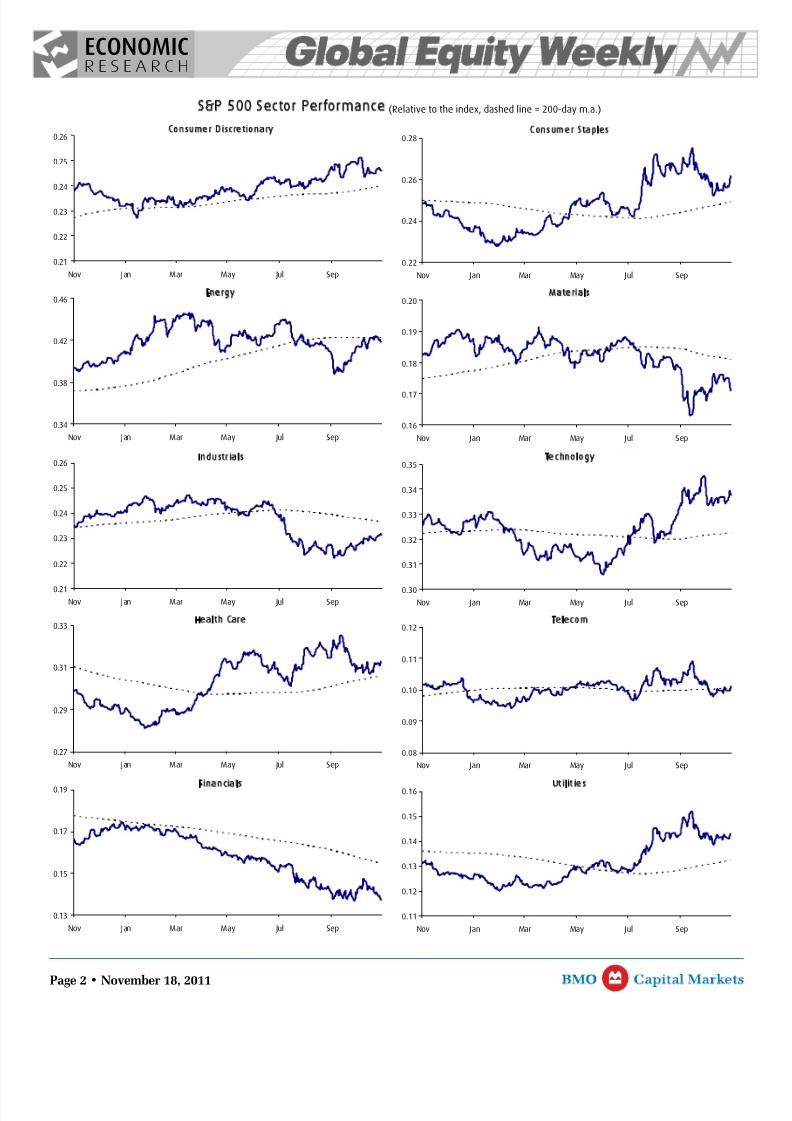
Mixed EmotionsEquity markets were under pressure this week, as ongoing turmoil in Europe outweighed further signsthat the U.S. economy maintained its momentum into the fourth quarter. The S&P 500 fell 3.8%, with all
sectors in the red, including steep 5%-plus declines in materials, energy and financials. Meantime, theTSX slumped 3.1%, also amid broad-based weakness, including a deep 6.7% dive in the gold sector.
While equity markets have firmed up since late summer, the overriding concern about a messy outcomein Europe continues to act as a ceiling on sentiment and equity prices. One can argue that, if not for theuncertainty in Europe, stocks would be flaring higher in typical late-year fashion right now, thanks to alow base of sentiment, still-strong earnings results and firming U.S. economic momentum. Equity marketsentiment was extremely depressed by late summer, with most measures registering bearish tones not
seen since the Great Recession,and the mood remains quitedownbeat today. Additionally,valuations are ringing in favour of equities, with the S&P 500 forwardearnings yield topping 8%, ormore than 6 ppts above 10-yearTreasuries. But, a favourablesentiment and valuation backdropis, by itself, not a sufficientcondition to spur stock priceshigher. Rather, that combination plus improving fundamentals arewhat the bulls need.
Setting Europe aside for a minute,some fundamentals have indeed
improved, namely the all-important U.S. economy. U.S. economic data continued to top expectations this week, including better-than-expected reports on consumer spending, industrial production and housing. Interestingly, the much-maligned housing market continues to show signs that it is at least finding some stability, if not a ray of upward momentum. The combined mortgage delinquency and foreclosure rate fell to the lowest levelsince late 2008 in Q3, homebuilder confidence has firmed, and mortgage lending standards have at leaststabilized after about 4 years of tightening. There’s no question that the level of U.S. housing activity isstill extremely depressed, but stability is good news at the margin. All told, after a very sluggish first half for the U.S. economy, immediate recession fears have subsided, and decent 3% GDP growth appears likelyin Q4.
Ordinarily, this would be just the fundamental improvement that the bulls need to unwind bearishsentiment and favourable valuations, pushing stock prices firmly higher. But the European trump card isstill in the deck, and equity investors are rightfully hesitant given some potentially ugly consequencesfrom the sovereign debt crisis. Not to be overlooked, Europe makes up about 30% of S&P 500 revenues,and recession in that region has the potential to eat into otherwise still-solid earnings results. In short,stocks probably want to burst higher, but Europe won’t let them.
Market Performance as of November 18, 2011
Current Performance (percent)
Price 1 Week 1 Month 3 Months 1 Year YTD 2010
IKKEI 225 8,375 -1.6 -4.2 -6.4 -16.4 -18.1 -3.0
ow Jones 11,796 -2.9 1.9 7.3 5.5 1.9 11.0
S&P/TSX 11,892 -3.1 -1.3 -2.4 -7.6 -11.5 14.4
China CSI 300 2,606 -3.3 0.6 -8.0 -17.2 -16.7 -12.5
TSE 100 5,363 -3.3 -0.9 5.3 -7.0 -9.1 9.0
S&P 500 1,216 -3.8 -0.8 6.6 1.6 -3.3 12.8
ASDAQ 2,573 -4.0 -3.2 8.1 2.3 -3.0 16.9
AX 5,800 -4.2 -1.3 3.5 -15.1 -16.1 16.1
CAC 40 2,997 -4.8 -4.6 -2.6 -22.5 -21.2 -3.3
ource: Bloomberg
8/3/2019 BMO Global Equity Weekly 11-18-2011
http://slidepdf.com/reader/full/bmo-global-equity-weekly-11-18-2011 2/4

8/3/2019 BMO Global Equity Weekly 11-18-2011
http://slidepdf.com/reader/full/bmo-global-equity-weekly-11-18-2011 3/4
ECONOMICR E S EAR CH
Page 3 • November 18, 2011
TSX Sector Performance (Relative to the index, dashed line = 200-day m.a.)
Consumer Discretionary
0.7
0.8
0.8
0.9
0.9
Nov Jan Mar May Jul Sep
Consumer Staples
1.1
1.2
1.3
1.4
1.5
Nov Jan Mar May Jul Sep
Energy
2.0
2.1
2.2
2.3
2.4
2.5
2.6
Nov Jan Mar May Jul Sep
Materials
2.5
2.7
2.9
3.1
3.3
3.5
Nov Jan Mar May Jul Sep
Industrials
0.9
1.0
1.1
1.2
Nov Jan Mar May Jul Sep
Technology
0.1
0.1
0.2
0.2
0.3
Nov Jan Mar May Jul Sep
Health Care
0.2
0.3
0.4
0.5
0.6
0.7
Nov Jan Mar May Jul Sep
Telecom
0.5
0.6
0.7
0.8
0.9
Nov Jan Mar May Jul Sep
Financials
1.1
1.2
1.3
1.4
Nov Jan Mar May Jul Sep
Utilities
1.2
1.3
1.4
1.5
1.6
1.7
Nov Jan Mar May Jul Sep

8/3/2019 BMO Global Equity Weekly 11-18-2011
http://slidepdf.com/reader/full/bmo-global-equity-weekly-11-18-2011 4/4
ECONOMICR E S EAR CH
Page 4 • November 18, 2011
North American Sector Performances as of November 18, 2011
S&P 500 Sectors 1 Week 1 Month 3 Months 1 Year YTD 2010
Cons Staples -1.2 0.6 4.3 7.6 5.3 10.7
Utilities -2.2 1.0 6.3 10.8 9.7 0.9Telecom Services -2.9 -1.6 1.5 0.5 -4.9 12.3Industrials -3.0 1.6 10.7 0.7 -6.3 23.9Banks -3.4 -1.5 9.1 -9.4 -19.6 18.7Health Care -3.6 0.6 5.7 6.0 4.0 0.7Information Technology -3.7 -2.7 10.8 4.6 0.7 9.1Cons Discretionary -4.0 -2.1 9.7 5.3 1.1 25.7
Energy -5.4 0.3 6.1 7.8 -0.1 17.9Materials -5.6 -0.2 2.5 -4.0 -12.9 19.9Financials -5.6 -2.6 1.0 -16.0 -21.8 10.8
S&P 600 Small Cap -3.0 2.5 10.5 4.4 -3.8 25.0
S&P 400 Mid Cap -3.5 1.0 7.3 1.6 -5.1 24.9
S&P 100 Large Cap -3.5 -1.2 5.9 1.6 -3.2 10.1S&P 500 -3.8 -0.8 6.6 1.6 -3.3 12.8
TSX SectorsHealth Care 1.4 12.7 12.5 52.0 39.8 50.3Energy -1.7 0.3 1.5 -6.5 -13.1 10.0Cons Discretionary -1.8 -1.0 1.1 -14.4 -17.2 21.8Cons Staples -1.8 -0.7 5.1 4.9 2.5 8.3Industrials -1.8 4.9 6.4 2.1 -0.2 14.4Information Technology -1.8 -8.7 -11.6 -46.2 -46.5 -11.6
Telecom Services -1.9 -1.6 1.4 9.6 10.7 16.2Banks -2.3 -4.7 -6.1 -9.0 -9.2 6.4Utilities -2.3 -3.9 1.0 3.1 -1.4 12.6Financials -2.6 -4.2 -5.5 -9.5 -10.9 6.3Gold -6.7 0.6 -4.0 -4.2 -7.4 26.2Materials -6.8 -1.1 -7.3 -10.2 -16.0 35.8
REITs 0.6 3.2 5.3 9.6 10.8 15.1Income Trusts -0.2 3.3 6.5 15.5 12.4 17.5
S&P/TSX Mid Cap -3.1 -0.2 -1.5 -5.8 -10.4 26.5S&P/TSX 60 Large Cap -3.2 -1.7 -2.7 -8.3 -12.0 10.9S&P/TSX Small Cap -4.3 0.9 -5.3 -10.2 -17.4 31.3
TSX -3.1 -1.3 -2.4 -7.6 -11.5 14.4
Source: Bloomberg
The information, opinions, estimates, projections and other materials contained herein are provided as of the date hereof and are subject to change without notice. Some of the information, opinions, estimates, projections and other materials contained herein have been obtained from numerous sources andBank of Montreal (“BMO”) and its affiliates make every effort to ensure that the contents thereof have been compiled or derived from sources believed to be reliable and to contain information and opinions which are accurate and complete. However, neither BMO nor its affiliates have independently verifieor make any representation or warranty, express or implied, in respect thereof, take no responsibility for any errors and omissions which may be contained herein or accept any liability whatsoever for any loss arising from any use of or reliance on the information, opinions, estimates, projections and othematerials contained herein whether relied upon by the recipient or user or any other third party (including, without limitation, any customer of the recipient or user). Information may be available to BMO and/or its affiliates that is not reflected herein. The information, opinions, estimates, projections and othematerials contained herein are not to be construed as an offer to sell, a solicitation for or an offer to buy, any products or services referenced herein (including, without limitation, any commodities, securities or other financial instruments), nor shall such information, opinions, estimates, projections and othematerials be considered as investment advice or as a recommendation to enter into any transaction. Additional information is available by contacting BMO or its relevant affiliate directly. BMO and/or its affiliates may make a market or deal as principal in the products (including, without limitation, anycommodities, securities or other financial instruments) referenced herein. BMO, its affiliates, and/or their respective shareholders, directors, officers and/or employees may from time to time have long or short positions in any such products (including, without limitation, commodities, securities or othefinancial instruments). BMO Nesbitt Burns Inc. and/or BMO Capital Markets Corp., subsidiaries of BMO, may act as financial advisor and/or underwriter for certain of the corporations mentioned herein and may receive remuneration for same. “BMO Capital Markets” is a trade name used by the Bank Montreal Investment Banking Group, which includes the wholesale/institu tional arms of Bank of Montreal, BMO Nesbitt Burns Inc., BMO Nesbitt Burns Ltée/Ltd., BMO Capital Markets Corp. and Harris N.A., and BMO Capital Markets Limited. TO U.S. RESIDENTS: BMO Capital Markets Corp. and/or BMO NesbBurns Securities Ltd., affiliates of BMO NB, furnish this report to U.S. residents and accept responsibility for the contents herein, except to the extent that it refers to securities of Bank of Montreal. Any U.S. person wishing to effect transactions in an y security discussed herein should do so through BMO CapitaMarkets Corp. and/or BMO Nesbitt Burns Securities Ltd. TO U.K. RESIDENTS: The contents hereof are not directed at investors located in the U.K., other than persons described in Part VI of the Financial Services and Markets Act 2000 (Financial Promotion) Order 2001.
™ - “BMO (M-bar roundel symbol) Capital Markets” is a trade-mark of Bank of Montreal, used under licence. © Copyright Bank of Montreal 2006