bnp paribas multi-asset diversified future index · 2018-01-12 · the target volatility is locked...
TRANSCRIPT

BNP PARIBAS MULTI-ASSET DIVERSIFIED FUTURE INDEX Marketing Communication – For professional clients only This document has been prepared for discussion purposes only and does not constitute an offer or a solicitation to engage in any trading strategy or the purchase or sale of any financial instrument.
CORPORATE & INSTITUTIONAL BANKING GLOBAL MARKETS DECEMBER 2017

2 December 2017 |
SOLUTION OVERVIEW 1
WHY THE BNP PARIBAS MULTI-ASSET DIVERSIFIED FUTURE INDEX?
3 December 2017 |
A systematic approach based on two investment principles:
What, when? At the underlying level: Trend Following is used to determine positions and market timing
How? At the portfolio level: asset allocation integrates individual asset views while privileging a robust risk diversification
Special care to Risk Management is provided through daily execution, daily forex hedging and several risk controls. The target volatility is locked at 8%, 4% or 2% depending on the Index version.
A highly liquid strategy 100% invested in futures
The BNP Paribas Multi-Asset Diversified Future Index is based on the successful investment methodology of the BNP Paribas Multi-Asset Diversified Index, created in 2012.
To better address new market conditions, like very low rates or restless equity markets, the Index benefits from a high flexibility in its asset allocation: unconstrained exposures and short positions are allowed
A COMPREHENSIVE APPROACH
2. 1.
4 December 2017 |
INVESTMENT PHILOSOPHY 2
5 December 2017 |
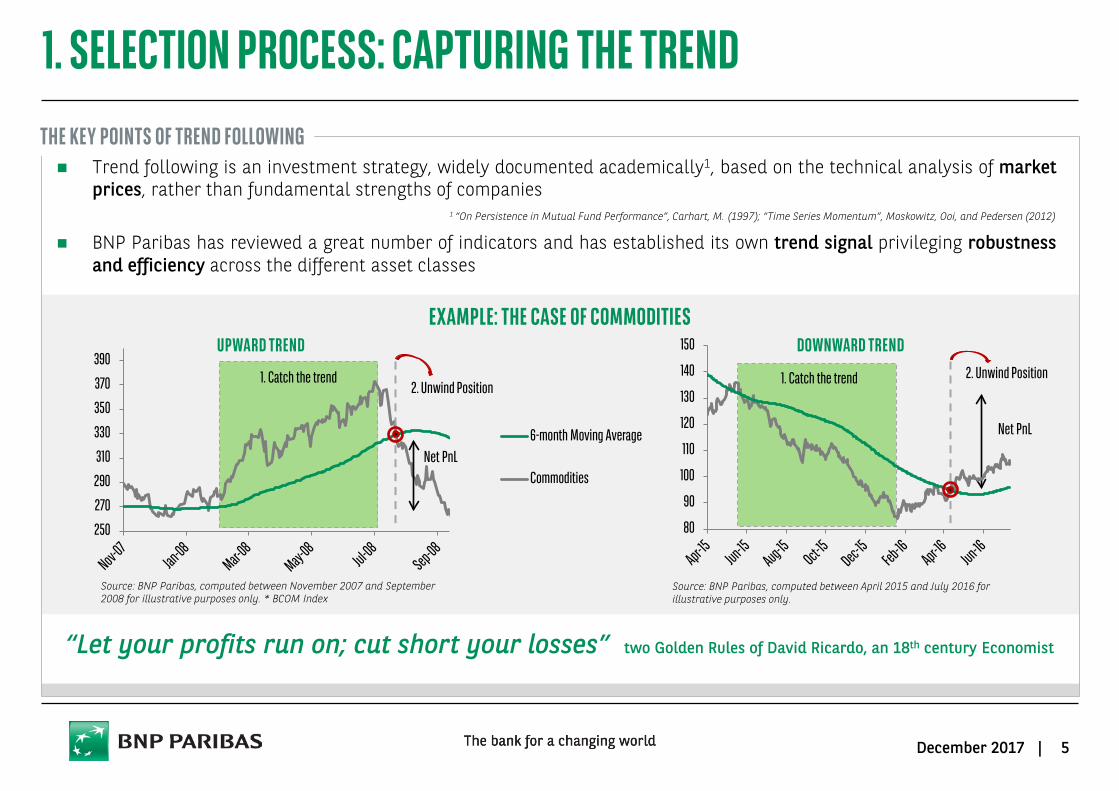
1. SELECTION PROCESS: CAPTURING THE TREND THE KEY POINTS OF TREND FOLLOWING Trend following is an investment strategy, widely documented academically1, based on the technical analysis of market
prices, rather than fundamental strengths of companies
BNP Paribas has reviewed a great number of indicators and has established its own trend signal privileging robustness and efficiency across the different asset classes
EXAMPLE: THE CASE OF COMMODITIES
“Let your profits run on; cut short your losses” two Golden Rules of David Ricardo, an 18th century Economist
1 “On Persistence in Mutual Fund Performance”, Carhart, M. (1997); “Time Series Momentum”, Moskowitz, Ooi, and Pedersen (2012)
DOWNWARD TREND
Source: BNP Paribas, computed between April 2015 and July 2016 for illustrative purposes only.
Source: BNP Paribas, computed between November 2007 and September 2008 for illustrative purposes only. * BCOM Index
UPWARD TREND
Net PnL
1. Catch the trend
Net PnL
250
270
290
310
330
350
370
390
2. Unwind Position 1. Catch the trend 2. Unwind Position
80
90
100
110
120
130
140
150
6-month Moving Average
Commodities
6 December 2017 |
0%
1%
2%
3%
4%
5%
6%
7%
8%
9%
0% 5% 10% 15% 20% 25% 30% 35% 40%
Retur
nRisk (volatility)
Individual Underlyings
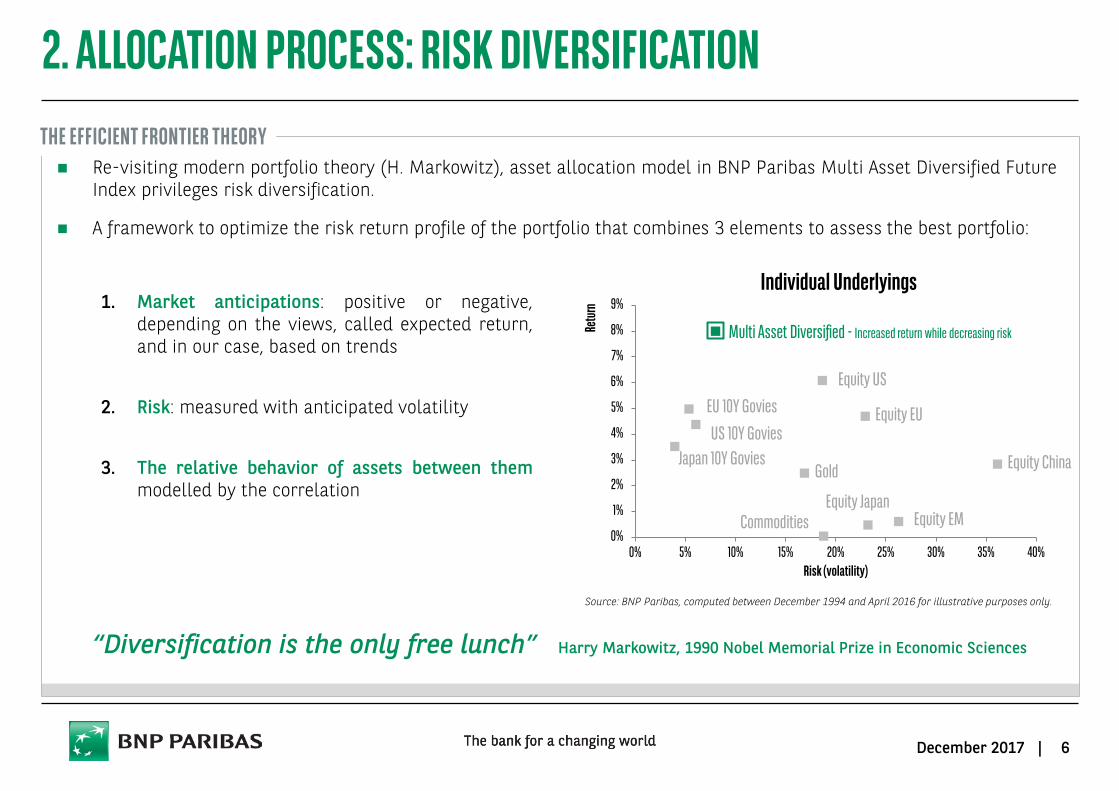
2. ALLOCATION PROCESS: RISK DIVERSIFICATION
Re-visiting modern portfolio theory (H. Markowitz), asset allocation model in BNP Paribas Multi Asset Diversified Future Index privileges risk diversification.
A framework to optimize the risk return profile of the portfolio that combines 3 elements to assess the best portfolio:
“Diversification is the only free lunch” Harry Markowitz, 1990 Nobel Memorial Prize in Economic Sciences
1. Market anticipations: positive or negative, depending on the views, called expected return, and in our case, based on trends
2. Risk: measured with anticipated volatility
3. The relative behavior of assets between them modelled by the correlation
THE EFFICIENT FRONTIER THEORY
Equity US
Equity EU
Equity Japan
Equity China
EU 10Y Govies
Gold
Source: BNP Paribas, computed between December 1994 and April 2016 for illustrative purposes only.
Multi Asset Diversified - Increased return while decreasing risk
US 10Y Govies Japan 10Y Govies
Commodities Equity EM

7 December 2017 |
3 THE BNP PARIBAS MULTI-ASSET DIVERSIFIED FUTURE INDEX I - BEYOND ALLOCATION II - INVESTMENT PROCESS III - RISK MANAGEMENT

THE BNP PARIBAS MULTI-ASSET DIVERSIFIED FUTURE INDEX THE 3 INVESTMENT STEPS
BNP Paribas Multi-Asset Diversified Future Index
BEYOND ALLOCATION Universe of Assets: expanded investment capabilities by the use of futures
The possibility to use unconstrained allocation and take short positions increases the Fund’s agility, especially during crisis periods
A very dynamic allocation
I.
INVESTMENT PROCESS
A purely systematic process based on a proprietary methodology that has been extensively stress-tested
Quantitative allocation based solely on price action
A BNPP innovative approach in the estimation of the expected returns
II.
Source: BNP Paribas, December 2017.
RISK MANAGEMENT
III. Daily management of allocation levels in order to ensure high reactivity and robustness
and avoid timing risk The Portfolio is actively monitored with different levels of risk control: individual &
global, and has a similar risk profile as a traditional retirement portfolio (at 8%, 4% or 2% (depending on the Index version)
8 December 2017 |

9 December 2017 |
THE BNP PARIBAS MULTI-ASSET DIVERSIFIED FUTURE INDEX I - BEYOND ALLOCATION II - INVESTMENT PROCESS III - RISK MANAGEMENT
3
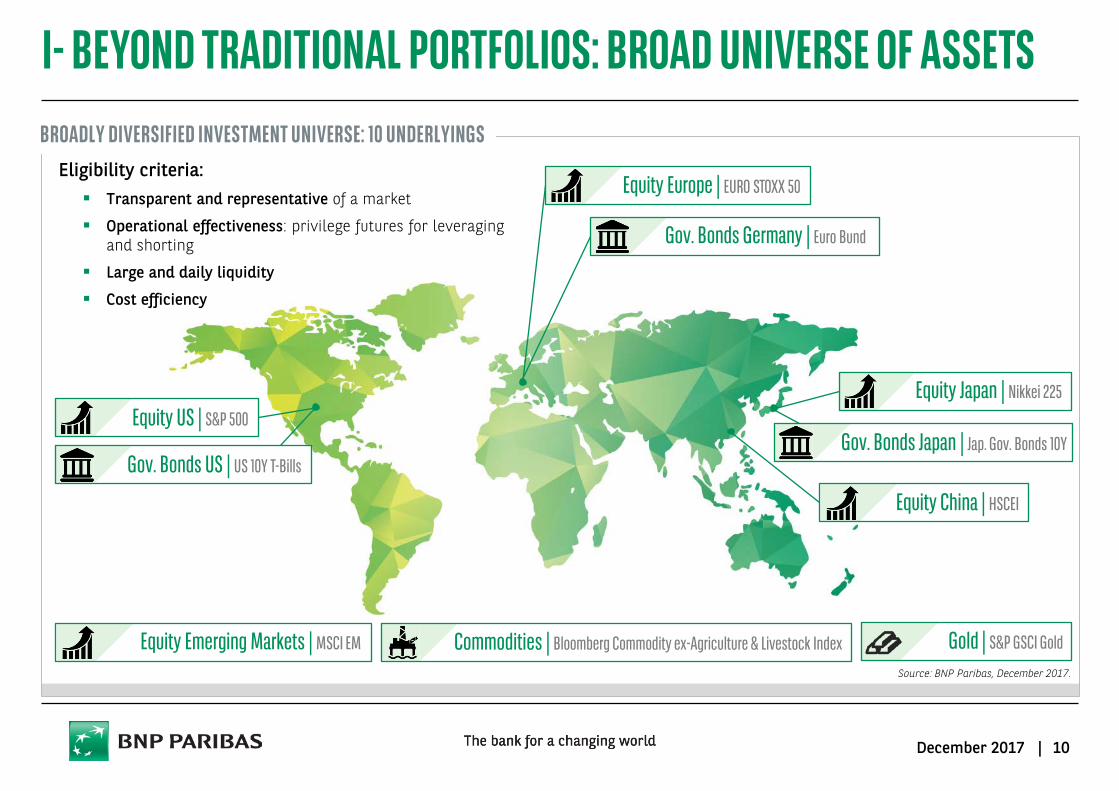
I- BEYOND TRADITIONAL PORTFOLIOS: BROAD UNIVERSE OF ASSETS
Equity Europe | EURO STOXX 50
Equity US | S&P 500 Equity Japan | Nikkei 225
Equity China | HSCEI
Gov. Bonds Germany | Euro Bund
Gov. Bonds US | US 10Y T-Bills Gov. Bonds Japan | Jap. Gov. Bonds 10Y
Commodities | Bloomberg Commodity ex-Agriculture & Livestock Index Equity Emerging Markets | MSCI EM
BROADLY DIVERSIFIED INVESTMENT UNIVERSE: 10 UNDERLYINGS
Source: BNP Paribas, December 2017.
Gold | S&P GSCI Gold
Eligibility criteria: Transparent and representative of a market
Operational effectiveness: privilege futures for leveraging and shorting
Large and daily liquidity
Cost efficiency
10 December 2017 |

11 December 2017 |
I- BEYOND TRADITIONAL PORTFOLIOS: WHAT ABOUT FOREX ?
Forex, in particular, is not biased by global growth and inflation in the very long run. Forex momentum would therefore require additional complexity in the proprietary model
As investors are more focused on indices in local currency, trend following is usually stronger when looking at trends without forex effect
The BNP Paribas Multi-Asset Diversified Future Index positions are protected daily against Forex Variation
FOCUSING ON GENUINE ASSET BEHAVIOURS
CURRENCY DEBASEMENT
Source: Bloomberg, BNP Paribas, as of December 2014. For illustrative purposes only.
Excluding forex will allow the strategy to better capture the effect of Central Bank policies: E.g. equity market going up when the currency level is decreasing
⇒ Better transparency on the behaviour of the strategy as performances are not blurred with forex effect
9095
100105110115120125130
Japanese Equity
Japanese Equity Composite USD
FOREX AS A COMPONENT

12 December 2017 |
I- BEYOND TRADITIONAL PORTFOLIOS: EFFECTIVE RISK DIVERSIFICATION
10%
90%
50% 50% EQUITY/BOND
NOMINAL EXPOSURE
RISK EXPOSURE
EXAMPLE A: BALANCED PORTFOLIO
Balanced Asset Allocation brings high risk concentration
Risk parity allocation is well diversified but volatility is too low to generate enough performance, in a context of low risk premium. There is a need for more flexibility (leverage+short)
USING LEVERAGE TO EFFICIENTLY BENEFIT FROM DIVERSIFICATION
EXPANDING TRADING POSSIBILITIES WITH UNCONSTRAINED ALLOCATION
EXAMPLE B: RISK PARITY PORTFOLIO
80% 20%
50% 50%
10% P.A. VOLATILITY 4% P.A.

13 December 2017 |
80
85
90
95
100
105
110
BNP Paribas Multi-asset Diversified Vol 8 EUR Future Index MSCI World Index
MSCI World Index vs. BNP Paribas Multi-Asset Diversified Vol 8 EUR Future Index
BNP Paribas Multi-Asset Diversified Future Index allows for limited recourse to short selling, which can bring added value when considered as hedging positions
I- BEYOND TRADITIONAL PORTFOLIOS: SHORT POSITIONS EXPANDING TRADING POSSIBILITIES WITH LIMITED SHORT SELLING
+4.61% Spread
Brexit
Short positons on emerging equities and commodities mitigated losses on other risky asset long positions.
⇒ Allowing short positions aims to help weather shocks under depressed markets
Short EURO STOXX 50 vs. Long S&P 500 during Brexit referendum
Source: Bloomberg, BNP Paribas, as of June 2016. For illustrative purposes only. Source: Bloomberg, BNP Paribas, from end of December 2015 to end of February 2016. For illustrative purposes only.
80859095
100105110115120
Equities US (S&P 500 Index) Equities Europe (EURO STOXX 50 Index)
14 December 2017 |
0
1
2
3
4
5
6
-40%-20%
0%20%40%60%80%
100%120%140%
Dec-06 Dec-07 Dec-08 Dec-09 Dec-10 Dec-11 Dec-12 Dec-13 Dec-14 Dec-15
Bund Weight Cumulated Gains 10Y Swap
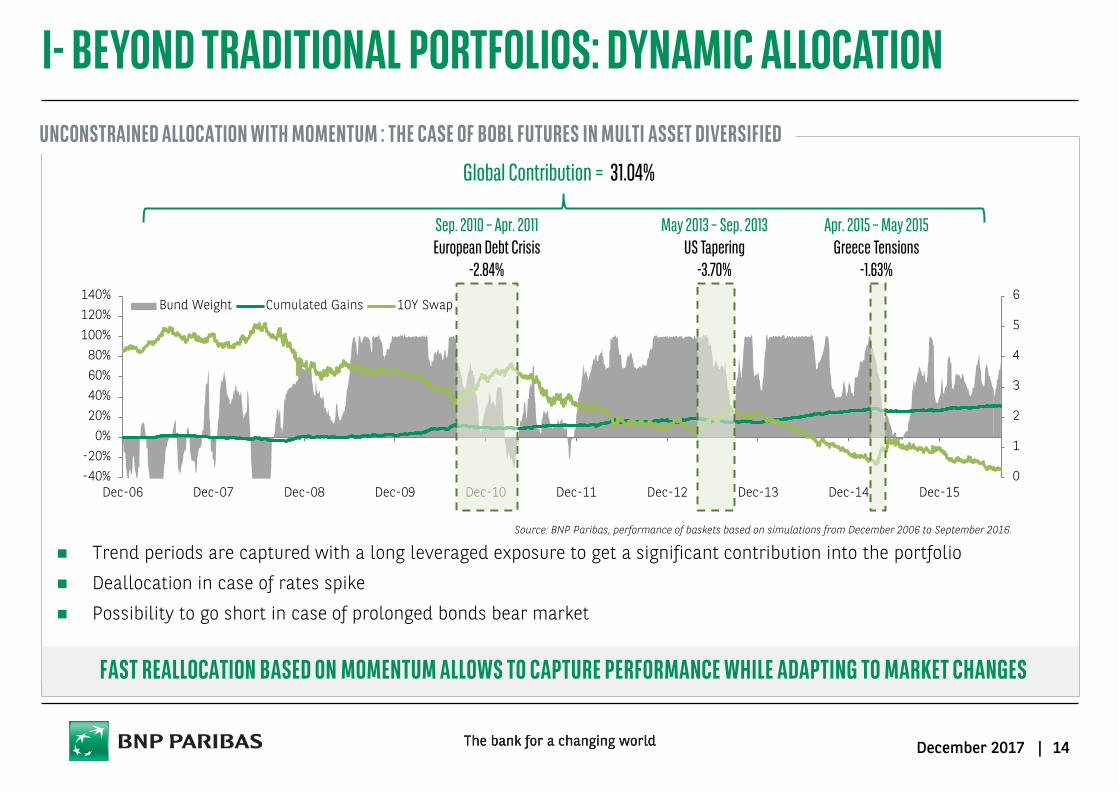
I- BEYOND TRADITIONAL PORTFOLIOS: DYNAMIC ALLOCATION UNCONSTRAINED ALLOCATION WITH MOMENTUM : THE CASE OF BOBL FUTURES IN MULTI ASSET DIVERSIFIED
Sep. 2010 – Apr. 2011 European Debt Crisis
-2.84%
May 2013 – Sep. 2013 US Tapering
-3.70%
Apr. 2015 – May 2015 Greece Tensions
-1.63%
Trend periods are captured with a long leveraged exposure to get a significant contribution into the portfolio
Deallocation in case of rates spike
Possibility to go short in case of prolonged bonds bear market
Global Contribution = 31.04%
Source: BNP Paribas, performance of baskets based on simulations from December 2006 to September 2016.
FAST REALLOCATION BASED ON MOMENTUM ALLOWS TO CAPTURE PERFORMANCE WHILE ADAPTING TO MARKET CHANGES

15 December 2017 |
I- BEYOND TRADITIONAL PORTFOLIOS: WEIGHT CAPS AND FLOORS
Individual Asset Class Minimum/Maximum weights* Equity Europe -50% 50%
Equity US -50% 50%
Equity Japan -50% 50%
Equity China -10% 10%
Equity Emerging Markets -5% 5%
Gov. Bonds Germany -100% 100%
Gov. Bonds US -100% 100%
Gov. Bonds Japan -25% 25%
Commodities -25% 25%
Gold -25% 25%
Sum of weights* BNP PARIBAS MULTI-ASSET DIVERSIFIED VOL 8 FUTURE INDEX ≤ 300%
BNP PARIBAS MULTI-ASSET DIVERSIFIED VOL 4 FUTURE INDEX ≤ 150%
BNP PARIBAS MULTI-ASSET DIVERSIFIED VOL 2 FUTURE INDEX ≤ 100%
At the time of daily rebalancing the following weight constraints, designed to take into account liquidity, risk and nature of the underlying, are implemented:
Source: BNP Paribas, December 2017. *Individual weights referred are for the 8% vol. Index. Caps and floors are adjusted pro-rata.

16 December 2017 |
3 THE BNP PARIBAS MULTI-ASSET DIVERSIFIED FUTURE INDEX I - BEYOND ALLOCATION II - INVESTMENT PROCESS III - RISK MANAGEMENT

17 December 2017 |
II- INVESTMENT PROCESS: A SYSTEMATIC DAILY PROCESS
Hypothetical example for illustrative purposes only and not indicative of actual trading results.
Portfolio testing 2
Previous Expected Return: 1.7%
3 Portfolio determination
-100%
+100%
Weight
Initial Weights
New Weights
New Expected Return: 2.2%
Market observation 1
Time
Price Action
Expected Performance
Volatility
Correlation
Price
-100%
+100%
Weight increment
Eq. EU
Eq. US
Bond EU
Bond US
Eq. EM
Commo.
Eq. EU
Eq. US
Bond EU
Bond US
Commo.
Eq. EM
-100%
+100%
Weight
Eq. EU
Eq. US
Bond EU
Bond US
Commo.
Eq. EM
Weights are tested
Performance Impact +
Risk Control
EACH BUSINESS DAY…

18 December 2017 |
II- INVESTMENT PROCESS: A HIGH FLEXIBILITY
A simple allocation using past returns (momentum strategy) already leads to better returns than a static portfolio
Unconstrained allocation and short positions bring forth additional performance (see chart below)
x 1.08
1.08 Sharpe Ratio 8.23% p.a.
0.50 Sharpe Ratio 4.77% p.a.
1.00 Sharpe Ratio 6.81% p.a.
0.88 Sharpe Ratio 4.80% p.a.
x 1.14
x 1.76
COMPARISON OF DIFFERENT PORTFOLIO ALLOCATION: A sound usage of leveraged and short positions allows better return for less risk
CAN MOMENTUM BE IMPROVED ?
BENEFITS OF A HIGHER FLEXIBILITY
The Key for increased performance remains anticipating well market behaviour
Source: BNP Paribas, performance of baskets based on simulations from December 1994 to December 2016 on the universe of the Index. Past or simulated performance or achievement is not indicative of current or future performance.
1
Cumu
lative
Retur
n (log
10)
Long-Short Efficient Frontier Portfolio (unconstrained)
Classic Efficient Frontier Portfolio (long-only)
Risk Adjusted Portfolio (long only)
Equal Weighted Portfolio (long only)
19 December 2017 |
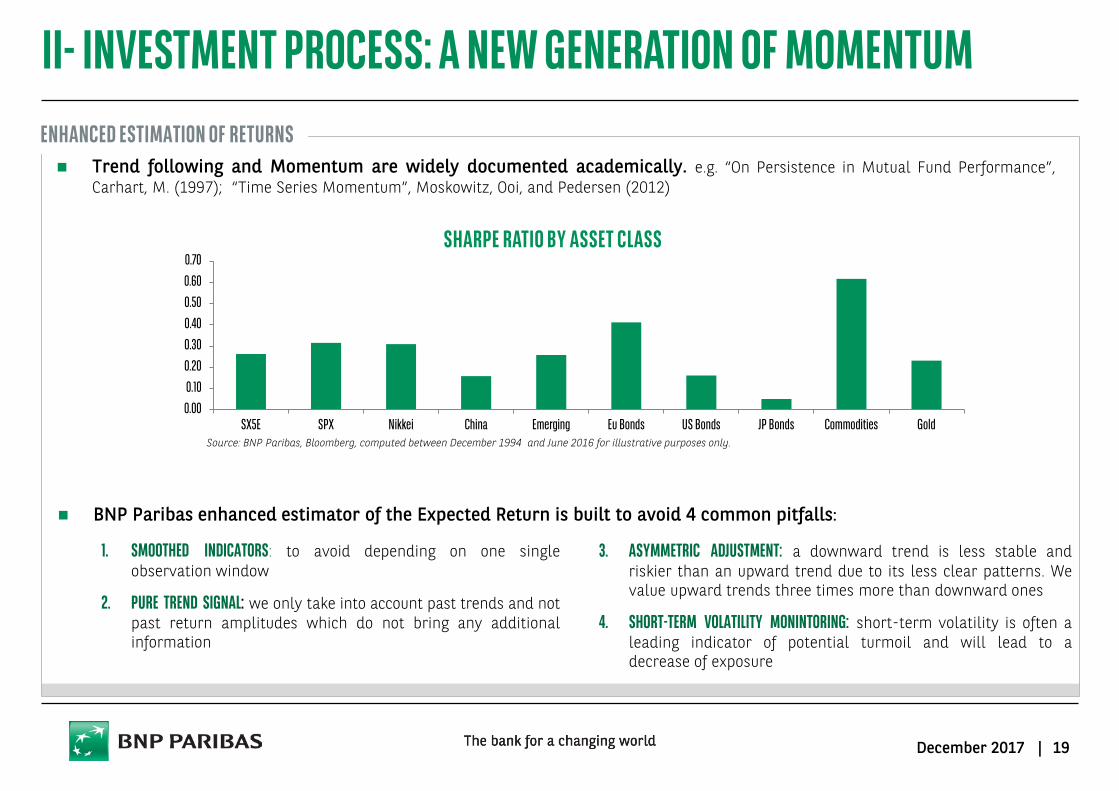
Trend following and Momentum are widely documented academically. e.g. “On Persistence in Mutual Fund Performance”, Carhart, M. (1997); “Time Series Momentum”, Moskowitz, Ooi, and Pedersen (2012)
II- INVESTMENT PROCESS: A NEW GENERATION OF MOMENTUM ENHANCED ESTIMATION OF RETURNS
BNP Paribas enhanced estimator of the Expected Return is built to avoid 4 common pitfalls:
1. SMOOTHED INDICATORS: to avoid depending on one single observation window
2. PURE TREND SIGNAL: we only take into account past trends and not past return amplitudes which do not bring any additional information
3. ASYMMETRIC ADJUSTMENT: a downward trend is less stable and riskier than an upward trend due to its less clear patterns. We value upward trends three times more than downward ones
4. SHORT-TERM VOLATILITY MONINTORING: short-term volatility is often a leading indicator of potential turmoil and will lead to a decrease of exposure
SHARPE RATIO BY ASSET CLASS
Source: BNP Paribas, Bloomberg, computed between December 1994 and June 2016 for illustrative purposes only.
0.000.100.200.300.400.500.600.70
SX5E SPX Nikkei China Emerging Eu Bonds US Bonds JP Bonds Commodities Gold

20 December 2017 |
1100
1150
1200
1250
1300
1350
1400
30-Jun-11 15-Jul-11 30-Jul-11 14-Aug-11 29-Aug-11
SPX 12 month MA 3 month MA
II- INVESTMENT PROCESS: A LOWER RELIANCE ON OBSERVATION PERIODS
Long-term Moving Averages do not capture a sudden and sharp market fall: their reactivity is poor (e.g. 12 month lag)
Shorter-term Moving Averages are more reactive, but tend to overreact when market trend starts changing (e.g. 3 month lag)
⇒ E.g. on 29th July 2011 (just before the market crash, see chart above), the 3-month Moving Average was negative, whereas the 12-month Moving Average was positive: contradictory signal (resulting in very different PnL for the two strategies)
Traditional momentum can indicators send mixed signals depending on the timeframe they capture (e.g. charts below)
SMOOTHED INDICATORS TO COMPENSATE PITFALLS OF MOVING AVERAGES 1
Source: BNP Paribas, Bloomberg, computed between June 2010 and August 2011. For illustrative purposes only.
NEED TO COMBINE SHORT AND LONG TERM INDICATORS
LONG TERM INDICATORS CAN CAUSE A POOR REACTIVITY… … WHILE SHORT TERM INDICATORS CAN SEND FALSE SIGNALS:
Source: BNP Paribas, Bloomberg, computed between June 2013 and August 2014. For illustrative purposes only.
1500
1600
1700
1800
1900
2000
2100
Jun-13 Aug-13 Oct-13 Dec-13 Feb-14 Apr-14 Jun-14 Aug-14
SPX 12 month MA 3 month MA

21 December 2017 |
II- INVESTMENT PROCESS: A PURE TREND SIGNAL
There is no linear relationship between the amplitude of the past 1-year return and of the 1-month future return of a strategy (e.g. chart above)
Historically, past important movements have not lead to the highest future performances, on the contrary (mean-reversion phenomenon). You cannot predict the amplitude of a movement, only the trend
TREND BRINGS INFORMATION, AMPLITUDE DOES NOT
AMPLITUDE OF PAST RETURNS NOT AN INDICATOR OF FUTURE PERFORMANCE 2
The past performance of an underlying is not a reliable indicator of the amplitude of its future returns
IT IS MORE CHALLENGING TO PREDICT THE AMPLITUDE OF A MOVEMENT THAN ITS LIKELY TREND
Bubble effect
Source: BNP Paribas, Bloomberg, Euro Stoxx 50 returns computed between December 1993 and March 2013 for illustrative purposes only.
-6%-5%-4%-3%-2%-1%0%1%2%3%
0% 10% 20% 30% 40% 50% 60% 70%1-
Mon
th r
ealis
ed r
etur
n
Previous 1Y Return
22 December 2017 |
150
160
170
180
190
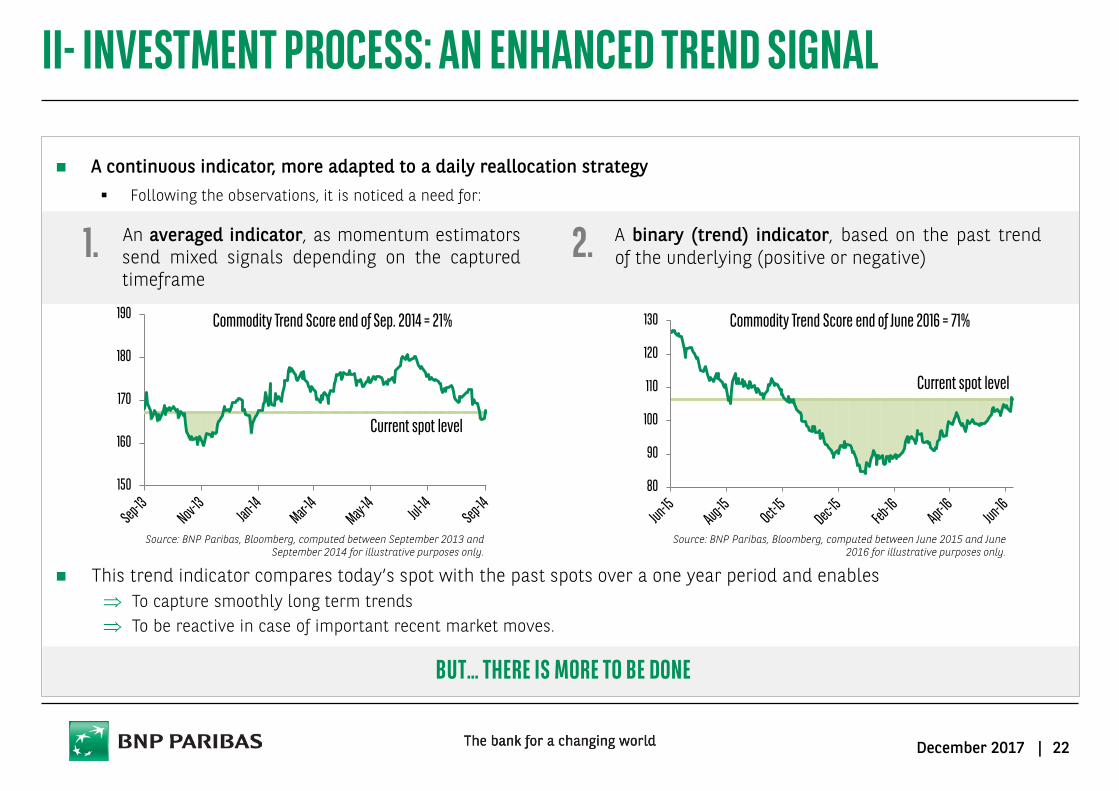
II- INVESTMENT PROCESS: AN ENHANCED TREND SIGNAL
This trend indicator compares today’s spot with the past spots over a one year period and enables ⇒ To capture smoothly long term trends ⇒ To be reactive in case of important recent market moves.
An averaged indicator, as momentum estimators send mixed signals depending on the captured timeframe
A binary (trend) indicator, based on the past trend of the underlying (positive or negative) 1. 2.
Current spot level
80
90
100
110
120
130 Commodity Trend Score end of June 2016 = 71%
Source: BNP Paribas, Bloomberg, computed between June 2015 and June 2016 for illustrative purposes only.
A continuous indicator, more adapted to a daily reallocation strategy Following the observations, it is noticed a need for:
BUT… THERE IS MORE TO BE DONE
Current spot level
Source: BNP Paribas, Bloomberg, computed between September 2013 and September 2014 for illustrative purposes only.
Commodity Trend Score end of Sep. 2014 = 21%

23 December 2017 |
II- INVESTMENT PROCESS: AN ASYMMETRIC ADJUSTMENT
A downward trend is more difficult to predict and more risky than an upper trend (less clear patterns) asymmetry between long and short positions, with 3 times more weight given to long positions
CONDITIONAL SHARPE RATIO WITH AND WITHOUT ASYMMETRY ADJUSTMENT
NOT ALL TRENDS ARE BORN EQUAL 3
Investing in more heavily on an upward trend will, on average, bring a significantly higher Sharpe Ratio than a downward trend (e.g. chart below)
Source: BNP Paribas, Bloomberg, computed between December 1994 and July 2016 for illustrative purposes only.
UNDERWEIGHT SHORT VS. LONG POSITIONS
0.00
0.10
0.20
0.30
0.40
0.50
0.60
0.70
SX5E SPX Nikkei China Emerging Eu Bonds US Bonds JP Bonds Commodities Gold
Sharpe Sharpe with Asymmetry
24 December 2017 |
146
147
148
149
150
151
152
153
0%
1%
2%
3%
4%
5%
6%
7%
Dec-15 Jan-16 Feb-16 Mar-16 Apr-16 May-16 Jun-16 Jul-16 Aug-16
JBG future 1 month volatility 1 year volatility 1 year / 1 month ratio
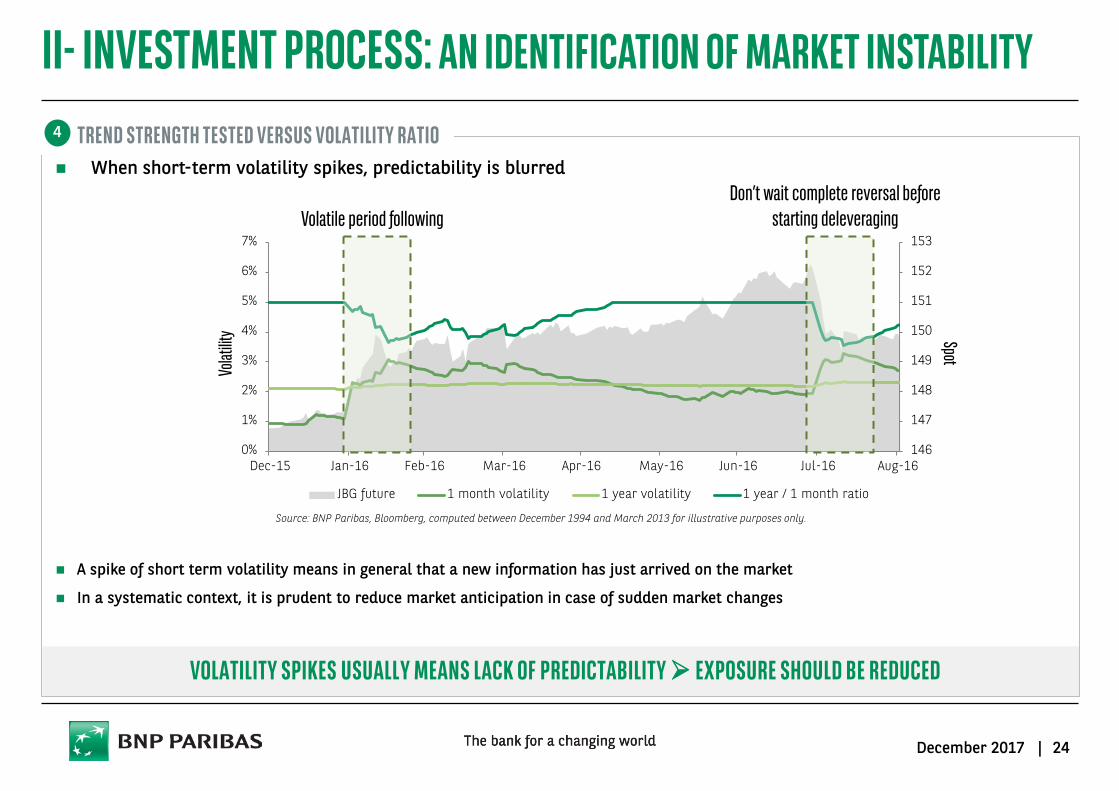
II- INVESTMENT PROCESS: AN IDENTIFICATION OF MARKET INSTABILITY
A spike of short term volatility means in general that a new information has just arrived on the market
In a systematic context, it is prudent to reduce market anticipation in case of sudden market changes
TREND STRENGTH TESTED VERSUS VOLATILITY RATIO When short-term volatility spikes, predictability is blurred
Source: BNP Paribas, Bloomberg, computed between December 1994 and March 2013 for illustrative purposes only.
4
VOLATILITY SPIKES USUALLY MEANS LACK OF PREDICTABILITY EXPOSURE SHOULD BE REDUCED
Volatile period following Don’t wait complete reversal before
starting deleveraging Vo
latilit
y Spot

25 December 2017 |
II- INVESTMENT PROCESS: THE MULTI-ASSET DIVERSIFIED APPROACH
Source: BNP Paribas, performance of baskets based on simulations from December 1994 to December 2016 on the universe of the Index. Past or simulated performance or achievement is not indicative of current or future performance.
x 1.08 1.08 Sharpe Ratio 8.23% p.a.
0.50 Sharpe Ratio 4.77% p.a.
1.00 Sharpe Ratio 6.81% p.a.
0.88 Sharpe Ratio 4.80% p.a.
x 1.14
x 1.76
1.50 Sharpe Ratio 11.61% p.a. x 1.39
BNPP’S SOLUTION IMPROVES THE CLASSIC APPROACH The implementation of the 4 simple observations of the BNP Paribas’ enhanced estimator of Expected Return has
historically resulted on a performance pick-up:
3. ASYMMETRIC ADJUSTMENT 4. SHORT-TERM VOLATILITY MONITORING
1. SMOOTHED INDICATORS 2. PURE TREND SIGNAL
Multi Asset Diversified strategy has shown a SR up to 4 times the one of a simple equal weight allocation
1
Cumu
lative
Retur
n (log
10)
Multi-Asset DiversifiedLong-Short Efficient Frontier Portfolio (unconstrained)Classic Efficient Frontier Portfolio (long-only)Risk Adjusted Portfolio (long only)Equal Weighted Portfolio (long only)

26 December 2017 |
3 THE BNP PARIBAS MULTI-ASSET DIVERSIFIED FUTURE INDEX I - BEYOND ALLOCATION II - INVESTMENT PROCESS III - RISK MANAGEMENT

27 December 2017 |
III- RISK MANAGEMENT: TIMING RISK
Timing has a big impact on performance For a monthly execution, the Risk/Return Ratio significantly depends on the reshuffle date
Daily allocation, on top of limiting timing risk, can lead to more stable performances
Daily management, allows for quick reactivity in case of market shocks
IMPACT OF EXECUTION ON RISK/RETURN RATIO*
DAILY EXECUTION IS A REAL PLUS
Source: BNP Paribas computed between December 2003 and April 2016 for illustrative purposes only. *The risk/return ration is computed by dividing the annual return and the Maximum Drawdown(in absolute value).
OUR APPROACH: DAILY EXECUTION
First Week Second Week Third Week Fourth Week Daily Monthly return 1% VaR -5.35% -5.33% -5.23% -5.22% -5.06%
Max Drawdown -13.72% -11.68% -12.86% -12.37% -10.31%
0.60
0.70
0.80
0.90
1.00
1.10
1.20
First Week Second Week Third Week Fourth Week Daily

28 December 2017 |
III- RISK MANAGEMENT: SMOOTHING EXECUTION
High reactivity of the weight allocation process results in a high cost, whereas an averaging over a short term period reduces the overall cost each time the underlying spot follows a mean reverting pattern:
On the left example above, after a 10% drop of the underlying spot, the strategy adjusts the exposure to 90%. When the spot rebounds to the initial values, the strategy only recovers 9%;
On the right example, after the same initial drop, the strategy recovers 9.8% due to the 5 day smoothing.
Smoothing execution is achieved indirectly by smoothing the trend signal.
In the long run, the strategy will loose a bit more in case of major reversal but will spear a lot of money on all the false signals.
THE BENEFITS OF AVERAGING (ONE WEEK PERIOD)
THE IMPACT OF SMOOTHING WEIGHT CHANGE A 5-day averaging mitigates the impact of short-term variations (e.g. charts below).
Case of a classic trend strategy where exposure is adjusted according to underlying spot evolution.
Source: BNP Paribas, Bloomberg, computed between December 1993 and March 2013 for illustrative purposes only.
A WEEKLY AVERAGING TO ENHANCE THE DAILY REBALANCING OF THE STRATEGY
-1% cost -0.2% cost
84%
86%
88%
90%
92%
94%
96%
98%
100%
102%
84
86
88
90
92
94
96
98
100
102
1 2 3 4 5
Spot Strategy Position (rhs)
84%
86%
88%
90%
92%
94%
96%
98%
100%
102%
84
86
88
90
92
94
96
98
100
102
1 2 3 4 5
Spot Strategy Position (rhs)

29 December 2017 |
III- RISK MANAGEMENT: FX AND VOLATILITY MANAGEMENT
At the component level, by taking into account spikes of short-term volatility, and maximum and minimum exposure
At the portfolio level:
Efficient Frontier 8%, 4% or 2% volatility target (depending on the Index version) to control long-term risk
Volatility control ex-post to control short-term risk
Daily execution allows quick reactivity
FX hedged mechanism: protection against currency risk
For illustrative purposes only.
Deleverage
Higher than Target Volatility
Lower than Target Volatility
150% Exposure
Risk of the portfolio (Realised Volatility)
100% Exposure
Equal to Target Volatility
Volatility under
control
1-YEAR REALISED VOLATILITY
Source: Bloomberg, BNP Paribas, as of 29 December 2017. Past performance is not necessarily a guide to future performance.
MULTIPLE RISK MANAGEMENT LAYERS
0%2%4%6%8%
10%12%14%
Dec-95 Dec-98 Dec-01 Dec-04 Dec-07 Dec-10 Dec-13 Dec-16
BNP Paribas Multi-Asset Diversified Vol 8 Future Index
30 December 2017 |
PERFORMANCE OF THE INDICES 4

31 December 2017 |
Source: Bloomberg, BNP Paribas, as of 29 December 2017. Performance simulations based on historical data from 31 December 1994 to 18 May 2016, historical performance thereafter. The Index level is reduced by an annualized rate of 0.50% (the “Adjustment Factor”) on a daily basis and additional replication costs applied upon occurrence of a portfolio reweighting. Past performance or simulated performance is not an indicator of future performance. No company of the BNP Paribas Group will be liable for any direct or indirect loss resulting from the use of the contents of this document. These simulations are the result of estimates made by BNP Paribas at a given moment on the basis of the parameters selected by BNP Paribas, of market conditions at this given moment and of historical data, which should not be used as guidance, in any way, of the future results of the BNP Paribas Multi-Asset Diversified Vol 8 Future Index. Consequently the figures and prices indicated in this document have an indicative value only and do not constitute in any way an offer on behalf of BNP Paribas. * Benchmark is composed of 50% Equities (MSCI World Index) + 50% Bonds US (TY1 Commodity from 3 January 1995 to 3 January 2007, BNPIFU10 Index since).
PERFORMANCE AND STATISTICS OF THE BNP PARIBAS MULTI-ASSET DIVERSIFIED VOL 8 FUTURE INDEX (SIMULATIONS UNTIL 18 MAY 2016)
PERFORMANCE ANALYSIS | SIMULATIONS (1/10)
BNP Paribas Multi-Asset Diversified Vol 8
Future Index
Static Diversified Basket 1 *
YTD Performance 7.64% 10.19%
1Y Performance 7.64% 10.19%
3Y Performance 14.07% 13.01%
Global Performance p.a. 11.44% 4.31%
Volatility p.a. 7.82% 7.66%
Sharpe ratio 1.46 0.56
Max Drawdown -10.31% -28.88%
0
200
400
600
800
1000
1200BNP Paribas Multi-Asset Diversified Vol 8 Future Index
Static Diversified Basket 1*
Index live since 19 May 2016

32 December 2017 |
1995 1996 1997 1998 1999 2000 2001 2002 2003 2004 2005 2006 2007 2008 2009 2010 2011 2012 2013 2014 2015 2016 2017
January 5.27% 1.05% 4.22% 4.38% 1.82% -0.43% 0.59% 0.49% 4.03% -0.17% 0.11% 2.76% -0.56% 2.49% -2.59% -0.99% -1.08% 3.33% -0.05% -0.87% 0.52% 1.64% -2.30%
February 1.90% -4.29% 0.47% 2.20% -5.00% 2.21% 1.34% 0.77% 2.44% 2.60% 0.19% -1.29% 0.03% 4.74% 0.47% 1.83% 1.61% 1.29% 2.78% 1.31% 1.74% 2.36% 3.79%
March 4.56% 2.49% -3.10% 3.10% 0.58% -0.93% 0.15% -2.13% -2.97% 0.82% 0.15% 1.73% -1.29% -0.62% -0.54% 2.30% -2.99% 2.55% 3.28% -0.48% 1.99% 0.20% -1.33%
April 1.92% 3.71% 1.26% 0.44% 2.30% -1.85% -2.33% 1.66% 1.60% -4.23% -1.30% 3.17% 1.26% -2.34% -1.51% 1.28% 2.88% 0.01% 7.29% 1.19% -0.44% -1.46% 0.48%
May 5.58% 0.35% 0.07% 2.06% -2.97% -0.72% -1.71% 2.46% 9.50% -1.79% 3.45% -2.32% 1.65% -1.41% -0.65% -1.29% 0.49% 1.39% -0.24% 4.16% 0.14% -0.39% 1.08%
June -0.22% 0.60% 3.10% 3.34% 5.88% 0.87% -1.09% -1.23% -1.29% 0.47% 2.03% -1.93% -0.27% 3.50% -0.89% 1.20% -2.79% -0.74% -2.65% 0.61% -2.63% 5.65% -1.78%
July 0.42% -7.47% 7.78% 1.31% 0.69% -1.77% 2.20% 0.38% -2.31% 0.03% 0.81% 0.47% -1.36% -3.73% 2.68% -0.84% 4.71% 2.38% 2.07% -0.70% 3.58% 1.87% 0.96%
August 0.20% 0.28% -1.21% 4.41% 0.93% 2.85% 1.03% 3.26% 2.17% -0.30% 2.83% 0.70% 1.31% -1.73% 0.41% 6.92% 3.49% 1.02% -2.84% 3.54% -4.26% -1.90% 1.68%
September 1.88% 5.99% 0.90% 4.81% -2.17% -1.36% 4.38% 3.68% 0.45% 3.27% 2.42% 0.91% 2.38% -0.60% 2.16% 0.08% 0.13% -0.69% 3.38% 0.27% 0.01% 0.08% -0.94%
October 0.35% 1.21% 0.88% -1.26% -1.17% 0.30% 3.00% -1.37% 1.80% 2.25% -4.04% 0.91% 3.11% 0.98% -0.52% 0.99% 0.74% -0.61% 3.91% 0.72% 0.52% -3.13% 4.86%
November 5.55% 8.78% 0.07% 0.86% 1.86% 5.49% -4.16% -1.50% 0.53% 2.27% 3.32% 2.15% 0.03% 3.69% 4.68% -2.51% 0.15% 1.53% 2.17% 3.27% 2.63% -1.45% 0.89%
December 4.25% -0.92% 2.32% 0.49% 5.41% 3.38% -1.92% 6.49% 6.35% 0.21% 3.30% 1.06% 0.07% 3.48% -2.63% -0.62% 1.21% 2.27% -2.36% 2.05% -2.59% 1.76% 0.25%
Yearly 36.33% 11.34% 17.63% 29.28% 7.86% 8.02% 1.14% 13.38% 23.94% 5.33% 13.79% 8.47% 6.40% 8.33% 0.83% 8.34% 8.57% 14.51% 17.50% 15.98% 0.91% 5.02% 7.64%
PERFORMANCE ANALYSIS | SIMULATIONS (2/10) MONTHLY PERFORMANCES OF THE BNP PARIBAS MULTI-ASSET DIVERSIFIED VOL 8 FUTURE INDEX
68% positive months Consistently positive annual returns regardless of market conditions Source: Bloomberg, BNP Paribas, as of 29 December 2017. Performance simulations based on historical data from 31 December 1994 to 18 May 2016. The Index level is reduced by an annualized rate of 0.50% (the “Adjustment Factor”) on a daily basis and additional replication costs applied upon occurrence of a portfolio reweighting. Past performance or simulated performance is not an indicator of future performance. No company of the BNP Paribas Group will be liable for any direct or indirect loss resulting from the use of the contents of this document. These simulations are the result of estimates made by BNP Paribas at a given moment on the basis of the parameters selected by BNP Paribas, of market conditions at this given moment and of historical data, which should not be used as guidance, in any way, of the future results of the BNP Paribas Multi-Asset Diversified Vol 8 Future Index. Consequently the figures and prices indicated in this document have an indicative value only and do not constitute in any way an offer on behalf of BNP Paribas.
Since October 2012: live date of the methodology.

33 December 2017 |
PERFORMANCE AND STATISTICS OF THE BNP PARIBAS MULTI-ASSET DIVERSIFIED VOL 4 FUTURE INDEX (SIMULATIONS UNTIL 19 JUNE 2016)
PERFORMANCE ANALYSIS | SIMULATIONS (3/10)
BNP Paribas Multi-Asset Diversified Vol 4
Future Index
Static Diversified Basket 2 *
YTD Performance 3.78% 6.42%
1Y Performance 3.78% 6.42%
3Y Performance 6.94% 8.82%
Global Performance p.a. 5.61% 3.62%
Volatility p.a. 3.91% 5.73%
Sharpe ratio 1.44 0.63
Max Drawdown -5.27% -16.08%
Source: Bloomberg, BNP Paribas, as of 29 December 2017. Performance simulations based on historical data from 31 December 1994 to 19 June 2016, historical performance thereafter. The Index level is reduced by an annualized rate of 0.30% (the “Adjustment Factor”) on a daily basis and additional replication costs applied upon occurrence of a portfolio reweighting. Past performance or simulated performance is not an indicator of future performance. No company of the BNP Paribas Group will be liable for any direct or indirect loss resulting from the use of the contents of this document. These simulations are the result of estimates made by BNP Paribas at a given moment on the basis of the parameters selected by BNP Paribas, of market conditions at this given moment and of historical data, which should not be used as guidance, in any way, of the future results of the BNP Paribas Multi-Asset Diversified Vol 4 Future Index. Consequently the figures and prices indicated in this document have an indicative value only and do not constitute in any way an offer on behalf of BNP Paribas. * Benchmark is composed of 30% Equities (MSCI World Index) + 70% Bonds US (TY1 Commodity from 3 January 1995 to 3 January 2007, BNPIFU10 Index since).
0
50
100
150
200
250
300
350
400BNP Paribas Multi-Asset Diversified Vol 4 Future Index
Static Diversified Basket 2*
Index live since 20 June 2016
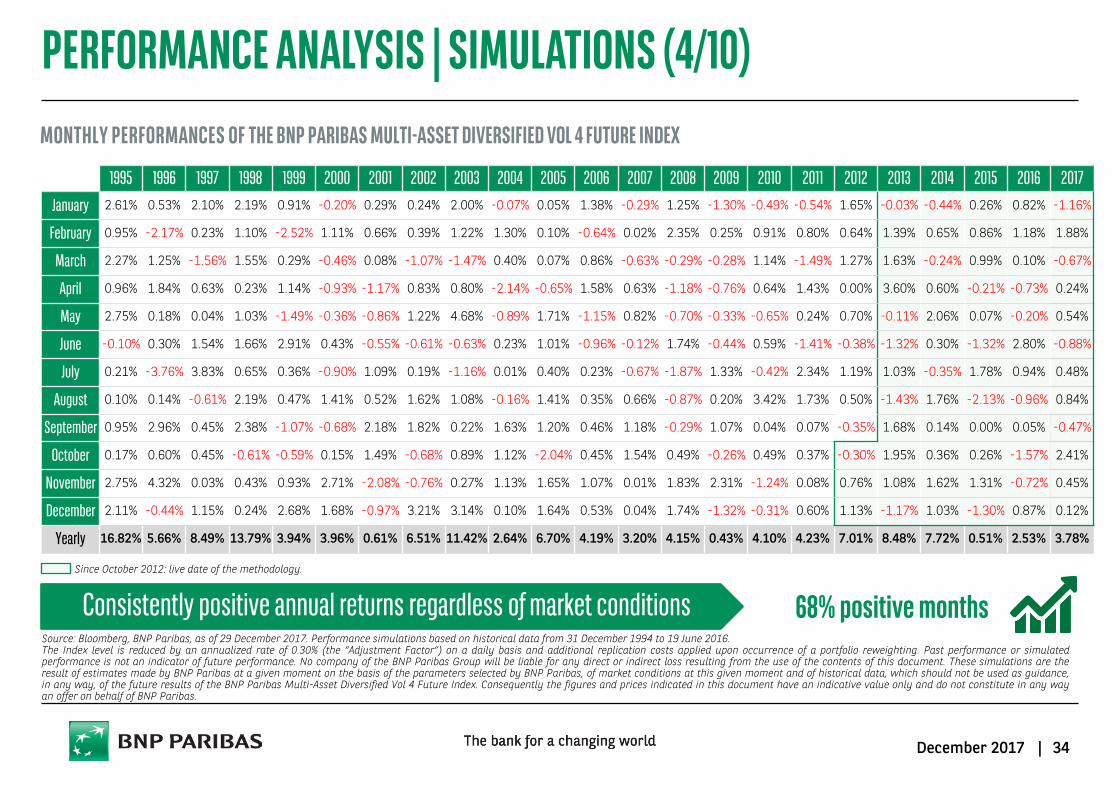
PERFORMANCE ANALYSIS | SIMULATIONS (4/10) MONTHLY PERFORMANCES OF THE BNP PARIBAS MULTI-ASSET DIVERSIFIED VOL 4 FUTURE INDEX
68% positive months Consistently positive annual returns regardless of market conditions Source: Bloomberg, BNP Paribas, as of 29 December 2017. Performance simulations based on historical data from 31 December 1994 to 19 June 2016. The Index level is reduced by an annualized rate of 0.30% (the “Adjustment Factor”) on a daily basis and additional replication costs applied upon occurrence of a portfolio reweighting. Past performance or simulated performance is not an indicator of future performance. No company of the BNP Paribas Group will be liable for any direct or indirect loss resulting from the use of the contents of this document. These simulations are the result of estimates made by BNP Paribas at a given moment on the basis of the parameters selected by BNP Paribas, of market conditions at this given moment and of historical data, which should not be used as guidance, in any way, of the future results of the BNP Paribas Multi-Asset Diversified Vol 4 Future Index. Consequently the figures and prices indicated in this document have an indicative value only and do not constitute in any way an offer on behalf of BNP Paribas.
34 December 2017 |
1995 1996 1997 1998 1999 2000 2001 2002 2003 2004 2005 2006 2007 2008 2009 2010 2011 2012 2013 2014 2015 2016 2017 January 2.61% 0.53% 2.10% 2.19% 0.91% -0.20% 0.29% 0.24% 2.00% -0.07% 0.05% 1.38% -0.29% 1.25% -1.30% -0.49% -0.54% 1.65% -0.03% -0.44% 0.26% 0.82% -1.16%
February 0.95% -2.17% 0.23% 1.10% -2.52% 1.11% 0.66% 0.39% 1.22% 1.30% 0.10% -0.64% 0.02% 2.35% 0.25% 0.91% 0.80% 0.64% 1.39% 0.65% 0.86% 1.18% 1.88%
March 2.27% 1.25% -1.56% 1.55% 0.29% -0.46% 0.08% -1.07% -1.47% 0.40% 0.07% 0.86% -0.63% -0.29% -0.28% 1.14% -1.49% 1.27% 1.63% -0.24% 0.99% 0.10% -0.67%
April 0.96% 1.84% 0.63% 0.23% 1.14% -0.93% -1.17% 0.83% 0.80% -2.14% -0.65% 1.58% 0.63% -1.18% -0.76% 0.64% 1.43% 0.00% 3.60% 0.60% -0.21% -0.73% 0.24%
May 2.75% 0.18% 0.04% 1.03% -1.49% -0.36% -0.86% 1.22% 4.68% -0.89% 1.71% -1.15% 0.82% -0.70% -0.33% -0.65% 0.24% 0.70% -0.11% 2.06% 0.07% -0.20% 0.54%
June -0.10% 0.30% 1.54% 1.66% 2.91% 0.43% -0.55% -0.61% -0.63% 0.23% 1.01% -0.96% -0.12% 1.74% -0.44% 0.59% -1.41% -0.38% -1.32% 0.30% -1.32% 2.80% -0.88%
July 0.21% -3.76% 3.83% 0.65% 0.36% -0.90% 1.09% 0.19% -1.16% 0.01% 0.40% 0.23% -0.67% -1.87% 1.33% -0.42% 2.34% 1.19% 1.03% -0.35% 1.78% 0.94% 0.48%
August 0.10% 0.14% -0.61% 2.19% 0.47% 1.41% 0.52% 1.62% 1.08% -0.16% 1.41% 0.35% 0.66% -0.87% 0.20% 3.42% 1.73% 0.50% -1.43% 1.76% -2.13% -0.96% 0.84%
September 0.95% 2.96% 0.45% 2.38% -1.07% -0.68% 2.18% 1.82% 0.22% 1.63% 1.20% 0.46% 1.18% -0.29% 1.07% 0.04% 0.07% -0.35% 1.68% 0.14% 0.00% 0.05% -0.47%
October 0.17% 0.60% 0.45% -0.61% -0.59% 0.15% 1.49% -0.68% 0.89% 1.12% -2.04% 0.45% 1.54% 0.49% -0.26% 0.49% 0.37% -0.30% 1.95% 0.36% 0.26% -1.57% 2.41%
November 2.75% 4.32% 0.03% 0.43% 0.93% 2.71% -2.08% -0.76% 0.27% 1.13% 1.65% 1.07% 0.01% 1.83% 2.31% -1.24% 0.08% 0.76% 1.08% 1.62% 1.31% -0.72% 0.45%
December 2.11% -0.44% 1.15% 0.24% 2.68% 1.68% -0.97% 3.21% 3.14% 0.10% 1.64% 0.53% 0.04% 1.74% -1.32% -0.31% 0.60% 1.13% -1.17% 1.03% -1.30% 0.87% 0.12%
Yearly 16.82% 5.66% 8.49% 13.79% 3.94% 3.96% 0.61% 6.51% 11.42% 2.64% 6.70% 4.19% 3.20% 4.15% 0.43% 4.10% 4.23% 7.01% 8.48% 7.72% 0.51% 2.53% 3.78%
Since October 2012: live date of the methodology.

35 December 2017 |
PERFORMANCE AND STATISTICS OF THE BNP PARIBAS MULTI-ASSET DIVERSIFIED VOL 2 FUTURE INDEX (SIMULATIONS UNTIL 19 JUNE 2016)
PERFORMANCE ANALYSIS | SIMULATIONS (5/10)
BNP Paribas Multi-Asset Diversified Vol 2 Future Index
YTD Performance 1.69%
1Y Performance 1.69%
3Y Performance 3.33%
Global Performance p.a. 2.73%
Volatility p.a. 1.96%
Sharpe ratio 1.40
Max Drawdown -2.68%
Source: Bloomberg, BNP Paribas, as of 29 December 2017. Performance simulations based on historical data from 31 December 1994 to 19 June 2016, historical performance thereafter. The Index level is reduced by an annualized rate of 0.20% (the “Adjustment Factor”) on a daily basis and additional replication costs applied upon occurrence of a portfolio reweighting. Past performance or simulated performance is not an indicator of future performance. No company of the BNP Paribas Group will be liable for any direct or indirect loss resulting from the use of the contents of this document. These simulations are the result of estimates made by BNP Paribas at a given moment on the basis of the parameters selected by BNP Paribas, of market conditions at this given moment and of historical data, which should not be used as guidance, in any way, of the future results of the BNP Paribas Multi-Asset Diversified Vol 2 Future Index. Consequently the figures and prices indicated in this document have an indicative value only and do not constitute in any way an offer on behalf of BNP Paribas.
70
90
110
130
150
170
190BNP Paribas Multi-Asset Diversified Vol 2 Future Index
Cash Capitalised
Index live since 20 June 2016
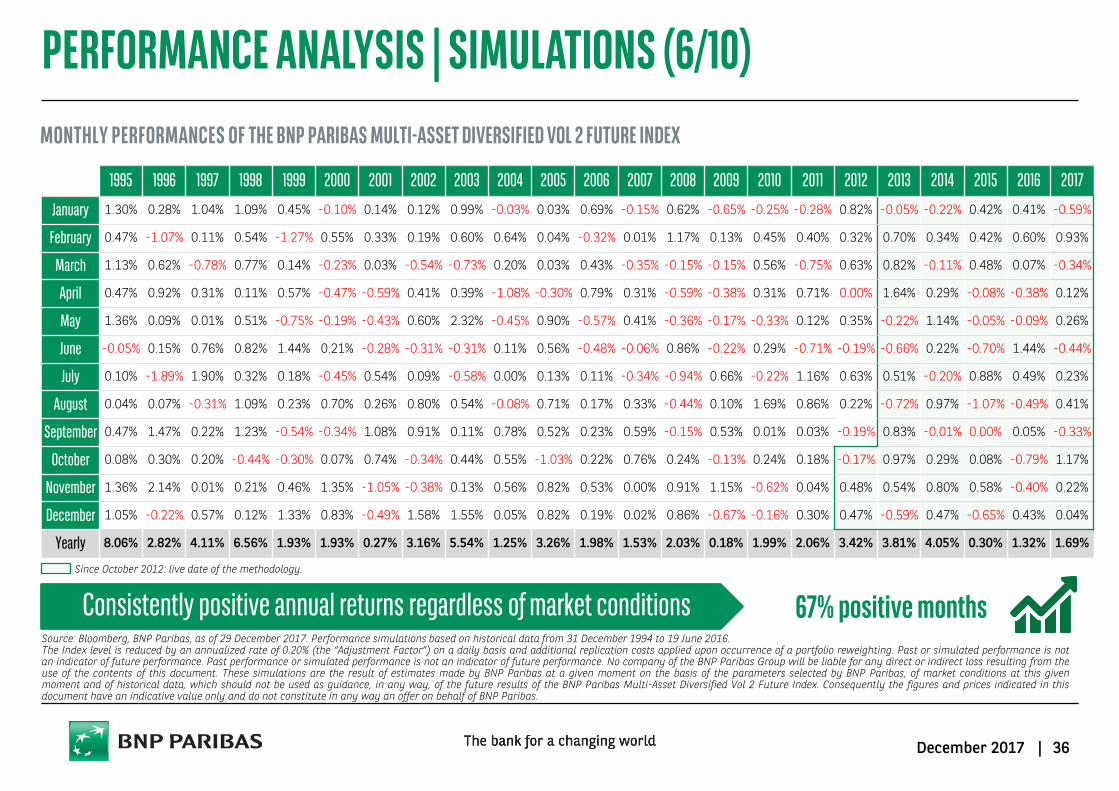
PERFORMANCE ANALYSIS | SIMULATIONS (6/10) MONTHLY PERFORMANCES OF THE BNP PARIBAS MULTI-ASSET DIVERSIFIED VOL 2 FUTURE INDEX
67% positive months Consistently positive annual returns regardless of market conditions Source: Bloomberg, BNP Paribas, as of 29 December 2017. Performance simulations based on historical data from 31 December 1994 to 19 June 2016. The Index level is reduced by an annualized rate of 0.20% (the “Adjustment Factor”) on a daily basis and additional replication costs applied upon occurrence of a portfolio reweighting. Past or simulated performance is not an indicator of future performance. Past performance or simulated performance is not an indicator of future performance. No company of the BNP Paribas Group will be liable for any direct or indirect loss resulting from the use of the contents of this document. These simulations are the result of estimates made by BNP Paribas at a given moment on the basis of the parameters selected by BNP Paribas, of market conditions at this given moment and of historical data, which should not be used as guidance, in any way, of the future results of the BNP Paribas Multi-Asset Diversified Vol 2 Future Index. Consequently the figures and prices indicated in this document have an indicative value only and do not constitute in any way an offer on behalf of BNP Paribas.
36 December 2017 |
1995 1996 1997 1998 1999 2000 2001 2002 2003 2004 2005 2006 2007 2008 2009 2010 2011 2012 2013 2014 2015 2016 2017
January 1.30% 0.28% 1.04% 1.09% 0.45% -0.10% 0.14% 0.12% 0.99% -0.03% 0.03% 0.69% -0.15% 0.62% -0.65% -0.25% -0.28% 0.82% -0.05% -0.22% 0.42% 0.41% -0.59%
February 0.47% -1.07% 0.11% 0.54% -1.27% 0.55% 0.33% 0.19% 0.60% 0.64% 0.04% -0.32% 0.01% 1.17% 0.13% 0.45% 0.40% 0.32% 0.70% 0.34% 0.42% 0.60% 0.93%
March 1.13% 0.62% -0.78% 0.77% 0.14% -0.23% 0.03% -0.54% -0.73% 0.20% 0.03% 0.43% -0.35% -0.15% -0.15% 0.56% -0.75% 0.63% 0.82% -0.11% 0.48% 0.07% -0.34%
April 0.47% 0.92% 0.31% 0.11% 0.57% -0.47% -0.59% 0.41% 0.39% -1.08% -0.30% 0.79% 0.31% -0.59% -0.38% 0.31% 0.71% 0.00% 1.64% 0.29% -0.08% -0.38% 0.12%
May 1.36% 0.09% 0.01% 0.51% -0.75% -0.19% -0.43% 0.60% 2.32% -0.45% 0.90% -0.57% 0.41% -0.36% -0.17% -0.33% 0.12% 0.35% -0.22% 1.14% -0.05% -0.09% 0.26%
June -0.05% 0.15% 0.76% 0.82% 1.44% 0.21% -0.28% -0.31% -0.31% 0.11% 0.56% -0.48% -0.06% 0.86% -0.22% 0.29% -0.71% -0.19% -0.66% 0.22% -0.70% 1.44% -0.44%
July 0.10% -1.89% 1.90% 0.32% 0.18% -0.45% 0.54% 0.09% -0.58% 0.00% 0.13% 0.11% -0.34% -0.94% 0.66% -0.22% 1.16% 0.63% 0.51% -0.20% 0.88% 0.49% 0.23%
August 0.04% 0.07% -0.31% 1.09% 0.23% 0.70% 0.26% 0.80% 0.54% -0.08% 0.71% 0.17% 0.33% -0.44% 0.10% 1.69% 0.86% 0.22% -0.72% 0.97% -1.07% -0.49% 0.41%
September 0.47% 1.47% 0.22% 1.23% -0.54% -0.34% 1.08% 0.91% 0.11% 0.78% 0.52% 0.23% 0.59% -0.15% 0.53% 0.01% 0.03% -0.19% 0.83% -0.01% 0.00% 0.05% -0.33%
October 0.08% 0.30% 0.20% -0.44% -0.30% 0.07% 0.74% -0.34% 0.44% 0.55% -1.03% 0.22% 0.76% 0.24% -0.13% 0.24% 0.18% -0.17% 0.97% 0.29% 0.08% -0.79% 1.17%
November 1.36% 2.14% 0.01% 0.21% 0.46% 1.35% -1.05% -0.38% 0.13% 0.56% 0.82% 0.53% 0.00% 0.91% 1.15% -0.62% 0.04% 0.48% 0.54% 0.80% 0.58% -0.40% 0.22%
December 1.05% -0.22% 0.57% 0.12% 1.33% 0.83% -0.49% 1.58% 1.55% 0.05% 0.82% 0.19% 0.02% 0.86% -0.67% -0.16% 0.30% 0.47% -0.59% 0.47% -0.65% 0.43% 0.04%
Yearly 8.06% 2.82% 4.11% 6.56% 1.93% 1.93% 0.27% 3.16% 5.54% 1.25% 3.26% 1.98% 1.53% 2.03% 0.18% 1.99% 2.06% 3.42% 3.81% 4.05% 0.30% 1.32% 1.69%
Since October 2012: live date of the methodology.

37 December 2017 |
Equity Europe Equity US Equity Japan Equity China Equity
Emerging German Gov.
Bonds US Gov. Bonds
Japan Gov. Bonds Gold Commodities Net Exposure
End of Dec. 2017 2.77% 32.64% 19.95% 9.47% 0.26% 99.61% -35.46% 24.87% 10.31% 17.35% 181.78%
Source: Bloomberg, BNP Paribas, as of 29 December 2017. Simulations of end-of-month allocation. Exposure figures that are shown include the daily volatility control and are rounded to the second decimal place.
PERFORMANCE ANALYSIS | SIMULATIONS (7/10) ALLOCATION IN THE DIFFERENT ASSET CLASSES IN THE LAST 12 MONTHS
BNP Paribas Multi-Asset Diversified Vol 8 Future Index
-100%-50%
0%50%
100%150%200%250%300%350%
Equity EuropeEquity USEquity JapanEquity ChinaEquity EmergingGerman Gov. BondsUS Gov. BondsJapan Gov. BondsGoldCommodities

38 December 2017 |
Equity Europe Equity US Equity Japan Equity China Equity
Emerging German Gov.
Bonds US Gov. Bonds
Japan Gov. Bonds Gold Commodities Net Exposure
End of Dec. 2017 1.39% 16.35% 9.99% 4.74% 0.13% 49.90% -17.76% 12.46% 5.17% 8.69% 91.06%
Source: Bloomberg, BNP Paribas, as of 29 December 2017. Simulations of end-of-month allocation. Exposure figures that are shown include the daily volatility control and are rounded to the second decimal place.
PERFORMANCE ANALYSIS | SIMULATIONS (8/10) ALLOCATION IN THE DIFFERENT ASSET CLASSES IN THE LAST 12 MONTHS
BNP Paribas Multi-Asset Diversified Vol 4 Future Index
-100%
-50%
0%
50%
100%
150%
200%
250%
Equity Europe
Equity US
Equity Japan
Equity China
EquityEmerging
39 December 2017 |
Equity Europe Equity US Equity Japan Equity China Equity
Emerging German Gov.
Bonds US Gov. Bonds
Japan Gov. Bonds Gold Commodities Net Exposure
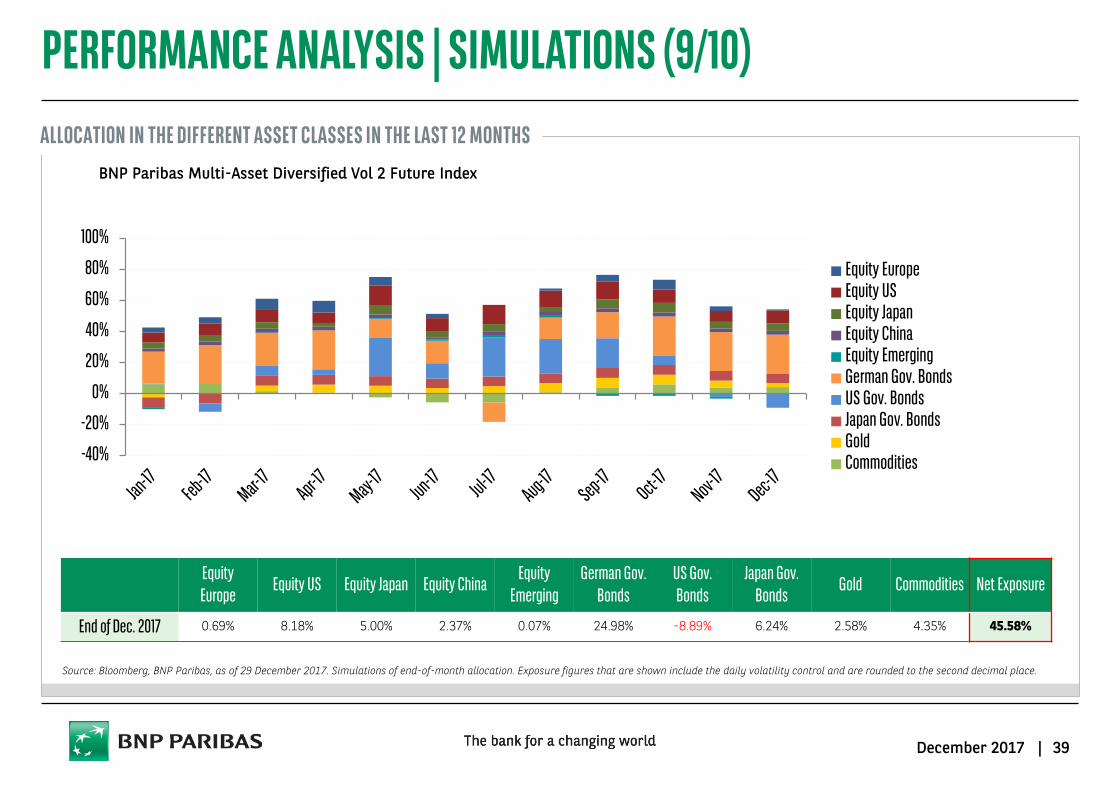
End of Dec. 2017 0.69% 8.18% 5.00% 2.37% 0.07% 24.98% -8.89% 6.24% 2.58% 4.35% 45.58%
Source: Bloomberg, BNP Paribas, as of 29 December 2017. Simulations of end-of-month allocation. Exposure figures that are shown include the daily volatility control and are rounded to the second decimal place.
PERFORMANCE ANALYSIS | SIMULATIONS (9/10) ALLOCATION IN THE DIFFERENT ASSET CLASSES IN THE LAST 12 MONTHS
BNP Paribas Multi-Asset Diversified Vol 2 Future Index
-40%
-20%
0%
20%
40%
60%
80%
100%
Equity EuropeEquity USEquity JapanEquity ChinaEquity EmergingGerman Gov. BondsUS Gov. BondsJapan Gov. BondsGoldCommodities

40 December 2017 |
Strong diversification allows the BNP Paribas Multi-Asset Diversified Vol 8 Future Index (“MA Diversified”) to: Achieve a higher risk to return ratio than traditional assets
Minimise losses compared to traditional assets
A low correlation with other assets: 0.43 max
A lower maximum loss historically
A much higher risk/return ratio: 1.46
In EUR MA Diversified Equity Europe Equity US Equity EM German Gov. Bonds US Gov. Bonds Commodities Gold
Returns 11.44% 5.28% 6.93% 2.35% 4.79% 3.98% 1.07% 2.78%
Volatility 7.82% 22.83% 18.42% 26.04% 5.38% 6.03% 18.73% 16.86%
Sharpe Ratio 1.46 0.23 0.38 0.09 0.89 0.66 0.06 0.16
In EUR Equity Europe Equity US Equity EM German Gov. Bonds US Gov. Bonds Commodities Gold
Correlation 0.10 0.12 0.12 0.43 0.42 0.19 0.23
In EUR MA Diversified Equity Europe Equity US Equity EM German Gov. Bonds US Gov. Bonds Commodities Gold
Max drawdown -10.31% -68.39% -62.36% -67.39% -11.01% -13.98% -77.40% -50.43%
PERFORMANCE ANALYSIS | SIMULATIONS (10/10) HIGHER AND MORE STABLE SIMULATED PERFORMANCE THAN TRADITIONAL ASSETS
Source: Bloomberg, BNP Paribas, as of 29 December 2017. Performance simulations based on historical data from December 1994 to May 2016. The Index level is reduced by an annualized rate of 0.50% (the “Adjustment Factor”) on a daily basis and additional replication costs applied upon occurrence of a portfolio reweighting. Past performance or simulated performance is not an indicator of future performance. No company of the BNP Paribas Group will be liable for any direct or indirect loss resulting from the use of the contents of this document. These simulations are the result of estimates made by BNP Paribas at a given moment on the basis of the parameters selected by BNP Paribas, of market conditions at this given moment and of historical data, which should not be used as guidance, in any way, of the future results of the BNP Paribas Multi-Asset Diversified Vol 8 Future Index. Consequently the figures and prices indicated in this document have an indicative value only and do not constitute in any way an offer on behalf of BNP Paribas.

41 December 2017 |
APPENDIX 7

42 December 2017 |
DETAILS OF THE BNP PARIBAS MULTI-ASSET DIVERSIFIED FUTURE INDEX
Asset classes Underlying index Bloomberg Code Rolled Futures on the: Equity Europe BNP Paribas Eurozone Equity Futures Index BNPIFEU Index EURO STOXX 50
Equity US BNP Paribas US Equity Futures Index BNPIFUS Index S&P 500
Equity Japan BNP Paribas Japan Equity Futures Index BNPIFJP Index Nikkei 225
Equity China BNP Paribas China Equity Futures Index BNPIFCN Index HSCEI
Equity Emerging Markets BNP Paribas Emerging Equities Futures Index BNPIFEM Index MSCI Emerging Markets
Gov. Bonds Germany BNP Paribas EUR 10Y Futures Index BNPIFE10 Index Euro Bund
Gov. Bonds US BNPP Paribas USD 10Y Futures Index BNPIFU10 Index US 10Y T-Bill
Gov. Bonds Japan BNP Paribas JPY 10Y Futures Index BNPIFJ10 Index Japanese 10Y Bond
Commodities Bloomberg Commodity ex- Agriculture & Livestock Index BBUXALC Index -
Gold S&P GSCI Gold Index ER SPGSGCP Index -
Name Currency Type of index Bloomberg code Reuters code BNP Paribas Multi-Asset Diversified vol 8 Future Index EUR Excess Return BNPIMD8F Index .BNPIMD8F
BNP Paribas Multi-Asset Diversified vol 4 Future Index EUR Excess Return BNPIMD4F Index .BNPIMD4F
BNP Paribas Multi-Asset Diversified vol 2 Future Index EUR Excess Return BNPIMD2F Index .BNPIMD2F
INDEX DETAILS
INDEX COMPONENTS
Source: BNP Paribas, December 2017.

43 December 2017 |
BNP PARIBAS CIB VALUE PROPOSITION
The Quantitative Investment Strategies team is in charge of developing, launching, and ensuring daily production and follow-up of all systematic investment strategies of GM
These strategies are then made available to clients through a variety of formats, including certificates, OTC and when relevant THEAM* funds
QUANTITATIVE INVESTMENT STRATEGIES TEAM
An efficient set-up 3
Index calculation expertise (SOC1 approved, IOSCO compliant)
Powerful trading platform with global execution specialists
High customization capabilities
Efficient after-sales support
Access all markets and asset classes through 2000+ fully diversified systematic strategies
Over 15 Blns AUMs currently managed
A diversified offer 1 Investment experts 2
Quantitative Research : team of 15 Investment professionals (PhDs, former traders, strategists…) developing systematic strategies
Derivatives Experts : BNPP is one of the leader in derivatives for the last 25 years
* THEAM is BNP Paribas Investment Partner’s specialist in Capital Protection, Indexing and Model-driven management.

44 December 2017 |
BNPP’S APPROACH IN SYSTEMATIC STRATEGY INVESTING
Processes have been set-up in order to provide the best quality at all levels of the production chain
As part of our SOC 1 certification, independent auditors control and assess quality of our processes on a regular basis
QUANTITATIVE INVESTMENTS STRATEGIES TEAM
1. Robustness : avoiding Overfitting Each Strategy go through a validation process involving functions and independent
approval to ensure quality of the strategy before going live All strategies inputs are going through robustness tests by a independent research team Robustness Reports are available on demand
2. Execution & Timing Risk Limited resort to marketing timing signals: most of the strategies will privilege systematic
execution with adequate infrastructure Daily Execution and high quality execution platform allows to remove the material impact
of timing and randomness factor
3. Live Track Record & Performance Commitment
Some Strategies are used into ETFs or Indexed Funds with long track records Market recognition and awards are available (5* morning stars, HF journal Awards …)
4. Transaction Costs Explicit and Transparent costs with execution commitment at this level
5. High Standards Reporting Performance Attribution Detailed Risk Reportings with external partnerships available on request

45 December 2017 |
BNP PARIBAS | VALUE PROPOSITION
Global Markets competitive edge Global Markets is BNP Paribas’ capital markets business, delivering solutions across asset classes, and industry-leading services for clients. With solid roots in Europe and a strong global presence, Global Markets is a leader in derivatives, bringing efficient trading and execution, market-leading research and strategy, tailor-made products and a sustainable long-term business model.
Full access across asset classes Unified Global Markets teams allow clients to access a full suite of asset classes via a fully integrated platform
G10 Rates Equity Derivatives
Commodity Derivatives
Prime Solutions & Financing
Forex & Local Markets Credit Primary
Markets
G L O B A L M A R K E T S
A Market Leader Global Markets consistently ranks highly in industry rankings and awards worldwide. With leading market share on global exchanges and global recognition in surveys and rankings, you can be confident you’re receiving a top tier service from a top tier provider.
WHAT MAKES BNP PARIBAS DIFFERENT

46 December 2017 |
DISCLAIMER This document is CONFIDENTIAL AND FOR DISCUSSION PURPOSES ONLY; it constitutes a marketing communication and has been prepared by a Sales and Marketing function within BNP Paribas for, and is directed at, (a) Professional Clients and Eligible Counterparties as defined by the European Union Markets in Financial Instruments Directive (2004/39/EC) (“MiFID”), and (b) where relevant, persons who have professional experience in matters relating to investments falling within Article 19(1) of the Financial Services and Markets Act 2000 (Financial Promotion) Order 2005, and at other persons to whom it may lawfully be communicated (together “Relevant Persons”). Any investment or investment activity to which this document relates is available only to and will be engaged in only with Relevant Persons. This document is not intended for Retail Clients as defined by MiFID and should not be passed on to any such persons. Any person who is not a Relevant Person should not act or rely on this document or its content. As a confidential document it is submitted to selected recipients only and may not be reproduced (in whole or in part) to any other person without written consent. This document does not constitute an offer or a solicitation to engage in any trading strategy, to purchase or sell any financial instruments or to enter into any transaction. Given its general nature, the information included in this document does not purport to contain all the elements that may be relevant for a recipient to make an informed decision in relation to any strategy, financial product or transaction discussed herein. To the extent that any transaction is subsequently entered into between the recipient and BNP Paribas, such transaction will be entered into upon such terms as may be agreed by the parties in the relevant documentation. The information contained in this document has been obtained from sources believed to be reliable, but BNP Paribas makes no representation, express or implied, that such information, or any opinions based thereon and contained in this document, are accurate or complete and they should not be relied on as such. Other financial institutions or persons may have different opinions or draw different conclusions from the facts or ideas relevant to this document. Any scenarios, assumptions, historical or simulated performances, indicative prices or examples of potential transactions or returns are included for illustrative purposes only. Past performance is not necessarily indicative of future results. BNP Paribas gives no assurance that any favourable scenarios described are likely to happen, that it is possible to trade on the terms described herein or that any potential returns illustrated can be achieved. BNP Paribas is further under no obligation to update or keep current the information contained in this document. In providing this document, BNP Paribas offers no investment, financial, legal, tax or any other type of advice to, nor has any fiduciary duties towards, recipients. Certain strategies and/or potential transactions discussed in this document may involve the use of derivatives which may be complex in nature and may give rise to substantial risks, including the risk of total or partial loss of any investment or losses without limitation and which should only be undertaken by those with the requisite knowledge and experience. BNP Paribas makes no representation nor gives any warranty as to the results to be obtained from any investment, strategy or transaction, nor as to whether any strategy, security or transaction discussed herein may be suitable for recipients’ financial needs, circumstances or requirements. Recipients must make their own assessment of such strategies, securities and/or potential transactions detailed herein, using such professional advisors as they may require. BNP Paribas accepts no liability for any direct or consequential losses arising from any action taken in connection with or reliance on the information contained in this document even where advised of the possibility of such losses. As an investment bank with a wide range of activities BNP Paribas may face conflicts of interest, which are resolved under legal provisions and internal guidelines. You should be aware, however, that BNP Paribas may be long or short, for its own account or as agent, in investments, transactions or strategies referred to in this document or related products before the material is published to clients and that it may engage in transactions in a manner inconsistent with the views expressed in this document, either for its own account or for the account of its clients. Additionally, BNP Paribas within the previous twelve months may have acted as an investment banker or may have provided significant advice or investment services to companies or in relation to investments mentioned in this document. Laws and regulations of countries may restrict the distribution of this document. Persons in possession of this document should inform themselves about possible legal restrictions and observe them accordingly. BNP Paribas London Branch, 10 Harewood Avenue, London NW1 6AA; tel: +44 (0)20 7595 2000; fax: +44 (0)20 7595 2555 (www.bnpparibas.com). Incorporated in France with Limited Liability. Registered Office: 16 boulevard des Italiens,75009 Paris, France. 662 042 449 RCS Paris. BNP Paribas London Branch is lead supervised by the European Central Bank (ECB) and the Autorité de Contrôle Prudentiel et de Résolution (ACPR). BNP Paribas London Branch is authorised by the ECB, the ACPR and the Prudential Regulation Authority and subject to limited regulation by the Financial Conduct Authority and Prudential Regulation Authority. Details about the extent of our authorisation and regulation by the Prudential Regulation Authority, and regulation by the Financial Conduct Authority are available from us on request. BNP Paribas London Branch is registered in England and Wales under no. FC13447. The content in this document/communication may contain “Research” as defined under MiFID II unbundling rules. If the document/communication contains Research, it is intended for those firms who are either in scope of the MiFID II unbundling rules and have signed up to one of the BNP Paribas Global Markets Research packages, or firms that are out of scope of the MiFID II unbundling rules and therefore not required to pay for Research under MiFID II. Please note that it is your firm’s responsibility to ensure that you do not view or use the Research content in this document if your firm has not signed up to one of the BNP Paribas Global Markets Research packages, except where your firm is out of scope of the MiFID II unbundling rules.