board and executive compensation practices of public ......board and executive compensation...
TRANSCRIPT

Board and Executive Compensation Practices of Public Russian Companies Survey by Deloitte CIS Centre for Corporate Governance2017

Executive summary 03
Methods and Sample Characteristics 04
Compensation disclosure practices 06
Board compensation practices 08
Executive compensation practices 12
Contacts 14

Executive summary
Our survey of board and executive compensation practices is based on public disclosures of 82 public Russian companies listed on the Moscow Exchange.
Transparency of compensation practices remains a significant issue, and relevant recommendations of the Corporate Governance Code (“Code”) appear to have a limited effect on listed companies. Only three companies in our sample disclosed the CEO compensation, as the Code recommends, and none disclosed the individual compensation of senior executives. Moreover, about a quarter of companies did not even disclose the aggregate executive pay. While the aggregate board (i.e. non-executive) compensation is usually disclosed, only 26% of companies disclosed the individual compensation of board members. On the positive side, 59% of companies disclosed their board compensation policies, and these documents are usually useful in understanding the compensation principles of listed companies.
One of the unexpected findings in our survey is that 10 companies (12% of the sample) did not remunerate their boards at all. Surprisingly, most of them were not remunerating their directors as a matter of policy rather than in response to poor performance. We would query the ability of these companies to attract and retain independent board members with required expertise. The median 2016 compensation of non-executives directors in our sample was RUB 3.8 million. In the case of the Large Cap companies, director compensation was predictably higher, with a median value of RUB 7.7 million. This is close to figures observed in the UK.
The median size of the fixed annual retainer in our sample was RUB 2.5 million, and most companies provided extra pay associated with specific roles on the board. The median compensation of Board Chairmen was RUB 6.1 million (RUB 20 million among the Large Cap companies). The compensation of the Audit and Remuneration Committee Chairmen was RUB 4.3 million and 4.6 million (RUB 8.2 million and 7.2 million in the Large Cap category), respectively.
Almost a quarter of boards in our sample are entitled to meeting attendance fees, a policy discouraged by the Code. It is perhaps more worrying that 9% of boards reported receiving short-term bonuses. This practice is not in compliance with the Code and in our opinion represents a far more serious departure from sound compensation principles.
With executive compensation practices considerably less transparent than director pay, our analysis was constrained to aggregate figures. The median aggregate Management Board compensation in our sample was about RUB 250.9 million, and such medians in the Small Cap and the Large Cap categories were RUB 157.8 million and RUB 609.0 million respectively. The maximum reported amount of aggregate executive pay was RUB 4.3 billion.
On average, the fixed elements of executive pay were approximately equal in size to variable elements. In the Large Cap category, however, variable pay accounted for about two thirds of executive pay, whereas in the Small Cap category, fixed pay accounted for about 60%.
Seventeen percent of companies in our sample reported that they had performance share plans for their executives, according to their Annual Reports and the footnotes to IFRS statements. This is a smaller proportion than we had expected and an uncommonly low figure by international standards.
Overall, we are concerned with the wide spread of poor director compensation practices at listed companies in Russia. At one extreme, they come in the shape of short-term rewards, and at the other — in not compensating directors at all. Our survey is less insightful in terms of executive compensation due to the general opacity of this area. We believe this is all the more reason for boards and shareholders to pay close attention to executive pay practices. Clearly, there is a lot that boards and shareholders of Russian companies could do to raise the standards of compensation practices for boards and executive teams, and to ensure transparency of these practices to stakeholders.

Board and Executive Compensation Practices of Public Russian Companies, 2017
04
Our survey covers 82 Russian companies that have common stock listed on either tier 1 or tier 2 of the Moscow Exchange.
Our analysis was based on publicly available information presented in company documents (Annual and Quarterly reports, IFRS reports, Compensation policies, Shareholder meeting minutes) and on corporate websites.
We accounted only for the information published before 1 October 2017. In addition, we used the market valuation data from Bloomberg to group companies into capitalization bands.
We grouped companies into three bands based on their market capitalization.
The thresholds are as follows:
• Large cap: > USD 3.5 billion
• Mid cap: Between USD 500 million and USD 3.5 billion
• Small cap: < USD 500 million
The groups are fairly similar in size. Twenty seven companies in our survey fell into the Large Cap category, 29 were categorized as Mid Cap, and 26 companies as Small Cap, as displayed in Chart 1.
Chart 1: Company breakdown by market capitalization
Large Cap
Mid Cap
Small Cap35%
Industry breakdownTable 1 presents the industry breakdown of our sample. Energy & Resources is the largest category, accounting for 42% of companies in the sample, followed by Manufacturing with 23% and the Financial Services and Insurance with 13%.
With a more granular breakdown into sub-industries, Power companies is the largest category accounting for 27% of companies, followed by Metals with 11%. Oil & Gas and Banking both account for 9% of the company count.
Methods and Sample Characteristics
33%
35%
32%

Board and Executive Compensation Practices of Public Russian Companies, 2017
05
The industry breakdown of companies included in our sample is displayed on the Chart 2.
Chart 2: Industry breakdown (by number and market cap)
Energy & Resources
Financial Services & Insurance
Manufactoring
Consumer Business & Transportation
Other
42%
13%23%
11%11%
Predictably, Energy & Resources account for the bulk of the aggregate market capitalization (57%), driven mainly by the Oil & Gas subcategory which alone accounts for 47% of the aggregate market cap. The Banking sector accounts for 16% of the market cap, and Metals for 12%. Despite the considerable number of Power companies (i.e. electric utilities) in the sample (22 organizations), the share of their market capitalization is a modest 6%.
Table 1: Industry breakdown
Industry Sub-industry # of companies
% of companies
% of market capitalization
Energy & Resources
Mining 5 6% 4%
O&G 7 9% 47%
Power 22 27% 6%
Total 34 42% 57%
Financial Services & Insurance
Banking 7 9% 16%
Insurance 1 1% 0.6%
Investment Management 1 1% 0.2%
Other 2 2% 1%
Total 11 13% 18%
Manufacturing Automotive 4 5% 1%
Industrial products 4 5% 0.2%
Metals 9 11% 12%
Chemicals 2 2% 2%
Total 19 23% 15%
Consumer Business & Transportation
Aviation & Transportation services
3 4% 1%
Hotel Business 1 1% 0.03%
Retail 5 6% 4%
Total 9 11% 5%
Other Pharmaceuticals 1 1% 0.08%
Real Estate (Construction Companies & Developers)
4 5% 1.06%
Telecommunications 3 4% 3.4%
Diversified Holdings 1 1% 0.7%
Total 9 11% 5%
Grand Total 82
57%
18%
15%
5% 5%

Board and Executive Compensation Practices of Public Russian Companies, 2017
06
RegulationDisclosure standards on corporate governance practices are rising globally and are tightly regulated in the advanced jurisdictions. The Russian regulatory regime has been less demanding historically, and several important gaps remain as demonstrated by our findings. However, the Central Bank of Russia, which regulates the securities markets in the country, seeks to address this issue. Additional disclosure guidance was introduced in the new Code in 2014 and in the Central Bank’s Information Letter on the Code Compliance Reporting on 17.02.2016.
Mandatory disclosure standards, including those in the area of compensation, are detailed in the Bank of Russia’s Decree №454-П “On disclosure of information by issuers of securities” (“Decree”) dated 30 December 2014. It mandates aggregate disclosure of compensation and reimbursements to each of the governing bodies (bar the CEO), as well a breakdown of these aggregate figures by components. Amendments to the Decree intended to strengthen mandatory compensation disclosure standards were discussed at several fora throughout 2017, but they have not yet been adopted at the time of this writing.
Under the Code, which operates under a ‘comply or explain’ regime, the board should ensure effective and transparent compensation system for board members, management board and other key executives (“key management personnel”). The board should also oversee the compensation disclosures in the Annual Report and on the company’s web site.
Board Compensation disclosureMost companies in our sample (98%) disclosed the aggregate board compensation in their Annual Reports. This figure includes 10 companies (or 12%) that reported zero board compensation in the reporting period. Two companies explained this by poor financial performance in the reporting year. Seven companies, however, reported that they were not remunerating their directors
for board service as a matter of policy. While this is not a disclosure issue, we would query the ability of these companies to attract and retain independent board members with required expertise. Finally, one company reported that it was remunerating its independent directors under an employment contract. The latter practice represents a clear departure from director independence criteria of the Code and the Listing Rules.
Compensation disclosure practices
Table 2: Disclosure of Remuneration Reports and Board Compensation Policies
Remuneration Report
Board Compensation Policy
All (82) 98% 59%
Large Cap (27) 99% 70%
Mid Cap (29) 100% 45%
Small Cap (26) 99% 62%
Source: Annual Reports, Company web sites
Under the Code, public companies should describe the compensation policies that apply to board members and the key management personnel in their annual reports. Disclosures should include a description of components of compensation as well as the practice of long-term incentive plans, if any. The Code also recommends the disclosure of the individual compensation of the CEO (but not of the other senior executives) and the individual compensation payable to each board member. Aggregate compensation of key management personnel should also be disclosed according to the Code as well as the KPIs that apply to this group.
Remuneration Reports and Board Compensation PoliciesAs mandated by the Decree, all the companies in our sample published their Annual and Quarterly reports. Almost all (98%) included a Remuneration Report as a section in their Annual reports. As detailed below, however, in most cases these Remuneration Reports were not very informative in the international comparison.
At the same time, 59% of the companies in our sample disclosed a board compensation policy on their web sites, which typically included a description of the principles and structure of compensation, as well as a pay breakdown by components (Table 2).

Board and Executive Compensation Practices of Public Russian Companies, 2017
07
Two companies in our sample failed to disclose the aggregate Board compensation in their Annual Reports. One of them did not disclose any compensation data, and the other one reported only a combined figure for the Board and the Executives. Twenty two percent of companies had the aggregate board compensation recorded in the Minutes of Annual Shareholders Meeting. Other companies either referred to the Compensation Policy without citing specific figures, or did not include the approval of board compensation in the meeting agenda altogether.
Individual director compensation of Russian directors is far less transparent than the aggregate board pay. Only 26% of companies in our sample provided such disclosure.
In terms of the structure of director compensation, 48% of companies disclosed the size of the base annual retainer (i.e. fixed compensation unrelated to the scope of board responsibilities) in their Annual Reports and/or Compensation Policies. Thirty eight percent of companies of our sample provided at least some information on additional compensation associated with specific roles on the Board. Additional compensation for the role of Board Chairman was disclosed by 28% of companies. Additional compensation for Chairing the Audit and Remuneration Committees was provided by 30% and 29% of the sample respectively. Twenty one percent reported additional compensation associated with membership in the Audit and Remuneration committees. Only two companies disclosed the additional compensation associated with the role of a Senior Independent Director.
Table 3: Compensation disclosure practices
# of сompanies
% of companies
Aggregate Board compensation in Annual Report 80 98%
Individual director compensation 21 26%
Aggregate Board compensation in Shareholders Meeting Minutes
18 22%
Base retainer level 39 48%
Additional compensation for specific roles: Board Chairman Audit Committee Chairman Remuneration Committee Chairman Members of Committees Senior Independent Director
232524172
28%30%29%21%2%
Aggregate compensation of the Management Board/Executive team
60 73%
CEO compensation 3 4%
CFO compensation 0 0%
Individual compensation of executives 0 0%
Key management personnel 82 100%
Source: Annual Reports, Board Compensation policies, Shareholders Meeting Minutes, IFRS Statements
Executive compensation disclosureThe aggregate compensation of the Management Board was disclosed by 73% of companies of our sample (in their Annual and Quarterly Reports). In addition, 19% reported they did not have a Management Board (and did not disclose the aggregate compensation of their top management team), and yet another 4% indicated that they were externally managed and disclosed the respective management fees paid to external entities. We do not view the management fee figures as direct equivalents of the Management Board compensation and did not account for them in our analysis. The remainder (4%) failed to provide an explanation for not disclosing the compensation of their Management Boards.
None of the companies in our sample disclosed the individual compensation of the Management Board (or its top management team).
Only three companies disclosed the individual compensation of the CEO, yet the CFO compensation was not disclosed by any company in our sample.
Key management personnel All the companies in our sample provided disclosure of compensation paid to key management personnel in their IFRS reports.
A summary of compensation disclosure practices by Russian companies is provided in Table 3.

Board and Executive Compensation Practices of Public Russian Companies, 2017
08
Board compensation practices
Directors of Russian companies typically receive a base retainer that can be supplemented by additional pay for committee membership or a Chairman’s role. Some companies also provide meeting attendance fees and/or annual bonuses to non-executive directors, against the recommendations of the Corporate Governance Code. In rare cases, directors also receive stock grants, or equity-linked payments.
Director compensation levels, as reported in 2016 Annual Reports, are displayed in Table 4, along with a breakdown by market cap. As individual compensation levels were not available, we estimated the individual director pay by dividing the aggregate reported Board compensation by the number of Board members entitled to compensation.1
The median estimated individual non-executive director compensation in our sample was about RUB 3.8 million (USD 56,900)2, and the largest amount was approximately RUB 37.5 million (USD 561,100).
Table 4: Median annual non- executive director compensation
Market capitalization breakdown, USD billion
Median annual director compensation, RUB million
All 3.8 (71)
Large Cap 7.7 (25)
Mid Cap 3.8 (26)
Small Cap 1.2 (20)
Source: Annual Reports
Comparing the median compensation of non-executive directors in 2016 (RUB 3.8 million) with the level observed in our 2012 survey (RUB 3.4 million)3, the increase in ruble terms represents a modest 12%. In USD terms, the director compensation level has decreased by about one half.
In the international comparison, Russian director compensation levels appear commensurate in general. According to Spenser Stuart UK Board Index, which covers the largest 150 FTSE companies, the average director
compensation was GBP 87.194 (RUB 7.9 million)4 in 2016. It should be borne in mind, however, that these UK companies are larger on average than those included in our Russian sample, providing a benchmark for our Large Cap subsample rather than the whole Russian sample. The median director pay for Large Cap Russian companies in 2016 (RUB 7.7 million) was roughly similar to the UK average.
Spenser Stuart also provides data on the average director compensation at listed companies in other European countries. Thus, the average director compensation in Europe ranged from EUR 44,000 (RUB 3.3 million)5 in Norway to EUR 292,000 (RUB 21.6 million) in Switzerland. While these figures are not directly comparable to our survey (the composition of respective samples varies greatly in terms of size of companies and industry profiles), it can be noted that compensation levels observed in Russia are closer to the lower end of this band.
The median individual compensation of Board and Committee Chairmen in Russia is presented in Table 5.
1 Excluding government officials and officers of the Bank of Russia that are typically not allowed to receive compensation for board service. We also excluded other directors from the count of remunerated board members if there was an explicit indication in the Annual Report that specific directors were not entitled to or were not receiving compensation for board service.
2 Based on the average USD rate of 66.833 in 2016
3 Deloitte CIS “Corporate Governance Structures of Public Russian Companies” Deloitte Centre for Corporate Governance, 2012
4 Based on the average GBP rate of 90.596 in 2016
5 Based on the average EUR rate of 70.992 in 2016

Board and Executive Compensation Practices of Public Russian Companies, 2017
09
Predictably, Board Chairmen received the highest compensation among all the directors: the median value is RUB 6.1 million. In the Large Cap category, Board Chairmen received a median compensation of RUB 20 million. The median compensation of Audit Committee and Remuneration Committee Chairmen is RUB 4.3 million and 4.6 million, respectively.
Table 5 also provides a breakdown of median individual compensation levels by market cap categories. We note that due to the limited number of observations within each category (Mid Cap in particular), the reported figures are less reliable than the sample-wide statistics.
In international comparison, fees for Board Chairman at the largest 150 UK companies ranged between GBP 30,000 and GBP 1,500,000 according to Spencer Stuart and the average is GBP 373,874 (RUB 33.9 million). That is 1.5 times higher than the Board Chairman pay in our Russian Large Cap subsample.
In the other markets’ survey by Spenser Stuart, the average Chairman’s compensation in Europe ranged from EUR 73,087 (RUB 5.4 million) in Norway to EUR 2,148,120 in Switzerland (RUB 158.9 million).
6 Includes Chairmen of Nominations and Remunerations Committees, HR and Remunerations Committees, and other such board committees whose titles suggest responsibilities in the area of compensations oversight.
Table 5: Median annual individual non-executive director compensation
Market capitalization, USD billion
Board Chairman Audit Committee Chairman
Remuneration6 Committee Chairman
Median annual individual compensation of director, RUB million
All (82) 6.1 (16) 4.3 (20) 4.6 (17)
Large Cap (27) 20 (7) 8.2 (8) 7.2 (7)
Mid Cap (29) 8.1 (3) 7.4 (3) 17.4 (3)
Small Cap (26) 1.7 (6) 2.1 (9) 1.1 (7)
Source: Annual Reports, Shareholders Meeting Minutes
Chart 3: Median annual individual non-executive director compensation, RUB mln
208.
11.
7
8.2
7.4
2.1
7.2
17.4
1.1
Boa
rd
Chai
rman
Audi
t Co
mm
itte
e Ch
airm
an
Rem
uner
atio
n Co
mm
itte
e Ch
airm
an
Large Cap
Mid Cap
Small Cap
Board and Executive Compensation Practices of Public Russian Companies, 2017
10
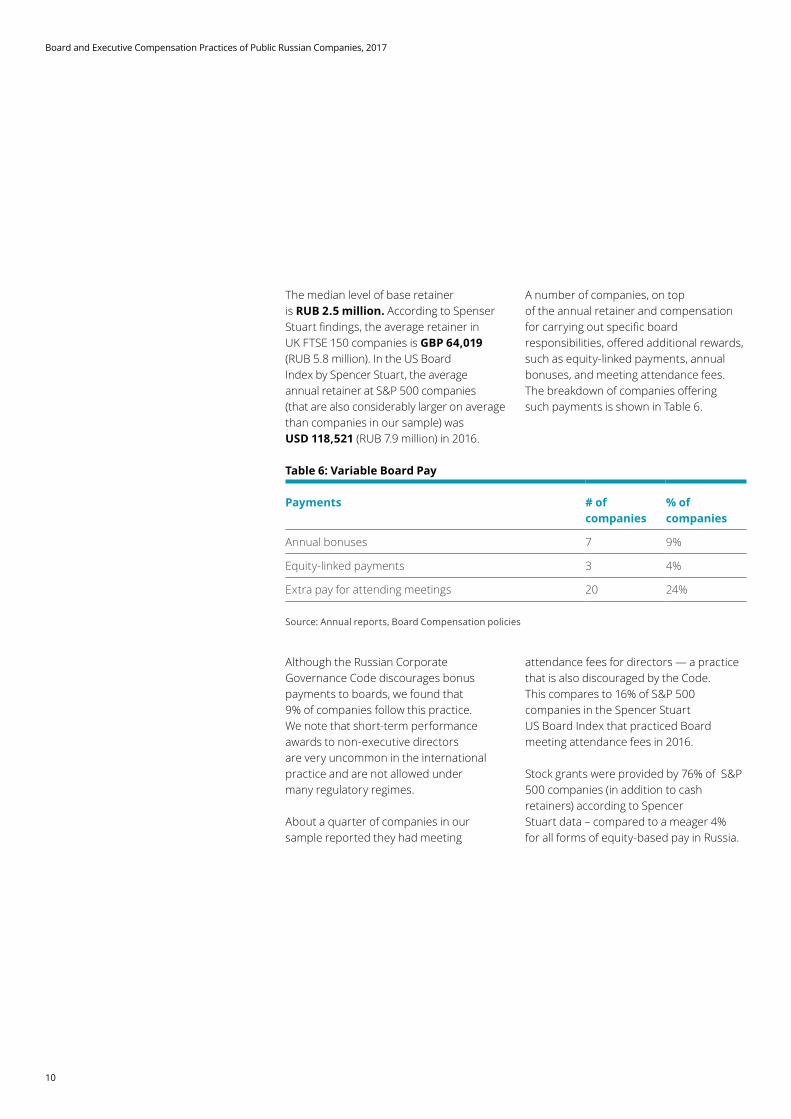
The median level of base retainer is RUB 2.5 million. According to Spenser Stuart findings, the average retainer in UK FTSE 150 companies is GBP 64,019 (RUB 5.8 million). In the US Board Index by Spencer Stuart, the average annual retainer at S&P 500 companies (that are also considerably larger on average than companies in our sample) was USD 118,521 (RUB 7.9 million) in 2016.
A number of companies, on top of the annual retainer and compensation for carrying out specific board responsibilities, offered additional rewards, such as equity-linked payments, annual bonuses, and meeting attendance fees. The breakdown of companies offering such payments is shown in Table 6.
Although the Russian Corporate Governance Code discourages bonus payments to boards, we found that 9% of companies follow this practice. We note that short-term performance awards to non-executive directors are very uncommon in the international practice and are not allowed under many regulatory regimes.
About a quarter of companies in our sample reported they had meeting
attendance fees for directors — a practice that is also discouraged by the Code. This compares to 16% of S&P 500 companies in the Spencer Stuart US Board Index that practiced Board meeting attendance fees in 2016.
Stock grants were provided by 76% of S&P 500 companies (in addition to cash retainers) according to Spencer Stuart data – compared to a meager 4% for all forms of equity-based pay in Russia.
Table 6: Variable Board Pay
Payments # of companies
% of companies
Annual bonuses 7 9%
Equity-linked payments 3 4%
Extra pay for attending meetings 20 24%
Source: Annual reports, Board Compensation policies

Board and Executive Compensation Practices of Public Russian Companies, 2017
11

Board and Executive Compensation Practices of Public Russian Companies, 2017
12
Table 8. Breakdown of aggregate executive compensation, RUB million
Market capitalization breakdown, USD billion
Fixed Variable
Fee for service on the Management Board
Salary Bonus awards Reimbursement Other types of rewards
All 3.7 (18) 105.6 (53) 109.5 (49) 4.4 (15) 4.6 (25)
Large Cap 7.5 (8) 166.4 (21) 358.8 (20) 5.6 (10) 9.2 (10)
Mid Cap 4 (3) 102.7 (19) 80.8 (17) 7 (2) 4 (10)
Small Cap 1.6 (7) 44.6 (13) 34.7 (12) 3.3 (3) 4.5 (5)
Source: Annual Reports, Quarterly reports
Predictably, executive compensation had a more complex structure than director pay in our survey. It typically consisted of a salary, bonus awards, and fees for service on the Management Board. In some cases, it also included additional forms such as reimbursement (for example, traveling expenses) and other types of rewards, 18% and 30% of our sample, respectively.
Since none of the companies in our sample disclosed the compensation of individual Management Board members (or key executives), our analysis of executive pay practices is constrained to aggregate amounts.
Based on the data from Annual Reports, Table 7 below summarizes median levels of executive team compensation, with a breakdown by market cap.
Table 7. Median annual Management Board compensation
Market capitalization breakdown, USD billion
Management Board compensation, RUB million
All 250.9 (60)
Large Cap 609 (24)
Mid Cap 157.8 (22)
Small Cap 89.3 (14)
Source: Annual Reports
The median reported aggregate Management Board compensation in our sample was about RUB 250.9 million (USD 3.8 million), with a maximum of approximately RUB 4.3 billion (USD 64.4 million).
Breaking down by market cap bands, the executive compensation at Large Cap companies is predictably the largest (RUB 609 million), almost 4 times higher than for the Mid Cap category (RUB 157.8 million), and almost 7 times higher than for the Small Cap group (RUB 89.3 million).
We do not provide comparisons with the international executive pay data since aggregate team data is not usually presented in market surveys due to availability of individual pay breakdowns. In addition, several potentially relevant jurisdictions use a one-tier board system and do not have a legal framework for Management Boards.
Table 8 presents the breakdown of aggregate executive compensation levels by components.
Executive compensation practices

Board and Executive Compensation Practices of Public Russian Companies, 2017
13
An interesting finding in our view is that on average, the fixed elements of pay (salary and Management Board service fees) are approximately equal to the variable elements (bonus awards and ‘other types’). However, this ratio varies considerably across the market cap bands in our sample. In the Large Cap category, variable pay accounts for about two thirds of the executive compensation, whereas in the Small Cap category, variable components account for about 40% of the total.
Chart 4 presents a breakdown of executive compensation by components.
Chart 4. Breakdown of executive compensation
31%
40%
7%15% 7% Fee for service
on theExecutive board
Salary
Bonus awards
Reimbursement
Other types of rewards
Seventeen percent of companies in our sample had performance share plans (or long-term incentive plans) for their executives, according to their Annual Reports and the footnotes to IFRS statements.
Finally, we analyzed the compensation paid to key management personnel (which typically includes both the Board and the group of senior executives which may or may not be the same as the Management Board) as reported in the footnotes to annual IFRS reports.
While the compensation paid to key management personnel was disclosed by all the companies in our sample, we were not able to use such disclosures by 14 companies. In these 14 cases, the reported figures were presented as a bundled amount that included, in addition to actual compensation, social contributions that were made to off-budget funds. We were not able to adjust these figures in a consistent manner to make them comparable to the rest of the sample.
Our findings are presented in Table 9. The size of this aggregate pay varies widely among the market cap bands.
Table 9. Median Compensation of Key Management Personnel
Market capitalization breakdown, USD billion
Median annual pay of key management personnel, RUB million
All (82) 350 (68)
Large Cap 1330 (22)
Mid Cap 287.9 (25)
Small Cap 120 (21)
Sources: IFRS Reports
The median compensation of the key management personnel was about RUB 350 million, with a considerable gap between the pay at the Large Cap (RUB 1.33 billion) and the Small Cap categories (RUB 120 million).

Contacts
Oleg Shvyrkov, Ph.D.Director for Corporate GovernanceDeloitte CIS
Теl.: +7 (495) 787 06 00ext. [email protected]
Irina Deynega, LL.M. Manager Corporate GovernanceDeloitte CIS
Теl.: +7 (495) 787 06 00ext. [email protected]
Elena Filina Manager Tax & LegalDeloitte CIS
Теl.: +7 (495) 787 06 00ext. [email protected]
Svetlana Meyer Managing Partner Tax & LegalDeloitte CIS
Теl.: +7 (495) 787 06 00ext. [email protected]


deloitte.ruAbout Deloitte
Deloitte refers to one or more of Deloitte Touche Tohmatsu Limited, a UK private company limited by guarantee (“DTTL”), its network of member firms, and their related entities. DTTL and each of its member firms are legally separate and independent entities. DTTL (also referred to as “Deloitte Global”) does not provide services to clients. Please see www.deloitte.com/about for a more detailed description of DTTL and its member firms.
Deloitte provides audit, consulting, financial advisory, risk management, tax and related services to public and private clients spanning multiple industries. Deloitte serves four out of five Fortune Global 500® companies through a globally connected network of member firms in more than 150 countries bringing world-class capabilities, insights, and high-quality service to address clients’ most complex business challenges. To learn more about how Deloitte’s approximately 244,000 professionals make an impact that matters, please connect with us on Facebook, LinkedIn, or Twitter.
This communication contains general information only, and none of Deloitte Touche Tohmatsu Limited, its member firms, or their related entities (collectively, the “Deloitte Network”) is, by means of this communication, rendering professional advice or services. Before making any decision or taking any action that may affect your finances or your business, you should consult a qualified professional adviser. No entity in the Deloitte Network shall be responsible for any loss whatsoever sustained by any person who relies on this communication.
© 2017 ZAO Deloitte & Touche CIS. All rights reserved.