board of directorsa nnu al r epo rt 2017-2018 2 board of directors 1. mr. chen qiyu - chairman 2....
TRANSCRIPT


AN
NU
AL R
EP
OR
T 2
017-2018
2
BOARD OF DIRECTORS1. Mr. Chen Qiyu - Chairman
2. Mr. P. V. N. Raju - Honorary Chairman
3. Dr. Ravi Penmetsa - Managing Director & CEO
4. Mr. Wu Yifang - Director
5. Mr. Dongming Li - Director
6. Ms. Guan Xiaohui - Director
7. Mr. Peng Yiran - Director & CFO
8. Mr. Moheb Ali - Independent Director
9. Mr. Udo J Vetter - Independent Director
COMPANY SECRETARY
P. Sampath Kumar
STATUTORY AUDITORSM/s. S.R. Batliboi & Associates LLP
Chartered Accountants
Hyderabad.
BANKERSSyndicate Bank
Corporate Finance Branch
Hyderabad.
Corporate Information
REGISTERED OFFICE6-3-865/1/2, Flat No 201,
Greenland Apartments, Ameerpet,
Hyderabad - 500 016
Tel: +91-40-6662 1010: Fax-+91-40-2340 2229
E-Mail: [email protected]
Website: www.glandpharma.com
PLANTS
Sy. No. 143-148, 150 & 151 Unit – I, Block - C, Phase - I
D.P. Pally, Dundigal (Post), Visakhapatnam Special Economic Zone,
Hyderabad – 500 043. Duvvada, Visakhapatnam- 530 046.
Plot No. 49 & 50, Plot No. 42 – 52, 54, 55 & 64 – 68 APIIC,
Jawaharlal Nehru Pharmacity, Parawada (M), Phase-III, Pashamylaram(V), Patancheru(M),
Visakhapatnam – 531 021. Medak(Dt) – 502 307.
Unit – II, Block – C, Phase-I,
Visakhapatnam Special Economic Zone
Duvvada, Visakhapatnam - 530 046.

ANNUAL REPORT 2017-2018
3
NOTICE
Notice is hereby given that the 40th Annual General Meeting of the Members of Gland Pharma Limited will be held on Monday,
the 17th September, 2018 at the Registered Office of the Company situated at Flat No. 201, Greenland Apartments, Ameerpet,
Hyderabad – 500 016 at 11:00 A.M. to transact the following business:
Ordinary Business:
1. To receive, consider and adopt the Balance Sheet of the Company as at 31st March, 2018; the Statement of Profit &
Loss and the Cash Flow Statement for the year ended on that date along with the Schedules and Notes thereto,
together with the Reports of Directors and Auditors thereon.
2. To appoint a Director in place of Dr. Ravi Penmetsa, who retires by rotation and being eligible, offers himself for
re-appointment.
3. To appoint a Director in place of Mr. Peng Yiran, who retires by rotation and being eligible, offers himself for
re-appointment.
4. To appoint M/s. S.R. Batliboi & Associates L.L.P., Chartered Accountants, Hyderabad as Statutory Auditors of the
Company for a period of 5 years i.e., from F.Y. 2018-19 to F.Y. 2022-23 and to authorize the Board of Directors to fix
their remuneration by passing the following resolution:
“RESOLVED THAT pursuant to Section 139(1) and other applicable provisions, if any, of the Companies Act, 2013 and
the Rules made thereunder, M/s. S. R. Batliboi & Associates L.L.P, Chartered Accountants, Hyderabad (Firm Registration
No. 101049W/ E300004) be and are hereby appointed as Statutory Auditors of the Company for a period of 5 years
i.e., from F.Y. 2018-19 to F.Y. 2022-23 and shall hold office from the conclusion of this Annual General Meeting till the
conclusion of the Annual General Meeting for financial year 2022-23 and the Board of Directors be and is hereby
authorised to fix their remuneration.”
Special Business:
5. To approve shifting of registered office of the Company
To consider and if thought fit, to pass with or without modifications, the following resolution as a Special Resolution
“RESOLVED THAT pursuant to the provisions of Section 12(5) of the Companies Act, 2013 and Rules 25 and 27 of the
Companies (Incorporation) Rules, 2014 and other applicable provisions, if any, of the Companies Act, 2013; the
Registered office of the Company be and is hereby shifted from Flat No. 201, Greenland Apartments, Ameerpet,
Hyderabad – 500 016 to Sy. No. 143 - 148, 150 & 151, Near Gandi Maisamma 'X' Roads, D.P.Pally, Dundigal, Dundigal-
Gandimaisamma Mandal, Medchal-Malkajgiri District, Hyderabad, Telangana – 500 043.
FURTHER RESOLVED THAT Dr. Ravi Penmetsa, CEO & Managing Director of the Company and / or Mr. P. Sampath Kumar,
Company Secretary of the Company be and are hereby authorized severally to file the necessary e-forms with Registrar
of Companies, and to do all such other acts, deeds and things as may be required to give effect to the above
resolution.”
For and on behalf of the Board
Dr. Ravi Penmetsa Place: Hyderabad
Managing Director & CEO Date: 21 -Aug-2018
DIN: 00179939
AN
NU
AL R
EP
OR
T 2
017-2018
4
Notes:
1. A Member of the Company entitled to attend and vote at the Meeting is entitled to appoint a proxy to attend and
vote instead of himself and the proxy need not be a Member of the Company.
2. The proxy form, in order to be effective, must be deposited at the Registered Office of the Company not less than
48 hours before commencement of the Meeting.
3. Members are requested to bring their copies of the Annual Report to the Meeting.
4. Explanatory Statement pursuant to Section 102 of the Companies Act, 2013 is annexed hereto.
EXPLANATORY STATEMENT PURSUANT TO SECTION 102 OF THE COMPANIES ACT, 2013
Item No.5: To approve shifting of registered office of the Company
In view of operational convenience, it is proposed to shift the Registered office of the Company from Flat No. 201, Greenland
Apartments, Ameerpet, Hyderabad – 500 016 to the Company’s Dundigal Plant situated at Sy. No. 143 - 148, 150 & 151, Near
Gandi Maisamma 'X' Roads, D.P.Pally, Dundigal, Dundigal- Gandimaisamma Mandal, Medchal-Malkajgiri District, Hyderabad,
Telangana – 500 043.
Since the Company’s Plant is located outside the local limits of the City, approval of the Members of the Company through a
Special resolution is required.
The Board recommends the passing of the resolutions at Item No. 7 of the Notice as a Special resolution.
None of the Directors, Key Managerial Personnel of the Company, or their relatives, is interested in this resolution.
For and on behalf of the Board
Dr. Ravi Penmetsa Place: Hyderabad
Managing Director & CEO Date: 21 -Aug-2018
DIN: 00179939

ANNUAL REPORT 2017-2018
5
a) in preparation of the annual accounts for the year
ended 31st March, 2018; the applicable accounting
standards have been followed along with proper
explanations relating to material departures, if any.
b) they have selected such accounting policies and
applied them consistently and made judgments and
estimates that are reasonable and prudent so as to
give a true and fair view of the state of affairs of the
Company as at March 31, 2018 and of the profit of
the Company for the year ended on that date.
c) they have taken proper and sufficient care for the
maintenance of adequate accounting records in
accordance with the provisions of the Act, for
safeguarding the assets of the Company and for
preventing and detecting fraud and other irregularities.
d) they have prepared the annual accounts on a going
concern basis.
e) they have laid down proper internal financial controls
to be followed by the Company and they were adequate
and operating effectively and
f) they have devised proper systems to ensure compliance
with the provisions of all applicable laws and such
systems were adequate and operating effectively.
Declaration by Independent Directors [Section134(3)(d)]
Both the Independent Directors of the Company have given
declarations that they meet the criteria of independence as
laid down under Section 149(6) of the Companies Act, 2013.
A Statement on the criteria for determining the
Independence of Directors is annexed as Annexure B to
this Report.
Company’s policy on Directors’ appointment andremuneration and Criteria for determining qualifications,Positive Attributes and Independence of a Director[Section 134(3)(e)]
The Company has constituted a Nomination and
Remuneration Committee which has been entrusted the
responsibility of selecting and recommending the
appointment and remuneration of Directors. The Committee,
while making appointments and fixing the remuneration of
Directors will take into consideration the following:
a) their qualification,
b) past record, especially their credentials and
achievements, experience, past remuneration
c) job profile and suitability
d) comparative remuneration with the industry in line
with size and profits of the Company
e) their pecuniary relationship with the promoters.
Dear Members,
Your Directors take pleasure in presenting the 40th Annual
Report together with Audited Financial Statements for the
Year ended 31st March, 2018.
CORPORATE AFFAIRS & FINANCIAL HIGHLIGHTS
During the Financial year under review, M/s. Fosun Pharma
Industrial Pte. Ltd, a Singapore based Company acquired
74% of the shareholding of the Company. M/s. KKR Floorline
Investments Pte. Ltd; the Private Equity investor and other
strategic investors disinvested in the Company.
Financial Highlights(Rs. in Mn)
ParticularsYear Ended Year Ended2017-18 2016-17
Income 16,716.82 15,251.88
Profit Before Interest,
Depreciation and Tax 5,838.94 6,585.50
Finance cost 41.25 63.92
Profit Before Depreciationand Tax 5,797.69 6,521.58Depreciation 782.08 741.47
Profit Before Tax 5,015.61 5,780.11Provision for TaxationCurrent Tax 1,694.59 1,430.29
Deferred Tax Liability 106.33 208.57
Taxes for earlier years 3.54 3.99
Profit After Tax 3,211.15 4,137.26Less : Total other
Comprehensive Income
for the year, net of tax 5.03 9.83
Total ComprehensiveIncome for the year,net of tax 3,206.12 4,127.43Earnings Per Share (Rs.)
Basic 212.37 267.01
Diluted 207.24 267.01
Extract of the Annual Return [Section 134(3)(a)]
The extract of the Annual Return in Form MGT-9 in terms of
Section 92 of the Companies Act, 2013 and the Rules made
thereunder is annexed as Annexure A to this Report.
Meetings of the Board of Directors [Section 134(3)(b)]
During the year under review, the Board of Directors met 7
times on 27th June, 2017; 1st September, 2017; 15th
September, 2017; 3rd October, 2017; 3rd October, 2017 (twice
on the same day); 13th October, 2017 and 7th February,
2018.
Directors’ Responsibility Statement [Section 134(3)(c)and 134(5)]
In terms of Section 134(3)(c) and 134(5) of the Companies
Act, 2013 your directors state that :
DIRECTORS' REPORT

AN
NU
AL R
EP
OR
T 2
017-2018
6
Further the Nomination and Remuneration Committee also,
while recommending and appointing independent Directors
will evaluate the following:
a) their qualification,
b) credentials, past experience in the fields of finance,
management, technology, taxation and other related
fields
c) expertise in similar industry
d) confirmation from the Internal Auditors that there is
no pecuniary relationship with the Company or other
parties in terms of Section 149(6) of the Companies
Act, 2013.
Audit Reports [Section 134(3)(f)]
The Independent Auditor’s Report given by M/s. S.R. Batliboi
& Associates, L.L.P, Statutory Auditors of the Company does
not contain any qualifications, reservation or adverse
remarks.
The Secretarial Audit Report given by M/s. BS & Company,
Company Secretaries LLP does not contain any qualifications,
reservation or adverse remarks.
Particulars of Loans, Guarantees and Investments[Section 134(3)(g)]
During the year under review, the Company did not extendany Loans or Guarantees and did not make any investments
as covered under the provisions of Section 186 of the
Companies Act, 2013.
Particulars of contracts with Related Parties [Section134(3)(h)]
The Company’s transactions with Related Parties are at arm’s
length and are in the ordinary course of business only. The
Company does not have any related party transactions, which
may have potential conflict with the interests of the
Company. All Related Party transactions have been reported
in Notes to Accounts and do not cover under the provisions
of Section 188(1) of the Companies Act, 2013 read with
Rules made thereunder.
The details of the Related Party transactions were provided
in Annexure C to this Report.
Company Affairs [Section 134(3)(i)]
Research and Development
R&D is another focus area for Gland. Synthetic R&D is led
by Dr. C.S. Venkatesan and Formulation R&D is led by Dr S.
Sridevi. Each of them has over two decades of experience.
Gland has a team of close to 200 scientists working in the
areas of:
• API Process Development
• Analytical Method Development
• Formulation Development
• Synthesis/isolation and characterization of process
and degradation impurities
Financial Highlights [Rule 8(5)(i) of Companies(Accounts) Rules, 2014]
Performance and Operations Review
During the year, the gross income of the Company was
Rs.16,716.82 Mn as against Rs. 15,251.88 Mn during the
previous year reflecting a growth of 9.60%.
Exports
Exports contribution to the revenue of the Company is
approximately 84%. Your Company exports to almost 70
countries across 6 continents. During the year, the Company
has achieved an export turnover of Rs.13,627.91 Mn.
Domestic Operations
The Domestic sales during the year 2017-18 amounts to
Rs. 2,601.02 Mn. Domestic sales include Co-Marketing, which
is a major revenue source for your Company in Domestic
segment.
Taxation
The Company has made an Income Tax provision of
Rs.1,694.59 Mn for the period under review as against
Rs.1,430.29 Mn for the previous year. An amount of
Rs.106.33 Mn has been provided towards Deferred Tax
Liability for the year as required under Accounting Standard-
22 relating to “Accounting for Taxes on Income”. Deferred
Tax Liability provision for the previous year was Rs.208.57
Mn.
Borrowings
The Company has repaid all its outstanding working capital
loans and Term Loans and the Company has no outstanding
borrowings as on date of this Report.
Capital Expenditure
During the year under review, the Company has incurred
capital expenditure of Rs.494.07 Mn at its Manufacturing
Facilities at Dundigal, Pashamylaram, VSEZ and Pharmacity.
General Reserve [Section 134(3)(j)]:
During the financial year under review, no amount was
transferred to General Reserve.
Dividends [Section 134(3)(k)]
The Board of Directors did not recommend dividend for this
year.
Material Changes and commitments [Section 134(3)(l)]
There were no material changes occurred or commitments
made by the management from the end of the financial
year to the date of this report, which effect the financial
position of the Company.

ANNUAL REPORT 2017-2018
7
Conservation of Energy, Technology Absorption andForeign Exchange Earnings & Out go [Section 134(3)(m)]
Particulars as required under Section 134(3)(m) of the
Companies Act, 2013 are annexed as Annexure-D to this
Report.
Risk Management [Section 134(3)(n)]
The Company has formulated a Risk Management policy.
Risks are classified in to different categories such as
Financial, Operational, Legal and Strategic risks. These risks
are reviewed from time to time and controls are put in
place with specific responsibility of the concerned Officer
of the Company. However, the Board could not identify any
major risks, which may threaten the immediate existence
of the Company.
Corporate Social Responsibility [Section 134(3)(o)]
The Company had constituted a ‘Corporate Social
Responsibility Committee’ to decide upon and implement
the Corporate Social Responsibility Policy (CSR policy) of
the Company.
The brief outline of the Corporate Social Responsibility (CSR)
policy of the Company and the initiatives undertaken by
the Company on CSR activities during the year are set out
in Annexure-E to this Report in the format prescribed in
the Companies (CSR policy) Rules, 2014.
Change in the nature of business [Rule 8(5)(ii) ofCompanies (Accounts) Rules, 2014]
There is no change in the nature of the business of the
Company during the financial year under review.
Change in the Directors or Key Managerial Personnel[Rule 8(5)(iii) of Companies (Accounts) Rules, 2014]
Directors
(i) During the year under review, Mrs. K. Jhansi Lakshmi
and Mr. Udo J. Vetter were reappointed as Directors
liable to retire by rotation in the Annual General
Meeting held on 27th September, 2017.
(ii) The following changes were made in the constitution
of the Board of Directors of the Company, on 3rd
October, 2017 pursuant to the acquisition of 74% of
shareholding by Fosun Pharma Industrial Pte. Ltd.
Directors appointed:
1. Mr. Chen Qiyu – Chairman (Director not liable to
retire by rotation)
2. Mr. Wu Yifang
3. Mrs. Guan Xiaohui
4. Mr. Peng Yiran
5. Mr. Shao Ying
Directors resigned:
1. Mrs. K. Jhansi Lakshmi
2. Mr. Udo J. Vetter
3. Mr. Sanjay Nayar
4. Mr. Karan Swani
5. Mr. B. Narasimha Rao
6. Mr. Srinivas Sadu
Dr. Ravi Penmetsa had been appointed as Chief
Executive Officer (CEO) & Managing Director of the
Company.
(iii) On 7th February, 2018 Mr. Li Dongming and Mr. Udo J.
Vetter (Independent Director) were appointed as
Additional Directors by the Board and later regularized.
(iv) The resignations of Mr. D.S. Brar and Mr. Shao Ying
were accepted with effect from 7th February, 2018.
(v) As per the provisions of Section 152 of the Companies
Act, 2013 read with Articles of Association of the
Company; Dr. Ravi Penmetsa, CEO & Managing Director
and Mr. Peng Yiran, Director are retiring by rotation
at the ensuing Annual General Meeting and being
eligible, offer themselves for re-appointment.
Subsidiaries and Associates [Rule 8(5)(iv) of Companies(Accounts) Rules, 2014]
The Company does not have any subsidiaries or Associates
as defined in the Companies Act, 2013, during the Financial
Year under review.
However, Gland Pharma Limited is a subsidiary of Fosun
Pharma Industrial Pte. Ltd, a Singapore Company, which
holds 74% of shareholding in Gland Pharma Limited.
Deposits [Rule 8(5)(v) of Companies (Accounts) Rules,2014]
The Company did not accept any deposits within the meaning
of Section 73 of the Companies Act, 2013 read with the
Companies (Acceptance of Deposits) Rules, 2014. There are
no unpaid or unclaimed deposits as the Company had never
accepted deposits within the meaning of the Act and the
Rules made thereunder.
Significant and Material Orders [Rule 8(5)(vii) ofCompanies (Accounts) Rules, 2014]
No orders were passed by the Regulators or Courts or
Tribunals impacting the ‘going concern’ status and the future
operations of the Company.
Internal Financial controls [Rule 8(5)(viii) of Companies(Accounts) Rules, 2014]
The Company appointed M/s. Y. Raghuram & Co., Chartered
Accountants as Internal Auditors of the Company. The
Company has adequate financial controls at every level to
check and control any defects and frauds in the Company.

AN
NU
AL R
EP
OR
T 2
017-2018
8
Disclosure under The Sexual Harassment of Women atWorkplace (Prevention, Prohibition and Redressal) Act,2013
The Company has in place a policy on Prevention, Prohibition
and Redressal of Sexual Harassment at workplace in line
with the requirements of The Sexual Harassment of Women
at Workplace (Prevention, Prohibition and Redressal) Act,
2013. An Internal Complaints Committee (ICC) has been
set up to redress complaints received regarding sexual
harassment. The policy has set guidelines on the redressal
and enquiry process that is to be followed by complainants
and the ICC, whilst dealing with issues related to sexual
harassment at the work place. All women employees
(permanent, temporary, contractual and trainees) are
covered under this policy. The Company has not received
any complaints during the year.
Vigil Mechanism [Section 177(9) and 177(10)]
The Company, as required under Rule 7 of Companies
(Meetings of Board and its Powers) Rules, 2014; has
established a Vigil Mechanism for their Directors and
employees to report their genuine concerns or grievances.
The Audit Committee of the Company shall oversee the vigil
mechanism, which provides for adequate safeguards against
victimization of employees and Directors who avail of the
vigil mechanism.
All the employees and Directors of the Company are provided
direct access to the Chairman of the Audit Committee.
Auditors
Statutory Auditors
M/s. S.R. Batliboi & Associates, L.L.P., Chartered
Accountants, Hyderabad were appointed as Statutory
Auditors of the Company to hold office from the conclusion
of the 36th Annual General Meeting to the conclusion of the
Annual General Meeting for the financial year 2017-18.
A proposal for the reappointment of the same Audit firm
i.e., S.R. Batliboi & Associates, L.L.P for a further period of
five years (i.e., from the conclusion of the ensuing Annual
General Meeting till the conclusion of the Annual General
Meeting for the F.Y 2022-23), will be placed before the
Members at the ensuing Annual General Meeting. The said
Auditors have given their willingness and eligibility
certificate in terms of Section 139 of the Companies Act,
2013.
Secretarial Auditors
Pursuant to the provisions of Section 204 of the Companies
Act, 2013 and the Rules made thereunder, the Company
has appointed BS & Company, Company Secretaries LLP to
undertake the Secretarial Audit of the Company. The
Secretarial Audit Report is annexed as Annexure-F to this
Report.
Particulars of Employees
In terms of the provisions of Rules 5(2) and 5(3) of the
Companies (Appointment and Remuneration of Managerial
Personnel) Rules, 2014; a statement showing the names
and other particulars of the employees drawing remuneration
in excess of the limits set out in the said Rules is annexed
as Annexure-G to this Report.
Committees of the Board of Directors
a) Audit Committee [Section 177]
The primary objective of the Audit Committee of the
Company is to monitor and provide effective supervision of
the management’s financial reporting process with a view
to ensure accurate, timely and proper disclosures and the
transparency, integrity and quality of financial reporting.
The Audit Committee will review periodically the internal
control systems, scope of audit including the observations
of auditors, if any, and review the half yearly and annual
financial statements before submission to the Board and
also ensures compliance with internal control system.
The terms of reference of the Committee are wide enough
to cover matters specified for Audit Committees under
Section 177 of the Companies Act, 2013.
During the year under review, the Audit Committee met on
27th June, 2017 and 21st December, 2017.
Composition and attendance of Audit Committee
Name No. ofof the Position Category Meetings
Director attendedMr. Moheb Ali Chairman Independent 2
Director
Mr. D.S.Brar Member Independent -(resigned w.e.f. Director7th Feb, 2018)
Mr. Karan Swani Member Non-Executive 1(resigned w.e.f. Director3rd Oct, 2017)
Ms. Guan Xiaohui Member Non-Executive 1(appointed w.e.f. Director3rd Oct, 2017)
Mr. Udo J Vetter Member Independent -(appointed w.e.f. Director7th Feb, 2018)
Dr. Ravi Penmetsa, CEO & Managing Director, Mr. Peng Yiran,
Director & CFO and Mr.Wu Rong, Chief Financial Controller
of the Company are the Special invitees to every Audit
Committee Meeting.
b) Nomination and Remuneration Committee[Section 178]
The purpose of the Nomination and Remuneration Committee
of the Company shall be to discharge the Board’s

ANNUAL REPORT 2017-2018
9
responsibilities relating to remuneration of the Company’s
Executive Directors. The Committee has overall responsibility
for formulating the criteria for determining qualifications
and independence of a Director and recommends to the
Board a policy relating to the remuneration for the directors,
key managerial personnel and other employees.
During the year under review, the Nomination and
Remuneration Committee met on 3rd October, 2017 and 30th
January, 2018.
Composition and attendance of Nomination andRemuneration Committee
Name No. ofof the Position Category Meetings
Director attendedMr. D.S.Brar Chairman Independent -
(resigned w.e.f. Director
7th Feb, 2018)
Mr. Moheb Ali Member Independent 1
(Chairman w.e.f. Director
7th Feb, 2018)
Mr. Karan Swani Member Non-Executive -
(resigned w.e.f. Director
3rd Oct, 2017)
Mr. P.V.N. Raju Member Chairman 2
(Whole-time
Director)
Mr. Wu Yifang Member Non-Executive 1
(appointed w.e.f. Director
3rd Oct, 2017)
Mr. Udo J. Vetter Member Independent -
(appointed w.e.f. Director
7th Feb, 2018)
Mr. Peng Yiran, Director & CFO of the Company is the Special
invitee to every Nomination and Remuneration Committee
Meeting.
c) Stakeholders Relationship and Share TransferCommittee
The “Stakeholders’ Relationship and Share transfer
Committee” of Directors was constituted to deal and resolve
grievances of the stakeholders of the Company and also to
consider and approve the share transfers and transmissions
as and when required.
The Company is not required to constitute the Stakeholders’
Relationship Committee as the number of shareholders of
the Committee is less than one thousand.
The Committee had met on 27th September, 2017.
The Committee had the following responsibilities:
i. Approve transfers/transmission of shares.
ii. Approve issue of duplicate share certificates,
consolidation/sub-division of share certificates on
completion of the procedures as may be stipulated.
iii. Ensure all shareholders’ queries, grievances and
complaints like transfer of shares, non-receipt of
balance sheet, non-receipt of declared dividends, etc.
are attended and redressed in an expeditious manner.
iv. Any other matter referred by the Board relating to
shareholders of the Company.
The Committee was dissolved with effect from 3rd October,
2017.
Composition and attendance of Stakeholders Relationshipand Share Transfer Committe
Name No. ofof the Position Category Meetings
Director attendedDr. Ravi Penmetsa Chairman CEO & Managing 1
Director
Mr. B. Narasimha Member Whole-time 1
Rao Director & CFO
(resigned w.e.f.
3rd Oct, 2017)
Mr. Karan Swani Member Non-Executive -
(resigned w.e.f. Director
3rd Oct, 2017)
d) Corporate Social Responsibility (CSR) Committee[Section 135]
The Company has constituted the ‘Corporate Social
Responsibility Committee’ for formulating and recommending
to the Board of Directors a Corporate Social Responsibility
Policy for the Company, which shall indicate the activities
to be undertaken by the Company as specified in the
Companies Act, 2013 and the Rules made thereunder.
The Corporate Social Responsibility Committee recommends
the amount of expenditure to be incurred by the Company
on CSR activities and monitor the Corporate Social
Responsibility Policy of the Company from time to time.
During the year under review, no Meetings of the Corporate
Social Responsibility Committee were held.
Composition and attendance of Corporate SocialResponsibility Committee
Name No. ofof the Position Category Meetings
Director attended
Dr. Ravi Penmetsa Chairman CEO & Managing N.A
Director
Mr. Moheb Ali Member Independent N.A
Director
Mr. Peng Yiran Member Director & CFO N.A

AN
NU
AL R
EP
OR
T 2
017-2018
10
Details of remuneration to Executive Directors(Rs. in 000’s)
Name of theSalary
Commi-PF
Perqui-Total
Director ssion sites
Mr. P. V. N. Raju 5,031 - - 1,033 6,064
Dr. Ravi Penmetsa 21,143 53,970 1,080 1,938 78,131
Mr. B. Narasimha Rao 4,402 - 329 459 5,190
(resigned w.e.f.
3rd Oct, 2017)
Mr. Srinivas Sadu 5,243 - 348 475 6,066
(resigned w.e.f.
3rd Oct, 2017)
Mrs. K. Jhansi Lakshmi 2,744 - 176 304 3,223
(resigned w.e.f.
3rd Oct, 2017)
Non-Executive Directors
The Company does not pay any remuneration to Non-
Executive Directors, except sitting fees for attending the
Board of Directors Meetings, reimbursement of travelling
and out of pocket expenses for attending such meetings.
Corporate Governance
A separate report on Corporate Governance is included as
part of the Annual Report.
Human Relations
The Company continues to have cordial and harmonious
relationship with its employees.
Acknowledgements
Your Directors gratefully acknowledge the continued support,
co-operation and wise counsel extended by the Government
Authorities, Banks and Financial Institutions.
Your Directors place on record their sincere appreciation
for the significant contribution made by the employees
through their dedication, hard work and commitment.
Your Directors sincerely acknowledge the confidence and
faith reposed in the Company by the Shareholders, Medical
Profession & trade and other stake holders.
For and on behalf of the Board
Dr. Ravi Penmetsa Peng YiranManaging Director & CEO Director & CFODIN: 00179939 DIN: 07675475
Place: Hyderabad
Date: 21-Aug-2018

ANNUAL REPORT 2017-2018
11
I. Registration and other details:
i) CIN: U24239AP1978PLC002276
ii) Registration Date 20-03-1978
iii) Name of the Company Gland Pharma Ltd
iv) Category / Sub-Category Company limited by Shares
of the Company Indian Non-Government Company
v) Address of the Registered #6-3-865/1/2, Flat No. 201,
office and contact details Greenland Apartments, Ameerpet,
Hyderabad- 500 016, Telangana
vi) Whether listed company (Y/N) Unlisted
vii)Name, Address and Contact Bigshare Services Pvt. Ltd.
details of Registrar and 306, 3rd Floor, Right Wing,
Transfer Agent, if any Amrutha Ville, Opp. Yashoda Hospital,
Raj Bhavan Road, Somajiguda,
Hyderabad – 500 082.
Ph: 040-23374967.
e-mail: [email protected].
Website: bigshareonline.com
II. Principal business activities of the company
Business activities contributing 10% or more of the total
turnover of the company are:-
Sl. Name and Description of NIC Code of the % to totalNo. main products / services Product/ service turnover of
the company
1 Pharmaceuticals 21002 and 21001 100%
III. Particulars of holding, subsidiary and associatecompanies
S. Name and Address Holding/ % of ApplicableNo. of the company CIN/GLN Subsidiary/ shares Section
Associate Held
1 Fosun Pharma - Holding 74% 2(46),
Industrial 2(87) (ii)
Pte. Ltd.
ANNEXURE – A (TO THE DIRECTORS’ REPORT)Form No. MGT-9
EXTRACT OF ANNUAL RETURN
as on financial year ended 31st March, 2018[Pursuant to Section 92(3) of the Companies Act, 2013 and Rule 12(1) of the Companies
(Management and Administration) Rules, 2014]
IV. Share holding pattern (Equity Share Capital Breakup as percentage of Total Equity)i) Category-wise Share Holding
Category of
No. of Shares held at the No. of Shares held at the
Shareholders
beginning of the year end of the year %
Demat Physical Total% of Total
Demat Physical Total% of Total change
Shares Shares
A. Promoters(1) Indian
a) Individual/HUF 12,000 - 12,000 0.08 - - - - (0.08)
b) Central Govt - -
c) State Govt(s) - -
d) Bodies Corp. 47,30,250 - 47,30,250 30.53 20,09,487 - 20,09,487 12.97 (17.56)
e) Banks / FI -
f) Any Other-
Discretionary Trusts 17,52,600 - 17,52,600 11.31 14,11,700 - 14,11,700 9.11 (2.20)
Sub-total (A) (1):- 64,94,850 - 64,94,850 41.92 34,21,187 - 34,21,187 22.08 (19.84)
(2) Foreign
a) NRIs -
Individuals - - - - - - - - -
b) Other Individuals - - - - - - - - -
c) Bodies Corp.* - - - - 105,23,758 9,42,504 114,66,262 74.00 74.00
d) Banks / FI - - - - - - - - -
e) Any Other - - - - - - - - -
Sub-total (A) (2):- - - - - - - - - -
Total shareholdingof Promoter(A) =(A)(1)+(A)(2) 64,94,850 - 64,94,850 41.92 139,44,945 9,42,504 148,87,449 96.08 54.16
*Fosum Pharma Industrial Pte. Ltd. acquired 74% of the shareholding of the Company and as the control of the Board and Company is
vested in it, it is considered as Promoter of the Company.

AN
NU
AL R
EP
OR
T 2
017-2018
12
Category of
No. of Shares held at the No. of Shares held at the
Shareholders
beginning of the year end of the year %
Demat Physical Total% of Total
Demat Physical Total% of Total change
Shares Shares
B. Public
Shareholding
1. Institutions
a) Mutual Funds - - - - - - - - -
b) Banks / FI - - - - - - - - -
c) Central Govt - - - - - - - - -
d) State Govt(s) - - - - - - - - -
e) Venture Capital
Funds - - - - - - - - -
f) Insurance
Companies - - - - - - - - -
g) FIIs - - - - - - - - -
h) Foreign Venture
Capital Funds - - - - - - - - -
i) Others (specify) - - - - - - - - -
Sub-total (B)(1):- - - - - - - - - -
2. Non-Institutions
a) Bodies Corp. - - - - - - - -
i) Indian - 15,42,500 15,42,500 9.95 - 6,00,000 6,00,000 3.87 (6.08)
ii) Overseas 58,96,599 - 58,96,599 38.05 - - - - (38.05)
b) Individuals - - - - - - - - -
i) Individual
shareholders
holding nominal
share capital upto
Rs. 1 lakh - 7,500 7,500 0.05 - 7,500 7,500 0.05 -
ii) Individual
shareholders
holding
nominal share
capital in excess
of Rs 1 lakh 15,53,496 4 15,53,500 10.03 - - - - (10.03)
c) Others
(specify) - - - - - - - -
Sub-total (B)(2):- 74,50,095 15,50,004 90,00,099 58.08 - 6,07,500 6,07,500 3.92 (54.16)
Total Public
Shareholding
(B)=(B)(1)+(B)(2) 74,50,095 15,50,004 90,00,099 58.08 - 6,07,500 6,07,500 3.92 (54.16)
C. Shares held by
Custodian for
GDRs & ADRs - - - - - - - - -
Grand Total
(A+B+C) 139,44,945 15,50,004 154,94,949 100 139,44,945 15,50,004 154,94,949 100 -

ANNUAL REPORT 2017-2018
13
(ii) Shareholding of Promoters
Share holding at the Share holding at thebeginning of the year end of the year
Sl Shareholder’s No. of % of % of Shares No. of % of % of Shares % changeNo. Name Shares total Pledged / Shares total Pledged / in share
Shares encumbered Shares encumbered holdingof the to total of the to total during
company shares company shares the year
1. Mr. P.V.N.Raju & Mrs. K.Jhansi Lakshmi 2,00,900 1.30 - - - - (1.30)
(Trustees of M/s. Surya Trust)
2. Mrs. K. Jhansi Lakshmi 12,000 0.08 - - - - (0.08)
3. Gland Celsus Bio-Chemicals Private Ltd 40,29,628 26.01 - 20,09,487 12.97 - (13.04)
4. Ethigen Labs Pvt. Ltd. 3,50,000 2.26 - - - - (2.26)
5. Questar Laboratories Private Ltd 3,50,622 2.26 - - - - (2.26)
6. RP Advisory Services Pvt Ltd (Trustee 7,86,700 5.08 - 7,86,700 5.08 - -
of Empower Discretionary Trust)
7. RP Advisory Services Pvt Ltd 4,75,000 3.07 - 3,75,000 2.42 - (0.65)
(Trustee of Nilay Discretionary Trust)
8. B. Narasimha Rao (Trustee of Rivendell 2,90,000 1.87 - 1,00,000 0.65 - (1.22)
Discretionary Trust)
9. RP Advisory Services Pvt Ltd (Trustee - - - 1,50,000 0.97 - 0.97
of Odin Discretionary Trust)
10. Fosun Pharma Industrial Pte. Ltd - - - 114,66,258 74.00 - 74.00
11. Lustrous Star Ltd - - - 01 0.0 - 0.0
12. Regal Gesture Limited - - - 01 0.0 - 0.0
13. Ample Up Ltd - - - 01 0.0 - 0.0
14. Fosun Industrial Co. Ltd - - - 01 0.0 - 0.0
(iii) Change in Promoters’ Shareholding ( please specify, if there is no change)
Sl.Name of Shareholder
Shareholding at the Cumulative ShareholdingNo. beginning of the year during the year
1. Mr. P.V.N. Raju & Mrs. K. Jhansi Lakshmi No. of % of total shares No. of % of total shares
(Trustees of M/s. Surya Trust) shares of the company shares of the company
At the beginning of the year 2,00,900 1.30% - -
Date wise Increase /Decrease in Shareholding during (i) 2,00,900 shares were transferred to Fosum Pharma
the year specifying the reasons for increase /decrease Industrial Pte. Ltd. on 3rd October, 2017.
(e.g. allotment /transfer / bonus / sweat equity, etc)
At the End of the year (or on the date of separation, - -
If separated during the year)

AN
NU
AL R
EP
OR
T 2
017-2018
14
Sl.Name of Shareholder
Shareholding at the Cumulative ShareholdingNo. beginning of the year during the year
2. Mrs. K. Jhansi Lakshmi No. of % of total shares No. of % of total shares
shares of the company shares of the company
At the beginning of the year 12,000 0.08% - -
Date wise Increase /Decrease in Shareholding during (i) 12,000 shares were transferred to Fosum Pharma
the year specifying the reasons for increase /decrease Industrial Pte. Ltd. on 3rd October, 2017.
(e.g. allotment /transfer / bonus / sweat equity, etc)
At the End of the year (or on the date of separation, - -
If separated during the year)
Sl.Name of Shareholder
Shareholding at the Cumulative ShareholdingNo. beginning of the year during the year
3. Gland Celsus Bio-Chemicals Private Limited No. of % of total shares No. of % of total shares
shares of the company shares of the company
At the beginning of the year 40,29,628 26.01% 20,09,487 12.97%
Date wise Increase /Decrease in Shareholding during (i) 20,20,141 shares were transferred to Fosum Pharma
the year specifying the reasons for increase /decrease Industrial Pte. Ltd. on 3rd October, 2017.
(e.g. allotment /transfer / bonus / sweat equity, etc)
At the End of the year (or on the date of separation, 20,09,487 12.97%
If separated during the year)
Sl.Name of Shareholder
Shareholding at the Cumulative ShareholdingNo. beginning of the year during the year
4. Ethigen Labs Pvt Ltd No. of % of total shares No. of % of total shares
shares of the company shares of the company
At the beginning of the year 3,50,000 2.26% - -
Date wise Increase /Decrease in Shareholding during (i) 3,50,000 shares were transferred to Fosum Pharma
the year specifying the reasons for increase /decrease Industrial Pte. Ltd. on 3rd October, 2017.
(e.g. allotment /transfer / bonus / sweat equity, etc)
At the End of the year (or on the date of separation, - -
If separated during the year)
Sl.Name of Shareholder
Shareholding at the Cumulative ShareholdingNo. beginning of the year during the year
5. Questar Laboratories Pvt Ltd No. of % of total shares No. of % of total shares
shares of the company shares of the company
At the beginning of the year 3,50,622 2.26% - -
Date wise Increase /Decrease in Shareholding during (i) 3,50,622 shares were transferred to Fosum Pharma
the year specifying the reasons for increase /decrease Industrial Pte. Ltd. on 3rd October, 2017.
(e.g. allotment /transfer / bonus / sweat equity, etc)
At the End of the year (or on the date of separation, - -
If separated during the year)

ANNUAL REPORT 2017-2018
15
Sl.Name of Shareholder
Shareholding at the Cumulative ShareholdingNo. beginning of the year during the year
6. RP Advisory Services Private Limited No. of % of total shares No. of % of total shares
(holding shares for the beneficial interest of shares of the company shares of the company
Empower Discretionary Trust)
At the beginning of the year 7,86,700 5.08% 7,86,700 5.08%
Date wise Increase /Decrease in Shareholding during
the year specifying the reasons for increase /decrease No change
(e.g. allotment /transfer / bonus / sweat equity, etc)
At the End of the year (or on the date of separation, 7,86,700 5.08%
If separated during the year)
Sl.Name of Shareholder
Shareholding at the Cumulative ShareholdingNo. beginning of the year during the year
7. RP Advisory Services Private Limited No. of % of total shares No. of % of total shares
(holding shares for the beneficial interest of shares of the company shares of the company
Nilay Discretionary Trust)
At the beginning of the year 4,75,000 3.07% 5,86,066 3.78%
Date wise Increase /Decrease in Shareholding during (i) 1,11,066 shares were transferred from KKR Floorline
the year specifying the reasons for increase /decrease Investments Pte. Ltd on 27th Sep, 2017.
(e.g. allotment /transfer / bonus / sweat equity, etc) (ii) 2,11,066 shares were transferred to Fosun Pharma Industrial
Pte. Ltd on 3rd October, 2017.
At the End of the year (or on the date of separation, 3,75,000 2.42%
If separated during the year)
Sl.Name of Shareholder
Shareholding at the Cumulative ShareholdingNo. beginning of the year during the year
8. Mr. B. Narasimha Rao (holding shares for the No. of % of total shares No. of % of total shares
beneficial interest of Rivendell Discretionary Trust) shares of the company shares of the company
At the beginning of the year 2,90,000 1.87% 1,00,000 0.65%
Date wise Increase /Decrease in Shareholding during (i) 1,90,000 shares were transferred to Fosum Pharma
the year specifying the reasons for increase /decrease Industrial Pte. Ltd. on 3rd October, 2017.
(e.g. allotment /transfer / bonus / sweat equity, etc)
At the End of the year (or on the date of separation, - - 1,00,000 0.65%
If separated during the year)
Sl.Name of Shareholder
Shareholding at the Cumulative ShareholdingNo. beginning of the year during the year
9. RP Advisory Services Private Limited No. of % of total shares No. of % of total shares
(holding shares for the beneficial interest of shares of the company shares of the company
Odin Discretionary Trust)
At the beginning of the year - - 468,366 3.02%
Date wise Increase /Decrease in Shareholding during (i) 468,366 shares were transferred from KKR Floorline
the year specifying the reasons for increase /decrease Investments Pte. Ltd on 27th Sep, 2017.
(e.g. allotment /transfer / bonus / sweat equity, etc) (ii) 3,18,366 shares were transferred to Fosun Pharma
Industrial Pte. Ltd on 3rd October, 2017.
At the End of the year (or on the date of separation, - - 1,50,000 0.97%
If separated during the year)

AN
NU
AL R
EP
OR
T 2
017-2018
16
Sl.Name of Shareholder
Shareholding at the Cumulative ShareholdingNo. beginning of the year during the year
10. Fosun Pharma Industrial Pte. Ltd No. of % of total shares No. of % of total shares
shares of the company shares of the company
At the beginning of the year - - 105,23,758 67.91%
Date wise Increase /Decrease in Shareholding during (i) Shares were purchased on 3rd Oct, 2017 from the below
the year specifying the reasons for increase /decrease mentionedpromoters
(e.g. allotment /transfer / bonus / sweat equity, etc)
(ii)53,17,167 shares were acquired from KKR Floorline
Investments Pte. Ltd on 3rd Oct, 2017.
(iii) Shares were purchased on 3rd Oct, 2017 from the below
mentioned Shareholder
(iv) 942,500 ‘Compulsorily Convertible Preference Shares’
(CCPS) were allotted on 3rd October, 2017. The same were
converted into Equity Shares on 7th Feb, 2018.
At the End of the year (or on the date of separation, 114,66,258 74.0%
If separated during the year)
Name of the Promoter No. of shares
Mr. PVN Raju & Smt. K. Jhansi Lakshmi
(Trustees of M/s. Surya Trust) 2,00,900
Mrs. K. Jhansi Lakshmi 12,000
Gland Celsus Bio Chemicals Pvt Ltd 20,20,141
Ethigen Labs Pvt Ltd 3,50,000
Questar Laboratories Pvt Ltd 3,50,622
RP Advisory Services Pvt Ltd 2,11,066
(Trustee of Nilay Discretionary Trust)
B. Narasimha Rao 1,90,000
(Trustee of Rivendell Discretionary Trust)
RP Advisory Services Pvt Ltd 3,18,366
(Trustee of Odin Discretionary Trust)
Total 36,53,095
Name of the Shareholder No. of shares
Mr. Udo J. Vetter 447,396
Mrs. Cornelia Vetter Kherkhoff 3,38,600
Mrs. Bianca Maria Vetter 3,38,600
Mr. Klaus Schoenwetter 1,08,700
Mrs. Kaara Radon 3,20,200
Total 15,53,496
Sl.Name of Shareholder
Shareholding at the Cumulative ShareholdingNo. beginning of the year during the year
11. Lustrous Star Ltd (holding shares for the No. of % of total shares No. of % of total shares
beneficial interest of Fosun Pharma Industrial shares of the company shares of the company
Pte. Ltd)
At the beginning of the year - - 01 0.0%
Date wise Increase /Decrease in Shareholding during (i) One share was acquired from Mr. Udo J. Vetter on 3rd Oct,
the year specifying the reasons for increase /decrease 2017
(e.g. allotment /transfer / bonus / sweat equity, etc)
At the End of the year (or on the date of separation, - - 01 0.0%
If separated during the year)

ANNUAL REPORT 2017-2018
17
Sl.Name of Shareholder
Shareholding at the Cumulative ShareholdingNo. beginning of the year during the year
12. Regal Gesture Ltd (holding shares for the No. of % of total shares No. of % of total shares
beneficial interest of Fosun Pharma Industrial shares of the company shares of the company
Pte. Ltd)
At the beginning of the year - - 01 0.0%
Date wise Increase /Decrease in Shareholding during (i) One share was acquired from Mr. Udo J. Vetter on 3rd Oct,
the year specifying the reasons for increase /decrease 2017.
(e.g. allotment /transfer / bonus / sweat equity, etc)
At the End of the year (or on the date of separation, 01 0.0%
If separated during the year)
Sl.Name of Shareholder
Shareholding at the Cumulative ShareholdingNo. beginning of the year during the year
13. Ample Up Ltd (holding shares for the beneficial No. of % of total shares No. of % of total shares
interest of Fosun Pharma Industrial Pte. Ltd) shares of the company shares of the company
At the beginning of the year - - 01 0.0%
Date wise Increase /Decrease in Shareholding during (i) One share was acquired from Mr. Udo J. Vetter on 3rd Oct,
the year specifying the reasons for increase /decrease 2017.
(e.g. allotment /transfer / bonus / sweat equity, etc)
At the End of the year (or on the date of separation, 01 0.0%
If separated during the year)
Sl.Name of Shareholder
Shareholding at the Cumulative ShareholdingNo. beginning of the year during the year
14. Fosun Industrial Co. Ltd (holding shares for the No. of % of total shares No. of % of total shares
beneficial interest of Fosun Pharma Industrial shares of the company shares of the company
Pte. Ltd)
At the beginning of the year - - 01 0.0%
Date wise Increase /Decrease in Shareholding during (i) One share was acquired from Mr. Udo J. Vetter on 3rd Oct,
the year specifying the reasons for increase /decrease 2017.
(e.g. allotment /transfer / bonus / sweat equity, etc)
At the End of the year (or on the date of separation, 01 0.0%
If separated during the year)
(iv) Shareholding Pattern of top ten Shareholders (other than Directors, Promoters and Holders of GDRs and ADRs):
Sl.Name of Shareholder
Shareholding at the Cumulative ShareholdingNo. beginning of the year during the year
1. Jeshta Farms Private Limited No. of % of total shares No. of % of total shares
shares of the company shares of the company
At the beginning of the year 60,000 0.39% 60,000 0.39%
Date wise Increase /Decrease in Shareholding during
the year specifying the reasons for increase /decrease No change in shareholding.(e.g. allotment /transfer / bonus / sweat equity, etc)
At the End of the year (or on the date of separation, 60,000 0.39%
If separated during the year)
AN
NU
AL R
EP
OR
T 2
017-2018
18
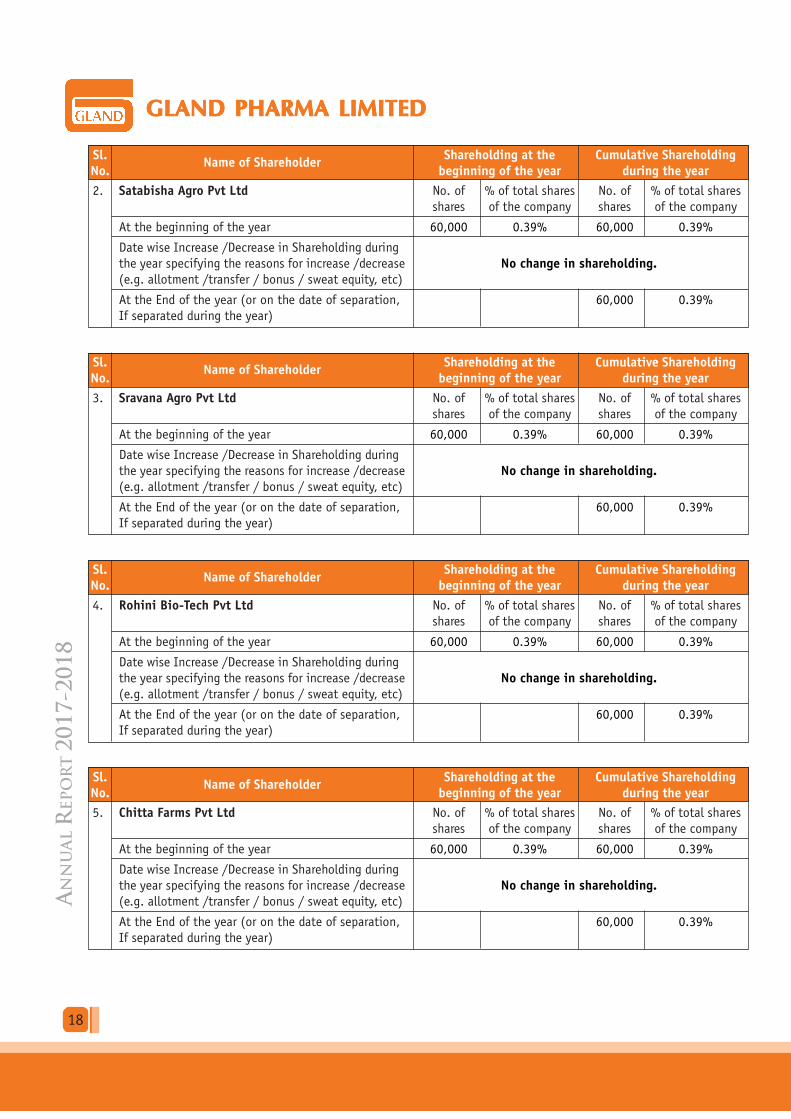
Sl.Name of Shareholder
Shareholding at the Cumulative ShareholdingNo. beginning of the year during the year
2. Satabisha Agro Pvt Ltd No. of % of total shares No. of % of total shares
shares of the company shares of the company
At the beginning of the year 60,000 0.39% 60,000 0.39%
Date wise Increase /Decrease in Shareholding during
the year specifying the reasons for increase /decrease No change in shareholding.(e.g. allotment /transfer / bonus / sweat equity, etc)
At the End of the year (or on the date of separation, 60,000 0.39%
If separated during the year)
Sl.Name of Shareholder
Shareholding at the Cumulative ShareholdingNo. beginning of the year during the year
3. Sravana Agro Pvt Ltd No. of % of total shares No. of % of total shares
shares of the company shares of the company
At the beginning of the year 60,000 0.39% 60,000 0.39%
Date wise Increase /Decrease in Shareholding during
the year specifying the reasons for increase /decrease No change in shareholding.(e.g. allotment /transfer / bonus / sweat equity, etc)
At the End of the year (or on the date of separation, 60,000 0.39%
If separated during the year)
Sl.Name of Shareholder
Shareholding at the Cumulative ShareholdingNo. beginning of the year during the year
4. Rohini Bio-Tech Pvt Ltd No. of % of total shares No. of % of total shares
shares of the company shares of the company
At the beginning of the year 60,000 0.39% 60,000 0.39%
Date wise Increase /Decrease in Shareholding during
the year specifying the reasons for increase /decrease No change in shareholding.(e.g. allotment /transfer / bonus / sweat equity, etc)
At the End of the year (or on the date of separation, 60,000 0.39%
If separated during the year)
Sl.Name of Shareholder
Shareholding at the Cumulative ShareholdingNo. beginning of the year during the year
5. Chitta Farms Pvt Ltd No. of % of total shares No. of % of total shares
shares of the company shares of the company
At the beginning of the year 60,000 0.39% 60,000 0.39%
Date wise Increase /Decrease in Shareholding during
the year specifying the reasons for increase /decrease No change in shareholding.(e.g. allotment /transfer / bonus / sweat equity, etc)
At the End of the year (or on the date of separation, 60,000 0.39%
If separated during the year)

ANNUAL REPORT 2017-2018
19
Sl.Name of Shareholder
Shareholding at the Cumulative ShareholdingNo. beginning of the year during the year
6. Punarvasu Bio-tech Pvt Ltd No. of % of total shares No. of % of total shares
shares of the company shares of the company
At the beginning of the year 60,000 0.39% 60,000 0.39%
Date wise Increase /Decrease in Shareholding during
the year specifying the reasons for increase /decrease No change in shareholding.(e.g. allotment /transfer / bonus / sweat equity, etc)
At the End of the year (or on the date of separation, 60,000 0.39%
If separated during the year)
Sl.Name of Shareholder
Shareholding at the Cumulative ShareholdingNo. beginning of the year during the year
7. Hastha Agro Pvt Ltd No. of % of total shares No. of % of total shares
shares of the company shares of the company
At the beginning of the year 60,000 0.39% 60,000 0.39%
Date wise Increase /Decrease in Shareholding during
the year specifying the reasons for increase /decrease No change in shareholding.(e.g. allotment /transfer / bonus / sweat equity, etc)
At the End of the year (or on the date of separation, 60,000 0.39%
If separated during the year)
Sl.Name of Shareholder
Shareholding at the Cumulative ShareholdingNo. beginning of the year during the year
8. Hansagiri Greenlands Pvt Ltd No. of % of total shares No. of % of total shares
shares of the company shares of the company
At the beginning of the year 60,000 0.39% 60,000 0.39%
Date wise Increase /Decrease in Shareholding during
the year specifying the reasons for increase /decrease No change in shareholding.(e.g. allotment /transfer / bonus / sweat equity, etc)
At the End of the year (or on the date of separation, 60,000 0.39%
If separated during the year)
Sl.Name of Shareholder
Shareholding at the Cumulative ShareholdingNo. beginning of the year during the year
9. Vishnupadi Greenlands Pvt Ltd No. of % of total shares No. of % of total shares
shares of the company shares of the company
At the beginning of the year 60,000 0.39% 60,000 0.39%
Date wise Increase /Decrease in Shareholding during
the year specifying the reasons for increase /decrease No change in shareholding.(e.g. allotment /transfer / bonus / sweat equity, etc)
At the End of the year (or on the date of separation, 60,000 0.39%
If separated during the year)

AN
NU
AL R
EP
OR
T 2
017-2018
20
Sl.Name of Shareholder
Shareholding at the Cumulative ShareholdingNo. beginning of the year during the year
10. Arunagiri Agro Farms Pvt Ltd No. of % of total shares No. of % of total shares
shares of the company shares of the company
At the beginning of the year 60,000 0.39% 60,000 0.39%
Date wise Increase /Decrease in Shareholding during
the year specifying the reasons for increase /decrease No change in shareholding.(e.g. allotment /transfer / bonus / sweat equity, etc)
At the End of the year (or on the date of separation, 60,000 0.39%
If separated during the year)
(iv) Shareholding of Directors: (Mention for each Director)
Sl.Name of the Director
Shareholding at the Cumulative ShareholdingNo. beginning of the year during the year
1. Mr. P.V.N. Raju (holding shares for the beneficial No. of % of total shares No. of % of total shares
interest of Surya Trust) shares of the company shares of the company
At the beginning of the year 2,00,900 1.38 - -
Date wise Increase /Decrease in Shareholding during (i) 2,00,900 shares were transferred to Fosun Pharma
the year specifying the reasons for increase /decrease Industrial Pte. Ltd on 3rd October, 2017.
(e.g. allotment /transfer / bonus / sweat equity, etc)
At the End of the year (or on the date of separation, - -
If separated during the year)
Sl.Name of the Director
Shareholding at the Cumulative ShareholdingNo. beginning of the year during the year
2. Dr. Ravi Penmetsa No. of % of total shares No. of % of total shares
shares of the company shares of the company
At the beginning of the year - - - -
Date wise Increase /Decrease in Shareholding during
the year specifying the reasons for increase /decrease -
(e.g. allotment /transfer / bonus / sweat equity, etc)
At the End of the year (or on the date of separation, - -
If separated during the year)
Sl.Name of the Director
Shareholding at the Cumulative ShareholdingNo. beginning of the year during the year
3. Mr. Udo J. Vetter No. of % of total shares No. of % of total shares
shares of the company shares of the company
At the beginning of the year 4,47,400 2.89 - -
Date wise Increase /Decrease in Shareholding during (i) 4,47,400 shares were transferred to Fosun Pharma
the year specifying the reasons for increase /decrease Industrial Pte. Ltd and to its affiliates on 3rd October,
(e.g. allotment /transfer / bonus / sweat equity, etc) 2017
At the End of the year (or on the date of separation, - -
If separated during the year)

ANNUAL REPORT 2017-2018
21
Sl.Name of the Director
Shareholding at the Cumulative ShareholdingNo. beginning of the year during the year
4. Mr. Chen Qiyu No. of % of total shares No. of % of total shares
shares of the company shares of the company
At the beginning of the year - - - -
Date wise Increase /Decrease in Shareholding during
the year specifying the reasons for increase /decrease -
(e.g. allotment /transfer / bonus / sweat equity, etc)
At the End of the year (or on the date of separation, - -
If separated during the year)
Sl.Name of the Director
Shareholding at the Cumulative ShareholdingNo. beginning of the year during the year
5. Mr. Moheb Masthan Ali No. of % of total shares No. of % of total shares
shares of the company shares of the company
At the beginning of the year - - - -
Date wise Increase /Decrease in Shareholding during
the year specifying the reasons for increase /decrease -
(e.g. allotment /transfer / bonus / sweat equity, etc)
At the End of the year (or on the date of separation, - -
If separated during the year)
Sl.Name of the Director
Shareholding at the Cumulative ShareholdingNo. beginning of the year during the year
6. Mr. Wu Yifang No. of % of total shares No. of % of total shares
shares of the company shares of the company
At the beginning of the year - - - -
Date wise Increase /Decrease in Shareholding during
the year specifying the reasons for increase /decrease -
(e.g. allotment /transfer / bonus / sweat equity, etc)
At the End of the year (or on the date of separation, - -
If separated during the year)
Sl.Name of the Director
Shareholding at the Cumulative ShareholdingNo. beginning of the year during the year
7. Mrs. Guan Xiaohui No. of % of total shares No. of % of total shares
shares of the company shares of the company
At the beginning of the year - - - -
Date wise Increase /Decrease in Shareholding during
the year specifying the reasons for increase /decrease -
(e.g. allotment /transfer / bonus / sweat equity, etc)
At the End of the year (or on the date of separation, - -
If separated during the year)
AN
NU
AL R
EP
OR
T 2
017-2018
22
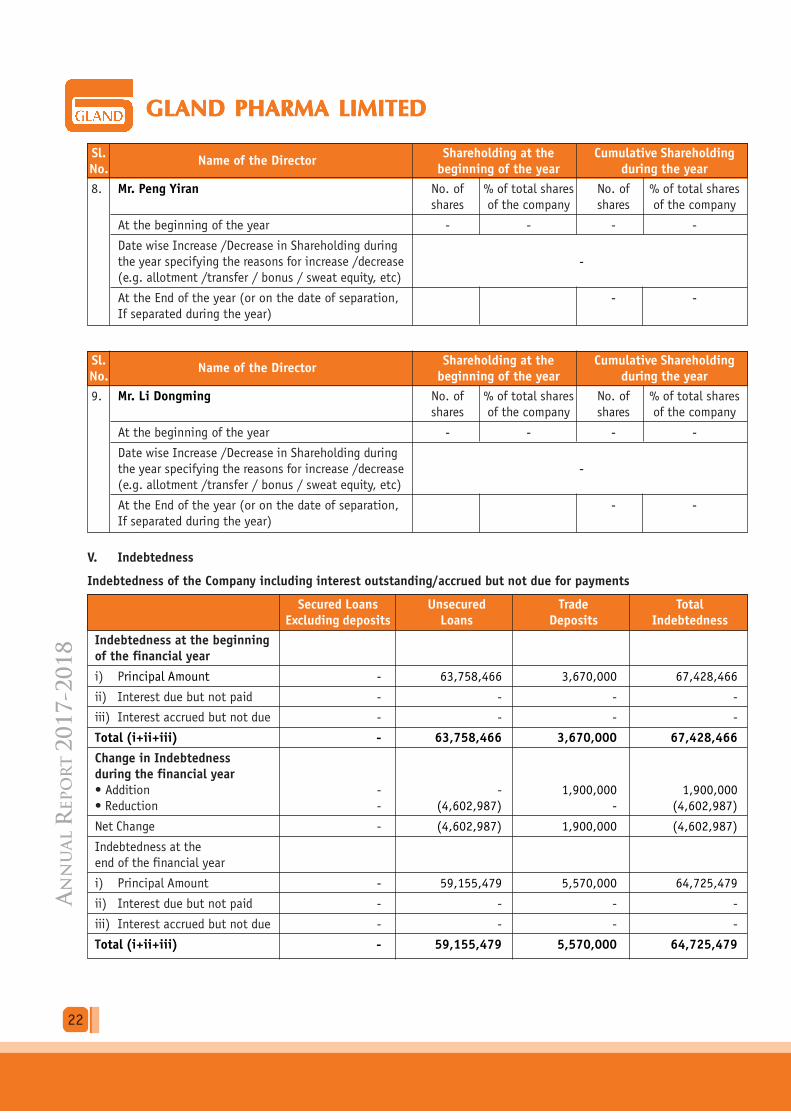
Sl.Name of the Director
Shareholding at the Cumulative ShareholdingNo. beginning of the year during the year
8. Mr. Peng Yiran No. of % of total shares No. of % of total shares
shares of the company shares of the company
At the beginning of the year - - - -
Date wise Increase /Decrease in Shareholding during
the year specifying the reasons for increase /decrease -
(e.g. allotment /transfer / bonus / sweat equity, etc)
At the End of the year (or on the date of separation, - -
If separated during the year)
Sl.Name of the Director
Shareholding at the Cumulative ShareholdingNo. beginning of the year during the year
9. Mr. Li Dongming No. of % of total shares No. of % of total shares
shares of the company shares of the company
At the beginning of the year - - - -
Date wise Increase /Decrease in Shareholding during
the year specifying the reasons for increase /decrease -
(e.g. allotment /transfer / bonus / sweat equity, etc)
At the End of the year (or on the date of separation, - -
If separated during the year)
V. Indebtedness
Indebtedness of the Company including interest outstanding/accrued but not due for payments
Secured Loans Unsecured Trade TotalExcluding deposits Loans Deposits Indebtedness
Indebtedness at the beginningof the financial year
i) Principal Amount - 63,758,466 3,670,000 67,428,466
ii) Interest due but not paid - - - -
iii) Interest accrued but not due - - - -
Total (i+ii+iii) - 63,758,466 3,670,000 67,428,466
Change in Indebtednessduring the financial year• Addition - - 1,900,000 1,900,000
• Reduction - (4,602,987) - (4,602,987)
Net Change - (4,602,987) 1,900,000 (4,602,987)
Indebtedness at the
end of the financial year
i) Principal Amount - 59,155,479 5,570,000 64,725,479
ii) Interest due but not paid - - - -
iii) Interest accrued but not due - - - -
Total (i+ii+iii) - 59,155,479 5,570,000 64,725,479

ANNUAL REPORT 2017-2018
23
VI. Remuneration of directors
A. Remuneration to Managing Director, Whole-time Directors and/or Manager:
(in INR 000’s)
Sl. Particulars ofName of MD/WTD/ Manager
Totalno. Remuneration Amount
Mr. P.V.N. Dr. Ravi Mr. B. Mr. Srinivas Smt. K. Jhansi
Raju Penmetsa Narasimha Rao Sadu Lakshmi
1. Gross Salary
(a) Salary as per provisions 5,031 21,143 4,402 5,243 2,744 38,562
contained in section 17(1)
of the Income-tax Act,1961
(b) Value of perquisites u/s 17(2) 1,033 1,938 459 475 304 4,208
of the Income-tax Act, 1961
(c) Profits in lieu of salary under
section 17(3) of the
Income-tax Act, 1961 - - - - - --
2. Stock Option - - - - - -
3. Sweat Equity - - - - - -
4. Commission - 53,970 - - - 53,970
- as % of profit
- others, specify…
5. Others, please specify (PF) - 1,080 329 348 176 1,933
Total (A) 6,064 78,131 5,190 6,066 3,223 98,674
Ceiling as per Companies Act, 2013 511,428
B. Remuneration to other directors:(in INR)
Sl.Name of the director
Particulars of remuneration TotalNo. Sitting fees Commission Others amount
1. Independent directors
(i) Mr. Moheb Masthan Ali 1,20,000 - - 1,20,000
(ii) Mr. Davinder Singh Brar 20,000 - - 20,000
Total (1) 140,000 - - 1,40,000
2. Other Non-Executive Directors
(i) Mr. Udo J. Vetter - - - -
(ii) Mr. Sanjay Omprakash Nayar - - - -
(iii) Mr. Karan Swani - - - -
Total (2) - - - -
Total (B) = (1+2) 1,40,000 - - 1,40,000
AN
NU
AL R
EP
OR
T 2
017-2018
24
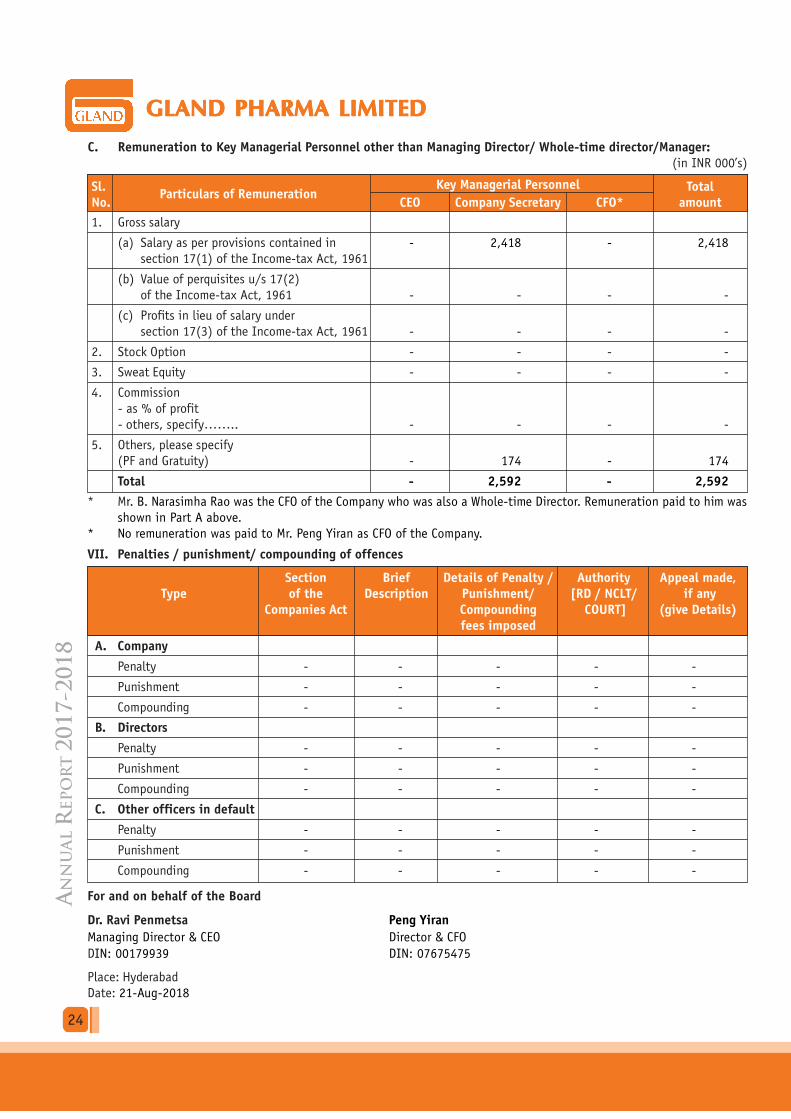
C. Remuneration to Key Managerial Personnel other than Managing Director/ Whole-time director/Manager:(in INR 000’s)
Sl.Particulars of Remuneration
Key Managerial Personnel TotalNo. CEO Company Secretary CFO* amount
1. Gross salary
(a) Salary as per provisions contained in - 2,418 - 2,418
section 17(1) of the Income-tax Act, 1961
(b) Value of perquisites u/s 17(2)
of the Income-tax Act, 1961 - - - -
(c) Profits in lieu of salary under
section 17(3) of the Income-tax Act, 1961 - - - -
2. Stock Option - - - -
3. Sweat Equity - - - -
4. Commission
- as % of profit
- others, specify…….. - - - -
5. Others, please specify
(PF and Gratuity) - 174 - 174
Total - 2,592 - 2,592
* Mr. B. Narasimha Rao was the CFO of the Company who was also a Whole-time Director. Remuneration paid to him was
shown in Part A above.
* No remuneration was paid to Mr. Peng Yiran as CFO of the Company.
VII. Penalties / punishment/ compounding of offences
Section Brief Details of Penalty / Authority Appeal made,Type of the Description Punishment/ [RD / NCLT/ if any
Companies Act Compounding COURT] (give Details)fees imposed
A. Company
Penalty - - - - -
Punishment - - - - -
Compounding - - - - -
B. Directors
Penalty - - - - -
Punishment - - - - -
Compounding - - - - -
C. Other officers in default
Penalty - - - - -
Punishment - - - - -
Compounding - - - - -
For and on behalf of the Board
Dr. Ravi Penmetsa Peng Yiran
Managing Director & CEO Director & CFO
DIN: 00179939 DIN: 07675475
Place: Hyderabad
Date: 21-Aug-2018

ANNUAL REPORT 2017-2018
25
1. Definition of Independence:
A director will be considered as an “independent
director” if the person meets with the criteria for
‘independent director’ as laid down in the Act, which is
as follows:
“An independent director in relation to a company,
means a Director other than a Managing Director or a
Whole-time Director or a Nominee Director—
(a) who, in the opinion of the Board, is a person of
integrity and possesses relevant expertise and
experience;
(b) (i) who is or was not a promoter of the Company
or its holding, subsidiary or associate company;
(ii) who is not related to promoters or directors in
the Company, its holding, subsidiary or
associate company;
(c) who has or had no pecuniary relationship, other
than remuneration as such director or having
transaction not exceeding ten percent of his total
income or such amount as may be prescribed with
the Company, its holding, subsidiary or associate
company, or their promoters, or directors, during
the two immediately preceding financial years or
during the current financial year;
(d) none of whose relatives (i) is holding any security
of or interest in the Company, its holding, subsidiary
or associate company during the two immediately
preceding financial years or during the current
financial year; Provided that the relative may hold
security or interest in the Company of face value
not exceeding Rs. 50 Lakhs or two percent of the
paid-up capital of the Company, its holding,
subsidiary or associate company or such higher sums
as may be prescribed; (ii) is indebted to the
Company, its holding, subsidiary or associate
company or their promoters, or directors, in excess
of such amounts as may be prescribed during the
two immediately preceding financial years or during
the current financial year; (iii) has given a guarantee
or provided any security in connection with the
indebtedness of any third person to the Company,
its Holding, subsidiary or associate company or their
promoters, or directors of such holding Company,
for such amount as may be prescribed during the
two immediately preceding financial years or during
the current financial year; or (iv) has any other
pecuniary transaction or relationship with the
Company or its subsidiary or its Holding or Associate
Company amounting to two percent or more of its
Gross turnover or total income singly or in
combination with the transactions referred to in
subclause (i), (ii) or (iii).
(e) who, neither himself nor any of his relatives—
(i) holds or has held the position of a key
managerial personnel or is or has been employee
of the Company or its holding, subsidiary or
associate company in any of the three financial
years immediately preceding the financial year
in which he is proposed to be appointed;
Provided that in case of a relative who is an
employee, the restriction under this clause shall
not apply for his employment during preceding
three financial years.
(ii) is or has been an employee or proprietor or a
partner, in any of the three financial years
immediately preceding the financial year in
which he is proposed to be appointed, of—
(A) a firm of auditors or company secretaries
in practice or cost auditors of the Company
or its holding, subsidiary or associate
company; or
(B) any legal or a consulting firm that has or
had any transaction with the Company, its
holding, subsidiary or associate company
amounting to ten per cent or more of the
gross turnover of such firm;
(iii) holds together with his relatives two per cent
or more of the total voting power of the
Company; or
(iv) is a Chief Executive or Director, by whatever
name called, of any nonprofit organisation that
receives twenty-five per cent or more of its
receipts from the Company, any of its promoters,
directors or its holding, subsidiary or associate
company or that holds two per cent or more of
the total voting power of the Company, or
(f) who possess such other qualifications as may be
prescribed.
2. Qualifications of Directors
The Board of Directors of the Company did not prescribe
any specific qualifications for an individual to be
appointed as a Director of the Company. However, while
nominating an individual as a Director of the Company,
the Board shall ensure that-
ANNEXURE – B (TO THE DIRECTORS’ REPORT)Criteria for determining the Independence of a Director
AN
NU
AL R
EP
OR
T 2
017-2018
26
a) a transparent Board nomination process is in place
that encourages diversity of thought, experience,
knowledge, perspective, age and gender.
b) The Board of Directors shall have an appropriate
blend of functional and industry expertise.
c) The function and domain expertise of the individual
contributes to the overall skill-domain mix of the
Board of Directors.
d) Independent Directors (“ID”) ideally should be
thought/ practice leaders in their respective
functions/ domains.
3. Positive attributes of Directors
Directors are expected to comply with duties as provided
in the Companies Act, 2013 (‘Act’). For reference, the
duties of the Directors as provided by the Act are as
follows:
a) act in accordance with the Articles of the Company.
b) act in good faith in order to promote the objects
of the Company for the benefit of its members as a
whole, and in the best interests of the Company,
its employees, the shareholders, the community
and for the protection of environment.
c) exercise duties with due and reasonable care, skill
and diligence and exercise independent judgment.
d) not be involved in a situation in which he may
have a direct or indirect interest that conflicts, or
possibly may conflict, with the interest of the
company.
e) not achieve or attempt to achieve any undue gain
or advantage either to himself or to his relatives,
partners, or associates.
f) not assign his office.
Independent Directors are also expected to abide
by the ‘Code for Independent Directors’ as outlined
in Schedule IV to section 149(8) of the Act. The
Code specifies the guidelines of professional
conduct, role and function and duties of
Independent Directors. The guidelines of
professional conduct specified in the Code are as
follows:
“An independent director shall:
a) uphold ethical standards of integrity and probity;
b) act objectively and constructively while exercising
his duties;
c) exercise his responsibilities in a bonafide manner
in the interest of the Company;
d) devote sufficient time and attention to his
professional obligations for informed and balanced
decision making;
e) not allow any extraneous considerations that will
vitiate his exercise of objective independent
judgment in the paramount interest of the Company
as a whole, while concurring in or dissenting from
the collective judgment of the Board in its decision
making;
f) not abuse his position to the detriment of the
Company or its shareholders or for the purpose of
gaining direct or indirect personal advantage or
advantage for any associated person;
g) refrain from any action that would lead to loss of
his independence;
h) where circumstances arise which make an
independent director lose his independence, the
independent director must immediately inform the
Board accordingly;
i) assist the company in implementing the best
corporate governance practices.”
For and on behalf of the Board
Dr. Ravi Penmetsa Peng YiranManaging Director & CEO Director & CFO
DIN: 00179939 DIN: 07675475
Place: HyderabadDate: 21-Aug-2018

ANNUAL REPORT 2017-2018
27
ANNEXURE – C (TO THE DIRECTORS’ REPORT)Form No. AOC-2
[Pursuant to clause (h) of sub-section (3) of section 134 of the Act andRule 8(2) of the Companies (Accounts) Rules, 2014]
Form for disclosure of particulars of contracts/arrangements entered into by the company with related parties referred
to in Sub Section(1) of section 188 of the Companies Act,2013 including certain arm's length transactions under third
proviso thereto:
1. Details of contracts or arrangements or transactions not at arm’s length basis
(a) Name(s) of the related party and nature of relationship NIL
(b) Nature of contracts/arrangements/transactions NIL
(c) Duration of the contracts /arrangements/transactions N.A
(d) Salient terms of the contracts or arrangements or transactions including the value, if any N.A
(e) Justification for entering into such contracts or arrangements or transactions N.A
(f) Date(s) of approval by the Board N.A
(g) Amount paid as advances, if any N.A
(h) Date on which the special resolution was passed in general meeting as required N.A
under first proviso to section 188
2. Details of contracts or arrangements or transactions at arm’s length basis
(a) Salient terms of the contracts or arrangements or transactions including the value, if any:
Nature of contracts/ Duration of Value of contracts/Sl.
Name of Related Partyarrangements/ contracts/ arrangements/
No transactions arrangements/ transactionstransactions (Rs.)
1. Dhananjaya Properties LLP Rent Payment - 20,16,000
2. Sasikala Properties LLP Rent Payment - 12,61,679
3. Sri. P.V.N. Raju Rent Payment - 2,03,772
4. Mrs. K. Jhansi Lakshmi Rent Payment - 13,58,877
5. Smt. P. Suryakantham Rent Payment - 2,03,772
6. Sri. K. Praveen Kumar Rent Payment - 86,622
7. Gland Chemicals Private Limited Purchase of raw materials - 78,25,53,329
Sale of Goods - 8,52,52,680
8. Nicomac Clean Rooms Far East Private Limited Purchase of Capital goods - 2,41,76,408
9. Moreschi Asia Doors Private Limited Purchase of Capital goods - 11,59,220
10. Gland Celsus Bio chemicals Private Limited Sale of Vehicles - 6,25,000
11. Chongqing Pharmaceutical Research Purchase of raw materials - 7,54,40,892
Institute Co., Ltd
(b) Date(s) of approval by the Board, if any: Not applicable
(c) Amount paid as advances, if any: NIL
*N.A- Not Applicable
For and on behalf of the Board
Dr. Ravi Penmetsa Peng YiranManaging Director & CEO Director & CFO
DIN: 00179939 DIN: 07675475
Place: HyderabadDate: 21-Aug-2018

AN
NU
AL R
EP
OR
T 2
017-2018
28
A. Conservation of EnergyThe Company has been taking adequate measures to reduce
energy consumption at all levels. The details of consumption
of electrical energy are given below:
POWER AND FUEL CONSUMPTION 2017-18 2016-17
a) Electricity
Units purchased 67,315,101 61,711,212
Total Amount In Rupees 410,340,083 338,518,857
Unit Rate in Rupees 6.10 5.49
b) Own generation through
Diesel Generators:
Units 1,062,866 536,413
Units per litre of Diesel Oil 3.82 3.66
Cost per Unit in Rs. 12.09 13.76
Steps taken by the Company for utilizing alternate sourcesof energy:
No alternative source of energy was used during the period
under review.
Capital investment on energy conservation equipment:Nil
Consumption per unit of production:
Products
Electricity (Units)
Coal (D/C Grade)
Others (Specify)
B. Technology absorption
RESEARCH AND DEVELOPMENT (R&D):
1. Specific areas in which Formulation Development,
R&D is carried out Analytical Method Development,
by the Company. Stability studies and Development
of new products.
2. Benefits derived as a Developed new products and
result of the above R&D achieved cost and process
efficiencies on existing products.
3. Future plan of action To develop processes for newer
products and intermediates.
4. Expenditure on R&D 2017-18 2016-17
(Rs. in Mn) (Rs. in Mn)
a) Capital 43.89 16.85
b) Recurring 619.51 583.92
c) Total 663.39 600.76
d) Total R&D Expenditure
as a Percentage of Sales 4.09% 4.03%
Since the Company manufactures differenttypes of Formulations and ActivePharmaceutical Ingredients, it is notpracticable to give consumption per unitof production.
Works on Basic Drugs and
Formulations related to the
Company’s existing activities at
various levels of Development.
Developed new products and
achieved cost and process
efficiencies on existing
products.
NIL
1. Efforts in brief, made
towards technology
absorption and
adoption.
2. Benefits derived as a
result of the above
efforts.
3. Information regards
import of technology
during the last
3 years.
Technology absorption, adaptation and innovation:
Particulars of Foreign Exchange Earnings and Outgo (Amount in Rs.)
PARTICULARS 2017-18 2016-17
1. Foreign ExchangeEarnings:
In USD 205,836,006 170,244,517
In EURO 933,552.805 3,088,756
Equivalent In INR 13,172,130,618 11,493,343,078
2. Foreign ExchangeOutgo:
Capital Expenditure
In USD 1,651,392 5,858,761
In EURO 1,386,534 2,065,628
Equivalent In INR 219,243,761 553,900,994
Revenue Expenditure
In USD 75,115,276 52,416,195
In EURO 7,298,596 6,032,912
Equivalent In INR 5,457,794,692 3,981,263,375
Payment to FinancialInstitutions - -
For and on behalf of the Board
Dr. Ravi Penmetsa Peng YiranManaging Director & CEO Director & CFO
DIN: 00179939 DIN: 07675475
Place: HyderabadDate: 21-Aug-2018
ANNEXURE – D (TO THE DIRECTORS’ REPORT)Information pursuant to Section 134(3)(m) of the Companies Act, 2013 read with
Rule 8(3) of the Companies (Accounts) Rules, 2014.

ANNUAL REPORT 2017-2018
29
A brief outline of the Company’s CSR policy, includingan overview of projects or programmes proposed to beundertaken by the Company
1. Overview :
(i) Outline of CSR policy
The ‘Gland CSR Policy’ encompasses the Company’s(Gland) philosophy of “Serving Society through Industry”and is designed to employ Company’s resources,strengths and strategies in discharging its responsibilityas a Corporate Citizen.Gland continues to strive to transform the businessenvironment in which it operates. It also works for thetransformation of the Society. The aim of Gland is tocreate an environment which enhances opportunitiesfor all the good things, better education and overallquality of living that life has to offer. Gland designs itsCSR initiatives in alignment with its objective ofenhancing the quality of life in all aspects.The Objective of the Gland CSR Policy is to:
(i) Ensure an increased commitment at all levels in theorganization, to operate its business in an economically,socially & environmentally sustainable manner, whilerecognizing the interests of all its stakeholders.
(ii) To directly or indirectly take up programs that benefitthe communities, preferably but not necessarily in &around its Plants and offices.The Corporate Social Responsibility Committee (CSRCommittee) of the Board of Directors of the Companyhas the power to approve the projects / programmes,for which the Annual CSR budget should be spent.However, the amount shall be spent on those activitiesas mentioned under Schedule VII of the Companies Act,2013 and the Rules made thereunder, as amended fromtime to time.Gland follows a project based accountability approachto assess the sustainability of the project through itsaction plan to qualify as ‘short-term’ and ‘long-term’initiatives.To ensure effective implementation of the CSR programsundertaken, a monitoring mechanism will be put in placeat the Head Office. The progress of CSR programs underimplementation at various locations will be reported toHead Office on a monthly basis and the Head Office willreport to the Committee on a quarterly basis.The CSR Department at the Head Office will conductimpact studies on a periodical basis, throughindependent professional third parties / professionalinstitutions, especially on a strategic and high valueprograms.
(ii) CSR projects:The CSR Committee is considering various options toidentify the CSR projects to be undertaken by theCompany. The various CSR activities that have beenconsidered by the Committee to be taken up in villages
in and around the Manufacturing Plants of the Companyinclude (i) Safe Drinking Water facility (ii) Street Lighting(iii) Construction of Toilets in Schools, especially forgirls (iv) Facilitating monetary assistance for educationof girls (v) Providing furniture to Government Schools,(vi) Desilting and Maintenance of Tanks and Lakes andconservation of water bodies, etc.During the financial year 2017-18, the Company hascontributed Rs. 68.23 Lakhs for ensuring environmentalsustainability, ecological balance by planting trees inalignment with the programmes undertaken by theGovernment; and for Rural Development projects.
2. Composition of CSR Committee :The CSR Committee of the Board of Directors of theCompany comprises (i) Dr. Ravi Penmetsa, ManagingDirector & CEO (ii) Mr. Moheb Ali, Independent Directorand (iii) Mr. Peng Yiran, Director & CFO.
3. Average Net Profit of the Company for last threefinancial years : Rs. 436.78 crores
4. Prescribed CSR Expenditure for Financial year 2017-18 (2% of the amount as in item 2 above): Rs. 8.73crores
5. Details of CSR Spending during the financial year:(a) Total amount to be spent during the Financial year:
Rs.8.73 crores(b) Amount unspent, if any: Rs.8.053 crores (Amount
unspent as on 31st March, 2018 : Rs. 24.38 crores)(c) Manner in which the amount was spent during the
financial year : The Company has contributed Rs.50.00 Lakhs for plantation of trees in alignmentwith ‘Haritha Haram’ programme undertaken byGovernment of Telangana. An amount of Rs. 18.22Lakhs were spent on Rural Development projectsincluding installation of CCTV cameras for increasingsecurity to women and for providing ruralinfrastructure in villages.
6. In case the Company has failed to spend the 2% ofthe average net profit of the last three financial yearsor any part thereof, reasons for not spending theamount:The Company is making efforts to identify variousprojects for spending the amount unspent.
7. Responsibility Statement of CSR Committee of Board:The CSR Committee of the Company’s Board states thatthe implementation and monitoring of CSR policy, is incompliance with CSR objectives and policy of theCompany.
For and on behalf of the Board
Dr. Ravi Penmetsa Peng YiranManaging Director & CEO Director & CFODIN: 00179939 DIN: 07675475
Place: HyderabadDate: 21-Aug-2018
ANNEXURE – E (TO THE DIRECTORS’ REPORT)ANNUAL REPORT ON CSR ACTIVITIES

AN
NU
AL R
EP
OR
T 2
017-2018
30
To,
The Members,
Gland Pharma Limited
We were appointed by the Board of Directors of Gland Pharma
Limited (“the Company”) to conduct the Secretarial Audit
for the financial year ended March 31, 2018.
We have conducted the secretarial audit of the compliance
of applicable statutory provisions and the adherence to good
corporate practices by Gland Pharma Limited (hereinafter
called the Company). Secretarial Audit was conducted in a
manner that provided us a reasonable basis for evaluating
the corporate conducts/statutory compliances and
expressing our opinion thereon.
Based on our verification of the Company’s books, papers,
minute books, forms, returns filed and other records
maintained by the company and also the information
provided by the Company, its officers, agents and authorizedrepresentatives during the conduct of secretarial audit, we
hereby report that in our opinion, the company has during
the audit period covering the financial year ended on 31st
March, 2018 complied with the statutory provisions listed
hereunder and also that the Company has proper Board-
processes and compliance mechanism in place to the extent,
in the manner and subject to the reporting made hereinafter:
We have examined the books, papers, minute books, forms
and returns filed and other records maintained by GlandPharma Limited (“the Company”) for the financial year
ended on 31st March, 2018 according to the provisions of:
I. The Companies Act, 2013 (the Act) and the rules made
there under;
II. The Depositories Act, 1996 and the Regulations and
Bye-laws framed there under;
III. Foreign Exchange Management Act,1999 and Rules and
Regulations made thereunder to the extent of Foreign
Direct Investment.
IV. The Company has identified the following general laws
which are applicable to them:
1. The Minimum Wages Act,1948
2. The Payment of Wages Act, 1936
3. The Employees’ Provident Funds & Misc.
Provisions Act 1952 and E.P.F Scheme 1952
4. The Employees’ State Insurance Act, 1948 and
Employees’ State Insurance (General)
Regulations 1950
5. The Payment of Gratuity Act 1972 and The A.P.
Payment of Gratuity Rules, 1972
6. The Contract Labour (Regulation and Abolition)
Act, 1970
7. The Employment Exchanges (Compulsory
Notification of vacancies) Act, 1959
8. The Factories Act, 1948
9. Industrial Employment (Standing Orders) Act,
1946
10. The National Festival and Other Holidays Act,
1974
11. The Maternity Benefit Act, 1961
12. The Payment of Bonus Act, 1965
13. The Shops & Establishment Act, 1988
14. The Labour Welfare Fund Act, 1987
15. The Equal Remuneration Act, 1976
16. The Child Labour (Regulation & Prohibition) Act,
1986
17. The Sexual Harassment of Women at Workplace
(Prevention, Prohibition and Redressal) Act,
2013
18. The Workmen Compensation Act
19. Industrial Disputes Act, 1947
V. The Company has identified only the following Industry
specific laws which are applicable to them:
i. Drugs and Cosmetics Act, 1940;
ii. Drugs (Price Control) Order, 1995;
iii. Narcotic Drugs and Psychotropic Substances
Act, 1985;
iv. The Drugs and Magic Remedies (Objectionable
Advertisement) Act, 1954;
v. Air (Prevention and Control of Pollution) Act,
1981;
vi. Water (Prevention and Control of Pollution)
Act, 1974;
vii. Environment Protection Act, 1986;
ANNEXURE – F (TO THE DIRECTORS’ REPORT)Form No. MR-3
[Pursuant to section 204(1) of the Companies Act, 2013 and Rule No.9 of the Companies
(Appointment and Remuneration of Managerial Personnel) Rules, 2014]
SECRETARIAL AUDIT REPORT
FOR THE FINANCIAL YEAR ENDED 31st MARCH, 2018

ANNUAL REPORT 2017-2018
31
viii. Hazardous Wastes (Management, Handling and
Transboundary Movement) Rules, 2008;
ix. Hazardous Chemicals Rules, 1989;
x. Public Liability Insurance Act, 1991;
xi. Poisons Act, 1919;
xii. Legal Metrology Act, 2009;
xiii. Petroleum Act, 1934;
xiv. Indian Electricity Act, 2003;
xv. Pharmacy Act, 1948;
xvi. Special Economic Zones Act, 2005;
We have also examined compliance with the applicable
clauses of Secretarial Standards issued by The Institute of
Company Secretaries of India (ICSI) which the company is
in the process of adopting.
During the period under review, the Company has complied
with the provisions of the Act, Rules, Regulations,
Guidelines, Standards, etc. mentioned above.
We further report that
The Board of Directors of the Company was constituted
with proper balance of Executive Directors, Non-Executive
Directors and Independent Directors. The changes in the
composition of the Board of Directors that took place during
the period under review were carried out in compliance
with the provisions of the Act.
Adequate notice was given to all directors for convening
the Board/ Committee Meetings. Agenda and detailed notes
on agenda were sent at least seven days in advance, and a
system exists for seeking and obtaining further information
and clarifications on the agenda items before the meeting
and for meaningful participation at the meeting.
During the period under review, resolutions were carried
through majority decisions. As confirmed by the
Management, there were no dissenting views expressed by
any of the members on any business transacted at the
meetings held during the period under review.
Based on the information, documents provided and the
representations made by the Company, its officers during
our audit process and also on review of the compliance
reports taken on record by the Board of Directors of the
Company periodically, in our opinion, there are adequate
systems and processes exists in the Company to
commensurate with the size and operations of the Company,
to monitor and ensure compliance with applicable laws,
rules, regulations and guidelines.
The compliance by the Company of the applicable financial
laws like direct and indirect tax laws and maintenance of
financial records and books of accounts has not been
reviewed by us since the same have been subject to review
by statutory auditors and other professionals.
We further report that following were the major eventsduring the audit period:
a. The Company has issued 942,500 Compulsorily
Convertible Preference Shares of Rs. 10/- each to Fosun
Pharma Industrial Pte. Ltd which were later converted
into 942,500 equity shares of Rs. 10/- each.
b. The Company has bought back 942,500 equity shares
of Rs. 10/- each through tender offer method.
c. The Company has amended the Articles of Association
of the Company.
d. Mr. Peng Yiran was appointed as the Chief Financial
Officer of the Company in place of Mr. B Narasimha
Rao who resigned during the year.
e. The Company has become 74% subsidiary of Fosun
Pharma Industrial Pte. Ltd.
For BS & Company Company Secretaries LLP(Formerly BS & Company, Company Secretaries)
Date: 17.08.2018 Soumya DafthardarPlace: Hyderabad Designated Partner
ACS No.: 29312
C P No.: 13199
Note: This report is to be read with our letter of even date
which is annexed as ‘Annexure’ and forms an integral part
of this report.

AN
NU
AL R
EP
OR
T 2
017-2018
32
To,The Members,Gland Pharma Limited
Hyderabad
Our report of even date is to be read with this letter.
1. Maintenance of Secretarial records is the responsibility
of the Management of the Company. Our responsibility
is to express as opinion on these secretarial records
based on our audit.
2. We have followed the audit practices and process as
were appropriate to obtain reasonable assurance about
the correctness of the contents of the Secretarial
records. The verification was done on test basis to
ensure that correct facts are reflected in secretarial
records. We believe that the processes and practices,
we followed provide a reasonable basis for our opinion.
3. We have not verified the correctness and appropriateness
of financial records and Books of Accounts of the
Company.
4. Wherever required, we have obtained the Management
representation about the compliance of applicable laws,
rules and regulations, etc.
5. The compliance of the provisions of Companies Act,
2013 and other applicable laws, Rules, Regulations,
secretarial standards issued by ICSI is the responsibility
of the Management. Our examination was limited to
the verification of procedures on test basis.
6. The Secretarial Audit report is neither an assurance as
to the future viability of the Company nor of the efficacy
or effectiveness with which the Management has
conducted the affairs of the Company.
7. We further report that, based on the information
provided by the Company, its officers, authorized
representatives during the conduct of the audit and
also on the review of quarterly compliance report by
the respective departmental heads/ Managing Director
taken on record by the Board of the Company, in our
opinion adequate systems and process and control
mechanism exist in the Company to monitor compliance
with applicable general laws like labour laws &
Environment laws and Data protection policy.
8. We further report that the compliance by the Company
of applicable fiscal laws like Direct & Indirect tax laws
have not been reviewed in this audit since the same
has been subject to review by the statutory financial
audit and other designated professionals.
For BS & Company Company Secretaries LLP(Formerly BS & Company, Company Secretaries)
Date: 17.08.2018 Soumya DafthardarPlace: Hyderabad Designated Partner
ACS No.: 29312
C P No.: 13199
ANNEXURE

ANNUAL REPORT 2017-2018
33
ANNEXURE – G(TO THE DIRECTORS’ REPORT)
Information pursuant to Rule 5(2) and 5(3) ofThe Companies (Appointment and Remuneration of Managerial Personnel) Rules, 2014
Name Dr. Ravi Penmetsa Mr. B. Narasimha Rao Mr. Srinivas Sadu Smt. K. Jhansi Lakshmi
Designation CEO & Whole-time Director & Whole-time Director & Whole-time Director
Managing Director CFO (Resigned w.e.f. COO (Resigned as WTD (Resigned w.e.f.
3rd October 2017) w.e.f. 3rd October 2017) 3rd October 2017)
Gross Remuneration Rs. 78.13 Million Rs. 5.19 Million Rs. 11.52 Million Rs.3.22 Million
Nature of Employment No specific contract No specific contract No specific contract No specific contract
Qualifications M.D M.com M.S (Industrial B.A
Pharmacy) & MBA
Experience 25 years 37 years 22 Years 23 years
Age 61 years 59 years 48 years 63 years
Date of commencement of 21-10-1992 01-01-1986 01-08-2000 15-11-1995
employment with Company
Previous Employments Medical Practitioner Nagarjuna Construction Natco Pharma Limited NIL
in U.S. Corporation (currently
known as NCC Limited)
Percentage of equity NIL NIL NIL NIL
shares held by theemployee in the Companydirectly by himself
Name of the Director Mr. P.V.N. Raju (Father) - - Mr. P.V.N. Raju (Father)
who is a relative Smt. K. Jhansi Lakshmi Dr. Ravi Penmetsa
(Sister) (Brother)
(Resigned w.e.f.
3rd Oct, 2017)
Note: Remuneration include salary, allowances, Company’s contribution to Provident Fund, Commission and perquisites
For and on behalf of the Board
Dr. Ravi Penmetsa Peng YiranManaging Director & CEO Director & CFO
DIN: 00179939 DIN: 07675475
Place: Hyderabad
Date: 21-Aug-2018

AN
NU
AL R
EP
OR
T 2
017-2018
34
Company’s Philosophy on Corporate Governance
The Company believes that all its activities should reflect
good corporate governance practices. This would ensure
efficient conduct of the affairs of the Company and help in
maximizing value for all its stakeholders. Corporate
Governance brings about sustained growth and long term
benefits for the stakeholders. It is a system by which the
organization will be driven and controlled by its commitment
to values and ethical business conduct, voluntary practices
and compliance with laws and regulations paving way to
preserving shareholders’ trust while maximizing long-term
corporate value.
The Company will continue to employ its resources, strengths
and strategies to achieve its vision, while upholding the
core values of transparency, integrity, honesty and
accountability, which are fundamental to the Company.
This philosophy is backed by the principles of concern,
commitment, quality and integration in all its acts and
relationships with its employees, customers, associates and
consumers at large which has always propelled the group
towards higher horizons. The Company follows a tradition
of fair, transparent and ethical governance practices.
The Company believes that sound governance practices and
responsible corporate behavior contribute to superior long-
term performance of the Company. The Company is
committed to adhere to good corporate governance
principles as embodied in its governance policy.
The Company will continue to implement the code of
Corporate Governance in true spirit for increasing the wealth
and long term benefits for stakeholders over a sustained
period of time.
Board of Directors
Composition
As on 31st March, 2018, The Board of Directors consists of
Nine Directors, consisting of two Executive Directors, five
Non-Executive Directors and two Independent Directors.
The Board is classified broadly as follows:
Sl. Name of theStatus Category
No. Director
1 Mr. Chen Qiyu Chairman Non-Executive
Director
2 Mr. P. V. N. Raju Honorary Promoter &
Chairman Executive Director
3 Dr. Ravi Penmetsa CEO & Promoter &
Managing Executive Director
Director
4 Mr. Peng Yiran Director & Non-Executive Director
CFO
5 Mr. Wu Yifang Director Non-Executive Director
6 Mr. Dongming Li Director Non-Executive Director
7 Ms. Guan Xiaohui Director Non-Executive Director
8 Mr. Udo J. Vetter Director Independent Director
9 Mr. Moheb Ali Director Independent Director
Board Meetings & Procedures
The Board meets at least four times in a year at quarterly
intervals and more frequently if deemed necessary, to
transact its business. Information and data that are
important to the Board’s understanding of the business in
general and relating to matters are tabled for discussion.
The Agenda and relevant enclosures are distributed to the
members of the Board sufficiently in advance of the meeting.
The meetings of the Board of Directors are generally held
at Company’s Registered Office or Plants at Hyderabad, and
are scheduled well in advance.
Number & Dates of Board Meetings held during the year
During the year, the Board met 7 times. The dates on which
the meetings were held are 27th June, 2017; 1st September,
2017; 15th September, 2017; 3rd October, 2017; 3rd October,
2017 (twice on the same day); 13th October, 2017 and 7th
February, 2018.
Attendance of the Directors at the Board Meetings during
the financial year 2017-18 and last Annual General Meeting:
Sl. Name of the Particulars
No. Director No. of Board No. of Board LastMeetings Meetings AGM
Director was Participated (27.09. entitled 2017)
to attend
1 Mr. Chen Qiyu 2 2 N.A
2 Mr. P.V.N. Raju 7 5 Yes
3 Dr. Ravi Penmetsa 7 7 Yes
4 Mr. Wu Yifang 2 2 N.A
5 Mr. Dongming Li - - N.A
6 Ms. Guan Xiaohui 2 2 N.A
7 Mr. Peng Yiran 2 2 N.A
8 Mr. Moheb Ali 7 6 Yes
9 Mr. Shao Ying 2 2 N.A
10 Mr. Udo J Vetter 5 1 No
11 Mr. Srinivas Sadu 5 5 No
12 Mr. B. Narasimha Rao 5 5 Yes
13 Mr. Karan Swani 5 1 No
14 Mr. Sanjay Nayar 5 - No
15 Mr. D. S. Brar 7 1 No
16 Mrs. K. Jhansi Lakshmi 5 5 Yes
CORPORATE GOVERNANCE

ANNUAL REPORT 2017-2018
35
General Body Meetings
Particulars of last three Annual General Meetings:
AGM Year ended Venue Date Time
39th 31-03-2017 Flat No. 201, Greenland Apartments, Ameerpet, 27.09.2017 11.00 A.M
Hyderabad-500 016
38th 31-03-2016 Flat No. 201, Greenland Apartments, Ameerpet, 26.09.2016 11.00 A.M
Hyderabad-500 016
37th 31-03-2015 Flat No. 201, Greenland Apartments, Ameerpet, 28.09.2015 11.00 A.M
Hyderabad-500 016
General Shareholder Information
1. Annual General Meeting
Date : 17th September, 2018
Time : 11:00 A.M.
Venue : Registered Office at Flat No. 201, Greenland Apartments, Ameerpet,
Hyderabad-500 016.
2. Financial Year : From 1st April 2017 to 31st March 2018.
Address for correspondence (Registered Office)
The Company Secretary
Gland Pharma Limited
# 6-3-865/1/2, Flat No. 201, Greenland Apartments
Ameerpet, Hyderabad-500 016
E-Mail: [email protected]
For and on behalf of the Board
Dr. Ravi Penmetsa Peng YiranManaging Director & CEO Director & CFO
DIN: 00179939 DIN: 07675475
Place: Hyderabad
Date: 21-Aug-2018

AN
NU
AL R
EP
OR
T 2
017-2018
36
Overview
The financial statements have been prepared in compliance
with the requirements of the Companies Act, 2013 and
Generally Accepted Accounting Principles (GAAP) in India.
These estimates and judgments relating to the financial
statements have been made on a prudent and reasonable
basis, in order that the statements reflect, in a true and
fair manner, the state of affairs and profits for the year.
This report may also contain certain statements, published
in various research reports and magazines, that the Company
believes are or may be considered to be ‘forward looking
statements’ which are subject to certain risks and
uncertainties.
Global Economy:
The global economy remains trapped in a prolonged period
of slow economic growth and dwindling international trade
growth. The weaker-than-expected growth performances in
Japan, the United States of America and in several countries
in Africa, the Commonwealth of Independent States (CIS)
and Latin America and the Caribbean have contributed to
this downward revision relative to forecasts presented in
the World Economic Situation and Prospects (WESP) 2016
(United Nations, 2016). The prolonged sluggishness in the
global economy has been characterized by a widespread
slowdown of productivity growth in many parts of the world,
weak investment, low wage growth, low inflation and rising
debt levels. The relatively slow pace of economic growth
will hamper progress towards achieving the Sustainable
Development Goals (SDGs), as defined in the 2030 Agenda
for Sustainable Development, which was adopted by the
Member States of the United Nations in 2015. If downside
risks to the outlook were to materialize, this could push
global growth rates down even further, with additional
setbacks towards achieving the SDGs, particularly the goals
of eradicating extreme poverty and creating decent work
for all.
Source: World Economic Situation and Prospects (WESP)
Activity in advanced economies is expected to grow 2.2
percent in 2018 before easing to a 2 percent rate of
expansion next year, as central banks gradually remove
monetary stimulus. Growth in emerging market and
developing economies overall is projected to strengthen to
4.5 percent in 2018, before reaching 4.7 percent in 2019
as the recovery in commodity exporters matures and
commodity prices level off following this year’s increase.
(Source: Global Economic Prospects, A World Bank GroupFlagship Report)
In emerging market and developing economies, growth came
primarily from acceleration in private consumption and an
end to the investment contractions in commodity exporting
countries. Amongst these, growth in China and India was
supported by resurgent net exports and strong private
consumption respectively, whereas improved commodity
exports and easing of monetary policy were key drivers of
the growth in Russia and Brazil.
Global growth is projected to further strengthen to 3.9%
in 2018 and 2019. This short term growth is anticipated in
advanced economies by positive macroeconomic effects of
the December 2017 US tax reform and stronger prospects
in euro market countries and in emerging market.
Global Pharma Market
The global pharmaceutical sales grew by around 3% in the
year 2017 compared to the year 2016 and key growth drivers
continue to be shifted towards use of generic medicines
accompanied by patent expiries mainly in the regulated
market and higher growth in Pharmerging markets. The
largest pharmaceutical market, US is estimated to be
approximately US$ 453 Bn in 2017 registering a growth of
around 1.4% (compared to 5.8% in 2016). Lower price
increases for the protected branded products, price erosion
for generics along with lower growth from new product
launches led to reduced growth rate in 2017. The market is
expected to grow at a CAGR of 4% to 7% through 2022 due
to launches of more innovative medicines, and be offset by
slower price growth and the increasing impact of patent
expiries. The global spending on medicines is forecasted to
reach close to US$ 1.4 trillion by 2022, an increase of
about 26% over the 2017 level, growing at 3% to 6% slower
than 6.2% growth over prior five years. Developed market
spending growth will be driven by original brands and
innovation in specialty medicines.
Global generics market
The global generic drug market is estimated to grow at
10.8% CAGR for the 2016-21 period to reach US$ 380.6 Bn
by 2021. Governments worldwide are facing pressures of
rising healthcare costs, thus emphasising on the importance
of generics and their role in making pharmaceutical products
affordable to those in need. Patent expiry for branded drugs
in developed markets has a bearing on the potential of
generics in those markets. In the emerging world, the
branded generics markets will be driven primarily by rising
per capita incomes, increasing healthcare awareness and
enhanced incidence of chronic ailments. In terms of value
and volumes, generics now make up around 28% and 80%
respectively, of drugs dispensed around the world and that
MANAGEMENT DISCUSSION AND ANALYSIS

ANNUAL REPORT 2017-2018
37
percentage will continue to grow as more drugs lose patent
protection. The market of the generic drugs consists of both
branded generics and non-branded generics. US is currently
dominating world’s generic market. With 90% of
prescriptions being dispensed in 2017 being generics, it
currently represents a multi-billion dollar industry. The
biggest catalysts of this industry being lower priced generics
launched after patent expiries of branded drugs, rising
ageing population, increasing prevalence of chronic
diseases, continuous efforts by Government and health care
service providers to control their healthcare expenditures,
etc. are expected to fuel growth in coming years. Amongst
emerging economies, China, India, Brazil and Russia are
expected to exhibit a significant increase in generic volume
growth.
Opportunities for generics remain strong and positive across
the globe, with an increasing demand for affordable, safe,
and effective medicines. The need to control costs remains
a challenge for healthcare providers around the world. The
availability of cost-effective, safe generic alternatives offers
a tool that can be used to balance access to and affordability
of many -major therapies required to maintain a healthy
population of patients across multiple disease areas.
Generic Injectables
The global generic injectables market was valued at over
US$ 110 Bn in 2018 and is projected to expand at a CAGR
of around 13.6% during the forecast period from 2018 to
2025. Rise in pressure to increase health care costs, growth
in demand for affordable medicines, expected loss of patents
during the forecast period, surge in adoption of biosimilar
products, increase in research & development activities for
the development of complex molecules suitable for injectable
dosage forms, and technological advancements in the form
of premixes and prefilled syringes are expected to propel
the global generic injectables market. However, uncertainty
of regulations in the U.S. for large molecule generic
injectables, complexity of the formulation, requirement for
high initial investment for injectable manufacturing plant,
and stringent regulatory requirements governing sterility
requirements of injectables are preventing the entry of new
players in the global generic injectables market.
The large molecule injectables segment is anticipated to
expand at a rapid pace due to expected patent expiry of
blockbuster molecules, rise in incidence of cancer, and
rapidly increasing new product launches.
The vials segment held a major share of the market in 2016.
However, the prefilled syringes segment is projected to
expand at a rapid pace during the forecast period. This is
attributed to increase new product launches in the segment,
surge in adoption of technologically advanced products,
and rise in self-administration of injectables. Moreover, dose
accuracy and ease of administration are major benefits of
prefilled syringe container type. Prefilled syringes are largely
used for the administration of vaccines, blood stimulants,
and therapeutic proteins.
The oncology segment is expected to dominate the global
generic injectables market due to rise in incidence of cancer,
increase in demand for oncology biosimilars, and large
number of pipeline products.
Geographically, the global generic injectables market has
been segmented into North America, Europe, Asia Pacific,
Latin America, and Middle East & Africa. Asia Pacific
dominates the global generic injectables market due to high
consumption of generic injectable products owing to their
affordability over high cost biological and branded products.
Moreover, surge in government initiatives to increase
adoption of generic products, government support to start
a generic medical store, high prevalence of infectious and
lifestyle diseases in the region are some factors that are
projected to boost the generic injectables market in the
region during the forecast period. For example, in 2016,
the Government of India launched a scheme named Pradhan
Mantri Jan Aushadhi Yojana to support the establishment
of generic medical stores in rural areas.
North America is expected to account for the second largest
share of the global generic injectables market by 2025 due
to expected new abbreviated new drug application (ANDA)
approvals by 2020, patent loss of blockbuster biological
drugs prescribed in key therapeutic areas such as oncology,
and increasing shortages of the generic injectables in the
U.S. Europe is a favorable market for biosimilar product
launches due to well-established regulations. Moreover,
government initiative to reduce the burden of health care
cost by supporting the use of generic medicines is making
the market expand at a considerable pace.
(Source: Transparency Market Research)
Global Oncology Trends 2018
The number of approved cancer therapies continues to rise,
with 63 cancer drugs launching within the past five years.
Of the 14 New Active Substance cancer therapeutics
launched in 2017 alone, all of them were targeted therapies
and 11 of them were granted Breakthrough Therapy
designations by the FDA. Global spending on cancer
medicines continues to rise with therapeutic and supportive
care use at $133 billion globally in 2017, up from $96
billion in 2013. Spending on cancer medicines is heavily
concentrated among a handful of therapies, with the top
35 drugs accounting for 80% of total spending, while over
half of cancer drugs have less than $90 million in annual
sales. List prices of new cancer drugs at launch have risen

AN
NU
AL R
EP
OR
T 2
017-2018
38
steadily over the past decade, and the median annual cost
of a new cancer drug launched in 2017 exceeded $150,000
compared to $79,000 for the new cancer drugs launched in
2013.
(Source: IQVIA Institute for Human Data Science Study)
India – Pharmaceutical Scenario:
India is the largest provider of generic drugs globally with
the Indian generics accounting for 20% of the global exports
in terms of volume. Branded generics dominate the Indian
pharmaceuticals market, constituting nearly 70 to 80% of
the market. Of late, consolidation has become an important
characteristic of the Indian Pharmaceutical Market (IPM)
as the industry is highly fragmented.
Indian pharmaceuticals market is expected to touch USD
55 Bn (including Exports) by 2020 from USD 36.7 Bn in
2016, growing at a compound annual growth rate (CAGR)
of 15.92%. By 2020, India is likely to be among the top
three pharmaceutical markets by incremental growth and
sixth largest market globally in absolute size. India’s
Pharmaceutical industry has filed the highest number of
Drug Master Files (DMFS) with USFDA and by the end of
year 2016, number of filings stands at 3,950. India’s
Abbreviated New Drug Applications (ANDAs) totaling over
4,000 by June 2017. India’s total exports of Pharmaceuticals
(APIs, Generics and Alternative system of medicine) during
2016-17 was USD 16.8 Bn. India has a market share of
almost 42% of Generic drugs produced globally, a market
size of Africa and Middle East put together. North America
is India’s largest export market, receiving over 34% of India’s
pharmaceuticals exports. Africa is the second largest,
receiving over 19% of India’s exports.
Source: http://www.makeinindia.com/sector/
pharmaceuticals
India’s pharma exports grew 2.91% to $17.27 billion in
2017-18, according to the Pharma Export Promotion Council.
India’s pharma exports to China increased 44% to $182.67
million in 2017-18.
Financial Performance of the Drugs and PharmaceuticalsIndustry
l Indian pharmaceutical market grew 5.5 per cent in
CY2017 in terms of moving annual turnover. In March
2018, the market grew at 9.5 per cent year-on-year
with sales of Rs 10,029 crore (US$ 1.56 billion).
l By 2020, India is likely to be among the top three
pharmaceutical markets by incremental growth and 6th
largest market globally in absolute size.
l Increase in the size of middle class households coupled
with the improvement in medical infrastructure and
increase in the penetration of health insurance in the
country will also influence in the growth of
pharmaceuticals sector.
GLAND PHARMA
Gland Pharma Facilities have been audited by various
Regulatory Authorities like USFDA, ANVISA, DCA, MHRA,
etc. and obtaining clearance without any serious
qualifications, on a regular basis. The Company is expected
to launch some new products in the Regulated Markets this
year and is also planning to file new ANDAs. Your Company
strives to introduce new products in the Existing as well as
New Markets and consistently increase its Revenue and
Margins.
Internal Control System
The Company has a well-established internal control
framework, which is designed to assess the adequacy and
effectiveness of financial and operational controls. The
management is committed to ensuring an effective internal
control environment, commensurate with the size and
complexity of the business, which provides an assurance
on compliance with internal policies, applicable laws,
regulations and protection of resources and assets.
The Financial Statements are prepared on the basis of the
Significant Accounting Policies which are reviewed and
updated from time to time. Your Company has in place
adequate internal financial controls with reference to the
Financial Statements. Such controls have been assessed
during the year taking into consideration the essential
components of internal controls stated in the Guidance Note
on Audit of Internal Financial Controls over Financial
Reporting issued by The Institute of Chartered Accountants
of India. The Audit Committee of the Board review reports
submitted by the independent internal auditors and monitor
follow-up and corrective action. Nonetheless your Company
recognizes that any internal control framework, no matter
how well designed, has inherent limitations and accordingly,
regular audit and review processes ensure that such systems
are reinforced on an ongoing basis.
RISK MANAGEMENT
The pharmaceutical industry is highly volatile and
competition arises from manufacturers who have similar
production facilities manufacturing products at competitive
prices. Retention of Human resources with similar skills,
talents and experiences poses continuous risk in the industry.
Nonetheless there is a risk of inability to maintain current
margins on the products with fluctuations in market prices
world-wide. Unforeseen changes in the regulatory
environment could lead to operational disruptions.
ANNUAL REPORT 2017-2018
39
Gland Pharma endeavors to continually sharpen its Risk
Management systems and processes in line with a rapidly
changing business environment. The Company is regularly
training its human resources with regulatory developments
and ensures conformance of the guidelines across the plants.
QUALITY MANAGEMENT
Gland Pharma is committed to implementing a robust quality
management system and has distinct procedures and systems
in every facility to maintain global quality standards, and
to ensure compliance with the requirements of the Current
Good Manufacturing Practices (cGMP), WHO and GMP. Gland
Pharma ensures that its operating procedures meet the
standards of global regulators like USFDA. The Company
has well-trained personnel for quality control at each site,
who ensure strict adherence to quality systems and
procedures.
Cautionary statement:
Some of the statements contained in this report may be
forward looking statements within the meaning of applicable
laws and regulations. Actual results may differ from those
expressed or implied. Factors that could make significant
difference to the company’s operations include economic
conditions, government regulations, etc. on which the
company does not have any direct control.

AN
NU
AL R
EP
OR
T 2
017-2018
40
To the Members of Gland Pharma Limited
Report on the Ind AS Financial Statements
We have audited the accompanying Ind AS financial statements of Gland
Pharma Limited (“the Company”), which comprise the Balance Sheet as
at March 31, 2018, the Statement of Profit and Loss, including the
Statement of Other Comprehensive Income, the Cash Flow Statement and
the Statement of Changes in Equity for the year then ended, and a summary
of significant accounting policies and other explanatory information.
Management’s Responsibility for the Ind AS Financial Statements
The Company’s Board of Directors is responsible for the matters stated in
Section 134(5) of the Companies Act, 2013 (“the Act”) with respect to
the preparation of these Ind AS financial statements that give a true and
fair view of the financial position, financial performance including other
comprehensive income, cash flows and changes in equity of the Company
in accordance with accounting principles generally accepted in India,
including the Indian Accounting Standards (Ind AS) specified under section
133 of the Act., read with the Companies (Indian Accounting Standards)
Rules, 2015, as amended. This responsibility also includes maintenance
of adequate accounting records in accordance with the provisions of the
Act for safeguarding of the assets of the Company and for preventing and
detecting frauds and other irregularities; selection and application of
appropriate accounting policies; making judgments and estimates that
are reasonable and prudent; and the design, implementation and
maintenance of adequate internal financial control that were operating
effectively for ensuring the accuracy and completeness of the accounting
records, relevant to the preparation and presentation of the Ind AS financial
statements that give a true and fair view and are free from material
misstatement, whether due to fraud or error.
Auditor’s Responsibility
Our responsibility is to express an opinion on these Ind AS financial
statements based on our audit. We have taken into account the provisions
of the Act, the accounting and auditing standards and matters which are
required to be included in the audit report under the provisions of the Act
and the Rules made thereunder. We conducted our audit of the Ind AS
financial statements in accordance with the Standards on Auditing, issued
by the Institute of Chartered Accountants of India, as specified under
Section 143(10) of the Act. Those Standards require that we comply with
ethical requirements and plan and perform the audit to obtain reasonable
assurance about whether the financial statements are free from material
misstatement.
An audit involves performing procedures to obtain audit evidence about
the amounts and disclosures in the financial statements. The procedures
selected depend on the auditor’s judgment, including the assessment of
the risks of material misstatement of the Ind AS financial statements,
whether due to fraud or error. In making those risk assessments, the
auditor considers internal financial control relevant to the Company’s
preparation of the Ind AS financial statements that give a true and fair
view in order to design audit procedures that are appropriate in the
circumstances. An audit also includes evaluating the appropriateness of
accounting policies used and the reasonableness of the accounting
estimates made by the Company’s Directors, as well as evaluating the
overall presentation of the Ind AS financial statements. We believe that
the audit evidence we have obtained is sufficient and appropriate to
provide a basis for our audit opinion on the Ind AS financial statements.
Opinion
In our opinion and to the best of our information and according to the
explanations given to us, the Ind AS financial statements give the
information required by the Actin the manner so required and give a true
and fair view in conformity with the accounting principles generally
accepted in India, of the state of affairs of the Company as at March 31,
2018, its profit including other comprehensive income, its cash flows and
the changes in equity for the year ended on that date.
Report on Other Legal and Regulatory Requirements
1. As required by the Companies (Auditor’s report) Order, 2016 (“the
Order”) issued by the Central Government of India in terms of sub-
section (11) of section 143 of the Act, we give in the Annexure 1 a
statement on the matters specified in paragraphs 3 and 4 of the
Order.
2. As required by section 143(3) of the Act, we report that:
(a) We have sought and obtained all the information and
explanations which to the best of our knowledge and belief
were necessary for the purpose of our audit;
(b) In our opinion, proper books of account as required by law
have been kept by the Company so far as it appears from our
examination of those books;
(c) The Balance Sheet, Statement of Profit and Loss including the
Statement of Other Comprehensive Income, the Cash Flow
Statement and Statement of Changes in Equity dealt with by
this Report are in agreement with the books of account;
(d) In our opinion, the aforesaid Ind AS financial statements comply
with the Indian Accounting Standards specified under section
133 of the Act, read with Companies (Indian Accounting
Standards) Rules, 2015, as amended;
(e) On the basis of written representations received from the
directors as on March 31, 2018 and taken on record by the
Board of Directors, none of the directors is disqualified as on
March 31, 2018 from being appointed as a director in terms of
section 164 (2) of the Act;
(f) With respect to the adequacy of the internal financial controls
over financial reporting of the Company with reference to these
Ind AS financial statements and the operating effectiveness of
such controls, refer to our separate Report in “Annexure 2” to
this report;
(g) With respect to the other matters to be included in the Auditor’s
Report in accordance with Rule 11 of the Companies (Audit
and Auditors) Rules, 2014, as amended, in our opinion and to
the best of our information and according to the explanations
given to us:
i. The Company has disclosed the impact of pending
litigations on its financial position in its Ind AS financial
statements – Refer Note 39 to the Ind AS financial
statements;
ii. The Company did not have any long-term contracts
including derivative contracts for which there were any
material foreseeable losses; and
iii. There were no amounts which were required to be
transferred to the Investor Education and Protection Fund
by the Company.
For S.R. Batliboi & Associates LLPChartered Accountants
ICAI Firm Registration Number: 101049W/E300004
per Navneet Rai KabraPartner
Membership Number: 102328
Place of Signature: Hyderabad
Date: August 21, 2018
INDEPENDENT AUDITOR’S REPORT

ANNUAL REPORT 2017-2018
41
Name of the Nature of Amount Amount paid Period to Forum wherestatute dues demanded under dispute which the dispute is pending
(Rs. in mn) (Rs. in mn) amount relates
Central Excise Act, 1944 Excise Duty 30.56 5.00 2001-2003 Customs, Excise and Service Tax
Appellate Tribunal
Central Excise Act, 1944 Excise Duty 0.99 0.07 2014 - 2015 Assistant Commissioner,
July 2011 Hyderabad
Central Excise Act, 1944 Excise Duty 1.00 0.10 2012 - 2014 Customs, Excise and Service Tax
Appellate Tribunal
Central Excise Act, 1944 Excise Duty 2.45* 0.18 2014 - 2015 Customs, Excise and Service Tax
Appellate Tribunal
Finance Act, 1994 Service Tax 28.12* 1.49 2009 - 2014 Customs, Excise and Service Tax
Appellate Tribunal
(i) (a) The Company has maintained proper records
showing full particulars, including quantitative
details and situation of fixed assets.
(b) All fixed assets have not been physically verified
by the management during the year ending but
there is a regular programme of verification
which, in our opinion, is reasonable having
regard to the size of the Company and the nature
of its assets. No material discrepancies were
noticed on such verification.
(c) According to the information and explanations
given by the management, the title deeds of
immovable properties included in property, plant
and equipment are held in the name of the
Company.
(ii) The management has conducted physical verification
of inventory at reasonable intervals during the year
and no material discrepancies were noticed on such
physical verification.
(iii) According to the information and explanations given
to us, the Company has not granted any loans, secured
or unsecured to companies, firms, limited liability
partnerships or other parties covered in the register
maintained under section 189 of the Companies Act,
2013. Accordingly, the provisions of clause 3(iii) (a),
(b) and (c) of the Order are not applicable to the
Company and hence not commented upon.
(iv) In our opinion and according to the information and
explanations given to us, there are no loans,
investments, guarantees, and securities given in
respect of which provisions of section 185 and 186 of
the Companies Act, 2013 are applicable to the
Company and hence not commented upon.
(v) The Company has not accepted any deposits within
the meaning of Sections 73 to 76 of the Act and the
Companies (Acceptance of Deposits) Rules, 2014 (asamended). Accordingly, the provisions of clause 3(v)of the Order are not applicable to the Company andhence not commented upon.
(vi) We have broadly reviewed the books of accountmaintained by the Company pursuant to the rules madeby the Central Government for the maintenance ofcost records under section 148(1) of the CompaniesAct, 2013, related to the manufacture of ActivePharmaceutical Ingredients and Formulations includingIntermediates and services of contract research, andare of the opinion that prima facie, the specifiedaccounts and records have been made and maintained.We have not, however, made a detailed examinationof the same.
(vii) (a) Undisputed statutory dues including providentfund, employees’ state insurance, income-tax,sales-tax, service tax, goods and service tax,duty of custom, duty of excise, value added tax,cess and other material statutory dues havegenerally been regularly deposited with theappropriate authorities though there has beena slight delay in a few cases.
(b) According to the information and explanationsgiven to us, no undisputed amounts payable inrespect of provident fund, employees’ stateinsurance, income-tax, service tax, goods andservice tax, sales-tax, duty of custom, duty ofexcise, value added tax, cess and other materialstatutory dues were outstanding, at the yearend, for a period of more than six months fromthe date they became payable.
(c) According to the records of the Company, thedues of income-tax, sales-tax, service tax, dutyof custom, duty of excise , value added tax andcess on account of any dispute, are as follows:
ANNEXURE TO THE AUDIT REPORTAnnexure 1 referred to in paragraph 1 of our report of even date
Re: Gland Pharma Limited ('the Company')

AN
NU
AL R
EP
OR
T 2
017-2018
42
*Including penalty. #Paid subsequent to year end.
(viii) In our opinion and according to the information andexplanations given by the management, the Companyhas not defaulted in repayment of sales tax loan tothe government. The Company has no outstandingdues in respect of banks, financial institutions anddebenture holders.
(ix) According to the information and explanations givenby the management, the Company has not raised anymoney way of initial public offer / further public offer/ debt instruments and term loans hence, reportingunder clause (ix) is not applicable to the Companyand hence not commented upon.
(x) Based upon the audit procedures performed for thepurpose of reporting the true and fair view of thefinancial statements and according to the informationand explanations given by the management, we reportthat no fraud by the Company or no fraud on theCompany by the officers and employees of theCompany has been noticed or reported during the year.
(xi) According to the information and explanations givenby the management, the managerial remuneration hasbeen paid / provided in accordance with the requisiteapprovals mandated by the provisions of section 197read with Schedule V to the Companies Act, 2013.
(xii) In our opinion, the Company is not a nidhi Company.Therefore, the provisions of clause (xii) of the orderare not applicable to the Company and hence notcommented upon.
(xiii) According to the information and explanations givenby the management, transactions with the related
parties are in compliance with section 177 and 188of Companies Act, 2013 where applicable and thedetails have been disclosed in the notes to thefinancial statements, as required by the applicableaccounting standards.
(xiv) According to the information and explanations givenby the management, the Company has complied withprovisions of section 42 of the Companies Act, 2013in respect of the private placement of shares duringthe year. According to the information andexplanations given by the management, we report thatthe amounts raised, have been used for the purposesfor which the funds were raised. The Company hasnot made any preferential allotment or fully or partlyconvertible debentures during the year.
(xv) According to the information and explanations givenby the management, the Company has not enteredinto any non-cash transactions with directors orpersons connected with him as referred to in section192 of Companies Act, 2013.
(xvi) According to the information and explanations givento us, the provisions of section 45-IA of the ReserveBank of India Act, 1934 are not applicable to theCompany.
For S.R. Batliboi & Associates LLPChartered Accountants
ICAI Firm Registration Number: 101049W/E300004
per Navneet Rai KabraPartner
Membership Number: 102328
Place of Signature: Hyderabad
Date: August 21, 2018
Name of the Nature of Amount Amount paid Period to Forum wherestatute dues demanded under dispute which the dispute is pending
(Rs. in mn) (Rs. in mn) amount relates
Finance Act, 1994 Service Tax 0.37 0.37 2004 - 2006 Customs, Excise and Service Tax
Appellate Tribunal
Finance Act, 1994 Service Tax 15.08* 1.02 2014 - 2015 Customs, Excise and Service Tax
Appellate Tribunal
Finance Act, 1994 Service Tax 2.72* 0.10 2014 - 2015 Customs, Excise and Service Tax
Appellate Tribunal
Finance Act, 1994 Service Tax 13.21 - 2015 - 2016 Additional Commissioner,
Hyderabad
Finance Act, 1994 Service Tax 0.94 - 2015 - 2016 Principal Commissioner, Hyderabad
Finance Act, 1994 Service Tax 86.12 - 2015 - 2016 Principal Commissioner, Hyderabad
Finance Act, 1994 Service Tax 734.22* 27.53 2010 - 2011 and Customs, Excise and Service Tax
2012 - 2015 Appellate Tribunal
Value Added Tax Act, 2005 Value Added 1.73 1.73 2012-13 and Telangana Value Added Tax
and CST Act, 1956 Tax and CST 2013-2014 Appellate Tribunal
Entry tax of Goods into Entry Tax 44.40 22.20# 2010-11 to High court, Hyderabad
Local Areas Act, 2001 2015-2016
Andhra Pradesh VAT Act, Sales tax 0.99 0.12 1998 -1999 to Appellate Joint Commissioner
2005 2001 - 2002 (Sales tax, Hyderabad)
Income Tax Act, 1961 Income Tax 0.86 0.86 2006– 2007 and Deputy Commissioner of
2007-2008 Income Tax
Income Tax Act, 1961 Income Tax 143.04 - 2013 - 2014 Commissioner of Income Tax

ANNUAL REPORT 2017-2018
43
Report on the Internal Financial Controls under Clause (i) ofSub-section 3 of Section 143 of the Companies Act, 2013(“the Act”)
We have audited the internal financial controls over financial
reporting of Gland Pharma Limited (“the Company”) as of
March 31, 2018 in conjunction with our audit of the financial
statements of the Company for the year ended on that date.
Management’s Responsibility for Internal Financial Controls
The Company’s Management is responsible for establishing and
maintaining internal financial controls based on the internal
control over financial reporting criteria established by the
Company considering the essential components of internal control
stated in the Guidance Note on Audit of Internal Financial Controls
Over Financial Reporting issued by the Institute of Chartered
Accountants of India. These responsibilities include the design,
implementation and maintenance of adequate internal financial
controls that were operating effectively for ensuring the orderly
and efficient conduct of its business, including adherence to the
Company’s policies, the safeguarding of its assets, the prevention
and detection of frauds and errors, the accuracy and completeness
of the accounting records, and the timely preparation of reliable
financial information, as required under the Companies Act, 2013.
Auditor’s Responsibility
Our responsibility is to express an opinion on the Company’s
internal financial controls over financial reporting with reference
to these financial statements based on our audit. We conducted
our audit in accordance with the Guidance Note on Audit of
Internal Financial Controls Over Financial Reporting (the
“Guidance Note”) and the Standards on Auditing as specified
under section 143(10) of the Companies Act, 2013; to the extent
applicable to an audit of internal financial controls and, both
issued by the Institute of Chartered Accountants of India. Those
Standards and the Guidance Note require that we comply with
ethical requirements and plan and perform the audit to obtain
reasonable assurance about whether adequate internal financial
controls over financial reporting with reference to these financial
statements was established and maintained and if such controls
operated effectively in all material respects.
Our audit involves performing procedures to obtain audit evidence
about the adequacy of the internal financial controls over financial
reporting with reference to these financial statements and their
operating effectiveness. Our audit of internal financial controls
over financial reporting included obtaining an understanding of
internal financial controls over financial reporting with reference
to these financial statements, assessing the risk that a material
weakness exists, and testing and evaluating the design and
operating effectiveness of internal control based on the assessed
risk. The procedures selected depend on the auditor’s judgement,
including the assessment of the risks of material misstatement of
the financial statements, whether due to fraud or error.
We believe that the audit evidence we have obtained is sufficient
and appropriate to provide a basis for our audit opinion on the
internal financial controls over financial reporting with reference
to these financial statements.
Meaning of Internal Financial Controls Over Financial Reportingwith reference to these Financial Statements
A Company’s internal financial control over financial reporting
with reference to these financial statements is a process designed
to provide reasonable assurance regarding the reliability of
financial reporting and the preparation of financial statements
for external purposes in accordance with generally accepted
accounting principles. A Company’s internal financial control over
financial reporting with reference to these financial statements
includes those policies and procedures that (1) pertain to the
maintenance of records that, in reasonable detail, accurately and
fairly reflect the transactions and dispositions of the assets of
the Company; (2) provide reasonable assurance that transactions
are recorded as necessary to permit preparation of financial
statements in accordance with generally accepted accounting
principles, and that receipts and expenditures of the Company
are being made only in accordance with authorisations of
management and directors of the Company; and (3) provide
reasonable assurance regarding prevention or timely detection of
unauthorised acquisition, use, or disposition of the Company’s
assets that could have a material effect on the financial statements.
Inherent Limitations of Internal Financial Controls overFinancial Reporting with reference to these FinancialStatements
Because of the inherent limitations of internal financial controls
over financial reporting with reference to these financial
statements, including the possibility of collusion or improper
management override of controls, material misstatements due to
error or fraud may occur and not be detected. Also, projections of
any evaluation of the internal financial controls over financial
reporting with reference to these financial statements to future
periods are subject to the risk that the internal financial control
over financial reporting with reference to these financial
statements may become inadequate because of changes in
conditions, or that the degree of compliance with the policies or
procedures may deteriorate.
Opinion
In our opinion, the Company has, in all material respects, adequate
internal financial controls over financial reporting with reference
to these financial statements and such internal financial controls
over financial reporting with reference to these financial
statements were operating effectively as at March 31, 2018, based
on the internal control over financial reporting criteria established
by the Company considering the essential components of internal
control stated in the Guidance Note on Audit of Internal Financial
Controls Over Financial Reporting issued by the Institute of
Chartered Accountants of India.
For S.R. Batliboi & Associates LLPChartered AccountantsICAI Firm Registration Number: 101049W/E300004
per Navneet Rai KabraPartnerMembership Number: 102328
Place of Signature: HyderabadDate: August 21, 2018
ANNEXURE TO THE AUDIT REPORTAnnexure 2 to the Independent Auditor’s report of even date on the
financial statements of Gland Pharma Limited

AN
NU
AL R
EP
OR
T 2
017-2018
44
Balance sheet as at March 31, 2018(All amounts in Indian Rupees millions, except share data and where otherwise stated)
NoteAs at As at
March 31, 2018 March 31, 2017
ASSETSNon-current assetsProperty, plant and equipment 3 8,426.41 8,715.81
Capital work in progress 3 1,988.82 1,611.50
Financial assets
Loans 4 58.84 55.68
Other non-current financial assets 5 2.04 -
Non-current tax assets (net) 7 198.36 196.07
Other non-current assets 8 99.15 76.89
10,773.62 10,655.95
Current assetsInventories 9 5,128.30 3,787.19
Financial assets
Loans 4 4.73 4.00
Trade receivables 6 4,752.10 4,178.73
Cash and cash equivalents 10 3,728.41 5,330.77
Bank balances other than cash and cash equivalents 11 2,979.98 -
Other current financial assets 5 32.31 4.42
Other current assets 8 1,883.96 776.39
18,509.79 14,081.50
Total Assets 29,283.41 24,737.45
EQUITY AND LIABILITIESEquityEquity share capital 12 154.95 154.95
Other equity 13 23,949.27 20,743.16
24,104.22 20,898.11
LiabilitiesNon-current liabilitiesFinancial liabilities
Borrowings 14 54.89 59.16
Other financial liabilities 16 381.33 392.55
Deferred tax liability (net) 17 957.47 853.79
1,393.69 1,305.50
Current liabilitiesFinancial liabilities
Trade payables 15 2,924.15 1,892.89
Other financial liabilities 16 142.78 114.86
Provisions 18 21.09 22.25
Current tax liabilities (net) 19 129.00 -
Other current liabilities 20 568.48 503.84
3,785.50 2,533.84
Total equity and liabilities 29,283.41 24,737.45
Summary of significant accounting policies 2.1
The accompanying notes form an integral part of the financial statements.
As per our report of even date attached
For S.R.BATLIBOI & ASSOCIATES LLP For and on behalf of the Board of DirectorsChartered Accountants Gland Pharma LimitedICAI Firm Registration Number : 101049W/E300004
per Navneet Rai Kabra Dr. Ravi Penmetsa Guan XiaohuiPartner Managing Director and Chief Executive Officer DirectorMembership No. 102328 DIN: 0179939 DIN: 07675466
Yiran Peng P. Sampath KumarDirector and Chief Financial Officer Company SecretaryDIN: 07675475
Place: Hyderabad, Date: August 21, 2018 Place: Hyderabad, Date: August 21, 2018
CIN: U24239AP1978PLC002276

ANNUAL REPORT 2017-2018
45
Statement of Profit and Loss for the year ended March 31, 2018(All amounts in Indian Rupees millions, except share data and where otherwise stated)
NoteFor the year ended For the year ended
March 31, 2018 March 31, 2017
INCOMERevenue from operations (Gross) 21 16,228.93 14,916.27
Other income 22 487.89 335.61
Total income (I) 16,716.82 15,251.88
EXPENSESCost of materials consumed 23 7,182.98 4,506.65
Purchase of traded goods 91.22 126.94
(Increase)/decrease in inventories of finished goods, 24 (666.66) 463.72
stock-in-trade and work-in-progress
Excise duty on sale of goods 29.52 124.51
Power and fuel 603.52 492.42
Employee benefits expense 25 1,790.80 1,534.16
Other expenses 26 1,846.50 1,417.98
Depreciation expense 3 782.08 741.47
Finance cost 27 41.25 63.92
Total expenses (II) 11,701.21 9,471.77
Profit before tax (I-II) 5,015.61 5,780.11
Tax expenses 29
Current tax 1,694.59 1,430.29
Deferred tax charge 106.34 208.57
Taxes for earlier years 3.54 3.99
Total tax expense 1,804.47 1,642.85
Profit for the year 3,211.14 4,137.26
OTHER COMPREHENSIVE INCOME (OCI)Other comprehensive income not to be reclassified to
profit or loss in subsequent periods:
Re-measurement loss on employee defined benefit plans 7.69 15.03
Deferred tax credit (2.66) (5.20)
Total other comprehensive income for the year, net of tax 5.03 9.83
Total comprehensive income for the year, net of tax 3,206.11 4,127.43
Earnings per share: 30
Basic, computed on the basis of profit attributable to equity holders 211.75 267.01
Diluted, computed on the basis of profit attributable to equity holders 207.24 267.01
Summary of significant accounting policies 2.1
The accompanying notes form an integral part of the financial statements.
As per our report of even date attached
For S.R.BATLIBOI & ASSOCIATES LLP For and on behalf of the Board of DirectorsChartered Accountants Gland Pharma LimitedICAI Firm Registration Number : 101049W/E300004
per Navneet Rai Kabra Dr. Ravi Penmetsa Guan XiaohuiPartner Managing Director and Chief Executive Officer Director
Membership No. 102328 DIN: 0179939 DIN: 07675466
Yiran Peng P. Sampath KumarDirector and Chief Financial Officer Company Secretary
DIN: 07675475
Place: Hyderabad Place: Hyderabad
Date: August 21, 2018 Date: August 21, 2018

AN
NU
AL R
EP
OR
T 2
017-2018
46
Statement of Changes in Equity for the year ended March 31, 2018(All amounts in Indian Rupees millions, except share data and where otherwise stated)
a. Equity share capital
Equity shares of Rs. 10 each, issued, subscribed and fully paid No. Rs.
As at April 01, 2016 15,494,949 154.95Add: Issued during the year - -
As at March 31, 2017 15,494,949 154.95Add: Issued during the year 942,500 9.43
Less: Shares bought back during the year (942,500) -9.43
As at March 31, 2018 15,494,949 154.95
b. Other EquityOther components of equity
Reserves and surplusOther comprehensive Total
IncomeSecurities Capital General Retained Re-measurement lossPremium Redemption Reserve Earnings on employee defined
Reserve income benefit plans(net of tax)
As at April 01, 2016 5,149.72 24.01 40.65 11,401.35 - 16,615.73Profit for the year - - - 4,137.26 - 4,137.26
Other comprehensive income, net of tax - - - - (9.83) (9.83)
As at March 31, 2017 5,149.72 24.01 40.65 15,538.61 (9.83) 20,743.16
Issue of share capital 3,976.81 - - - - 3,976.81
Amount utilised towards buy back of shares (3,236.59) - - - - (3,236.59)
Tax on buy back of shares - - - (740.22) - (740.22)
Amount transferred from general reserve - 9.43 (9.43) - - -
to capital redemption reserve
on account of buy back
Profit for the year - - - 3,211.14 - 3,211.14
Other comprehensive income, net of tax - - - - (5.03) (5.03)
As at March 31, 2018 5,889.94 33.44 31.22 18,009.53 (14.86) 23,949.27
The accompanying notes are an integral part of the standalone financial statements.
As per our report of even date.
For S.R.BATLIBOI & ASSOCIATES LLP For and on behalf of the Board of DirectorsChartered Accountants Gland Pharma LimitedICAI Firm Registration Number : 101049W/E300004
per Navneet Rai Kabra Dr. Ravi Penmetsa Guan XiaohuiPartner Managing Director and Director
Membership No. 102328 Chief Executive Officer DIN: 07675466
DIN: 0179939
Yiran Peng P. Sampath KumarDirector and Company Secretary
Chief Financial Officer
DIN: 07675475
Place: Hyderabad Place: Hyderabad Place: Hyderabad
Date: August 21, 2018 Date: August 21, 2018 Date: August 21, 2018

ANNUAL REPORT 2017-2018
47
Statement of Cash Flows for the year ended March 31, 2018(All amounts in Indian Rupees millions, except share data and where otherwise stated)
For the year ended For the year endedMarch 31, 2018 March 31, 2017
Cash flow from operating activitiesProfit before tax 5,015.61 5,780.11Adjustments to reconcile profit before tax to net cash flowsDepreciation expense 782.08 741.47Provision for doubtful debts 16.22 -Bad debts written off 12.82 10.94Interest expense 31.31 50.30Assets written off - 11.30Unrealized foreign exchange (gain)/loss (61.10) 75.59Profit on disposal of property, plant and equipment (0.21) (0.48)Interest income (271.68) (178.54)Liabilities no longer required written back - (3.69)
Operating profit before working capital changes 5,525.05 6,487.00Movements in working capital:Increase in trade receivables (528.59) (750.89)Increase in inventories (1,341.11) (116.44)Increase in loans, deposits and others (3.89) (5.01)Increase in other assets (1,118.11) (9.51)Increase in trade payables and other financial liabilities 1,007.26 1,037.78Increase/(decrease) in provisions and other liabilities 50.11 (264.48)
Cash generated from operations 3,590.72 6,378.45Income tax paid (net of refunds) (1,571.42) (1,613.89)
Net cash flow from operating activities (A) 2,019.30 4,764.56
Cash flows from investing activitiesPurchase of property, plant and equipment (851.75) (1,161.89)Proceeds from disposal of property, plant and equipment 1.60 1.09Investment in bank deposits (2,982.02) -Interest received 243.80 194.26
Net cash flow used in investing activities (B) (3,588.37) (966.54)
Cash flows from financing activitiesRepayment of long-term borrowings (4.61) (707.63)Repayment of short-term borrowings - (399.00)Proceeds from issue of shares 3,985.83 -Buy back of shares (including tax thereon) (3,985.83) -Interest paid (31.31) (57.53)
Net cash flows used in financing activities (C) (35.92) (1,164.16)
Net (decrease)/increase in cash and cash equivalents (A+B+C) (1,604.99) 2,633.86Effect of exchange differences on cash and cash equivalents held in foreign currency 2.63 (35.35)Cash and cash equivalents at the beginning of the year (refer note 10) 5,330.77 2,732.26
Cash and cash equivalents at the end of the year 3,728.41 5,330.77Components of cash and cash equivalentsCash on hand 0.41 0.48With banks on current account 1,396.03 1,302.91With banks on deposit account 2,331.97 4,027.38
Total cash and cash equivalents (refer note 10) 3,728.41 5,330.77
Summary of significant accounting policies
The accompanying notes form an integral part of the financial statements.As per our report of even date attached
For S.R.BATLIBOI & ASSOCIATES LLP For and on behalf of the Board of DirectorsChartered Accountants Gland Pharma LimitedICAI Firm Registration Number : 101049W/E300004
per Navneet Rai Kabra Dr. Ravi Penmetsa Guan XiaohuiPartner Managing Director and Chief Executive Officer DirectorMembership No. 102328 DIN: 0179939 DIN: 07675466
Yiran Peng P. Sampath KumarDirector and Chief Financial Officer Company SecretaryDIN: 07675475
Place: Hyderabad, Date: August 21, 2018 Place: Hyderabad, Date: August 21, 2018

AN
NU
AL R
EP
OR
T 2
017-2018
48
1. Corporate information
Gland Pharma Limited (‘the Company’) is a public limited
Company domiciled in India and is primarily engaged
in manufacturing injectable formulations. The Company
has presently three divisions namely Bulk Drugs (one
unit is in SEZ), Formulations and Research &
Development.
2. Basis of preparation
The financial statements of the Company have been
prepared and presented in accordance with the Indian
Accounting Standards (“Ind AS”) notified under the
Companies (Indian Accounting Standards) Rules, 2015
and as amended from time to time.
The financial statements have been prepared on a
historical cost convention, except for certain financial
assets and liabilities which have been measured at fair
value.
2.1 Summary of significant accounting policies
(a) Current versus non-current classification
The Company presents assets and liabilities in the
balance sheet based on current/ non-current
classification. An asset is treated as current when it is:
l Expected to be realised or intended to be sold or
consumed in normal operating cycle
l Held primarily for the purpose of trading
l Expected to be realised within twelve months after
the reporting period, or
l Cash or cash equivalent unless restricted from being
exchanged or used to settle a liability for at least
twelve months after the reporting period
All other assets are classified as non-current.
A liability is current when:
l It is expected to be settled in normal operating
cycle
l It is held primarily for the purpose of trading
l It is due to be settled within twelve months after
the reporting period, or
l There is no unconditional right to defer the
settlement of the liability for at least twelve months
after the reporting period
The Company classifies all other liabilities as non-
current.
Deferred tax assets and liabilities are classified as non-
current assets and liabilities.
The operating cycle is the time between the acquisition
of assets for processing and their realisation in cash
and cash equivalents. The Company has identified twelve
months as its operating cycle.
(b) Foreign currencies
The financial statements are presented in Indian rupees,
which is the functional currency of the Company and
the currency of the primary economic environment in
which the Company operates.
Transactions and balances
Transactions in foreign currencies are initially recorded
by the Company at its functional currency spot rates at
the date the transaction first qualifies for recognition.
Monetary assets and liabilities denominated in foreign
currencies are translated at the functional currency spot
rates of exchange at the reporting date.
Exchange differences arising on settlement or
translation of monetary items are recognised in profit
or loss
Non-monetary items that are measured in terms of
historical cost in a foreign currency are translated using
the exchange rates at the dates of the initial
transactions.
(c) Fair value measurement
Fair value is the price that would be received to sell an
asset or paid to transfer a liability in an orderly
transaction between market participants at the
measurement date. The fair value measurement is based
on the presumption that the transaction to sell the
asset or transfer the liability takes place either:
l In the principal market for the asset or liability, or
l In the absence of a principal market, in the most
advantageous market for the asset or liability
The principal or the most advantageous market must
be accessible by the Company.
The fair value of an asset or a liability is measured
using the assumptions that market participants would
use when pricing the asset or liability, assuming that
market participants act in their economic best interest.
A fair value measurement of a non-financial asset takes
into account a market participant’s ability to generate
economic benefits by using the asset in its highest
and best use or by selling it to another market
participant that would use the asset in its highest and
best use.
The Company uses valuation techniques that are
appropriate in the circumstances and for which sufficient
data are available to measure fair value, maximising
the use of relevant observable inputs and minimising
the use of unobservable inputs.
Notes to Financial Statements for the year ended March 31, 2018(All amounts in Indian Rupees millions, except share data and where otherwise stated)
ANNUAL REPORT 2017-2018
49
All assets and liabilities for which fair value is measured
or disclosed in the financial statements are categorised
within the fair value hierarchy, described as follows,
based on the lowest level input that is significant to
the fair value measurement as a whole:
Level 1 : Quoted (unadjusted) market prices in active
markets for identical assets or liabilities
Level 2 : Valuation techniques for which the lowest
level input that is significant to the fair value
measurement is directly or indirectly observable
Level 3 : Valuation techniques for which the lowest
level input that is significant to the fair value
measurement is unobservable
For assets and liabilities that are recognised in the
financial statements on a recurring basis, the Company
determines whether transfers have occurred between
levels in the hierarchy by re-assessing categorisation
(based on the lowest level input that is significant to
the fair value measurement as a whole) at the end of
each reporting period.
The Company’s chief financial officer determines the
appropriate valuation techniques and inputs for fair
value measurements. In estimating the fair value of an
asset or a liability, the Company uses market-observable
data to the extent it is available. Where level 1 inputs
are not available, the Company engages third party
qualified valuers to perform the valuation. Any change
in the fair value of each asset and liability is also
compared with relevant external sources to determine
whether the change is reasonable.
For the purpose of fair value disclosures, the Company
has determined classes of assets and liabilities on the
basis of the nature, characteristics and risks of the asset
or liability and the level of the fair value hierarchy as
explained above.
(d) Revenue recognition
Revenue is recognised to the extent that it is probable
that the economic benefits will flow to the Company
and the revenue can be reliably measured, regardless
of when the payment is being made. Revenue is
measured at the fair value of the consideration received
or receivable, taking into account contractually defined
terms of payment and excluding taxes or duties collected
on behalf of the government. The Company has
concluded that it is the principal in all of its revenue
arrangements since it is the primary obligor in all the
revenue arrangements as it has pricing latitude and is
also exposed to inventory and credit risks.
The specific recognition criteria described below mustalso be met before revenue is recognised.
Sale of products
Revenue from sale of goods is recognised on dispatchwhich coincides with transfer of significant risks andrewards to customer and is net of trade discounts, salesreturns and sales tax, where applicable, and theadditional amount in case of exclusive arrangement, isrecognised based on the terms of the agreement enteredinto with the customers, in the period when thecollectability of the profit share becomes probable anda reliable measure of the profit share is available.
Based on the Educational Material on Ind AS 18 issuedby the ICAI, the Company has assumed that recoveryof excise duty flows to the Company on its own account.This is for the reason that it is a liability of themanufacturer which forms part of the cost of production,irrespective of whether the goods are sold or not. Sincethe recovery of excise duty flows to the Company onits own account, revenue includes excise duty.
However, sales tax/ value added tax (VAT)/ Goods andService Tax (GST)is not received by the Company on itsown account. Rather, it is tax collected on value addedto the commodity by the seller on behalf of thegovernment. Accordingly, it is excluded from revenue.
Sale of services
Revenue from sale of dossiers/licenses/services isrecognized in accordance with the terms of the relevantagreements as accepted and agreed with the customers.
Interest income
Interest income is recognised on a time proportion basistaking into account the amount outstanding and theapplicable interest rate. Interest income is includedunder the head “other income” in the statement ofprofit and loss.
Export benefits, incentives and licenses
Export benefits on account of duty drawback and exportpromotion schemes are accrued and accounted in theperiod of export, and are included in other operatingrevenue.
(e) Taxes
Current income tax
Current income tax assets and liabilities are measuredat the amount expected to be recovered from or paidto the taxation authorities. The tax rates and tax lawsused to compute the amount are those that are enactedor substantively enacted, at the reporting date in thecountries where the Company operates and generates
taxable income.
Notes to Financial Statements for the year ended March 31, 2018(All amounts in Indian Rupees millions, except share data and where otherwise stated)
AN
NU
AL R
EP
OR
T 2
017-2018
50
Current income tax relating to items recognised outside
profit or loss is recognised outside profit or loss (either
in other comprehensive income or in equity). Current
tax items are recognised in correlation to the underlying
transaction either in OCI or directly in equity.
Management periodically evaluates positions taken in
the tax returns with respect to situations in which
applicable tax regulations are subject to interpretation
and establishes provision where appropriate.
Deferred tax
Deferred tax is provided using the liability method on
temporary differences between the tax bases of assets
and liabilities and their carrying amounts for financial
reporting purposes at the reporting date.Deferred tax
liabilities are recognised for all taxable temporary
differences.
Deferred tax assets are recognised for all deductible
temporary differences, the carry forward of unused tax
credits and any unused tax losses. Deferred tax assets
are recognised to the extent that it is probable that
taxable profit willbe available against which the
deductible temporary differences, and the carry forward
of unused tax credits and unused tax losses can be
utilized.
The carrying amount of deferred tax assets is reviewed
at each reporting date and reduced to the extent that
it is no longer probable that sufficient taxable profit
will be available to allow all or part of the deferred tax
asset to be utilised. Unrecognised deferred tax assets
are re-assessed at each reporting date and are
recognised to the extent that it has become probable
that future taxable profits will allow the deferred tax
asset to be recovered.
Deferred tax assets and liabilities are measured at the
tax rates that are expected to apply in the period when
the asset is realised or the liability is settled, based on
tax rates and tax laws that have been enacted or
substantively enacted at the reporting date.
Deferred tax relating to items recognised outside profit
or loss is recognised outside profit or loss (either in
other comprehensive income or in equity). Deferred
tax items are recognised in correlation to the underlying
transaction either in OCI or directly in equity.
Deferred tax assets and deferred tax liabilities are offset
if a legally enforceable right exists to set off current
tax assets against current tax liabilities and the deferred
taxes relate to the same taxable entity and the same
taxation authority.
Sales/ value added taxes paid on acquisition ofassets or on incurring expenses
Expenses and assets are recognised net of the amount
of sales/ value added taxes paid, except:
l When the tax incurred on a purchase of assets or
services is not recoverable from the taxation
authority, in which case, the tax paid is recognised
as part of the cost of acquisition of the asset or as
part of the expense item, as applicable
l When receivables and payables are stated with the
amount of tax included
The net amount of tax recoverable from, or payable to,
the taxation authority is included as part of receivables
or payables in the balance sheet.
(f) Property, plant and equipment
Under the previous GAAP (Indian GAAP), property, plant
and equipment and capital work in progress were carried
in the balance sheet at cost of acquisition. The Company
has elected to regard those values of property, plant
and equipment as deemed cost at the date of the
acquisition since there is no change in the functional
currency as on the date of transition to Ind AS i.e.
April 01, 2015. The Company has also determined that
cost of acquisition or construction as deemed cost as
at April 01, 2015.
Capital work in progress is stated at cost, net of
accumulated impairment loss, if any. Property, plant
and equipment is stated at cost, net of accumulated
depreciation and accumulated impairment losses, if any.
Such cost includes the cost of replacing part of the
plant and equipment and borrowing costs for long-term
construction projects if the recognition criteria are met.
When significant parts of plant and equipment are
required to be replaced at intervals, the Company
depreciates them separately based on their specific
useful lives. Likewise, when a major inspection is
performed, its cost is recognised in the carrying amount
of the plant and equipment as a replacement if the
recognition criteria are satisfied. All other expenses on
existing property, plant and equipment, including day-
to-day repair and maintenance expenditure and cost of
replacing parts, are charged to the statement of profit
and loss for the period during which such expenses are
incurred.
Subsequent expenditure related to an item of property,
plant and equipment is added to its book value only if
it increases the future benefits from the existing asset
beyond its previously assessed standard of performance
or extends its estimated useful life.
Notes to Financial Statements for the year ended March 31, 2018(All amounts in Indian Rupees millions, except share data and where otherwise stated)
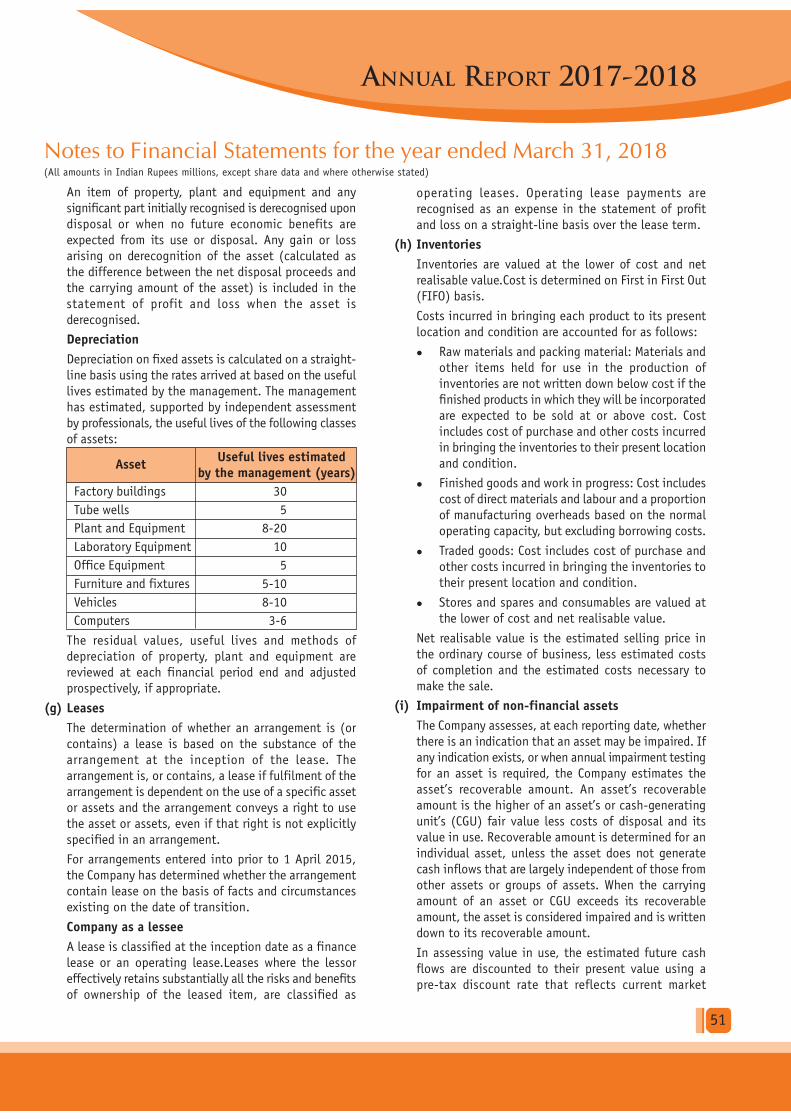
ANNUAL REPORT 2017-2018
51
An item of property, plant and equipment and any
significant part initially recognised is derecognised upon
disposal or when no future economic benefits are
expected from its use or disposal. Any gain or loss
arising on derecognition of the asset (calculated as
the difference between the net disposal proceeds and
the carrying amount of the asset) is included in the
statement of profit and loss when the asset is
derecognised.
Depreciation
Depreciation on fixed assets is calculated on a straight-
line basis using the rates arrived at based on the useful
lives estimated by the management. The management
has estimated, supported by independent assessment
by professionals, the useful lives of the following classes
of assets:
AssetUseful lives estimated
by the management (years)
Factory buildings 30
Tube wells 5
Plant and Equipment 8-20
Laboratory Equipment 10
Office Equipment 5
Furniture and fixtures 5-10
Vehicles 8-10
Computers 3-6
The residual values, useful lives and methods of
depreciation of property, plant and equipment are
reviewed at each financial period end and adjusted
prospectively, if appropriate.
(g) Leases
The determination of whether an arrangement is (or
contains) a lease is based on the substance of the
arrangement at the inception of the lease. The
arrangement is, or contains, a lease if fulfilment of the
arrangement is dependent on the use of a specific asset
or assets and the arrangement conveys a right to use
the asset or assets, even if that right is not explicitly
specified in an arrangement.
For arrangements entered into prior to 1 April 2015,
the Company has determined whether the arrangement
contain lease on the basis of facts and circumstances
existing on the date of transition.
Company as a lessee
A lease is classified at the inception date as a finance
lease or an operating lease.Leases where the lessor
effectively retains substantially all the risks and benefits
of ownership of the leased item, are classified as
operating leases. Operating lease payments are
recognised as an expense in the statement of profit
and loss on a straight-line basis over the lease term.
(h) Inventories
Inventories are valued at the lower of cost and net
realisable value.Cost is determined on First in First Out
(FIFO) basis.
Costs incurred in bringing each product to its present
location and condition are accounted for as follows:
l Raw materials and packing material: Materials and
other items held for use in the production of
inventories are not written down below cost if the
finished products in which they will be incorporated
are expected to be sold at or above cost. Cost
includes cost of purchase and other costs incurred
in bringing the inventories to their present location
and condition.
l Finished goods and work in progress: Cost includes
cost of direct materials and labour and a proportion
of manufacturing overheads based on the normal
operating capacity, but excluding borrowing costs.
l Traded goods: Cost includes cost of purchase and
other costs incurred in bringing the inventories to
their present location and condition.
l Stores and spares and consumables are valued at
the lower of cost and net realisable value.
Net realisable value is the estimated selling price in
the ordinary course of business, less estimated costs
of completion and the estimated costs necessary to
make the sale.
(i) Impairment of non-financial assets
The Company assesses, at each reporting date, whether
there is an indication that an asset may be impaired. If
any indication exists, or when annual impairment testing
for an asset is required, the Company estimates the
asset’s recoverable amount. An asset’s recoverable
amount is the higher of an asset’s or cash-generating
unit’s (CGU) fair value less costs of disposal and its
value in use. Recoverable amount is determined for an
individual asset, unless the asset does not generate
cash inflows that are largely independent of those from
other assets or groups of assets. When the carrying
amount of an asset or CGU exceeds its recoverable
amount, the asset is considered impaired and is written
down to its recoverable amount.
In assessing value in use, the estimated future cash
flows are discounted to their present value using a
pre-tax discount rate that reflects current market
Notes to Financial Statements for the year ended March 31, 2018(All amounts in Indian Rupees millions, except share data and where otherwise stated)

AN
NU
AL R
EP
OR
T 2
017-2018
52
assessments of the time value of money and the risks
specific to the asset. In determining fair value less
costs of disposal, recent market transactions are taken
into account. If no such transactions can be identified,
an appropriate valuation model is used. These
calculations are corroborated by valuation multiples,
quoted share prices for publicly traded companies or
other available fair value indicators.
The Company bases its impairment calculation on
detailed budgets and forecast calculations, which are
prepared separately for each of the Company’s CGUs to
which the individual assets are allocated.
Impairment losses of continuing operations, including
impairment on inventories, are recognised in the
statement of profit and loss, except for properties
previously revalued with the revaluation surplus taken
to OCI. For such properties, the impairment is recognised
in OCI up to the amount of any previous revaluation
surplus. An assessment is made at each reporting date
to determine whether there is an indication that
previously recognised impairment losses no longer exist
or have decreased. If such indication exists, the
Company estimates the asset’s or CGU’s recoverable
amount. A previously recognised impairment loss is
reversed only if there has been a change in the
assumptions used to determine the asset’s recoverable
amount since the last impairment loss was recognised.
The reversal is limited so that the carrying amount of
the asset does not exceed its recoverable amount, nor
exceed the carrying amount that would have been
determined, net of depreciation, had no impairment
loss been recognised for the asset in prior periods.
Such reversal is recognised in the statement of profit
or loss unless the asset is carried at a revalued amount,
in which case, the reversal is treated as a revaluation
increase.
(j) Provisions
Provisions are recognised when the Company has a
present obligation (legal or constructive) as a result of
a past event, it is probable that an outflow of resources
embodying economic benefits will be required to settle
the obligation and a reliable estimate can be made of
the amount of the obligation. When the Company
expects some or all of a provision to be reimbursed, for
example, under an insurance contract, the
reimbursement is recognised as a separate asset, but
only when the reimbursement is virtually certain. The
expense relating to a provision is presented in the
statement of profit and loss net of any reimbursement.
If the effect of the time value of money is material,
provisions are discounted using a current pre-tax rate
that reflects,when appropriate, the risks specific to the
liability. When discounting is used, the increase in the
provision due to the passage of time is recognised as a
finance cost.
(k) Retirement and other employee benefits
Retirement benefit in the form of provident fund is a
defined contribution scheme. The Company has no
obligation, other than the contribution payable to the
provident fund. The Company recognizes contribution
payable to the provident fund scheme as an expense,
when an employee renders the related service. If the
contribution payable to the scheme for service received
before the balance sheet date exceeds the contribution
already paid, the deficit payable to the scheme is
recognized as a liability after deducting the contribution
already paid. If the contribution already paid exceeds
the contribution due for services received before the
balance sheet date, then excess is recognized as an
asset to the extent that the pre-payment will lead to,
for example, a reduction in future payment or a cash
refund.
The Company operates a defined benefit gratuity plan
in India, which requires contributions to be made to a
separately administered fund.
The cost of providing benefits under the defined benefit
plan is determined based on actuarial valuation.
Remeasurements, comprising of actuarial gains and
losses, the effect of the asset ceiling, excluding amounts
included in net interest on the net defined benefit
liability and the return on plan assets (excluding
amounts included in net interest on the net defined
benefit liability), are recognised immediately in the
balance sheet with a corresponding debit or credit to
retained earnings through OCI in the period in which
they occur. Remeasurements are not reclassified to profit
or loss in subsequent periods.
Past service costs are recognised in profit or loss on
the earlier of:
l The date of the plan amendment or curtailment,
and
l The date that the Company recognises related
restructuring costs
Net interest is calculated by applying the discount rate
to the net defined benefit liability or asset. The Company
recognises the following changes in the net defined
benefit obligation as an expense in the statement of
profit and loss:
Notes to Financial Statements for the year ended March 31, 2018(All amounts in Indian Rupees millions, except share data and where otherwise stated)

ANNUAL REPORT 2017-2018
53
l Service costs comprising current service costs, past-
service costs, gains and losses on curtailments and
non-routine settlements; and
l Net interest expense or income
The Company treats accumulated leave, as a long-term
employee benefit for measurement purposes. Such long-
term compensated absences are provided for based on
an actuarial valuation using the projected unit credit
method at the period-end. Actuarial gains/losses are
immediately taken to the statement of profit and loss
and are not deferred. The Company presents the entire
liability in respect of leave as a current liability in the
balance sheet, since it does not have an unconditional
right to defer its settlement beyond 12 months after
the reporting date.
(l) Financial instruments
A financial instrument is any contract that gives rise
to a financial asset of one entity and a financial liability
or equity instrument of another entity.
Financial assets
Initial recognition and measurement
All financial assets are recognised initially at fair value
plus, in the case of financial assets not recorded at fair
value through profit or loss, transaction costs that are
attributable to the acquisition of the financial asset.
Purchases or sales of financial assets that require
delivery of assets within a time frame established by
regulation or convention in the market place (regular
way trades) are recognised on the trade date, i.e., the
date that the Company commits to purchase or sell the
asset.
Subsequent measurement
For purposes of subsequent measurement, financial
assets are classified in four categories:
l Debt instruments at amortised cost
l Debt instruments at fair value through other
comprehensive income (FVTOCI)
l Debt instruments, derivatives and equity
instruments at fair value through profit or loss
(FVTPL)
l Equity instruments measured at fair value through
other comprehensive income (FVTOCI)
A ‘debt instrument’ is measured at the amortised cost
if both the following conditions are met:
a) The asset is held within a business model whose
objective is to hold assets for collecting contractual
cash flows, and
b) Contractual terms of the asset give rise on specified
dates to cash flows that are solely payments of
principal and interest (SPPI) on the principal
amount outstanding.
This category is the most relevant to the Company.
After initial measurement, such financial assets are
subsequently measured at amortised cost using the
effective interest rate (EIR) method. Amortised cost is
calculated by taking into account any discount or
premium on acquisition and fees or costs that are an
integral part of the EIR. The EIR amortisation is included
in finance income in the profit or loss. The losses arising
from impairment are recognised in the profit or loss.
This category generally applies to trade and other
receivables.
Equity investments:
All equity investments in scope of Ind AS 109 are
measured at fair value.
Derecognition
A financial asset (or, where applicable, a part of a
financial asset or part of a group of similar financial
assets) is primarily derecognised (i.e. removed from
the Company’s balance sheet) when:
a) the rights to receive cash flows from the asset have
expired, or
b) the Company has transferred its rights to receive
cash flows from the asset, and
i. the Company has transferred substantially all
the risks and rewards of the asset, or
ii. the Company has neither transferred nor
retained substantially all the risks and rewards
of the asset, but has transferred control of the
asset.
Impairment of financial assets
In accordance with Ind AS 109, the Company applies
expected credit loss (ECL) model for measurement and
recognition of impairment loss on the following financial
assets and credit risk exposure:
l Financial assets that are debt instruments, and are
measured at amortised cost e.g., loans, deposits,
trade receivables and bank balance
l Trade receivables or any contractual right to receive
cash or another financial asset that result from
transactions that are within the scope of Ind AS
11 and Ind AS 18
The Company recognizes impairment loss allowance
based on lifetime ECLs at each reporting date, right
from its initial recognition.
Notes to Financial Statements for the year ended March 31, 2018(All amounts in Indian Rupees millions, except share data and where otherwise stated)

AN
NU
AL R
EP
OR
T 2
017-2018
54
ECL impairment loss allowance (or reversal) recognized
during the period is recognized as income/ expense in
the statement of profit and loss.
Financial liabilities
Initial recognition and measurement
Financial liabilities are classified, at initial recognition,
as financial liabilities at fair value through profit or
loss, loans and borrowings, payables, as appropriate.
All financial liabilities are recognised initially at fair
value and, in the case of loans and borrowings and
payables, net of directly attributable transaction costs.
The Company’s financial liabilities include trade and
other payables and loans and borrowings including bank
overdrafts.
Subsequent measurement
The measurement of financial liabilities depends on their
classification, as described below:
i. Financial liabilities at fair value through profit or
loss
ii. Financial liability at amortised cost
Loans and borrowings
After initial recognition, interest-bearing loans and
borrowings are subsequently measured at amortised cost
using the EIR method. Gains and losses are recognised
in profit or loss when the liabilities are derecognised
as well as through the EIR amortisation process.
Amortised cost is calculated by taking into account
any discount or premium on acquisition and fees or
costs that are an integral part of the EIR. The EIR
amortisation is included as finance costs in the
statement of profit and loss.
Derecognition
A financial liability is derecognised when the obligation
under the liability is discharged or cancelled or expires.
Reclassification of financial instruments
The Company determines classification of financial
assets and liabilities on initial recognition. After initial
recognition, no reclassification is made for financial
assets which are equity instruments and financial
liabilities. If the Company reclassifies financial assets,
it applies the reclassification prospectively from the
reclassification date which is the first day of the
immediately next reporting period following the change
in business model. The Company does not restate any
previously recognised gains, losses (including
impairment gains or losses) or interest.
Offsetting of financial instruments
Financial assets and financial liabilities are offset and
the net amount is reported in the balance sheet if
there is a currently enforceable legal right to offset
the recognised amounts and there is an intention to
settle on a net basis, to realise the assets and settle
the liabilities simultaneously.
(m)Cash and cash equivalents
Cash and cash equivalent in the balance sheet comprise
cash at banks and on hand and short-term deposits
with an original maturity of three months or less, which
are subject to an insignificant risk of changes in value.
For the purpose of the statement of cash flows, cash
and cash equivalents consist of cash and short-term
deposits, as defined above, net of outstanding bank
overdrafts as they are considered an integral part of
the Company’s cash management.
(n) Research and Development
Revenue expenditure on research and development is
charged to revenue in the period in which it is incurred.
Property, plant and equipment purchased for research
and development is added to property, plant and
equipment and depreciated in accordance with the
policies of the Company.
(o) Earnings Per Share
Basic earnings per share are calculated by dividing the
net profit or loss for the period attributable to equity
shareholders by the weighted average number of equity
shares outstanding during the period.
Diluted EPS amounts are calculated by dividing the
profit attributable to equity holders of the Company by
the weighted average number of Equity shares
outstanding during the year plus the weighted average
number of Equity shares that would be issued on
conversion of all the dilutive potential Equity shares
into Equity shares.
Notes to Financial Statements for the year ended March 31, 2018(All amounts in Indian Rupees millions, except share data and where otherwise stated)

AN
NU
AL R
EP
OR
T 2
017-2018
55
Notes to Financial Statements for the year ended March 31, 2018(All amounts in Indian Rupees millions, except share data and where otherwise stated)
3. Property, plant and equipment
Plant and Laboratory Research and Furniture OfficeParticulars Freehold Land Buildings machinery equipments Development and fixtures equipments Vehicles Computers Tubewells Total
Equipments
Cost
As at April 01, 2016 244.44 1,926.38 5,532.94 316.30 176.57 137.79 39.94 35.27 72.41 1.49 8,483.53
Additions 5.97 80.01 1,359.26 55.76 16.85 20.88 8.80 8.33 23.23 - 1,579.09
Disposals - - - (0.17) - - - (7.24) - - (7.41)
As at March 31, 2017 250.41 2,006.39 6,892.20 371.89 193.42 158.67 48.74 36.36 95.64 1.49 10,055.21
Additions 42.40 120.12 193.86 37.67 43.89 21.68 3.94 1.49 29.02 - 494.07
Disposals - - - - - - - (4.76) - - (4.76)
As at March 31, 2018 292.81 2,126.51 7,086.06 409.56 237.31 180.35 52.68 33.09 124.66 1.49 10,544.52
Depreciation
As at April 01, 2016 - 73.97 391.22 45.68 29.31 24.32 10.77 4.27 24.98 0.20 604.72
Charge for the year - 86.00 516.81 43.28 30.77 19.55 11.14 7.20 26.39 0.33 741.47
Disposals - - - (0.02) - - - (6.77) - - (6.79)
As at March 31, 2017 - 159.97 908.03 88.94 60.08 43.87 21.91 4.70 51.37 0.53 1,339.40
Charge for the year - 88.90 553.17 44.84 33.09 21.22 9.59 7.30 23.64 0.33 782.08
Disposals - - - - - - - (3.37) - - (3.37)
As at March 31, 2018 - 248.87 1,461.20 133.78 93.17 65.09 31.50 8.63 75.01 0.86 2,118.11
Net carrying value
As at March 31, 2017 250.41 1,846.42 5,984.17 282.95 133.34 114.80 26.83 31.66 44.27 0.96 8,715.81
As at March 31, 2018 292.81 1,877.64 5,624.86 275.78 144.14 115.26 21.18 24.46 49.65 0.63 8,426.41
Capital Work in Progress : Rs.1,988.82 (March 31, 2017: Rs. 1,611.50)
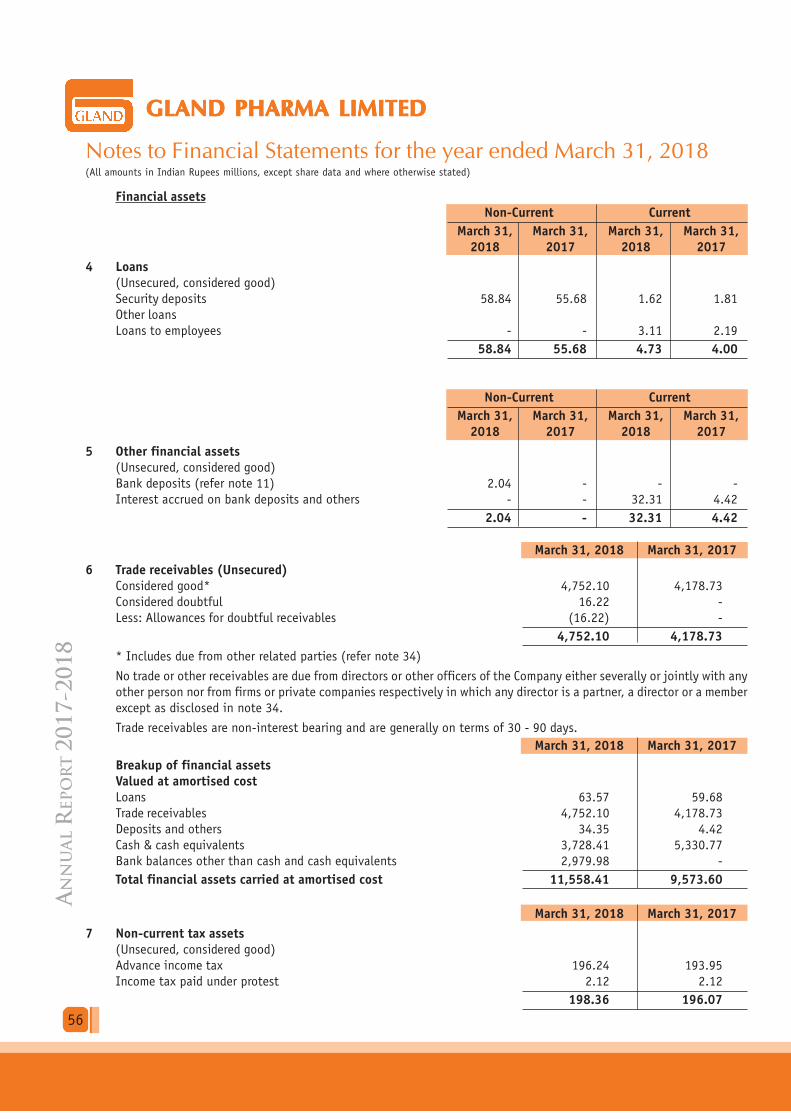
AN
NU
AL R
EP
OR
T 2
017-2018
56
Notes to Financial Statements for the year ended March 31, 2018(All amounts in Indian Rupees millions, except share data and where otherwise stated)
Financial assetsNon-Current Current
March 31, March 31, March 31, March 31,2018 2017 2018 2017
4 Loans(Unsecured, considered good)
Security deposits 58.84 55.68 1.62 1.81
Other loans
Loans to employees - - 3.11 2.19
58.84 55.68 4.73 4.00
Non-Current Current
March 31, March 31, March 31, March 31,2018 2017 2018 2017
5 Other financial assets(Unsecured, considered good)
Bank deposits (refer note 11) 2.04 - - -
Interest accrued on bank deposits and others - - 32.31 4.42
2.04 - 32.31 4.42
March 31, 2018 March 31, 2017
6 Trade receivables (Unsecured)Considered good* 4,752.10 4,178.73
Considered doubtful 16.22 -
Less: Allowances for doubtful receivables (16.22) -
4,752.10 4,178.73
* Includes due from other related parties (refer note 34)
No trade or other receivables are due from directors or other officers of the Company either severally or jointly with any
other person nor from firms or private companies respectively in which any director is a partner, a director or a member
except as disclosed in note 34.
Trade receivables are non-interest bearing and are generally on terms of 30 - 90 days.
March 31, 2018 March 31, 2017
Breakup of financial assetsValued at amortised costLoans 63.57 59.68
Trade receivables 4,752.10 4,178.73
Deposits and others 34.35 4.42
Cash & cash equivalents 3,728.41 5,330.77
Bank balances other than cash and cash equivalents 2,979.98 -
Total financial assets carried at amortised cost 11,558.41 9,573.60
March 31, 2018 March 31, 2017
7 Non-current tax assets(Unsecured, considered good)
Advance income tax 196.24 193.95
Income tax paid under protest 2.12 2.12
198.36 196.07

ANNUAL REPORT 2017-2018
57
Notes to Financial Statements for the year ended March 31, 2018(All amounts in Indian Rupees millions, except share data and where otherwise stated)
Non-Current Current
March 31, March 31, March 31, March 31,2018 2017 2018 2017
8 Other assets(Unsecured, considered good)
Capital advance 38.17 27.32 - -
Advance recoverable in cash or in kind - - 71.64 116.63
Prepaid Expenses - - 103.75 55.56
Export rebate claims receivable - - 17.63 41.97
Export incentives receivable 17.46 34.45 502.78 380.86
Balance with statutory/ government authorities 43.52 15.12 1,188.16 181.37
99.15 76.89 1,883.96 776.39
No advances are due from directors or other officers of the company or any of them either severally or jointly with any
other persons or advances to firms or private companies respectively in which any director is a partner or a director or a
member should be separately stated.
March 31, 2018 March 31, 2017
9 Inventories (valued at lower of cost and net realisable value)Raw materials and components 2,611.69 1,935.94
Packing materials 886.76 916.47
Finished goods* 481.87 237.35
Work-in-progress 971.74 549.60
Stores and spares 176.24 147.83
5,128.30 3,787.19
*Includes stock in trade 31.57 40.19
March 31, 2018 March 31, 2017
10 Cash and cash equivalentsBalances with banks
In current accounts 1,396.03 1,302.91
Deposits with original maturity of less than three months 2,331.97 4,027.38
Cash on hand 0.41 0.48
3,728.41 5,330.77
Non-Current Current
March 31, March 31, March 31, March 31,2018 2017 2018 2017
11 Bank balances other than cash and cash equivalentsOther bank deposits
Deposit with original maturity 3-12 months - - 2,782.99 -
Margin money deposits*
Deposit with original maturity 3-12 months - - 196.99 -
Deposit with original maturity more than 12 months 2.04 - - -
2.04 - 2,979.98 -
Less: Amount disclosed under deposits and others (2.04) - - -
(refer note 5) - - 2,979.98 -
*Margin money deposits represent security held by bank including bank guarantees issued by the bankers on behalf of
the Company.

AN
NU
AL R
EP
OR
T 2
017-2018
58
Notes to Financial Statements for the year ended March 31, 2018(All amounts in Indian Rupees millions, except share data and where otherwise stated)
March 31, 2018 March 31, 201712 Equity share capital
Authorised
18,000,000 (March 31, 2017: 18,000,000) equity shares of Rs. 10 each 180.00 180.00
0.001% 5,100,000 (March 31, 2017: 5,100,000) compulsorily convertible
non cumulative preference shares of Rs. 10 each 51.00 51.00
0.001% 1,200,000 (March 31, 2017: 1,200,000) redeemable convertible
non cumulative preference shares of Rs. 10 each 12.00 12.00
243.00 243.00Issued, subscribed and fully paid up shares
15,494,949 (March 31, 2017: 15,494,949) equity shares of Rs. 10 each 154.95 154.95
154.95 154.95
(a) Reconciliation of the number of shares outstanding at the beginning and at the end of the reportingperiod
March 31, 2018 March 31, 2017
No. of Amount No. of AmountShares Shares
Equity SharesAt the beginning of the year 15,494,949 154.95 15,494,949 154.95
Less: Shares bought back during the year* (942,500) (9.43) - -
Add: Issued during the year# 942,500 9.43 - -
15,494,949 154.95 15,494,949 154.95
* During the year ended March 31, 2018, the Company bought back 942,500 equity shares under the buy-back of
equity shares plan approved by the shareholders on September 15, 2017.
#During the year ended March 31, 2018, the Company had issued 0.001% 942,500 compulsorily convertible non
cumulative preference shares of Rs. 10 each, which were converted into equity shares.
Aggregate number of shares bought back during the period of five years immediately preceding the reporting
date:
Particulars March 31, March 31, March 31, March 31, March 31,2018 2017 2016 2015 2014
Equity shares of Rs. 10 each 942,500 - 177,500 2,223,000 -
(b) Terms / rights attached to equity shares
The Company has only one class of equity shares having par value of Rs. 10 per share. Each holder of equity shares
is entitled to one vote per share. The Company declares and pays dividends in Indian rupees. The dividend
proposed by the Board of Directors is subject to the approval of the shareholders in the ensuing Annual General
Meeting.
In the event of liquidation of the company, the holders of equity shares will be entitled to receive remaining
assets of the company, after distribution of all preferential amounts. The distribution will be in proportion to the
number of equity shares held by the shareholders.
(c) Shares held by the holding company
Out of equity shares issued by the Company, shares held by its holding company are as below:
Name of the Shareholder March 31, 2018 March 31, 2017
Fosun Pharma Industrial Pte. Ltd 114.66 -
11,466,262 (March 31, 2017: Nil) equity shares
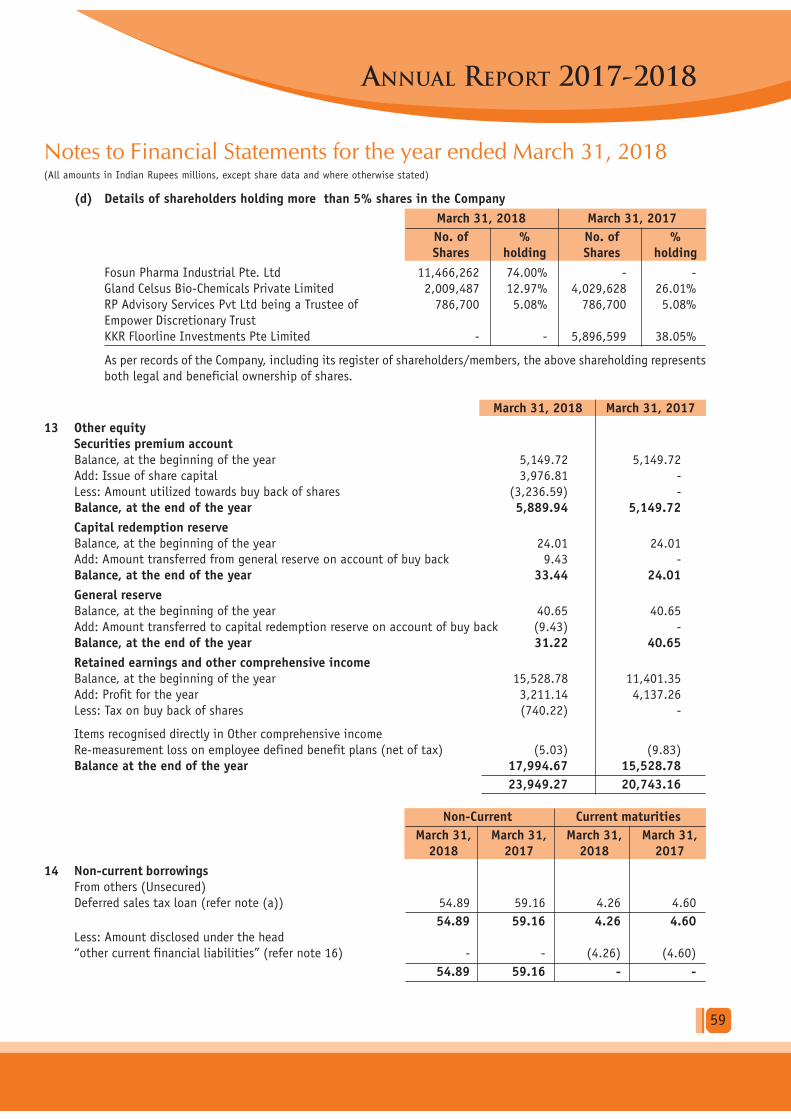
ANNUAL REPORT 2017-2018
59
Notes to Financial Statements for the year ended March 31, 2018(All amounts in Indian Rupees millions, except share data and where otherwise stated)
(d) Details of shareholders holding more than 5% shares in the Company
March 31, 2018 March 31, 2017
No. of % No. of %Shares holding Shares holding
Fosun Pharma Industrial Pte. Ltd 11,466,262 74.00% - -
Gland Celsus Bio-Chemicals Private Limited 2,009,487 12.97% 4,029,628 26.01%
RP Advisory Services Pvt Ltd being a Trustee of 786,700 5.08% 786,700 5.08%
Empower Discretionary Trust
KKR Floorline Investments Pte Limited - - 5,896,599 38.05%
As per records of the Company, including its register of shareholders/members, the above shareholding represents
both legal and beneficial ownership of shares.
March 31, 2018 March 31, 2017
13 Other equitySecurities premium accountBalance, at the beginning of the year 5,149.72 5,149.72
Add: Issue of share capital 3,976.81 -
Less: Amount utilized towards buy back of shares (3,236.59) -
Balance, at the end of the year 5,889.94 5,149.72
Capital redemption reserveBalance, at the beginning of the year 24.01 24.01Add: Amount transferred from general reserve on account of buy back 9.43 -
Balance, at the end of the year 33.44 24.01
General reserveBalance, at the beginning of the year 40.65 40.65
Add: Amount transferred to capital redemption reserve on account of buy back (9.43) -
Balance, at the end of the year 31.22 40.65
Retained earnings and other comprehensive incomeBalance, at the beginning of the year 15,528.78 11,401.35
Add: Profit for the year 3,211.14 4,137.26
Less: Tax on buy back of shares (740.22) -
Items recognised directly in Other comprehensive income
Re-measurement loss on employee defined benefit plans (net of tax) (5.03) (9.83)
Balance at the end of the year 17,994.67 15,528.78
23,949.27 20,743.16
Non-Current Current maturities
March 31, March 31, March 31, March 31,2018 2017 2018 2017
14 Non-current borrowingsFrom others (Unsecured)
Deferred sales tax loan (refer note (a)) 54.89 59.16 4.26 4.60
54.89 59.16 4.26 4.60Less: Amount disclosed under the head
“other current financial liabilities” (refer note 16) - - (4.26) (4.60)
54.89 59.16 - -

AN
NU
AL R
EP
OR
T 2
017-2018
60
Notes to Financial Statements for the year ended March 31, 2018(All amounts in Indian Rupees millions, except share data and where otherwise stated)
(a) Deferred sales tax is interest free and payable in 14 yearly unequal instalments starting from October 2012, as per
the sales tax deferment scheme. The last instalment is payable in 2026-27.
Changes in liabilities arising from financing activities
ParticularsApril 01,
Cash flowsMarch 31,
2017 2018
Non-current borrowings (including current maturities) 63.76 (4.60) 59.16
Total liabilities from financing activities 63.76 (4.60) 59.16
Changes in liabilities arising from financing activities
ParticularsApril 01,
Cash flowsMarch 31,
2016 2017
Non-current borrowings (including current maturities) 771.39 (707.63) 63.76
Short-term borrowings 399.00 (399.00) -
Total liabilities from financing activities 1,170.39 (1,106.63) 63.76
March 31, 2018 March 31, 2017
15 Trade payablesValued at amortised costOutstanding dues to creditors other than micro enterprises
and small enterprises 2,598.65 1,773.18
Outstanding dues to micro enterprises and small enterprises (refer note 32) 23.43 109.91
Outstanding dues to related parties (refer note 34) 302.07 9.80
2,924.15 1,892.89
Terms and conditions of the above financial liabilities:Trade payables are non-interest bearing and are normally settled on 30-120 day terms.
For explanations on the Company's credit risk management processes, refer to Note 37.
Non-Current Current
March 31, March 31, March 31, March 31,2018 2017 2018 2017
16 Other financial liabilitiesValued at amortised costCurrent maturities of non-current borrowings (refer note 14) - - 4.26 4.60
Capital creditors - - 138.52 110.26
Trade deposits payable 5.57 3.67 - -
Revenue received in advance 375.76 388.88 - -
381.33 392.55 142.78 114.86
March 31, 2018 March 31, 2017
Breakup of financial liabilities carried at amortised costValued at amortised costNon current borrowings 54.89 59.16
Trade payables 2,924.15 1,892.89
Current maturities of non-current borrowings 4.26 4.60
Capital creditors 138.52 110.26
Trade deposits payable 5.57 3.67
Revenue received in advance 375.76 388.88
Total financial liabilities carried at amortised cost 3,503.15 2,459.46

ANNUAL REPORT 2017-2018
61
Notes to Financial Statements for the year ended March 31, 2018(All amounts in Indian Rupees millions, except share data and where otherwise stated)
March 31, 2018 March 31, 2017
17 Deferred tax liability (net)
Deferred tax liabilityAccelerated depreciation for tax purposes 970.38 863.14
970.38 863.14Deferred tax assetProvision for employee benefits 7.30 7.70
Provision for doubtful debts 5.61 -
Provision for bonus - 1.65
12.91 9.35
Deferred tax liability (net) 957.47 853.79
For the year ended March 31, 2018: Opening Recognised in Recognised in Closingbalance profit & loss other comprehensive balance
income
Accelerated depreciation for tax purposes 863.14 107.24 - 970.38
Provision for employee benefits (7.70) 3.06 (2.66) (7.30)
Provision for doubtful debts - (5.61) - (5.61)
Provision for bonus (1.65) 1.65 - -
Deferred tax liability (net) 853.79 106.34 (2.66) 957.47
For the year ended March 31, 2017: Opening Recognised in Recognised in Closingbalance profit & loss other comprehensive balance
incomeAccelerated depreciation for tax purposes 649.95 213.19 - 863.14
Provision for employee benefits 0.47 (2.97) (5.20) (7.70)
Provision for bonus - (1.65) - (1.65)
Deferred tax liability (net) 650.42 208.57 (5.20) 853.79
March 31, 2018 March 31, 2017
18 ProvisionsProvision for employee benefitsProvision for gratuity (refer note 31) 11.91 13.62
Provision for compensatory absences 9.18 8.63
21.09 22.25
March 31, 2018 March 31, 2017
19 Current tax liabilities (net)Income tax (net of advance tax and tax deducted at source) 129.00 -
129.00 -
March 31, 2018 March 31, 2017
20 Other current liabilitiesStatutory dues 32.65 81.65
Advances from customers 503.16 388.06
Unearned revenue 32.67 34.13
568.48 503.84

AN
NU
AL R
EP
OR
T 2
017-2018
62
Notes to Financial Statements for the year ended March 31, 2018(All amounts in Indian Rupees millions, except share data and where otherwise stated)
21 Revenue from operations (Gross) For the year ended For the year ended
March 31, 2018 March 31, 2017Revenue from sale of goods (including excise duty)- Domestic 1,698.83 1,405.38
- Export 12,507.61 8,807.94
(A) 14,206.44 10,213.32Revenue from sale of services- Domestic 902.19 1,482.72
- Export 721.54 2,872.01
(B) 1,623.73 4,354.73Other operating income- Export incentives 398.76 348.22
(C) 398.76 348.22
(A+B+C) 16,228.93 14,916.27
Sale of goods includes excise duty collected from customers of Rs. 29.52 (March 31, 2017: Rs. 124.51). Revenue from
operations for periods up to June 30, 2017 includes excise duty. From July 01, 2017 onwards the excise duty and most
indirect taxes in India have been replaced by Goods and Service Tax (GST). The Company collects GST on behalf of the
Government. Hence, GST is not included in revenue from operations. In view of the aforesaid change in indirect taxes,
revenue from operations for the year ended March 31, 2018 is not comparable with March 31, 2017.
22 Other income For the year ended For the year ended
March 31, 2018 March 31, 2017Interest on
- Fixed deposits 268.80 175.82
- Others 2.88 2.72
Foreign exchange gain (net) 213.18 151.78
Profit on disposal of property, plant and equipment 0.21 0.48
Insurance claim 0.01 0.84
Miscellaneous income 2.81 3.97
487.89 335.61
23 Cost of materials consumed For the year ended For the year ended
March 31, 2018 March 31, 2017
Inventory at the beginning of the year 1,935.94 1,424.31
Add: Purchases 6,048.75 3,671.67
7,984.69 5,095.98
Less: Inventory at the end of the year 2,611.69 1,935.94
Cost of raw materials consumed 5,373.00 3,160.04
Cost of packing materials consumed 1,809.98 1,346.61
7,182.98 4,506.65

ANNUAL REPORT 2017-2018
63
Notes to Financial Statements for the year ended March 31, 2018(All amounts in Indian Rupees millions, except share data and where otherwise stated)
24 (Increase) / decrease in inventories For the year ended For the year ended
March 31, 2018 March 31, 2017Inventories at the end of the year
Finished goods 481.87 237.35
Work in progress 971.74 549.60
1,453.61 786.95Inventories at the beginning of the year
Finished goods 237.35 268.87
Work in progress 549.60 981.80
786.95 1,250.67
(666.66) 463.72
25 Employee benefits expense For the year ended For the year ended
March 31, 2018 March 31, 2017
Salaries, wages and bonus 1,612.21 1,399.00
Contribution to provident and other fund (refer note 31) 80.17 67.00
Gratuity expense (refer note 31) 33.64 16.28
Staff welfare expenses 64.78 51.88
1,790.80 1,534.16
26 Other expenses For the year ended For the year ended
March 31, 2018 March 31, 2017
Stores Consumed 206.60 186.89
Rent (refer note 39(a)) 24.84 62.74
Repairs and maintenance:
- Plant and machinery 166.27 127.23
- Buildings 66.66 89.66
- Other 11.66 10.78
Rates and taxes 211.23 202.05
Quality control expenses 235.14 204.11
Research and development expenses 189.12 198.67
Legal and professional charges* 467.75 78.20
Carriage outwards 71.25 72.04
Insurance 23.49 23.08
Printing and stationery 21.29 18.55
Travelling and conveyance 23.10 24.68
Selling and business promotion expenses 20.10 20.51
Sales commission 7.96 21.44
Postage and courier 3.41 3.94
Telephone expenses 6.14 6.52
Vehicle maintenance 6.84 7.35
Payment to auditors:
Statutory audit fees 4.00 5.00
Certifications fees and others 2.28 2.58
Out of pocket expenses 0.06 0.10
Provision for doubtful debts 16.22 -

AN
NU
AL R
EP
OR
T 2
017-2018
64
Notes to Financial Statements for the year ended March 31, 2018(All amounts in Indian Rupees millions, except share data and where otherwise stated)
Bad debts written off 12.82 10.94
Assets written off - 11.30
Miscellaneous expenses 41.45 28.01
CSR expenditure (Refer Note 28) 6.82 1.61
1,846.50 1,417.98
* Includes Rs. 425.07 ( March 31, 2017: 59) towards transaction cost for acquisition of 74% stake by Fosun in the
company.
27 Finance cost For the year ended For the year ended
March 31, 2018 March 31, 2017
Interest expense 31.31 50.30
Bank charges 9.94 13.62
41.25 63.92
28 Details of CSR expenditure For the year ended For the year ended
March 31, 2018 March 31, 2017
(a) Gross amount required to be spent 87.36 70.65
by the Company during the year:
(b) Amount spent during the year 6.82 1.61
29 Taxes
(a) Income tax expense:
The major components of income tax expenses for the year ended March 31, 2018 and for the year ended March
31, 2017 are:
(i) Profit or loss section
ParticularsFor the year ended For the year ended
March 31, 2018 March 31, 2017
Current income tax charge 1,694.59 1,430.29
Deferred tax charge 106.34 208.57
Adjustment of current income tax relating to earlier years 3.54 3.99
Total income tax expense recognised 1,804.47 1,642.85in statement of Profit & Loss
(ii) OCI Section
ParticularsFor the year ended For the year ended
March 31, 2018 March 31, 2017
Net gain on remeasurement of defined benefit plans (2.66) (5.20)
Income tax charged to OCI (2.66) (5.20)
(b) Reconciliation of effective tax rate:
ParticularsFor the year ended For the year ended
March 31, 2018 March 31, 2017
Profit Before Tax (A) 5,015.61 5,780.11
Enacted tax rate in India (B) 34.61% 34.61%
Expected tax expenses (C = A*B) 1,735.80 2,000.38

ANNUAL REPORT 2017-2018
65
Permanent DifferenceDeduction under section 10AA of the Income Tax Act, 1961 (82.46) (636.24)
Weighted deduction under section 35(2AB) (183.41) (273.10)
under the Income Tax Act, 1961 (a)
Deduction under section 32AC of the Income Tax Act, 1961 - (210.81)
Expenses disallowed under Income Tax Act, 1961 444.29 62.62
Adjustment for taxes with respect to earlier years 10.23 11.53
Others 9.77 12.92
Total (D) 198.42 (1,033.08)
Profit after adjusting permanent difference 5,214.03 4,747.03
Expected tax expense 1,804.47 1,642.85
Total Tax expense 1,804.47 1,642.85
Effective Tax Rate 35.98% 28.42%
(a) India’s Finance Act, 2016 incorporated an amendment that reduces the weighted deduction on eligible
research and development expenditure in a phased manner from 200% to 150% commencing from 1 April
2017.
30 Earnings per share March 31, 2018 March 31, 2017
The following reflects the profit and share data used in the basic and
diluted EPS computations:
i) Profit for the year attributable to equity shareholders 3,211.14 4,137.26
ii) Weighted average number of equity shares in calculating basic EPS 15,164,428 15,494,949
iii) Weighted average number of equity shares in calculating diluted EPS 15,494,949 15,494,949
vi) Face value of each equity share (Rs.) 10.00 10.00
iv) Basic Earnings per share 211.75 267.01
v) Diluted Earnings per share 207.24 267.01
31 Gratuity
I Defined Benefit Plans
The Company has a defined benefit gratuity plan and governed by Payment of Gratuity Act, 1972. Every employee
who has completed five years or more of service is entitled to a gratuity on departure at 15 days salary for each
completed year of service. The scheme is funded through a policy with LIC. The following tables summarise net
benefit expenses recognised in the statement of profit and loss, the status of funding and the amount recognised
in the Balance sheet for the gratuity plan:
A) Net employee benefit expense (recognised in Employee benefits expenses)
For the year ended For the year endedMarch 31, 2018 March 31, 2017
Current service cost 22.35 16.94
Past service cost 10.33 -
Interest cost 8.41 6.95
Expected return on plan assets (7.45) (7.61)
Net employee benefit expenses 33.64 16.28
Actual return on plan asset 7.45 7.61
B) Amount recognised in the Balance Sheet March 31, 2018 March 31, 2017Defined benefit obligation 150.08 120.42
Fair value of plan assets (138.17) (106.80)
11.91 13.62
Notes to Financial Statements for the year ended March 31, 2018(All amounts in Indian Rupees millions, except share data and where otherwise stated)

AN
NU
AL R
EP
OR
T 2
017-2018
66
Notes to Financial Statements for the year ended March 31, 2018(All amounts in Indian Rupees millions, except share data and where otherwise stated)
C) Changes in the present value of the March 31, 2018 March 31, 2017defined benefit obligationOpening defined benefit obligation 120.42 87.19
Current service cost 22.35 16.94
Interest cost 8.41 6.95
Benefits paid (19.67) (5.37)
Past service cost 10.33 -
Net Actuarial losses on obligation 8.24 14.71
for the year recognised under OCI
Closing defined benefit obligation 150.08 120.42
D) Change in the fair value of plan assets March 31, 2018 March 31, 2017Opening fair value of plan assets 106.80 95.37
Expected return on plan assets 7.45 7.61
Contributions 43.04 9.51
Benefits paid (19.67) (5.37)
Net Actuarial losses / (gains) on plan assets 0.55 (0.32)
for the year recognised under OCI
Closing fair value of plan assets 138.17 106.80
The Company expects to contribute Rs. 35.44 to the gratuity fund in the next year (March 31, 2017:
Rs. 16.33)
The major categories of plan assets as a percentage of the fair value of total plan assets are as follows:
March 31, 2018 March 31, 2017
Investments with LIC 100.00% 100.00%
E) Re measurement adjustments: March 31, 2018 March 31, 2017Experience loss/ (gain) on plan liabilities 15.69 6.09
Experience loss/ (gain) on plan assets (0.55) 0.32
Financial loss/ (gain) on plan liabilities (7.45) 8.62
Re measurement losses recognised in 7.69 15.03other comprehensive income:
(i) The principal assumptions used in determining gratuity for the Company’s plans are shownbelow:
March 31, 2018 March 31, 2017Discount rate 7.65% 8.00%
Expected rate of return on assets 8.25% 8.25%
Salary rise 8.00% 8.00%
Attrition Rate 10.00% 10.00%
The estimates of future salary increases, considered in the actuarial valuation, take account of inflation,
seniority, promotion and other relevant factors, such as supply and demand in the employment market.
The overall expected rate of return on assets is determined based on the actual rate of return during
the current year.
(ii) Disclosure related to indication of effect of the defined benefit plan on the entity’s futurecash flows:
Expected benefit payments for the year ending:
Year ending March 31, 2018 March 31, 2017
1 year 21.04 16.33
2-5 years 62.40 48.45
6-10 years 70.63 51.99

ANNUAL REPORT 2017-2018
67
Notes to Financial Statements for the year ended March 31, 2018(All amounts in Indian Rupees millions, except share data and where otherwise stated)
(iii) Sensitivity analysis:
A quantitative sensitivity analysis for significant assumption is as shown below:
(a) Effect of 1% change in assumed discount rate March 31, 2018 March 31, 2017
- 1% increase 139.54 111.55
- 1% decrease 161.59 130.08
(b) Effect of 1% change in assumed salary growth rate
- 1% increase 160.64 128.80
- 1% decrease 140.05 112.31
(c) Effect of 1% change in assumed attrition rate
- 1% increase 147.54 116.91
- 1% decrease 152.82 124.75
For the year ended For the year endedMarch 31, 2018 March 31, 2017
II Defined Contribution Plan
Contribution to Provident Fund 80.17 67.00
32 Trade Payables (Details of dues to Micro, Small and Medium Enterprises as per MSMED Act,2006):
March 31, 2018 March 31, 2017The principal amount and the interest due thereon (to be shown
separately) remaining unpaid to any supplier as at the end of each
accounting year 23.43 109.91
The amount of interest paid by the buyer in terms of section 16, of
the Micro, Small and Medium Enterprise Development Act, 2006 along
with the amounts of the payment made to the supplier beyond the
appointed day during each accounting year - -
The amount of interest due and payable for the period of delay in
making payment (which have been paid but beyond the appointed
day during the year) but without adding the interest specified under
Micro, Small and Medium Enterprise Development Act, 2006. - -
The amount of interest accrued and remaining unpaid at the end of
each accounting year; and - -
The amount of further interest remaining due and payable even in the
succeeding years, until such date when the interest dues as above are
actually paid to the small enterprise for the purpose of disallowance
as a deductible expenditure under section 23 of the Micro, Small and
Medium Enterprise Development Act, 2006. - -
33 Research and development
i) Details of Revenue expenditure (expensed as and when incurred):
For the year ended For the year endedMarch 31, 2018 March 31, 2017
Cost of materials consumedRaw Materials Consumed 77.52 86.44
Power and Fuel 5.87 4.66
Employee benefits expensesSalaries, allowances and wages 130.34 115.56
Contribution to provident fund and other funds 6.91 6.38
Staff welfare expenses 1.29 0.59

AN
NU
AL R
EP
OR
T 2
017-2018
68
Notes to Financial Statements for the year ended March 31, 2018(All amounts in Indian Rupees millions, except share data and where otherwise stated)
Other ExpensesRates and taxes 116.50 55.32
Research and development expenses 189.12 198.67
Repairs and maintenance 6.51 2.06
Others 2.91 7.10
Depreciation and Amortisation 33.09 30.77
Total 570.06 507.55
ii) Details of research and development assets :
Particulars Research and development
Total Equipments
Furniture Computers
and fixtures
Gross BlockAs at April 01, 2016 163.32 6.25 7.00 176.57Additions 16.09 0.12 0.64 16.85
As at March 31, 2017 179.41 6.37 7.64 193.42
Additions 39.18 0.95 3.76 43.89
As at March 31, 2018 218.59 7.32 11.40 237.31
Depreciation/AmortisationAs at April 01, 2016 25.63 1.05 2.63 29.31Charge for the year 27.33 1.06 2.38 30.77
As at March 31, 2017 52.96 2.11 5.01 60.08
Charge for the year 29.87 1.11 2.11 33.09
As at March 31, 2018 82.83 3.22 7.12 93.17
Net BlockAs at March 31, 2017 126.45 4.26 2.63 133.34
As at March 31, 2018 135.76 4.10 4.28 144.14
34 Related party disclosures
Names of related parties and description of relationship
Name of the related party Relationship
Enterprise which exercises significant influence
KKR Floorline Investors Pte Limited (Upto October 03, 2017)
Fellow subsidiaryChongqing Pharmaceutical Research Institute Co., Ltd
Enterprise over which Key Management Personnelexercise significant influencei) Gland Chemicals Private Limited
ii) Gland Celsus Biochemicals Private Limited
iii) Nicomac Clean Rooms Far East Private Limited
(Upto October 03, 2017)
iv) Moreschi Asia Doors Private Limited
(Upto October 03, 2017)
v) Dhananjaya Properties LLP
vi) Sasikala Properties LLP

ANNUAL REPORT 2017-2018
69
Notes to Financial Statements for the year ended March 31, 2018(All amounts in Indian Rupees millions, except share data and where otherwise stated)
Key Management Personneli) Sri P.V.N. Raju Chairman and Director
ii) Dr. Ravi Penmetsa Managing Director and Chief Executive Officer
iii) Srinivas Sadu Chief Operating Officer and Whole Time Director
(WTD upto October 03, 2017)
iv) B.Narasimha Rao Chief Financial Officer and Whole Time Director
(CFO and WTD upto October 03, 2017)
v) Mrs K Jhansi Lakshmi Vice President (Finance) and Whole Time Director
(VP and WTD upto October 03, 2017)
Relatives of Key Management Personneli) K Praveen Kumar (Upto October 03, 2017)
ii) Smt. P. Suryakantham
iii) Mr Nakul V Penmetsa
Transactions during the year:
For the For theNature year ended year ended
March 31, 2018 March 31, 2017
Enterprise over which Key Management Personnelexercise significant influenceGland Chemicals Private Limited Purchase of raw material 782.55 31.72
Sale of goods 85.25 5.12
Nicomac Clean Rooms Far East Private Limited Purchase of capital goods 24.18 58.07
Moreschi Asia Doors Private Limited Purchase of capital goods 1.16 7.71
Dhananjaya Properties LLP Rent expense 2.02 1.94
Sasikala Properties LLP Rent expense 1.26 1.48
Gland Celsus Bio Chemicals Pvt Ltd Sale of Vehicles 0.63 -
Fellow subsidiaryChongqing Pharmaceutical Research Institute Co., Ltd Purchase of raw material 75.44 -
Key Management Personnel ^Sri P.V.N. Raju Managerial remuneration 6.06 7.83
Rent expense 0.20 0.19
Dr. Ravi Penmetsa Managerial remuneration 78.13 78.04
Mrs K Jhansi Lakshmi Managerial remuneration 3.22 6.38
Rent expense 1.36 1.69
B. Narasimha Rao Managerial remuneration 5.19 10.96
Srinivas Sadu Managerial remuneration 6.07 12.74
Relatives of Key Management PersonnelSmt. P. Suryakantham Rent expense 0.20 0.19
K Praveen Kumar Rent expense 0.09 0.18
Nakul Penmetsa Salary expense 1.75 2.89
Closing balances receivable/(payable) (Unsecured):
March 31, 2018 March 31, 2017Chongqing Pharmaceutical Research Institute Co., Ltd (65.49) -
Gland Chemicals Private Limited (236.58) (9.80)
Gland Chemicals Private Limited 31.07 5.12
Nicomac Clean Rooms Far East Private Limited - 2.30
Moreschi Asia Doors Private Limited - (2.08)

AN
NU
AL R
EP
OR
T 2
017-2018
70
Notes to Financial Statements for the year ended March 31, 2018(All amounts in Indian Rupees millions, except share data and where otherwise stated)
Dhananjaya Properties LLP - (0.17)
Sasikala Properties LLP - (0.13)
Sri P.V.N. Raju - (0.02)
Dr. Ravi Penmetsa (53.97) (57.08)
Mrs K Jhansi Lakshmi - (0.15)
Smt. P. Suryakantham - (0.02)
K Praveen Kumar - (0.01)
^ As the future liability for gratuity and leave encashment is provided on an actuarial basis for the Company as a whole,
the amount pertaining to the Key Management personnel and their relatives is not ascertainable and, therefore, not
included above. The transactions with related parties are made on terms equivalent to those that prevail in arm’s length
transactions. This assessment is undertaken each financial year through examining the financial position of the related
party and the market in which the related party operates. Outstanding balances at the year-end are unsecured, interest
free and settlement occurs in cash.
35 Significant accounting judgements, estimates and assumptions
The preparation of the Company’s financial statements requires management to make judgements, estimates and
assumptions that affect the reported amounts of revenues, expenses, assets and liabilities, and the accompanying
disclosures, and the disclosure of contingent liabilities. Uncertainty about these assumptions and estimates could
result in outcomes that require a material adjustment to the carrying amount of assets or liabilities affected in future
periods.
(A) Judgements
In the process of applying the Company’s accounting policies, management has made the following judgements,
which have the most significant effect on the amounts recognised in the financial statements.
(i) Lease commitments - the Company as lessee
The Company has entered into leases for office premises. The Company has determined, based on an evaluation
of the terms and conditions of the arrangements, such as the lease term not constituting a major part of the
economic life of office premises and the fair value of the asset, that it does not retain significant risks and
rewards of ownership of the office premises and accounts for the contracts as operating leases.
(B) Estimates and assumptions
The key assumptions concerning the future and other key sources of estimation uncertainty at the reporting date,
that have a significant risk of causing a material adjustment to the carrying amounts of assets and liabilities
within the next financial year, are described below. The Company based its assumptions and estimates on parameters
available when the financial statements were prepared. Existing circumstances and assumptions about future
developments, however, may change due to market changes or circumstances arising that are beyond the control
of the Company. Such changes are reflected in the assumptions when they occur.
(i) Defined employee benefit plans (Gratuity)
The cost of the defined benefit gratuity plan and the present value of the gratuity obligation are determined
using actuarial valuations. An actuarial valuation involves making various assumptions that may differ from
actual developments in the future. These include the determination of the discount rate, future salary
increases and mortality rates. Due to the complexities involved in the valuation and its long-term nature, a
defined benefit obligation is highly sensitive to changes in these assumptions. All assumptions are reviewed
at each reporting date.
The parameter most subject to change is the discount rate. In determining the appropriate discount rate for
plans operated in India, the management considers the interest rates of government bonds in currencies
consistent with the currencies of the post-employment benefit obligation.
The mortality rate is based on publicly available mortality tables for the specific countries. Those mortality
tables tend to change only at interval in response to demographic changes. Future salary increases and
gratuity increases are based on expected future inflation rates for the respective countries. Further details
about gratuity obligations are given in Note 31.

ANNUAL REPORT 2017-2018
71
Notes to Financial Statements for the year ended March 31, 2018(All amounts in Indian Rupees millions, except share data and where otherwise stated)
(ii) Depreciation on property, plant and equipment
Depreciation on property, plant and equipment is calculated on a straight-line basis using the rates arrived
at based on the useful lives and residual values of all its property, plant and equipment estimated by the
management. The management believes that depreciation rates currently used fairly reflect its estimate of
the useful lives and residual values of property, plant and equipment, though these rates in certain cases are
different from lives prescribed under Schedule II of the Companies Act, 2013.
36 Fair Values
Set out below, is a comparison by class of the carrying amounts and fair value of the Company’s financial instruments:
Carrying value Fair value
March 31, March 31, March 31, March 31,2018 2017 2018 2017
Financial assets at amortised cost:Loans 63.57 59.67 63.57 59.67
Deposits and others 34.35 4.42 34.35 4.42
Trade receivables 4,752.10 4,178.73 4,752.10 4,178.73
Cash & cash equivalents 3,728.41 5,330.76 3,728.41 5,330.76
Bank balances other than above 2,979.98 - 2,979.98 -
Financial liabilities at amortised cost:Borrowings (including current maturities) 59.15 63.76 59.15 63.76
Trade Payables 2,924.15 1,892.90 2,924.15 1,892.90
Other liabilities 519.85 502.81 519.85 502.81
The management assessed that cash and cash equivalents, trade receivables, trade payables and other current liabilities
approximate their carrying amounts largely due to the short-term maturities of these instruments.
The fair value of the financial assets and liabilities is included at the amount at which the instrument could be
exchanged in a current transaction between willing parties, other than in a forced or liquidation sale.
37 Financial risk management objectives and policies
Financial Risk Management Framework
The Company is exposed primarily to Credit Risk, Liquidity Risk and Market risk (fluctuations in foreign currency
exchange rates and interest rate), which may adversely impact the fair value of its financial instruments. The Company
assesses the unpredictability of the financial environment and seeks to mitigate potential adverse effects on the
financial performance of the Company.
A Credit Risk
Credit risk is the risk that counterparty will not meet its obligations under a financial instrument or customer
contract, leading to a financial loss. Credit risk encompasses of both, the direct risk of default and the risk of
deterioration of creditworthiness as well as concentration of risks. Credit risk is controlled by analysing credit
limits and creditworthiness of customers on a continuous basis to whom the credit has been granted after
obtaining necessary approvals for credit. Financial instruments that are subject to concentrations of credit risk
principally consist of trade receivables, cash and cash equivalents, bank deposits and other financial assets. None
of the financial instruments of the Company result in material concentration of credit risk, except for trade
receivables.
Trade receivables:
The customer credit risk is managed by the Company’s established policy, procedures and control relating to
customer credit risk management. Credit quality of a customer is assessed based on the individual credit limits are
defined in accordance with this assessment and outstanding customer receivables are regularly monitored. The

AN
NU
AL R
EP
OR
T 2
017-2018
72
Notes to Financial Statements for the year ended March 31, 2018(All amounts in Indian Rupees millions, except share data and where otherwise stated)
Company’ receivables turnover is quick and historically, there were no significant defaults on account of any
customer in the past. Ind AS requires an entity to recognise in profit or loss, the amount of expected credit losses
(or reversal) that is required to adjust the loss allowance at the reporting date to the amount that is required to
be recognised in accordance with Ind AS 109. The Company assesses at each date of statements of financial
position whether a financial asset or a group of financial assets is impaired. Expected credit losses are measured
at an amount equal to the 12 month expected credit losses or at an amount equal to the life time expected credit
losses if the credit risk on the financial asset has increased significantly since initial recognition. The Company
has used a practical expedient by computing the expected credit loss allowance for trade receivables based on a
provision matrix. The provision matrix takes into account historical credit loss experience and adjusted for
forward-looking information.
Before accepting any new customer, the Company uses an internal credit scoring system to assess the potential
customer’s credit quality and defines credit limits by customer. Limits and scoring attributed to customers are
reviewed on periodic basis.
Exposure to credit risk:
The carrying amount of financial assets represents the maximum credit exposure. The maximum exposure to credit
risk was Rs. 4,752.10 and Rs. 4,178.73 as of March 31, 2018 and March 31, 2017 respectively, being the total of
the carrying amount of balances with trade receivables.
B Liquidity Risk
Liquidity risk refers to the risk that the Company cannot meet its financial obligations. The objective of liquidity
risk management is to maintain sufficient liquidity and ensure that funds are available for use as per requirements.
The Company manages liquidity risk by maintaining adequate reserves, banking facilities and reserve borrowing
facilities, by continuously monitoring forecast and actual cash flows, and by matching the maturity profiles of
financial assets and liabilities.
The table below summarises the maturity profile of the Company’s financial liabilities based on contractual
undiscounted payments:
Up to 1 Year 1 to 3 years 3 to 5 years > 5 years Total
March 31, 2018:Borrowings (including current maturities) 4.26 14.21 2.48 38.20 59.15
Trade Payables 2,924.15 - - - 2,924.15
Other Payables 514.28 - - 5.57 519.85
3,442.69 14.21 2.48 43.77 3,503.15March 31, 2017:Borrowings (including current maturities) 4.60 9.56 10.26 39.34 63.76
Trade Payables 1,892.90 - - - 1,892.90
Other Payables 499.14 - - 3.67 502.81
2,396.64 9.56 10.26 43.01 2,459.47
C Market Risk
Market risk is the risk that the fair value or future cash flows of a financial instrument will fluctuate because of
changes in market prices. Such changes in the values of financial instruments may result from changes in the
foreign currency exchange rates, interest rates, credit, liquidity and other market changes.
C1 . Interest rate risk
Interest rate risk is the risk that the fair value or future cash flows of a financial instrument will fluctuate because
of change in market interest rates. The Company’s exposure to the risk of changes in market interest rates relates
primarily to the Company’s long-term debt obligations with floating interest rates. In order to optimize the
Company’s position with regards to interest income and interest expenses and to manage the interest rate risk,
treasury performs a comprehensive corporate interest risk management by balancing the proportion of fixed rate
and floating rate financial instruments in its total portfolio.
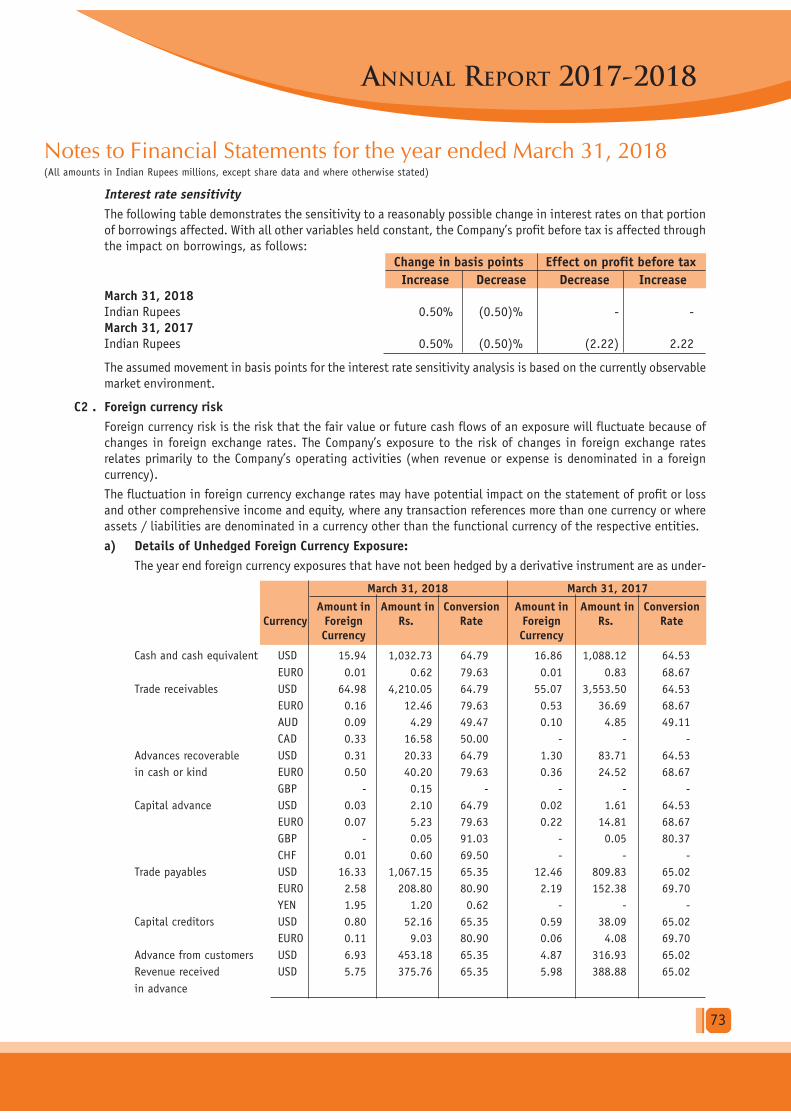
ANNUAL REPORT 2017-2018
73
Notes to Financial Statements for the year ended March 31, 2018(All amounts in Indian Rupees millions, except share data and where otherwise stated)
Interest rate sensitivity
The following table demonstrates the sensitivity to a reasonably possible change in interest rates on that portion
of borrowings affected. With all other variables held constant, the Company’s profit before tax is affected through
the impact on borrowings, as follows:
Change in basis points Effect on profit before tax
Increase Decrease Decrease IncreaseMarch 31, 2018Indian Rupees 0.50% (0.50)% - -
March 31, 2017Indian Rupees 0.50% (0.50)% (2.22) 2.22
The assumed movement in basis points for the interest rate sensitivity analysis is based on the currently observable
market environment.
C2 . Foreign currency risk
Foreign currency risk is the risk that the fair value or future cash flows of an exposure will fluctuate because of
changes in foreign exchange rates. The Company’s exposure to the risk of changes in foreign exchange rates
relates primarily to the Company’s operating activities (when revenue or expense is denominated in a foreign
currency).
The fluctuation in foreign currency exchange rates may have potential impact on the statement of profit or loss
and other comprehensive income and equity, where any transaction references more than one currency or where
assets / liabilities are denominated in a currency other than the functional currency of the respective entities.
a) Details of Unhedged Foreign Currency Exposure:
The year end foreign currency exposures that have not been hedged by a derivative instrument are as under-
March 31, 2018 March 31, 2017
Amount in Amount in Conversion Amount in Amount in ConversionCurrency Foreign Rs. Rate Foreign Rs. Rate
Currency Currency
Cash and cash equivalent USD 15.94 1,032.73 64.79 16.86 1,088.12 64.53
EURO 0.01 0.62 79.63 0.01 0.83 68.67
Trade receivables USD 64.98 4,210.05 64.79 55.07 3,553.50 64.53
EURO 0.16 12.46 79.63 0.53 36.69 68.67
AUD 0.09 4.29 49.47 0.10 4.85 49.11
CAD 0.33 16.58 50.00 - - -
Advances recoverable USD 0.31 20.33 64.79 1.30 83.71 64.53
in cash or kind EURO 0.50 40.20 79.63 0.36 24.52 68.67
GBP - 0.15 - - - -
Capital advance USD 0.03 2.10 64.79 0.02 1.61 64.53
EURO 0.07 5.23 79.63 0.22 14.81 68.67
GBP - 0.05 91.03 - 0.05 80.37
CHF 0.01 0.60 69.50 - - -
Trade payables USD 16.33 1,067.15 65.35 12.46 809.83 65.02
EURO 2.58 208.80 80.90 2.19 152.38 69.70
YEN 1.95 1.20 0.62 - - -
Capital creditors USD 0.80 52.16 65.35 0.59 38.09 65.02
EURO 0.11 9.03 80.90 0.06 4.08 69.70
Advance from customers USD 6.93 453.18 65.35 4.87 316.93 65.02
Revenue received USD 5.75 375.76 65.35 5.98 388.88 65.02
in advance

AN
NU
AL R
EP
OR
T 2
017-2018
74
Notes to Financial Statements for the year ended March 31, 2018(All amounts in Indian Rupees millions, except share data and where otherwise stated)
b) Foreign currency sensitivity:
The following tables demonstrate the sensitivity to a reasonably possible change in USD and EURO
exchange rates, with all other variables held constant. The impact on the Company’s profit before tax
is due to changes in the fair value of monetary assets and liabilities. The Company’s exposure to
foreign currency changes for all other currencies is not material.
Change in Exchange rate Effect on profit before tax
Increase Decrease Increase/(Decrease)March 31, 2018USD 1.00% 1.00% 33.17 (33.17)
EURO 1.00% 1.00% (1.59) 1.59
March 31, 2017USD 1.00% 1.00% 32.07 (32.07)
EURO 1.00% 1.00% (0.80) 0.80
38 . Capital management
For the purpose of the Company’s capital management, capital includes issued equity capital, share premium and all
other equity reserves attributable to the equity holders. The primary objective of the Company’s capital management is
to maximise the shareholder value.
The Company manages its capital structure in consideration to the changes in economic conditions and the requirements
of the financial covenants.
No changes were made in the objectives, policies or processes for managing capital during the period ended March 31,
2018 and March 31, 2017.
39 Commitments and Contingencies
a. Leases
Operating lease commitments - Company as lessee
Operating leases are mainly in the nature of lease of office premises with no restrictions and are renewable/
cancellable at the option of either of the parties. The escalation rates range from 0% to 10% per annum as per
the terms of the lease agreement. There are no sub-leases. There are no restrictions imposed by lease arrangements.
The aggregate amount of operating lease payments recognized in the Statement of Profit and Loss is Rs. 24.84
(March 31, 2017: Rs. 62.74).
b. Commitments
March 31, 2018 March 31, 2017Estimated amount of contracts remaining
to be executed on capital account and not provided for 312.30 196.64
Other commitments Nil Nil
c. Contingent Liabilities
March 31, 2018 March 31, 2017
(i) Outstanding bank guarantees (excluding performance obligations) 22.51 25.70
(ii) Claims against the Company not acknowledged as debts 33.39 21.08
(iii) Demand for direct taxes 9.63 0.86
(iv) Demand for indirect taxes 134.61 792.26
200.14 839.90
40 Disclosure on Specified Bank Notes (SBNs)
During the previous year, the Company had specified bank notes or other denomination note as defined in the MCA
notification G.S.R. 308(E) dated March 31, 2017 on the details of Specified Bank Notes (SBN) held and transacted
ANNUAL REPORT 2017-2018
75
Notes to Financial Statements for the year ended March 31, 2018(All amounts in Indian Rupees millions, except share data and where otherwise stated)
during the period from November 8, 2016 to December 30, 2016, the denomination wise SBNs and other notes as per
the notification is given below:
OtherSBNs* denomination Total
notes
Closing cash in hand as on November 08, 2016 0.68 0.33 1.01
Add: Permitted receipts - 3.11 3.11
Less: Permitted payments - 2.93 2.93
Less: Amount deposited in banks 0.68 - 0.68
Closing cash in hand as on December 30, 2016 - 0.51 0.51
*For the purposes of this clause, the term ‘Specified Bank Notes’ shall have the same meaning provided in the notification
of the Government of India, in the Ministry of Finance, Department of Economic Affairs number S.O. 3407(E), dated the
8th November, 2016.
41 Segment reporting
For management purposes, the Company is organised into business units based on its markets and has three reportable
segments, as follows:
Segments are identified in line with Ind AS 108 ‘Operating segments’, taking into consideration the internal organisation
and management structure as well as the differential risk and returns of the segment.
Although the Company’s operating divisions are managed on a worldwide basis, they operate in 3 major geographical
areas of the world, in India (its home country), North America & Europe and Rest of World.
For the financial year ended March 31, 2018Segment Carrying amountrevenue of segment assets
India 3,000.13 25,375.47
North America & Europe 12,469.06 3,253.07
Rest of the world 759.74 654.87
Total 16,228.93 29,283.41
For the financial year ended March 31, 2017Segment Carrying amountrevenue of segment assets
India 3,241.60 20,815.77
North America & Europe 10,684.16 3,140.94
Rest of the world 990.51 780.74
Total 14,916.27 24,737.45
The Company has entire fixed assets situated within India for producing goods to sell in domestic as well as overseas
markets. Hence, separate figures for fixed assets/ additions to fixed assets have not been furnished.
42 Standards issued but not yet effective
The amendments to standards that are issued, but not yet effective, up to the date of issuance of the Company’s
financial statements are disclosed below. The Company intends to adopt these standards, if applicable, when they
become effective.The Ministry of Corporate Affairs (MCA) has issued the Companies (Indian Accounting Standards)
Amendment Rules, 2017 and Companies (Indian Accounting Standards) Amendment Rules, 2018 amending the following
standard:

AN
NU
AL R
EP
OR
T 2
017-2018
76
Notes to Financial Statements for the year ended March 31, 2018(All amounts in Indian Rupees millions, except share data and where otherwise stated)
i. Ind AS 115, Revenue from contracts with customers
Ind AS 115 was notified on March 28, 2018 and establishes a five-step model to account for revenue arising from
contracts with customers. Under Ind AS 115, revenue is recognised at an amount that reflects the consideration
to which an entity expects to be entitled in exchange for transferring goods or services to a customer.
The new revenue standard will supersede all current revenue recognition requirements under Ind AS. This new
standard requires revenue to be recognized when promised goods or services are transferred to customers in
amounts that reflect the consideration to which the Company expects to be entitled in exchange for those goods
or services. Adoption of the new rules could affect the timing of revenue recognition for certain transactions of
the Company. Ind AS 115 is effective for the Company in the first quarter of fiscal 2019 using either one of two
methods:
(i) retrospectively to each prior reporting period presented in accordance with Ind AS 8 Accounting Policies,
Changes in Accounting Estimates and Errors, with the option to elect certain practical expedients as defined
within Ind AS 115 (the full retrospective method); or (ii) retrospectively with the cumulative effect of initially
applying Ind AS 115 recognized at the date of initial application (1 April, 2018) and providing certain additional
disclosures as defined in Ind AS 115 (the modified retrospective method).The Company continues to evaluate the
available transition methods and its contractual arrangements. The ultimate impact on revenue resulting from the
application of Ind AS 115 will be subject to assessments that are dependent on many variables, including, but not
limited to, the terms of the contractual arrangements and the mix of business. The Company’s considerations also
include, but are not limited to, the comparability of its financial statements and the comparability within its
industry from application of the new standard to its contractual arrangements. The management continues to
evaluate the changes to accounting system and processes, and additional disclosure requirements that may be
necessary. A reliable estimate of the quantitative impact of Ind AS 115 on the financial statements will only be
possible once the implementation project has been completed.
ii. Amendments to certain Indian Accounting Standards:
The Ministry of Corporate Affairs (MCA), on March 28, 2018, issued certain amendments to Ind AS. The amendments
relate to the following standards:
- Ind AS 21, The Effects of Changes in Foreign Exchange Rates,
- Ind AS 12, Income Taxes and
- Ind AS 112, Disclosure of Interests in Other Entities
The amendments are effective April 01, 2018. The Company believes that the aforementioned amendments will
not materially impact the financial position, performance or the cash flows of the Company.
As per our report of even date.
For S.R.BATLIBOI & ASSOCIATES LLP For and on behalf of the Board of Directors
Chartered Accountants Gland Pharma LimitedICAI Firm Registration Number : 101049W/E300004
per Navneet Rai Kabra Dr. Ravi Penmetsa Guan XiaohuiPartner Managing Director and Director
Membership No. 102328 Chief Executive Officer DIN: 07675466
DIN: 0179939
Yiran Peng P. Sampath KumarDirector and Company Secretary
Chief Financial Officer
DIN: 07675475
Place: Hyderabad Place: Hyderabad
Date: August 21, 2018 Date: August 21, 2018

FORM NO. MGT-11
Proxy form[Pursuant to Section 105(6) of the Companies Act, 2013 and Rule 19(3) of the Companies
(Management and Administration) Rules, 2014]
CIN: U24239AP1978PLC002276
Name of the Company: Gland Pharma Limited
Registered Office: 6-3-865/1/2, Flat 201, Greenland Apts., Ameerpet, Hyderabad – 500 016
Name of the member(s):
Registered address:
Email ID:
Folio No.:
1. Name:
Address:
E-mail Id:
Signature:
2. Name:
Address:
E-mail Id:
Signature:
as my/our proxy to attend and vote (on a poll) for me/us and on my/our behalf at the 40th Annual General Meeting of the Company,
to be held on Monday, 17th September, 2018 at 11:00 A.M . at the registered office of the Company situated at Flat No. 201, Greenland
Apartments, Ameerpet, Hyderabad – 500 016 and at any adjournment thereof in respect of such resolutions as are indicated below:
Resolution No. Particulars
1. To adopt the Annual Financial Statements.
2. To appoint a Director in place of Dr. Ravi Penmetsa who retires by rotation and being eligible, offers himself for
re-appointment.
3. To appoint a Director in place of Mr. Peng Yiran, who retires by rotation and being eligible, offers himself for
re-appointment
4. To appoint Statutory Auditors
5. To approve shifting of Registered Office of the company
Signed this ................day of ................, 2018
Signature of Proxy holder(s) Signature of shareholder(s)
Notes: 1. This form of proxy in order to be effective should be duly completed and deposited at the Registered Office of the Company,
not less than 48 hours before the commencement of the Meeting.
Affix
Revenue
Stamp
of Re.1/-
I/We, being the member(s) of the Company holding .......................... Equity shares of the above named Company, hereby appoint
or failing him