board of directors meeting - connecticut (xerox) ... by licensed carriers in the state. ... about...
TRANSCRIPT

Board of Directors Meeting
May 19, 2016
Agenda
A. Call to Order and Introductions B. Public Comment C. Review and Approval of Minutes April 21, 2016 Regular Meeting Minutes (Vote) May 10, 2016 Special Meeting Minutes (Vote)
D. CEO Report E. Finance – Budget (Vote) F. Texas Health Institute Presentation - Marketplace Health Equity Assessment G. APCD Update H. Adjournment
Votes
• April 21, 2016 Regular Meeting Minutes • May 10, 2016 Special Meeting Minutes

CEO Report

2017 Fiscal Year Budget &
2017 Financial Sustainability
May 2016
5
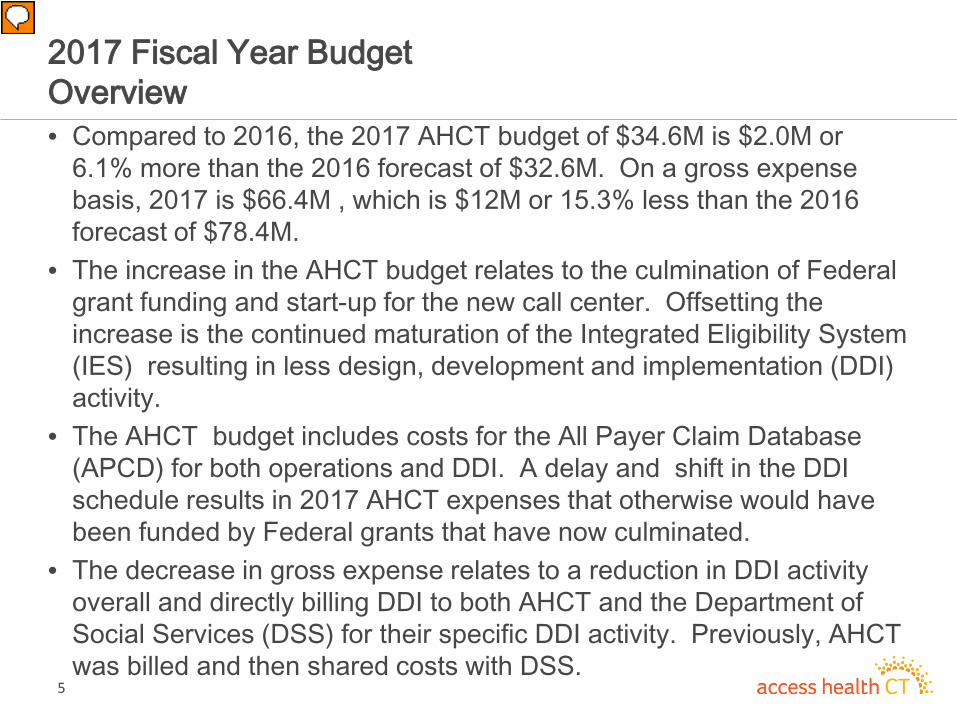
2017 Fiscal Year Budget Overview • Compared to 2016, the 2017 AHCT budget of $34.6M is $2.0M or
6.1% more than the 2016 forecast of $32.6M. On a gross expense basis, 2017 is $66.4M , which is $12M or 15.3% less than the 2016 forecast of $78.4M.
• The increase in the AHCT budget relates to the culmination of Federal grant funding and start-up for the new call center. Offsetting the increase is the continued maturation of the Integrated Eligibility System (IES) resulting in less design, development and implementation (DDI) activity.
• The AHCT budget includes costs for the All Payer Claim Database (APCD) for both operations and DDI. A delay and shift in the DDI schedule results in 2017 AHCT expenses that otherwise would have been funded by Federal grants that have now culminated.
• The decrease in gross expense relates to a reduction in DDI activity overall and directly billing DDI to both AHCT and the Department of Social Services (DSS) for their specific DDI activity. Previously, AHCT was billed and then shared costs with DSS.

6
Access Health CT Budget Cycle
FY 2015 FY 2016 FY 2017
Funding: Primarily federally funding by Level 2 Supplemental, 2013 Level I and 2014 Level I Grants. Partial Marketplace Assessment revenue. Expense Structure: Design, Development and Implementation (DDI) as well as Operational costs.
Funding: Primarily Marketplace Assessment revenue with federal funding by Level 2 Supplemental, 2013 Level I and 2014 Level I Grants. Expense Structure: Operational costs with some continuing DDI that is primarily enhancements and resolving issues.
Funding: Primarily Marketplace Assessment revenue with federal funding by 2014 Level I Grant. Expense Structure: Operational costs with limited DDI that is primarily enhancements.

7
2017 Fiscal Year Budget 2017 vs. 2016 Fiscal Year Forecast
Variances • Salary & Fringe costs
increases due to conversion of Temp Staff to permanent and timing of hiring FY16 positions.
• Temporary Staffing, Contractual, and Equipment and Maintenance – See page 5 for detail
Access Health CT Budget DSS Reimb Grant AHCTSalaries 8,065,818$ -$ -$ 8,065,818$ Fringe Benefits 2,419,745$ -$ -$ 2,419,745$ Temporary Staffing 2,021,349$ 1,585,079$ -$ 436,270$ Contractual 38,865,708$ 18,082,305$ 2,054,556$ 18,728,847$ Equipment and Maintenance 13,803,144$ 10,064,566$ -$ 3,738,578$ Supplies 31,550$ -$ -$ 31,550$ Travel 118,500$ -$ -$ 118,500$ Other Administrative 1,061,813$ -$ -$ 1,061,813$ Total Expense 66,387,627$ 29,731,950$ 2,054,556$ 34,601,121$
Access Health CT Forecast DSS Reimb Grant AHCTSalaries 7,180,710$ -$ (168,050)$ 7,348,760$ Fringe Benefits 2,154,213$ -$ 24,526$ 2,129,687$ Temporary Staffing 3,246,287$ 1,783,286$ 320,617$ 1,142,384$ Contractual 52,814,746$ 26,717,644$ 8,661,585$ 17,435,517$ Equipment and Maintenance 11,550,356$ 8,535,570$ (83,120)$ 3,097,905$ Supplies 38,252$ -$ (6)$ 38,258$ Travel 252,715$ -$ (5,590)$ 258,304$ Other Administrative 1,202,628$ -$ 29,400$ 1,173,227$ Total Expense 78,439,906$ 37,036,500$ 8,779,364$ 32,624,043$
Access Health CT Variance DSS Reimb Grant AHCTSalaries 885,107$ -$ 168,050$ 717,058$ Fringe Benefits 265,532$ -$ (24,526)$ 290,059$ Temporary Staffing (1,224,938)$ (198,207)$ (320,617)$ (706,114)$ Contractual (13,949,038)$ (8,635,339)$ (6,607,030)$ 1,293,330$ Equipment and Maintenance 2,252,788$ 1,528,996$ 83,120$ 640,673$ Supplies (6,702)$ -$ 6$ (6,708)$ Travel (134,215)$ -$ 5,590$ (139,804)$ Other Administrative (140,815)$ -$ (29,400)$ (111,415)$ Total Expense (12,052,280)$ (7,304,550)$ (6,724,808)$ 1,977,078$
Fiscal Year 2017
Fiscal Year 2016
FY17 v FY16 Variance
8
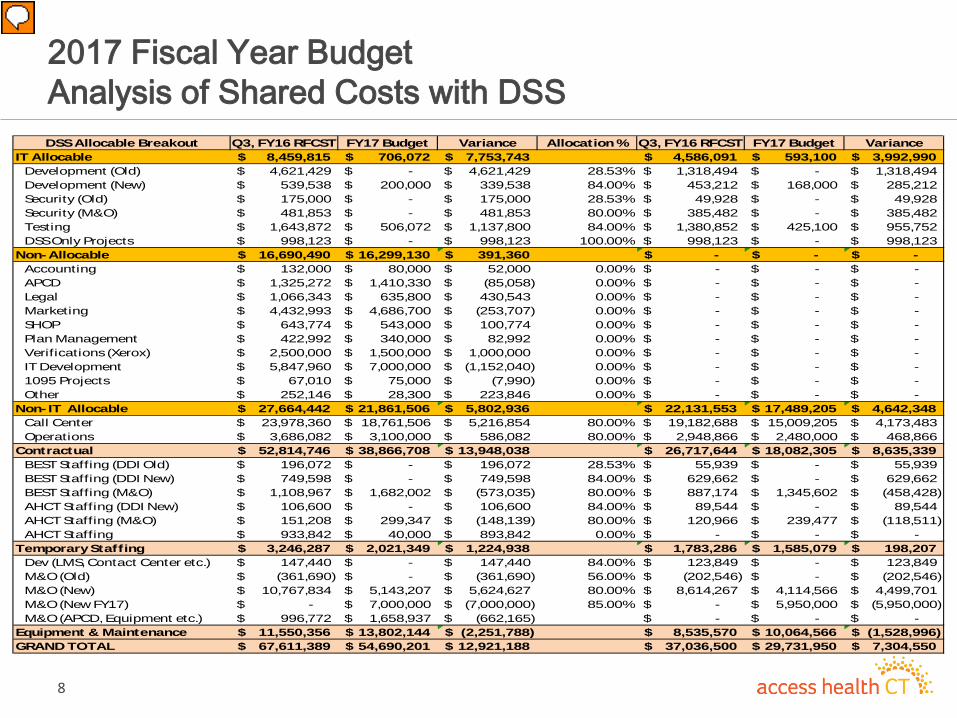
2017 Fiscal Year Budget Analysis of Shared Costs with DSS DSS Allocable Breakout Q3, FY16 RFCST FY17 Budget Variance Allocation % Q3, FY16 RFCST FY17 Budget Variance
IT Allocable 8,459,815$ 706,072$ 7,753,743$ 4,586,091$ 593,100$ 3,992,990$ Development (Old) 4,621,429$ -$ 4,621,429$ 28.53% 1,318,494$ -$ 1,318,494$ Development (New) 539,538$ 200,000$ 339,538$ 84.00% 453,212$ 168,000$ 285,212$ Security (Old) 175,000$ -$ 175,000$ 28.53% 49,928$ -$ 49,928$ Security (M&O) 481,853$ -$ 481,853$ 80.00% 385,482$ -$ 385,482$ Testing 1,643,872$ 506,072$ 1,137,800$ 84.00% 1,380,852$ 425,100$ 955,752$ DSS Only Projects 998,123$ -$ 998,123$ 100.00% 998,123$ -$ 998,123$
Non-Allocable 16,690,490$ 16,299,130$ 391,360$ -$ -$ -$ Accounting 132,000$ 80,000$ 52,000$ 0.00% -$ -$ -$ APCD 1,325,272$ 1,410,330$ (85,058)$ 0.00% -$ -$ -$ Legal 1,066,343$ 635,800$ 430,543$ 0.00% -$ -$ -$ Marketing 4,432,993$ 4,686,700$ (253,707)$ 0.00% -$ -$ -$ SHOP 643,774$ 543,000$ 100,774$ 0.00% -$ -$ -$ Plan Management 422,992$ 340,000$ 82,992$ 0.00% -$ -$ -$ Verifications (Xerox) 2,500,000$ 1,500,000$ 1,000,000$ 0.00% -$ -$ -$ IT Development 5,847,960$ 7,000,000$ (1,152,040)$ 0.00% -$ -$ -$ 1095 Projects 67,010$ 75,000$ (7,990)$ 0.00% -$ -$ -$ Other 252,146$ 28,300$ 223,846$ 0.00% -$ -$ -$
Non- IT Allocable 27,664,442$ 21,861,506$ 5,802,936$ 22,131,553$ 17,489,205$ 4,642,348$ Call Center 23,978,360$ 18,761,506$ 5,216,854$ 80.00% 19,182,688$ 15,009,205$ 4,173,483$ Operations 3,686,082$ 3,100,000$ 586,082$ 80.00% 2,948,866$ 2,480,000$ 468,866$
Contractual 52,814,746$ 38,866,708$ 13,948,038$ 26,717,644$ 18,082,305$ 8,635,339$ BEST Staffing (DDI Old) 196,072$ -$ 196,072$ 28.53% 55,939$ -$ 55,939$ BEST Staffing (DDI New) 749,598$ -$ 749,598$ 84.00% 629,662$ -$ 629,662$ BEST Staffing (M&O) 1,108,967$ 1,682,002$ (573,035)$ 80.00% 887,174$ 1,345,602$ (458,428)$ AHCT Staffing (DDI New) 106,600$ -$ 106,600$ 84.00% 89,544$ -$ 89,544$ AHCT Staffing (M&O) 151,208$ 299,347$ (148,139)$ 80.00% 120,966$ 239,477$ (118,511)$ AHCT Staffing 933,842$ 40,000$ 893,842$ 0.00% -$ -$ -$
Temporary Staffing 3,246,287$ 2,021,349$ 1,224,938$ 1,783,286$ 1,585,079$ 198,207$ Dev (LMS, Contact Center etc.) 147,440$ -$ 147,440$ 84.00% 123,849$ -$ 123,849$ M&O (Old) (361,690)$ -$ (361,690)$ 56.00% (202,546)$ -$ (202,546)$ M&O (New) 10,767,834$ 5,143,207$ 5,624,627$ 80.00% 8,614,267$ 4,114,566$ 4,499,701$ M&O (New FY17) -$ 7,000,000$ (7,000,000)$ 85.00% -$ 5,950,000$ (5,950,000)$ M&O (APCD, Equipment etc.) 996,772$ 1,658,937$ (662,165)$ -$ -$ -$
Equipment & Maintenance 11,550,356$ 13,802,144$ (2,251,788)$ 8,535,570$ 10,064,566$ (1,528,996)$ GRAND TOTAL 67,611,389$ 54,690,201$ 12,921,188$ 37,036,500$ 29,731,950$ 7,304,550$
9
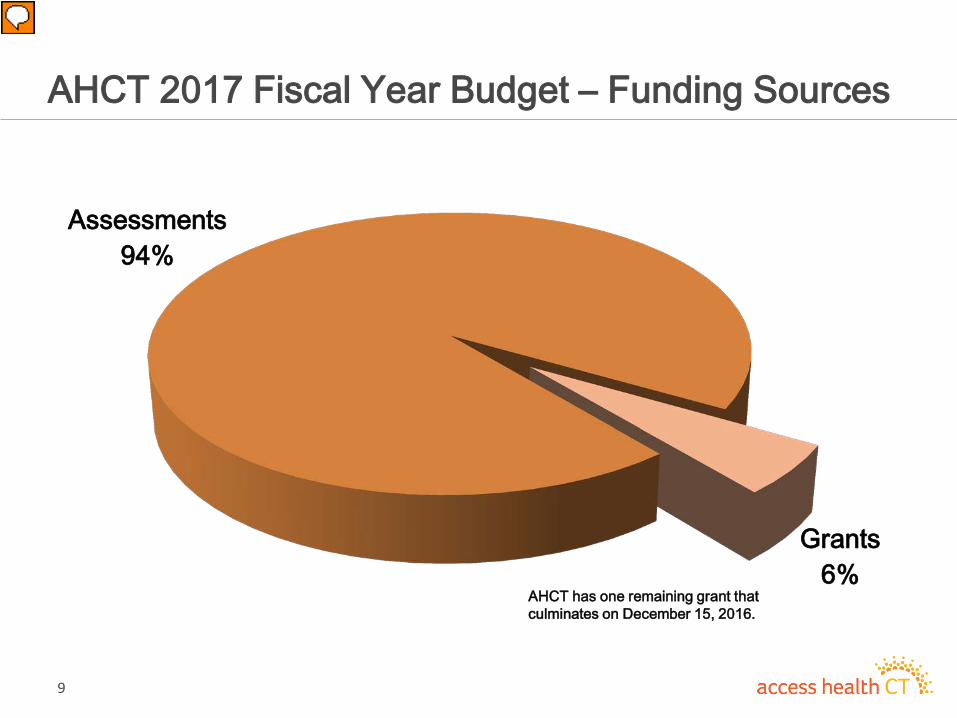
AHCT 2017 Fiscal Year Budget – Funding Sources
Assessments 94%
Grants 6%
AHCT has one remaining grant that culminates on December 15, 2016.

10
AHCT 2017 Fiscal Year Budget – Total vs Recurring
AHCT $34.6M
APCD $1.4M
Operations $26.4 M
APCD $1.4M
IT Development $5.1M
Call Center $0.4M
$20
$22
$24
$26
$28
$30
$32
$34
$36
AHCT Non-Recurring Recurring
Call Center: Annual est. stand Up costs spread over three year contract, until FY19. Total $1.8M, AHCT est. share of 20%. APCD: Final development costs for APCD Implementation
AHCT $32.8
11
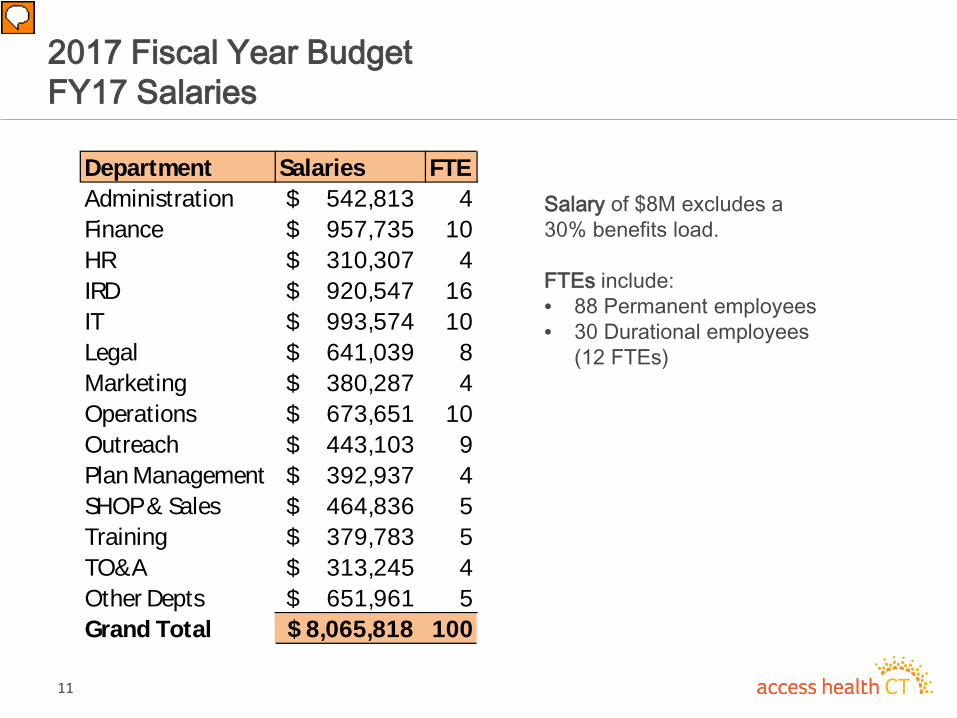
2017 Fiscal Year Budget FY17 Salaries
Salary of $8M excludes a 30% benefits load. FTEs include: • 88 Permanent employees • 30 Durational employees
(12 FTEs)
Department Salaries FTEAdministration 542,813$ 4Finance 957,735$ 10HR 310,307$ 4IRD 920,547$ 16IT 993,574$ 10Legal 641,039$ 8Marketing 380,287$ 4Operations 673,651$ 10Outreach 443,103$ 9Plan Management 392,937$ 4SHOP & Sales 464,836$ 5Training 379,783$ 5TO&A 313,245$ 4Other Depts 651,961$ 5Grand Total 8,065,818$ 100

12
$7,181
$8,066
$15
$142 $11 ($80)
$398 $42 $26
$73 $19
( $67) $67 $51
$71
$115
$7,000
$7,200
$7,400
$7,600
$7,800
$8,000
$8,200
2017 Fiscal Year Budget FY16 vs. FY17 Salaries
Salary increase includes timing of hiring FY16 employees and conversion of temp staffing, mainly IT, resulting in overall cost savings.

13
2017 Fiscal Year Budget Risks and Opportunities • Risks and opportunities to the AHCT 2017 budget include
– Risks • Transition and start-up of new call center vendor • System maintenance & operations (M&O) contract in process • Expanding mobile app to Medicaid • Cost sharing with DSS • Insurance renewal costs
– Opportunities
• New call center • Cost sharing with DSS • M&O contract • Business Process Outsourcing (BPO)
14
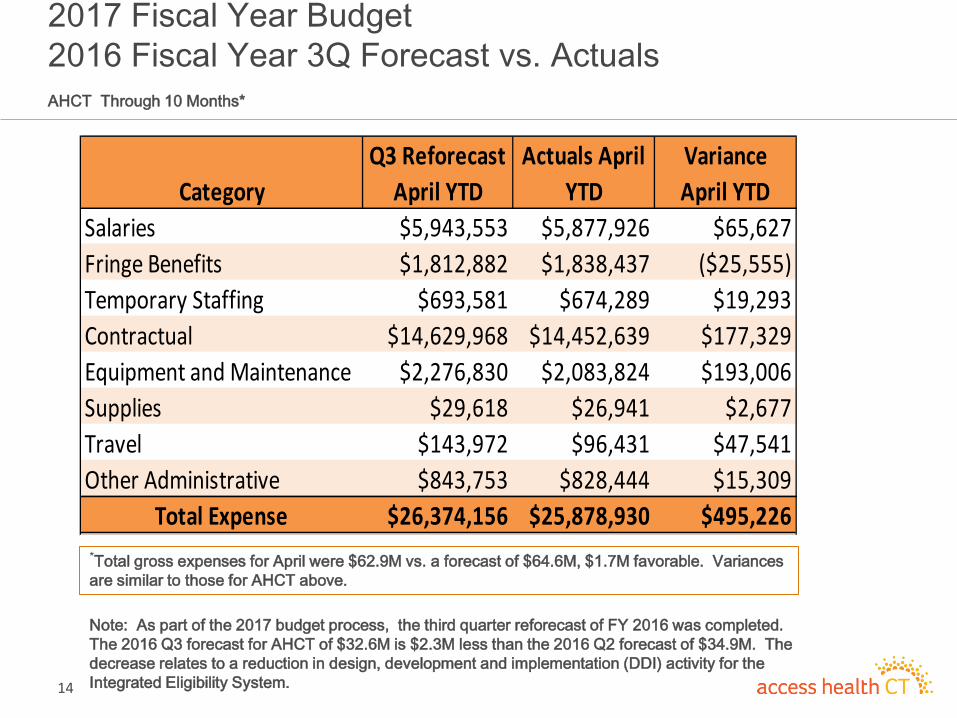
2017 Fiscal Year Budget 2016 Fiscal Year 3Q Forecast vs. Actuals AHCT Through 10 Months*
Note: As part of the 2017 budget process, the third quarter reforecast of FY 2016 was completed. The 2016 Q3 forecast for AHCT of $32.6M is $2.3M less than the 2016 Q2 forecast of $34.9M. The decrease relates to a reduction in design, development and implementation (DDI) activity for the Integrated Eligibility System.
CategoryQ3 Reforecast
April YTDActuals April
YTDVariance April YTD
Salaries $5,943,553 $5,877,926 $65,627Fringe Benefits $1,812,882 $1,838,437 ($25,555)Temporary Staffing $693,581 $674,289 $19,293Contractual $14,629,968 $14,452,639 $177,329Equipment and Maintenance $2,276,830 $2,083,824 $193,006Supplies $29,618 $26,941 $2,677Travel $143,972 $96,431 $47,541Other Administrative $843,753 $828,444 $15,309
Total Expense $26,374,156 $25,878,930 $495,226*Total gross expenses for April were $62.9M vs. a forecast of $64.6M, $1.7M favorable. Variances are similar to those for AHCT above.

2017 Financial Sustainability

16
2017 Fiscal Sustainability Overview • The marketplace assessment was approved in 2013 and was charged
for the first time in CY 2014 based on Statewide Individual, Small Group and Dental premium.
• 2017 will be the fourth year of the marketplace assessment. The actual assessment will be calculated on CY 2015 premium. This timing is used to be able to rely on the most recent officially filed data by licensed carriers in the State.
• In 2015, the Board of Directors approved a marketplace assessment rate of 165 bps for two calendar years, 2016 and 2017.
• The analysis that follows displays the historical results of the marketplace assessments since inception and an estimated projection of 2017 assessments at 165 bps. Based on this a cash reserve of approximately 5 months is anticipated.

17
Fiscal Year Assessments
$24,468 $25,949
$24,638
165 BP
$-
$5,000
$10,000
$15,000
$20,000
$25,000
$30,000
$35,000
2016 2017 20189 Mth Reserve 165 BP

18
Fiscal Year Assessments – Historical and Projection
Assessment is calculated on a calendar basis and remains at 165bps, which was set at 75% of requirement
165 BP in 2016 and 2017 ($'s in 000's)
Premium Marketplace Assessment Assessment Year End
Base Year Premium Collection Year Rate Reserve
2012 1,846,453$ 2014-15 0.0135 24,927$ 12,464$ 24,479$ 2013 2,141,986$ 2015-16 0.0135 28,917$ 26,922$ 16,376$ 2014 2,025,492$ 2016-17 0.0165 33,421$ 31,169$ 14,921$ 2015 2,098,035$ 2017-18 0.0165 34,618$ 34,019$ 14,341$ 2016 2,208,813$ 2018-19 0.0165 36,445$ 35,531$ 17,022$
Calendar Year Marketplace Assessment
Fiscal Year Marketplace Assessment

Advancing Health Equity in the Health Insurance Marketplace
FINDINGS FROM CONNECTICUT’S MARKETPLACE HEALTH EQUITY ASSESSMENT TOOL (M-HEAT)
Dennis Andrulis, PhD, MPH Senior Research Scientist
Nadia Siddiqui, MPH
Director for Health Equity Programs
Presentation to AHCT Board of Directors May 19, 2016 | Hartford, CT
Supported by W.K. Kellogg Foundation & Connecticut Health Foundation 19

About Texas Health Institute
Marketplace Health Equity Assessment Tool
Background & Design
Results
Moving Forward
OVERVIEW
20

ABOUT TEXAS HEALTH INSTITUTE
Non-partisan, nonprofit public health research and policy institute based in Austin, Texas
Monitoring national health reform from a health equity lens since 2007 across 5 key areas:
• Health insurance • Health care safety net • Health care workforce • Data & quality • Public health & prevention
21

M-HEAT BACKGROUND & DESIGN
22
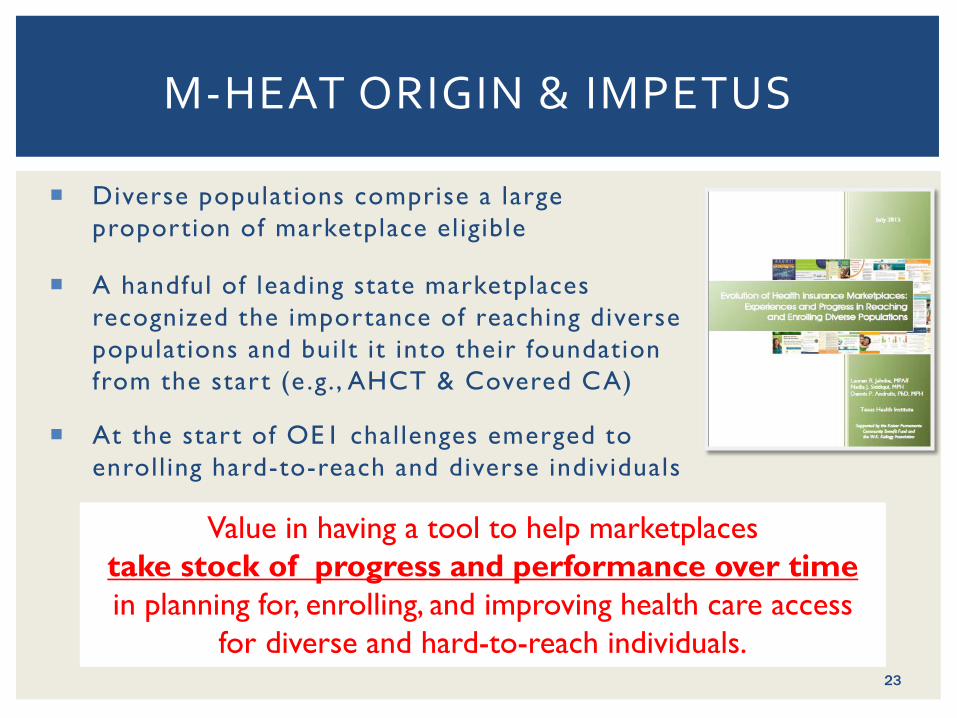
Diverse populations comprise a large proportion of marketplace eligible
A handful of leading state marketplaces recognized the importance of reaching diverse populations and built it into their foundation from the start (e .g. , AHCT & Covered CA)
At the start of OE1 challenges emerged to enrolling hard-to-reach and diverse individuals
M-HEAT ORIGIN & IMPETUS
Value in having a tool to help marketplaces take stock of progress and performance over time in planning for, enrolling, and improving health care access
for diverse and hard-to-reach individuals. 23
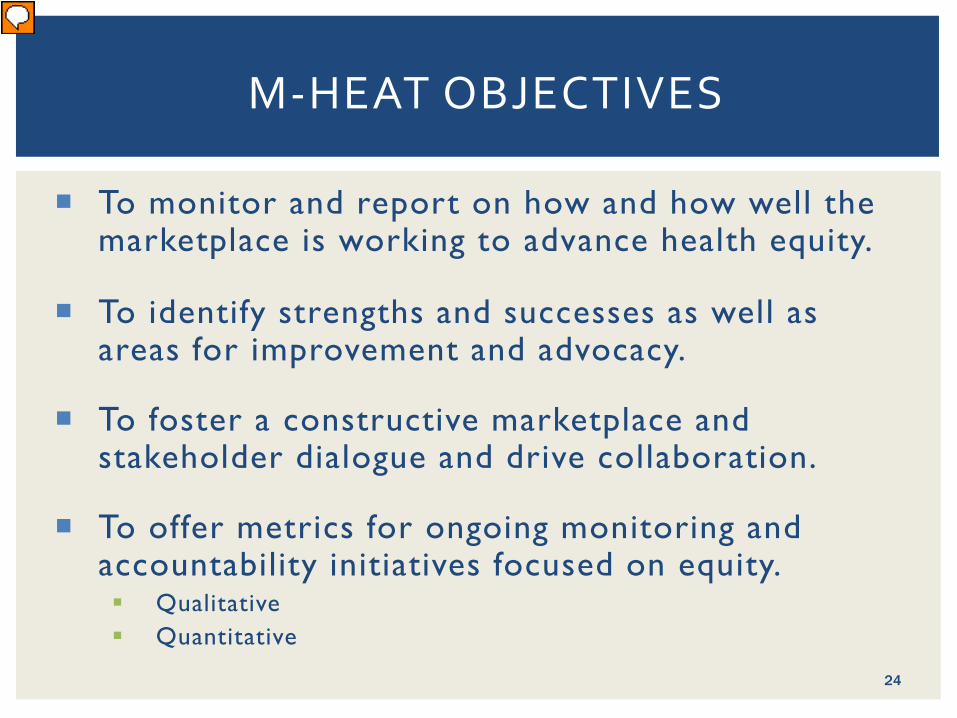
To monitor and report on how and how well the marketplace is working to advance health equity.
To identify strengths and successes as well as areas for improvement and advocacy.
To foster a constructive marketplace and stakeholder dialogue and drive collaboration.
To offer metrics for ongoing monitoring and accountability initiatives focused on equity. Qualitative Quantitative
M-HEAT OBJECTIVES
24
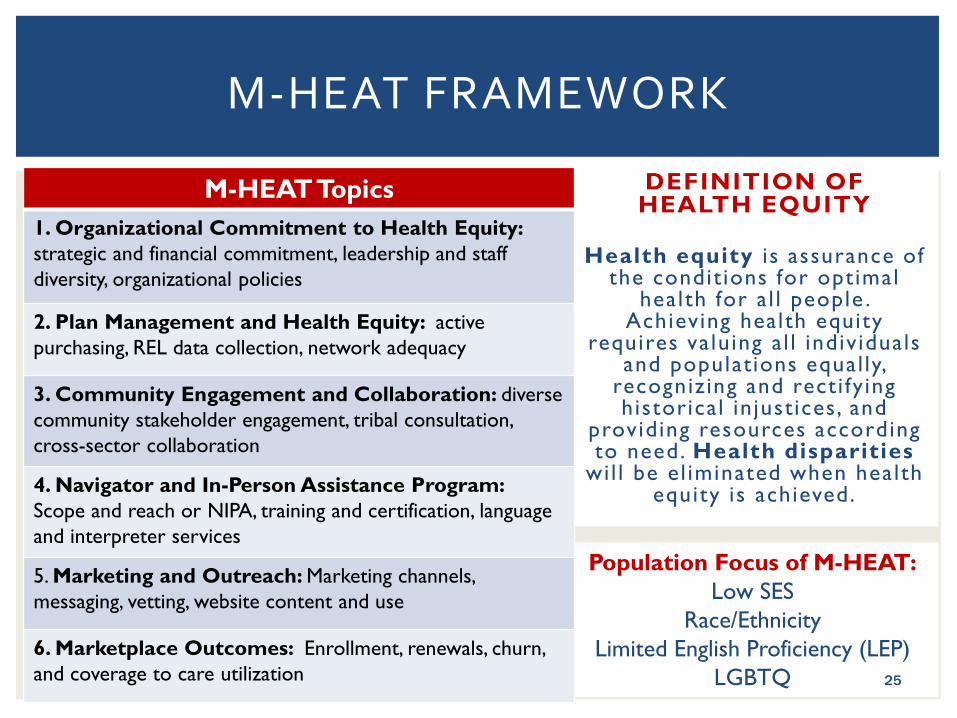
M-HEAT FRAMEWORK
DEFINITION OF HEALTH EQUITY
Health equity i s assurance of
the condit ions for optimal health for a l l people .
Achieving health equity requires valuing al l individuals
and populations equal ly, recognizing and recti fy ing historical in justices, and
providing resources according to need. Health disparities
wil l be el iminated when health equity is achieved.
Population Focus of M-HEAT: Low SES
Race/Ethnicity Limited English Proficiency (LEP)
LGBTQ 25
M-HEAT Topics 1. Organizational Commitment to Health Equity: strategic and financial commitment, leadership and staff diversity, organizational policies
2. Plan Management and Health Equity: active purchasing, REL data collection, network adequacy
3. Community Engagement and Collaboration: diverse community stakeholder engagement, tribal consultation, cross-sector collaboration
4. Navigator and In-Person Assistance Program: Scope and reach or NIPA, training and certification, language and interpreter services
5. Marketing and Outreach: Marketing channels, messaging, vetting, website content and use
6. Marketplace Outcomes: Enrollment, renewals, churn, and coverage to care utilization
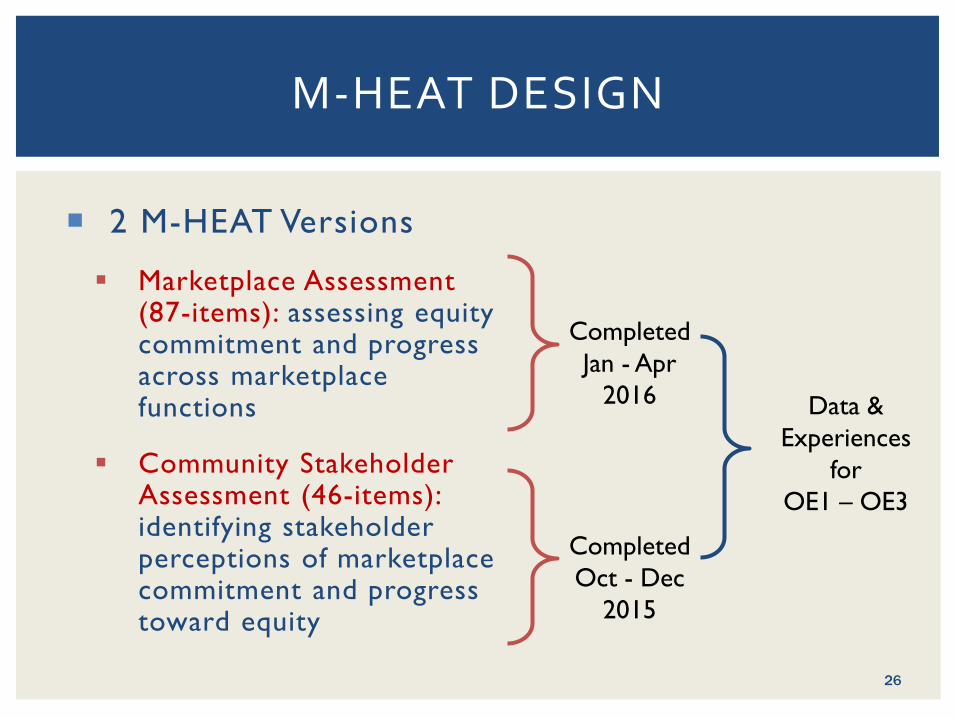
2 M-HEAT Versions
Marketplace Assessment (87-items): assessing equity commitment and progress across marketplace functions
Community Stakeholder Assessment (46-items): identifying stakeholder perceptions of marketplace commitment and progress toward equity
M-HEAT DESIGN
Completed Jan - Apr
2016
Completed Oct - Dec
2015
Data & Experiences
for OE1 – OE3
26

• Meetings - Community Stakeholders & AHCT Staff
April 2015
• AHCT & Community Input on M-HEAT
Summer 2015 • Community
Stakeholder Version
Fall 2015
•Marketplace Version
Spring 2016 • Engagement
of AHCT & Stakeholders on Results
May 2016
M-HEAT DEVELOPMENT & ADMINISTRATION
Ongoing Engagement of AHCT Staff and Community Stakeholders through Development and Administration, Spring 2015-2016
27

M-HEAT RESULTS
28

STAKEHOLDER RESPONDENTS
Over 3 in 4 respondents target non-White populations 2 in 3 respondents target LGBTQ populations
Nearly 70% had some role in outreach, education, enrollment 29
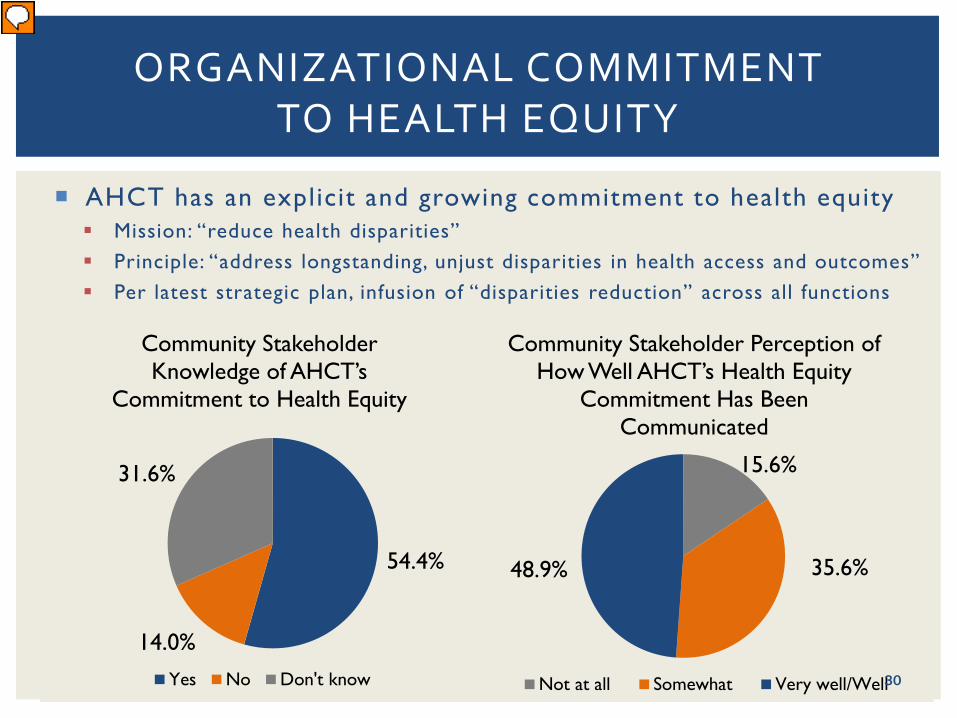
AHCT has an explicit and growing commitment to health equity Mission: “reduce health disparities” Principle: “address longstanding, unjust disparities in health access and outcomes” Per latest strategic plan, infusion of “disparities reduction” across all functions
ORGANIZATIONAL COMMITMENT TO HEALTH EQUITY
54.4%
14.0%
31.6%
Community Stakeholder Knowledge of AHCT’s
Commitment to Health Equity
Yes No Don't know
15.6%
35.6% 48.9%
Community Stakeholder Perception of How Well AHCT’s Health Equity
Commitment Has Been Communicated
Not at all Somewhat Very well/Well30

ORGANIZATIONAL DIVERSITY: COMMUNITY STAKEHOLDER PERCEPTIONS
20% 20% 51%
38%
0%
25%
50%
75%
100%
Board of directors Executive staff Service or call centers Other staff
Community Stakeholder Perception of How Reflective AHCT Leadership, Staff, and Call Centers Are of Populations Served
Very/Mostly Somewhat/A little Not at all
When asked to report how diversity in the marketplace has changed, 33% report that they feel it has grown. 31
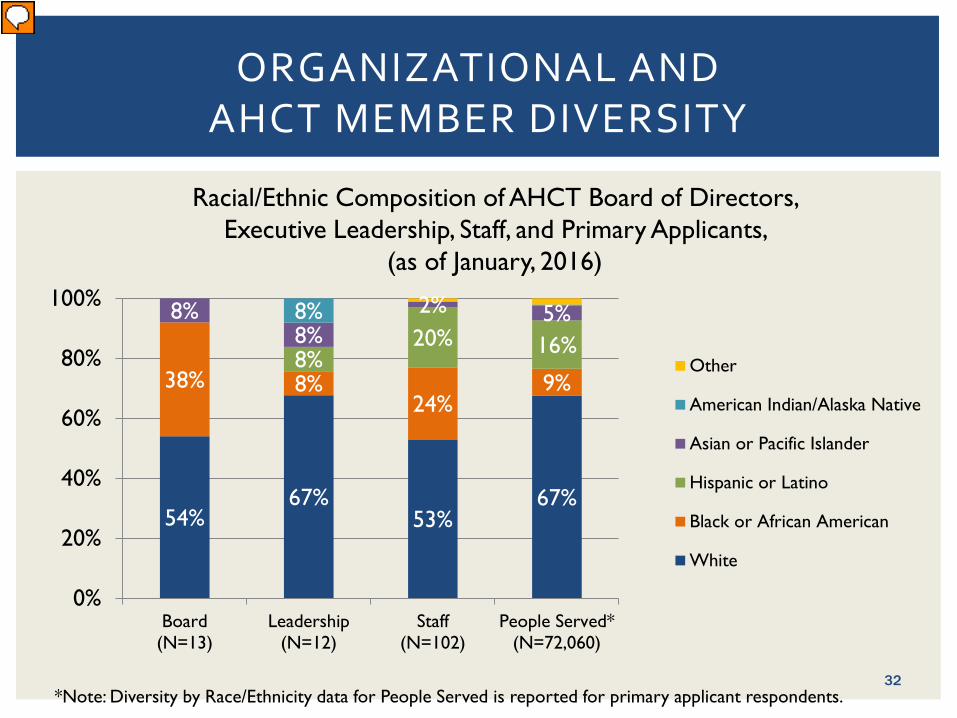
ORGANIZATIONAL AND AHCT MEMBER DIVERSITY
Racial/Ethnic Composition of AHCT Board of Directors, Executive Leadership, Staff, and Primary Applicants,
(as of January, 2016)
54% 67%
53% 67%
38% 8% 24%
9% 8%
20% 16% 8%
8% 2% 5% 8%
0%
20%
40%
60%
80%
100%
Board(N=13)
Leadership(N=12)
Staff(N=102)
People Served*(N=72,060)
Other
American Indian/Alaska Native
Asian or Pacific Islander
Hispanic or Latino
Black or African American
White
*Note: Diversity by Race/Ethnicity data for People Served is reported for primary applicant respondents. 32
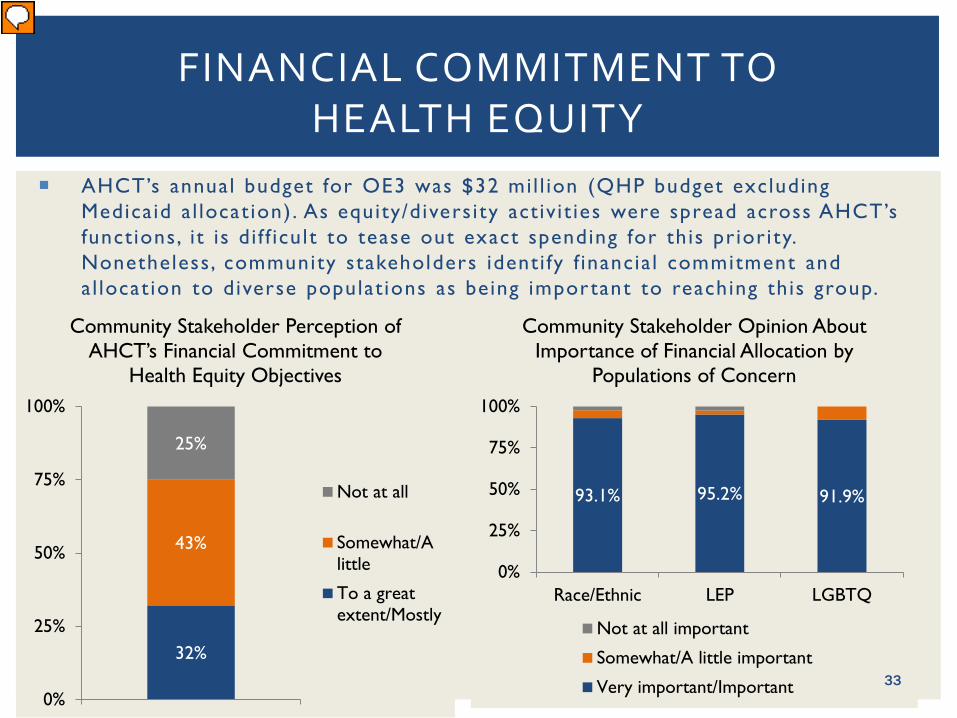
93.1% 95.2% 91.9%
0%
25%
50%
75%
100%
Race/Ethnic LEP LGBTQ
Community Stakeholder Opinion About Importance of Financial Allocation by
Populations of Concern
Not at all important
Somewhat/A little important
Very important/Important
AHCT’s annual budget for OE3 was $32 mil l ion (QHP budget excluding Medicaid a l locat ion). As equity/divers i ty activ i t ies were spread across AHCT’s functions, i t is di f f icult to tease out exact spending for this priority. Nonetheless, community stakeholders identi fy f inancia l commitment and al locat ion to diverse populat ions as being important to reaching this group.
FINANCIAL COMMITMENT TO HEALTH EQUITY
32%
43%
25%
0%
25%
50%
75%
100%
Community Stakeholder Perception of AHCT’s Financial Commitment to
Health Equity Objectives
Not at all
Somewhat/Alittle
To a greatextent/Mostly
33

61% 87%
63% 39% 48%
33%
0%
25%
50%
75%
100%
Hispanic White Black Asian LEP LGBTQ
Stakeholder Perception of AHCT’s Engagement of Diverse Representatives to Inform Marketplace Plans, Policies, and Decisions
To a great extent/Mostly Somewhat/A Little Not at all
COMMUNITY ENGAGEMENT: COMMUNITY STAKEHOLDER PERCEPTIONS
AHCT reports that it very often engages community partners representing diverse racial , ethnic , and l inguistic populations. While stakeholders agree this occurs at least somewhat or a l ittle , they feel that engagement varies by racial/ethnic population.
34

ENGAGEMENT VS. INCORPORATING FEEDBACK: COMMUNITY STAKEHOLDER PERCEPTIONS
87%
61% 63%
39% 38%
26% 26% 29%
0%
20%
40%
60%
80%
100%
White Hispanic Black Asian
Community Stakeholder Perception of Being Engaged vs. Feedback Being
Incorporated
Mostly/to a great extent engagedFeedback always/very often incorporated
Overall stakeholder perception of community engagement and incorporation of feedback varies by race/ethnicity. In addition, stakeholders feel that engagement does not always translate to incorporation of feedback.
35

AHCT reports that navigators/assisters are very representative of the AHCT eligible populations. Generally most stakeholders agreed that navigators/assisters were at least somewhat representative.
NAVIGATOR AND IN-PERSON ASSISTERS*: COMMUNITY STAKEHOLDER PERCEPTIONS
*AHCT no longer has in-person assisters, this changed since OE1.
36
31% 35% 35%
31% 31% 12%
38% 31%
24%
29%
0%
25%
50%
75%
100%
Race/Ethnic LEP LGBTQ
Community Stakeholder Perception of How Representative Navigators/Assisters Are of Populations Served
Very representative Representative Somewhat representative
Less representative Not at all representative
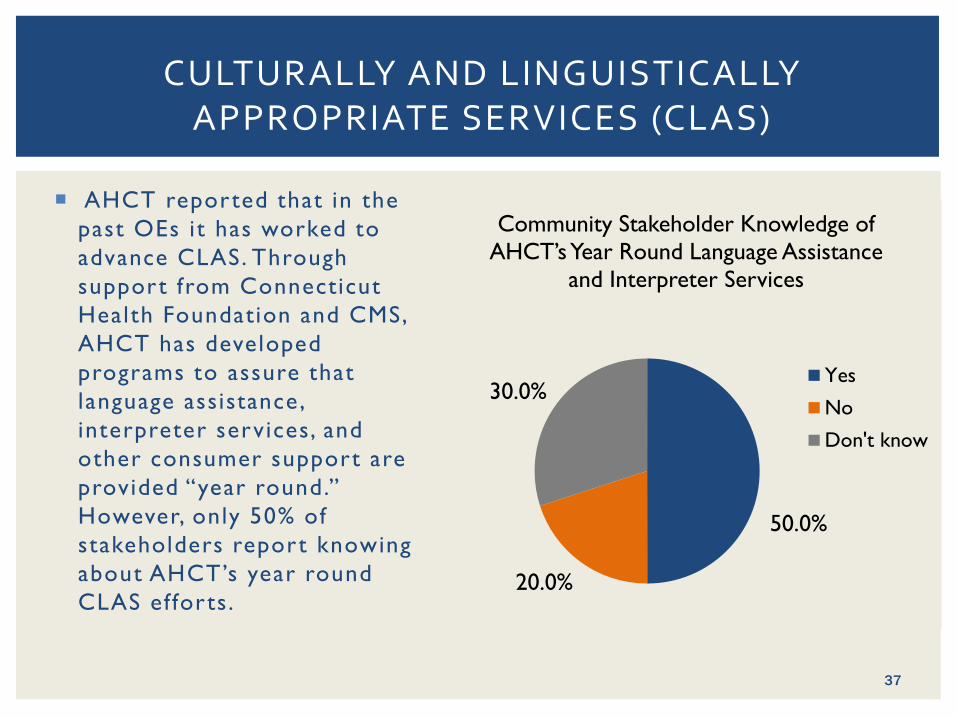
AHCT reported that in the past OEs it has worked to advance CLAS. Through support from Connecticut Health Foundation and CMS, AHCT has developed programs to assure that language assistance, interpreter services, and other consumer support are provided “year round.” However, only 50% of stakeholders report knowing about AHCT’s year round CLAS ef forts.
CULTURALLY AND LINGUISTICALLY APPROPRIATE SERVICES (CLAS)
50.0%
20.0%
30.0%
Community Stakeholder Knowledge of AHCT’s Year Round Language Assistance
and Interpreter Services
Yes
No
Don't know
37

ENROLLMENT OUTCOMES & COMMUNITY PERCEPTION OF PERFORMANCE
33%
67%
34% 35%
0%
25%
50%
75%
100%
Hispanic orLatino
White Black or AfricanAmerican
Limited EnglishProficient
Community Perception of AHCT’s Performance in Reaching and Enrolling
Diverse Population Groups
Excellent/Very good Good Fair Poor
Asian populations not reported due to data collection error.
% Enrolled in OE3
White 66.0% Hispanic 16.8%
Black 8.2% Asian 6.4% AI/AN 0.3% Other 2.3%
Over 116,000 Enrolled in AHCT in
2016
Source: Calculations based on data provided by AHCT, May 2016. Note 35% of individuals not reporting race/ethnicity not included in denominator of percent calculation.
38
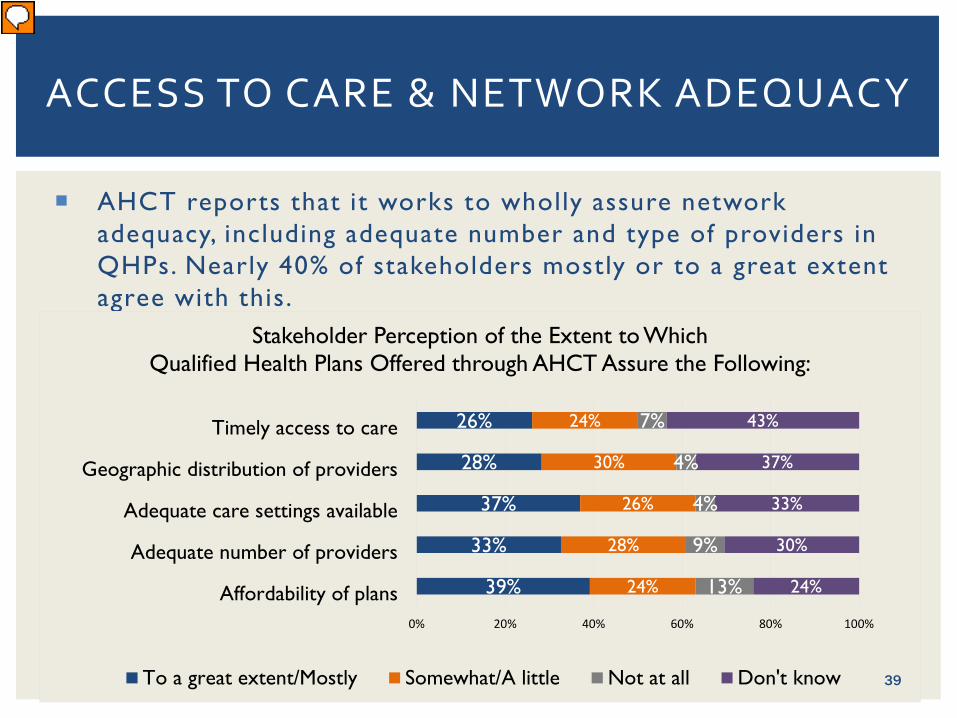
ACCESS TO CARE & NETWORK ADEQUACY
AHCT reports that it works to wholly assure network adequacy, including adequate number and type of providers in QHPs. Nearly 40% of stakeholders mostly or to a great extent agree with this.
39%
33%
37%
28%
26%
24%
28%
26%
30%
24%
13%
9%
4%
4%
7%
24%
30%
33%
37%
43%
0% 20% 40% 60% 80% 100%
Affordability of plans
Adequate number of providers
Adequate care settings available
Geographic distribution of providers
Timely access to care
Stakeholder Perception of the Extent to Which Qualified Health Plans Offered through AHCT Assure the Following:
To a great extent/Mostly Somewhat/A little Not at all Don't know 39
HEALTH INSURANCE LITERACY EDUCATION AND ASSISTANCE
41.0%
25.6%
33.3%
Community Stakeholder Knowledge of Availability of AHCT
Education and Assistance on Understanding How to Use Health
Insurance
Yes No Don't know
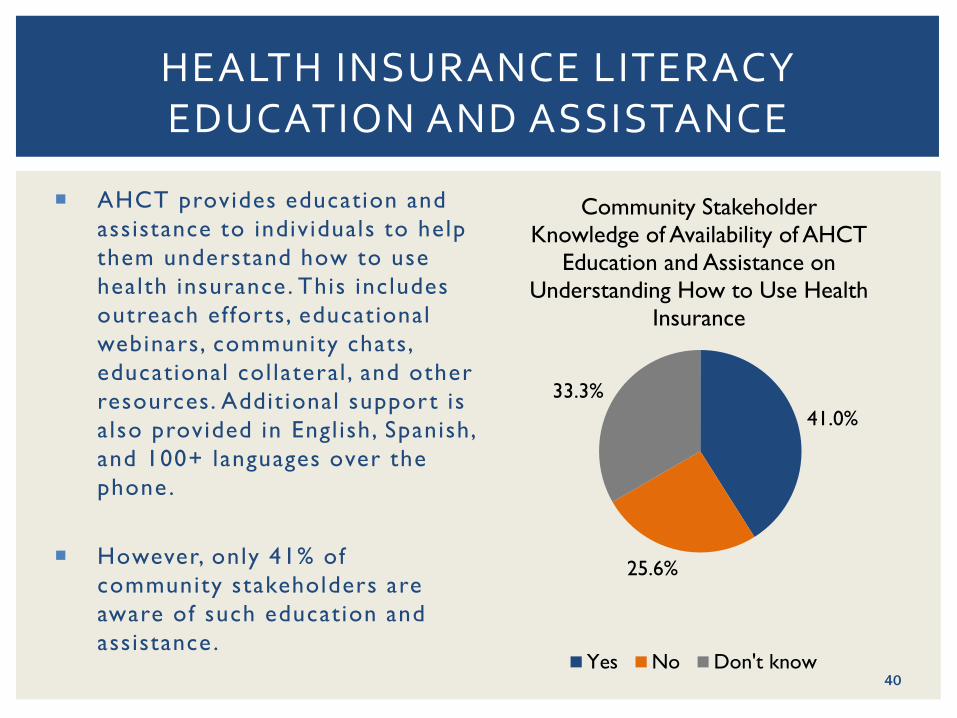
AHCT provides education and assistance to individuals to help them understand how to use health insurance. This includes outreach ef forts, educational webinars, community chats, educational col lateral , and other resources. Addit ional support is also provided in Engl ish, Spanish, and 100+ languages over the phone .
However, only 41% of community stakeholders are aware of such education and assistance .
40

MOVING FORWARD: POINTS FOR CONSIDERATION
41
Research Team
Dennis P. Andrulis , PhD, MPH Senior Research Scientist , Texas Health Inst itute
Associate Professor, Universi ty of Texas School of Publ ic Health dandrul is@texashealth inst i tute .org
Nadia J. Siddiqui, MPH
Director of Health Equity Programs Texas Health Inst itute
nsiddiqui@texashealth inst i tute .org
Anna Stelter, MPH, MSSW Pol icy Analyst
Texas Health Inst itute
Matthew Turner, PhD, MPH Senior Analyst
Texas Health Inst itute
THANK YOU
42

All Payer Claims Database (APCD) Update May 19, 2016
43
44
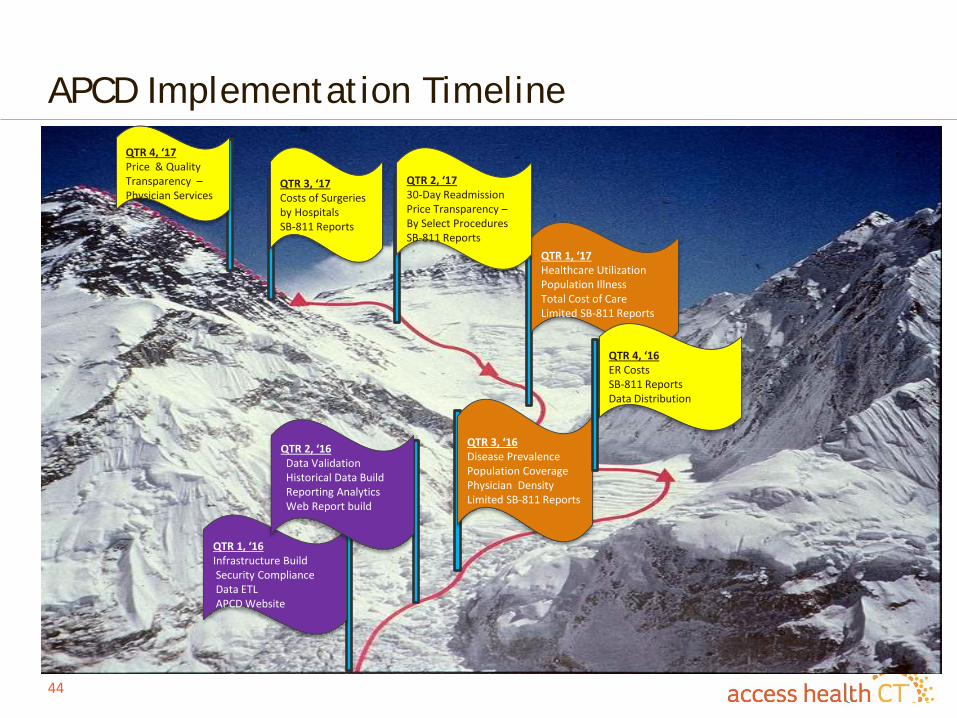
APCD Implementation Timeline
QTR 3, ‘16 Disease Prevalence Population Coverage Physician Density Limited SB-811 Reports
QTR 1, ‘17 Healthcare Utilization Population Illness Total Cost of Care Limited SB-811 Reports
QTR 2, ‘17 30-Day Readmission Price Transparency – By Select Procedures SB-811 Reports
QTR 3, ‘17 Costs of Surgeries by Hospitals SB-811 Reports
QTR 4, ‘17 Price & Quality Transparency – Physician Services
QTR 4, ‘16 ER Costs SB-811 Reports Data Distribution
QTR 1, ‘16 Infrastructure Build Security Compliance Data ETL APCD Website
QTR 2, ‘16 Data Validation Historical Data Build Reporting Analytics Web Report build

45
APCD Data Submission Status
• APCD Data Collection Plan - Data collection is ongoing although data quality validation has been very slow for some of the submitting entities. Two (2) carriers (Aetna and Anthem) have stopped data submissions until they filter ASO data from their files.
• We are targeting roughly 850,000 lives by mid-May 2016 • Received confirmation from CMS that our APCD will be considered as
eligible to receive Research Identifiable Files (RIF) data under the CMMI funded SIM program category of data request
• National Association of Health Data Organization (NAHDO) has also approached U.S. Department of Labor (DOL) with the idea of collecting uniform data from various states as a remedy to ERISA restrictions. NAHDO also has developed a uniform data lay out detail. CT’s APCD is evaluating the proposed uniform data lay out standard currently. This is a promising approach.

46
APCD Data Submission Status
• Total population in CT was 3.58 million in 2015* • Total estimated population in APCD in the future (even without ERISA
plans) is approximately 3.02 million lives
* Estimates for commercial plans are derived from APCD data submissions; Medicaid and Medicare estimates are from Kaiser State Health Facts (http://kff.org/statedata/) and uninsured rate at 3.8% from AHCT 2015 Member Census
Payer Types Total
(Million Lives) Collectible
(Million Lives)Commercial
Non-ERISA Plans 1.43 1.43 ERISA Plans 0.42 -
Medicare - - Medicare Advantage (Part C) 0.20 0.20
Medicare FFS (Parts A & B) 0.63 0.63 Medicaid / CHIP 0.76 0.76 Uninsured 0.14 - TOTAL 3.58 3.02
47
APCD Data Grouping Approaches
• In an effort to prepare readiness to address disparities in care, which is currently part of our organization’s important strategy, we consider APCD as an important instrument in addressing it. To that objective, we have sought inputs from various stakeholders in the state regarding how we approach it.
• Reality is that we may not have good race and ethnicity data in our claims/eligibility files.
• Researched various approaches to measuring disparities in care – identifying surrogate measures (groupers) like Health Reference Groups (HRG), The Five Connecticuts, Opportunity Index, Planning Regions, Educational Reference Groups (ERG), District Reference Groups (DRG), Racially Concentrated Areas of Poverty (RCAP)

48
APCD Data Collection Status Update – Race Data Completion
- AI/AN - Asian - Black/African - American Native Hawaiian or Pacific Islander - White - Other Race - Unknown/Not – Specified - Hispanic
SubmittersRace Information Completion Rate
Population Weights
Aetna 32.6% 19.8%Anthem 0.3% 24.4%Cigna 0.0% 9.4%ConnectiCare 3.2% 17.3%Harvard Pilgrim 5.2% 0.3%United Health Group 0.1% 27.8%Well Care 49.4% 0.9%OVERALL 7.6%
Note: Based on test data for year 2012; current completion rate may be different.

Combining Connecticut’s APCD with DPH Birth Records Collaboration involving UConn, Access Health CT, DPH, Onpoint, CSMS Two step process:
1. Merge birth records with APCD member file • ~ 60% of CT residents born in CT; have child in CT (?)
2. Use multiple imputation to impute race and ethnicity for patients not in birth records • Uses patient demographics (address, name, age etc.) to build a predictive
model for patients race/ethnicity Results included in APCD files
28
Source: Slide from Dr. Robert Aseltine’s presentation to the APCD Advisory Group on 2/11/2016

50
APCD Data Grouping Approaches – Health Reference Group (HRG)

51
APCD Data Grouping Approaches – Health Reference Group (HRG)

52
APCD Data Grouping Approaches – The Five Connecticuts
53
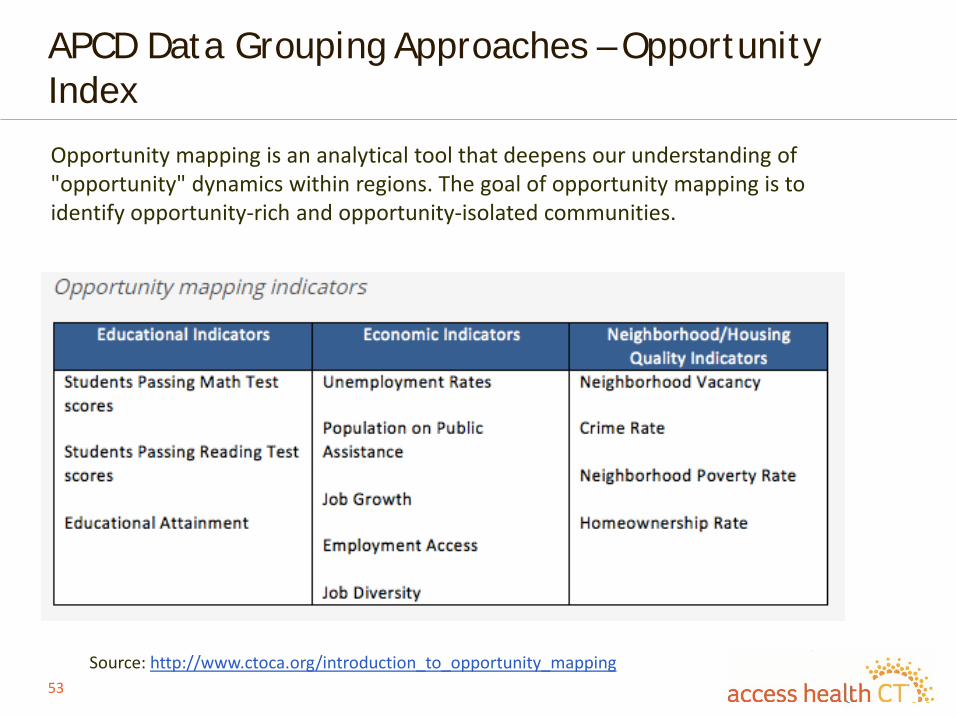
APCD Data Grouping Approaches – Opportunity Index
Source: http://www.ctoca.org/introduction_to_opportunity_mapping
Opportunity mapping is an analytical tool that deepens our understanding of "opportunity" dynamics within regions. The goal of opportunity mapping is to identify opportunity-rich and opportunity-isolated communities.

54
APCD Data Grouping Approaches – Opportunity Index

55
APCD Data Grouping Approaches – Opportunity Index

Adjournment