board presentation 2012
TRANSCRIPT

Welcome to
By James Lake, Principal GHS 2010-2012

Attendance at GHS has increased over
the previous two years by 4.1%
90.054
94.198
87
88
89
90
91
92
93
94
95
2009-2010 2011-2012

Enrollment at GHS –
Holding steady
91
110 110
9499 101
0
20
40
60
80
100
120
2008-09(B) 2009-10(A) 2009-10(B) 2010-11(A) 2010-11(B) 2011-12(A)

Making
Growth at
GHS!!!49
56
63
44
38
27
0
10
20
30
40
50
60
70
The number of
students on the
D/F List
decreased by
57% since
June 2010.

Growth in the
RIGHT
DIRECTION!!!
61
88
7264
51
30
0
10
20
30
40
50
60
70
80
90
100
# of D's
Over the last 3
years, the number
of D’s students
received on their
semester report
cards decreased by
66%.

Remarkable
Student
Achievement!!!
From the highest point
to the lowest, the
number of F’s students
received on their report
cards decreased by
98%
Overall, the percentage
of students who
received F grades has
decreased by 83%.
50
65
53
14
11
0
10
20
30
40
50
60
70
# of F's
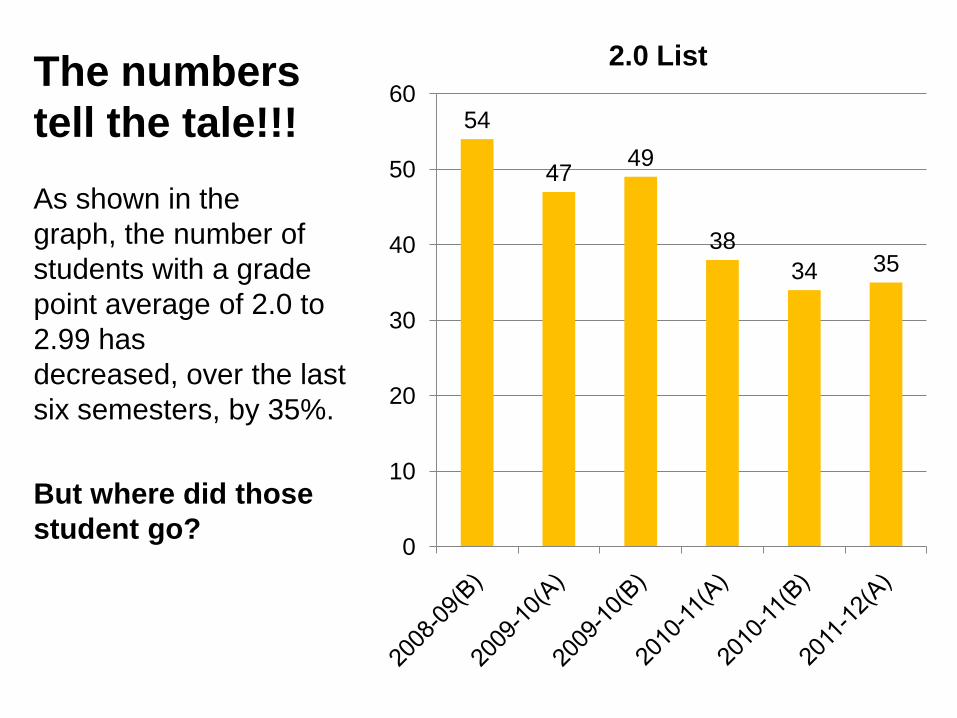
The numbers
tell the tale!!! 54
4749
38
34 35
0
10
20
30
40
50
60
2.0 List
As shown in the
graph, the number of
students with a grade
point average of 2.0 to
2.99 has
decreased, over the last
six semesters, by 35%.
But where did those
student go?

They went to the HONOR ROLL –
increasing the number by nearly
100%
16 1615
30 3028
0
5
10
15
20
25
30
35
2008-09(B) 2009-10(A) 2009-10(B) 2010-11(A) 2010-11(B) 2011-12(A)

But GHS students did not stop there…
some continued on to the DEAN’S LIST
increasing it by 100% as well!
21
13 13
1920
26
0
5
10
15
20
25
30
2008-09(B) 2009-10(A) 2009-10(B) 2010-11(A) 2010-11(B) 2011-12(A)

GHS,
just like all the other schools in
PUSD, has made great strides toward
success in a variety of different
academic, athletic, and social events.
We are all important. We are all unique.

Our school is
MORE than BRICKS and
MORTAR!!!
GHS is about
everything but
bricks and
mortar!


It’s about
LEADERSHIP!