bob marshall wilderness complex 2004 visitor...
TRANSCRIPT

Bob Marshall Wilderness Complex
2004 Visitor Study
Prepared by Joshua G. Whitmore
William T. Borrie Alan E. Watson
Sponsored by
USDA Forest Service – Rocky Mountain Research Station, Lolo and Flathead National Forests
College of Forestry and Conservation
University of Montana 32 Campus Drive
Missoula, Montana 59812


Acknowledgements
A research project of this size and scope involves contributions from many people
in addition to the primary authors. These contributors deserve recognition and thanks.
Thank you to all the Forest Service employees who helped with the planning and
fieldwork components of this project. Specifically we would like to thank Tim Love and
Ed Weber. This project builds from the previous year’s study in the Bob Marshall
Wilderness Complex, and we could not have completed our work without the efforts and
insights of Steve McCool and Chad Dear. Katie Kneeshaw and Neal Christensen from
the Aldo Leopold Wilderness Research Institute also deserve thanks for their technical
assistance. Lastly, thank you to all the visitors who graciously participated in the survey
by completing on-site and mail-return questionnaires. Their cooperation made this
project possible.
2004 Bob Marshall Wilderness Complex Visitor Survey 1

Executive Summary Purpose of study This purpose of this study was to provide information on the characteristics of
Bob Marshall Wilderness Complex (BMWC) use, users, and user attitudes about the
wilderness and its management. Originally, this project began in 2003 with a full survey
conducted in that year (Dear, McCool and Borrie, 2004)1. However, the summer of 2003
was not a typical year for the BMWC. Fires and fire fighting activity led to direct
closures of popular recreation areas, destinations, and trailheads. Smoke, access
limitations, and safety concerns undoubtedly discouraged visitation in areas directly
affected as well as across the whole complex. A decision was made to repeat the survey
in 2004 in hopes of better understanding the impacts of the fires and fire closures. Data
from 2004 allows comparisons to previous studies conducted in 1970 and 1982 and an
understanding of how visitation was affected while the fires were burning in 2003.
Methods The population under study in this research was adults (16 years or older) making
recreational visits to the BMWC during the summer and fall of 2004. Sampling of these
visitors occurred at the thirteen most visited trailheads in the BMWC. Visitors were
contacted at these trailheads between June 18 and October 18, 2004. September 9 was
considered to be the beginning of the fall season. A sampling design was employed that
allowed fieldworkers to maximize efficiency in the field and capture a representative
sample of the total visitor population.
Onsite and mail-return questionnaires were used. Fieldworkers contacted 408
visitors. Twelve visitors refused to participate, four of whom had completed the survey
the previous year. Mail-return questionnaires were mailed to the remaining 396
respondents. The questionnaire was returned by 297 respondents; three questionnaires
were returned “undeliverable.” This yielded an overall response rate of 72%.
1 Dear, C.E., McCool, S.F. and Borrie, W.T. (2005). "Bob Marshall Wilderness Complex 2003 Visitor Study Final Report" Technical Completion Report. College of Forestry and Conservation, The University of Montana, Missoula, MT 49 pp.
2 2004 Bob Marshall Wilderness Complex Visitor Survey

AnalysisThree separate analyses were conducted.
1. Overall 2004 descriptions, to provide information on the characteristics of use,
users, and attitudes about the wilderness and its management in a non-fire
affected year.
2. 2003 versus 2004 analysis, to understand how the factors listed above are affected
by a heavily fire affected year (2003).
3. 2004 versus 1970/1982 analysis, to provide comparison to previous studies
conducted in these years.
The data were analyzed using four classification variables. These are variables that
are believed to influence visitor responses to use, user and attitude questions, and are
believed to be of particular interest to wilderness managers. The four classification
variables are:
• Length of stay: day versus overnight visitors.
• Use of outfitter: outfitted versus non-outfitted visitors.
• Season of use: summer versus fall visitors.
• Mode of travel: hiking versus horseback riding visitors.
Each use, user, or user attitude characteristic was analyzed to determine if there
was a statistically significant difference in characteristics linked to these four
classification variables. Only statistically significant differences are reported. A
complete report of all characteristics is included in a separate technical appendix.
Summary of findings
Section 1, overall 2004 findings: Visitor Characteristics (2004)
Day visitors were more likely than overnight visitors to be from Montana and to
have previous experience in the BMWC. Day visitors were, on average, more educated
2004 Bob Marshall Wilderness Complex Visitor Survey 3

than overnight users. There were no significant differences in age or proportion of
male/female visitors between day and overnight visitors.
Outfitted visitors were more likely than non-outfitted visitors to be older, to be
from outside of Montana, and to have less previous experience in the BMWC. There
were no significant differences in education or ratio of male:female visitors between
outfitted and non-outfitted visitors.
Female visitors were more common during the summer than during the fall.
There were no significant differences in age, education, place of residence, or previous
experience between summer and fall visitors.
Compared to horseback riding visitors, hiking visitors were more likely to be
young and have more years of education. There were no significant differences in sex,
place of residence, or previous experience in the BMWC.
Visit Characteristics (2004)
Compared to overnight visitors, day visitors were more likely to be hiking and
more likely to be traveling in smaller parties. When they did ride horses, day use groups
typically took fewer horses than overnight groups. On average, day visitors reported
encountering more other parties per day on their trips than overnight visitors. Day
visitors were less likely to participate in photography, fishing, swimming, and hunting.
Day visitors were also less likely to be outfitted.
Compared to non-outfitted visitors, outfitted visitors were more likely to be
horseback riding, traveling in larger parties, and to be staying in the BMWC for longer
periods of time. When riding, outfitted visitors used more horses or other livestock than
non-outfitted visitors. Outfitted visitors were more likely to participate in photography,
fishing, swimming, and rafting. Outfitted visitors were also less likely to participate in
hiking. There were no significant differences in reported rates of encounters with other
groups between outfitted and non-outfitted visitors.
Compared to fall visitors, summer visitors were more likely to hike, to visit in
smaller groups, and to stay in the BMWC for shorter periods of time. Summer visitors
were more likely to participate in photography, nature study, swimming, and rafting.
Summer visitors were less likely to participate in hunting. Summer visitors reported
4 2004 Bob Marshall Wilderness Complex Visitor Survey

encountering more other parties per day than fall visitors. There were no significant
differences in number of livestock used between summer and fall visitors.
Compared to visitors that participated in horseback riding, hiking visitors were
more likely to be in smaller groups, and to be staying for shorter periods of time. Hikers
reported encountering more groups per day than horseback riding visitors. Hikers were
more likely to participate in nature study and swimming. Hikers were less likely to
participate in fishing and hunting. Hikers were also less likely to be outfitted.
Visitor attitudes (2004)
Desirability of Management Actions
Visitors rated “signs along the trail explaining natural features or early history”
and “a few trees blown down across the trail, maybe one or two per mile” as the most
undesirable trail management actions in the Wilderness. “Burying unburnable trash” and
“cemented rock fireplaces with metal grates” were rated by visitors as the most
undesirable campsite management actions. “Issuing trip permits so visitors could only
camp each night in the area assigned to them” was rated by visitors as the most
undesirable visitor management action. “Eliminating grazing by visitors’ horses” and “a
natural fishery—no stocking and barren lakes left barren” were rated by visitors as the
most undesirable resource management actions.
Section 2, Comparing 2003 data with 2004 data Visitor Characteristics (2003 vs. 2004)
The visitor characteristics under investigation in this study were: age, sex, level of
education, place of residence, and previous experience in BMWC. In all cases, there was
not a significant difference between the overall data from 2003 and that from 2004. In
addition, no significant differences were found when comparing three time periods in
2003 to the same periods in 2004 (pre-fire: June, July; during-fire: August, September;
after-fire: October). The conclusion is that the characteristics of the visitors themselves
were not different for the two years.
2004 Bob Marshall Wilderness Complex Visitor Survey 5

Visit Characteristics (2003 vs. 2004)
Compared to 2004 visitors, both day and overnight visitors were more likely to
travel by foot and less likely to fish during the fires of 2003. Overnight visitors that used
livestock took fewer livestock during the fires of 2003. More day visitors used outfitters
during the fires of 2003 than in August/September of 2004. No significant differences
between day and overnight users were found in the mode of travel during the fires of
2003. (i.e. day visitors and overnight visitors were equally likely to hike or horseback
ride during the 2003 fires as they were in the equivalent time period (August, September)
in 2004.)
Compared to non-outfitted visitors, outfitted visitors were more likely to hike,
took less livestock, and had shorter stays during the fires of 2003. Non-outfitted visitors
were less likely to fish during the fires of 2003. No statistical difference was found in the
number of encounters reported by outfitted or non-outfitted visitors during the fires of
2003.
Visitors were less likely to use horses and more likely to hike during the fires of
2003. The average number of horses taken by groups that took horses was less during the
fires of 2003. Hikers were less likely to fish during the fires of 2003. Both hikers and
horseback riders had shorter average stays during the fires of 2003. Horseback riders
were less likely to use an outfitter during the fires of 2003.
Visitor Attitudes (2003 vs. 2004)
Desirability of Management Actions
Visitor attitudes remained very much the same from 2003 to 2004. In only five
cases did they change. In four of those five cases, fire was the subject of the question. It
is reasonable to assume that the fires of 2003 caused visitors’ attitudes about fire related
subject matter to change. “Natural forest fires started by lightning” were more desirable
in 2004. “Cemented rock fireplaces with metal grates” were less desirable in 2004.
“Small loose rock fireplaces (fire rings)” were less desirable in 2004. “Prohibiting wood
fires where dead wood is scarce” was less desirable in 2004. “Eliminating grazing by
visitors’ horses (require carrying feed)” was also less desirable in 2004 compared to
2003.
6 2004 Bob Marshall Wilderness Complex Visitor Survey

Section 3, Comparing 2004 data with 1970/1982 results Visitor Characteristics (2004 vs. 1970/1982)
After no significant change in visitor age from 1970 to 1982, visitors on average
were older in 2004. After a rise in the percentage of female visitors from 1970 to 1982,
the percentage of females stayed the same in 2004 with approximately 30% of visitors
being female. Education levels were not significantly different between 1982 and 2004.
Hikers were more likely to be from out of state in 2004 than in 1982. Visitors in 2004
were more likely to have visited the BMWC previously, more likely to have previous
experience in any wilderness, made more visits to wilderness in the past 12 months, and
spent more days in wilderness in the last 12 months than in previous studies at the
BMWC.
Visit Characteristics (2004 vs. 1970/1982)
The average party size remained approximately the same over the years. Hikers
still outnumbered horseback riders in 2004 but by a slimmer margin than in 1982. After a
drop from 1970 to 1982 in the number of horses taken by groups that used horses, the
average number of horses taken rebounded some in 2004. The proportion of visitors that
participated in various activities did not change from 1982 to 2004. The average length of
stay continued a downward trend and was less in 2004. The proportion of visitors in 2004
that used outfitters was not statistically different than in 1982. The average number of
reported encounters with other groups per day was more in 2004.
Visitor Attitudes (2004 vs. 1970/1982)
Even though visitors in 2004 encountered more groups per day than in 1982, their
opinions on the number of other groups encountered (saw too many, saw too few, etc.)
stayed the same. For perceived change in area quality, the proportion of visitors
responding with better, about the same, or getting worse was not significantly different
between 1982 and 2004. (i.e. about the same percentage perceived the area quality was
getting worse.)
2004 Bob Marshall Wilderness Complex Visitor Survey 7

Table of Contents EXECUTIVE SUMMARY ..............................................................................................2 ABOUT THE STUDY....................................................................................................12 STUDY METHODS.......................................................................................................14 SECTION ONE: OVERALL RESULTS from 2004 SURVEY ...............................16
About the results .......................................................................................................16 Who were the 2004 visitors to the BMWC?.............................................................17
Age......................................................................................................................17 Sex.......................................................................................................................19 Education ............................................................................................................20 Place of residence ...............................................................................................22 Membership to clubs...........................................................................................25 Previous experience in BMWC ..........................................................................26
What are the characteristics of a 2004 BMWC visit?...............................................28 Party size.............................................................................................................28 Type of group......................................................................................................31 Mode of travel.....................................................................................................32 Number of livestock used ...................................................................................34 Activities participated in .....................................................................................36 Length of stay .....................................................................................................39 Outfitter use ........................................................................................................41 Encounters with other groups .............................................................................43
What were 2004 BMWC visitor attitudes?...............................................................45 Reaction to encounters........................................................................................45 Campsite conditions............................................................................................47 Perceived change in area quality.........................................................................49
Desirability of management actions....................................................................50
8 2004 Bob Marshall Wilderness Complex Visitor Survey

SECTION TWO: 2003 versus 2004 FIRE TIME PERIODS ...................................54
About the results .......................................................................................................54 How were the visitors themselves different in 2003 and 2004? ...............................56 How were the characteristics of a BMWC visit different in 2003 and 2004? ..........57
Mode of travel.....................................................................................................57 Number of livestock used ...................................................................................59 Activities participated in .....................................................................................61 Length of stay .....................................................................................................64 Outfitter use ........................................................................................................66 Encounters with other groups .............................................................................68
What were the differences in visitor attitudes between 2003 and 2004?..................69
Desirability of management actions....................................................................69 SECTION THREE: 2004 versus 1970/1982 studies ..................................................72
About the results .......................................................................................................72 How have visitors to the BMWC changed over the years? ......................................74
Age......................................................................................................................74 Sex.......................................................................................................................75 Education ............................................................................................................76 Place of Residence ..............................................................................................77 Previous experience in BMWC ..........................................................................79 Information sources ...........................................................................................81 Club membersip ..................................................................................................82
How have visit characteristics changed over the years?...........................................83 Party size.............................................................................................................83 Mode of travel.....................................................................................................84 Number of livestock used ...................................................................................85 Activities participated in .....................................................................................86 Length of stay .....................................................................................................87 Outfitter use ........................................................................................................88 Encounters with other groups .............................................................................89
2004 Bob Marshall Wilderness Complex Visitor Survey 9

How have visitor attitudes changed over the years?.................................................90 Opinions on number of encounters .....................................................................90 Campsite conditions............................................................................................91 Perceived change in area quality.........................................................................92
APPENDICES ..............................................................................................................93
10 2004 Bob Marshall Wilderness Complex Visitor Survey

2004 Bob Marshall Wilderness Complex Visitor Survey 11

About the study: The original purpose of conducting a visitor study at the Bob Marshall Wilderness
Complex (BMWC) was to provide information on the characteristics of use, users, and
user attitudes about the wilderness and its management. More specifically, the objectives
of the study were to:
1. describe characteristics of the wilderness visit, including activities, methods of
travel within the wilderness, timing of use, length of stay and camping practices;
2. describe characteristics of visitors, including types of groups, party size, previous
experience, residence, and socioeconomic descriptions; and,
3. describe visitor attitudes, satisfaction with wilderness conditions encountered
(both resource and social density conditions, and preference of various policies
and management actions).
Information on BMWC use, users, and attitudes can assist BMWC managers to
more effectively manage use and users. Specifically, understanding wilderness use and
users in BMWC is helpful for monitoring the popularity of recreation activities; planning
and designing recreation facilities and services; planning budgetary, personnel and other
resource needs; effectively conducting public information and education programs;
evaluating the efficiency and equity of public outdoor recreation, and determining trends.
Understanding commercial recreational use and users is especially useful for managing
permit systems and achieving an appropriate balance between commercial and non-
commercial use of wilderness.
To accomplish the above objectives, a study was conducted in 2003. However,
the summer of 2003 was not a typical year for the BMWC. Fires and fire fighting
activity led to closures of popular recreation areas, destination and trailheads. Smoke,
access limitations, and safety concerns undoubtedly discouraged visitation in areas
directly affected as well as across the whole complex. Additionally, other fires in the
region (e.g. Glacier National Park) may have displaced or discouraged visitation. This
created a unique opportunity to capture use patterns, visitor characteristics, and attitudes
for a season that was highly affected by fire. Indeed, the 2003 study did confidently
achieve the first three objectives listed above for a heavily fire affected season. However,
12 2004 Bob Marshall Wilderness Complex Visitor Survey

it was unclear how fire and fire fighting activity impacted different user groups. It was
also unclear how representative the visitors during the summer of 2003 were of current
use and user characteristics. Therefore, the fourth objective to determine trends since the
1970 and 1982 studies was not explored in 2003.
To address the difficulties arising from an atypical study year, a decision was
made to expend the study to include 2004. The 2004 extension was conducted in an
attempt to capture a more representative sample in the BMWC. The purpose of the
extension retained the same objectives as the ones previously listed with the addition of
understanding how a highly active fire season affects current use patterns, visitor
characteristics, and attitudes. Fires did not affect the 2004 season significantly. In fact, no
major fires occurred in the BMWC or surrounding areas.1 This lack of fire activity in
2004 provided easy investigation of this last objective. Also with a more representative
season, the comparisons with the 1970 and 1982 studies could be made with more
confidence.
1 However, it should be noted that various impacts of the 2003 fires continued on into 2004, such as blackened vegetation, open vistas, and minor damage to the infrastructure. These impacts will continue for the foreseeable future.
2004 Bob Marshall Wilderness Complex Visitor Survey 13

Study Methods: In order to make accurate comparisons to the 2003 data, the 2004 extension
followed almost identical study methods. In both years, the population under study are
summer and fall adult recreational visitors to the BMWC who entered or exited the
wilderness via trailheads estimated to receive the heaviest use. The trailheads included:
Bear Creek; Beaver Creek; Benchmark; Gibson Reservoir; Headquarters Pass; Indian
Meadows; Middle Fork Teton River; Monture creek; Morrison Creek; North Fork
Blackfoot River; Owl Creek; Pyramid Pass; and, South Fork Flathead River. Visitors had
to have been in or near the Wilderness for three hours or more to be considered.
At these thirteen sites, sampling occurred during the 2004 season from June 18th
to October 18th and in 2003 from June 20th to October 23rd. Sampling began when a
majority of trailheads were open and visitation began to pick up as the passes became
travelable. Sampling ended at the first significant snow event of the season that covered
access roads and caused visitation to drop off sharply. A detailed sampling schedule is
included in the technical appendix.
Trailheads were sampled for four-day weekday blocks of time (Monday through
Thursday) and three-day weekend blocks of time (Friday through Sunday). Fieldworkers
contacted visitors at these trailheads during six hour periods between eight am and eight
pm. Trailheads were sampled with probabilities proportional to size. In other words,
among the 13 trailheads included in this study, those with higher levels of use were
sampled more frequently than those with lower levels of use.1 This bias towards higher
use trailheads was accounted for in the analysis by weighting data inversely proportional
to size of sample. In other words, data from lower use trailheads were weighted more
than data from higher use trailheads.2 This sample design allowed fieldworkers to
1 Previous trailhead use estimates (Lucas 1985) were used to determine use levels at trailheads. These estimates were verified for rank accuracy with current Forest Service managers. 2 Weighting was calculated so that the sample size analyzed remained roughly the same as the actual number sampled. The sample sizes reported in each table in the technical appendix is the weighted sample size that was used in each analysis.
14 2004 Bob Marshall Wilderness Complex Visitor Survey

optimize their efficiency and capture a representative sample of the visitor population.
This system was used in both the 1970 and 1982 studies.
On-site and mail-return questionnaires were used. All respondents to the on-site
questionnaire were included in the mail-return questionnaire. In 2003, fieldworkers
contacted 605 visitors, 408 were contacted in 2004.1 Seven visitors refused to participate
in 2003, 12 people refused in 2004, 4 of which had completed the study the previous
year. Mail-return questionnaires were mailed to the remaining respondents. An initial
mailing was sent to respondents within twelve days of contact. A follow-up postcard was
mailed to non-respondents one to two weeks after the questionnaire was mailed. A
second mailing complete with another copy of the questionnaire was mailed to non-
respondents three to four weeks after the initial mailing. Six mail-return questionnaires
were not deliverable in 2003, 3 were not deliverable in 2004. In 2003, the mail-return
questionnaire was completed and returned by 462 respondents yielding an overall
response rate of 78%. In 2004, 294 questionnaires were returned yielding an overall
response rate of 72%.
A non-response bias check was conducted on six key variables including: season
of use, use of outfitter, length of stay, mode of travel, education level, and previous
experience in BMWC. No significant differences were found between respondents and
non-respondents. Results of these tests are shown in the appendix 3.
1 Due to financial and logistic constraints, fewer fieldworkers were employed in 2004. Never the less, in 2004, a total of 13 trailheads were sampled with a total of 18 sampling blocks in summer and 8 blocks in fall (full details of sampling shown in appendix 2).
2004 Bob Marshall Wilderness Complex Visitor Survey 15

Section 1: Overall Results from 2004 Survey
About the Results:
Options are innumerable for reporting results from a study such as this. The results
presented below were chosen based on numerous communications with Forest Service
personnel. The data are presented using four classification variables. These variables are
believed to hold the greatest potential for demonstrating variation. The four classification
variables are:
• Length of stay: day versus overnight visitors.
• Use of outfitter: outfitted versus non-outfitted visitors.
• Season of use: summer versus fall visitors. Summer sampling occurred between
June 18th and September 8th. Fall sampling occurred between September 13th and
October 17th
• Mode of travel: hiking versus horseback riding visitors.
Each use and user characteristic was analyzed to determine if there was a
statistically significant difference in responses due to these four classification variables.
For each characteristic, we present descriptive statistics to estimate the population
parameters. Following this we show descriptive statistics and statistical test results for
characteristics that showed a statistically significant difference between classification
variables. 95% confidence intervals are included in the summary below. We can say with
95% confidence that the means and percentages reported are within the ranges given. A
complete illustration of all characteristics is included in a appendix 1.
16 2004 Bob Marshall Wilderness Complex Visitor Survey

Who were the 2004 visitors to BMWC?
Respondents were asked numerous questions on both the onsite and mail-return questionnaires that helped to characterize the demographic and other characteristics of visitors to BMWC. These included: age, sex, level of education, place of residence, and previous experience in BMWC. Wherever possible, results from the onsite questionnaire were used instead of results from the mail-return questionnaire. This was done because more visitors completed the onsite questionnaire (n=396) than completed the mail-return questionnaire (n=294). In some cases, questions about the same characteristic were asked in different ways on the onsite and mail-return questionnaire. This allowed for a more nuanced understanding of the characteristic. Age The onsite questionnaire asked respondents for their year of birth. There were significant differences in age when visitors were split by use of outfitter and by mode of travel. There were no significant differences when visitors were split by length of stay or season of use.
Figure 1a. Age of Visitors
25%
12%
22%
41%
18-29 30-39 40-49 50 and over
The average age of visitors was 43.5 ± 1.5 years.
± 4%
2004 Bob Marshall Wilderness Complex Visitor Survey 17

Figure 1b. Average age of visitors, split by use of outfitter
49.5
41.5
18
23
28
33
38
43
48
53
58
Outfitted Visitors Non-outfitted Visitors
year
s
Outfitted visitors were, on average, older than non-outfitted visitors
± 2.5
± 1.7
Figure 1c. Average age of visitors, split by mode of travel
40.1
46.7
18
23
28
33
38
43
48
53
58
Hike Horseback
year
s
Horse riders were, on average, older than hikers
±2.1
±2.1
18 2004 Bob Marshall Wilderness Complex Visitor Survey

Sex Respondents’ sex was documented on the onsite questionnaire. There were significant differences in sex when visitors were split by season of use. There were no significant differences in sex when visitors were split by use of outfitter, length of stay, or mode of travel.
Figure 2a. Sex of respondents
71%
29%
Male Female
Figure 2c. Sex of visitors, split by season of use
31.5
18.5
68.5
81.5
0
10
20
30
40
50
60
70
80
90
100
Summer Fall
Perc
ent
Percent Female Percent Male
More than two-thirds of visitors were male.
± 5%
Fall visitors were more likely to be male than summer visitors.
± 5%
± 9%
2004 Bob Marshall Wilderness Complex Visitor Survey 19

Education Respondents to the onsite questionnaire were asked to indicate the highest year of school they completed. There were significant differences in education when visitors were split by length of stay and by mode of travel. There were no significant differences in education when visitors were split by use of outfitter or season of use.
Figure 3a. Education levels of visitors
4%14%
20%
31%
31%
Less than high school Diploma High school diplomaSome college Four year collegeSome graduate school
The average education level of visitors in years was 15.6 ± .3
± 9%
Figure 3b. Average education level in years , split by length of stay
16.08
15.35
12
13
14
15
16
17
18
Day visitors Overnight visitors
year
s
Day visitors were, on average, more educated than overnight users.
±.44
±.33
20 2004 Bob Marshall Wilderness Complex Visitor Survey

Figure 3c. Average education levels in years, split by mode of travel
15.98
14.63
12
13
14
15
16
17
18
Hike Horseback
year
s
Hikers, on average, were more educated than horse riders
±.33
±.47
2004 Bob Marshall Wilderness Complex Visitor Survey 21

Place of Residence The last part of the onsite questionnaire asked respondents to provide their name and mailing address so that we could send them a mail-return questionnaire. The mailing information was also used to analyze visitors’ place of residence. Identities and personal information of respondents were kept anonymous and confidential. There were significant differences in place of residence when visitors were split by length of stay and when split by use of outfitter. There were no significant differences in place of residence when split by mode of travel or season of use.
Figure 4a. Place of Residence
62.518.5
9.55.6 3.7 0.1
Montana States east of Rocky Mountains
Washington, Oregon Mountain states (except Montana)
California Foreign <1%
Figure 4b. Place of residence, split by length of stay
68.859.8
12.321.3
12.385.1 5.6
0.75.2
0.7 00
10
20
30
40
50
60
70
80
Day visitor Overnight visitor
perc
ent
Montana States east of Rocky Mountains
Washington, Oregon Mountain states (except Montana)
California Foreign <1%
62.5 ± 5% of visitors were from Montana
± 5%
The distribution of day visitors’ place of residence was different than the distribution of overnight visitor’s place of residence
± 2% ± 2%
22 2004 Bob Marshall Wilderness Complex Visitor Survey

Figure 4c. Place of residence, split by use of outfitter
28.9
72.3
40.2
11.914.48.24.1 6.1
12.4
1.20 00
1020304050607080
Outf itted Non-outf itted
perc
ent
.3
Montana States east of Rocky Mountains
Washington, Oregon Mountain states (except Montana)
California Foreign <1%
Non-outfitted visitors were more likely to be from Montana.
± 2% ± 2%
2004 Bob Marshall Wilderness Complex Visitor Survey 23

Place of residence, size of place of residence Visitors were asked to indicate the size of both their current place of residence and place they lived most before the age of 18. The choices were: on a farm, rural or small town (under 1,000 population), town (1,001-5,000 population), small city (5,001-50,000 population), medium city (50,001-1 million), and large city (over 1 million).
Figure 5a. Size of current place of residence
14%
17%
12%26%
25% 6%
On a farm Rural or small town (<1,000) Town (1,001-5,000) Small city (5,001-50,000)Medium city (50,001-1 million) Large city (>1 million)
± 3%
Figure 5b. Size of place of residence before age 18
21%
13%
15%24%
18% 9%
On a farm Rural or small town (<1,000) Town (1,001-5,000) Small city (5,001-50,000) Medium city (50,001-1 million)Large city (>1 million)
± 3%
24 2004 Bob Marshall Wilderness Complex Visitor Survey

Membership to conservation or outdoor recreation clubs Visitors were asked if they belong to any conservation or outdoor recreation clubs. Those that indicated that they did belong to such clubs were asked to indicate which ones.
Figure 6a. Percentage of respondents belonging to conservation or outdoor recreation clubs
38%
62%
Belong to clubs Do not belong to clubs
± 5%
The most common clubs reported were: Rocky Mountain Elk Foundation, Montana Wilderness Association, Sierra Club, Nature Conservancy, Backcountry Horseman, Montana Wildlife Foundation, Audobon Society, Trout Unlimited, Ducks Unlimited, Quail unlimited, Natural Resource Defense Council, and the Wilderness Society.
2004 Bob Marshall Wilderness Complex Visitor Survey 25
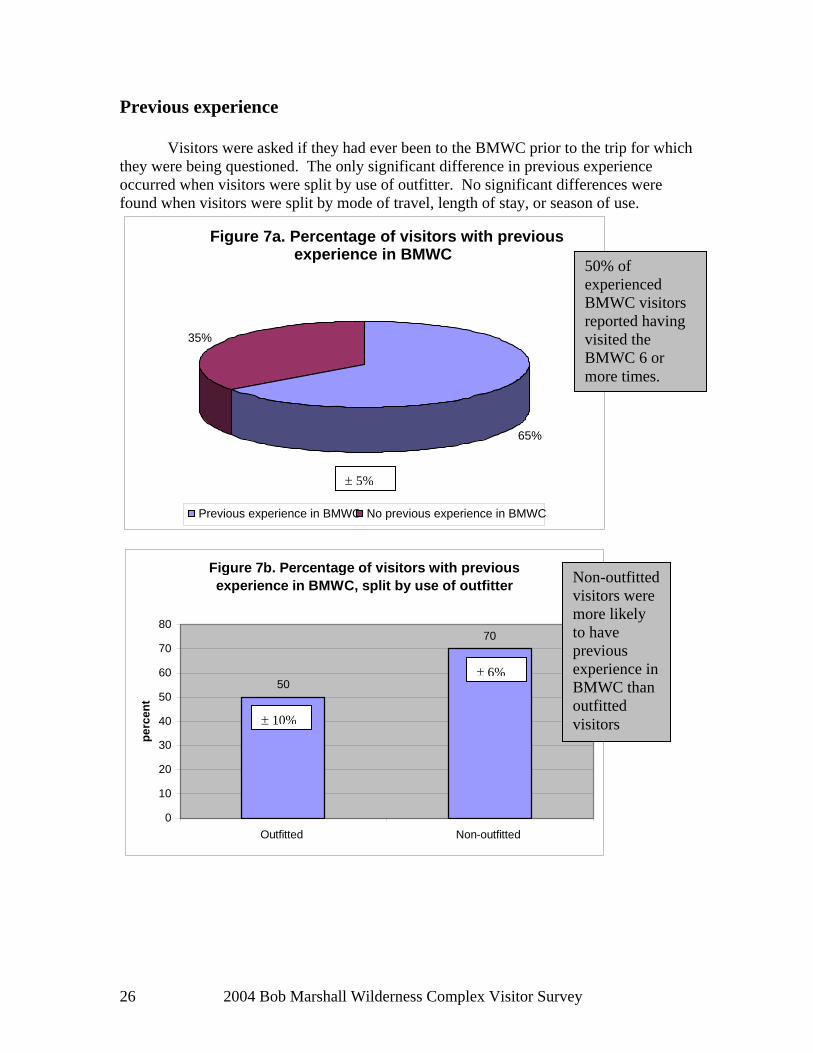
Previous experience Visitors were asked if they had ever been to the BMWC prior to the trip for which they were being questioned. The only significant difference in previous experience occurred when visitors were split by use of outfitter. No significant differences were found when visitors were split by mode of travel, length of stay, or season of use.
Figure 7a. Percentage of visitors with previous experience in BMWC
65%
35%
Previous experience in BMWC No previous experience in BMWC
± 5%
50% of experienced BMWC visitors reported having visited the BMWC 6 or more times.
Figure 7b. Percentage of visitors with previous experience in BMWC, split by use of outfitter
50
70
0
10
20
30
40
50
60
70
80
Outfitted Non-outfitted
perc
ent
Non-outfitted visitors were more likely to have previous experience in BMWC than outfitted visitors
± 6%
± 10%
26 2004 Bob Marshall Wilderness Complex Visitor Survey

Visitors were also asked if they had visited any Wilderness before this trip and at what age they made their first visit to a Wilderness area. Visitors were asked to indicate how many times they visited a Wilderness area in the previous 12 months and how many days total they spent in Wilderness areas in the previous 12 months.
Figure 7c. Previous experience in any Wilderness area
91%
9%
Previous experience in any Wilderness No previous experince in any Wilderness
The vast majority of visitors had visited a Wilderness area prior to their visit to the BMWC. The average visitor age at their first visit to a Wilderness area was 21.1± 2 years.
± 3%
Figure 7d. Number of visits and number of days spent in any Wilderness in the previous 12 months
4.8
11.8
0
2
4
6
8
10
12
14
Average number of visits in previous 12 months Average number of days spent in previous 12months
± 1
± 2
2004 Bob Marshall Wilderness Complex Visitor Survey 27

What are the characteristics of a 2004 BMWC visit? Respondents were asked numerous questions on both the onsite and mail-return questionnaires that helped to illustrate characteristics of their visits to the BMWC. These characteristics included: party size; mode of travel; number of livestock used; activities participated in; length of stay; use of outfitters; and number of encounters with other groups. As with the visitor characteristic data, results from the onsite questionnaire are listed instead of results from the mail-return questionnaire whenever this was appropriate. Party size Respondents were asked how many people were in their party. There were significant differences in party size when visitors were split by length of stay, by use of outfitter, and by mode of travel. No significant differences were found when visitors were split by season of use.
Figure 8a. Party size
3%
65%
18%
5%9%
1 person 2-4 people 5-7 people 8-10 people 11-15 people
The average number of people per party was 4.6 ± .4
± 3%
28 2004 Bob Marshall Wilderness Complex Visitor Survey

Figure 8b. Party size, split by length of stay
2.9
5.6
0
1
2
3
4
5
6
7
8
9
10
Day Visitors Overnight Visitors
num
ber o
f peo
ple
Party size for overnight visitors, on average, was larger than the party size for day visitors. ± .6
± .3
Figure 8c. Party size split by use of outfitter
9.2
3.4
0
1
2
3
4
5
6
7
8
9
10
Outfitted Non-outfitted
num
ber o
f peo
ple
Party size for outfitted visitors, on average, was larger than the party size for non-outfitted visitors
±1.1
± .3
2004 Bob Marshall Wilderness Complex Visitor Survey 29

Figure 8d. Party size split by mode of travel
3.2
6
0
1
2
3
4
5
6
7
8
9
10
Hike Horseback
num
ber o
f peo
ple
Party size for horseback riders, on average, was larger than hikers ± .8
± .3
Figure 8e. Party size split by season of use
4.5
5.8
0
1
2
3
4
5
6
7
8
9
10
Summer Fall
num
ber o
f peo
ple
Party size in the fall, on average, was larger than party size in the summer
± .4
± .6
30 2004 Bob Marshall Wilderness Complex Visitor Survey

Type of group Respondents that did not travel alone were asked to indicate the type(s) of people that made up their group. The choices were: a family or families (includes part of a family), a family plus friends (includes part of a family), friends and acquaintances (not related), and from an organization (scouts, club, etc.).
Figure 9a. Type of group
41%
33%
21%
1% 4%
Family Friends Family and friends Club or organization Other
Visitors mostly traveled with family members.
± 3%
2004 Bob Marshall Wilderness Complex Visitor Survey 31

Mode of travel Respondents were asked to indicate their primary mode of travel in the Wilderness. The choices were; hike (carrying our equipment ourselves), boat (raft, canoe, kayak, etc.), hike (leading horses or other livestock), and horseback. All modes of travel are depicted in Figure 10a. Only hikers and horseback riders are used in the comparative analyses. There were significant differences in mode of travel when visitors were split between length of stay, use of outfitter, and season of use.
Figure 10a. Mode of travel
49%
42%
2% 7%
Hike Horseback Hike with packstock raft
Figure 10b. Mode of travel, split by length of stay
80.5
33.6
19.5
53
0
10
20
30
40
50
60
70
80
90
Day visitor Overnight visitor
perc
ent
Hike Horseback
± 4%
Day visitors were much more likely to hike than ride horses. Overnight visitors were more likely to ride horses than to hike. ± 7% ± 6%
32 2004 Bob Marshall Wilderness Complex Visitor Survey

Figure 10c. Mode of travel, split by use of outfitter
2.1
64.362.9
33.935
1.80
10
20
30
40
50
60
70
80
90
Outfitted Non-outfitted
perc
ent
Hike Horseback Other
Non- outfitted visitors were more likely to hike than outfitted visitors. Outfitted visitors were more likely to ride horses than non-outfitted visitors. The other category for outfitted visitors was primarily composed of rafters.
± 3% ± 2%
Figure 10d, Mode of travel, split by season of use
53.1
33.336.1
66.7
10.8
00
10
20
30
40
50
60
70
80
90
Summer Fall
perc
ent
Hike Horseback Other
Summer visitors were more likely to hike than fall visitors. Fall visitors were more likely to ride horses than summer visitors.
± 4% ± 10%
2004 Bob Marshall Wilderness Complex Visitor Survey 33

Number of livestock Respondents who were in parties that used horses or other livestock (n=139) were asked how many horses or other livestock their party used. There were significant differences in number of livestock used when visitors were split by length of stay and split by use of outfitter. There was not a significant difference between summer and fall visitors.
Figure 11a. Number of livestock in groups that used livestock
7%
37%
33%
5%
4%14%
1-2 livestock 3-5 livestock 6-10 livestock 11-15 livestock16-20 livestock 20 or more
The average number of livestock taken, for groups that used livestock, was 11.1 ± 1.5
± 4%
Figure 11b. Average number of livestock in groups that used livestock, split by length of stay
3.6
11.4
02468
101214161820
Day Visitors Overnight Visitors
num
ber
Overnight visitor groups that used livestock used more livestock than day visitor groups that used livestock.
± 1.8
± .7
34 2004 Bob Marshall Wilderness Complex Visitor Survey

Figure 11c. Average number of livestock in groups that used livestock, split by use of outfitter
18.4
5.47
0
2
4
6
8
10
12
14
16
18
20
Outfitted visitors Non-outfitted visitors
num
ber
Outfitted visitor groups that used livestock used more livestock than non-outfitted visitor groups that used livestock.
±2.9
± .9
2004 Bob Marshall Wilderness Complex Visitor Survey 35

Activities Respondents were asked to identify all of the activities in which they participated in the Wilderness on the specific trip for which they were questioned. Totals equal more than 100 because some respondents participated in more than one activity. There were significant differences in various activities when visitors were split by length of stay, use of outfitter, season of use, and mode of travel.
Figure 12a. Activities participated in
69.763.6
52.6
30.2
21.8
10.57.2
00
10
20
30
40
50
60
70
80
Hike
Photog
raphy Fish
Nature
study
SwimHun
tRaft
Mtn cli
mb
perc
ent o
f vis
itors
par
ticip
atin
g
Hiking and photography were the most popular activities participated in by visitors.
± 3%
36 2004 Bob Marshall Wilderness Complex Visitor Survey

Figure 12b. Activities participated in, split by length of stay
77.8
53.543.4
38
5.1 1 0 0
66 68.957.1
26.4 30.1
15.2 10.70
01020304050607080
Hike
Photog
raphy
Fish
Nature
study
SwimHun
tRaft
Mtn clim
b perc
ent o
f vis
itors
par
ticip
atin
g
Day visitors Overnight visitors
Day visitors were more likely to participate in hiking and nature study than overnight visitors. Overnight visitors were more likely to participate in fishing, swimming and photography than day visitors
± 6%
Figure 12c. Activities participated in, split by use of outfitter
53.3
70 70
28.3
40
10.7
35
0
73.6
61.7
48.3
30.3
178.9
0.4 00
10
20
30
40
50
60
70
80
Hike
Photog
raphy Fish
Nature
study
SwimHun
tRaft
Mtn clim
b
perc
ent o
f vis
itors
par
ticip
atin
g
Outfitted Non-Outfitted
Non-outfitted visitors were more likely to hike than outfitted visitors.
± 7%
2004 Bob Marshall Wilderness Complex Visitor Survey 37

Figure 12d. Activities participated in, split by season of use
74.967.2
52.8
34.426
1.68.5
0
44.9 44.951
8.20
57.1
0 00
10
20
30
40
50
60
70
80
Hike
Photog
raphy Fish
Nature
study
SwimHun
tRaft
Mtn clim
b
Perc
ent o
f vis
itors
par
ticip
atin
g
Summer Fall
Summer visitors were more likely to participate in hiking, photography, nature study, swimming, and rafting than fall visitors. Almost all hunting is reported by fall visitors
± 6%
Figure 12e. Activities participated in, split by mode of travel
63.2
45.140.1
21.1
1.3 0.7 0
62.3
51.8
20.214.9
25.2
0 00
10
20
30
40
50
60
70
80
Photog
raphy Fish
Nature
study
SwimHun
tRaft
Mtn clim
b
Perc
ent o
f vis
itors
pat
icip
atin
g
Hike Horseback
Hikers were more likely to participate in nature study and swimming than horseback riders. Horseback riders more often reported participating in hunting.
± 4%
38 2004 Bob Marshall Wilderness Complex Visitor Survey

Length of stay Respondents were asked how many nights their party stayed in the Wilderness, beyond the road, on this particular visit. Day visitors were recorded as zero. There were significant differences in length of stay when visitors were split by use of outfitter, season of use, and mode of travel.
Figure 13a. Length of stay in nights
35%
11%15%
23%
16%
Day trip 1-2 nights 3-4 nights 5-6 nights 7 or more nights
Figure 13b. Average length of stay, split by use of outfitter
6.3
2.5
0
1
2
3
4
5
6
7
8
Outfitted Non-outfitted
num
ber o
f nig
hts
The average length of stay in nights was 3.28 ± .3
± 3%
Outfitted visitors’ length of stay was, on average, longer than non-outfitted visitors.
± .4
± .4
2004 Bob Marshall Wilderness Complex Visitor Survey 39

Figure 13c. Average length of stay, split by season of use
2.9
4.8
0
1
2
3
4
5
6
7
8
Summer Fall
num
ber o
f nig
hts
Fall visitors’ length of stay was, on average, longer than summer visitors’ length of stay ± .9
± .3
Figure 13d. Averqage length of stay, split by mode of travel
1.6
4.7
0
1
2
3
4
5
6
7
8
Hike Horseback
num
ber o
f nig
hts
Horseback riders’ length of stay was, on average, longer than hikers.
± .5
± .3
40 2004 Bob Marshall Wilderness Complex Visitor Survey

Outfitter use Visitors were asked if an outfitter or guide accompanied them on their trip. There were significant differences in outfitter use when visitors were split by length of stay and mode of travel.
Figure 14a. Outfitted vs. Non-outfitted visitors
22%
78%
Outfitted visitors Non-outfitted visitors
± 4%
Figure 14b. Outfitter use, splt by length of stay
0
33.3
0
10
20
30
40
50
60
Day visitor Overnight visitor
perc
ent u
sing
out
fitte
r
Only overnight visitors reported using outfitters in 2004. ± 5%
± 1%
2004 Bob Marshall Wilderness Complex Visitor Survey 41

Figure 14c. Outfitter use, split by mode of travel
0.8
34.8
0
10
20
30
40
50
60
Hike Horseback
perc
ent u
sing
out
fitte
r
Nearly all use of outfitters was by horseback riders.
± 5%
± 1%
Type of outfitter use Visitors that used outfitters were also asked what type of outfitted service they used. Was it a (1) fully outfitted trip or (2) a “drop camp” (brought in and left)?
Figure 14d. Type of outfitter use
76%
24%
Fully outfitted Drop camp
The majority of outfitted use was fully outfitted trips.
± 10%
42 2004 Bob Marshall Wilderness Complex Visitor Survey

Encounters Visitors were asked to indicate the total number of other groups they saw in the Wilderness on the trip about which they were being questioned. They were also asked how many of these were groups of ten or more people and how many of the groups had horses or other livestock. There were significant differences in encounters with all groups when visitors were split by length of stay, season of use, and mode of travel.
Figure 15a. Number of groups encountered per day
2.27
0.16
0.92
0
0.5
1
1.5
2
2.5
All groups Large groups (more than10 people)
Horse or livestock groups
Num
ber
of g
roup
s en
coun
tere
d pe
r da
y
± .5
± .1± .2
Figure 15b. Average number of all groups encountered per day , split by length of stay
3.9
1.4
0
0.5
1
1.5
2
2.5
3
3.5
4
4.5
Day visitors Overnight visitors
grou
ps e
ncou
nter
ed
Day visitors encountered more groups per day than overnight visitors. ± .6
± .3
2004 Bob Marshall Wilderness Complex Visitor Survey 43

Figure 15c. Average number of all groups encountered per day, split by season of use
2.4
1.3
0
0.5
1
1.5
2
2.5
3
Summer Fall
grou
ps e
ncou
nter
ed
Summer visitors, on average, encountered more groups per day than fall visitors.
± .3
± .5
Figure 15d. Average number of all groups encountered per day, split by mode of travel
2.8
1.6
0
0.5
1
1.5
2
2.5
3
Hike Horseback
num
ber o
f gro
ups
± .4
± .5
Hikers, on average, encountered more groups per day than horseback riders.
44 2004 Bob Marshall Wilderness Complex Visitor Survey

What were 2004 BMWC visitor attitudes?
Visitors were asked numerous questions about their attitudes towards social and physical conditions and management actions. Reactions to encounters Visitors were asked if they thought crowding was a problem in the places they visited and if so, where. Visitors were also asked their reactions to the number of other people encountered. The options were: saw way too few, saw too few, about right, saw too many, saw way too many, or did not matter to me one way or the other.
Figure 16a. Percentage of respondenets reporting that crowding was a problem
14%
86%
Crowding was a problem Crowding was not a problem
The vast majority of visitors did not think crowding was a problem.
± 4%
The most common places listed as having a problem with crowding were: the trail to Benchmark, around Our Lake near Headquarters Pass, Indian Meadows, North Fork of the Sun River, South Fork of the Flathead trail between Meadow Creek and Mid Creek, Upper Holland Lake, Pretty Prairie, and around Hodag Flats.
2004 Bob Marshall Wilderness Complex Visitor Survey 45

Figure 16b. Reactions to the number of other people encountered
0.3 2
54.2 20.8
2.4
20.3
Saw way too few Saw too fewAbout right Saw too manySaw way too many Did not matter to me one way or the other
Most visitors thought that the number of people they encountered was about right.
46 2004 Bob Marshall Wilderness Complex Visitor Survey

Campsite conditions Overnight visitors were asked to report the number of groups they preferred to be camped within sight or sound of them. There were no significant differences in preferred campsite conditions when visitors were split between use of outfitter, season of use, or mode of travel.
Figure 17a. Preferred number of other parties camped within sight or sound
83%
14%
1%
2%
0 groups 1 group 2 groups 3 or more groups
± 3%
Overnight visitors were also asked how frequently they were able to camp within this preferred number. 63% of respondents indicated that they were able to do this always. 31% reported being able to do this usually (at least half the time). Only 6% reported that they were able to do this sometimes or never. Overnight visitors were asked if they camped near the Middle Fork of the Flathead or the South Fork of the Flathead. 29% of overnight visitors reported camping near the South Fork, while only 4% reported camping near the Middle Fork.
2004 Bob Marshall Wilderness Complex Visitor Survey 47

Overnight visitors were asked if they passed up an available campsite because they didn’t like the condition it was in. If so they were asked to choose from a selection of reasons why they passed it up. The breakdown of these reasons and the location of these campsites can be found in appendix 1.
Figure 17b. Percentage of overnight visitors that passed up a campsite because they didn't like the condition it was in
16%
84%
Passed up campsite Did not pass up campsite
± 5%
48 2004 Bob Marshall Wilderness Complex Visitor Survey

Perceived change in area quality Visitors that had visited the BMWC previously were asked if they thought the quality of the area was: getting better, about the same, or was getting worse. No significant differences were found when perceived change in area quality was split by length of stay, by use of outfitter, by season of use, or by mode of travel.
Figure 18a. Perceived cahnge in area quality
13%
75%
12%
Getting better About the same Getting worse
± 5%
2004 Bob Marshall Wilderness Complex Visitor Survey 49

Management actions Visitors were asked how desirable or undesirable they considered various trail, campsite, visitor, and resource management actions. Management actions are listed in Tables 2a through 2d with the least desirable management actions first and the most desirable management actions last. Table 1a. Desirability of trail management actions (listed in rank order by level of undesirability)
Management Action Undesirable
Don’t care Desirable
Desirable in more heavily used parts of Wilderness, but not in more lightly used parts
A few trees blown down across the trail, maybe 1 or 2 per mile 35
48 13 3
Signs along the trail explaining natural features or early history 34
21 31 13
Use of chain saws by the administrators to clear trails of trees 23
27 41 7
Bridges over creeks where hikers could get their feet wet
23
36
25
16
Low standard trails (somewhat like a game trail--narrow, grade varies, winding, not the shortest route) 22
29 45 4
Leaving some areas with no trails 17 13 66 4 High standard trails (wide, steady grades, fairly straight) 12
14 32 42
Bridges over rivers that are dangerous for hikers to wade or for horses to ford 4
7 75 15
50 2004 Bob Marshall Wilderness Complex Visitor Survey

Table 1b. Desirability of campsite management actions (listed in rank order by level of undesirability)
Management Action Undesirable
Don’t care Desirable
Desirable in more heavily used parts of Wilderness, but not in more lightly used parts
Burying unburnable trash 76 4 19 2 Cemented rock fireplaces with metal grates 71
15 5.5 8.6
Split log picnic tables at campsites 62 19 11 8 Prohibiting camping within 200 feet of lakes, Wild and Scenic Rivers, or streams 40
12 38 10
Pole corrals at campsites for horses 38 28 21 13 Outhouses (pit toilets) 37 28 19 17 Prohibiting wood fires where dead wood is scarce 34
21 36 10
Small, loose rock fireplaces (fire rings) 30
25 34 11
Encouraging visitors to remove fire rings and all evidence of campfires when breaking camp 19
20 57 4
Expect campers to use only dead wood on the ground for campfires 18
12 65 5
A detailed, accurate map 1 10 87 1.6
2004 Bob Marshall Wilderness Complex Visitor Survey 51

Table 1c. Desirability of visitor management actions (listed in rank order by level of undesirability)
Management Action Undesirable
Don’t care Desirable
Desirable in more heavily used parts of Wilderness, but not in more lightly used parts
Issue trip permits so visitors could only camp each night in the area assigned to them 72
11 8 9
Closing some areas to use by horse parties 37
14 45 4
Mandatory human waste pack out policy for boaters on the river 30
22 41 8
Require all visitors to register when entering 29
33 36 3
Limiting the size of parties to 12 people 19
18 57 6
Restricting the number of visitors to an area if it is being used beyond capacity 18
8 64 10
Allow visitors to catch fish to eat in the Wilderness but not to bring out
13
21
63
3
Rangers in the backcountry 7 29 56 9 A guidebook to the Wilderness 5 29 64 2 Packing unburnable garbage back out of the Wilderness 3
2 92 3
52 2004 Bob Marshall Wilderness Complex Visitor Survey

Table 1d. Desirability of resource management actions (listed in rank order by level of undesirability)
Management Action Undesirable
Don’t care Desirable
Desirable in more heavily used parts of Wilderness, but not in more lightly used parts
Eliminating grazing by visitors' horses (require carrying horse feed) 44
22 21 14
A natural fishery-no stocking and barren lakes left barren 29
28 40 3
Natural forest fires started by lightning 12
20 66 2
2004 Bob Marshall Wilderness Complex Visitor Survey 53

Section 2: 2003 vs. 2004 Fire time periods
About the results:
If a heavily fire-affected year is indeed different than a non fire-affected year in
terms of use patterns, visitor characteristics, and attitudes, significant differences should
be found between the responses of the two years. As expected, several significant
differences did occur between the overall 2003 season and the overall 2004 season. This
section examines those differences and explains how an active fire season affects the
factors studied. It is also reasonable to assume that not all of the 2003 season was heavily
affected by fire. Fires did not start until mid July and trailhead closures did not start until
the end of July. Similarly, by the end of September, the fires had passed and all the
trailheads had reopened in time for the fall hunting season. Therefore, to further
understand the influence of fire, both years were split into 3 time periods, based on the
occurrence of fires and fire fighting activity in 2003.
• Pre fire (June and July)
• During fire (August and September)
• After fire (October)
The ‘pre fire’ period was the time period that occurred before the 2003 fires started to
have an impact on visitation. By the beginning of August, trailhead closures had begun
and many sections of the BMWC were closed to recreational use. This ‘during fire’ time
period lasted until fires were extinguished and trailheads reopened at the end of
September. The remainder of the season was deemed the ‘after fire’ time period. This
division of the year into these periods allowed a detailed comparison of similar time
periods between 2003 and 2004.
First a comparison was conducted with all the data of 2003 and all the data of
2004. All questions common to both studies were statistically tested for significant
differences. In turn, each of the time periods were tested against each other in a similar
manner, i.e. ‘pre fire’ period 2003 vs. ‘pre fire’ period 2004.
As the ‘pre fire’ and ‘after fire’ time periods were not significantly affected by
fire in 2003, they should not show many significant differences when compared with the
same time periods in 2004. Indeed this was the case, the non-fire time periods for each
2004 Bob Marshall Wilderness Complex Visitor Study 54

year showed no significant differences. Perhaps predictably, the ‘during fire’ time period
for each year showed the most differences. In addition, when overall comparisons of each
year were run, the only significant differences found were the same ones found for the
‘during fire’ time periods. Therefore the differences that appeared in the overall
comparisons of each year can be explained by the differences found in the ‘during fire’
time period.
55 2004 Bob Marshall Wilderness Complex Visitor Study

How were the Visitors themselves different in 2003 and 2004?
The visitor characteristics under investigation in this study were: age, sex, level of
education, place of residence, and previous experience in BMWC. In all cases, visitor
characteristics did not show a significant difference between overall comparisons of 2003
and 2004 or between the three individual time period comparisons for each year. The
conclusion is that the characteristics of the visitors themselves were not different for the
two years.
2004 Bob Marshall Wilderness Complex Visitor Study 56

How were the characteristics of a BMWC visit different in 2003 and 2004? Although the characteristics of the people that visited the BMWC did not change, the characteristics of their visits did show several significant differences between the two years. The characteristics of a BMWC visit under study in this investigation were: party size, mode of travel, number of livestock used, activities participated in, length of stay, use of outfitters, and number of encounters with other groups. Characteristics that showed overall significant differences are shown below. There were no significant differences between 2003 and 2004 for party size. Much like the previous section, each characteristic was also subdivided to investigate differences between: length of stay (day versus overnight), use of outfitter (outfitted versus non-outfitted), and mode of travel (hiking versus horseback). Mode of Travel Respondents were asked to indicate their primary mode of travel in the wilderness. The options were: hike (carrying equipment ourselves), boat (raft, canoe, kayak, etc), hiked (leading horses or other livestock), or horseback. No significant differences were found in the ‘pre fire’ and ‘after fire’ time period comparisons. However, the ‘during fire’ comparison did yield significant differences in hiking and horseback riding. Significant differences were also found when mode of travel was further split by length of stay and use of outfitter.
Figure 19a, Mode of travel
64.7
35.335.4
59.1
0
10
20
30
40
50
60
70
80
90
100
During fire period 2003 During fire period 2004
perc
ent o
r res
pond
ents
Hike Horseback
Visitors were more likely to travel by foot during the fires of 2003.
± 6% ± 10%
57 2004 Bob Marshall Wilderness Complex Visitor Study

Figure 19b. Mode of travel split by length of stay
79.4
5260
33.6
20.6
4840
66.1
0102030405060708090
100
During fire 2003Day visitors
During fire 2003Overnight visitorrs
During fire 2004Day visitors
During fire 2004Overnight visitors
perc
ent o
f res
pond
ents
Hike Horseback
Both day and overnight visitors were less likely to use horses during the fires of 2003.
± 7% ± 7% ± 9% ± 9%
Figure 19c. Mode of travel, split by use of outfitter
70.9
22.2
57.3
4.1
29.1
77.8
42.7
95.9
0102030405060708090
100
During fire 2003Non-outfitted
During fire 2003Outfitted
During fire 2004Non-outfitted
During fire 2004Outfitted
perc
ent o
f res
pond
ents
Hike Horseback
Both non-outfitted and outfitted visitors were less likely to use horses during the fires of 2003.
± 2%
± 4% ± 7% ± 4%
2004 Bob Marshall Wilderness Complex Visitor Study 58

Number of livestock
Respondents who were in parties that used horses or other livestock were asked how many horses or other livestock their party used. No significant differences were found in the ‘pre fire’ and ‘after fire’ time period comparisons. The ‘during fire’ time period did yield significant differences between the years.
Figure 20a. Average number of livestock taken
5.73
11.91
0
2
4
6
8
10
12
14
During fire period 2003 During fire period 2004
Num
ber o
f liv
esto
ck ta
ken
On average, the number of livestock taken by groups that used livestock was less during the fires of 2003.
± 1.8
± .5
59 2004 Bob Marshall Wilderness Complex Visitor Study

When the number of livestock taken was split into day and overnight users within the ‘during fire’ period, no significant difference was found in the number of livestock taken by day visitors. A significant difference was found in the number of livestock taken by overnight visitors.
Figure 20b. Average number of livestock taken, split by length of stay
0
6.8
0
14.4
02468
101214161820
Day visitor Overnight visitor
num
ber o
f liv
esto
ck
During fire period 2003 During fire period 2004
On average, overnight visitors took fewer livestock during the fires of 2003.
No significant difference was found in the number of livestock taken by day visitors.
± 2.4
± .8
When the number of livestock taken was split by outfitter use within the ‘during
fire’ period, no significant difference was found in the number of livestock taken by non-outfitted visitors. A significant difference was found in the number of livestock taken by outfitted visitors.
figure 20c. Average number of livestock taken, split by use of outfitter
0
10.9
0
19.5
02468
101214161820
Non-outfitted Outfitted
num
ber o
f liv
esto
ck
During fire period 2003 During fire period 2004
On average, the number of livestock taken by outfitted users was less during the fires of 2003.
No significant difference was found in the number of livestock taken by non-outfitted visitors.
± 3.8
± 2.8
2004 Bob Marshall Wilderness Complex Visitor Study 60

Activities Respondents were asked to identify all of the activities in which they participated in the BMWC on the specific trip for which they were questioned. The options were: fishing, hunting, hiking, nature study (bird watching, identifying wild flowers, rock study, etc.), mountain climbing (using ropes, special equipment, etc), rafting, swimming, or taking pictures. No significant differences were found in the ‘pre fire’ and ‘after fire’ time period comparisons. The only significant difference found was in the percentage of respondents participating in fishing in the ‘during fire’ time period.
Figure 21a. Participated in fishing
30.8
51.9
0
10
20
30
40
50
60
During fire period 2003 During fire period 2004
perc
ent
part
icip
atin
g
Visitors were less likely to fish during the fires of 2003.
± 7%
± 9%
61 2004 Bob Marshall Wilderness Complex Visitor Study

Significant differences between the years were found when fishing was split by use of outfitter, length of stay, and mode of travel.
Figure 21b. Percent of visitors participating in fishing, split by use of outfitter
28.6
46.450.7
54.5
0
10
20
30
40
50
60
Non-outfitted Outfitted
perc
ent p
artic
ipat
ing
During fire period 2003 During fire period 2004
Non-outfitted visitors were less likely to fish during the fires of 2003.
± 10%
Not statistically different ± 10%
Figure 21c. Percent of visitors participated in fishing, split by length of stay
30.2 31
56.350
0
10
20
30
40
50
60
Day visitor Overnight visitor
perc
ent p
artic
ipat
ing
During fire period 2003 During fire period 2004
Both day and overnight visitors were less likely to fish during the fires of 2003.
± 5%
± 5%
2004 Bob Marshall Wilderness Complex Visitor Study 62

FIgure 21d. Percent of visitors participating in fishing, split by mode of travel
23.9
42.547.9
55.2
0
10
20
30
40
50
60
Hike Horseback
perc
ent p
aric
ipat
ing
During fire period 2003 During fire period 2004
Hikers, were less likely to fish during the fires of 2003.
± 10%
Not statistically different
± 5%
63 2004 Bob Marshall Wilderness Complex Visitor Study

Length of stay Respondents were asked how many nights their party stayed in the wilderness, beyond the road, on this particular visit. Day visitors were recorded as zero. No significant differences in length of stay were found in the ‘pre fire’ and ‘after fire’ time period comparisons. Significant differences were found in the ‘during fire’ comparison.
Figure 22a. Average length of stay
2.4
3.8
0
1
2
3
4
5
6
7
8
During fire period 2003 During fire period 2004
num
ber o
f nig
hts
On average, the length of stay was less during the fires of 2003.
± .5
± .3
2004 Bob Marshall Wilderness Complex Visitor Study 64

When length of stay was split by outfitter use within the ‘during fire’ period, no significant difference was found for the non-outfitted visitors. A significant difference was found in the length of stay of outfitted visitors.
Figure 22b. Average length of stay, split by use of outfitter
3.5
7
0
1
2
3
4
5
6
7
8
Non-outfitted Outfitted
num
ber o
f nig
hts
During fire period 2003 During fire period 2004
On average, the length of stay of outfitted visitors was less during the fires of 2003.
No significant difference was found in the length of stay of non-outfitted visitors.
± .7
± .7
Significant differences for the ‘during fire’ periods were found when length of stay was split by mode of travel.
Figure 22c. Average length of stay, split by mode of travel
1.5
3.12.5
4.7
0
1
2
3
4
5
6
7
8
Hike Horseback
num
ber o
f nig
hts
During fire period 2003 During fire period 2004
On average, the length of stay for both hikers and horseback riders was less during the fires of 2003.
± .7
± .6± .7
± .3
65 2004 Bob Marshall Wilderness Complex Visitor Study

Outfitter use Respondents were asked if an outfitter or guide went with them on their trip. No
significant differences were found in the ‘pre fire’ and ‘after fire’ time period comparisons. Significant differences were found for the percent of visitors using outfitters in the ‘during fire’ time period comparisons.
Figure 23a. Outfitter use
11.8
31.2
0
10
20
30
40
50
60
During fire period 2003 During fire period 2004
perc
ent u
sing
out
fitte
rs
Visitors were less likely to use outfitters during the fires of 2003.
± 7%
± 4%
Significant differences for the ‘during fire’ periods were found when outfitted use was split by length of stay and mode of travel.
Figure 23b. Outfitter use, split by length of stay
5.7
16.7
0
43.1
0
10
20
30
40
50
60
Day vistior Overnight visitor
perc
ent u
sing
out
fitte
rs
During fire period 2003 During fire period 2004
Overnight visitors were more likely to be outfitted in 2004 than during the fires of 2003.
± 1%
± 7%
2004 Bob Marshall Wilderness Complex Visitor Study 66

Figure 23c. Use of outfitters, split by mode of travel
4.4
28
3.1
50
0
10
20
30
40
50
60
Hike Horseback
perc
ent u
sing
out
fitte
r
During fire period 2003 During fire period 2004
Horseback riders were less likely to use an outfitter during the fires of 2003.
Not statistically different
± 2% ± 7%
67 2004 Bob Marshall Wilderness Complex Visitor Study

Encounters Respondents were asked how many other groups they saw in the wilderness on the trip about which they were being questioned. They were also asked how many of these were groups of 10 or more people and how many of the groups had horses or other livestock. No significant differences were found in the ‘pre fire’ and ‘after fire’ time period comparisons for any of these questions. However, significant differences were found for numbers of encounters in the ‘during fire’ time periods. No significant differences were found when number of groups encountered was further split by use of outfitter, mode of travel, or length of stay.
Figure 24a. Number of groups encountered
3.8
0.32
1.7
5.2
0.68
3.3
0
1
2
3
4
5
6
All groups Large groups Groups with livestock
num
ber o
f gro
ups
During fire period 2003 During fire period 2004
In all categories, the average number of groups encountered was less during the fires of 2003.
± 1.1
± .4 ± .8
± .4± .08
± .2
2004 Bob Marshall Wilderness Complex Visitor Study 68

What were the differences in visitor attitudes between 2003 and 2004? Visitors were asked numerous questions about their attitude towards social and physical conditions and management actions. Earlier in this section, it was described that the characteristics of the visitors themselves did not change during the fires of 2003, but the characteristics of their visit did change. Much along this theme, visitors’ attitudes showed very few differences between the years. The attitudes that showed significant differences between 2003 and 2004 are presented below. These significant differences were consistent throughout all fire time periods, allowing an overall comparison of the years to be conducted. It is interesting that in the few cases that attitudes changed from 2003 to 2004, the subject of the question had something to do with fire. Desirability of management actions:
Figure 25. Cemented rock fireplaces with metal grates
59.7
71
2015.2
10.35.5
10 8.3
01020304050607080
2003 2004
perc
ent o
f res
pond
ents
Undesirable Don't careDesirableDesirable in more heavily used parts of wilderness, but not in more lightly used parts
Cemented rock fireplaces were less desirable in 2004.
± 2% ± 2%
69 2004 Bob Marshall Wilderness Complex Visitor Study

Figure 26. Small, loose rock fireplaces (fire rings)
22.9
29.329.125.9
42.6
33.4
5.511.4
05
1015202530354045
2003 2004
Perc
ent o
f res
pond
ents
Undesirable Don't careDesirableDesirable in more heavily used parts of wilderness, but not in more lightly used parts
Fire rings were less desirable in 2004.
± 2% ± 2%
Figure 27. Natural forest fires started by lightning
27.8
11.5
22.9 20.1
48.6
66.7
0.7 1.70
1020304050607080
2003 2004
Perc
ent o
f res
pond
ents
Undesirable Don't careDesirableDesirable in more heavily used parts of wilderness, but not in more lightly used parts
Natural forest fires were more desirable in 2004.
± 2% ± 2%
2004 Bob Marshall Wilderness Complex Visitor Study 70

Figure 28. Prohibiting wood fires where dead wood is scarce
26.4
34.1
19.2 21.3
50.6
34.8
3.89.8
0
10
20
30
40
50
60
2003 2004
perc
ent o
f res
pond
ents
Undesirable Don't careDesirableDesirable in more heavily used parts of wilderness, but not in more lightly used parts
Prohibiting wood fires where dead wood is scarce was less desirable in 2004.
± 2% ± 2%
The only non-fire related question that showed significant differences between
2003 and 2004 was the elimination of grazing by visitors horses (require carrying horse feed).
FIgure 29. Eliminating grazing by visitors' horses (require carrying horse feed)
35.5
45
26.121.1
31.2
20.1
7.213.8
05
101520253035404550
2003 2004
Perc
ent o
f res
pond
ents
Undesirable Don't careDesirableDesirable in more heavily used parts of wilderness, but not in more lightly used parts
Eliminating grazing was less desirable in 2004.
± 2% ± 2%
71 2004 Bob Marshall Wilderness Complex Visitor Study

Section 3: How have use patterns, visitor characteristics, and attitudes changed since the studies conducted in 1970 and 1982? About the results:
The fourth objective (listed in section 1) of conducting a visitor study for the
BMWC was to compare results to previous studies completed in 1970 and 19821 to
determine trends in use patterns, visitor characteristics, and attitudes. This section looks
at those differences and trends.
To allow an accurate comparison to the previous studies, the questions in the 2004
survey appeared as close to the 1970 and 1982 surveys as possible. In many cases the
wording appeared as an exact replica of the previous studies. In a few cases, wording was
changed to reflect current usage and understanding; for example, a question about how
visitors acquired information from the Forest Service was updated to include the choice
of using the internet. A few items that seemed low in priority were not repeated; for
example the comparison of usage for the three individual wilderness areas that make up
the BMWC was dropped as the area has increasingly been treated as one contiguous
wilderness area.
1 Lucas, Robert C. Visitor characteristics, attitudes, and use patterns in the Bob Marshall Wilderness complex, 1970-82. Research Paper INT-345. Ogden, UT: U.S. Department of Agriculture, Forest Service, Intermountain Research Station; 1985. 32p.
2004 Bob Marshall Wilderness Complex Visitor Survey 72

The method of sampling also remained as close as possible to the 1970 and 1982
studies. Descriptions of the exact sampling procedures are listed in section 1. A summary
of mail response rates is listed below. A decline in response rate is expected over the
years, and in 2004 a response rate of 72% is considered very good.
Year
Number of Questionnaires
mailed Completed and
returned Percent returned 1970 552 502 91% 1982 972 785 82% 2004 408 294 72%
73 2004 Bob Marshall Wilderness Complex Visitor Survey

How have visitors to the BMWC changed over the years? Confidence intervals are included for the 2004 data. Confidence intervals for the 1970 and 1982 data are included when known. We can say with 95% confidence that the means and percentages shown are within the ranges given. Age: There did not appear to be a difference between the ages of visitors of 1970 and 1982, however 2004 did yield a significant change in age structure. (Age categories were changed from those appearing earlier in this report to match those of the previous studies.)
Figure 30. Age
1923
14
54 54
36
2723
50
0
10
20
30
40
50
60
1970 1982 2004
perc
ent
16-24 25-44 45 and over
Visitors, on average, were older in 2004.
± 4%
2004 Bob Marshall Wilderness Complex Visitor Survey 74

Sex: Most visitors are male among all three studies. The proportion of female visitors grew from 20 percent in 1970 to 30 percent in 1982. In 2004 the proportion of females was not significantly different than in 1982.
Figure 31a. Sex of respondents
20
30 29
80
70 71
0
10
20
30
40
50
60
70
80
90
1970 1982 2004
perc
ent
Percent female Percent male
The percentage of males to females did not change from 1982 to 2004.
± 5%
75 2004 Bob Marshall Wilderness Complex Visitor Survey

Education: Education levels of 2004 were significantly different from 1970, indicating that visitors have become more highly educated. However, there was no significant difference between 1982 and 2004.
Figure 32a. Education level of visitors
17
9
4
2422
14
18
2320
13
21
3128
26
31
0
5
10
15
20
25
30
35
1970 1982 2004
perc
ent o
f res
pond
ents
Less than high school diploma high school diplomasome college four year college degree some graduate school
The education level of visitors was not significantly different from 1982 to 2004.
± 5% ± 9%
2004 Bob Marshall Wilderness Complex Visitor Survey 76

Place of residence In all studies, more than half of the visitors to the BMWC were from Montana. Overall, place of residence has not significantly changed over the years. However, a significant difference was found in the proportion of out of state visitors when split by mode of travel.
Figure 33a. Place of residence
6661 63
6 5 63 4 45 410
1925
19
1 1 00
10
20
30
40
50
60
70
80
1970 1982 2004
perc
ent o
f vis
itors
Montana Mountain states (except Montana)California Washington, OregonStates east of rocky mountains Foreign
Overall place of residence was not significantly different between the years. ± 4%
± 5%
77 2004 Bob Marshall Wilderness Complex Visitor Survey

Figure 33b. Percent of visitors from out of state, split by mode of travel
30
40
49
41 4035
0
10
20
30
40
50
60
1970 1982 2004
perc
ent
Hike Horseback
The percentage of hikers from out of state is increasing.
± 5%
2004 Bob Marshall Wilderness Complex Visitor Survey 78

Previous experience Significant differences were found in the proportion of visitors with previous experience in the BMWC in 2004 compared to 1982. The proportion of visitors with previous experience in any wilderness was also significantly greater in 2004.
Chart 34a. Previous experience in the BMWC
55
44
65
45
56
35
0102030405060708090
100
1970 1982 2004
Perc
ent o
f res
pond
ents
Previous experience in BMWC No prevous experince in BMWC
The percentage of visitors with previous experience in the BMWC was significantly different between 1982 and 2004 ± 5% ± 5%
Figure 34b. Previous experience in any wilderness area
78 78
91
22 22
9
0102030405060708090
100
1970 1982 2004
perc
ent o
f res
pond
ents
Previous experience in any wilderness No previous experience in any wilderness
On average, visitors in 2004 were more likely to have visited any wilderness area before their trip to the BMWC. ± 4%
± 5%
79 2004 Bob Marshall Wilderness Complex Visitor Survey

The average number of wilderness visits in the previous 12 months was found to be significantly different in 2004, however the total number of days spent in wilderness over the previous 12 months although, on average, higher in 2004, was not found to be different from 1970 to 1982.
Figure 34c. Average number of wilderness visits in the last 12 months
3 3
4.8
0
1
2
3
4
5
6
1970 1982 2004
num
ber o
f vis
its
On average, visitors in 2004 had visited wilderness more times in the past year than in previous studies.
± 1
Figure 34d. Total number of days spent in wilderness in the previous 12 months
9.9 9.8
11.8
0
2
4
6
8
10
12
14
1970 1982 2004
Num
ber o
f day
s
No significant difference was found in the total number of days spent in wilderness in the previous 12 months for the three studies.
± 2
2004 Bob Marshall Wilderness Complex Visitor Survey 80
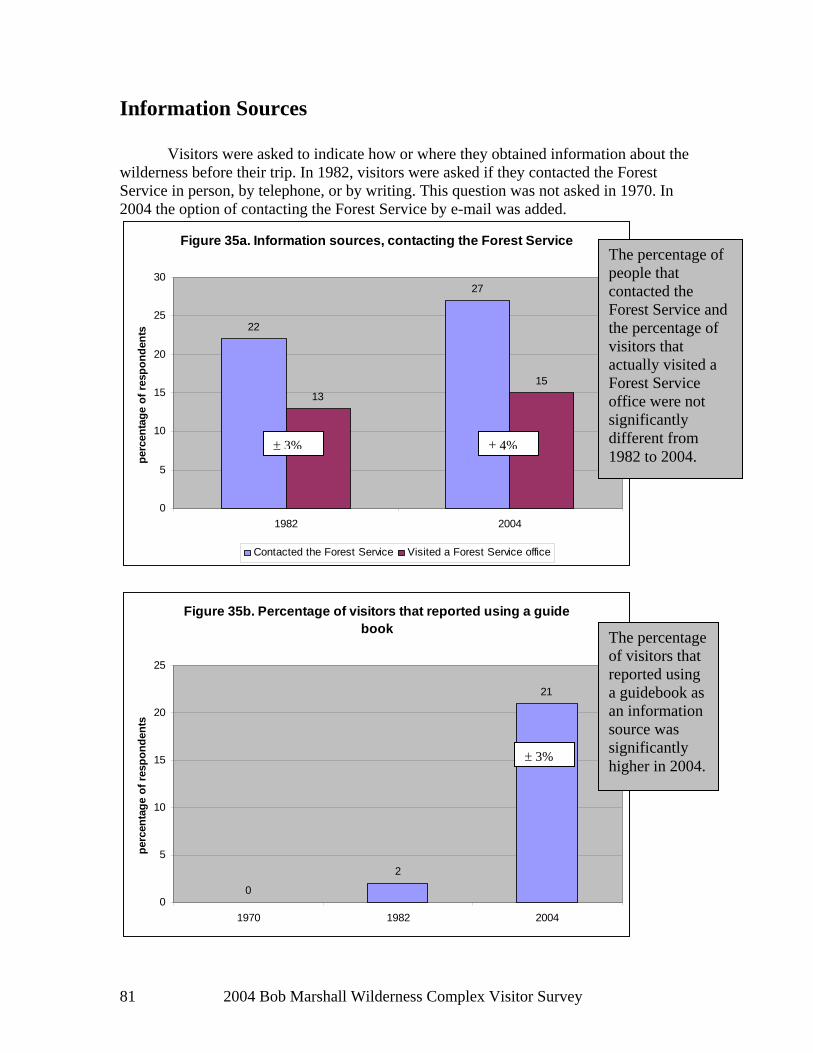
Information Sources Visitors were asked to indicate how or where they obtained information about the wilderness before their trip. In 1982, visitors were asked if they contacted the Forest Service in person, by telephone, or by writing. This question was not asked in 1970. In 2004 the option of contacting the Forest Service by e-mail was added.
Figure 35a. Information sources, contacting the Forest Service
22
27
1315
0
5
10
15
20
25
30
1982 2004
perc
enta
ge o
f res
pond
ents
Contacted the Forest Service Visited a Forest Service office
The percentage of people that contacted the Forest Service and the percentage of visitors that actually visited a Forest Service office were not significantly different from 1982 to 2004.
± 3% ± 4%
Figure 35b. Percentage of visitors that reported using a guide book
0
2
21
0
5
10
15
20
25
1970 1982 2004
perc
enta
ge o
f res
pond
ents
The percentage of visitors that reported using a guidebook as an information source was significantly higher in 2004. ± 3%
81 2004 Bob Marshall Wilderness Complex Visitor Survey

Club membership Visitors were asked if they belonged to any conservation or outdoor clubs.
Figure 36. Percent of visitors that belong to conservation or outdoor recreation clubs
31
25
38
0
5
10
15
20
25
30
35
40
1970 1982 2004
perc
enta
ge o
f res
pond
ents
The percentage of visitors that belonged to clubs was significantly higher in 2004.
± 5%
± 3%
2004 Bob Marshall Wilderness Complex Visitor Survey 82

How have visit characteristics changed over the years? Party size No statistical difference was found for average party size or proportion of visitors in party size categories.
Figure 37a. Average party size
4.94.3 4.6
0
1
2
3
4
5
6
7
8
9
10
1970 1982 2004
num
ber o
f peo
ple
No significant difference was found in the average party size.
± .7 ± .5 ± .4
Figure 37b. Number of people in party split by size category
58
3
54
63 65
28
1418
8 955 6
9
0
10
20
30
40
50
60
70
1970 1982 2004
perc
ent
1 2-4 5-7 8-10 11 or more
No difference was found in party size when split by size category.
83 2004 Bob Marshall Wilderness Complex Visitor Survey

Mode of travel In 1982, visitors were more likely to be hikers than horseback riders. This was opposite of the findings of the 1970 study. In 2004, hikers still outnumbered horseback riders, but the proportions were closer together.
Figure 38. Mode of travel
40
57
4950
36
42
63 24 2
7
0
10
20
30
40
50
60
1970 1982 2004
Perc
ent o
f res
pond
ents
Hike Horseback Hike with pack animals Boat
Hikers still outnumbered horseback riders in 2004.
± 2% ± 2%
2004 Bob Marshall Wilderness Complex Visitor Survey 84

Number of livestock After a drop in average number of horses taken per horse group from 1970 to 1982, the number rebounded in 2004.
Figure 39. Average number of horses for groups that used horses
12
9
11
0
2
4
6
8
10
12
14
1970 1982 2004
num
ber o
f hor
ses
The average number of horses taken per horse group appears slightly higher in 2004 than in 1982.
± 1.5
85 2004 Bob Marshall Wilderness Complex Visitor Survey

Activities Participation in various activities was not significantly different between 1982 and 2004.
Figure 40. Activities participated in
6068 70
5661 6461
5753
26 28 30
1117
22
32
1611
0.3 0.8 00
10
20
30
40
50
60
70
80
1970 1982 2004
perc
ent p
artic
ipat
ing
in
Hike Photography Fish Nature study Swim Hunt Mountain climb
Participation in different activities did not significantly change from 1982 to 2004.
± 4% ± 3%
2004 Bob Marshall Wilderness Complex Visitor Survey 86

Length of stay The average length of stay was significantly different between each year and is on the decline. The average length of stay for both horseback riders and hikers was less in 2004 than in 1982.
Figure 41a. Average length of stay
5.14.7
3.3
0
1
2
3
4
5
6
1970 1982 2004
num
ber o
f nig
hts
The average length of stay was less in 2004.
± .6 ± .5
± .3
Figure 41b. Average length of stay split by mode of travel
2.93.6
1.6
7.4
6.3
4.7
0
1
2
3
4
5
6
7
8
1970 1982 2004
num
ber o
f nig
hts
Hike Horseback
The average length of stay for both hikers and horseback riders was less in 2004.
± .5
± .3
87 2004 Bob Marshall Wilderness Complex Visitor Survey

Outfitter use The overall percentage of visitors using outfitters was not significantly different between 1982 and 2004. When split by season of use, the percentage of summer visitors using outfitters was significantly different.
Figure 42a. Percentage of visitors using outfitters
31
17
22
0
5
10
15
20
25
30
35
1970 1982 2004
perc
ent o
f vis
itors
No difference was found between 1982 and 2004.
± 4%
± 4%
Figure 42b. Percent using outfitter, split by season of use
21
14
22
46
24 24
05
101520253035404550
1970 1982 2004
perc
ent o
f vis
itors
Summer Fall
The percentage of summer visitors using outfitters was more in 2004 than in 1982.
± 4% ± 4%
2004 Bob Marshall Wilderness Complex Visitor Survey 88

Encounters The average number of encounters per day was significantly different between 1982 and 2004. When split by length of stay, the average number of encounters was significantly different for day visitors but not for overnight visitors.
Figure 43a. Average number of encounters per day
1.3
1.6
2.3
0
0.5
1
1.5
2
2.5
1970 1982 2004
num
ber o
f enc
ount
ers
The average number of encounters per day was more in 2004.
± .3
± .3
Figure 43b. Average number of encounters per day split by length of stay
3.2 3
3.9
1 1.2 1.4
00.5
11.5
22.5
33.5
44.5
1970 1982 2004
num
ber o
f enc
ount
ers
Day visitors Overnight visitors
The average number of encounters per day was more for day visitors in 2004.
± .3 ± .6
89 2004 Bob Marshall Wilderness Complex Visitor Survey

How have visitor attitudes changed over the years? Encounters
Following the questions about the number of encounters with other groups, visitors were asked about how they felt about the number of groups they encountered. The options were; saw way too few, saw too few, about right, saw too many, saw way too many, and did not matter to me one way or another. The two options for too few and the two for too many were added together for this analysis. No significant difference was found between the years.
Figure 44. Opinions of numbers met
2 2 2
60 6154
24 24 24
14 1320
0
10
20
30
40
50
60
70
1970 1982 2004
perc
ent o
f rep
osnd
ents
Too few About right Too many Didn't matter
Opinions on how many groups people encountered did not change.
± 7%
2004 Bob Marshall Wilderness Complex Visitor Survey 90

Campsite conditions Visitors that stayed overnight were asked how many other parties they would prefer to be camped within sight or sound of their camp. Although the percentage of visitors that responded with a zero was about the same as previous years, the other categories were significantly different.
Figure 45. Prefered number of other parties camped within sight or sound
8681 83
7 714
4 613 6 2
0102030405060708090
100
1970 1982 2004
perc
ent o
f res
pond
ents
0 1 2 3 or more
More people indicated one party and less people indicated 2 or more parties in 2004 ± 3%
± 4%
91 2004 Bob Marshall Wilderness Complex Visitor Survey

Perceived change in area quality Visitors that had visited the BMWC before, were asked to indicate if they thought that the quality of the area was getting better, was about the same, or was getting worse. After a change from 1970 to 1982, there was no significant difference between 1982 and 2004.
Figure 46. Perceived change in area quality
128
13
52
76 75
36
1612
0
10
20
30
40
50
60
70
80
1970 1982 2004
perc
ent o
f res
pond
ents
Better About the same Worse
The perceived change in area quality did not change from 1982 to 2004.
± 4% ± 5%
2004 Bob Marshall Wilderness Complex Visitor Survey 92

Bob Marshall Wilderness Complex 2004 Visitor Study Technical Appendices
Appendix 1: Statistical Test Results for Overall 2004 Survey ................94
Visitor Characteristics Age ........................................................................................................................94 Sex .........................................................................................................................95 Education ..............................................................................................................96 Place of residence ..................................................................................................98 Membership in clubs ...........................................................................................100 Previous experience.............................................................................................101
Visit Characteristics Party size .............................................................................................................104 Type of group ......................................................................................................105 Mode of travel ....................................................................................................106 Number of livestock ...........................................................................................107 Activities..............................................................................................................108 Length of stay ......................................................................................................111 Outfitter use .........................................................................................................113 Encounters ..........................................................................................................114
Visitor Attitudes Reaction to encounters ........................................................................................116 Campsite conditions ............................................................................................116 Perceived change in area quality ........................................................................119 Source of information..........................................................................................123 Desirability of management actions ...................................................................125 High/Low points..................................................................................................127 Other comments...................................................................................................127
Appendix 2: Sampling Schedule and Numbers Contacted.....................132 Appendix 3: Non-response Bias Check..........................................................134 Appendix 4: 2003 vs. 2004 Fire Time Periods .............................................135
Visitor Characteristics Age, sex, education .............................................................................................135 Place of residence, previous experience ..............................................................136
Visit Characteristics Mode of travel ....................................................................................................137 Number of livestock ...........................................................................................138 Activities .............................................................................................................139 Length of say ......................................................................................................140 Outfitter use, encounters .....................................................................................141
Visitor Attitudes Desirability of management actions ....................................................................143
Appendix 5: Onsite Questionnaire .................................................................145 Appendix 6: Mail Return Questionnaire ......................................................148
2004 Bob Marshall Wilderness Complex Visitor Survey 93

Appendix 1: Descriptive tables and statistical test results Tables are listed in the same order as section one of this report. Visitor Characteristics Age: Table 1a. Average age of adult BMWC visitors* Mean (n=358)
43.5 years
Standard deviation
14.46
*data are from completed onsite questionnaires Table 1b. Average age of adult visitors, split by length of stay* Day
visitors (n=117)
Overnight visitors (n=241)
Mean 44 years 43 years Standard deviation
13.99 14.7
*data are from completed onsite questionnaires t(356)=.532, p=.595 Table 1c. Average age of adult visitors, split by use of outfitter* Outfitted
(n=92) Non-outfitted (n=266)
Mean 49.5 41.5 Standard deviation
11.95 14.7
*data are from completed onsite questionnaires t(356)=4.671, p=.000 Table 1d. Average age of adult visitors, split by season of use* Summer
(n=299) Fall (n=59)
Mean 43.7 42.7 Standard deviation
14.79 12.72
*data are from completed onsite questionnaires t(356)=.478, p=.633
94 2004 Bob Marshall Wilderness Complex Visitor Survey

Table 1e. Average age of adult visitors, split by mode of travel* Hike
(n=196) Horseback (n=122)
Mean 40.1 46.7 Standard deviation
15.07 12.12
*data are from completed onsite questionnaires t(316)=4.103, p=.000 Sex: Table 2a. Sex of visitors (n = 408)* Percent male
71.1
Percent female
28.9
*Data are from onsite questionnaire Table 2b. Sex of visitors, split by length of stay* Day
visitors (n=139)
Overnight visitors (n=287)
Percent male
66.2 73.5
Percent female
33.8 26.5
F(1)=2.497, p=.115 *Data are from onsite questionnaire Table 2c. Sex of visitors, split by use of outfitter use* Outfitted
(n=96) Non-outfitted (n=329)
Percent male
71.9 70.8
Percent female
28.1 29.2
F(1)=.026, p=.873 *Data are from onsite questionnaire
2004 Bob Marshall Wilderness Complex Visitor Survey 95

Table 2d. Sex of visitors, split by season of use* Summer
(n=346) Fall (n=81)
Percent male
68.5 81.5
Percent female
31.5 18.5
F(1)=1.168, p=.017 *Data are from onsite questionnaire Table 2e. Sex of visitors, split by mode of travel* Hike
(n=212) Horseback (n=174)
Percent male
70.8 70.7
Percent female
29.2 29.3
F(1)=.002, p=.961 *Data are from onsite questionnaire Education: Table 3a. Education level of visitors* Education level (n=364) Percent
of visitors Less than high school diploma 4 High school diploma 14 Some college 20 Four year college degree 31 Some graduate school 31 *Data are from onsite questionnaire Table 3b. Mean education level of visitors (years)* Mean (n=595) 15.59 years Standard deviation
2.54
*Data are from onsite questionnaire
96 2004 Bob Marshall Wilderness Complex Visitor Survey

Table 3c. Mean education level of visitors (years), split by length of stay* Day visitor
(n=120) Overnight visitor (n=243)
Mean 16.08 15.35 Standard deviation
2.44 2.56
t(362)=2.618, p=.009 *Data are from onsite questionnaire Table 3d. Average education level of visitors (years), split by use of outfitter* Outfitted
(n=92) Non-outfitted (n=272)
Mean 15.83 15.51 Standard deviation
2.63 2.51
t(362)=1.043 , p=.297 *Data are from onsite questionnaire Table 3e. Average education level of visitors (years), split by season of use* Summer
(n=305) Fall (n=59)
Mean 15.68 15.14 Standard deviation
2.58 2.33
t(362)=1.477, p=.141 *Data are from onsite questionnaire Table 3f. Average education level of visitors (years), split by mode of travel* Hike
(n=203) Horseback (n=121)
Mean 15.98 14.63 Standard deviation
2.37 2.59
T(322)=4.790, p=.000 *Data are from onsite questionnaire
2004 Bob Marshall Wilderness Complex Visitor Survey 97

Place of residence: Table 4a. Place of residence* Place of Residence Percentage
of respondents (n=424)
Montana 62.5 States east of Rocky Mountains
18.5
Washington, Oregon
9.5
Mountain States (except Montana)
5.6
California 3.7 Foreign .1 *Data are from onsite questionnaire Table 4b. Place of residence, split by length of stay* Place of Residence Day visitor
(n=138) Overnight visitor (n=286)
Montana 59.8 68.8 States east of Rocky Mountains
21.3 12.3
Washington, Oregon
8 12.3
Mountain States (except Montana)
5.6 5.1
California 5.2 .7 Foreign 0 .7 *Data are from onsite questionnaire X2(5)=14.287, p=.014
98 2004 Bob Marshall Wilderness Complex Visitor Survey

Table 4c. Place of residence, split by use of outfitter* Place of Residence Outfitted
(n=97) Non-outfitted (n=329)
Montana 28.9 72.3 States east of Rocky Mountains
40.2 11.9
Washington, Oregon
14.4 8.2
Mountain States (except Montana)
4.1 6.1
California 12.4 1.2 Foreign 0 .3 *Data are from onsite questionnaire X2(5)=84.205, p=.000 Table 4d. Place of residence split by season of use* Place of Residence Summer
(n=344) Fall (n=80)
Montana 60.8 71.3 States east of Rocky Mountains
18.9 17.5
Washington, Oregon
10.2 6.3
Mountain States (except Montana)
6.1 2.5
California 3.8 2.5 Foreign .3 0 *Data are from onsite questionnaire X2(5)=4.354, p=.500 Table 4e. Place of residence split by mode of travel* Place of Residence Hiker
(n=212) Horseback (n=173)
Montana 63.2 64.7 States east of Rocky Mountains
17 22.5
Washington, Oregon
11.8 4.0
Mountain States (except Montana)
5.7 5.2
California 1.9 3.5 Foreign .5 0 *Data are from onsite questionnaire X2(5)=10.195, p=.070
2004 Bob Marshall Wilderness Complex Visitor Survey 99

Table 5a. Type of place of residence Where
respondents live now (n=281)
Where respondents lived most of their life before age 18 (n=279)
On a farm 14.0 20.8 Rural or small town (under 1,000 population)
17.1 12.8
Town (1,001-5,000 population
11.9 14.7
Small city (5,001-50,000 population)
26.2 24.5
Medium city (50,001-1 million)
24.6 18.1
Large city (over 1 million)
6.1 9.1
Membership in clubs: Table 6. Percentage of visitors with membership in conservation or outdoor recreation clubs Percent with club membership (n=280)
37.6
100 2004 Bob Marshall Wilderness Complex Visitor Survey

Previous experience: Table 7a. Percentage of BMWC visitors with previous experience in BMWC* Percentage with previous experience in BMWC (n=370)
65
If experienced, mean number of times visited previously (n=232)**
21.59
If experienced, median number of times visited previously (n=232)
6
*Data are from onsite questionnaire **outliers in this response heavily influenced this mean Table 7b. Percentage of BMWC visitors with previous experience in BMWC, split by length of stay* Day visitor
Overnight visitor
Percentage with previous experience in BMWC
64.4 (n=119)
66.4 (n=250)
If experienced, mean number of times visited previously**
39.45 (n=73) 13.42(n=159)
If experienced, median number of times visited previously
5.6 (n=73) 6 (n=159)
*Data are from onsite questionnaire **outliers in this response heavily influenced mean F(1)=.126, p=.723
2004 Bob Marshall Wilderness Complex Visitor Survey 101
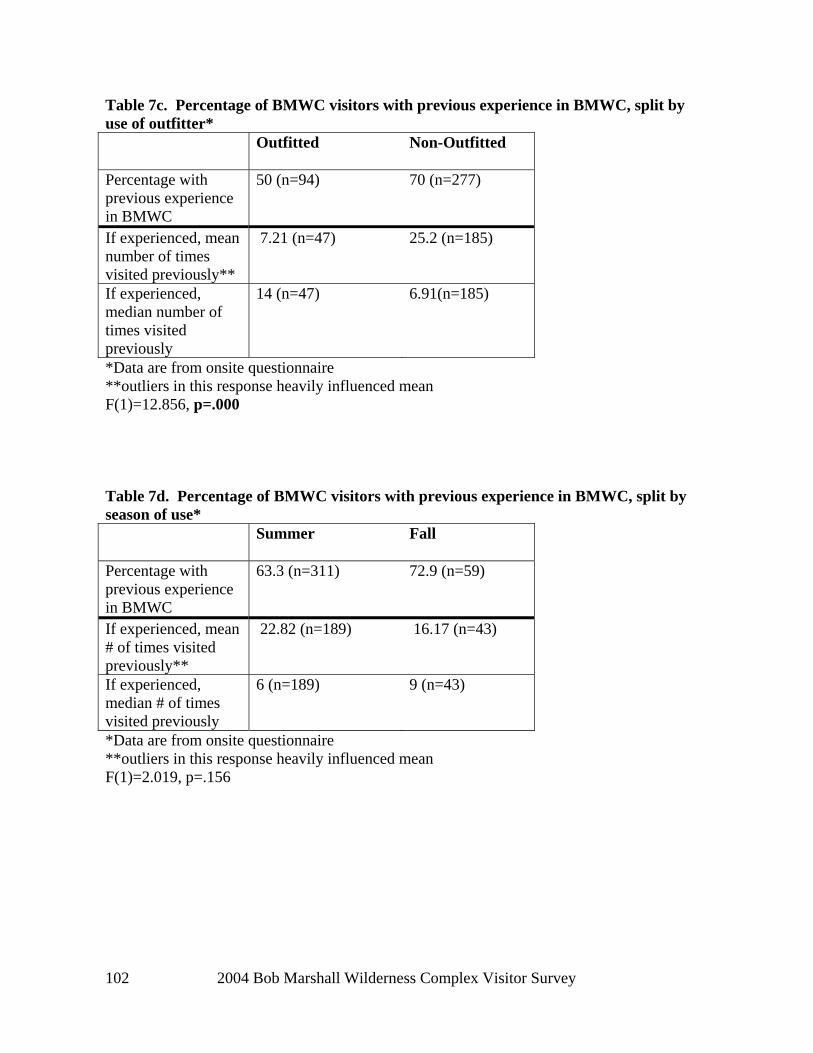
Table 7c. Percentage of BMWC visitors with previous experience in BMWC, split by use of outfitter* Outfitted
Non-Outfitted
Percentage with previous experience in BMWC
50 (n=94) 70 (n=277)
If experienced, mean number of times visited previously**
7.21 (n=47) 25.2 (n=185)
If experienced, median number of times visited previously
14 (n=47) 6.91(n=185)
*Data are from onsite questionnaire **outliers in this response heavily influenced mean F(1)=12.856, p=.000 Table 7d. Percentage of BMWC visitors with previous experience in BMWC, split by season of use* Summer
Fall
Percentage with previous experience in BMWC
63.3 (n=311) 72.9 (n=59)
If experienced, mean # of times visited previously**
22.82 (n=189) 16.17 (n=43)
If experienced, median # of times visited previously
6 (n=189) 9 (n=43)
*Data are from onsite questionnaire **outliers in this response heavily influenced mean F(1)=2.019, p=.156
102 2004 Bob Marshall Wilderness Complex Visitor Survey

Table 7e. Percentage of BMWC visitors with previous experience in BMWC, split by mode of travel* Hike Horseback Percent with previous experience in BMWC
66.3 (n=202) 64.6 (n=127)
If experienced, mean # of times visited previously**
29.04(n=129) 13.55 (n=79)
If experienced, median # of times visited previously
6 (n=129) 6 (n=79)
*Data are from onsite questionnaire **outliers in this response heavily influenced mean F(1)=.073, p=.787 Table 7f. Previous experience in any Wilderness Percentage of respondents who had been to any Wilderness before this trip (n=287)
90.8%
Table 7g. Average visitor age at time of first Wilderness visit Age (n=242) 21.1
years Table 7h. Number of visits to Wilderness in past 12 months made by BMWC visitors Mean number of visits (n=280)
4.79 visits
Table 7i. Number of days spent in Wilderness in past 12 months by BMWC visitors Mean number of days (n=276)
11.78 days
2004 Bob Marshall Wilderness Complex Visitor Survey 103

Visit Characteristics Party size: Table 8a. Party size Mean number of people per party (n=286)
4.63
1 person 3.2 2-4 people 64.3 5-7 people 18.1 8-10 people 5.1 11-15 people 9.2 --Percentage of total parties with indicated number of people Table 8b. Party size, split by length of stay Day
visitors (n=98)
Overnight visitors (n=188)
Mean number of people per party
2.88 5.54
Standard deviation 1.31 3.97 1 person 6.2 1.6 2-4 people 89.7 51.6 5-7 people 2.1 26.3 8-10 people 2.1 6.5 11-15 people 14.0 --Percentage of total parties with indicated number of people t(284)=6.426, p=.000 Table 8c. Party size, split by use of outfitter Outfitted
(n=60) Non-outfitted(n=225)
Mean number of people per party
9.22 3.43
Standard deviation 4.13 2.09 1 person 4.0 0 2-4 people 77.3 13.8 5-7 people 14.2 32.8 8-10 people 2.7 15.5 11-15 people 1.8 37.9 --Percentage of total parties with indicated number of people t(283)=15.036, p=.000
104 2004 Bob Marshall Wilderness Complex Visitor Survey
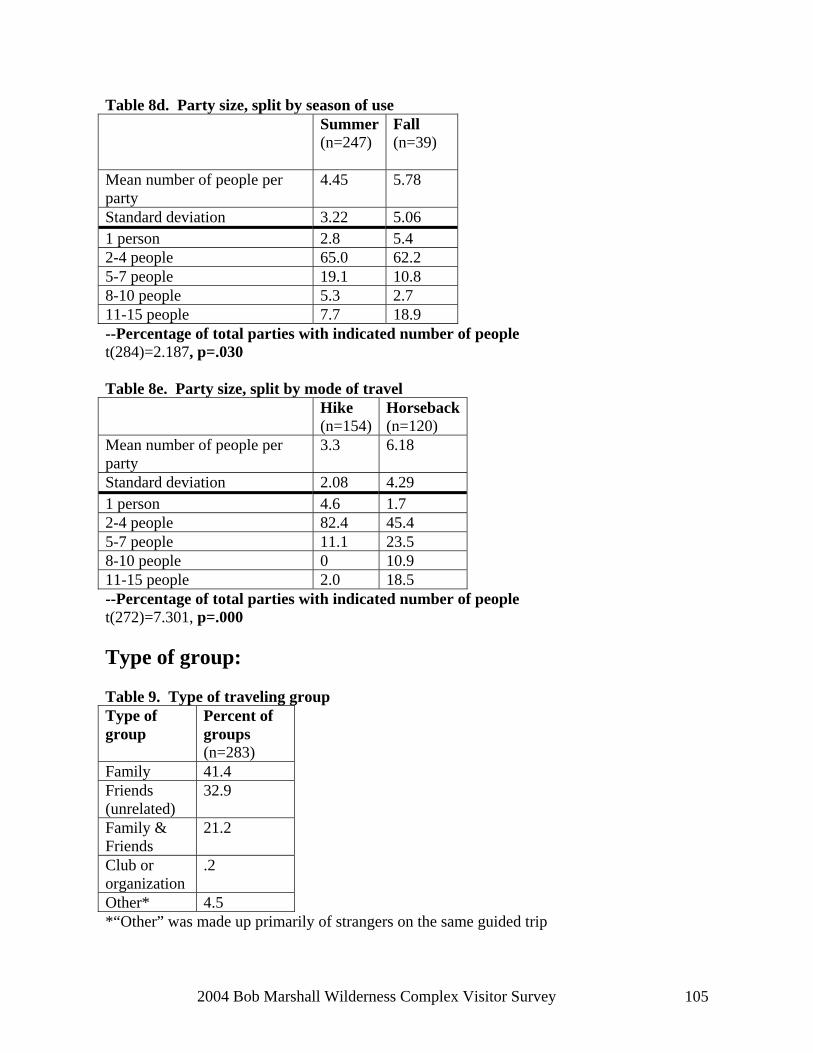
Table 8d. Party size, split by season of use Summer
(n=247) Fall (n=39)
Mean number of people per party
4.45 5.78
Standard deviation 3.22 5.06 1 person 2.8 5.4 2-4 people 65.0 62.2 5-7 people 19.1 10.8 8-10 people 5.3 2.7 11-15 people 7.7 18.9 --Percentage of total parties with indicated number of people t(284)=2.187, p=.030 Table 8e. Party size, split by mode of travel Hike
(n=154)Horseback(n=120)
Mean number of people per party
3.3 6.18
Standard deviation 2.08 4.29 1 person 4.6 1.7 2-4 people 82.4 45.4 5-7 people 11.1 23.5 8-10 people 0 10.9 11-15 people 2.0 18.5 --Percentage of total parties with indicated number of people t(272)=7.301, p=.000 Type of group: Table 9. Type of traveling group Type of group
Percent of groups (n=283)
Family 41.4 Friends (unrelated)
32.9
Family & Friends
21.2
Club or organization
.2
Other* 4.5 *“Other” was made up primarily of strangers on the same guided trip
2004 Bob Marshall Wilderness Complex Visitor Survey 105

Mode of travel: Table 10a. Mode of travel* Mode of travel Total
(n=453) Hike 49.6 Horseback 41.5 Hike with packstock
1.6
Raft 7.2 Other <1 --Percentage of total individual visits *Data are from onsite questionnaire Table 10b. Mode of travel, split by length of stay* Mode of travel
Day visitor (n=154)
Overnight visitor (n=298)
Hike 80.5 33.6 Horseback 19.5 53.0 Hike with packstock
0 2.3
Raft 0 11.1 Other <1 <1 --Percentage of total individual visits F(1)=81.573, p=.000** *Data are from onsite questionnaire *ANOVA test compared hikers and horseback riders Table 10c. Mode of travel, split by use of outfitter* Mode of travel
Outfitted (n=97)
Non-outfitted (n=342)
Hike 2.1 64.3 Horseback 62.9 33.9 Hike with packstock
1.0 1.8
Raft 34.0 0 Other 0 <1 --Percentage of total individual visits F(1)= 104.702, p=.000** *Data are from onsite questionnaire **ANOVA test compared hikers and horseback riders
106 2004 Bob Marshall Wilderness Complex Visitor Survey

Table 10d. Mode of travel, split by season of use* Mode of Travel
Summer (n=371)
Fall (n=81)
Hike 53.1 33.3 Horseback 36.1 66.7 Hike with packstock
1.9 0
Raft 8..9 0 Other <1 <1 --Percentage of total individual visits F(1)=18.948, p=.000** *Data are from onsite questionnaire **ANOVA test compared hikers and horseback riders
Number of livestock: Table 11a. Number of livestock in groups that used livestock Number of livestock Total (n=139) Mean 11.03 Standard deviation 8.68 1-2 livestock 7 3-5 livestock 37 6-10 livestock 33 11-15 livestock 5 16-20 livestock 4 20 or more livestock 14 --Percentage of total visitor groups using livestock Table 11b. Number of livestock in groups that used livestock, split by length of stay Number of livestock
Day visitor (n=18)
Overnight visitor (n=120)
Mean 3.49 12.18 Standard deviation 1.44 8.75 1-2 livestock 20 6 3-5 livestock 67 25 6-10 livestock 13 26 11-15 livestock 0 11 16-20 livestock 0 12 20 or more 0 20 --Percentage of total visitor groups using livestock t-test, t(137)= - 4.240 p=.000
2004 Bob Marshall Wilderness Complex Visitor Survey 107

Table 11c. Number of livestock in groups that used livestock, split by use of outfitter Number of livestock
Outfitted (n=44)
Non-outfitted (n=79)
Mean 18.4 5.47 Standard deviation 7.61 3.88 1-2 livestock 0 14 3-5 livestock 5 50 6-10 livestock 16 26 11-15 livestock 15 7 16-20 livestock 24 2 20 or more 40 1 --Percentage of total visitor groups using livestock t-test, t(137)= - 13.193, p=.000 Table 11d. Number of livestock in groups that used livestock, split by season of use Number of livestock
Summer (n=110)
Fall (n=34)
Mean 10.99 10.46 Standard deviation 8.24 9.64 1-2 livestock 8 6 3-5 livestock 28 33 6-10 livestock 22 32 11-15 livestock 12 4 16-20 livestock 13 7 20 or more 17 18 --Percentage of total visitor groups using livestock t-test, t(142)= .314, p=.754 Activities: Table 12a. Activities participated in Activity Total
(n=288) Hike 69.7 Photography 63.6 Fish 52.6 Nature Study 30.2 Swim 21.8 Other 6.4* Hunt 10.5 Raft 7.2 Mtn climb 0 --Percentage of visitors participating in each activity *Other was made up primarily of respondents who counted horseback riding as an activity.
108 2004 Bob Marshall Wilderness Complex Visitor Survey

Table 12b. Activities participated in, split by length of stay Activity Day visitor
(n=98) Overnight visitor (n=191)
Between groups ANOVA test result
Hike 77.8 66 F(1)=3.349, p=.068 Photography 53.5 68.9 F(1)=5.978, p=.015 Fish 43.4 57.1 F(1)=6.800, p=.010 Nature Study 38 26.4 F(1)=3.565, p=.060 Swim 5.1 30.1 F(1)=27.159, p=.000 Other* 5.1 7.3 F(1)=.488, p=.485 Hunt 1 15.2 F(1)=10.379, p=.001 Raft 0 10.7 F(1)=12.145, p=.001 Mtn climb 0 0 NA --Percentage of visitors participating in each activity *Other was made up primarily of respondents who counted horseback riding as an activity. Table 12c. Activities participated in, split by use of outfitter Activity Outfitted
(n=61) Non-outfitted (n=226)
Between groups ANOVA test result
Hike 53.3 73.6 F(1)=8.492, p=.004 Photography 70 61.7 F(1)=1.604, p=.206 Fish 70 48.3 F(1)=7.633, p=.006 Nature Study 28.3 30.3 F(1)=.139, p=.710 Swim 40 17 F(1)=13.931 p=.000 Other* 3.3 7.5 F(1)=1.525, p=.218 Hunt 10.7 8.9 F(1)=6.343, p=.012 Raft 35 .4 F(1)=107.80, p=.000 Mtn climb 0 0 NA --Percentage of visitors participating in each activity *Other was made up primarily of respondents who counted horseback riding as an activity.
2004 Bob Marshall Wilderness Complex Visitor Survey 109

Table 12d. Activities participated in, split by season of use Activity Summer
(n=246) Fall (n=49)
Between groups ANOVA test result
Hike 74.9 44.9 F(1)=19.144, p=.000 Photography 67.2 44.9 F(1)=9.317, p=.002 Fish 52.9 51 F(1)=.041, p=.840 Nature Study 34.4 8.2 F(1)=12.819, p=.000 Swim 26 0 F(1)=17.129, p=.000 Other 7.3 0 F(1)=3.915, p=.049 Hunt 1.6 57.1 F(1)=229.167, p=.000 Raft 8.5 0 F(1)=4.574, p=.033 Mtn climb 0 0 NA --Percentage of visitors participating in each activity *Other was made up primarily of respondents who counted horseback riding as an activity. Table 12e. Activities participated in, split by mode of travel Activity Hike
(n=154) Horse (n=123)
Between groups ANOVA test result
Hike NA 40.6 NA Photography 63.8 62.3 F(1)=.640, p=.424 Fish 45.1 51.8 F(1)=7.749, p=.006 Nature Study 40.1 20.2 F(1)=12.085, p=.001 Swim 21.1 14.9 F(1)=.018, p=.895 Other* 3.8 8.5 F(1)=2.598, p=.108 Hunt 1.3 25.2 F(1)=23.560, p=.000 Raft .7 0 F(1)=20.177, p=.000 Mtn climb 0 0 NA --Percentage of visitors participating in each activity *Other was made up primarily of respondents who counted horseback riding as an activity.
110 2004 Bob Marshall Wilderness Complex Visitor Survey

Length of stay: Table 13a. Length of stay in nights* Total
(n=445) Mean stay in nights
3.28
Standard deviation
3.29
0 34.5 1 6.1 2 5.0 3 10.5 4 5.0 5 15.0 6 8.4 7 6.3 8-10 8.4 11-14 .7 15 or more <1 --Percentage of individual visits for each number of nights *Data are from onsite questionnaire Table 13b. Length of stay in nights, split by use of outfitter* Outfitted
(n=96) Non-Outfitted (n=340)
Mean stay in nights
6.3 2.5
Standard deviation
1.92 3.12
0 0 43.5 1 0 7.9 2 0 6.1 3 1.3 13.4 4 7.6 4.3 5 35.3 9.2 6 27.7 3.1 7 7.6 6.1 8-10 20.6 5.3 11-14 0 1 15 or more 0 <1 --Percentage of individual visits for each number of nights t-test, t(435)= 11.413, p=.000 *Data are from onsite questionnaire
2004 Bob Marshall Wilderness Complex Visitor Survey 111

Table 13c. Length of stay in nights, split by season of use* Summer
(n=364) Fall (n=81)
Mean stay in nights
2.9 4.8
Standard deviation
2.95 4.19
0 36 27.9 1 6.7 3.5 2 5.6 2.0 3 9.4 15.4 4 5.2 4.0 5 17.6 3.0 6 10.2 0 7 4.0 16.4 8-10 5.0 23.9 11-14 0 4 15 or more <1 0 --Percentage of individual visits for each number of nights t-test, t(443)= 11.413, p=.000 *Data are from onsite questionnaire Table 13d. Length of stay, split by mode of travel* Hike
(n=222) Horseback (n=182)
Mean stay in nights
1.63 4.7
Standard deviation
2.32 3.47
0 55.6 15.9 1 7.8 5.5 2 7.7 2.7 3 9.8 13.1 4 2.3 5.3 5 8.8 21.9 6 2.6 9.4 7 1.6 11.4 8-10 3.8 12.7 11-14 0 1.8 15 or more 0 <1 --Percentage of individual visits for each number of nights t-test, t(402)= 10.674, p=.000 (between groups ANOVA on mean) *Data are from onsite questionnaire
112 2004 Bob Marshall Wilderness Complex Visitor Survey

Outfitter use: Table 14a. Outfitter use* Percentage of total visits with outfitter (n=439)
21.9%
*Data are from onsite questionnaire
Table 14b. Outfitter use, split by length of stay* Day
visitor (n=149)
Overnight visitor (n=289)
Percent outfitted
0 33.3
F(1)=10.918, p=.000 *Data are from onsite questionnaire
Table 14c. Outfitter use, split by season of use* Summer
(n=358) Fall (n=82)
Percent outfitted
21.5 24.4
F(1)=.344, p=.558 *Data are from onsite questionnaire Table 14d. Outfitter use, split by mode of travel* Hike
(n=222) Horseback(n=177)
Percent outfitted
.8 34.8
F(1)=104.702, p=.000 *Data are from onsite questionnaire Table 14e. Type of outfitter use (n=61) Fully Outfitted 76.5 Spot Pack 23.5 --Percentage of visitors who were on outfitted trips
2004 Bob Marshall Wilderness Complex Visitor Survey 113

Encounters: Table 15a. Mean number of groups encountered per day by visitors to BMWC Mean number of all types of groups encountered per day
2.27 (n=266)
Standard deviation 2.51 Mean number of large groups (more than 10 people) encountered per day
0.16 (n=285)
Standard deviation 0.43 Mean number of horse or livestock groups encountered per day
0.92 (n=285)
Standard deviation 1.43 Table 15b. Mean number of groups encountered per day by BMWC visitors, split by length of stay Day visitors Overnight
visitors t test for equality of means result
Mean number of all types of groups encountered per day
3.91(n=90) 1.43 (n=176)
Standard deviation 2.79 1.87
t(264)=8.595, p=.000
Mean number of large groups (more than 10 people) encountered per day
.17 (n=97) .15 (n=188)
Standard deviation .5 .4
t(283)=.314, p=.754
Mean number of horse or livestock groups encountered per day
1.23 (n=97) .76 (n=188)
Standard deviation 2.15 .82
t(283)=2.652, p=.008
114 2004 Bob Marshall Wilderness Complex Visitor Survey

Table 15c. Mean number of groups encountered per day by BMWC visitors, split by season of use Summer Fall t test for equality of
means result Mean number of all types of groups encountered per day
2.43 (n=229) 1.28 (n=36)
Standard deviation 2.61 1.44
T(264)=2.593, p=.010
Mean number of large groups (more than 10 people) encountered per day
.18 (n=244) .03 (n=41)
Standard deviation .46 .15
t(283)=2.042, p=.042
Mean number of horse or livestock groups encountered per day
.96 (n=244) .68 (n=41)
Standard deviation 1.51 .78
t(283)=1.171, p=.243
Table 15d. Mean number of groups encountered per day by BMWC visitors, split by mode of travel Hike Horse t test for equality of
means result Mean number of all types of groups encountered per day
2.81 (n=141) 1.61 (n=114)
Standard deviation 2.69 2.2
t(253)=3.829, p=.000
Mean number of large groups (more than 10 people) encountered per day
.16 (n=150) .14 (n=123)
Standard deviation .46 .39
t(271)=.427, p=.669
Mean number of horse or livestock groups encountered per day
.82 (n=151) 1.02(n=122)
Standard deviation 1.06 1.83
t(271)=1.116, p=.265
2004 Bob Marshall Wilderness Complex Visitor Survey 115

Visitor Attitudes Reactions to encounters: Table 16a. Visitor reactions to the number of other people encountered in BMWC Reaction Percent
reporting (n=286)
Saw way too few .3 Saw too few 2.0 About right 54.2 Saw too many 20.8 Saw way too many 2.4 Did not matter to me one way or the other
20.3
Do not remember <1 Campsite conditions: Table 17a. Percentage of respondents reporting that crowding was a problem in the places they visited Percent reporting crowding as a problem (n=287)
14%
Table 17b. Percentage of overnight visitors reporting preferred number of groups camped within sight or sound of them Number of groups
Percent (n=178)
0 groups 83.0 1 group 14.1 2 groups .7 3 or more groups
2.2
116 2004 Bob Marshall Wilderness Complex Visitor Survey

Table 17c. Percentage of overnight visitors reporting preferred number of groups camped within sight or sound, split by use of outfitter Number of groups
Outfitted (n=58)
Non-outfitted (n=121)
0 groups 82.8 82.6 1 group 15.5 14.0 2 groups 0 .8 3 or more groups
1.7 2.5
F(1)=.425, p=.515 Table 17d. Percentage of overnight visitors reporting preferred number of groups camped within sight or sound, split by season of use Summer
(n=153) Fall (n=25)
0 groups 84.3 76.0 1 group 13.7 16.0 2 groups .7 0 3 or more groups
1.3 8.0
F(1)=.3.169, p=.077 Table 17e. Percentage of overnight visitors reporting preferred number of groups camped within sight or sound, split by mode of travel Number of groups
Hike (n=73)
Horseback (n=93)
0 groups 94.5 75.3 1 group 5.5 19.4 2 groups 0 1.1 3 or more groups
0 4.3
F(1)=10.085, p=.002
2004 Bob Marshall Wilderness Complex Visitor Survey 117

Table 17f. Ability to find campsite with preferred number of other campers within site or sound Frequency of ability
Percentage of overnight visitors reporting (n=177)
Always 62.3 Usually (at least ½ time)
31
Sometimes 4.1 Never 2.5 Table 17g. Percentage of overnight visitors who camped near the Middle or South Fork Flathead Rivers Percentage of
campers camped near rivers (n=280)
Middle Fork Flathead River
3.7
South Fork Flathead River
28.6
Table 17h. Percentage of overnight visitors who passed up an available campsite because they didn’t like the condition it was in (n=186) Percent 15.9
118 2004 Bob Marshall Wilderness Complex Visitor Survey

Table 17i. Reasons for passing up campsite Reasons Percent of
overnight visitors who passed up a campsite because of its condition (n=34)
Horse manure 25.3 Bare ground or dust, exposed tree roots, erosion of the soil, etc.
25.3
Other* 22.7 Grazing for horses scarce
15.9
Litter 12.3 Cut or damaged trees 8.8 Evidence of human waste
7.1
Old campfire remains, rock fire rings, etc.
5.3
Firewood scarce 3.5 *There was no dominant theme in the “other” category List of campsites that were passed up because of its condition: Along the Sun River (many reports), along Gordon Creek, east of Baldy Bear Creek on S side of Rock Creek, , Salmon Forks, Near Benchmark trailhead, Youngs Creek on the South Fork of the Flathead, the point at Hodag Flats, Near Indian Meadows. Perceived change in area quality: Table 18a. Perceived change in area quality by repeat visitors Total (n=182) Percent reporting that quality is “Better”
12.8
Percent reporting that quality is “About the same”
74.9
Percent reporting that quality is “Worse”
12.2
2004 Bob Marshall Wilderness Complex Visitor Survey 119

Table 18b. Perceived change in area quality by repeat visitors, split by length of stay Day Visitors
(n=62) Overnight Visitors (n=119)
Percent reporting that quality is “Better”
8.1 15.1
Percent reporting that quality is “About the same”
85.5 69.7
Percent reporting that quality is “Worse”
6.5 15.1
F(1)=.042, p=.838 Table 18c. Perceived change in area quality by repeat visitors, split by use of outfitter Outfitted
(n=34) Non-Outfitted (n=148)
Percent reporting that quality is “Better”
11.8 12.8
Percent reporting that quality is “About the same”
76.5 74.3
Percent reporting that quality is “Worse”
11.8 12.8
F(1)=.025, p=.874 Table 18d. Perceived change in area quality by repeat visitors, split by season of use Summer
(n=151) Fall (n=30)
Percent reporting that quality is “Better”
11.3 20
Percent reporting that quality is “About the same”
75.5 73.3
Percent reporting that quality is “Worse”
13.2 6.7
F(1)=2.342, p=.128
120 2004 Bob Marshall Wilderness Complex Visitor Survey

Table 18e. Perceived change in area quality by repeat visitors, split by mode of travel Hike
(n=93) Horseback (n=84)
Percent reporting that quality is “Better”
9.7 16.7
Percent reporting that quality is “About the same”
80.6 69
Percent reporting that quality is “Worse”
9.7 14.3
F(1)=.221, p=.639 Immediately after the question about perceived change in area quality, visitors were asked what if anything seemed different. Here is the list of responses:
1. more people, more dying trees (drought?) 2. the Biggs fire helped thin jack pines 3. extensive fire damage from the gates park fire of 88 4. there is evidence of too many people on horseback and the associated damage 5. more moisture this year a few more people 6. vast burn areas some recovering, others don't seem to be - time will tell. seen no bears
or fishers this time 7. the need for fire is becoming increasingly evident 8. burn areas very slow to recover (trees, Vegetation) too much trash from humans left
on trails and campsites 9. Lots of fire damage 10. We caught more and bigger fish just after the fire 11. More people there fishing 12. Nothing but the natural regeneration from fire 13. Over the years trails have been relocated out of wet areas reducing horse damage (eg
morrison cr trail) 14. More people wider trail, fewer animals 15. More snow 16. More rain made the river flats and hillside green. the river was up also. 17. Lots more people 18. More cars and people 19. More cars on weekends 20. Site is cleaner, visitors seem to have an interest in keeping that area free of litter 21. the amount of burned area 22. the '88burn at gates park has been re-burned in several places - this greatly improved
both the accessibility of the area and the scenic nature or the area along with improved wildlife viewing
23. More signage (small, discrete, unobtrusive) telling others how to treat wilderness (pack it in pack it out) don't shortcut switchbacks etc.
2004 Bob Marshall Wilderness Complex Visitor Survey 121

24. Private parties using horses are having a big negative impact. Large areas where they picket horses are being de-vegetated
25. More people, Less grass (pasture), trail signs fallen down 26. trails seem more rutted and rocky than my last trip, no fish 27. less people 28. Meadow Creek had a trailhead host 29. Camp areas looked pretty used 30. there are more people with more degradation of delicate campsites 31. More burn area, more deadfall, more grass 32. My first visits to this area were in the early 70's. obviously , population pressures have
increased since then. the area appears to casual observation to be holding up all right in response, but I am concerned about increased motor traffic on (holland) lake
33. More people, more packers, more life 34. Previous visit in 98 so forest fire remnants were new and different. Also saw many
more horse packers 35. the trails are not opened up or improvements on them are not being maintained 36. Never saw areas ravaged by fires before 37. less people this year 38. trail to black bear deeply worn, muddy 39. the impact by the hundreds of horses 40. More traffic 41. More roads and trails closed, more people in the concentrated areas 42. Camp areas looked pretty used 43. forest fire damage. Streams in great shape/fishing was great (Sf of flathead above
salmon cr 44. Horse users seem more aware of their camping and horse feed/care habits, more small
plane traffic (especially close to benchmark) 45. one hellva fire that got away! However I am in favor of let burn policies 46. more hikers/backpackers, about the same number of horseback people 47. More air traffic, including helicopters servicing fire lookouts on the wilderness
boundary 48. Better grazing, fewer people 49. fishing was great, good re-growth in burn areas trail in good shape 50. the vegetation is recovering after the fire 51. the trails are almost impassable, lots of down trees 52. more people each time I come 53. the trails seemed like they were better kept 54. trails inside are better maintained than 80's and 90's
122 2004 Bob Marshall Wilderness Complex Visitor Survey

Source of information: Table 19a. Source of pre-trip information about BMWC Source Percent who obtained
information from source (n=288)
Obtained info from other source* 58.8 Read a guidebook 20.8 Did not obtain any info before trip 19 Visit to Forest Service office 14.5 Telephone to Forest Service office 10.3 View a Forest Service Internet site 14.4 View a non-Forest Service Internet site 8.5 E-mail a Forest Service office .8 Write a Forest Service office .6 *Other was predominantly made up of those who obtained information from friends or a map. Table 19b. Percentage of visitors reporting how well Forest Service-provided information met their needs (n=265) Percent reporting that Forest Service info met their needs “very well”
50.8
Percent reporting that Forest Service info met their needs “fairly well”
36.8
Percent reporting that Forest Service info met their needs “not very well”
7.4
No opinion 5.1
2004 Bob Marshall Wilderness Complex Visitor Survey 123

Desirability of management actions: Table 20a. Desirability of trail management actions (listed in rank order by level of undesirability) (n=283)
Management Action Undesirable
Don’t care Desirable
Desirable in more heavily used parts of Wilderness, but not in more lightly used parts
A few trees blown down across the trail, maybe 1 or 2 per mile 35
48 13 3
Signs along the trail explaining natural features or early history 34
21 31 13
Use of chain saws by the administrators to clear trails of trees 23
27 41 7
Bridges over creeks where hikers could get their feet wet
23
36
25
16
Low standard trails (somewhat like a game trail--narrow, grade varies, winding, not the shortest route) 22
29 45 4
Leaving some areas with no trails 17 13 66 4 High standard trails (wide, steady grades, fairly straight) 12
14 32 42
Bridges over rivers that are dangerous for hikers to wade or for horses to ford 4
7 75 15
124 2004 Bob Marshall Wilderness Complex Visitor Survey

Table 20b. Desirability of campsite management actions (listed in rank order by level of undesirability)
Management Action Undesirable
Don’t care Desirable
Desirable in more heavily used parts of Wilderness, but not in more lightly used parts
Burying unburnable trash 76 4 19 2 Cemented rock fireplaces with metal grates 71
15 5.5 8.6
Split log picnic tables at campsites 62 19 11 8 Prohibiting camping within 200 feet of lakes, Wild and Scenic Rivers, or streams 40
12 38 10
Pole corrals at campsites for horses 38 28 21 13 Outhouses (pit toilets) 37 28 19 17 Prohibiting wood fires where dead wood is scarce 34
21 36 10
Small, loose rock fireplaces (fire rings) 30
25 34 11
Encouraging visitors to remove fire rings and all evidence of campfires when breaking camp 19
20 57 4
Expect campers to use only dead wood on the ground for campfires 18
12 65 5
A detailed, accurate map 1 10 87 1.6
2004 Bob Marshall Wilderness Complex Visitor Survey 125

Table 20c. Desirability of visitor management actions (listed in rank order by level of undesirability)
Management Action Undesirable
Don’t care Desirable
Desirable in more heavily used parts of Wilderness, but not in more lightly used parts
Issue trip permits so visitors could only camp each night in the area assigned to them* 72
11 8 9
Closing some areas to use by horse parties* 37
14 45 4
Mandatory human waste pack out policy for boaters on the river* 30
22 41 8
Require all visitors to register when entering* 29
33 36 3
Limiting the size of parties to 12 people* 19
18 57 6
Restricting the number of visitors to an area if it is being used beyond capacity* 18
8 64 10
Allow visitors to catch fish to eat in the Wilderness but not to bring out*
13
21
63
3
Rangers in the backcountry* 7 29 56 9 A guidebook to the Wilderness* 5 29 64 2 Packing unburnable garbage back out of the Wilderness* 3
2 92 3
* Indicates management actions identified as important by Forest Service
126 2004 Bob Marshall Wilderness Complex Visitor Survey

Table 20d. Desirability of resource management actions (listed in rank order by level of undesirability)
Management Action Undesirable
Don’t care Desirable
Desirable in more heavily used parts of Wilderness, but not in more lightly used parts
Eliminating grazing by visitors' horses (require carrying horse feed)* 44
22 21 14
A natural fishery-no stocking and barren lakes left barren* 29
28 40 3
Natural forest fires started by lightning* 12
20 66 2
* Indicates management actions identified as important by Forest Service High / Low Points Visitors were asked to list the high points of their trip and the low points. The most common responses are as follows: Highs: Solitude, scenery, isolation, fishing, views, natural beauty, the Chinese wall, quiet, animals, wildflowers, and hiking to the top of mountains. Lows: Having to leave, horse manure, bad weather, muddy trails, downed trees, seeing a lot of people, not seeing wildlife, and mosquitoes. Other Comments At the end of the survey, respondents were given space to write any comments they had. The responses are as follows:
1. I'm not convinced that I should assume manager ignited fires will restore the natural role of fire within wilderness. I was under the assumption that fires that started naturally in wilderness wee permitted to burn anyway. That's "natural" no need for manager ignited fires.
2. Nature knows best how to take care of itself. fire is natures way of shedding its skin. Playing god in the forest is getting us into trouble. LEt It BURN. I've been going into the BM for 5 years. I fish for t week every year. I don't feel that my
2004 Bob Marshall Wilderness Complex Visitor Survey 127

presence has had any neg. effect. I respect the country and others that use it. I do hope that any user decisions are based on "good solid natural science" and not some "left wing emotional Bull Shit".
3. Grad student at trailhead, I think his name was Josh?.. Doing a great job. Very personable, knowledgeable, and helpful.
4. Our wilderness area and the wilderness study areas are a vast national treasure. They should remain intact. Motorized vehicles and the extraction industries (gas coal, oil, timber) should be banned from our wilderness areas, wilderness study areas and the entire rocky mountain front. "in the end our society will be defined not only by what we create, but by what we refuse to destroy" by john sawmill.
5. please try to keep the beautiful wilderness in the public's hands and for the good of all, not a few select rich people
6. Bob Marshall is one of the most beautiful places on earth. I feel very blessed to have backpacked in it for all these years
7. We have visited BM GB and SG wilderness areas because they are true wilderness. I thank people in Montana and the USA for protecting these areas from development (of any kind). Future Americans should have the right to enjoy these same areas for the same reasons. Thanks for this survey and the people who cared enough to find out what visitors to these areas think.
8. I feel I do not know enough about management ignited prescribed fires. I have not read enough about them to be either pro or con. I do know the fishing on the North fork of the Blackfoot improved a lot after the fire in that area. Most people think of fire as being negative. I have only read a little about its possible effects.
9. Long live wilderness, hands off, George Bush! 10. Keep the wilderness areas, wild and for horses. I love wilderness no matter where
they are. I'm glad there were people with foresight. People like George Bush are so stupid, it makes me wonder about the human race. People as a whole can be so stupid and very short sighted. Anyway, good luck.
11. I am very concerned about and opposed to any oil and gas exploration on the rocky mountain front. It is much more important for our country to develop alternative energy than to destroy an ecologically important wild area.
12. I think the Bob is remaining a great place for outdoor recreation. 13. Don't change a thing! 14. Personally I really enjoy recreating in recently burned areas of wilderness, to me,
this is not a deterrent. Additionally these burns improve habitat for most species and wildlife. the ungulates I hunt (deer and elk) are helped by having access to burned areas in conjunction with older growth. Ideally (in my mind and from what I know as a MSU fish and wildlife graduate) the desired forest has various succession stages from young to old growth. it seems like lately the Bob Marshall wilderness complex has been getting too much fire in too short of a time frame.
15. Let natural fires burn as they have in the last recent years. Its just beautiful in the bob. Protect the bldgs and bridges
16. I sincerely hope that future visitors enjoy this wilderness half as much as I did. It was truly a life changing experience. thank you for your work and good luck with the study
128 2004 Bob Marshall Wilderness Complex Visitor Survey

17. I am against man prescribed burns in the wilderness. Let nature take care of it. We waste too much valuable timber resource outside the wilderness to prescribed burns that burn more than was planned. I know what I am talking about having over 40 years in the woods
18. Hope you aren't spending much of our tax dollars on this survey. Better used for signs especially at the trailhead and on trail maintenance.
19. Barbless hooks should be mandatory to minimize the damage to the large number of fish that are caught and released.
20. Allow the wilderness to manage itself through natural fire. Decrease horse use in areas as it is too high impact.
21. By choosing to visit BMW in late July, we know we would encounter other parties. However, we found the very large parties with enough gear/supplies that took up an entire field - I'm speaking about guided fishing outfits- to be excessive. I feel like they are removing the sense of wilderness by having too much gear and too many tents piled high with stuff.
22. Even though the Bob is home to the outfitters horses, they should not be allowed to roam freely where they may disrupt a camp in the middle of the night. It is disrespectful and may upset the campers.
23. I thought being in the wilderness was so great and to see the mountains and everything was great. I would like to do a trip like this again
24. I think the bob is a treasure. It is wonderful to have it in our back yard. I also think there needs to be more people doing work on trails etc. and less people doing management. The more they try to manage it the worse it becomes. I do not like restrictions put on when and where you are allowed to go.
25. This was my first trip to a wilderness area, before this trip, I didn't understand the difference between wilderness on the hand and nat'l parks/forests on the other. I wish we could explore for oil/gas in wilderness areas, but I now understand why that would be difficult. I need to think and reconcile my opinions/feelings on this question. Big problem, uncut logs on the trails. Suggest using chain saws for f weeks each year to clear the trails. This would save tax payer money and make visits more enjoyable.
26. We travel to the bob most summers (unless fires keep us out) and love every experience we have had. We take new people each year in hopes they will also enjoy the outdoors.
27. I disagree with the idea of destroying the rock fire rings in the higher use areas, there are certainly places where people will camp repeatedly, leave the ring for the next campers, this would result in some well used campsites, but less impact on the rest of the surrounding wilderness area. I would much rather see a rock fire ring, as opposed to t5 turned over dirt pits.
28. I understand that there are maintenance and preservation concerns associated with wilderness areas like this. However, as expressed on the previous page. I would hope that those concerns could be addressed in ways that would allow visitors to get out in the wilderness without having every move limited in some way. Such as Glacier, expensive, tedious to plan, and frustrating to follow that plan down to every site visited, etc.
29. The bob is a great place, I don't want to see regulations get too heavy handed.
2004 Bob Marshall Wilderness Complex Visitor Survey 129

30. Had a great experience. Enjoy places that are minimally developed. Natural fires are good and create a variety of interesting forests. No new development in wilderness.
31. I had a great time, keep up the great work! 32. I feel strongly that the FS should not micro manage wilderness areas. In addition,
I am vehemently opposed to any more restrictions on what I believe is a birth right to US citizens- access to wilderness areas.
33. I have been packing in to the wilderness areas of Montana for 42 years. I would hate to see the Gov put any restrictions on this activity. I believe the Bob as wee as other areas are used less now than ever before by private horse users!
34. I found the section of this survey concerned with wildfire/controlled burns rather hard to answer. If any prescribed fires of controlled burns were initiated it would no longer be wilderness.
35. Wilderness areas are my favorite places on earth! Better than national parks. fires started in or that burn into them should burn freely
36. The keys to protecting wilderness are: t. reduce unnecessary consumption of natural resources, f. reduce population (human), 3. establish more meaningful connections between people and nature
37. I really enjoy this area NF Blackfoot it must stay catch and release, probably should have catch and release on bull trout in this area, keep up the good work FS.
38. I appreciate efforts towards well maintained trails. I love the off trail experience most. I appreciate efforts towards ethical camping, minimal trace. I hate regulation that keeps me out or regulates where I camp. I love above tree line and off trail where rangers don't go. I want rangers to keep abusive camping in check.
39. Too much horse manure everywhere we went. It completely filled the trails and smelled at our camps and brought flies.
40. At the trail head (meadow creek) the volunteer Laird Snider was very friendly and well informed to help all people in the camp.
41. Laird Snider at meadow creek was exceptionally courteous and quite informative, he came across as a good man.
42. As a transplant from Jackson, Wyo. I very much enjoy the small numbers of people in the back country. I think small controlled burns are a good idea. I would rather see controlled grazing rather that weed infested feed being packed in. As a long time guide I think Montana's backcountry is awesome.
43. Wilderness is of great but understated economic value to Montana, that is why I choose to live here spending most of my vacation time in the wilderness and spend a lot of money on wilderness related equipment. Especially horse related.
44. I feel very strongly that we have a high responsibility to future generations to preserve the wildness of the few places in America where there is true untrammeled wilderness, roadless, un-mechanized, undeveloped.
45. Maintain less used trails a little better, but leave everything else the way it is. 46. The time I spent in the wilderness was an unforgettable experience. It truly puts
one with nature. 47. I saw a lynx drinking from the NF Blackfoot!, Regulations are for people that
shouldn't be in the woods.
130 2004 Bob Marshall Wilderness Complex Visitor Survey

48. The Bob turned out to be the place that it became obvious that hikers and horse people have significant differences. Most of the trails looked way over used by horses not boots. they were difficult if not impossible to walk. We even saw horseman with his stock string out side by side in a meadow.
49. I believe that the forest service like many govt. agencies has too much bureaucracy-money is wasted on building, paperwork, vehicles etc, need more grass roots people in the field and less college educated types making decisions. All officials ought to start - be required to be in the woods without the luxuries of places like big prairie ranger station so they know first hand how it is to hike or have pack stock like ordinary folks. Spend more money on trail maintenance so less used areas would be more accessible.
50. It is important that wilderness excursions remain wild with the impression that civilization and its by products are escaped by entering a wilderness area. Many people understand this and recreate with a conscience commensurate with healthy wilderness lands. Education before folks enter wilderness is way more effective that trying to control them once they are already there.
51. I think natural fires should be allowed to burn. Perhaps even if man caused, it is a natural process we may not ee the benefits of in our lifetimes. Wilderness should be wilderness… protected not heavily managed, thanks for this survey.
52. Good access can be accomplished without compromising wilderness character. There are too many trails that are seldom if ever cleared for horse access. More cleared trails spreads out the use - away from some possibly over used areas.
53. The bob, the way it is now is perfect; nothing should be changed. May favorite place in the world!
54. I have experienced the Bob Marshall as a fresh beginner with only minimal experience with horses at age 30. My 17 years experience since then has given me a large overview of the wilderness issues.
55. I trust those in power will honor the public trust and to maintain wild resources. thanks for your efforts.
56. It is always a great experience in the bob. I think the FS does a good job at management of resources.
57. I believe that I enjoy wilderness as wilderness. Part of that is feeling free with all the needs and uses of wilderness this is harder to do. Care should be taken in crafting regulation not to ruin "free". All users of wilderness need to acknowledge and respect other users. Hikers private livestock users and outfitters. all need to not complain about the others. if a hiker complains about an outfitter using the same trail. I would suggest comparing it to hiking down to plateau point at grand canyon. A hiker can't even get a non mule urine breath on that wilderness trail.
58. Log more don't waste timber on fires.
2004 Bob Marshall Wilderness Complex Visitor Survey 131

Appendix 2. Sampling Schedule and numbers contacted at each site
Sample block dates
Week day (WD) or week end
(WE) sampling block
Planned sample site Nat’l Forest
Ranger District
Number contacted at sampled site
Summer June 18-20 WE S.F. Flathead River
(Meadow Creek) Flathead Spotted
Bear 11
June 21-24 WD Indian Meadows Helena Lincoln 4 June 28-July 1 WD Benchmark L & C Augusta 24 July 2-4 WE Gibson Reservoir L & C Augusta 17 July 5-7 WD Headquarters Pass L & C Rocky
Mtn. 49
July 12-15 WD North Fork Blackfoot River Lolo Seeley Lake
19
July 16-18 WE Pyramid Pass Lolo Seeley Lake
12
July 19-21 WD Bear Creek Flathead Hungry Horse
1
July 26-29 WD S.F. Flathead River (Meadow Creek)
Flathead Spotted Bear
33
July 30-Aug 1 WE Owl Creek Flathead Swan 28 Aug 2-Aug 4 WD Owl Creek Flathead Swan 11 Aug 9-12 WD Benchmark L & C Augusta 47 Aug 16-19 WD Beaver Creek Flathead Spotted
Bear 7
Aug 20-22 WE Morrison Creek Lolo Seeley Lake
2
Aug 23-25 WD Headquarters Pass L & C Rocky Mtn.
4
Aug 30-Sept 2 WD Benchmark L & C Augusta 11 Sept 3-5 WE Indian Meadows Helena Lincoln 25 Sept 6-8 WD North Fork Blackfoot River Lolo Seeley
Lake 29
Fall Sept 13-16 WD S.F. Flathead River
(Meadow Creek) L & C Spotted
Bear 9
Sept 17-19 WE Beaver Creek Flathead Spotted Bear
2
Sept 20-23 WD Pyramid Pass Lolo Seeley Lake
10
Sept 27-30 WD Owl Creek Flathead Swan 5 Oct 1-3 WE North Fork Blackfoot Lolo Seeley 4
132 2004 Bob Marshall Wilderness Complex Visitor Survey

Lake Oct 4-6 WD Monture Creek Lolo Seeley
Lake 7
Oct 11-14 WD Gibson Reservoir L & C Augusta 6 Oct 15-17 WE Benchmark L & C Augusta 2
2004 Bob Marshall Wilderness Complex Visitor Survey 133

Appendix 3. Non Response Bias Checks
Table 1. Non-response bias check test results Variable Between groups ANOVA test result Use of outfitter F(1)=1.115, p=.283 Length of stay F(1)=.103, p=.749 Mode of travel F(1)=.011, p=.918 Previous experience in BMWC F(1)=.794, p=.373 Education level F(1)=.720, p=.732
134 2004 Bob Marshall Wilderness Complex Visitor Survey

Appendix 4. 2003 versus 2004 Fire Time Period Comparisons In this section, information is shown only for figures appearing in Section 2 of this report. All other information can be found in either Appendix 1 of this report (for 2004) or in the final report for 2003.
Visitor Characteristics:
In all cases, for basic visitor characteristics, overall comparisons between the years and fire time period comparisons yielded no significant differences, overall comparisons are shown below. Age, overall 2003 and 2004 comparison 2003 average age (n=590)
43.77
2004 average age (n=358)
43.53
t(946)=.251, p=.802 Sex, overall 2003 and 2004 comparison 2003
(n=601) 2004 (n=426)
Percent male 68.7 71.1 Percent female 31.3 28.9 F(1)=.684, p=.408 Highest grade completed, overall 2003 and 2004 comparison 2003 average (n=595)
15.29
2004 average (n=364)
15.59
t(956)=1.774, p=.076
2004 Bob Marshall Wilderness Complex Visitor Survey 135

Place of residence, overall 2003 and 2004 comparison Place of Residence 2003
(n=138) 2004 (n=286)
Montana 64.8 62.4 States east of Rocky Mountains
17.3 18.4
Washington, Oregon
8.6 9.6
Mountain States (except Montana)
5.0 5.6
California 2.7 3.8 Foreign 1.7 .2 X2(4, CA and foreign pooled)=1.069, p=.899 Previous experience, overall 2003 and 2004 comparison 2003 2004
Percentage with previous experience in BMWC
59.9 (n=601)
65.0 (n=369) F(1)=2.447, p=.118
If experienced, mean number of times visited previously**
11.09 (n=594) 13.80(n=362) t(955)=.817, p=.414
If experienced, median number of times visited previously
2.0 (n=594) 2.0(n=362)
** Outliers heavily influenced the means 136 2004 Bob Marshall Wilderness Complex Visitor Survey

Visit Characteristics: With all questions regarding visit characteristics, a significant difference in overall comparison between the years was also accompanied by significant differences for the ‘during fire’ time period. ‘Pre fire’ and ‘after fire’ time periods did not show significant differences. Visit characteristics that showed significant differences are shown below. Those that showed significant differences were also tested for differences between three factors; length of stay, use of outfitter, and mode of travel. Mode of travel, overall 2003 vs 2004 Percentage of respondents
2003 (n=534)
2004 (n=413)
Hike 65.5 54.5 Horseback 34.5 45.5 X2(1)=11.952, p=.001 Mode of travel, during fire period comparison Percentage of respondents
During fire 2003 (n=309)
During fire 2004 (n=160)
Hike 64.7 35.3 Horseback 35.3 59.1 X2(1)=23.384, p=.000
Mode of travel, split by length of stay, during fire period comparison Percentage of respondents
During fire 2003
During fire 2004
Day visitors N=131 N=45 Hike 79.4 60.0 Horseback 20.6 40.0 X2(1)=6.617,
p=.017 Overnight visitors
N=152 N=115
Hike 52.0 33.6 Horseback 48.0 66.1 X2(1)=8.659,
p=.003
2004 Bob Marshall Wilderness Complex Visitor Survey 137

Mode of travel, split by use of outfitter, during fire period comparison Percentage of respondents
During fire 2003
During fire 2004
Non-Outfitted N=247 N=110 Hike 70.9 57.3 Horseback 29.1 42.7 X2(1)=6.314,
p=.012 Outfitted N=36 N=49 Hike 22.2 4.1 Horseback 77.8 95.9 X2(1)=6.579,
p=.010 Average number of livestock taken, overall 2003 and 2004 comparison 2003 average (n=179)
7.53
2004 average (n=144)
10.86
t(321)=4.096, p=.000 Average number of livestock taken, during fire period comparison During fire 2003 average (n=96)
5.73
During fire 2004 average (n=60)
11.91
t(154)=5.253, p=.000 Average number of livestock taken, split by length of stay, during fire period comparison During
fire 2003 During fire 2004
Day visitors 3.14 (n=28)
3.49 (n=14)
t(40)=.642, p=.525
Overnight visitors
6.81 (n=68)
14.37 (n=46)
t(112)=5.336, p=.000
Average number of livestock taken, split by use of outfitter, during fire period comparison During
fire 2003 During fire 2004
Non-outfitted 4.69 (n=80)
4.75 (n=31)
t(109)=.088, p=.930
Outfitted 10.91 (n=16)
19.46 (n=29)
t(43)=3.321, p=.002
138 2004 Bob Marshall Wilderness Complex Visitor Survey

Activities participated in, overall 2003 and 2004 comparison Percentage of respondents participating in activity
2003 2004
Fish 41.9 (n=454)
52.7 (n=296)
X2(1)=8.492, p=.004
Activities participated in, during fire period comparison Percentage of respondents participating in activity
During fire 2003
During fire 2004
Fish 30.8 (n=247)
51.9 (n=106)
X2(1)=14.172, p=.000
Activities participated in, split by length of stay, during fire period comparison Percentage of respondents
During fire 2003
During fire 2004
Day visitors N=106 N=32 Fish 30.2 56.3 X2(1)=7.226,
p=.007 Overnight visitors
N=142 N=76
Fish 31.0 50.0 X2(1)=7.627, p=.006
Activities participate in, split by use of outfitter, during fire period comparison Percentage of respondents
During fire 2003
During fire 2004
Non-outfitted N=220 N=75 Fish 28.6 50.7 X2(1)=12.057,
p=.001 Outfitted N=28 N=33 Fish 46.4 54.5 X2(1)=.399,
p=.527
2004 Bob Marshall Wilderness Complex Visitor Survey 139

Activities participated in, split by mode of travel, during fire period comparison Percentage of respondents
During fire 2003
During fire 2004
Hike N=142 N=48 Fish 23.9 47.9 X2(1)=9.818,
p=.002 Horseback N=80 N=58 Fish 42.5 55.2 X2(1)=2.164,
p=.141 Average length of stay in nights, overall 2003 and 2004 comparison 2003 average (n=598)
2.20
2004 average (n=445)
3.28
t(1041)=5.720, p=.000 Average length of stay in nights, during fire period comparison During fire 2003 average (n=315)
2.37
During fire 2004 average (n=160)
3.81
t(473)=4.942, p=.000 Average length of stay in nights, split by use of outfitter, during fire period comparison During
fire 2003 During fire 2004
Non-outfitted 2.22 (n=277)
2.39 (n=110)
t(386)=.538, p=.591
Outfitted 3.46 (n=37)
6.95 (n=50)
t(85)=7.182, p=.000
Average length of stay in nights, split by mode of travel, during fire period comparison During
fire 2003 During fire 2004
Hike 1.54 (n=183)
2.48 (n=65)
t(247)=.2.773, p=.006
Horseback 3.13 (n=100)
4.69 (n=94)
t(192)=2.954, p=.004
140 2004 Bob Marshall Wilderness Complex Visitor Survey

Percentage of visitors using outfitter, overall 2003 and 2004 comparison 2003 2004 Outfitted 14.0
(n=601) 21.9 (n=439)
X2(1)=11.038, p=.001
Percentage of visitors using outfitter, during fire period comparison During
fire 2003 During fire 2004
Outfitted 11.8 (n=314)
31.2 (n=160)
X2(1)=26.803, p=.000
Percentage of visitors using outfitter, split by length of stay, during fire period comparison Percentage of respondents
During fire 2003
During fire 2004
Day visitors N=140 N=45 Outfitted 5.7 0 X2(1)=3.859,
p=.048 Overnight visitors
N=174 N=116
Outfitted 16.7 43.1 X2(1)=24.542, p=.000
Percentage of visitors using outfitter, split by mode of travel, during fire period comparison Percentage of respondents
During fire 2003
During fire 2004
Hike N=183 N=65 Outfitted 4.4 3.1 X2(1)=.208,
p=.649 Horseback N=100 N=94 Outfitted 28.0 50.0 X2(1)=9.889,
p=.002
Average number of encounters, overall 2003 and 2004 comparison 2003 2004 All Groups 4.16
(n=450) 5.53 (n=291)
t(739)=3.709, p=.000
Groups over 10 .39 (n=451)
.62 (n=292)
t(741)=2.135, p=.033
Groups with livestock
1.92 (n=448)
3.07 (n=293)
t(740)=4.895, p=.000
2004 Bob Marshall Wilderness Complex Visitor Survey 141

Average number of encounters, during fire period comparison During
fire 2003 During fire 2004
All Groups 3.76 (n=245
5.15 (n=106)
t(349)=2.814, p=.005
Groups over 10 .32 (n=245)
.68 (n=106)
t(349)=2.287, p=.023
Groups with livestock
1.66 (n=245)
3.33 (n=106)
t(349)=4.976, p=.000
Average number of encounters per day, split by mode of travel, during fire period comparison During fire
2003 During fire 2004
Hike N=141 N=47 Average groups per day
2.26 2.05 t(185)=.588, p=.557
Horseback N=79 N=58 Average groups per day
1.43 1.60 t(135)=.499, p=.618
Average number of encounters per day, split by use of outfitter, during fire period comparison During fire
2003 During fire 2004
Non-outfitted N=218 N=74 Average groups per day
1.98 2.28 t(289)=1.034, p=.302
Outfitted N=28 N=32 Average groups per day
1.19 .65 t(58)=1.857, p=.068
Average number of encounters per day, split by length of stay, during fire period comparison During fire
2003 During fire 2004
Day visitor N=104 N=31 Average groups per day
3.16 3.38 t(133)=.429, p=.669
Overnight visitor
N=141 N=75
Average groups per day
.96 1.12 t(214)=1.081, p=.281
142 2004 Bob Marshall Wilderness Complex Visitor Survey

Visitor attitudes: Questions that showed significant differences are shown below. In all cases, these questions showed significant differences across all three fire time periods, indicating that visitor attitudes for these questions had changed from 2003 to 2004. The overall 2003 and 2004 comparisons are below. Cemented rock fireplaces with metal grates 2003 (n=439) 2004 (n=290) Undesirable 59.7 71.0 Don’t care 20.0 15.2 Desirable 10.3 5.5 Desirable in more heavily used parts but not lightly used parts.
10.0 8.3
X2(3)=11.044, p=.011 Small, loose rock fireplaces (fire rings) 2003 (n=437) 2004 (n=290) Undesirable 22.9 29.3 Don’t care 29.1 25.9 Desirable 42.6 33.4 Desirable in more heavily used parts but not lightly used parts.
5.5 11.4
X2(3)=14.898, p=.002 Natural forest fires started by lightning 2003 (n=432) 2004 (n=288) Undesirable 27.8 11.5 Don’t care 22.9 20.1 Desirable 48.6 66.7 Desirable in more heavily used parts but not lightly used parts.
.7 1.7
X2(3)=34.045, p=.000
2004 Bob Marshall Wilderness Complex Visitor Survey 143

Prohibiting wood fires where dead wood is scarce 2003 (n=443) 2004 (n=287) Undesirable 26.4 34.1 Don’t care 19.2 21.3 Desirable 50.6 34.8 Desirable in more heavily used parts but not lightly used parts.
3.8 9.8
X2(3)=23.506, p=.000 Eliminating grazing by visitors’ horses (require carrying feed) 2003 (n=445) 2004 (n=289) Undesirable 35.5 45.0 Don’t care 26.1 21.1 Desirable 31.2 20.1 Desirable in more heavily used parts but not lightly used parts.
7.2 13.8
X2(3)=21.837, p=.000
144 2004 Bob Marshall Wilderness Complex Visitor Survey

Appendix 5 Onsite Questionnaire
Wilderness Visitor Study 2004 OMB# 0596-0108
1. Have you visited this Wilderness area before?
[ ] No [ ] Yes If Yes, about how many times? ________
2. Are you aware of the fires that occurred in or around the Bob Marshall last year?
[ ] Yes [ ] No → Go to next page (question 5) [ ] Unsure → Go next page (question 5) 3. Did those fires affect your plans to visit The Bob last year (2003)?
[ ] No → Go to next question (question 4) [ ] Yes If Yes, then HOW did the fires affect your plans ?
4. Did the 2003 fires affect your plans to visit The Bob this year (2004)?
[ ] No → Go to next page (question 5) [ ] Yes If Yes, then HOW did the fires affect your plans ?
2004 Bob Marshall Wilderness Complex Visitor Survey 145

5. How important were each of the following factors in choosing a specific area to visit
this year ?
Not Important Somewhat Important
Very Important
Natural place, lack of human evidence 1 2 3
Remoteness, solitude 1 2 3
Scenic beauty 1 2 3
Quality hunting 1 2 3
Quality fishing 1 2 3
Recent occurrence of wildland fires 1 2 3
Test outdoor skills 1 2 3
Familiarity, been there before 1 2 3
A new area, variety 1 2 3
A friend or family member suggested it 1 2 3
6. What year were you born? ________ 7. What is the highest year of school you have completed? (circle number)
Elementary High School College Graduate School
1 2 3 4 5 6 7 8 9 10 11 12 13 14 15 16 17 18 19 or more Please provide your name and address so that we may send you a follow-up questionnaire regarding your trip and your ideas about the Wilderness and its management. Your opinions are important. This information will be kept strictly confidential. Your personal information will be destroyed after we receive your completed questionnaire. Name:__________________________________________________________________ Mailing Address:___________________________________________________________ City, State, Zip code:______________________________________________________
THANK YOU!
146 2004 Bob Marshall Wilderness Complex Visitor Survey

Group Summary
Trailhead: __________________________________________ Date: __________________ Time of Contact: _______ Direction of travel : [ ] Entering
[ ] Leaving Going into / coming from Wilderness ?
[ ] Yes [ ] No [ ] Not clear
Length of stay: [ ] Day Use only [ ] Overnight → Number of nights: ______
Outfitted: Gender composition :
[ ] Yes # Male : [ ] No # Female :
Type of group:
[ ] Hikers Number of stock : [ ] Horseback riders [ ] Hikers w/ pack animals [ ] Paddlers
Number of non-sampled group members: ________
Reason for non-sampling: Under 16 [ ] Outfitter [ ] Other _____________________ Qnr# __________ Comments:_________________________________________________________________________
2004 Bob Marshall Wilderness Complex Visitor Survey 147

Appendix 6. Mail-Return Questionnaire
148 2004 Bob Marshall Wilderness Complex Visitor Survey