bobcat distribution and abundance at ... - stacks.stanford.edu
TRANSCRIPT

Bobcat distribution and abundance at Jasper Ridge Biological Preserve
in Northern California
Amelia Zuckerwise May 2015

BOBCAT DISTRIBUTION AND ABUNDANCE
AT JASPER RIDGE BIOLGOGICAL PRESERVE IN NORTHERN CALIFORNIA
An Honors Thesis Submitted to the Department of Biology
in partial fulfillment of the Honors Program STANFORD UNIVERSITY
by
AMELIA ZUCKERWISE MAY 2015

BOBCAT DISTRIBUTION AND ABUNDANCE AT JASPER RIDGE BIOLOGICAL PRESERVE IN NORTHERN CALIFORNIA
by AMELIA ZUCKERWISE
Approved for submittal to the Department of Biology for consideration of granting graduation with honors:

Acknowledgements
I thank my research advisor, Professor Rodolfo Dirzo, for his invaluable guidance on this
project. The execution of and funding for this project would not have been possible
without the support of Nona Chiariello, Cindy Wilber, and Trevor Hebert at Jasper Ridge
Biological Preserve. I also thank Professor Tadashi Fukami for his advice. Several
volunteers assisted me with field data collection, especially the knowledgeable Bill
Gomez. In addition, other volunteers that helped me were Max Deng, Kara Yeung, Stu
Koretz, Ben Bravo, Warren Yeend, and Jaena Han.
Funding was provided by the Jasper Ridge Mellon Grant.

Table of Contents Abstract 1
Introduction 2
Materials and Methods 5
Results 9
Discussion 18
References 21

List of tables
Table 1. Range of Relative Abundance Indices in occurrences per site per 100 trap days.
Table 2. Estimation of degree of overlap with bobcat.

List of figures
Figure 1. Locations of cameras at JRBP from 2006-2008 mammal census.
Figure 2. Photograph of a bobcat from one of the cameras in March 2015.
Figure 3. Species composition.
Figure 4. Bobcat occurrences by site.
Figure 5. Daily activity patterns of bobcat.
Figure 6. Daily activity overlap of bobcat with brush rabbit and jackrabbit species.
Figure 7. Bobcat RAI by prey occurrences.
Figure 8. Bobcat daily activity overlap with humans in 2014-2015.
Figure 9. Bobcat RAI by prey occurrences.
Figure 10. Bobcat RAI by puma RAI 2014-2015.
1
Abstract
Conservation and land management decisions are often based on an understanding
of the distribution, abundance, and habitat requirements of wildlife. In this study, I
examined the spatial distribution and abundance of the bobcat (Lynx rufus), a mid-sized
predator, at Jasper Ridge Biological Preserve (JRBP) using camera traps. The initial
camera trap survey was conducted from 2006 to 2008. I conducted another survey from
2014 to 2015. The comparison suggests that the relative abundance of bobcats has
decreased substantially from the 2006-2008 survey to the 2014-2015 survey. This may
be due to several factors, including the recent drought, increased human activity and
construction, the incidence of notoedric mange, and increased puma abundance. The
drought could indirectly affect bobcats by altering vegetation and reducing prey
abundance. In both surveys, bobcats and their prey species exhibited crepuscular activity
patterns, and bobcat occurrences did not vary by season. The distribution of bobcats was
not predicted by canopy type or vegetation cover. As expected, bobcat abundance was
positively correlated with prey abundance across both surveys. Human activity was
measured only in the 2014 to 2015 survey and did not affect bobcat distribution, likely
due to the temporal separation between the diurnal activity of humans and the crepuscular
activity of bobcats. Unexpectedly, in the most recent survey, they were most abundant in
locations with relatively high abundance of puma. In addition, bobcats and puma had a
high degree of diel overlap. This could indicate that puma contribute to the decreased
abundance of bobcats by competition or predation. Further research on the impacts of
human activity, the recent drought, notoedric mange, and increased puma abundance are
necessary, as well as continued camera trap monitoring of bobcats.
2
Introduction
Conservation and land management decisions are often based on an understanding
of the distribution, abundance, and habitat requirements of wildlife. In this study, I
examined the spatial distribution and abundance of the bobcat (Lynx rufus), a mid-sized
predator, at Jasper Ridge Biological Preserve (JRBP) using camera traps.
Bobcats have been found to be a relatively abundant predator species at JRBP
(Mendoza et al. 2011). They are widely distributed throughout North America, from
southern Canada to northern Mexico, and thrive in many ecosystem types on a diet of
primarily rabbits and small rodents (Anderson and Lovallo 2003, Boyle and Fendley
1987). Rabbit species at JRBP include brush rabbits (Sylvilagus bachmani) and black-
tailed jackrabbits (Lepus californicus). Bobcats occasionally may prey on quail (Colinus
sp.), other birds, and mesopredators such as gray fox (Urocyon cinereoargenteus),
raccoon (Procyon lotor), skunk (Mephitis sp.), and opossum (Didelphus virginianus), but
not in significant numbers (Tewes et al. 2002). They are considered to be crepuscular,
but this varies greatly (Anderson and Lovallo 2003, Chamberlain et al. 2003). Bobcats’
breeding season begins in February and ends in May, and they raise kittens from June to
September (Chamberlain et al. 2003). Estimates of their home range vary widely, from
less than 5 to more than 30 km2 per individual, and overall male bobcats have larger
ranges than females (Boyle and Fendley 1987, Chamberlain et al. 2003, Donovan 2011,
Fuller et al. 1985, Lawhead 1984, Lovallo and Anderson 1996, Riley et al. 2003, Rucker
et al. 1989, Thomas and Story 1984, Tucker et al. 2008). At JRBP, bobcats have been
observed in chaparral, oak woodland, and grassland (Jasper Ridge Docent Class
Handbook 2009).

3
Overall, there is a lack of literature on bobcat habitat preferences in California.
Most previous studies have focused on areas in the Northeast, Southeast, and Midwest
United States (Boyle and Fendley 1987, Chamberlain et al. 2003, Donovan 2011, Fuller
et al. 1985, Kitchings et al. 1984, Lovallo and Anderson 1996, Rucker et al. 1989, Tucker
et al. 2008). Lawhead (1984) found that in Arizona, female and male bobcats have home
ranges of 4.8 and 9.1 km2, respectively, and they preferred riparian habitat. Kolowski
and Woolf (2002) found that in southern Illinois, bobcats select dense vegetation cover,
especially in the summer, consistent with previous studies (Boyle and Fendley 1987).
Habitat fragmentation has been shown to contribute to higher bobcat mortality rates and
decreased home range sizes in Southern California (Riley et al. 2003). In addition, JRBP
is approximately equal to the female bobcat home range size seen in Arizona (Lawhead
1984) and significantly smaller than most male bobcat ranges. In order to understand
typical bobcat behavior with the onset of land use change, it is essential to examine
bobcat behavior in small landscapes at the urban-wildland interface, such as JRBP.
Mammals play vital roles in ecosystems, but insufficient long-term data have been
presented (Peterson et al. 1998, Roemer et al. 2009). In particular, although little has
been published about bobcat habitat preferences in California, describing their basic
habitat requirements is important for conservation efforts. Change over time is another
key component to understanding ecosystems: the status and population trends of
mammals at JRBP are essential to making informed land management decisions.
At JRBP, a camera trap survey was conducted from March 2006 to July 2008 (R.
Dirzo, E. Mendoza, unpub. data). I conducted a second camera trap survey from
September 2014 to April 2015. In the present thesis, I measured bobcat distribution and

4
calculated relative abundance for both surveys. Bobcats were hypothesized to appear
most in areas with high relative abundance of prey, low human activity, and low relative
abundance of other predators.

5
Materials and Methods
Site characterization
Jasper Ridge Biological Preserve in Woodside, CA is 481 hectares of protected
land specifically used for education and research only. It encompasses grassland,
chaparral, oak woodland, broadleaf evergreen, riparian, redwood, and freshwater
ecosystems typical of Northern California (JRBP website, consulted October 2014). In
recent years, a few changes have occurred on both the local and regional scale. An
unprecedented drought has been happening for over a year throughout California (USGS
2014). In addition, increased human activity such as construction has taken place at
JRBP.
Field methods
A camera trap survey was conducted from March 2006 to July 2008 at 12 stations
evenly spaced in a grid throughout JRBP (see Fig. 1). Each station consisted of 2 posts
(10 meters apart) with a Sure Shot A-1TM film camera connected to a TrailMasterTM
TM15500 active infrared monitoring system. A team of trained field assistants
monitored them continuously. The methods are outlined in Mendoza et al. 2011.
In June and July of 2014, I set up 2 BushnellTM TrophyCam digital motion-
sensing cameras at each of 12 camera stations. Seven of the stations were in the same
location as the 2006-8 survey. Five of the locations were near the previous locations, but
these exact stations from 2006 could not be reached for various reasons including
construction and poison oak overgrowth. In addition, two more locations were added.

6
For both surveys, the camera stations are located in a variety of ecosystem types,
including grasslands, chaparral, broadleaf evergreen forest, oak woodland, riparian
woodland, and redwood forest. If there was substantial vegetation blocking a camera, the
vegetation was cut and scattered nearby.
Fig. 1. Locations of cameras at JRBP from 2006-2008 mammal census.
In addition, the characteristics of the vegetation at each site were measured once
in spring of 2006 and once in spring of 2015. Quadrats were placed in a 10-meter square
around the camera traps. All of the plants in the quadrat with basal diameters greater
than 1 centimeter were identified and their diameter measured. For the remaining plants,
each quadrat was divided into 10 transect lines. At each 1-meter mark along a transect
line, the plants touching that point were identified. Also, the terrain type, e.g. rock,

7
water, or bare, were noted. Percent cover for each site was calculated by dividing the
number of points at which live plants were present (as opposed to substrate, water, or leaf
litter) by the total number of points.
Data collection
In the 2006-8 survey, the camera film rolls were developed by a commercial
vendor, scanned, and stored in a database. The species information for each photo was
entered using Microsoft Access 2000. In this study, I used the data stored in this database
to conduct my analyses.
The Bushnell digital camera photos were stored on SD memory cards. The
species information for each photo was entered using Picasa (see example in Fig. 2). The
metadata for the photos were extracted using EXIFTool.
Fig. 2. Photograph of a bobcat from one of the cameras in March 2015 (edited for clarity).

8
In order to avoid repetition of the same animal, an individual occurrence was
defined as when two consecutive photographs of the same species at the same site were
more than ten minutes apart or as when two photographs of the same species at the same
site were nonconsecutive.
Data analysis
The relative population size of each species at a given site was calculated using
the Relative Abundance Index (RAI). RAI is the total number of occurrences for all days
divided by the total number of trap days and scaled to 100 trap days and has been shown
to be an accurate estimator of population density (O’Brien et al. 2003).
Diel activity patterns were analyzed using the package Overlap in R as outlined
by Ridout and Linkie 2009. This package uses kernel density estimation to quantify the
overlap of the probability density functions of diel activity patterns. The degree of
overlap is given by the overlap estimator ∆!, where 0 is no overlap and 1 is complete
overlap.
Correlations between the relative abundance of bobcats and factors including prey
activity, human activity, activity of other mesocarnivores (coyote and gray fox), puma
activity, and vegetation characteristics were calculated using a generalized linear model.
Data was transformed using either log transformation or the inverse of a square root
transformation to better fit the assumptions of the model.

9
Results
In the 2006-8 survey, black-tailed deer (Odocoileus hemionus) was by far the
most prevalent species detected. Rabbit species were the second most prevalent.
Like the previous survey, in the 2014-15 survey, black-tailed deer was by far the
most prevalent species detected, and rabbit species were the second most prevalent (see
Fig. 4). Though rabbit species overall remained one of the most common, the proportion
of black-tailed jackrabbits relative to brush rabbit species increased. Wild turkeys
(Meleagris gallopavo) have increased in numbers at JRBP since the previous survey
where only 1 was detected. Furthermore, individual photos of wild turkey frequently
included ten to twenty birds. While the relative prevalence of coyote (Canis latrans) has
decreased, the relative prevalence of gray fox has increased. In addition, in the previous
survey no puma (Puma concolor) were detected, but in the 2014-15 survey, puma were
present. Another difference is that humans did not walk through the older camera trap
stations, but they did walk through the recent ones.

10
Fig. 3. Species composition in both surveys. Rodent species do not include squirrels; bird species do not include birds of prey or wild turkeys. Rabbit species do not include black-tailed jackrabbit.
The RAI of bobcat has substantially decreased from the 2006-8 survey to the
2014-15 survey (see Table 1). The coyote RAI also has decreased, while the RAI of
0
10
20
30
40
50
60
percent of total occurrences
Species composition 2006-‐2008
0
10
20
30
40
50
60
percent of total occurrences
Species composition 2014-15

11
black-tailed deer and gray fox increased. The RAI of puma is nearly equal to bobcat in
the recent survey.
Table 1. Range of Relative Abundance Indices in occurrences per site per 100 trap days.
Relative Abundance Indices
Survey 2006-2008 Species Total occurrences Range of RAI bobcat 462 0.78 - 19.13 coyote 119 0 - 5.31 deer 2784 1.62 - 98 gray fox 5 0 - 0.48
Survey 2014-2015
Species Total occurrences Range of RAI bobcat 42 0 - 7.78 coyote 7 0 - 1.65 deer 1199 5.19 - 134.70 gray fox 28 0.33 - 7.43 puma 41 0 - 5.79
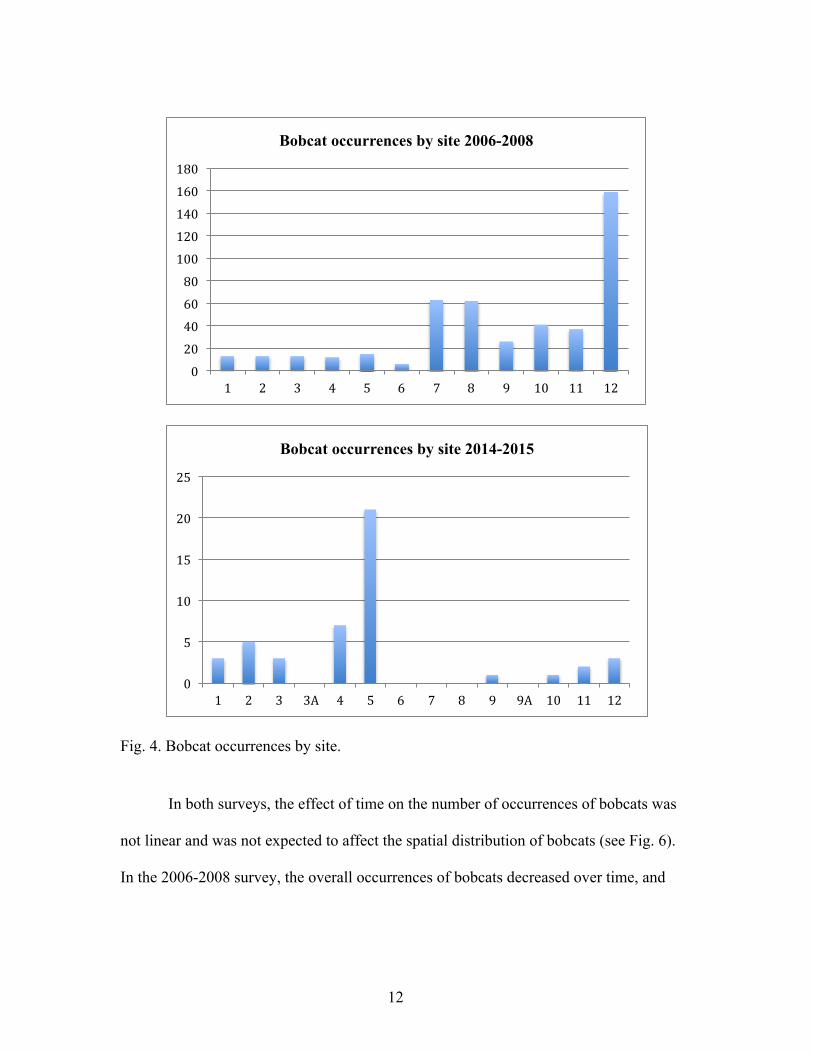
The distribution of bobcat occurrences has changed substantially from the 2006-8
survey to the 2014-15 survey. The highest abundance in the previous survey was at site
12, but in the recent survey at site 5. The overall number of occurrences is not equal at
each site due to the difference in number of trap days.
12
Fig. 4. Bobcat occurrences by site.
In both surveys, the effect of time on the number of occurrences of bobcats was
not linear and was not expected to affect the spatial distribution of bobcats (see Fig. 6).
In the 2006-2008 survey, the overall occurrences of bobcats decreased over time, and
0
20
40
60
80
100
120
140
160
180
1 2 3 4 5 6 7 8 9 10 11 12
Bobcat occurrences by site 2006-2008
0
5
10
15
20
25
1 2 3 3A 4 5 6 7 8 9 9A 10 11 12
Bobcat occurrences by site 2014-2015

13
lacked a consistent seasonal pattern from year to year. In the recent survey, bobcat
activity peaked in February 2015.
Fig. 5. Number of occurrences of bobcats over time. The 2006-2008 survey begins in March 2006 and ends in Jun 2008. The 2014-2015 survey begins in September 2014 and ends in April 2015.
0 5 10 15 20 25 30 35 40 45
Mar
Apr
May
Jun Jul
Aug
Sep
Oct
Nov
Dec
Jan
Feb
Mar
Apr
May
Jun Jul
Aug
Sep
Oct
Nov
Dec
Jan
Feb
Mar
Apr
May
Jun
number of obobcat occurrences
month
Bobcat occurrences over time 2006-2008
0
2
4
6
8
10
12
Sep Oct Nov Dec Jan Feb Mar Apr
number of bobcat occurrences
month
Bobcat occurrences over time 2014-2015

14
The daily activity patterns of bobcat at JRBP are crepuscular in nature and very
similar across both surveys (see Fig. 7).
Bobcat daily activity pattern
Survey 2006-8 Survey 2014-15
Fig. 6. Daily activity patterns of bobcat.
Bobcats show a large degree of overlap with their primary prey species, which
include rabbits and rodents (not including squirrels) (see Fig. 8). They also share some
degree of daily activity with pumas and to a lesser degree with coyotes (see Table 2). In
2014-15 survey in which humans were present, bobcats had a low degree of overlap with
humans in their daily activity patterns (see Fig. 9).
Table 2. Estimation of degree of overlap with bobcat. 0 is no overlap, 1 is complete overlap.
Daily overlap with bobcat Survey 2006-2008
Species ∆! Rabbit 0.869 Jackrabbit 0.685 Squirrel 0.349 Rodent 0.570 Coyote 0.878 Gray Fox 0.618

15
Survey 2014-2015 Species ∆! Rabbit 0.731 Jackrabbit 0.763 Squirrel 0.310 Rodent 0.690 Puma 0.836 Coyote 0.683 Gray Fox 0.786 Human 0.325
Bobcat overlap with rabbit and jackrabbit species Survey 2006-2008
Survey 2014-2015
Fig. 7. Daily activity overlap of bobcat with brush rabbit and jackrabbit species.

16
Fig. 8. Bobcat daily activity overlap with humans in 2014-2015.
In the 2006-2008 survey, the relative abundance of bobcat was not significantly
correlated with the occurrences of other mesocarnivores (including coyote and gray fox)
(t = -0.401, p = 0.700). There was no significant correlation between bobcat RAI and
canopy type (t = -0.987, p = 0.357) or bobcat RAI and percent cover (t = 0.129, p =
0.901). There was a significant correlation between bobcat RAI and prey occurrences (t
= 3.304, p = 0.013) (see Fig. 10).
In the 2014-2015 survey, two additional factors that were not present in the 2006-
2008 survey, relative abundance of puma and occurrences of humans, were tested. Like
the previous survey, bobcat RAI was not significantly correlated with the occurrences of
other mesocarnivores (t = 0.048, p = 0.963). There was no significant correlation
between bobcat RAI and canopy type (t = -1.389, p = 0.207) or bobcat RAI and percent
cover (t = 2.135, p = 0.070). In addition, occurrences of humans did not significantly
affect bobcat abundance (t = 1.062, p = 0.323). Similar to the previous survey, bobcat
RAI was significantly correlated with prey activity (t = 2.554, p = 0.038) (see Fig. 10).
Finally, puma RAI was significantly correlated with bobcat RAI (t = 3.896, p = 0.006)
(Fig. 11).

17
Survey 2006-2008 Survey 2014-2015
Fig. 9. Bobcat RAI by prey occurrences.
Fig 10. Bobcat RAI by puma RAI 2014-2015.

18
Discussion
The RAI of bobcats at Jasper Ridge Biological Preserve in the recent survey was
substantially lower than the RAI of bobcats in the 2006-2008 survey. Several factors
could have contributed to this result. California has been undergoing a severe drought
(USGS 2014). Bobcats have been shown to decline indirectly due to drought because
prey populations are reduced (Tewes and Hornocker 2008). However, prey abundance
has not substantially changed across the two surveys. It is unlikely that bobcats are
directly affected by changes in vegetation, as they do not vary significantly across
vegetation types and have been shown in other studies to have highly variable
preferences in habitat type depending on geographic region. In addition, notoedric
mange, a parasitic disease, is on the rise in California due to anticoagulant rodenticide use
in suburban areas (Riley et al. 2007). A few bobcats with mange have been sighted at
JRBP in the past (JRBP staff observations).
Recently, there have been slightly increased construction and human activity at
JRBP. However, bobcat relative abundance was not significantly affected by human
activity. The diel overlap between bobcats and humans is low, so human presence may
not deter them because they are unlikely to be in the same location at the same time of
day. Consistent with previous literature, bobcats exhibit crepuscular activity patterns,
and humans are active only during daylight hours.
In the 2014-2015 survey, bobcat RAI showed a significant positive correlation
with puma RAI, in contrast to the expected outcome. Also, bobcats and pumas have a
relatively high degree of diel overlap. This indicates that bobcats and pumas overlap
both spatially and temporally at JRBP. Puma-bobcat interactions are not well studied,
19
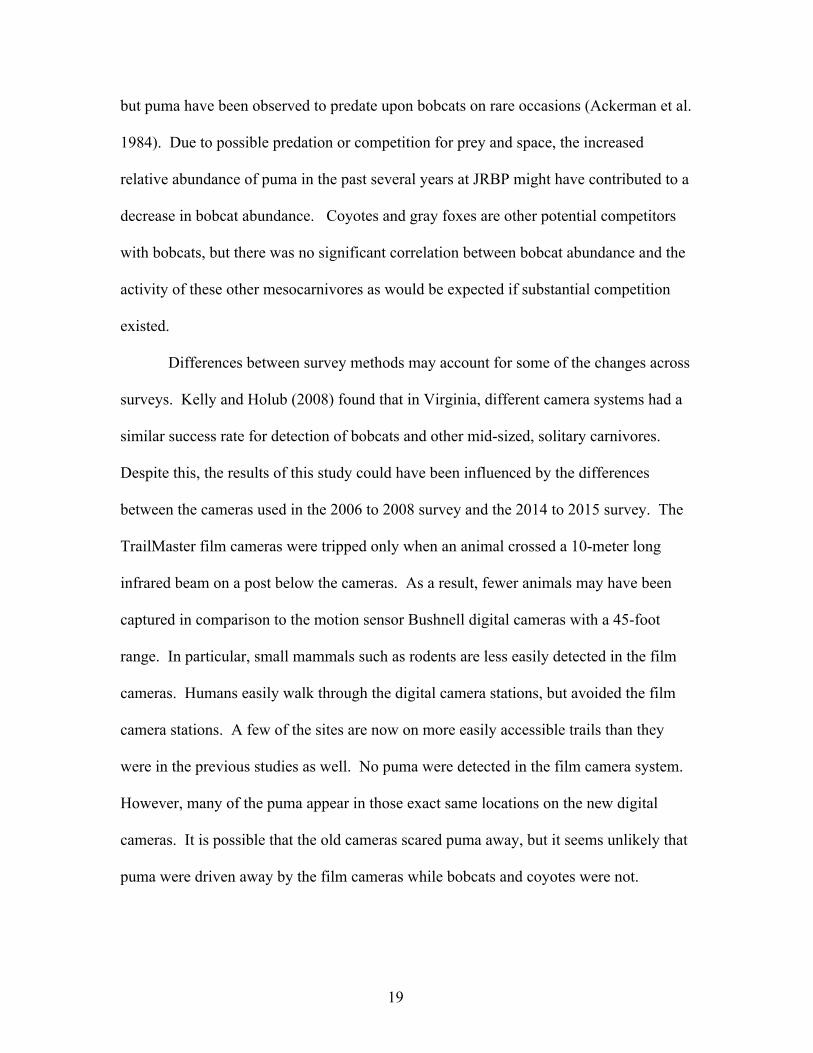
but puma have been observed to predate upon bobcats on rare occasions (Ackerman et al.
1984). Due to possible predation or competition for prey and space, the increased
relative abundance of puma in the past several years at JRBP might have contributed to a
decrease in bobcat abundance. Coyotes and gray foxes are other potential competitors
with bobcats, but there was no significant correlation between bobcat abundance and the
activity of these other mesocarnivores as would be expected if substantial competition
existed.
Differences between survey methods may account for some of the changes across
surveys. Kelly and Holub (2008) found that in Virginia, different camera systems had a
similar success rate for detection of bobcats and other mid-sized, solitary carnivores.
Despite this, the results of this study could have been influenced by the differences
between the cameras used in the 2006 to 2008 survey and the 2014 to 2015 survey. The
TrailMaster film cameras were tripped only when an animal crossed a 10-meter long
infrared beam on a post below the cameras. As a result, fewer animals may have been
captured in comparison to the motion sensor Bushnell digital cameras with a 45-foot
range. In particular, small mammals such as rodents are less easily detected in the film
cameras. Humans easily walk through the digital camera stations, but avoided the film
camera stations. A few of the sites are now on more easily accessible trails than they
were in the previous studies as well. No puma were detected in the film camera system.
However, many of the puma appear in those exact same locations on the new digital
cameras. It is possible that the old cameras scared puma away, but it seems unlikely that
puma were driven away by the film cameras while bobcats and coyotes were not.
20
Although it is likely that there were undetected pumas at JRBP in 2006, the more recent
survey showed a marked increase in their abundance.
I hypothesize that a combination of notoedric mange and the increased presence
of puma are the most likely reasons for the decline in bobcat abundance at JRBP. Further
research on all the potential factors that contribute to changes in the abundance of bobcats
as well as other mammals in the community is needed. The impact of human disturbance
at JRBP has not been evaluated. I recommend research on the influence of the drought
on vegetation and small, herbivorous mammal species, as well as puma-bobcat
interactions. Finally, monitoring of bobcats and other mammals using camera traps
should continue.

21
References Ackerman, B. B., Lindzey, F. G. & Hemker, T. P. Cougar Food Habits in Southern Utah. The Journal of Wildlife Management 48, 147–155 (1984). Anderson, E.M. and Lovallo, M.J. “Bobcat and Lynx.” In Wild Mammals of North America: Biology, Management, and Conservation 2nd edition, edited by Feldhamber, G.A., Thompson, B.C., and Chapman, J.A., 758-788. Baltimore: Johns Hopkins University Press, 2003. Boyle, Katherine A., and T. T Fendley. Habitat Suitability Index Models: Bobcat. Washington, DC: U.S. Dept. of the Interior, Fish and Wildlife Service, Research and Development, 1987. Chamberlain, Michael J., Bruce D. Leopold, and L. Mike Conner. 2003. “Space Use, Movements and Habitat Selection of Adult Bobcats (Lynx Rufus) in Central Mississippi.” The American Midland Naturalist 149 (2): 395–405. Dirzo R, Mendoza E, Cachú Y, Gomez W. 2009. Status of large and medium-sized mammals at JRBP, in Jasper Ridge Biological Preserve State of the Preserve Assessment, Chiariello N (ed). Jasper Ridge Biological Preserve, Stanford University. Donovan, Therese M., Mark Freeman, Hanem Abouelezz, Kimberly Royar, Alan Howard, and Ruth Mickey. 2011. “Quantifying Home Range Habitat Requirements for Bobcats (Lynx Rufus) in Vermont, USA.” Biological Conservation 144 (12): 2799–2809. Fuller, Todd K., William E. Berg, and David W. Kuehn. 1985. “Bobcat Home Range Size and Daytime Cover-Type Use in Northcentral Minnesota.” Journal of Mammalogy 66 (3): 568–71. “Jasper Ridge Biological Preserve Bio 105 A/B Docent Training Class Handbook, 13th Edition.” 2009. Jasper Ridge Biological Preserve of Stanford University. Jasper Ridge Biological Preserve of Stanford University. 2014. “Overview of Jasper Ridge Biological Preserve.” Jasper Ridge Biological Preserve. Accessed October 3. http://jrbp.stanford.edu/overview.php. Kelly, M. J. & Holub, E. L. Camera Trapping of Carnivores: Trap Success Among Camera Types and Across Species, and Habitat Selection by Species, on Salt Pond Mountain, Giles County, Virginia. Northeastern Naturalist 15, 249–262 (2008).
22
Kitchings, J. Thomas, and Jay D. Story. 1984. “Movements and Dispersal of Bobcats in East Tennessee.” The Journal of Wildlife Management 48 (3): 957–61. Kolowski, Joseph M., and Alan Woolf. 2002. “Microhabitat Use by Bobcats in Southern Illinois.” The Journal of Wildlife Management 66 (3): 822–32. Lawhead, David N. 1984. “Bobcat Lynx Rufus Home Range, Density and Habitat Preference in South-Central Arizona.” The Southwestern Naturalist 29 (1): 105–13. Lovallo, Matthew J., and Eric M. Anderson. 1996. “Bobcat (Lynx Rufus) Home Range Size and Habitat Use in Northwest Wisconsin.” American Midland Naturalist 135 (2): 241–52. Mendoza, Eduardo, Pierre R. Martineau, Elliott Brenner, and Rodolfo Dirzo. 2011. “A Novel Method to Improve Individual Animal Identification Based on Camera-Trapping Data.” The Journal of Wildlife Management 75 (4): 973–79. O’Brien, T. G., Kinnaird, M. F. & Wibisono, H. T. Crouching tigers, hidden prey: Sumatran tiger and prey populations in a tropical forest landscape. Animal Conservation 6, 131–139 (2003). Peterson, Garry, Craig R. Allen, and C. S. Holling. 1998. “Ecological Resilience, Biodiversity, and Scale.” Ecosystems 1 (1): 6–18. doi:10.1007/s100219900002. Ridout, M. S. & Linkie, M. Estimating overlap of daily activity patterns from camera trap data. JABES 14, 322–337 (2009). Riley, Seth P. D., Raymond M. Sauvajot, Todd K. Fuller, Eric C. York, Denise A. Kamradt, Cassity Bromley, and Robert K. Wayne. 2003. “Effects of Urbanization and Habitat Fragmentation on Bobcats and Coyotes in Southern California.” Conservation Biology 17 (2): 566–76. Riley, S. P. D. et al. Anticoagulant Exposure and Notoedric Mange in Bobcats and Mountain Lions in Urban Southern California. Journal of Wildlife Management 71, 1874–1884 (2007). Roemer, Gary W., Matthew E. Gompper, and Blaire Van Valkenburgh. 2009. “The Ecological Role of the Mammalian Mesocarnivore.” BioScience 59 (2): 165–73. doi:10.1525/bio.2009.59.2.9.
23
Rucker, Richard A., Michael L. Kennedy, Gary A. Heidt, and Michael J. Harvey. 1989. “Population Density, Movements, and Habitat Use of Bobcats in Arkansas.” The Southwestern Naturalist 34 (1): 101–8. Tewes, M.E., J. M. Mock, and J. H. Young. 2002. Bobcat predation on quail, birds, and mesomammals. Pages 65–70 in S. J. DeMaso, W. P. Kuvlesky, Jr., F. Hernandez, and M. E. Berger, eds. Quail V: Proceedings of the Fifth National Quail Symposium. Texas Parks and Wildlife Department, Austin, TX. Tewes, M.E. and Hornocker, M. G. "Effects of Drought on Bobcats and Ocelots." Wildlife Science: Linking Ecological Theory and Management Applications. Ed. T.E. Fulbright and D.G. Hewitt. Boca Raton: CRC, 2008. Tucker, Stephanie A., William R. Clark, and Todd E. Gosselink. 2008. “Space Use and Habitat Selection by Bobcats in the Fragmented Landscape of South-Central Iowa.” Journal of Wildlife Management 72 (5): 1114–24. U.S. Geological Survey. (2014, June 23). The California Drought. Retrieved October 5, 2014, from http://ca.water.usgs.gov/data/drought/index.html