body and organ fat quantification advances in ct and mri
TRANSCRIPT

1
PRECONFERENCE WORKSHOP
Body and Organ Fat QuantificationAdvances in CT
and MRI Techniques
H. Harry Hu (University of Southern California) – organizer
Mark Punyanitya (Columbia University) – organizer
Bret Goodpaster (University of Pittsburg)
Steven Heymsfield (Pennington Biomedical Research Center)
Wei Shen (Columbia University)
Fat Quantification via Imaging
Punyanitya, ShenGoodpaster, Hu
DATA ACQUISITION & IMAGING METHODS
CT, MRI
DATA PROCESSING & IMAGE SEGMENTATION
Theoretical Concepts & Practical Implementation
ROLE OF IMAGING in OBESITY Heymsfield

2
Course Objectives• DESCRIBE
– … principles that underpin CT and MRI fat quantification techniques– … basis of signal contrast between lean and fat tissues / organs
• EMPHASIZE– … tradeoffs between techniques– … the most appropriate methodology for fat quantification of
• Subcutaneous adipose tissue• Visceral adipose tissue• Skeletal muscle fat• Organ fat (liver, pancreas, heart)
• HIGHLIGHT– … post-processing procedures for image segmentation and fat quantification– … advantages and disadvantages of manual and automated segmentation– … the importance of quality control, accuracy, and repeatability
Course Timeline
• 110-140pm (Steven Heymsfield)Importance of 3D Imaging in Obesity Research
IMAGING METHODS• 140-210pm (Bret Goodpaster)
X-ray Computed Tomography
• 210-240pm (H. Harry Hu)Magnetic Resonance Imaging
IMAGE SEGMENTATION• 240pm – 310pm (Mark Punyanitya)
Principles and Methodology
• 310pm – 340pm (Wei Shen)Practical Implementation
• 340pm - 400pm Q/A

3
Magnetic Resonance Imaging of FatPrinciples, Methodology, Utility, and Challenges
Houchun Harry Hu
Radiology & Electrical Engineering
Children’s Hospital of Los Angeles
University of Southern California
Slide / Content Contributors
International Society for Magnetic Resonance in Medicine
http://www.ismrm.org/
• Huanzhou Yu – GE Healthcare
• Shahid Hussain – U of Nebraska, Omaha
• Peter Kellman – NIH
• E. Brian Welch – Vanderbilt University
• Charles McKenzie – University of Western Ontario
• Dimitrios Karampinos – UC San Francisco
• Peter Börnert – Philips Healthcare
• Thomas Perkins – Philips Healthcare
• Lidia Szczepaniak – Cedar Sinai Medical Center
• Gavin Hamilton – UC San Diego
• Mark Bydder – UC San Diego
• Scott Reeder – U of Wisconsin Madison
• Walter Block – U of Wisconsin Madison
• Fritz Schick – University of Tubingen
• Jürgen Machann – University of Tubingen
• Joel Kullberg – Uppsala University
• Russell Low – Sharp’s and Children’s MRI Center

4
• MRI Basics - Principles– Signal origins
– Tissue signal contrasts
– Spectroscopy vs. imaging
– Chemical shift
– Confounding factors
• MRI of Fat (and Water) - Methodology– T1 weighting
– Selective excitation / suppression
– Spectroscopy
– Chemical shift imaging
– Lots of examples
Outline
• MRI Basics - Principles– Signal origins
– Tissue signal contrasts
– Spectroscopy vs. imaging
– Chemical shift
– Confounding factors
Outline

5
1H
spin population,net magnetization = 0
most common MRI nuclei1H, 13C, 23Na, 31P
“a spin”with magnetic dipole
M in MRI ‐‐‐Magnetization
+ ‐
Mlongitudinal
precession
BO
M in MRI ‐‐‐Magnetization
alignment of spins,net magnetization ≠ 0
BOMlongitudinal
MO
~ Proton Density
z
1.5 Tesla, ~64 MHz
3 Tesla, ~128 MHz
Resonant (Larmor) Frequency
Greater BO, more magnetization BIGGER SIGNAL

6
Mlongitudinal rotated into the transverse plane to induce detectable signal in receivers
R in MRI ‐‐‐ Resonance
Mlongitudinal
transverse plane
Mtransverse
receiver coil wire loops
signal
z
x
y
α
α ‐‐‐ flip angle
{MO, T1, T2} are TISSUE SPECIFIC
and BO DEPENDENT;
SIGNAL EVOLVES WITH TIME.
α
transverse plane
MO
0
MO
Proton Density
R in MRI ‐‐‐ Relaxometry
decay
recovery
00

7
{TR, TE, flip angle}, {MO, T1, T2} tissue and image contrast
I in MRI ‐‐‐ Imaging
1H1H
RF receptionTissue releases energy via relaxationTissues behave differently ~ (T1, T2)
RF excitationTransmit energy into tissues
RFtime
signal
Pulse Sequence RF excitation RF reception
“an echo”
intrinsicoperator controlled
GMWMGMWM
30° 20° 10° 4°
T1 weightedShort TR, TE
Proton (MO)‐weightedLong TR, short TE
Light T2Long TR, mid TE
Heavy T2Long TR, TE
Tissue Contrast

8
TR Affects T1, TE Affects T2
Squares – white matterCircles – gray matterDiamonds – cerebrospinal fluid
• MRI signal intrinsically depends on (exponentially):
– Tissue MO (proton density), T1 (recovery rate), T2 (decay rate)
• Operator controls signal contrast by adjusting:
– TR, TE, flip angle (pulse sequence)
• MRI detects protons in free (unbound) water and lipids
• Bound water (macromolecules) and solids not detected (very short T2s)
Recap ‐ The MRI Signal
Generally, the nominal value has NO physical meaningDigitized number System dependentARBITRARY, no physical units
Relative tissue‐tissue signal contrast (brighter, darker)

9
Inverse Fourier Transform
image‐space
Complex DataMagnitude and Phase
Digitized DICOM
Magnitude onlyData compressed
PULSE SEQUENCETR, TE, voxel size, partial volume
k‐space trajectory
NOISE!!!!
k‐space
PHYSICS
SYSTEMmagnet field and gradient
imperfections, coil sensitivity, RF penetration … PHYSIOLOGY
tissue perfusion, blood oxygenation, …
OBJECT PARAMETERSproton densityT1, T2, velocity, area, diffusion, …
MODEL
Digitized DICOM
Magnitude onlyData compressed
The Complexity of MRI Signal & Quantification
How is Fat Quantified by MRI?
• Subcutaneous and Visceral Adipose Tissue
– Area, Volume
– Identify the adipose tissue (fat) voxels … sum up
– Does not explicitly depend on nominal value of fat signal
– Visual identification
– Convert to mass (DXA, chemical assay)
• Organs, Muscles
– Fat‐Signal Fraction = {F / (W+F)} x 100%
– Measure separately the fat (F) and water (W) signals (MO, T1, T2)
– Metric explicitly depend on nominal value of F and W signals
– Not volume fraction or mass fraction
– Proton‐density fat fraction
10
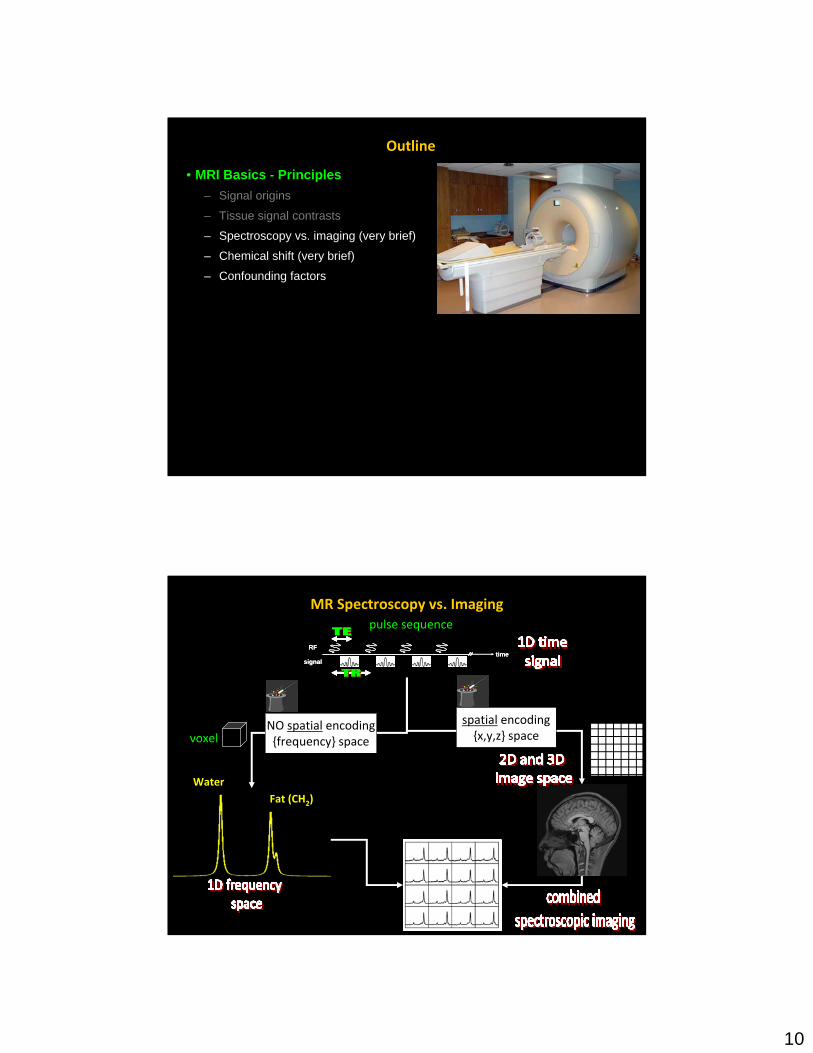
• MRI Basics - Principles– Signal origins
– Tissue signal contrasts
– Spectroscopy vs. imaging (very brief)
– Chemical shift (very brief)
– Confounding factors
Outline
MR Spectroscopy vs. Imaging
RFtime
signal
RFtime
signal
pulse sequence
spatial encoding{x,y,z} space
Fat (CH2)Water
NO spatial encoding{frequency} spacevoxel

11
Δf ~‐ 210 Hz at 1.5T‐ 420 Hz at 3.0T
Methylene (CH2) 1H in fat precesses SLOWER
To the receiver,
it appears to LAG
Chemical Shift H HO
Fat‐Water chemical shift is only ~102 Hz …
resonant frequency is 64 (1.5T) or 128 MHz
frequency
Fat (CH2)Water
“0” Hz
ON‐resonance
Signal receivers tuned to WATER proton
Larmor frequency
Δf
chemically shifted OFF‐resonance
Confounding Factor #1 –Magnet Inhomogeneity• Deviations in the magnetic field BO …
• (BO±δ)
– Imperfect magnet / hardware
– Air / tissue susceptibility
– Placing an object within the magnet
– … mismatch in true vs. assumed (modeled)
resonant frequencies
frequency“0” Hz Δf−δ −δ + Δf
Fat (CH2)Water
Fat (CH2)Water
Fat (CH2)Water
Fat (CH2)Water
Fat (CH2)Water
Fat (CH2)Water
Fat (CH2)Water
Fat (CH2)Water
Fat (CH2)Water
δ + Δfδ
Chemical‐shift is preserved!
250 Hz
‐250 Hz
500 Hz
‐500 Hz
L
K
field maps

12
Confounding Factor #2 –Single vs. Multi‐Peak Fat Model
Courtesy of Dr. G. Hamilton (UC San Diego)
For now, assume SINGLE
peak signal model.
Accounts for only 60‐70%
of the total fat signal.
Quantitative accuracy
requires MULTI peaks.
• MRI Basics - Principles– Signal origins
– Tissue signal contrasts
– Spectroscopy vs. imaging
– Chemical shift
– Confounding factors
• MRI of Fat (and Water) - Methodology– T1 weighting
– Selective excitation / suppression
– Spectroscopy
– Chemical shift imaging
Outline
MECHANISMS of
FAT vs. WATER (lean) TISSUE CONTRAST

13
Fat has shortest natural T1 in vivo, fast recovery.
MRI of Fat by T1‐WEIGHTING
On T1w, FAT IS
BRIGHTEST!
signal contrast
Whole Body T1‐weighted MRI (circa 2005)
Courtesy of Dr. J. Machann (Univ. Hospital Tubingen), J Magn Reson Imaging 2005:21:455-462.
LE UET
I II III IV V VI VII VIII
II IV VI VIIIII IV VI VIII
I III VIIVI III V VII
LE UET
I II III IV V VI VII VIII
II IV VI VIIIII IV VI VIII
I III VIIVI III V VII

14
Machann J et al., J Magn Reson Imaging
2005:21:455-462.
segmentation covered by next two speakers
• Principle
– Fat is brighter than other tissue due to shorter T1
• Advantages
– Fast and available on all MRI scanners
– Adipose tissue depots easily visualized
• Drawbacks
– Each voxel is either “all fat” or “no fat”
– Not suitable for organ fat quantification (e.g. fat fraction)
– Other structures can also be bright (e.g. blood, bowel content)
MRI of Fat by T1‐Weighting
THE TRADITIONAL WORKHORSE PULSE SEQUENCE FOR
SUBCUTANEOUS AND VISCERAL ADIPOSE TISSUE QUANTIFICATION;
MANY PUBLICATIONS;
LIKELY THE MOST COMMON MRI PROCEDURE IN TOS COMMUNITY

15
MRI of Fat by T1‐Weighting – Confounding Bright Signals
blood
T1
chemical shift Imaging(coming up)
bowel content
T1
chemical shift imaging
Courtesy of Dr. C. McKenzie
(U Western Ontario)
Alabousi et al., J Magn Reson
Imaging 2011:34:474-479.
Less VAT
Misclassification
SAT and VAT volumes
SINGLE fat peak model
2D and 3D
chemical shift
water or fat signal acquired
Frequency Selective Excitation /
Suppression MRI
SAT and VAT volumes
% fat‐signal fraction(fat:water ratio)
SINGLE and MULTIfat peak models
2D and 3D
chemical shift
water and fat signals are acquired
Chemical Shift MRI
% fat‐signal fraction(fat:water ratio)
MULTIfat peak model
single voxel
chemical shift
water and fat signals are acquired
Single‐VoxelMR Spectroscopy
SAT and VAT volumes
SINGLE fat peak model
2D and 3D
T1 relaxationsignal intensity
water and fat signals are acquired
T1‐weighted MRI
QuantitativeEndpoints
TypicalDimensionality
Basis of Water‐Fat Differentiation

16
MRI of Fat by T2‐Weighting ?
T1‐weighted T2‐weighted
T2 weighted fat quantification not used.
• MRI Basics - Principles– Signal origins
– Tissue signal contrasts
– Spectroscopy vs. imaging
– Chemical shift
– Confounding factors
• MRI of Fat (and Water) - Methodology– T1 weighting
– Selective excitation / suppression
– Spectroscopy
– Chemical shift imaging
Outline
MECHANISMS of
FAT vs. WATER (lean) TISSUE CONTRAST

17
Selective Water‐Fat Excitation / Suppression• Motivation
– Fat is bright on T1 and T2 weighted images.
– In clinical radiology, fat obscures pathology / confounds diagnosis
• Solution
– Develop pulse sequences to …
… suppress fat / excite water “fat sat” … mainly water signal remain
… suppress water / excite fat “water sat” … mainly fat signal remain
Water
Saturation RF pulsecentered on WATERresonant frequency
Fat (CH2) Water Fat (CH2)
Saturation RF pulsecentered on FAT
resonant frequency
Good for clinical workflow. Good for fat quantification.
Fat Sat
Water Sat
Selective Water‐Fat Excitation / Suppression
Machann J et al., Annual Reports on NMR Spectroscopy 2003:50:1-74.
Fat Sat
Water Sat
residual fat Signal
(why?)
no residualwater signal

18
Selective Water‐Fat Excitation / Suppression
water sat
☺
Looks similar to a T1 weighted image.
Fat is bright, muscle is dark.
T2‐weighted T2‐weighted fat sat
Water Fat (CH2)
Selective Water SuppressionWhy Does it Fail?Magnet Inhomogeneity (Revisited 1)
water sat
☺
BO inhomogeneity worsens with
higher field strengths.
SPATIALLY VARYING!
spectrum is shifted …

19
water sat
Peng Q et al., J Magn Reson Imaging
2005:21:263-271.
T1‐weighted
T1‐weighted water sat spectroscopy
W
F(CH2)
Machann J et al., Magn Reson Med2006:55:913-917.
• Principle
– Chemical shift; resonance frequency difference
– RF pulse is tuned to selectively excite/suppress one or the other
• Advantage
– Available on all MRI scanners
– Adipose tissue / lean tissue / organs easily separated
– Can detect fat presence in organs
• Drawbacks
– Can fail if there is large BO inhomogeneity
– Each voxel is still either “all fat” or “no fat” (SAT and VAT volumes)
– Not suitable for organ fat quantification
Selective Water‐Fat Excitation / Suppression

20
Fat Sat
Water Sat
Selective Water‐Fat Excitation / Suppression
Machann J et al., Annual Reports on NMR Spectroscopy 2003:50:1-74.
Fat Sat
Water Sat
residual fat signal
no residualwater signal
‐HC=CH‐
SAT and VAT volumes
SINGLE fat peak model
2D and 3D
chemical shift
water or fat signal acquired
Frequency Selective Excitation /
Suppression MRI
SAT and VAT volumes
% fat‐signal fraction(fat:water ratio)
SINGLE and MULTIfat peak models
2D and 3D
chemical shift
water and fat signals are acquired
Chemical Shift MRI
% fat‐signal fraction(fat:water ratio)
MULTIfat peak model
single voxel
chemical shift
water and fat signals are acquired
Single‐VoxelMR Spectroscopy
SAT and VAT volumes
SINGLE fat peak model
2D and 3D
T1 relaxationsignal intensity
water and fat signals are acquired
T1‐weighted MRI
QuantitativeEndpoints
TypicalDimensionality
Basis of Water‐Fat Differentiation

21
• MRI Basics - Principles– Signal origins
– Tissue signal contrasts
– Spectroscopy vs. imaging
– Chemical shift
– Confounding factors
• MRI of Fat (and Water) - Methodology– T1 weighting
– Selective excitation / suppression
– Spectroscopy
– Chemical shift imaging
Outline
MECHANISMS of
FAT vs. WATER (lean) TISSUE CONTRAST
Single‐Voxel MR Spectroscopy (MRS)
Machann J et al., Annual Reports on NMR Spectroscopy 2003:50:1-74.
Qayyum A. Radiographics 2009:29:1653-1664.
water peak
fat (CH2)
fatpeaks

22
• Principle
– Chemical shift
• Advantages
– Very high spectral frequency resolution
– Can detect very low amounts of fat
– Can detect ‐HC=CH‐ (unsaturation)
• Drawbacks
– Not always available on all MRI systems
– Usually single voxel
– Highly operator dependent; motion sensitive
– Post‐processing burden
MRS HAS BEEN THE GOLD‐STANDARD FOR FAT QUANTIFICATION IN
ORGANS (liver, pancreas, heart) and SKELETAL MUSCLES.
Single‐Voxel MR Spectroscopy (MRS)
area under fat peaksfat fraction (%) 100%
(area under fat + water peaks)= ×∑
∑
Magnet Inhomogeneity (Revisited 2)Line Broadening
water
As peaks get broader, area quantification becomes challenging.
Courtesy of Dr. F. Schick (Univ. Hospital Tubingen)

23
MRS at higher BO field strengths benefit from greater chemical shift and sharper peaks.
Ren, et al. J Lipid Research 2008:49:2055-2062.
Courtesy of Dr. G. Hamilton (UC San Diego)
T2 decay of water signal
T2 decay of fat signal
fat‐signal fraction =
Fat (signal, area)
Fat (signal, area) + Water (signal, area)
Fat {MO, T1, T2}
Fat {MO, T1, T2} Water {MO, T1, T2}
Fat (MO)
Fat (MO) + Water (MO)
Long TR, Short TE ‐> Proton Density Weighted
= proton‐density fat fraction

24
Courtesy of Dr. J. Machann (Univ. Hospital Tubingen), Diabetes, Obesity and Metabolism 2004:6:239-248.
IMCL
droplets
EMCL
striations
MRS of Skeletal Muscle Fat
Lingvay I, et al. J Clin Endocrinol Metab 2009:94:4070-4076.
MRS of the Pancreas

25
Lingvay I, et al. Circulation 2007:116:1170-1175.
Hammer, et al. J Clin Endocrinol Metab, 2008:93:497-503.
Van der Meer, et al. Radiology, 2007:245:251-257.
note the scale
MRS of the Heart
LV
4 chamber view
2 chamber view
Interventricular septum
myocardium
MRS Challenge: Motion
• MRS of abdominal organs (liver, pancreas, heart) typically requires
respiratory gating (bellows) and cardiac gating (ECG).
• Synchronize pulse sequence to natural physiological motion.
• Bulk motion: subject moves between voxel placement and scan start.
fatpeaks
water peak
Are these fat peaks real?

26
SAT and VAT volumes
SINGLE fat peak model
2D and 3D
chemical shift
water or fat signal acquired
Frequency Selective Excitation /
Suppression MRI
SAT and VAT volumes
% fat‐signal fraction(fat:water ratio)
SINGLE and MULTIfat peak models
2D and 3D
chemical shift
water and fat signals are acquired
Chemical Shift MRI
% fat‐signal fraction(fat:water ratio)
MULTIfat peak model
single voxel
chemical shift
water and fat signals are acquired
Single‐VoxelMR Spectroscopy
SAT and VAT volumes
SINGLE fat peak model
2D and 3D
T1 relaxationsignal intensity
water and fat signals are acquired
T1‐weighted MRI
QuantitativeEndpoints
TypicalDimensionality
Basis of Water‐Fat Differentiation
• MRI Basics - Principles– Signal origins
– Tissue signal contrasts
– Spectroscopy vs. imaging
– Chemical shift
– Confounding factors
• MRI of Fat (and Water) - Methodology– T1 weighting
– Selective excitation / suppression
– Spectroscopy (1D chemical shift)
– Chemical shift imaging
(“Dixon”method)
Outline
fat‐separated water‐separated fat fraction (%)

27
“Dixon” Method (2‐point) Fat‐Water MRI
z
x
y
t = 0 - t = 0 + … … …oppose‐phase (OP)= W ‐ F
Fat is precessing slower, accrues phase periodically with respect to water.
{W,F}θ =2π(Δf)(TE)
θ{W,F}
… … …
in‐phase (IP) = W + F
W F
2 ( )( )[ ]n
n
i TE fTES F eW π Δ= + ⋅
IPθ=0°= W + FOP θ=180°= W- F
fat only water only
F W
no difference
difference‐> fatty liver

28
OP = W‐F IP = W+F
Opposed‐Phase In‐Phase
η =F
W + F=
IP − OP( )2 IP
0%
50%
Courtesy of Dr. S. Reeder, U. Wisconsin Madison.
“Dixon” Method (2‐point) Fat‐Water MRI
34 %fat‐signal fraction
e.g. 34% of the liver signal originates from fat
1984 2‐pt. methods
1990 ‐ 19913 and 4‐pt. methods
Mid‐1990s, early‐2000Extensive clinical useSubtle variations
2003 – present6‐pt. methods
“Dixon” Method Evolution
• General Electric
– Lava‐Flex (2 pt.) – commercial, IDEAL (3‐6 pt.) – commercial + research
• Philips
– mDixon (2 pt.) – commercial, (3‐6 pt.) – research
• Siemens
– Dixon (2‐3 pt.) – research
towards method robustness and
fat fraction accuracy
Fat signal modeled with single (CH2) peakIP, OP, magnitude‐base
multi‐peak fat signal modelcomplex‐base
use in liver, heart

29
*2/2 2(( ) )ki t i t Ttf
ka es t W eF e π ψπ −+= ∑
Generalized 6+ pt. Dixon Method
fat chemical shift term
magnet non‐uniformity term
signal relaxation
water fat
measured MRI signal
Σ multiple fat peaks‐CH2‐
‐HC=CH‐‐CH3
complex unknown (2)
complex unknown (2)
real unknown (2)
2 ( )( )[ ]n
n
i TE fTES F eW π Δ= + ⋅
Generalized 6+ pt. Dixon MethodFat
Water *2/2 2(( ) )ki t i t Ttf
ka es t W eF e π ψπ −+= ∑
. . .
Water
Fat
IP = W+F
OP = W‐F
Fat Fraction (%) T2* map (ms)BO Inhomogeneity
Field Map(Hz)
iterativealgorithm
QUANTITATIVE !!!

30
Generalized 6+ pt. Dixon Method ‐ Advantages
Courtesy of Dr. S. Reeder, U. Wisconsin Madison, J Magn Reson Imaging 2011:34:729-749.
Full 0‐100% fat fraction scale
Whole organ assessment
Courtesy of Dr. S. Reeder, U. Wisconsin Madison, J Magn Reson Imaging 2009:29:1332-1339.
Single vs. Multi Peak Fat Model
Generalized 6+ pt. Dixon Method ‐ Advantages

31
Magnet Inhomogeneity (Revisited 3)Water‐Fat Signal Swap
Courtesy of Dr. R. Low Courtesy of S. Sharma
(June 2010‐LEFT, 24.9% in liver), (April 2011‐RIGHT, 3.8% in liver)
Color bar is set from 0 (0%) to 1000 (100%) fat fraction

32
3D “Dixon” Imaging
Courtesy of Dr. P. Kellman, National Institutes of Health, Curr Cardiovasc Imaging Rep 2010:3:83-91.
Myocardial Lipodystrophy
Pericardial Fat
3D “Dixon” Imaging of Heart
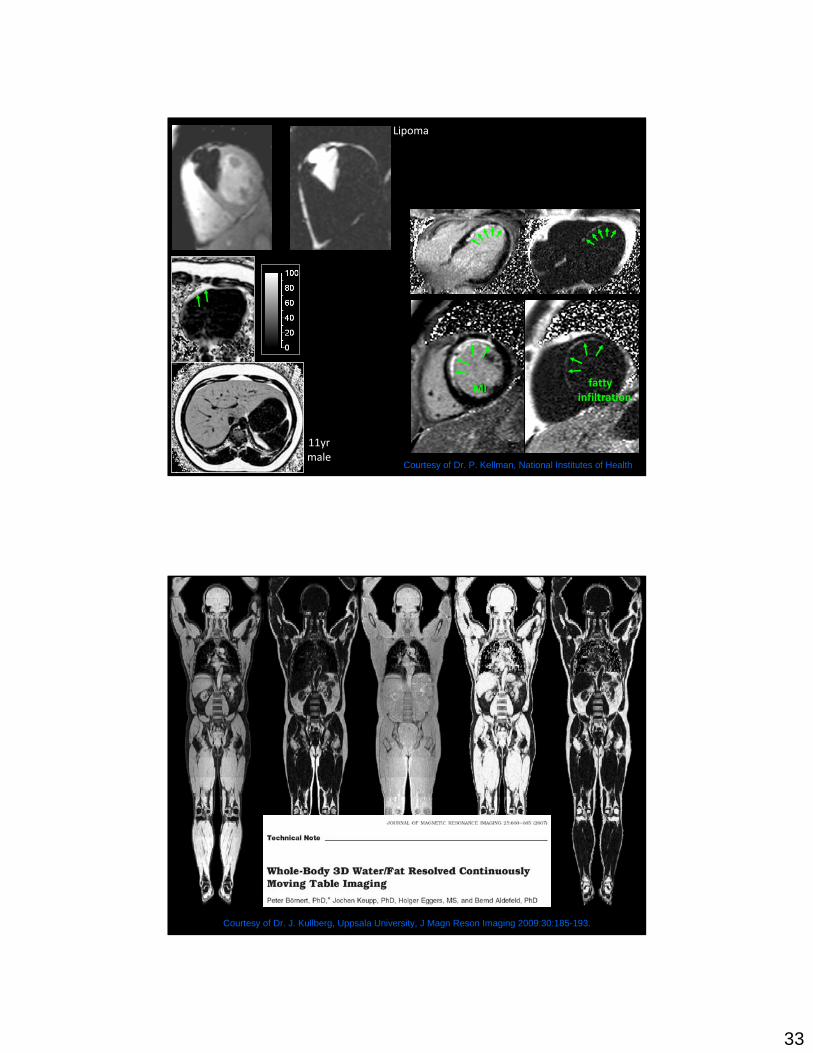
33
fattyinfiltration
MI
Courtesy of Dr. P. Kellman, National Institutes of Health
Lipoma
11yr male
Courtesy of Dr. J. Kullberg, Uppsala University, J Magn Reson Imaging 2009:30:185-193.

34
Comprehensive Fat Quantification with 3D “Dixon” Imaging
Water‐separated Fat‐separated In‐Phase Opposed‐Phase % fat fraction
SAT and VAT volume
Looks similar to heavy T1w or water‐saturated image
organ fat fraction content
numerically meaningful
anatomical guidance
Chemical Shift Imaging
• Principle
– Chemical shift
• Advantages
– Data yields a comprehensive set of images
• Fat‐only, Water‐only
• In‐phase (W+F), Opposed‐phase (W‐F)
• Fat‐Fraction, Water‐Fraction (full 0‐100% range)
– Ability to generate adipose tissue volumes and organ % fat content
• Drawbacks
– Longer scan time
– Not widely available (commercially) … yet

35
SAT and VAT volumes
SINGLE fat peak model
2D and 3D
chemical shift
water or fat signal acquired
Frequency Selective Excitation /
Suppression MRI
SAT and VAT volumes
% fat‐signal fraction(fat:water ratio)
SINGLE and MULTIfat peak models
2D and 3D
chemical shift
water and fat signals are acquired
Chemical Shift MRI
% fat‐signal fraction(fat:water ratio)
MULTIfat peak model
single voxel
chemical shift
water and fat signals are acquired
Single‐VoxelMR Spectroscopy
SAT and VAT volumes
SINGLE fat peak model
2D and 3D
T1 relaxationsignal intensity
water and fat signals are acquired
T1‐weighted MRI
QuantitativeEndpoints
TypicalDimensionality
Basis of Water‐Fat Differentiation

36
Emerging Application – Double Bond Mapping with “Dixon” CSI
Potential to assess different
‘ndb’ in adipose tissue
depots and organs
Courtesy of Dr. M. Bydder, UC San Diego.
Magn Reson Imaging 2011, in press.
‐CH=CH‐
• MRI is very flexible in highlighting fat
– T1 weighting
– Selective excitation / suppression
– Spectroscopy
– Chemical shift imaging
– … new contrast mechanisms are in development
• There are tradeoffs to each method
• Commercial availability
• Scan time (speed)
• Quantitative endpoint (volume, fat fraction)
• Required level of operator expertise / post‐processing burden
Take Home Message
SPATIAL RESOLUTIONpartial volume effects
2D multi-slice or 3D volume
RESPIRATIONbreath-hold
motion artifacts
SCAN TIMEsignal-to-noise ratio
subject comfort
Method?2D or 3D?
TR? TE? Flip angle?Spatial resolution?Slice thickness?

37
Chemical Shift Imaging (is here to stay)
Vol 34:729-749.October 2011
January 2010
http://ismrm.org/workshops/FatWater12/
FACULTY
W. Tom Dixon ‐ GE Healthcare
Gary Glover ‐ Stanford
Shahid Hussain ‐ U Nebraska Omaha
Jeffrey Schwimmer ‐ UC San Diego
Qing‐San Xiang ‐ U British Columbia
Holger Eggers ‐ Philips Healthcare
Walter Block ‐ UW Madison
Catherine Hines ‐Merck
Mark Bydder ‐ UC San Diego
Angel Pineda ‐ CSU Fullerton
Russell Low ‐ Sharp & Children’s MRI
John Wood ‐ Children’s Hospital LA
Richard Bergman ‐ Cedar Sinai
Gavin Hamilton ‐ UC San Diego
Lidia Szczepaniak ‐ Cedar Sinai
Chris Boesch ‐ U of Bern, Switzerland
Fritz Schick ‐ U of Tubingen, Germany
Michael Goran ‐ USC
Jürgen Machann ‐ U of Tubingen, Germany
Rosa Branca ‐ UNC Chapel Hill

38
[email protected]@chla.usc.edu
http://mrel.usc.edu/
Courtesy of Dr. P. Bornert, Philips Healthcare
Magnet strength measured in TESLA. 1 Tesla = 10,000 GAUSS. Earth’s pole fields are only 0.3‐0.6 GAUSS !!!
Tesla Gauss
~90021
~60014
~50011.7
~4009.4
~3007
~2004.7
~1283
~641.5
~431
Frequency (MHz)Tesla
Most common clinical for humanFDA approved
Non FDA approved for clinical humanResearch only
Small Animal
Greater BO, more magnetization BIGGER SIGNAL

39
fat water
Dixon: 22.9%MRS: 23.4%
Dixon: 4.4%MRS: 3.1%
water peak
fat (CH2)
fatpeaks