body composition, resting metabolic rate and dietary ... · 13 the mbsrq evaluates body image based...
TRANSCRIPT

1
Body Composition, Resting Metabolic Rate and Dietary Habits of Lean and Non-lean Female Athletes Sarah Watson, Jackie Buell, PhD, RD/LD, LAT, ATC The Ohio State University, Department of Human Nutrition April 27, 2009 Abstract – Athletes often desire to change body composition to enhance sport performance, and often practice chronic energy restriction to attain this change. This may change their energy needs. The aim of this study was to better understand the resting energy needs of female collegiate athletes by grouping sports into lean and nonlean categories and to evaluate accuracy of REE clinical equations in athletes. Measures of body composition using the BodPod and resting metabolic rate (RMR) using ReeVue indirect calorimetry were taken, and athletes took an online survey which included the EDE-Q, MBSRQ, tendency to diet scale, and physical activity and menstrual screening. Athletes (n=17) from Ohio State University’s varsity women’s swimming, synchronized swimming, soccer and ice hockey teams participated. No relationship was identified when comparing lean and nonlean sport dieting behaviors, RMR, and percent body fat. When all data were evaluated together, RMR correlated inversely with restrictive eating, and an inverse trend existed between RMR and EDE-Shape Concern. When evaluating the validity of traditional REE predictive equations, the differences between measured RMR and the Cunningham equation’s estimate were not statistically different than zero, and the Owen equation correlates most strongly with measured RMR. The study was greatly limited by the number of participants and time constraints; however some significant results and trends were noted. A study with better athlete participation and a larger variety of sports would likely provide stronger data. Introduction
Athletes often desire to change their body composition to help them succeed in sport. Some
sports promote leanness as part of the success factor which in turn likely promotes dieting behaviors.
This study will measure the body composition, resting metabolic rate, and nutritional habits of collegiate
female athletes in lean and non-lean sports. A lean sport is one in which a lean physique is paralleled
with success. Examples of lean sports include gymnastics, synchronized and competitive swimming and
varsity crew. A non-lean sport does not share that affiliation and examples include softball, ice hockey,
soccer and basketball.
A pilot study was completed in January 2006 which measured the body composition and resting
metabolic rate of 18 female athletes from the sports of basketball, softball, golf and lacrosse. The data
demonstrated that traditionally used clinical equations to estimate metabolic rate do not apply well to
about half of the athletes. A similar study with more power designed to also consider the likely dieting
behaviors and pressure to be thin may help tease out the factors that render these equations inaccurate
within athletic groups of women.

2
Measures employed in this current study are common, and include body composition (BodPod),
resting metabolic rate (ReeVue) and select questionnaires. The battery of questionnaires will allow
further insight into the body concern factors that may help us clinically predict which equation will work
best for particular athletes. Measuring the resting metabolic rate and comparing the values with those
calculated with classic estimation equations will help understand their clinical validity and appropriate
applications. It is important to help female athletes understand the influence of dieting behaviors on the
composition and energy needs of their bodies.
Three primary hypotheses of the study include:
1. Women engaged in lean sports are at higher risk than non-lean sportists for engaging in
dieting behaviors.
2. Women engaged in more dieting behaviors, over time, have increased body fatness and
decreased metabolic rates.
3. Traditional equation estimates of metabolic rate will be more accurate for athletes with
increased dieting behaviors due to the suppression of an otherwise high metabolic rate in
athletes.
Literature Review
Females athletes are unique because they encounter additional aesthetic pressures and
challenges during their athletic training regimen that are likely related to dieting behaviors and inadequate
fueling for sport. The female athlete triad is an example of this suppression and consists of three inter-
related disorders: osteoporosis, disordered eating, and lack of menses or amenorrhea. Like many, Birch 1
contends that psychological pressures to maintain a lean body result in excessive training and decreased
energy consumption. The low energy availability would hypothetically put the body in a relative
starvation, which would suppress the resting metabolic rate. There is also evidence that this sort of
energy deprivation may ironically increase the body fatness in athletes 2.
The psychological pressure females feel to excel in their athletics, and to obtain a lean body is
not found equally in all women’s sports. For this reason, sports are sometimes classified as lean or non-
lean.3 Lean sports are those in which weight and appearance directly affect sport success, like
3
gymnastics, synchronized and competitive swimming and varsity crew. These athletes strive for a lean
figure and likely feel a lot of pressure from judges, coaches, and teammates to obtain the “perfect body”.
A non-lean sport, such as basketball, softball, ice hockey or soccer, is a sport where factors like weight
and appearance are less central. The message that thinness is desirable and fundamental for success
may be blatantly conveyed to all athletes or done so inexplicitly and merely implied. Athletes in lean
sports, regardless of size, have been found to be more preoccupied with dieting and weight control. 3
Beals and Hill conducted to measure the correlation between female athlete triad and different
sports in collegiate women. 4 The study probed subjects on the components of the triad, but did not
include resting metabolic rate or body composition. The study demonstrated correlated risks for these
athletes, but was a field study thus excluded body composition.
Preoccupation with dieting and weight control found in lean sport athletes may preface an
insufficient caloric intake. When the calories consumed are equal to the number of calories used, body
weight and functions (like menstrual cycle) are maintained. When expenditure surpasses intake, weight is
usually lost. This idea is the basis for many diets, and here, by athletes wishing to obtain a lean physique.
A study by Deutz provides evidence that athletes with negative energy balance tend to have higher body
fat composition and lower metabolic rates. 2
The third aim of this study examined the clinical accuracy of traditional metabolic rate equations.
Clinically, in the absence of an indirect calorimeter to measure resting energy needs, it is common
practice to use population-based equations to estimate energy needs. Most of these estimation
equations consider factors such as gender, weight, height, age, and activity level as part of the prediction.
The Harris-Benedict, Mifflin St Jeor, Cunningham, and Owens equations are among those typically
studied. 5 The newer versions of the BodPod include an estimation of RMR and total energy needs based
on the Nelson equation. Among the first resting energy need equations was the estimation of raising
body surface area to the three-quarter power. A brief review of each equation follows.
The Harris-Benedict (HB) equation is a popular example of this clinical tool. It is a regression
equation to estimate the RMR with height, weight, age, and gender as the variables of interest. Total
energy needs can then be estimated by applying a factor for relative activity levels to estimate caloric
needs for the patient. One proposed weakness for this equation is that it does not account for body

4
composition (lean mass) in the estimate. Because lean body mass may influence the need for more
calories for weight maintenance. 5 The equation may underestimate the needs of a very lean subject,
such as an athlete. The opposite applies to a patient with a less lean physique. For example, the basal
needs of an obese patient may be over estimated. 6
The Mifflin St. Jeor, MSJ, is another common equation used clinically, and has demonstrated
reliability. 6 This equation has been found most accurate for healthy individuals. The MSJ also relies on
gender, age, weight and height within a regression model to estimate basal energy needs. Despite
exclusion of the body composition of the individual, the MSJ estimation seems to be accurate more often,
including for both obese and non-obese individuals. 7
The Cunningham equation provides yet another way to calculate basal metabolic rate and is
based solely on an intercept and lean body mass (LBM) using the same subject data that derived the HB
equation. 8 Ironically, the HB cohort included 16 male trained athletes and the Cunningham re-evaluation
chose to exclude their data. Beals and Manore utilized the Cunningham equation in endurance trained
athletes and demonstrated more acceptable clinical accuracy when compared with other equations
including HB and MSJ. 9 Conversely, a study by Tverskaya et al on who found the Cunningham to have
a tendency to overestimate resting energy needs.8 The useful advantage of the Cunningham is that only
the LBM variable is included making calculation very easy. Unfortunately, this is only practical when
accurate methods of estimating LBM are applied and this requires prior testing, likely incurring clinical
cost. 8
The Owens equations were developed on healthy women of various ages, activity levels and
body composition. This method uses different equations for women that identify as active or inactive. 10
The only variable in this equation that needs to be measured is weight. This makes the equation easy to
use. A potential disadvantage of the equation is categorizing women as either active or inactive could be
ambiguous and those discrepancies could lead to error.
The BodPod provides the user with an estimate of REE by use of the Nelson et al equation. This
equation was based on the premise that including accurate measures of fat and fat free mass increases
the accuracy of the resting metabolic rate estimation. 11 There is also evidence in the literature that the
very old method of predicting resting metabolic rate raising body surface area to the ¾ power may be a

5
reliable estimate. 12 Neither of these methods have been used recently in the clinical setting, but they
have been included in our comparison analysis for reference.
Questionnaires used to document likely energy restriction, dieting behaviors, and concern for
body shape included the Eating Disorder Examination (EDE-6), Tendency to Diet Scale, and the
Multidimensional Body Self Relations Questionnaire (MBSRQ). The EDE is commonly employed when
the research would like to demonstrate the propensity for disordered eating, and scoring includes sub-
scales for Restriction, Eating Concern, Weight Concern, and Shape Concern using a 6 point scale where
a higher score indicates a higher propensity for restriction or concern. 13 The MBSRQ evaluates body
image based on a 5-point scale ranging from definitely disagree (1) to definitely agree (5). This study
probed two of the scales: the Appearance Orientation (AO), how important and how aware they are of
their bodies, and the Appearance Evaluation (AE), how much they like, strive to attain, and how satisfied
they are with their bodies. (14-15) The Tendency to Diet Scale was first demonstrated and validated in the
RENO heart study and yields a score calculated where higher numbers indicate a higher tendency to diet.
16 Each of these questionnaires are considered valid and reliable tools, and are commonly employed by
the current group of researchers.
Methods
Subjects
The subjects were female collegiate athletes at The Ohio State University, ages 18-22. Lean
sports included swimming, synchronized (n = 4) and competitive (n = 3), and non-lean sports included
women’s ice hockey (n = 7) and soccer (n = 3). Other teams invited included women’s crew and
gymnastics, however due to hesitance from the coaches, these sports did not participate. Also, women’s
basketball and softball were recruited, but none opted to participate. IRB approval was attained prior to
study recruitment and all subjects were required to sign a written consent. Because we were using OSU
varsity athletes, additional approval was sought and obtained from the Sports Medicine Leadership team.
Experimental Protocol

6
All student athlete subjects were recruited through team meetings made possible through
collaboration with coaching and athletic training staffs. The athletes were invited to either Campbell Hall
350A and/or the OSU Labs in Life at COSI, a downtown Columbus science center for testing. This resting
metabolic rate measurement took place first thing in the morning, before the subject had eaten or
performed any exercise. The subjects relaxed in reclining chairs for about twenty minutes before
metabolic measurements were taken. Later that day, or on a second visit, athletes were measured in the
BodPod wearing a bathing suit. Athletes completed the on-line questionnaire at their leisure.
The dieting behaviors and attitudes of female student athletes were estimated using an on-line
survey tool on a SelectSurvey platform. This tool was a compilation of validated surveys to provide insight
into the body image (MBSRQ), dietary restraint (EDE-6 and TDS), level of additional physical activity, and
menstrual status in addition to dieting attitudes and behaviors (TDS). One of the questions in the survey
used 9 silhouette images representing different female physiques to gauge the athlete’s desire to have a
smaller physique. . This was gauged by including Figure 1 (as below) and asking which they looked like
and which they’d most like to resemble. The difference between the two was used in data analysis. 17
Figure 1
.
Resting energy expenditure was estimated with the ReeVue indirect calorimeter. ReeVue
technology involved the subject breathing through a mouthpiece (with nostrils occluded) attached to a
sensor that measured volume and oxygen extraction, or VO2. The machine used the equation of Weir to
estimate Resting Metabolic Rate, or RMR. This predicted the number of calories the body used at rest

7
each day. 18 The measure is considered most accurate when take first thing in the morning before eating,
drinking or exercising. Our protocol included the first morning measure and athletes rested in a reclined
or lying position for 20 minutes before testing to maximize a rested state.
The resting metabolic rate estimation equations calculated and analyzed are presented in Figure
2. 5 Additionally, the study analyzed the accuracy of the Nelson et al equation as put forth by the BodPod
and the body surface area raised to the three-quarter power estimate.
Figure 2
Various Predictive Equations
Harris Benedict men: RMR = 66.47 + 13.75 (wt) +5 (ht) - 6.76 (age)
women: RMR = 655.1 +9.56 (wt) +1.85 (ht) - 4.68 (age)
Mifflin St. Jeor men: RMR = 9.99 (wt) + 6.25 (ht) - 4.92 (age) + 166 (1) -161
women: RMR = 9.99 (wt) + 6.25 (ht) - 4.92 (age) + 166 (0) -161
Cunningham RMR = 550 +22 (LBM)
Owen: active women RMR = 50.4 + 21.2 (wt)
where wt = weight (kg), ht=height (cm), age = age (years), and LBM = lean body
The RMR values estimated using indirect calorimetry were compared to the RMRs estimated
using each of the traditional equations found in Figure 2. Each equation RMR was subtracted from the
measured RMR to transpose a new variable to reflect the amount of error for each equation (measured
minus estimated). The equation RMRs and corresponding errors were examined to determine accuracy
of prediction. This also allowed exploration of the relationship of dieting behaviors to the accuracy of the
equations to see if any of the measured factors could account for the error of the estimation.
Body composition of the athletes was estimated using air displacement plethysmography, or the
BodPod. The BodPod is a non-invasive method of estimating body composition. The participant is seated
in a defined volume system including two chambers, one containing the participant and the second to
quantify the displaced air by measuring pressure changes relying on the relationship of Boyle’s Law,
which centers on the inverse relationship between pressure and volume (P1V2=P2V1). 19 When the subject
is present in the anterior chamber of the Pod, it measures the pressure changes between the chambers
and that change is directly proportional to the amount of air displaced to estimate the body volume. The
subject’s mass is taken on a traditional scale. From body volume and mass, the whole-body density can

8
be estimated. Body fat and lean body mass were calculated within the system using either the Siri
equation on general population or Ortiz equation, used on African American population. 19 The different
equations are based on the difference in skeletal muscle and bone mineral density between the two
demographics. 20 This study included one African American athlete, so both equations were utilized within
the study as appropriate to ethnicity.
Statistical Methods
All subject data was collated and analyzed in SPSS statistical analysis software (version 16) 21 to
evaluate the relationship of dieting behaviors to resting metabolic rate and body fatness in these lean and
non-lean athletes. The body fatness and resting metabolic rates were compared between groups using
the t-test and variables of interest were examined for their ability to predict lean versus nonlean using the
logistic regression. Traditional equations were evaluated for level of error to accomplish a secondary aim
of this study: Equation errors were first examined to see if they were statically different from 0 using a
standard t-test. The errors were examined using bivariate correlation and non-parametric regression
evaluation (Spearman’s) to evaluate dietary and nutritional factors which might influence the utility of
standardized equations designed to estimate resting energy expenditure.
Results
Seventeen subjects have opted to participate in the study and the descriptive statistics are
outlined in Figure 3. Though subject participation was low, the sample is fairly representative of the teams
they represent and we have no reason to believe it is biased. The BodPod was completed on 15 of 17
subjects and one different subject opted out of the questionnaires.
Figure 3: Descriptive Data of all Subjects
Average Max. Min.
Weight (kg) 67.2 84.1 61.3
Height (cm) 168.6 180 158
Age (years) 20.4 21.7 18.6
RMR (kcal) 1615.4 2102 1022
pFat 26.1 29.9 18.8

9
In order to address the hypothesis that women engaged in lean sports are at higher risk than non-
lean sportists for engaging in dieting behaviors, lean versus nonlean sport categories were compared
using independent samples t-test with a variety of scores from the questionnaire: AE, AO, Tendency to
Diet Scale total, and the EDE variables of Restriction, Eating Concern, Weight Concern, and Shape
Concern. The raw data is reports in Figure 4 below.
Figure 4- Questionnaire Results vs. Lean and Nonlean Sport Categories
N Mean Std. Deviation Std. Error Mean
AE Lean 7 24.71 6.751 2.552
nonlean 9 24.33 3.500 1.167
AO Lean 7 36.86 9.137 3.453
nonlean 9 41.11 9.333 3.111
TDStotal Lean 7 40.14 6.283 2.375
nonlean 9 40.78 4.324 1.441
RestrictEDE Lean 7 1.771 1.4716 .5562
nonlean 9 1.644 1.2156 .4052
EatingEDE Lean 7 1.257 1.1759 .4445
nonlean 9 .867 1.0050 .3350
ShapeEDE Lean 7 2.60714 1.703900 .644014
nonlean 9 2.19444 1.443075 .481025
WeightEDE Lean 7 2.2143 1.70434 .64418
nonlean 9 1.9167 1.21835 .40612
The distribution of variances were evaluated and assumed equal based on Levene’s test. An
independent sample t-test showed no significant differences between lean and nonlean sport dieting
tendencies for any of these variables. Alternatively, when we examined the dichotomous variable lean (0)
and non-lean (1) using logistic regression, none of the questionnaire variables were significant predictors
of grouping.
Similarly, the percent body fatness and resting metabolic rates were compared between the lean
and non lean athletes. Assuming equal variances, both RMR (T=-.332, p=0.745, df=15) and percent body
10
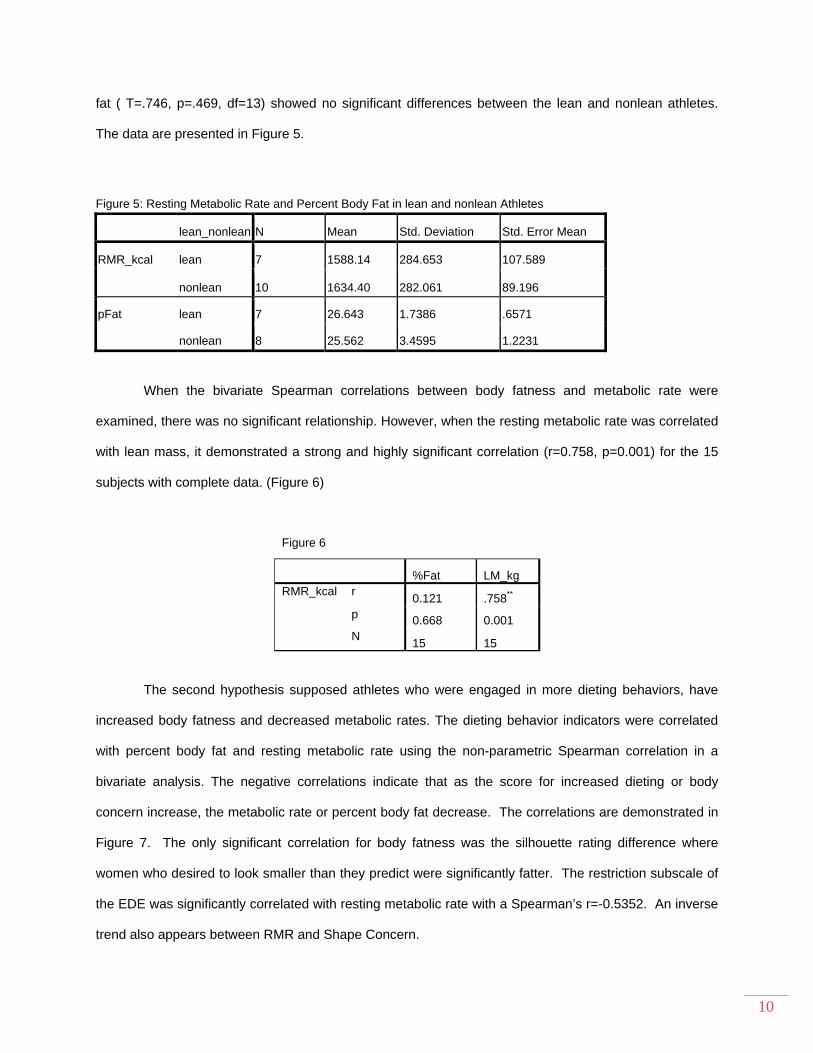
fat ( T=.746, p=.469, df=13) showed no significant differences between the lean and nonlean athletes.
The data are presented in Figure 5.
Figure 5: Resting Metabolic Rate and Percent Body Fat in lean and nonlean Athletes
lean_nonlean N Mean Std. Deviation Std. Error Mean
RMR_kcal lean 7 1588.14 284.653 107.589
nonlean 10 1634.40 282.061 89.196
pFat lean 7 26.643 1.7386 .6571
nonlean 8 25.562 3.4595 1.2231
When the bivariate Spearman correlations between body fatness and metabolic rate were
examined, there was no significant relationship. However, when the resting metabolic rate was correlated
with lean mass, it demonstrated a strong and highly significant correlation (r=0.758, p=0.001) for the 15
subjects with complete data. (Figure 6)
Figure 6
%Fat LM_kg RMR_kcal r
0.121 .758** p 0.668 0.001 N
15 15
The second hypothesis supposed athletes who were engaged in more dieting behaviors, have
increased body fatness and decreased metabolic rates. The dieting behavior indicators were correlated
with percent body fat and resting metabolic rate using the non-parametric Spearman correlation in a
bivariate analysis. The negative correlations indicate that as the score for increased dieting or body
concern increase, the metabolic rate or percent body fat decrease. The correlations are demonstrated in
Figure 7. The only significant correlation for body fatness was the silhouette rating difference where
women who desired to look smaller than they predict were significantly fatter. The restriction subscale of
the EDE was significantly correlated with resting metabolic rate with a Spearman’s r=-0.5352. An inverse
trend also appears between RMR and Shape Concern.
11
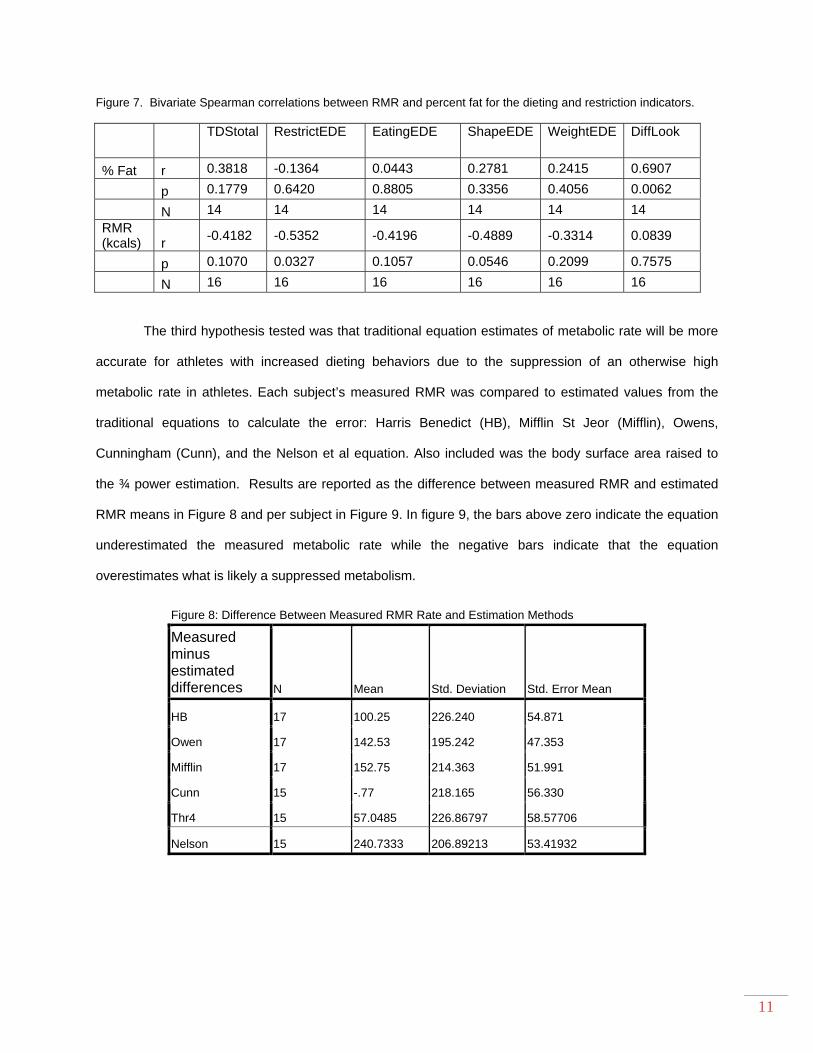
Figure 7. Bivariate Spearman correlations between RMR and percent fat for the dieting and restriction indicators.
TDStotal RestrictEDE EatingEDE ShapeEDE WeightEDE DiffLook
% Fat r 0.3818 -0.1364 0.0443 0.2781 0.2415 0.6907
p 0.1779 0.6420 0.8805 0.3356 0.4056 0.0062
N 14 14 14 14 14 14 RMR (kcals) r
-0.4182 -0.5352 -0.4196 -0.4889 -0.3314 0.0839
p 0.1070 0.0327 0.1057 0.0546 0.2099 0.7575
N 16 16 16 16 16 16
The third hypothesis tested was that traditional equation estimates of metabolic rate will be more
accurate for athletes with increased dieting behaviors due to the suppression of an otherwise high
metabolic rate in athletes. Each subject’s measured RMR was compared to estimated values from the
traditional equations to calculate the error: Harris Benedict (HB), Mifflin St Jeor (Mifflin), Owens,
Cunningham (Cunn), and the Nelson et al equation. Also included was the body surface area raised to
the ¾ power estimation. Results are reported as the difference between measured RMR and estimated
RMR means in Figure 8 and per subject in Figure 9. In figure 9, the bars above zero indicate the equation
underestimated the measured metabolic rate while the negative bars indicate that the equation
overestimates what is likely a suppressed metabolism.
Figure 8: Difference Between Measured RMR Rate and Estimation Methods
Measured minus estimated differences N Mean Std. Deviation Std. Error Mean
HB 17 100.25 226.240 54.871
Owen 17 142.53 195.242 47.353
Mifflin 17 152.75 214.363 51.991
Cunn 15 -.77 218.165 56.330
Thr4 15 57.0485 226.86797 58.57706
Nelson 15 240.7333 206.89213 53.41932

12
All of the equation differences were analyzed using a one sample t-test to determine if the
differences (errors) were statistically different than zero. The Cunningham equation’s difference showed
no statistical difference from zero, indicating better accuracy. Also, the BSA ^ ¾ estimation did not show
statistical difference from zero. The bivariate correlation with Spearman’s coefficient between the various
equations and measured RMR demonstrated multiple correlations, the strongest correlation was found
with the Owens equation. Each of the RMR estimation methods correlate well with the measure of RMR,
but the values predicted are significantly different from the measure and the error is significantly different
than zero.
Similarly, the difference variable for each equation was correlated with the questionnaire outcome
variables and the results are charted in Figure 10. Again, a negative correlation indicates that as the
tendency to be more restrictive or dieting behaviors go up, the amount of error between the measured
‐600
‐400
‐200
0
200
400
600
800
1 2 3 4 5 6 7 8 9 10 11 12 13 14 15 16 17Difference (kcal)
Subject Number
Figure 9: Error in Estimation Equations
HB dif
Owen dif
Mifflin dif
Cunn dif
BSA^3/4
Nels dif

13
and predicted RMR goes down. This indicates that the predictive equations are more accurate for those
athletes who score higher on the dieting indicators.
Figure 10: Spearman's Correlations between equation errors and dieting indicators
Differences
TDStotal RestrictEDE EatingEDE
ShapeEDE
WeightEDE
DiffLook
HB r -0.4361 -0.5262 -0.5167 -0.5081 -0.3920 0.0679
p 0.0913 0.0363 0.0404 0.0445 0.1331 0.8026
N 16 16 16 16 16 16
Owen r -0.5248 -0.4124 -0.6055 -0.6082 -0.4746 -0.0111
p 0.0369 0.1124 0.0129 0.0124 0.0633 0.9676
N 16 16 16 16 16 16
Mifflin r -0.3923 -0.4804 -0.5382 -0.4926 -0.3712 0.1464
p 0.1329 0.0596 0.0315 0.0525 0.1569 0.5886
N 16 16 16 16 16 16
Cunn r -0.3610 -0.4867 -0.4840 -0.5198 -0.3454 0.2063
p 0.2047 0.0776 0.0795 0.0567 0.2264 0.4792
N 14 14 14 14 14 14
Thr4 r -0.3632 -0.4491 -0.3536 -0.4934 -0.3058 0.1078
p 0.2018 0.1072 0.2149 0.0730 0.2876 0.7137
N 14 14 14 14 14 14
Nels r -0.4363 -0.4381 -0.5459 -0.5815 -0.4290 0.1289
p 0.1188 0.1172 0.0435 0.0292 0.1258 0.6605
N 14 14 14 14 14 14
In the bivariate analysis of these factors, it is impressive how much inter-correlation there is with
the questionnaire indicators. Looking at nonparametric comparisons, correlations other than the
proposed hypotheses are evident. There is a positive correlation between AE and the tendency to diet
scale, and a negative correlation between AE and Shape Concern. There is a positive correlation
between the tendency to diet and the desire for the body to look different, also between the tendency to
diet scale and the restriction scale. Weight concern is correlated positively with AE, wanting to look
different, the tendency to diet scale, restriction, Eating Concern and Shape concern.
Conclusion This was a small study due to time restriction and poor athlete enrollment, yet many trends were
seen and some significant correlations were found between variables. The first hypothesis that was

14
looked at was that women engaged in lean sports are at higher risk than non-lean sportists for engaging
in dieting behaviors. When comparing sport categories, no correlations were found with survey data that
would support this idea. For example, swimming was a team suspected to be high in dieting behaviors;
however that was not seen in this sample. Dieting behaviors are definitely going on in lean sports, but
they are appearing evenly in the nonlean sports as well. These results could be attributed to many
factors, so a higher number of subjects in each category and a wider variety of sports teams may help
tease out variable factors such as coaching and individuals to get a better picture of the sport in general.
The second hypothesis probed the idea that women engaged in dieting behaviors would, over
time, increase their body fat and decrease their metabolic rate. Analysis that compared RMR and percent
body fat in lean and nonlean sport athletes showed no significant difference. This makes sense because
our previous finding that the dieting behaviors were not different between the categories of lean and
nonlean sports. Looking at the results on an individual basis, however, did show correlations between
resting metabolic rate and restriction in an inverse relationship. This means that as these athletes restrict
their diet, their RMR decreases. Also, as their concern about their shape increases, their RMR decreases.
These dieting and image habits align with the suppression of the athlete’s resting metabolic rate.
The third hypothesis looked at the accuracy of predicted RMR equations and predicted that
because athletes tend to have a higher than average RMR, athletes involved in dieting behaviors, which
suppress the RMR, will have more accuracy with predictive equations. First, the accuracy of each
predictive method was found by comparison with the measured RMR. Although all of the predictive
methods correlated well with the measured values, the Owens equation correlated the strongest. This
equation uses the least amount of variables and, for the women’s equation, it uses one of the easiest to
measure, weight. The accuracy likely comes from the utilization of different equations based on activity
level.
The methods for prediction that show no significant difference from the measured value are,
surprisingly, not the same as the one with the strongest correlation. These are the Cunningham equation
and the body surface area (raised to the ¾ power) calculation. These are very accurate methods of
prediction, but they come with some restriction. The Cunningham equation uses lean body mass as a
variable, which requires use of the BodPod or other body composition technologies. These are not easily

15
accessible and are quite expensive to use in the clinical setting. Body surface area also comes from the
BodPod. Although they are quite accurate, they are not practical estimating RMR due to inherent
limitations in the variables used.
Many of the other trends found in the data are helpful in validating the methods used. The
correlations across the different surveys combined in the questionnaire reinforce the decision to use them
together. They show that the athletes with a high tendency to diet also have a desire for their body to look
much different, which makes sense intuitively. The data also shows that the athletes that have a tendency
to diet also have the tendency to restrict their eating. The women concerned about their weight also are
concerned with their eating and shape, they want to look different, and they have high dieting behaviors.
Although these trends are all in the same general category, it helps validate the results and shows not
just one area of dieting stresses for the athlete, but that there are multiple ways in which their attitudes
about dieting and their bodies fit together.
Comparing the various ways of estimating RMR shows that they are all valid for use. Evaluating
the error with the different dieting and restriction factors helps to narrow down which method is best to
use in each scenario and on different populations. For instance, it seems logical to use any of the
equations on an athlete who is a chronic dieter, but estimating the energy needs on an athlete who does
not engage in dieting would better be estimated using the Cunningham or three quarters equations.
Overall, the study broaches many ideas that help to understand female athletes and their energy
needs better. The survey begins to probe into the ideas of why some of their RMR readings are they way
they are. Once these trends are better understood, we can educate and help female athletes fuel to their
bodies, and in ways that can increase their metabolisms and decrease their body fatness.
Limitations
A more robust study would be a larger study that includes a greater number of athletes and a
wider variety of sports teams. This study was complete at The Ohio State University, a division I school
with elite athletes. In order to extrapolate this data to less elite athletes, more institutions could be
included so that the results can be applicable to more than such a small population. Another variable that

16
could be introduced would be to include coaching attitude surveys to gauge how they are addressing the
girl’s nutritional needs and to assess the pressures that are assumed to be felt by the girls in lean sports.
Conclusion
Caution needs to be used in estimating the RMR of female athletes because the estimation
equations do not all perform the same and seem to be influenced by dieting behaviors. Athletes not
engaged in dieting behaviors likely deserve a BodPod evaluation to allow for Cunningham estimation of
RMR. There appears to be no difference between lean and nonlean sports in terms of dieting behaviors,
body fatness and metabolic rates. The dieting behaviors seem to have a significant impact on individual
metabolic rates, but this study did not provide any evidence of greater fatness in athletes with a
depressed metabolic rate.

17
Appendices

18
Appendix A: Recruitment Script Recruitment Speech “My name is Sarah Watson, a senior here at OSU studying Nutrition. I am doing honors thesis research working with Dr. Jackie Buell, a sports nutrition expert and enthusiast, on a study of body composition, resting metabolic rate, and dietary habits in female collegiate athletes using a few different varsity sports teams; Softball, Gymnastics, Hockey, and Swimming. “We are looking for volunteers to participate in this study. Here is what it would entail on your end: about 30 minutes of your time to complete an online dietary survey which can be completed at your leisure before, or at the time of your lab visit. The lab visit will take about 45 minutes once in the lab. We can pick you up and bring you down to COSI in downtown Columbus. There is a new OSU Sports Nutrition Lab there called LABS in Life. When we get there, we will measure your body composition using a BodPod and your metabolic rate using ReeVue. Both of these procedures will require you to be fasted, so we will try to fit you all in first thing in the morning before you’ve had breakfast. The BodPod is a big machine you actually sit inside of. It has a little window so you can see out. The test takes about 5 minutes. The ReeVue test requires that you lay down, relax, and just breathe into a mouthpiece for another 5 minutes. When you’re done with these quick tests, we’ll feed you and bring you back! “These tests provide very useful information about your body, especially to athletes. We will help you understand your results. What’s cool for you is that these tests are pretty expensive, and you’ll be getting them and those helpful results for free! You’ll also be helping out the sports nutrition community by providing useful data we can use to learn more. “I hope you’re interested and willing to participate. The dates for testing are ______.”
19
Appendix B: Consent Form 2009H0038
The Ohio State University Consent to Participate in Research
Study Title:
Body Composition, Resting Metabolic Rate and Dietary Habits of Lean and Non-lean Female Athletes
Principal Investigator: Dr. Jackie Buell
Sponsor:
This is a consent form for research participation. It contains important information about
this study and what to expect if you decide to participate. Please consider the information carefully. Feel free to discuss the study with your friends and family and to ask questions before making your decision whether or not to participate.
Your participation is voluntary. You may refuse to participate in this study. If you decide to take part in the study, you may leave the study at any time. No matter what decision you make, there will be no penalty to you and you will not lose any of your usual benefits. Your decision will not affect your future relationship with The Ohio State University. If you are a student or employee at Ohio State, your decision will not affect your grades or employment status.
You may or may not benefit as a result of participating in this study. Also, as explained below, your participation may result in unintended or harmful effects for you that may be minor or may be serious depending on the nature of the research.
You will be provided with any new information that develops during the study that may affect your decision whether or not to continue to participate. If you decide to participate, you will be asked to sign this form and will receive a copy of the form. You are being asked to consider participating in this study for the reasons explained below.
1. Why is this study being done?
This study is being done to complete an honors thesis for graduation. We hope to make useful advances in the field of sports nutrition by better understanding energy needs for female athletes and how their behaviors affect their bodies.
2. How many people will take part in this study?
This study will include 60 female athletes. 3. What will happen if I take part in this study?

20
If you take part in this study, you will complete the three portions of the study. You will first complete a food habits questionnaire online. Then, you will come to Campbell Hall to have your resting metabolic rate measured. Finally, you will come to the Woody Hayes football facility where we will measure your body composition using a BodPod.
4. How long will I be in the study?
You will be in the study until all three of these pieces are complete. This will take no more than an academic quarter.
5. Can I stop being in the study?
You may leave the study at any time. If you decide to stop participating in the study, there will be no penalty to you, and you will not lose any benefits to which you are otherwise entitled. Your decision will not affect your future relationship with The Ohio State University.
6. What risks, side effects or discomforts can I expect from being in the study?
There are no risks or side effects! You will undergo two non-invasive physical tests and a private online questionnaire.
7. What benefits can I expect from being in the study? The benefits that you can expect include your free results. The tests we are conducting are
expensive and provide very useful information, especially for athletes. You will receive these tests and results at no cost to you, other than your time! We will also provide guidance in understanding and interpreting your results. You will also benefit from experiencing research and participating in a fellow undergraduate project.
8. What other choices do I have if I do not take part in the study?
9. Will my study-related information be kept confidential?
Efforts will be made to keep your study-related information confidential. However, there may be circumstances where this information must be released. For example, personal information regarding your participation in this study may be disclosed if required by state law. Also, your records may be reviewed by the following groups (as applicable to the research): Office for Human Research Protections or other federal, state, or international regulatory
agencies; U.S. Food and Drug Administration;

21
The Ohio State University Institutional Review Board or Office of Responsible Research Practices;
The sponsor supporting the study, their agents or study monitors; and Your insurance company (if charges are billed to insurance). If the study involves the use of your protected health information, you may also be asked to sign a separate Health Insurance Portability and Accountability Act (HIPAA) research authorization form.
10. What are the costs of taking part in this study?
There is no cost to you, other than your time. 11. Will I be paid for taking part in this study?
By law, payments to subjects are considered taxable income.
12. What happens if I am injured because I took part in this study?
If you suffer an injury from participating in this study, you should notify the researcher or study doctor immediately, who will determine if you should obtain medical treatment at The Ohio State University Medical Center.
The cost for this treatment will be billed to you or your medical or hospital insurance. The Ohio State University has no funds set aside for the payment of health care expenses for this study.
13. What are my rights if I take part in this study?
If you choose to participate in the study, you may discontinue participation at any time without penalty or loss of benefits. By signing this form, you do not give up any personal legal rights you may have as a participant in this study. You will be provided with any new information that develops during the course of the research that may affect your decision whether or not to continue participation in the study. You may refuse to participate in this study without penalty or loss of benefits to which you are otherwise entitled. An Institutional Review Board responsible for human subjects research at The Ohio State University reviewed this research project and found it to be acceptable, according to applicable state and federal regulations and University policies designed to protect the rights and welfare of participants in research.

22
14. Who can answer my questions about the study?
For questions, concerns, or complaints about the study you may contact ___________________. For questions about your rights as a participant in this study or to discuss other study-related concerns or complaints with someone who is not part of the research team, you may contact Ms. Sandra Meadows in the Office of Responsible Research Practices at 1-800-678-6251. If you are injured as a result of participating in this study or for questions about a study-related injury, you may contact ____________________.

23
Signing the consent form I have read (or someone has read to me) this form and I am aware that I am being asked to participate in a research study. I have had the opportunity to ask questions and have had them answered to my satisfaction. I voluntarily agree to participate in this study. I am not giving up any legal rights by signing this form. I will be given a copy of this form.
Printed name of subject Signature of subject
AM/PM
Date and time
Printed name of person authorized to consent for subject (when applicable)
Signature of person authorized to consent for subject (when applicable)
AM/PM
Relationship to the subject Date and time
Investigator/Research Staff I have explained the research to the participant or his/her representative before requesting the signature(s) above. There are no blanks in this document. A copy of this form has been given to the participant or his/her representative.
Printed name of person obtaining consent Signature of person obtaining consent
AM/PM
Date and time
Witness(es) - May be left blank if not required by the IRB
Printed name of witness Signature of witness
AM/PM
Date and time
Printed name of witness Signature of witness
AM/PM
Date and time
24
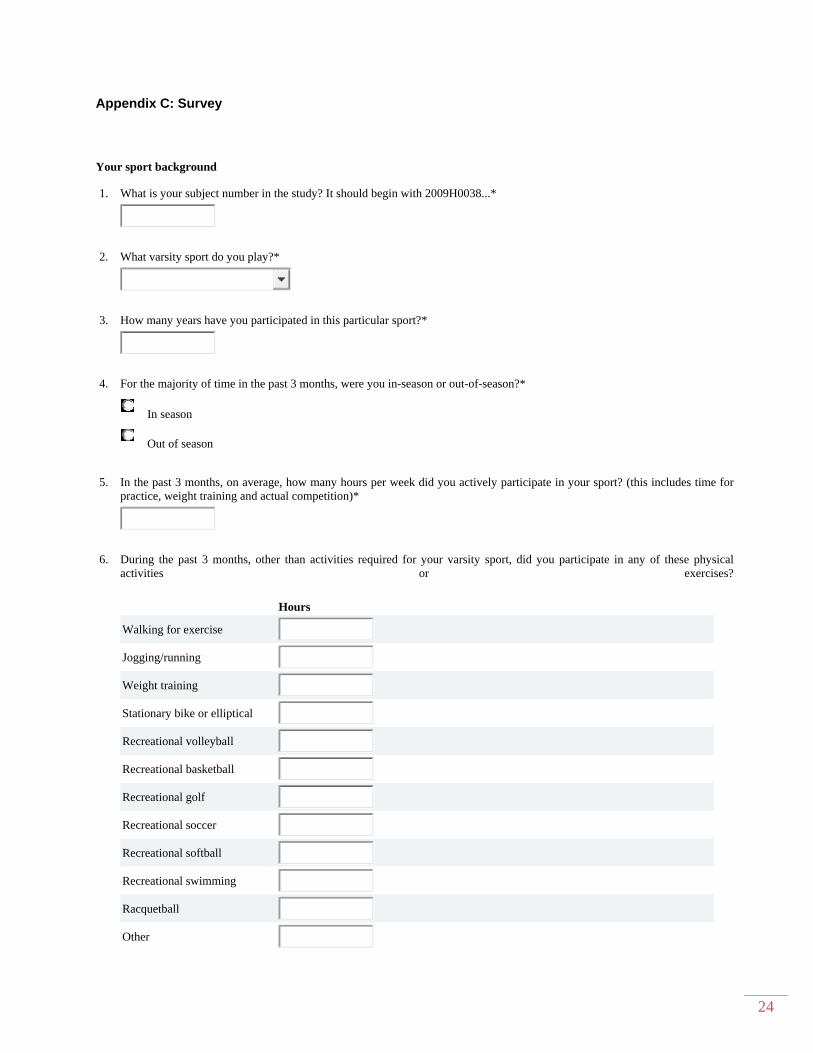
Appendix C: Survey Your sport background
1. What is your subject number in the study? It should begin with 2009H0038...*
2. What varsity sport do you play?*
3. How many years have you participated in this particular sport?*
4. For the majority of time in the past 3 months, were you in-season or out-of-season?*
In season
Out of season
5. In the past 3 months, on average, how many hours per week did you actively participate in your sport? (this includes time forpractice, weight training and actual competition)*
6. During the past 3 months, other than activities required for your varsity sport, did you participate in any of these physicalactivities or exercises?
Hours
Walking for exercise
Jogging/running
Weight training
Stationary bike or elliptical
Recreational volleyball
Recreational basketball
Recreational golf
Recreational soccer
Recreational softball
Recreational swimming
Racquetball
Other

25
7.
Which of these looks most like you?*
1 2 3 4 5 6 7 8 9
8.
Which of these would you most like to look like?*
1 2 3 4 5 6 7 8 9
Weight and cycle history
9. What is your weight at present? (Please give your best estimate in pounds.)*
10. What is your height? (Please give your best estimate in inches, so for instance 5' 8" would be 68.)*
11. Have you missed any periods in the last three to four months? *
Yes No
12. Estimate how many periods you've had in the past 12 months (1 year)?*
13. Have you been taking the "pill" (oral contraceptives)?*

26
Nutrition Habits and Attitudes
Page 3
Body Image
14. My body is sexually appealing*
Definitely Disagree
Mostly Disagree
Neither Agree nor Disagree
Mostly Agree
Definitely Agree
15. I like my looks just the way they are.*
Definitely Disagree
Mostly Disagree
Neither Agree nor Disagree
Mostly Agree
Definitely Agree
16. Most people would consider me good looking.*
Definitely Disagree
Mostly Disagree
Neither Agree nor Disagree
Mostly Agree
Definitely Agree
17. I like the way I look with my clothes on.*
Definitely Disagree
Mostly Disagree
Neither Agree nor Disagree
Mostly Agree
27
Definitely Agree
18. I like the way my clothes fit.*
Definitely Disagree
Mostly Disagree
Neither Agree nor Disagree
Mostly Agree
Definitely Agree
19. I dislike my physique.*
Definitely Disagree
Mostly Disagree
Neither Agree nor Disagree
Mostly Agree
Definitely Agree
20. I am physically unattractive.*
Definitely Disagree
Mostly Disagree
Neither Agree nor Disagree
Mostly Agree
Definitely Agree
21. Before going out in public, I always notice how I look.*
Definitely Disagree
Mostly Disagree
Neither Agree nor Disagree
Mostly Agree
Definitely Agree
22. I am careful to buy clothes that will make me look my best.*
Definitely Disagree

28
Mostly Disagree
Neither Agree nor Disagree
Mostly Agree
Definitely Agree
23. I check my appearance in a mirror whenever I can.*
Definitely Disagree
Mostly Disagree
Neither Agree nor Disagree
Mostly Agree
Definitely Agree
24. Before going out, I usually spend a lot of time getting ready.*
Definitely Disagree
Mostly Disagree
Neither Agree nor Disagree
Mostly Agree
Definitely Agree
25. It is important that I always look good.*
Definitely Disagree
Mostly Disagree
Neither Agree nor Disagree
Mostly Agree
Definitely Agree
26. I use very few grooming products.*
Definitely Disagree
Mostly Disagree
Neither Agree nor Disagree
Mostly Agree
29
Definitely Agree
27. I am self-conscious if my grooming isn't right.*
Definitely Disagree
Mostly Disagree
Neither Agree nor Disagree
Mostly Agree
Definitely Agree
28. I usually wear whatever is handy without caring how it looks.*
Definitely Disagree
Mostly Disagree
Neither Agree nor Disagree
Mostly Agree
Definitely Agree
29. I don't care what other people think about my appearance.*
Definitely Disagree
Mostly Disagree
Neither Agree nor Disagree
Mostly Agree
Definitely Agree
30. I take special care with my hair grooming.*
Definitely Disagree
Mostly Disagree
Neither Agree nor Disagree
Mostly Agree
Definitely Agree
31. I never think about my appearance.*
Definitely Disagree

30
Mostly Disagree
Neither Agree nor Disagree
Mostly Agree
Definitely Agree
32. I am always trying to improve my physical appearance.*
Definitely Disagree
Mostly Disagree
Neither Agree nor Disagree
Mostly Agree
Definitely Agree
Nutrition Habits and Attitudes
Page 4
Dieting characteristics
33. How difficult or easy is it for you to gain weight?*
Extremely Difficult
Moderately Difficult
Neutral
Moderately Easy
Extremely Easy
34. How difficult or easy is it for you to lose weight?*
Extremely Difficult
Moderately Difficult
Neutral
Moderately Easy
Extremely Easy
35. How much harder or easier is it for you to lose weight now than it was in the past?*

31
Much harder
Somewhat harder
Neutral
Somewhat easier
Much easier
36. How often are you dieting to lose weight?*
Never
Sometimes
Often
Always
37. How often do you use fasting or starving as a method to lose weight?*
Never
Sometimes
Often
Always
38. How often do you use laxatives or purgatives as a method to lose weight?*
Never
Sometimes
Often
Always
39. If an extremely sad event happens in your life (such as divorce, death, separation, loss of job, etc.), what is likely to happen to your weight?*
Gain Weight
Stay the Same
Lose Weight
40. If an extremely happy event happens in your life what is likely to happen to your weight?*
Gain Weight

32
Stay the Same
Lose Weight
41. How often are you preoccupied with losing weight?*
Never
Sometimes
Often
Always
42. How often are you preoccupied with food?*
Never
Sometimes
Often
Always
43. How much of a difference would it make in your life if you gained 5 pounds?*
Large Difference
Moderate Difference
Small Difference
No Difference
44. How much of a difference would it make in your life if you gained 10 pounds?*
Large Difference
Moderate Difference
Small Difference
No Difference
45. How much of a difference would it make in your life if you lost 5 pounds?*
Large Difference
Moderate Difference
Small Difference
No Difference

33
46. How much of a difference would it make in your life if you lost 10 pounds?*
Large Difference
Moderate Difference
Small Difference
No Difference
47. How important is your weight to yourself concept?*
Not Important
Mildly Important
Moderately Important
Extremely Important
On how many of the past 28 days....
48. Have you been deliberately trying to limit the amount of food you eat to influence your shape or weight(whether or not you have succeeded)?*
No days 1-5 days 6-12 days 13-15 days 16-22 days 23-27 days Every day
49. Have you gone for long periods of time (8 waking hours or more) without eating anything at all in order to influence your shape or weight?*
No days 1-5 days 6-12 days 13-15 days 16-22 days 23-27 days Every day
50. Have you tried to exclude from your diet any foods that you like in order to influence your shape or weight (whether or not you have succeeded)?*
No days 1-5 days 6-12 days 13-15 days 16-22 days 23-27 days Every day
51. Have you tried to follow definite rules regarding your eating (for example, a calorie limit) in order to influence your shape or weight (whether or not you have succeeded)?*
No days 1-5 days 6-12 days 13-15 days 16-22 days 23-27 days Every day
52. Have you had a definite desire to have an empty stomach with the aim of influencing your shape or weight?*
No days 1-5 days 6-12 days 13-15 days 16-22 days 23-27 days Every day
53. Have you had a definite desire to have a totally flat stomach?*
No days 1-5 days 6-12 days 13-15 days 16-22 days 23-27 days Every day
54. Has thinking about food, eating or calories made it very difficult to concentrate on things you are interested in (for example, working, following a conversation, or reading)?*

34
No days 1-5 days 6-12 days 13-15 days 16-22 days 23-27 days Every day
55. Has thinking about shape or weight made it very difficult to concentrate on things you are interested in (for example, working, following a conversation, or reading)?*
No days 1-5 days 6-12 days 13-15 days 16-22 days 23-27 days Every day
56. Have you had a definite fear of losing control over eating?*
No days 1-5 days 6-12 days 13-15 days 16-22 days 23-27 days Every day
57. Have you had a definite fear of that you might gain weight?*
No days 1-5 days 6-12 days 13-15 days 16-22 days 23-27 days Every day
58. Have you felt fat?*
No days 1-5 days 6-12 days 13-15 days 16-22 days 23-27 days Every day
59. Have you had a strong desire to lose weight?*
No days 1-5 days 6-12 days 13-15 days 16-22 days 23-27 days Every day
Nutrition Habits and Attitudes
Page 7
Over the past four weeks (28 days) ...
60. Over the past 28 days, how many times have you eaten what other would regard as an unusually large amount of food (given the circumstances)?*The value must be between 0 and 99, inclusive.
61. .....On how many of these times did you have a sense of having lost control over your eating (at the time you were eating)?The value must be between 0 and 99, inclusive.
62. Over the past 28 days, on how many DAYS have such episodes of overeating occurred (i.e., you have eaten an unusuallylarge amount of food and have had a sense of loss of control at the time)?The value must be between 0 and 28, inclusive.
63. Over the past 28 days, how many times have you made yourself sick (vomit) as a means of controlling your shape or weight?The value must be between 0 and 99, inclusive.
64. Over the past 28 days, how many times have you taken laxatives as a means of controlling your shape or weight?

35
The value must be between 0 and 99, inclusive.
65. Over the past 28 days, how many times have you exercised in a "driven" or "compulsive" way as a means of controlling your weight, shape or amount of fat, or to burn off calories?The value must be between 0 and 99, inclusive.
Nutrition Habits and Attitudes
Page 8
Please mark the appropriate box. Please note that for these questions the term "binge eating" means eating what others would regard as an unusually large amount of food for the circumstances, accompanied by a sense of having lost control over eating.
66. Over the past 28 days, on how many days have you eaten in secret (i.e., furtively)?... Do not count episodes of binge eating*
No days 1-5 days 6-12 days 13-15 days 16-22 days 23-27 days Every day
67. On what proportion of the times that you have eaten have you felt guilty (felt that you've done wrong) because of its effect on your shape or weight?.... Do not count the episodes of binge eating*
None of the times
A few of the times
Less than half of the times
Half of the times
More than half of the times
Most of the time
Every time
68. Over the past 28 days, how concerned have you been about other people seeing you eat?.... Do not count the episodes of binge eating*
None of the times
A few of the times
Less than half of the times
Half of the times
More than half of the times
Most of the time
Every time

36
Nutrition Habits and Attitudes
Page 9
Over the past 28 days...
69. Has your weight influenced how you think about (judge) yourself as a person?*
None of the times
A few of the times
Less than half of the times
Half of the times
More than half of the times
Most of the time
Every time
70. Has your shape influenced how you think about (judge) yourself as a person?*
None of the times
A few of the times
Less than half of the times
Half of the times
More than half of the times
Most of the time
Every time
71. How much would it have upset you if you had been asked to weigh yourself once a week (no more, or less, often) for the next four weeks?*
None of the times
A few of the times
Less than half of the times
Half of the times
More than half of the times
Most of the time
Every time

37
72. How dissatisfied have you been with your weight?*
None of the times
A few of the times
Less than half of the times
Half of the times
More than half of the times
Most of the time
Every time
73. How dissatisfied have you been with your shape?*
None of the times
A few of the times
Less than half of the times
Half of the times
More than half of the times
Most of the time
Every time
74. How uncomfortable have you felt seeing your body (for example, seeing your shape in the mirror, in a shop window reflection, while undressing or taking a bath of shower)?*
None of the times
A few of the times
Less than half of the times
Half of the times
More than half of the times
Most of the time
Every time
75. How uncomfortable have you felt about others seeing your shape or figure (for example, in communal changing rooms, when swimming, or wearing tight clothes)?*
None of the times

38
A few of the times
Less than half of the times
Half of the times
More than half of the times
Most of the time
Every time

39
References
1. Birch K. Female athlete triad. BMJ 2005 Jan 29;330(7485):244-6.
2. Deutz RC, Benardot D, Martin DE, Cody MM. Relationship between energy deficits and body composition in elite female gymnasts and runners. Med Sci Sports Exerc 2000 Mar;32(3):659-68.
3. Harrison K, Fredrickson BL. Women's sports media, self-objectification, and mental health in black and white adolescent females. J Commun 2003 06/15;53(2):216-32.
4. Beals KA, Hill AK. The prevalence of disordered eating, menstrual dysfunction, and low bone mineral density among US collegiate athletes. International Journal of Sports Nutrition and Exercise Metabolism 2006;16:1.
5. Burke L, Deakin V, editors. Clinical sports nutrition. Third ed. Sydney: The McGraw-Hill Companies; 2006. .
6. Frankenfield D, Roth-Yousey L, Compher C. Comparison of predictive equations for resting metabolic rate in healthy nonobese and obese adults: A systematic review. J Am Diet Assoc 2005 05;105(5):775-89.
7. Mifflin M, St Jeor S, Hill L, Scott B, Daugherty S, Koh Y. A new predictive equation for resting energy expenditure in healthy individuals. Am J Clin Nutr 1990 February 1;51(2):241-7.
8. Tverskaya R, Rising R, Brown D, Lifshitz F. Comparison of several equations and derivation of a new equation for calculating basal metabolic rate in obese children. J Am Coll Nutr 1998 August 1;17(4):333-6.
9. Beals KA, Manroe MM. Nutritional status of female athletes with subclinical eating disorders. J Am Diet Assoc. 1998;98:419-25. 10. Owen OE, Kavle E, Owen RS, Polansky M, Caprio S, Mozzoli MA, Kendrick ZV, Bushman MC, Boden G. A reappraisal of caloric requirements in healthy women. Am J Clin Nutr. 1986; 44:1-19. 11. Nelson KM, Weinsier RL, Long CL, Schutz Y. Prediction of energy expenditure from fat-free mass and fat mass. Am J Clin Nutr 1992;56:848–56. 12. Dodds, P. S., D. H. Rothman, and J. S. Weitz. 2001. Reexamination of the ‘‘‘¾-law’’ of metabolism. Journal of Theoretical Biology 209:9–27. 13. Fairburn, C.G., and Sarah Beglin. "Eating Disorder Examination Questionnaire (EDE-Q 6.0)." Cognitive Behavior Therapy and Eating Disorders, Appendix II (2008). 14. Cash TF, Winstead BW, Janda LH. The great American shape-up: Body image survey report. Psychol Today. 1986;20:30-37. 15. Brown, T. A., Cash, T. F., and Mikulka, P. J. Attitudinal body-image assessment: Factor analysis of the Body-Self Relations Questionnaire. J. Pers. Assess. 55: 135, 1990. 16. Kayman, S. and R.L. Brunner, Dieting Behaviors, in Obesity Assessment Tools, Methods, Interpretations, S.T. St. Jeor, Editor. 1997, Chapman and Hall: New York. p. 352-362.

40
17. Marjorie, Thompsson A., and James J. Gray. "Development and Validation of a New Body-Image Assessment Scale." Journal of Personality Assessment 64 (1995): 258-69. 18. REEVUE Indirect Calorimeter [Internet]; c2002 [cited 2008 February/20]. Available from: http://www.korr.com/products/reevue.htm.
19. McCrory MA, Mole PA, Gomez TD, Dewey KG, Bernauer EM. Body composition by air-displacement plethysmography by using measured thoracic gas volumes. J Appl Physiol 1998;84(4):1475-9.
20. Ortiz, Oscar, M. Russel, T. Daley, R. Baumgartner, M. Waki, S. Lichtman, J. Wang, R. Pierson, and S. Heymsfield. "Differences in skeletal muscle and bone mineral mass between black and white females and their relevance to body composition." Amerian Journal of Clinical Nutrition 8th ser. 55 (1992). 21. SPSS Inc. SPSS Statistics. Computer software. Vers. 17.0. <spss.com>.

41
Bibliography
1. Aurelia Nattiv MD, FACSM, Anne B. Loucks, Ph.D., FACSM, Melinda M. Manore, Ph.D., R.D., FACSM, Charlotte F. Sanborn, Ph.D., FACSM, Jorunn Sundgot-Borgen PD, and Michelle P. Warren, M.D. The female athlete triad. Medicine and Science in Sports and Exercise 2007:1867.
2. Beals KA, Hill AK. The prevalence of disordered eating, menstrual dysfunction, and low bone mineral density among US collegiate athletes. International Journal of Sports Nutrition and Exercise Metabolism 2006;16:1.
3. Beals KA, Meyer NL. Female athlete triad update. Clinics in Sports Medicine, 2007 1;26(1):69-89.
4. Beals KA, Manroe MM. Nutritional status of female athletes with subclinical eating disorders. J Am Diet Assoc. 1998;98:419-25.
5. Birch K. Female athlete triad. BMJ 2005 Jan 29;330(7485):244-6.
6. Brown, T. A., Cash, T. F., and Mikulka, P. J. Attitudinal body-image assessment: Factor analysis of the Body-Self Relations Questionnaire. J. Pers. Assess. 55: 135, 1990.
7. Burke L, Deakin V, editors. Clinical sports nutrition. Third ed. Sydney: The McGraw-Hill Companies; 2006. .
8. Cash TF, Winstead BW, Janda LH. The great American shape-up: Body image survey report. Psychol Today. 1986;20:30-37.
9. Collins AL, McCarthy HD. Evaluation of factors determining the precision of body composition measurements by air displacement plethysmography. European Journal of Clinical Nutrition 2003;57(6):770-6.
10. De Bock K, Richter EA, Russell AP, Eijnde BO, Derave W, Ramaekers M, Koninckx E, Lueger B, Verhaeghe J, Hespel P. Exercise in the fasted state facilitates fibre type-specific intramyocellular lipid breakdown and stimulates glycogen resynthesis in humans. The Journal of Physiology 2005;564(2):649-60.
11. Deutz RC, Benardot D, Martin DE, Cody MM. Relationship between energy deficits and body composition in elite female gymnasts and runners. Med Sci Sports Exerc 2000 Mar;32(3):659-68.
12. Dixon CB, Deitrick RW, Pierce JR, Cutrufello PT, Drapeau LL. Evaluation of the BOD POD and leg-to-leg bioelectrical impedance analysis for estimating percent body fat in national collegiate athletic association division III collegiate wrestlers. Journal of Strength and Conditioning Research / National Strength & Conditioning Association 2005;19(1):85-91.
13. Dodds, P. S., D. H. Rothman, and J. S. Weitz. 2001. Reexamination of the ‘‘‘¾-law’’ of metabolism. Journal of Theoretical Biology 209:9–27.
14. Fairburn, C.G., and Sarah Beglin. "Eating Disorder Examination Questionnaire (EDE-Q 6.0)." Cognitive Behavior Therapy and Eating Disorders, Appendix II (2008).

42
15. Felber J-, Golay A. Regulation of nutrient metabolism and energy expenditure. Metabolism, Clinical and Experimental. 1995;44(2):4.
16. Frankenfield DC, Rowe WA, Smith JS, Cooney RN. Validation of several established equations for resting metabolic rate in obese and nonobese people. Journal of American Dietetic Association 2003;103(9):1152.
17. FRANKENFIELD DC, MUTH ER, ROWE WA. The harris-benedict studies of human basal metabolism: History and limitations. Journal of the American Dietetic Association, 1998 4;98(4):439-45.
18. Frankenfield D, Roth-Yousey L, Compher C. Comparison of predictive equations for resting metabolic rate in healthy nonobese and obese adults: A systematic review. J Am Diet Assoc 2005 05;105(5):775-89.
19. Gibala MJ, MacLean DA, Graham TE, Saltin B. Tricarboxylic acid cycle intermediate pool size and estimated cycle flux in human muscle during exercise. The American Journal of Physiology 1998;275(2):235-42.
20. Hajhosseini L, Holmes T, Mohamadi P, Goudarzi V, McProud L, Hollenbeck CB. Changes in body weight, body composition and resting metabolic rate (RMR) in first-year university freshmen students. Journal of the American College of Nutrition 2006;25(2):123-7.
21. Harrison K, Fredrickson BL. Women's sports media, self-objectification, and mental health in black and white adolescent females. J Commun 2003 06/15;53(2):216-32.
22. Heather A Haugen, Edward L Melanson, Zung Vu Tran, Jay T Kearney, and James O Hill. Variability of measuring resting metabolic rate. The American Journal of Clinical Nutrition 2003;78:1141.
23. Heyward VH, Wagner DR. Applied body composition assessment. Second ed. United States of America: Human Kinetics; 2004. .
24. Dietary Reference Intakes [Internet]; c2007 [cited 2008 February/2008]. Available from: http://www.iom.edu.
25. Keim NL, Horn WF. Restrained eating behavior and the metabolic response to dietary energy restriction in women. Obesity Res 2004 January 1;12(1):141-9.
26. REEVUE Indirect Calorimeter [Internet]; c2002 [cited 2008 February/20]. Available from: http://www.korr.com/products/reevue.htm.
27. [Internet] [cited 2008 February/20]. Available from: http://www.bodpod.com.
28. Lof M, Hannestad U, Forsum E. Comparison of commonly used procedures, including the doubly-labelled water technique, in the estimation of total energy expenditure of women with special reference to the significance of body fatness. The British Journal of Nutrition 2003;90(5):961-8.
29. Maddalozzo GF, Cardinal BJ, Snow CA. Concurrent validity of the BOD POD and dual energy x-ray absorptiometry techniques for assessing body composition in young women. Journal of the American Dietetic Association 2002;102(11):1677-9.
30. Marjorie, Thompsson A., and James J. Gray. "Development and Validation of a New Body-Image Assessment Scale." Journal of Personality Assessment 64 (1995): 258-69.

43
31. McCrory MA, Mole PA, Gomez TD, Dewey KG, Bernauer EM. Body composition by air-displacement plethysmography by using prediction and measured thoracic gas volumes. J Appl Physiol 1998;84(4):1475-9.
32. Mifflin M, St Jeor S, Hill L, Scott B, Daugherty S, Koh Y. A new predictive equation for resting energy expenditure in healthy individuals. Am J Clin Nutr 1990;1(51):241-7.
33. Mifflin M, St Jeor S, Hill L, Scott B, Daugherty S, Koh Y. A new predictive equation for resting energy expenditure in healthy individuals. Am J Clin Nutr 1990 February 1;51(2):241-7.
34. Mulligan K, Butterfield GE. Discrepancies between energy intake and expenditure in physically active women. The British Journal of Nutrition 1990;64(1):23-36.
35. Nelson KM, Weinsier RL, Long CL, Schutz Y. Prediction of energy expenditure from fat-free mass and fat mass. Am J Clin Nutr 1992;56:848–56.
36. Orr J. Evaluation of a novel resting metabolic rate measurement system. .
37. Ortiz, Oscar, M. Russel, T. Daley, R. Baumgartner, M. Waki, S. Lichtman, J. Wang, R. Pierson, and S. Heymsfield. "Differences in skeletal muscle and bone mineral mass between black and white females and their relevance to body composition." Amerian Journal of Clinical Nutrition 8th ser.
38. Owen OE, Kavle E, Owen RS, Polansky M, Caprio S, Mozzoli MA, Kendrick ZV, Bushman MC, Boden G. A reappraisal of caloric requirements in healthy women. Am J Clin Nutr. 1986; 44:1-19.
39. Poehlman ET, Denino WF, Beckett T, Kinaman KA, Dionne IJ, Dvorak R, Ades PA. Effects of endurance and resistance training on total daily energy expenditure in young women: A controlled randomized trial. The Journal of Clinical Endocrinology and Metabolism 2002;87(3):1004-9.
40. Roza AM, Shizgal HM. The harris benedict equatino reevaluated: Resting energy requirements and the body cell mass. The American Journal of Clinical Nutrition 1984;40:168.
41. Sangenis P. Position stand on FEMALE ATHLETE TRIAD. .
42. Speakman JR, Selman C. Physical activity and resting metabolic rate. Proceedings of the Nutrition Society 2003;62:621.
43. SPSS Inc. SPSS Statistics. Computer software. Vers. 17.0. <spss.com>.
44. Thompson J, Manore MM. Predicted and measured resting metabolic rate of male and female endurance athletes. Journal of the American Dietetic Association 1996;96(1).
45. Tverskaya R, Rising R, Brown D, Lifshitz F. Comparison of several equations and derivation of a new equation for calculating basal metabolic rate in obese children. J Am Coll Nutr 1998 August 1;17(4):333-6.