body mass bias and occupational relevance of military physical fitness tests paul m. vanderburgh,...
TRANSCRIPT

Body Mass Bias and Body Mass Bias and Occupational Relevance of Occupational Relevance of
Military Physical Fitness TestsMilitary Physical Fitness Tests
Paul M. Vanderburgh, EdDPaul M. Vanderburgh, EdDProfessor & ChairProfessor & Chair
Department of Health and Sport ScienceDepartment of Health and Sport Science
University of Dayton, Dayton, OhioUniversity of Dayton, Dayton, Ohio

BLUFBLUFThe Evidence Suggests:The Evidence Suggests:
Military Physical Fitness TestsMilitary Physical Fitness Tests1.1. Are not potent indicators of performance of Are not potent indicators of performance of
typical, loaded military taskstypical, loaded military tasks
2.2. Impose a systematic bias against larger, not Impose a systematic bias against larger, not fatter, service membersfatter, service members
3.3. 1. and 2. are interrelated1. and 2. are interrelated
Solutions Solutions 1.1. Scaled ValuesScaled Values
2.2. Correction Factors Correction Factors
3.3. Balanced Fitness Tests (validation needed)Balanced Fitness Tests (validation needed)
Military Physical FitnessMilitary Physical Fitness

How Fitness is Assessed How Fitness is Assessed (Army, Air Force, Navy)(Army, Air Force, Navy)
Sit-ups or Curl-ups
Push-ups Distance Run

Military Physical Fitness TestsMilitary Physical Fitness Tests Upper Body
Muscular Strength/Endurance
Trunk Muscular Strength/Endurance
Aerobic Capacity
Army 2 min Push-ups 2 min Sit-ups 2 Mile Run Air Force 1 min Push-ups 1 min Sit-ups 1.5 Mile Run Navy 2 min Push-ups 2 min Curl-ups 1.5 Mile Run
• Conducive to mass testing
• No special equipment needed
• Body weight is the primary resistance

Typical Physically Demanding Typical Physically Demanding Military TasksMilitary Tasks
Light Load CarriageLight Load Carriage
Heavy Load CarriageHeavy Load Carriage
Heavy HandlingHeavy Handling

Light Load CarriageLight Load Carriage

Heavy Load CarriageHeavy Load Carriage

Heavy HandlingHeavy Handling

Occupational RelevanceOccupational Relevance

Free Carry and Stretcher Carry Free Carry and Stretcher Carry PerformancePerformance
Strongest correlates of Strongest correlates of free carryfree carry and and stretcher carrystretcher carry performance: performance: – High LBM to dead mass (FM + plus casualty High LBM to dead mass (FM + plus casualty
mass) ratiomass) ratio– Standing broad jump Standing broad jump – Upright pullUpright pull
(Bilzon (Bilzon Occup MedOccup Med ‘02) ‘02)
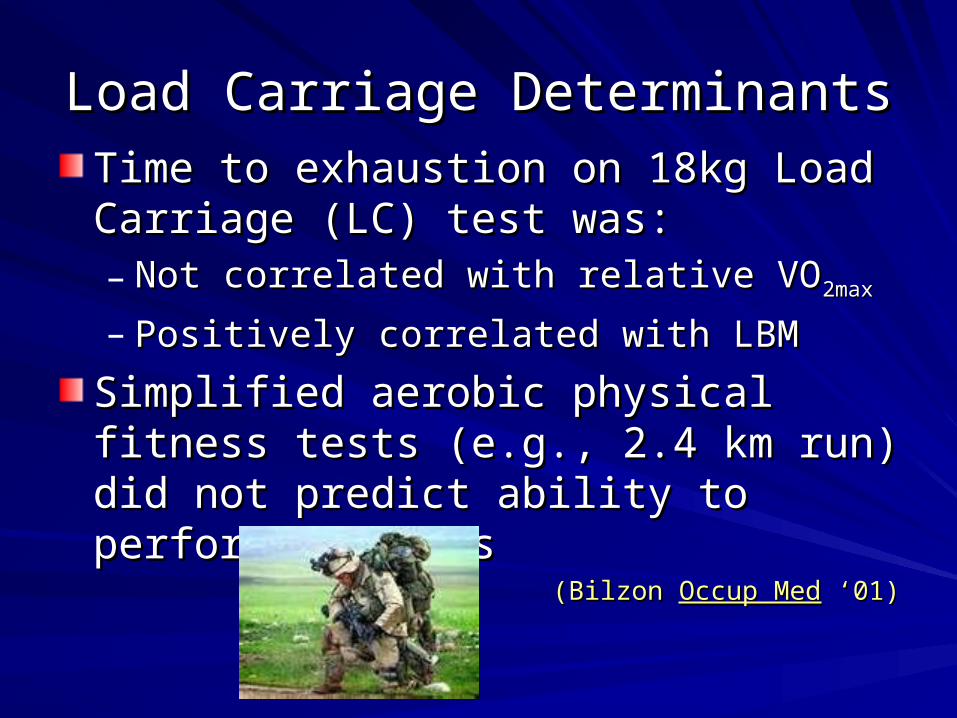
Load Carriage DeterminantsLoad Carriage Determinants
Time to exhaustion on 18kg Load Carriage Time to exhaustion on 18kg Load Carriage (LC) test was:(LC) test was:– Not correlated with relative VONot correlated with relative VO2max2max
– Positively correlated with LBMPositively correlated with LBM
Simplified aerobic physical fitness tests Simplified aerobic physical fitness tests (e.g., 2.4 km run) did not predict ability to (e.g., 2.4 km run) did not predict ability to perform LC tasksperform LC tasks
(Bilzon (Bilzon Occup MedOccup Med ‘01) ‘01)

Absolute VOAbsolute VO2max2max and LBM/DM were the most and LBM/DM were the most
potent predictors of %VOpotent predictors of %VO2max2max during heavy (40 during heavy (40
kg) LC taskskg) LC tasks
Absolute VOAbsolute VO2max2max, LBM/DM, gradient, and load , LBM/DM, gradient, and load
accounted for 89% of variance in %VOaccounted for 89% of variance in %VO2max2max
(Lyons (Lyons Occup MedOccup Med ’05) ’05)
Load Carriage DeterminantsLoad Carriage Determinants

PF Tests as Predictors of Military PF Tests as Predictors of Military PerformancePerformance
Body size, muscle strength, and aerobic Body size, muscle strength, and aerobic fitness (L/min) differentially predicted lifting fitness (L/min) differentially predicted lifting and load carriage task performanceand load carriage task performance– Not push-upsNot push-ups– Sit-ups generally weakSit-ups generally weak
– Relative VORelative VO2max2max only for light load carriage only for light load carriage
(Rayson Ergonomics ‘00)

PU, SU, 2MR Military Task PU, SU, 2MR Military Task Performance, 18 kg loadedPerformance, 18 kg loaded
30m sprint to and from prone position30m sprint to and from prone position– Vertical jump and 2MRVertical jump and 2MR
400M sprint400M sprint– 2MR and vertical jump2MR and vertical jump
Obstacle courseObstacle course– Long jump, SU, vertical jumpLong jump, SU, vertical jump
Casualty recoveryCasualty recovery– Body mass, vertical jump, and 2MRBody mass, vertical jump, and 2MR
(Harman (Harman MSSEMSSE (abstract) 2007) (abstract) 2007)

Occupational Relevance and Occupational Relevance and Physical Fitness Tests ConclusionsPhysical Fitness Tests Conclusions
Military physical fitness test performance is Military physical fitness test performance is generally not a potent predictor of loaded task generally not a potent predictor of loaded task performanceperformance
LBM, LBM/DM, upright pull, 1RM lift, and LBM, LBM/DM, upright pull, 1RM lift, and absolute VOabsolute VO2max2max are more predictive of load are more predictive of load
carriage performancecarriage performance
Body Mass BiasBody Mass Bias
Body Mass Bias 101Body Mass Bias 101
Defined as the non-zero correlation Defined as the non-zero correlation between body mass and a physical between body mass and a physical performance measureperformance measure– Push-ups, sit-upsPush-ups, sit-ups– Distance runDistance run– 1RM strength1RM strength
Free of the confounding effects of effort, Free of the confounding effects of effort, body fat, or physical activity levelbody fat, or physical activity levelTheoretical basisTheoretical basis
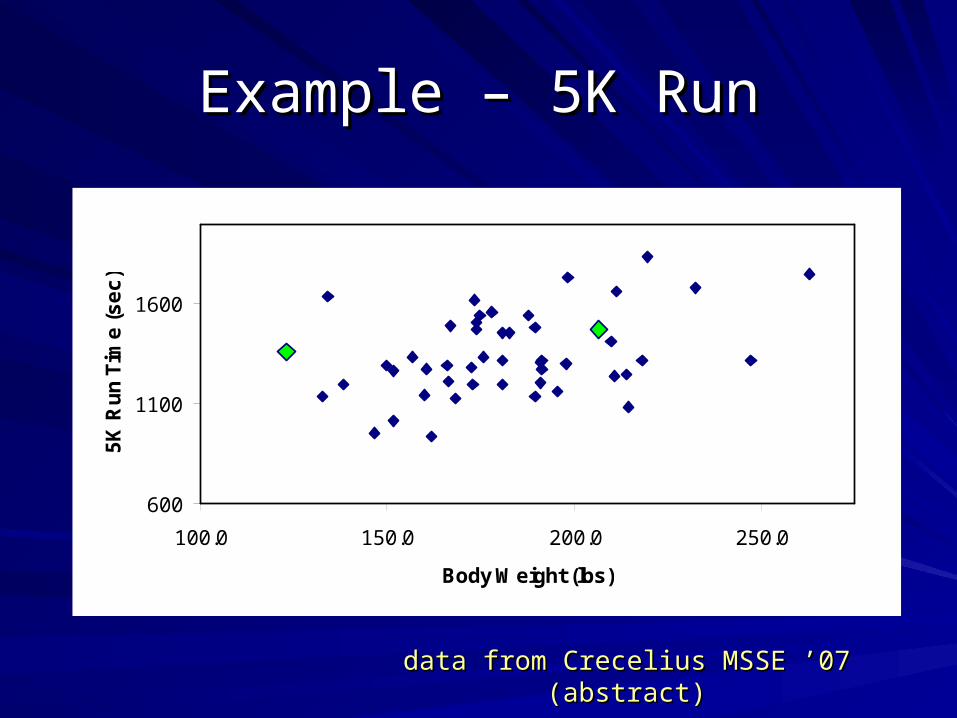
Example – 5K RunExample – 5K Run
600
1100
1600
100.0 150.0 200.0 250.0
Body Weight (lbs)
5K
Ru
n T
ime
(s
ec
)
data from Crecelius MSSE ’07 (abstract)data from Crecelius MSSE ’07 (abstract)

Comparison of RunnersComparison of Runners
600
1100
1600
100.0 150.0 200.0 250.0
Body Weight (lbs)
5K
Ru
n T
ime
(s
ec
)
B is 8.5% slower than A
AB

Comparison considering body mass Comparison considering body mass Distance from the best-fit curveDistance from the best-fit curve
600
1100
1600
100.0 150.0 200.0 250.0
Body Weight (lbs)
5K
Ru
n T
ime
(s
ec
)
B is 8.6% faster than A
AB

Body Mass Bias ExampleBody Mass Bias ExamplePowerlifting TOTALPowerlifting TOTAL
(data from IPF website: www.powerlifting-ipf.com, 5/07)
500
600
700
800
900
1000
1100
40 60 80 100 120 140
Body Mass (kg)
To
tal W
t L
ifte
d (
SQ
+B
P+
DL
, in
kg
)
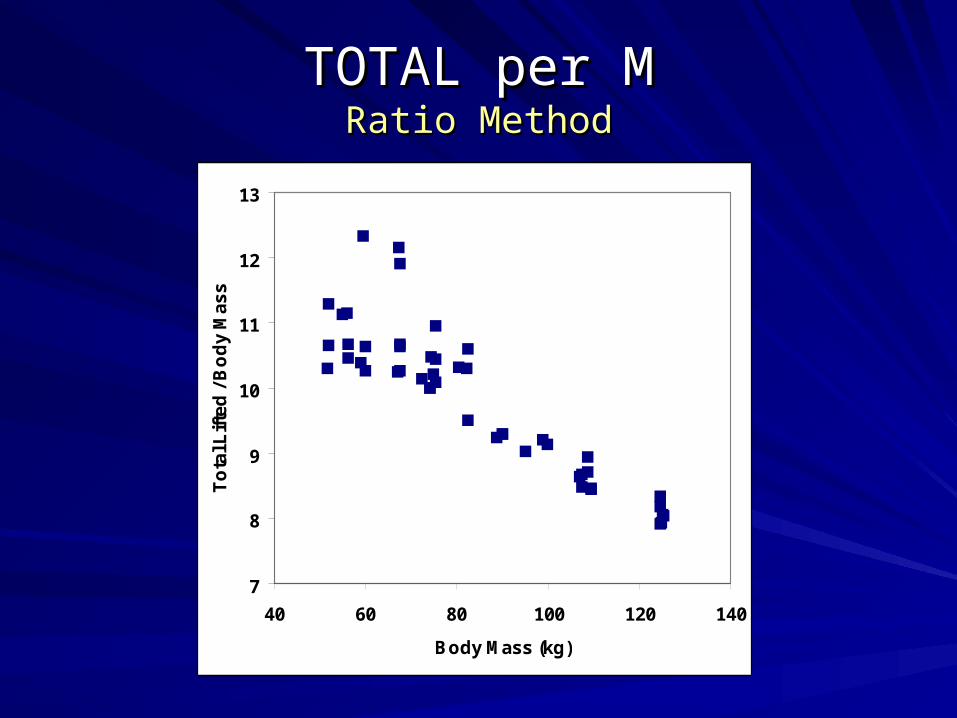
TOTAL per MTOTAL per MRatio MethodRatio Method
7
8
9
10
11
12
13
40 60 80 100 120 140
Body Mass (kg)
To
tal L
ifte
d /
Bo
dy
Ma
ss

TOT per MTOT per M2/32/3
30
35
40
45
50
55
40 60 80 100 120 140
Body Mass (kg)
TO
T/M
^2/
3
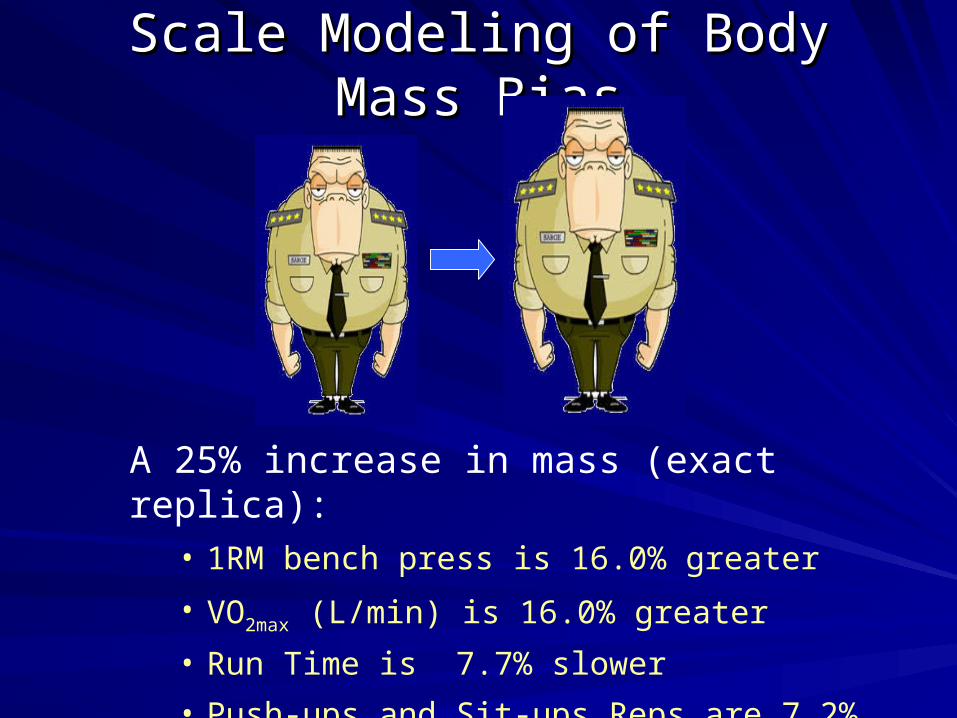
Scale Modeling of Body Mass BiasScale Modeling of Body Mass Bias
A 25% increase in mass (exact replica):• 1RM bench press is 16.0% greater
• VO2max (L/min) is 16.0% greater
• Run Time is 7.7% slower
• Push-ups and Sit-ups Reps are 7.2% fewer

Body Mass (M) and StrengthBody Mass (M) and StrengthTheoryTheory
Strength Strength αα muscle CSA muscle CSA
Muscle CSA Muscle CSA αα M M2/32/3
Therefore strength Therefore strength αα MM2/32/3
Fair comparison: Fair comparison: 1RM/M1RM/M2/32/3
(Astrand & Rodahl, Textbook of Work Physiology ’86)
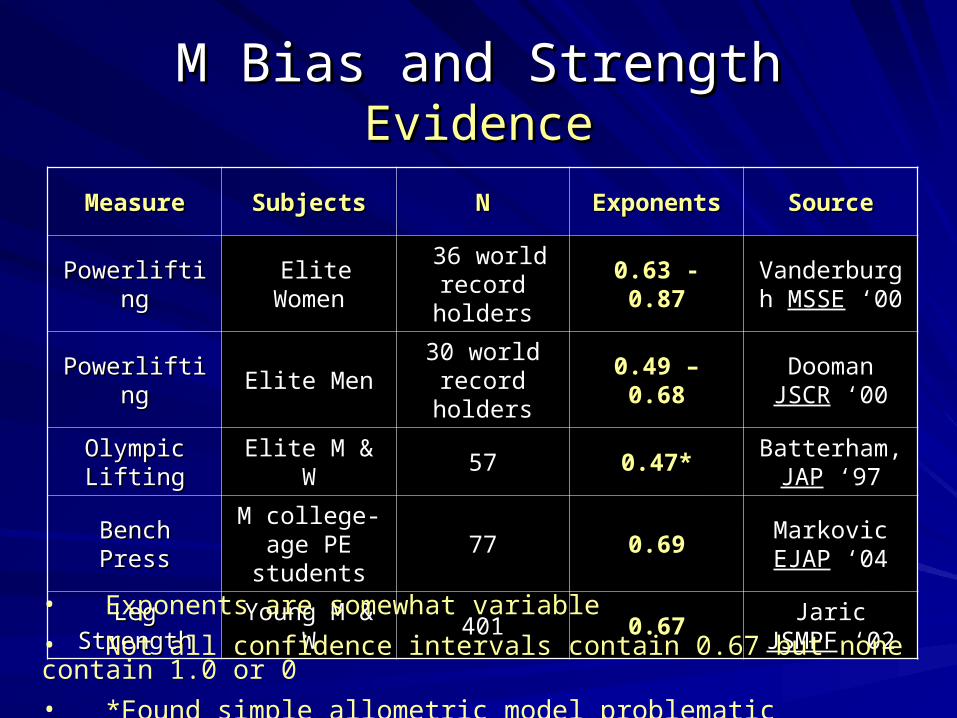
M Bias and StrengthM Bias and StrengthEvidenceEvidence
MeasureMeasure SubjectsSubjects NN ExponentsExponents SourceSource
PowerliftingPowerlifting Elite WomenElite Women 36 world 36 world record holdersrecord holders
0.63 - 0.87 Vanderburgh Vanderburgh MSSEMSSE ‘00 ‘00
PowerliftingPowerlifting Elite MenElite Men 30 world 30 world record holdersrecord holders
0.49 – 0.68 Dooman Dooman JSCRJSCR ‘00 ‘00
Olympic Olympic LiftingLifting Elite M & WElite M & W 5757 0.47* Batterham, Batterham,
JAPJAP ‘97 ‘97
Bench PressBench Press M college-age M college-age PE studentsPE students 7777 0.69 Markovic Markovic
EJAPEJAP ‘04 ‘04
Leg StrengthLeg Strength Young M & WYoung M & W 401401 0.67 Jaric Jaric JSMPFJSMPF ‘02‘02
• Exponents are somewhat variable
• Not all confidence intervals contain 0.67 but none contain 1.0 or 0
• *Found simple allometric model problematic

Body Mass and VOBody Mass and VO2max2max TheoryTheory
VOVO2max2max (L) (L) αα M M
Time Time αα M M1/31/3
VOVO2max2max (L/min) (L/min) αα M/M M/M1/31/3
Therefore VOTherefore VO2max2max (L/min) (L/min) αα MM2/32/3
Fair index: Fair index: ml Oml O22/(kg/(kg2/3.2/3.min)min)
(Astrand & Rodahl Textbook of Work Physiology ’86)
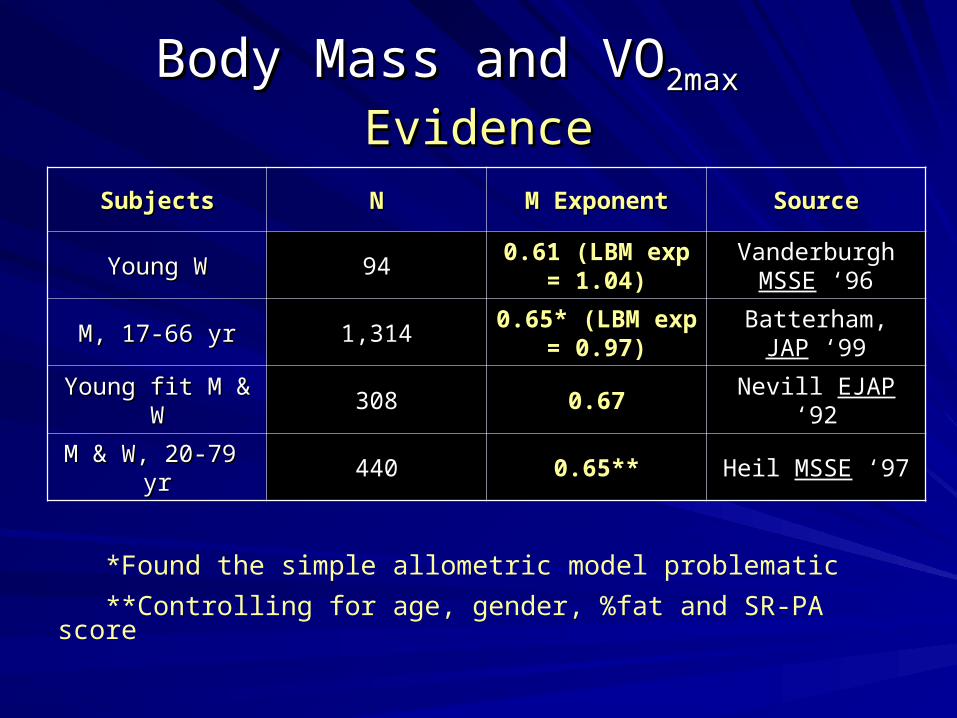
Body Mass and VOBody Mass and VO2max2max EvidenceEvidence
SubjectsSubjects NN M ExponentM Exponent SourceSource
Young WYoung W 94940.61 (LBM exp =
1.04)Vanderburgh Vanderburgh
MSSEMSSE ‘96 ‘96
M, 17-66 yrM, 17-66 yr 1,3141,3140.65* (LBM exp =
0.97)Batterham, Batterham, JAPJAP
‘99‘99
Young fit M & WYoung fit M & W 308308 0.67 Nevill Nevill EJAPEJAP ‘92 ‘92
M & W, 20-79 yrM & W, 20-79 yr 440440 0.65** Heil Heil MSSEMSSE ‘97 ‘97
*Found the simple allometric model problematic
**Controlling for age, gender, %fat and SR-PA score

Body Mass and Distance Run Time (RT) Body Mass and Distance Run Time (RT)
TheoryTheory
5K run speed (RS) 5K run speed (RS) αα VO VO2max2max (ml/kg (ml/kg..min)min)
But VOBut VO2max2max (L/min) (L/min) αα M M2/32/3
So RS So RS αα M M2/32/3/M or RS /M or RS αα M/ M/-1/3-1/3
Given that RT Given that RT αα RS RS-1-1
RT RT αα MM1/31/3
Fair index: Fair index: RT/MRT/M1/31/3
(Nevill JAP ’92, Vanderburgh MPEES ‘07)
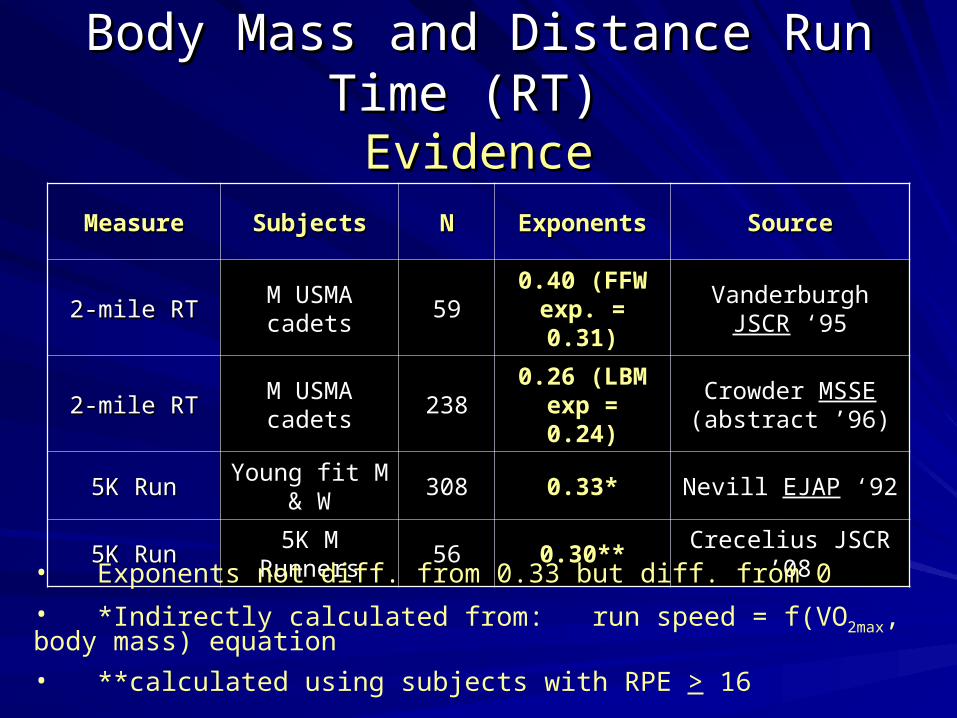
Body Mass and Distance Run Time (RT) Body Mass and Distance Run Time (RT) EvidenceEvidence
MeasureMeasure SubjectsSubjects NN ExponentsExponents SourceSource
2-mile RT2-mile RT M USMA M USMA cadetscadets 5959
0.40 (FFW exp. = 0.31)
Vanderburgh Vanderburgh JSCRJSCR ‘95‘95
2-mile RT2-mile RT M USMA M USMA cadetscadets 238238
0.26 (LBM exp = 0.24)
Crowder Crowder MSSEMSSE (abstract ’96)(abstract ’96)
5K Run5K Run Young fit M & Young fit M & WW
308308 0.33* Nevill Nevill EJAPEJAP ‘92 ‘92
5K Run5K Run 5K M Runners5K M Runners 5656 0.30** Crecelius JSCR ’08Crecelius JSCR ’08
• Exponents not diff. from 0.33 but diff. from 0
• *Indirectly calculated from: run speed = f(VO2max, body mass) equation
• **calculated using subjects with RPE > 16

Body Mass and Push-ups/Sit-ups REPSBody Mass and Push-ups/Sit-ups REPSTheoryTheory
Muscle force Muscle force αα M M2/32/3
REPS REPS αα M M2/32/3/M or M/M or M-1/3-1/3
Push-up, Sit-up REPS Push-up, Sit-up REPS αα M M-1/3-1/3
Fair index: REPSFair index: REPS..MM1/31/3
(Markovic EJAP ‘04)(Markovic EJAP ‘04)

Body Mass and Push-ups/Sit-ups REPSBody Mass and Push-ups/Sit-ups REPSEvidenceEvidence
MeasureMeasure SubjectsSubjects NN ExponentsExponents SourceSource
Push-upsPush-ups M USMA M USMA cadetscadets 238238
-0.38 (LBM exp = -0.28)
Crowder Crowder MSSEMSSE (abstract ’96)(abstract ’96)
Sit-upsSit-ups M USMA M USMA cadetscadets 238238
-0.26 (LBM exp = -0.24)*
Crowder Crowder MSSEMSSE (abstract ’96)(abstract ’96)
Push-upsPush-ups M college-age M college-age PE studentsPE students 7777 -0.42 Markovic Markovic EJAPEJAP ’04 ’04
Push-upsPush-ups M college-age M college-age PE studentsPE students 7777 -0.30 Markovic Markovic EJAPEJAP ’04 ’04
• Only exponent diff. from -0.33 and only slightly
• No studies on women
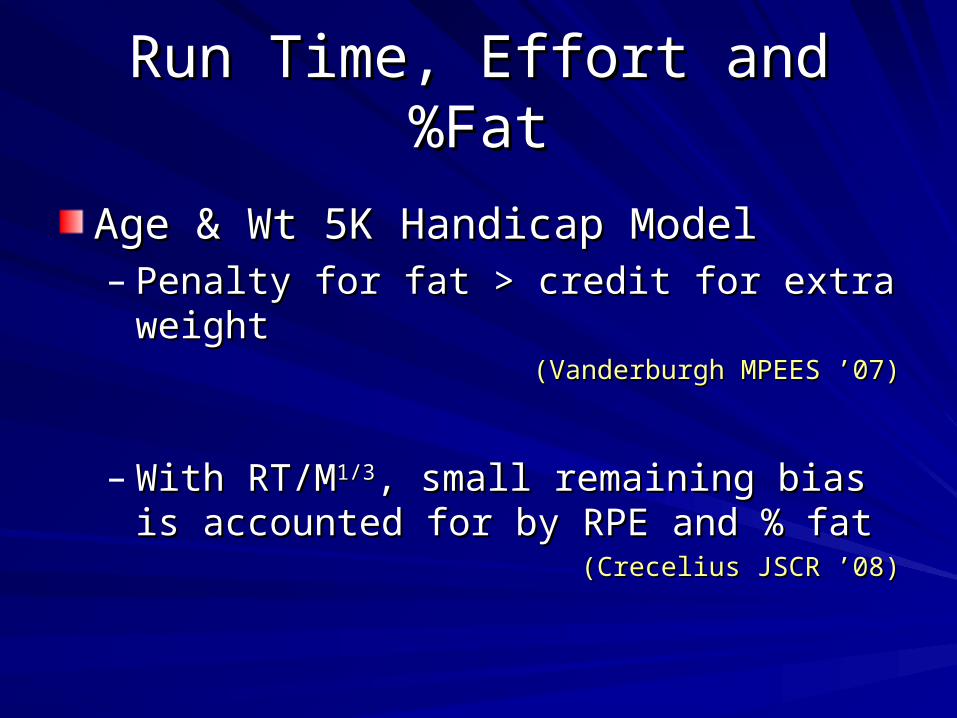
Run Time, Effort and %FatRun Time, Effort and %Fat
Age & Wt 5K Handicap ModelAge & Wt 5K Handicap Model– Penalty for fat > credit for extra weightPenalty for fat > credit for extra weight
(Vanderburgh MPEES ’07)(Vanderburgh MPEES ’07)
– With RT/MWith RT/M1/31/3, small remaining bias is , small remaining bias is accounted for by RPE and % fat accounted for by RPE and % fat
(Crecelius JSCR ’08)(Crecelius JSCR ’08)

Body Mass Bias Conclusions for Body Mass Bias Conclusions for Military Physical Fitness TestsMilitary Physical Fitness Tests
Military physical fitness test events favor lighter Military physical fitness test events favor lighter individuals, independent of body fatnessindividuals, independent of body fatness
Distance RunDistance Run– RT RT αα M M1/31/3
– Fair index = Fair index = RT/TRT/T1/31/3
Push-up, Sit-upsPush-up, Sit-ups– REPS REPS αα M M-1/3-1/3
– Fair index = Fair index = REPSREPS..MM1/31/3

Implications/SolutionsImplications/Solutions

Body Mass Bias Penalty - NavyBody Mass Bias Penalty - Navy
Male Female
60 kg 90 kg 45 kg 75 kg Event
Maximum Equivalent Maximum Equivalent
Push-ups 2 min 84 (100) 73 (85) 46 (100) 39 (80)
Curl-ups 2 min 101 (100) 88 (80) 101 (100) 85 (75)
1.5 mi run time 8:55 (100) 10:12 (85) 10:17 (100) 12:11 (85)
Total points (%diff.)
300 250 (16.7%) 300 240 (20%)
(Vanderburgh, Mil Med, 2006)

Body Mass Bias and Occupational Body Mass Bias and Occupational Relevance ConnectionRelevance Connection
The more potent predictors of loaded military The more potent predictors of loaded military task performance (LBM, LBM/DM, upright pull, task performance (LBM, LBM/DM, upright pull, 1RM lift, and absolute VO1RM lift, and absolute VO2max2max) tend to favor ) tend to favor
heavier individuals (LBM, LBM/DM, upright pull, heavier individuals (LBM, LBM/DM, upright pull, 1RM lift, and absolute VO1RM lift, and absolute VO2max2max))
Empirical and theoretical evidence suggests that Empirical and theoretical evidence suggests that common physical fitness test events favor lighter common physical fitness test events favor lighter individualsindividuals
Middle ground?Middle ground?
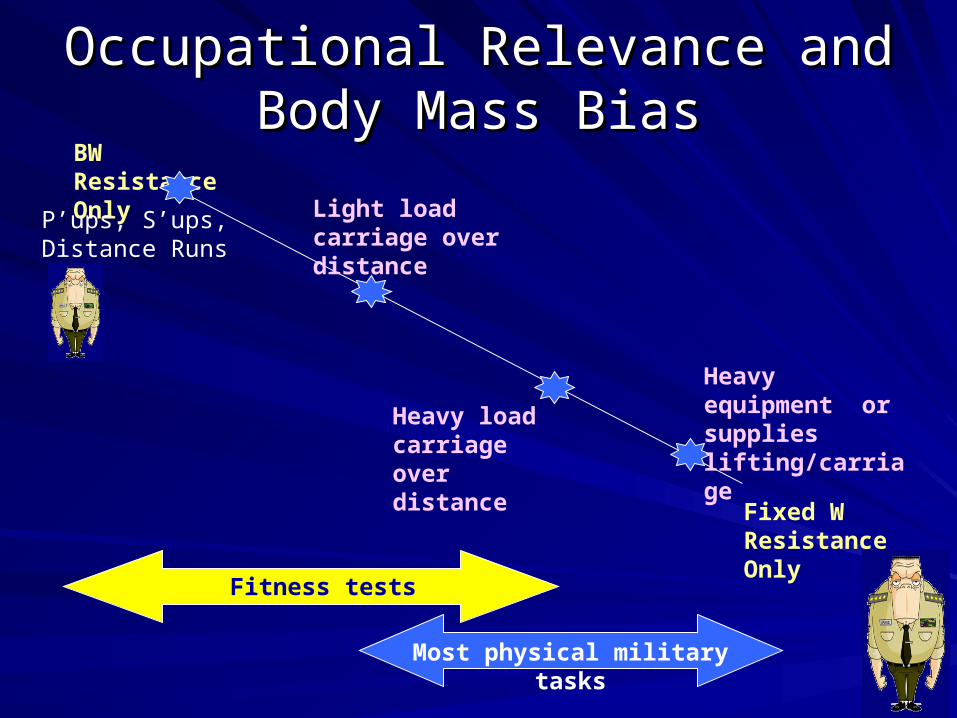
Occupational Relevance and Body Occupational Relevance and Body Mass BiasMass Bias
BW Resistance Only
Fixed W Resistance Only
Heavy equipment or supplies lifting/carriage
Light load carriage over distance
Heavy load carriage over distance
P’ups, S’ups, Distance Runs
Most physical military tasks
Fitness tests

Backpack Run TestBackpack Run Test(Vanderburgh Mil Med ’00)(Vanderburgh Mil Med ’00)
59 USMA male cadets59 USMA male cadets– Lean, fitLean, fit– Two-mile run timesTwo-mile run times
ModeledModeled effects of alterations in backpack effects of alterations in backpack weight (BW) via ACSM equations on two-mile weight (BW) via ACSM equations on two-mile run timesrun timesBackpack weights of 20-50 kg:Backpack weights of 20-50 kg:– No body mass biasNo body mass bias– Reflected load carriage weights expected of combat Reflected load carriage weights expected of combat
support and/or combat arms service memberssupport and/or combat arms service members
Eliminating bias may be congruent with Eliminating bias may be congruent with occupational relevanceoccupational relevance

Solution 1: Scaled ValuesSolution 1: Scaled Values
Requires calculatorRequires calculatorCreates strange currencyCreates strange currency
SubjectSubject Push-upsPush-ups Body MassBody Mass REPSREPS..MM1/31/3
AA 6767 80 kg80 kg 284.5284.5
BB 7070 68 kg68 kg 281.7281.7

Solution 2: Correction FactorsSolution 2: Correction Factors
Correction Factor (CF) : a dimensionless Correction Factor (CF) : a dimensionless number multiplied by raw scorenumber multiplied by raw score– Based on body massBased on body mass– Uses weight standard (e.g., 50 kg)Uses weight standard (e.g., 50 kg)
Example: woman, 172 lbs, 16:08 RTExample: woman, 172 lbs, 16:08 RT– CF = (125/172)CF = (125/172)1/3 1/3 = 0.90= 0.90– RTadj = 14:31RTadj = 14:31
(Vanderburgh (Vanderburgh Mil MedMil Med ’07) ’07)

Correction Factors Correction Factors Push-ups and Sit-upsPush-ups and Sit-ups
Women 120 130 140 150 160 170 180 190 200 0 1.00 1.01 1.04 1.06 1.08 1.11 1.13 1.15 1.17 1 1.00 1.02 1.04 1.06 1.09 1.11 1.13 1.15 1.17 2 1.00 1.02 1.04 1.07 1.09 1.11 1.13 1.15 1.17 3 1.00 1.02 1.05 1.07 1.09 1.11 1.13 1.15 1.17 4 1.00 1.02 1.05 1.07 1.09 1.12 1.14 1.16 1.18 5 1.00 1.03 1.05 1.07 1.10 1.12 1.14 1.16 1.18 6 1.00 1.03 1.05 1.08 1.10 1.12 1.14 1.16 1.18 7 1.01 1.03 1.05 1.08 1.10 1.12 1.14 1.16 1.18 8 1.01 1.03 1.06 1.08 1.10 1.12 1.14 1.16 1.18 9 1.01 1.04 1.06 1.08 1.10 1.13 1.15 1.17 1.18
(Vanderburgh Mil Med ‘07)

Correction Factors – EffectCorrection Factors – EffectWomen
82 82
69
85 8780
88 91 90
0
25
50
75
100
Push-ups = 35 Sit-ups = 65 2MRT = 19:28
AP
FT
Po
ints
Usi
ng
Ad
just
ed S
core
s
120 lb
150 lb
180 lb
(Vanderburgh Mil Med ‘07)
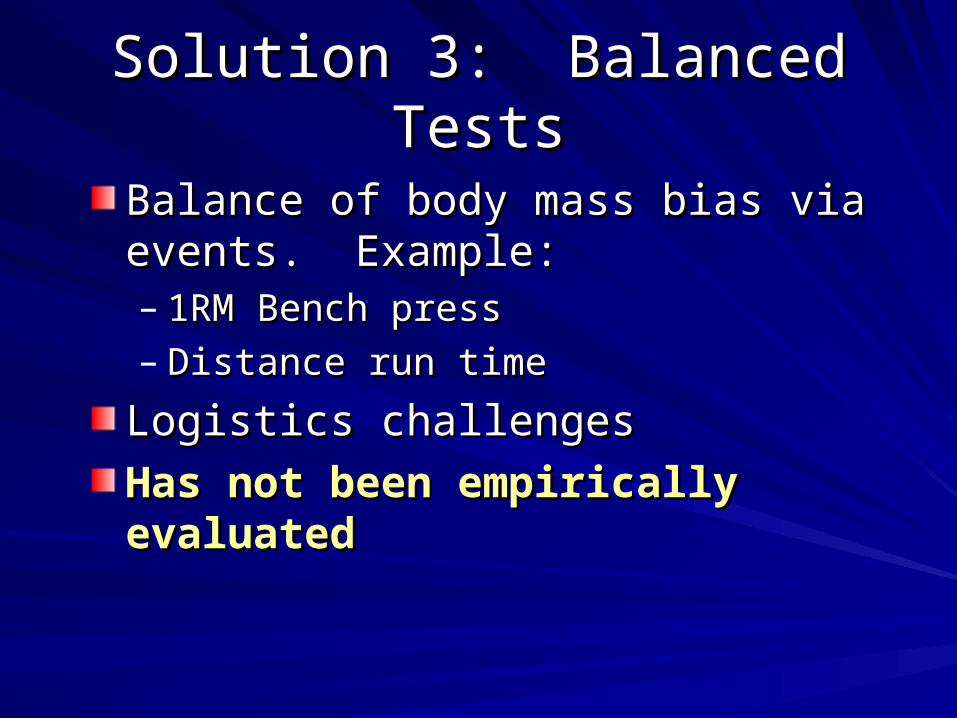
Solution 3: Balanced TestsSolution 3: Balanced Tests
Balance of body mass bias via events. Balance of body mass bias via events. Example:Example:– 1RM Bench press1RM Bench press– Distance run timeDistance run time
Logistics challengesLogistics challenges
Has not been empirically evaluatedHas not been empirically evaluated

2005 Pump and Run2005 Pump and Run5K run time minus (30 x Bench Press Reps) = adjusted score5K run time minus (30 x Bench Press Reps) = adjusted scoreBench Press weight a % of BW and age-adjustedBench Press weight a % of BW and age-adjustedDespite intent, imposes a substantial body mass biasDespite intent, imposes a substantial body mass biasProposal: correction factors or everyone lifts the same absolute Proposal: correction factors or everyone lifts the same absolute weightweight
(Vanderburgh JSCR 2008)
0
500
1000
1500
2000
35 60 85 110 135
Body Mass (kg)
Ad
just
ed R
un
Tim
e (s
ec)
Women
Men

ConclusionsConclusionsCurrent physical fitness tests of the Army, Navy, and Air Current physical fitness tests of the Army, Navy, and Air Force:Force:– Are not potent determinants of physical military task Are not potent determinants of physical military task
performanceperformance– Impose a physiological bias against heavier service membersImpose a physiological bias against heavier service members
Eliminating body mass bias may be more occupationally Eliminating body mass bias may be more occupationally relevant – must be tested empiricallyrelevant – must be tested empiricallySolutionsSolutions– Scaled valuesScaled values require no change to fitness test protocol but require no change to fitness test protocol but
create strange currencycreate strange currency– Correction factorsCorrection factors provide ease of calculation, preservation of provide ease of calculation, preservation of
original units, and require no equipmentoriginal units, and require no equipment– Balanced fitness testsBalanced fitness tests require equipment but no calculations – require equipment but no calculations –
need validationneed validation
ReferencesReferences1.1. Astrand PO, Rodahl K. Textbook of Work Physiology. New York, NY: McGraw Hill, 1986.Astrand PO, Rodahl K. Textbook of Work Physiology. New York, NY: McGraw Hill, 1986.2.2. Batterham AM, George KP: Allometric modeling does not determine a dimensionless power Batterham AM, George KP: Allometric modeling does not determine a dimensionless power
function ratio for maximal muscular function. J Appl Physiol 1997; 83: 2158-66.function ratio for maximal muscular function. J Appl Physiol 1997; 83: 2158-66.3.3. Batterham AM, Vanderburgh PM, Mahar MT, Jackson AS. Modeling the influence of body size on Batterham AM, Vanderburgh PM, Mahar MT, Jackson AS. Modeling the influence of body size on
VO2peak: Effects of model choice and body composition. J Appl Physiol 1999; 87: 1317-1325.VO2peak: Effects of model choice and body composition. J Appl Physiol 1999; 87: 1317-1325.4.4. Bilzon JL, Scarpello EG, Bilzon E, Allsop J. Generic task-related occupational requirements for Bilzon JL, Scarpello EG, Bilzon E, Allsop J. Generic task-related occupational requirements for
Royal Navy personnel. Occup Med 2002; 52: 503-510.Royal Navy personnel. Occup Med 2002; 52: 503-510.5.5. Bilzon JL, Allsopp AJ, Tipton MJ. Assessment of physical fitness for occupations encompassing Bilzon JL, Allsopp AJ, Tipton MJ. Assessment of physical fitness for occupations encompassing
load-carriage tasks. Occup Med 2001; 51: 357-361.load-carriage tasks. Occup Med 2001; 51: 357-361.6.6. Crecelius A, Vanderburgh PM, Laubach LL. Contributions of body composition and effort in the 5K Crecelius A, Vanderburgh PM, Laubach LL. Contributions of body composition and effort in the 5K
run age and body weight handicap model. J Strength Cond Res 2008;22:1475-1480.run age and body weight handicap model. J Strength Cond Res 2008;22:1475-1480.7.7. Crowder T,. Yunker C: Scaling of push-up, sit-up and two-mile run performances by body weight Crowder T,. Yunker C: Scaling of push-up, sit-up and two-mile run performances by body weight
and fat-free weight in young, fit men. [Abstract.]. Med Sci Sports Exercise 1996; 28: S183.and fat-free weight in young, fit men. [Abstract.]. Med Sci Sports Exercise 1996; 28: S183.8.8. Dooman CS, Vanderburgh PM. Allometric modeling of the bench press and squate: Who is the Dooman CS, Vanderburgh PM. Allometric modeling of the bench press and squate: Who is the
strongest regardless of body mass? Journal of Strength and Conditioning Research 2000; 14: 32-strongest regardless of body mass? Journal of Strength and Conditioning Research 2000; 14: 32-36.36.
9.9. Harman EA, Frykman PN, Gutekunst DJ, Nindl BC. Med Sci Sports Exerc 2007 (abstract); 39: Harman EA, Frykman PN, Gutekunst DJ, Nindl BC. Med Sci Sports Exerc 2007 (abstract); 39: S202.S202.
10.10. Heil DP. Body mass scaling of peak oxygen uptake in 20- to 79-yr-old adults. Med Sci Sport Heil DP. Body mass scaling of peak oxygen uptake in 20- to 79-yr-old adults. Med Sci Sport Exerc 1997; 29: 1602-1608. Exerc 1997; 29: 1602-1608.
11.11. Jaric S, Ugarkovic D, Kukolj M. Evaluation of methods of normalizing muscle strength in elite and Jaric S, Ugarkovic D, Kukolj M. Evaluation of methods of normalizing muscle strength in elite and young athletes. J Sports Med Phys Fit 2002; 42: 141-151. young athletes. J Sports Med Phys Fit 2002; 42: 141-151.
12.12. Lyons J, Allsopp A, Bilzon J. Influences of body composition upon the relative metabolic and Lyons J, Allsopp A, Bilzon J. Influences of body composition upon the relative metabolic and cardiovascular demands of load-carriage. Occup Med 2005; 55: 380-384.cardiovascular demands of load-carriage. Occup Med 2005; 55: 380-384.
ReferencesReferences13.13. Markovic G, Jaric S. Movement performance and body size: The relationship for different groups Markovic G, Jaric S. Movement performance and body size: The relationship for different groups
of tests. Eur J Appl Physiol 2004; 92: 139-149.of tests. Eur J Appl Physiol 2004; 92: 139-149.14.14. Nevill AM, Ramsbottom R, Williams C. Scaling physiological measurements for individuals of Nevill AM, Ramsbottom R, Williams C. Scaling physiological measurements for individuals of
different body size. Eur J Appl Physiol 1992; 65: 110-7.different body size. Eur J Appl Physiol 1992; 65: 110-7.15.15. Rayson MP, Holliman D, Belyavin A. Development of physical selection procedures for the British Rayson MP, Holliman D, Belyavin A. Development of physical selection procedures for the British
Army. Phase 2: Relationship between physical performance tasks and criterion standards. Army. Phase 2: Relationship between physical performance tasks and criterion standards. Ergonomics 2000; 43: 73-105.Ergonomics 2000; 43: 73-105.
16.16. U.S. Air Force Instruction 10-248. Fitness Program. January 2004; pp. 55-59.U.S. Air Force Instruction 10-248. Fitness Program. January 2004; pp. 55-59.17.17. U.S. Army Field Manual 21-20. Physical Fitness Training. October 1998; pp. 14-4 – 14-6. U.S. Army Field Manual 21-20. Physical Fitness Training. October 1998; pp. 14-4 – 14-6. 18.18. U.S. Navy OPSNAVINST 6110.1G. Physical Readiness Test (PRT). October 2002; p.14.U.S. Navy OPSNAVINST 6110.1G. Physical Readiness Test (PRT). October 2002; p.14.19.19. Vanderburgh PM, Mahar MT. Scaling of 2-mile run times by body weight and fat-free weight in Vanderburgh PM, Mahar MT. Scaling of 2-mile run times by body weight and fat-free weight in
college-age men. J Strength Cond Res 1995; 9: 67-70.college-age men. J Strength Cond Res 1995; 9: 67-70.20.20. Vanderburgh PM, Katch FI: Ratio scaling of VO2max penalizes women with larger percent body Vanderburgh PM, Katch FI: Ratio scaling of VO2max penalizes women with larger percent body
fat, not lean body mass. Med Sci Sport Exercise 1996; 28: 1204-8.fat, not lean body mass. Med Sci Sport Exercise 1996; 28: 1204-8.21.21. Vanderburgh PM, Dooman C: Considering body mass differences, who are the world’s strongest Vanderburgh PM, Dooman C: Considering body mass differences, who are the world’s strongest
women? Med Sci Sports Exercise 2000; 32: 197-201.women? Med Sci Sports Exercise 2000; 32: 197-201.22.22. Vanderburgh PM, Flanagan S. The Backpack Run Test: A model for a fair and occupationally Vanderburgh PM, Flanagan S. The Backpack Run Test: A model for a fair and occupationally
relevant military fitness test. Mil Med 2000; 165: 418-21.relevant military fitness test. Mil Med 2000; 165: 418-21.23.23. Vanderburgh PM, Crowder TA. Body weight penalties in the physical fitness tests of the Army, Air Vanderburgh PM, Crowder TA. Body weight penalties in the physical fitness tests of the Army, Air
Force, and Navy. Mil Med 2006; 171: 753-756.Force, and Navy. Mil Med 2006; 171: 753-756.24.24. Vanderburgh PM. Correction factors for body mass bias in military physical fitness tests. Mil Med Vanderburgh PM. Correction factors for body mass bias in military physical fitness tests. Mil Med
2007; in press.2007; in press.25.25. Vanderburgh PM, Laubach LL. Derivation of an age and weight handicap for the 5K run. Meas Vanderburgh PM, Laubach LL. Derivation of an age and weight handicap for the 5K run. Meas
Phys Ed Exerc Sci 2007; 11:49-59.Phys Ed Exerc Sci 2007; 11:49-59.26.26. Vanderburgh PM, Laubach LL. Body mass bias in a competition of muscle strength and aerobic Vanderburgh PM, Laubach LL. Body mass bias in a competition of muscle strength and aerobic
power. J Strength Cond Res 2008;22:375-382.power. J Strength Cond Res 2008;22:375-382.