bodydimensionsand proportions,white and … proportions,white and negrochildren6-11years...
TRANSCRIPT

Data from the Series 11 NATIONAL HEALTH SURVEY Number 143
BodyDimensionsand Proportions,White and NegroChildren6-11Years UnitedStates
Presents and discusses data on 20 anthropometric dimensions of children 6-11 years of age in the United States, 1963-65. The data are analyzed by race as well as age and sex and compare the patterns of body growth in Negro and white children in the United States.
DHEW Publication No. (H RA) 75-1625
U.S. DEPARTMENT OF HEALTH, EDUCATION, AND WELFARE Public Health Service
Health Resources Administration National Center for Health Statistics Rockville, Md. December 1974

Series 11 reports present findings from the National Health Examination Survey, which obtains data through direct examination, tests, and measurements of samples of the U.S. population. Reports 1 through 38 relate to the adult program, Cycle I of the Health Examination Survey. The present report is one of a number of reports of findings from the children and youth programs, Cycles II and III of the Health Examination Survey. These latter reports from Cycles II and III are being published in Series 11 but are numbered consecutively beginning with 101. It is hoped this will guide users to the data in which they are interested.
Library of Congress Cataloging in Publication Data
Malina, Robert M. Body dimensions and proportions, white and Negro children, 6-l 1 years, United States.
(National Center for Health Statistics. Vital and health statistics. Series 11: Data from the National Health Survey, no. 143) (DHEW publication no. (HRA) 75-1625)
Supt. of Dots. no.: HE 20.2210: 11/143. Includes bibliographical references. 1. Children in the United States-Anthropometry. 2. Children-Growth. 3. Negro
children-Anthropometry. I. Hamill, Peter V. V., joint author. II. Lemeshow, Stanley, joint author. III. Title. IV. Series: United States. National Center for Health Statistics. Vital and health statistics. Series 11: Data from the National Health Survey. Data from the heahh examination survey, no. 143. V. Series: United States. Dept. of Health, Education, and Welfare. DHEW publication no. (HRA) 75-1625. [DNLM: 1. Anthropometry-In infancy and chiIdhood. 2. Body height-In infancy and childhood. 3. Body weight-In infancy and childhood. W2AN 148vk no. 143 19 741 RA407.3.A347 no. 143 [GN63] 312’.6973s [572] 74-4239 ISBN O-8406-0011-9
For saleby the Superintendent of Documents, U.S. Government Printing OEice,Washington, D.C. w402- Price $1.30

NATIONAL CENTER FOR HEALTH STATISTICS
EDWARD B. PERRIN, Ph.D., Llirector
PHILIP S: LAWRENCE, Sc.D., Deputy Director JACOB J. FELDMAN, Ph.D., Acting Associate Director for Analysis
GAIL F. FISHER, Associate Directorfor the Cooperative Health Statistics System ELIJAH L. WHITE, Associate Directorfor Data Systems
IWAO M. MORIYAMA, Ph.D., Associate Directorfor International Statistics EDWARD E. MINTY, Associate Director for Management ROBERT A. ISRAEL, Associate Director for Operations
QUENTIN R. REMEIN, Associate Director for Program Development PAUL E. LEAVERTON, Acting Associate Director for Research
ALICE HAYWOOD, Information Officer
DIVISION OF HEALTH EXAMINATION STATISTICS
ARTHUR J. MCDOWELL, Director JEAN-PIERRE HABICHT, M.D., Ph.D., Special Assistant to Director
PETER V. V. HAMILL, M.D., Medical Advisor JEAN ROBERTS, Chief, Medical Statistics Branch
SIDNEY ABRAHAM, Chief, Nu hition Statistics Branch ROBERT S. MURPHY, Chief, Survey Pkrming and Development Branch
COOPERATION OF THE BUREAU OF THE CENSUS
In accordance with specifications established by the National Health Survey, the Bureau of the Census, under a contractual agreement, participated in the design and selection of the sample, and carried out the first stage of the field interviewing and certain parts of the statistical processing.
Vital and Health Statistics-Series 1 l-No. 143
DHEW Publication No. (HRA) 75-1625 Library of Congress Catalog Gtrd Number 74-4239

----------
----
--------
CONTENTS Page
Method------_----_-“--------------------------”-----------“
Results _----__--------------------------------------------------”Weight andHeight -------_-------_-----------------------------------Ponderal Index-----------------------------------------------------Components of Stature: Sitting Height and Subischial Length--------------Sitting Height/Stature Ratio --------------------____________L_______--Partitioning the Lower Extremity -----------_L-----_------------------Partitioning the Upper Extremity I------------------------------------Biacromial Breadth ----------------_--_____L_______________”Bicristal Breadth -----------_----I----------------------------------Biacromial Breadth/Bicristal Breadth Relationship---------------------Chest Dimensions -----------__-----_-_____c______________----------Bicondylar Breadth of the Femur ----------_--------------------------Limb Girths-------------------------------------------------------Estimated Mid-Arm MuscleCircumference ---_-------_--I__-----------Torso Girths--------------------------------------------------------
Discussion -_-_--------------------------------------------------------
Summary------------------------------------------------------------"
References --_--__-------------_____I______________-------------------
List of Detailed Tables ---------------^---------------------------------
Appendix I. Statistical Notes -----------_-_---------------------------The Survey Design--------------------------------------------------Notes on Response Rates-------__-_-------_-------------------------Parameter and Variance Estimation ---__------------_---------------,Q.g&ards of R&ability and Precision--------------------------------Hypothesis Testing ---------------_--__-----------------------------
Appendix II. Techniques of Measurement and Quality Control-------------Techniques of Measurement ------------I---_---___L________________--
Equipment-----------------------------------------------------.--Measuring Procedures andDefinitions ----“-“--------_-_------------Derived Measurements -_---_-------------_____________________---Indexes and Ratios-----------------------------------------------
Quality Control and Estimation of Residual Measurement Error----------Monitoring Systems----------------------------------------------
Biases and Controls in Replicate Measurements---------------------Selection of Replicate Examinees ------__---___--------------------The Analysis of Replicate Data on Body Measurements---------------Cycle III Systematic Replicate Procedure ---------------------------Results of the Replicate Analysis ----_-------_-------_____________I Discussion and Summary of Replicate Analysis----------------------
3
4 4 5 5 6 7 8 9
10 10 11 11 11 12 13
14
17
18
20
48 48 49 49 50 50
51 51 52 53 56 56 57 57 57 58 59 59 60 65
..: Ill1

BODY DIMENSIONS AND PROPORTIONS, WHITE AND NEGRO CHILDREN 6-11 YEARS
Robert hf. F&l&, Ph.D., Peter 1’. \‘. Hamili, M.D., M.P.H., and Stanley Lemeshow, I\l.S.P.H.a
This report compares the growth patterns of white and Negro childrem for 20 body measurements selected from a survey of U.S. children 6-11 years of age, Cycle II of the Health Examination Survey. It is the fifth in a series of re-ports presenting analyses and discussions of data on height, weight, and 28 other body measurements taken in Cycle II. The first two reports ‘*’ analyzed height and weight by age, sex, race, geographic region, and various socioeconomic indicators. The third report 3 presented data on skin-fold thickness. The fourth’ considered data, by age and sex, on 21 body measurements performed in Cycle II which are specifically useful to those concerned with human factors in equipment and safety design and in the manufacture of furniture and clothing.
The Health Examination Survey (HES) is conducted by the National Center for Health Statistics to collect and analyze health-related data on the American people through direct examination of selected subjects. It is a succession of separate programs, each referred to as a “cycle,” and each cycle lasts from 2 to 4 years.5
Cycle I of HES, conducted from 1959 to 1962, obtained information on the prevalence of certain chronic diseases and the distribution of anumber of anthropometric and sensory characteristics in the civilian, noninstitutionalized population of the conterminous United States aged 18-79 years. The general plan and operation of the survey and Cycle I are described in two previous reports,5.6
“Associate Professor of Anthropology, University of Texas. Austin, Texas; Medical Advisor, Children and Youth Program, Division of Health Examination Statistics: and formerly Analytical Statistician, DHES, respectively.
and most of the results are published in other Series 11 reports of Vital and Health Statistics.
Cycle II, conducted from .July 1963 to December 1965, involved selection and examlnation of a probability sample of noninstitutionalized children in the United States aged 6-11 years. This program succeeded in examining 96 percent of the 7,417 children selected for the sample. The examination had twoemphases. The first concerned factors related to healthy growth and development as determined by a physician, anurse, a dentist, and a psychologist; the second concerned a variety of somatic and physiologic measurements performed by specially trained technicians. The detailed plan and operation of Cycle II and the response results are described inVital and Health Statistics, Series 1, Number 5.? A comparable examination of data collection for Cycle III, youths aged 12-17, was completed in 1970, and the plan and operation are described in Series 1, Number 8.8
The present report and Series 11, Number 123 ’ together consider 27 of the 30 body measurements taken in Cycle II, leaving out only the three skinfold measurements. Although companion pieces, these two reports are very dissimilar in purpose and method of analysis. As stated in the introduction to Series 11, Number 123:
The main purpose of the numerous body measurements collected in Cycle II was to define a norma pattern of growth and development in children in the United States in the middle 1960’s (and to describe some of the modifying factors). However, the opportunity to obtain data on this uniquely representative sample of U.S. children for more utilitarian
1
purposes as well was not disregarded. In Cycle I (adults aged 18-79), 18 body measurements were obtained not only as medical and anthropologic correlates to the rest of the examination, but also as data for use in the consideration of anthropometric factors in equipment and safety design and manufacture (furniture, clothing, etc.)... The 21 anthropometric dimensions in this report were included in the group of body measurements partly for their descriptive value in the growth and development battery and partly for their use in “human engineering” or “human factors” work. Some of the measures have limited value in describing growth and development because they comprise multiple layers of tissue, multiple organ systems, and/or multiple loci of growth (e.g., waist and chest size, thigh clearance, all girths, seat breadth). However, many of these dimensions were selected primarily toachieve continuity with those measurements taken on adults in Cycle I of the HES...4 That report was descriptive and utilitarian
in its purposes. Percentile distributions of each measurement by age and sex were presented as found in the total population of U. S. children irrespective of race. In contrast, the present re-port is biologically oriented, and the data are analyzed separately for white and Negro children. In addition to the 20 separate body measurements taken in Cycle II, which are listed below, three indexes and two derived measurements (each based on two or more of the separate measurements) are used in the present comparative analysis.
The 20 separate dimensions presented in this report by age, sex, and race are weight, stature, sitting height, buttock-knee length, popliteal height, foot length, acromion-olecranon length, elbow-wrist length, hand length, biacromial breadth, bicristal breadth, bicondylar breadth of the femur, chest breadth, chest depth, upper arm girth, lower arm girth, calf girth, chest girth, waist girth, and hip girth.
In addition to gross body size, these dimensions provide measures of upper and lower extremity lengths, body breadths across bony landmarks, and various extremity and torso girths. Extremity length measurements make it
possible to assess the relative contribution of different segments (for instance, the upper arm and forearm to total arm length) and thus to better describe body proportions. Breadth measurements are indicators of skeletal breadth; when taken at several body sites they indicate the contribution of skeletal framework to body build. Limb circumferences provide an estimate of relative muscularity and thus an insight into the body’s compositiqn. The arm, for example, is comprised of successive layers of bone, muscle, and fat. When arm circumference is corrected for the thickness of the outer layer of subcutaneous fat at the triceps site, an estimate of the lean component of the arm’s composition is obtained. (See below.) Trunk circumferences are of limited value in estimating body composition except perhaps in extreme cases of undernutrition or overnutrition. They may, however, contribute to a general appraisal of physique, e.g., the ratio of chest and waist circumference. Each of thedimensions is defined and the technique of measurements described in detail in appendix II.
Two dimensions were derived from the avail-able measurements. First, sitting height was subtracted from stature to provide an estimate of subischial length. Subischial, or leg, length enables us to partition stature into two major components: the trunk, head, and neck, which comprise sitting height, and the lower extremity length. Second, an estimate of the mid-arm muscle circumference (lean component) was obtained by correcting the upper arm circumference for the thickness of the triceps skinfold as follows: EA4C (estimated muscle circumference) = upper arm circumference - r triceps skinfold. In recent years the estimated upper arm muscle circum: ference is often used as an anthropometric index of nutritional status.g-ll
In addition, three ratios were derived from the available measurements: (1) the ponderal index, height/w, b to provide an approximation of physique on a linearity/laterality continuum; (2) the ratio of sitting height to stature, sitting height/ stature X 100, to indicate the relative contribution of sitting height (head, neck, and trunk) to
b In computing this ratio height is cspresscdin inchesand weight in pounds, which produces a different result than would the use of metric measures.
2
total stature; and (3) the ratio of biacromial to bicristal breadths, biacromial breadth/bicristal breadth X 100, to indicate the relative proportions of shoulder and hip width. The shoulderihip ratio is used frequently in studies of body proportions and physique.
Estimates of the usual parameters for distributions (i.e., mean and standard deviation) are used throughout the report except where distributions deviate from normal. The percentile values indicate the general nature of the distributions, In general, with the exception of body weight and several girths, the dimensions discussed in the present report are normally distributed, or show only slight and inconsistent deviations over the age span under study. Normally distributed dimensions are primarily length and breadth measurements, which are measured be-tween well-defined bony landmarks-bone-to-bone measurements. The distributions of bodl weight and of limb and trunk circumference mcasurem(;~nts deviate from the normal over the ages studied and are skewed to the right. The positive skewness is more apparent for body weight and trunk circumferences. Of the three limb circumferences, lower arm circumference is normally distributed, while both upper arm and calf circumferences are slightly skewed to the right. The skewing of weight and girth measurements reflects the contribution of subcutaneous fat tothese dimensions. Subcutaneous fat measured via skin-fold thickness is positively skewed in distribution. 3 Hence in this report medians of weight and girth measurements are used for comparative purposes; however, means and their standard errors are also included in the detailed tables because these statistics are widely used by others.
The six new body measurements reported here complete the presentation of percentile distributions of all 30 body measurements taken in Cycle 11. Five of the 30 mcasurcs {height, weight, and three skinfolds) were examined by socioeconomic and demographic variables, in addition to percentile distributions specific for age, sex, and race. Is3 W the 25 remaining body dimensions, seven were considered useful only for Series 11, Number 123:‘(foot, hand, seat, and elbow-elbow breadths; thigh clearance; knee height; and buttock-poplitcal length). Six are presented for the first time in this report (the three
extremity girths: calf, upper arm, and lower arm; and three bone-to-bone breadths: biacromial, bicristal, and bicondylar). Twelve measurements are examined in both reports (sitting height, popliteal height, buttock-knee length, acromionolecranon length, elbow-wrist length, foot length, hand length, chest breadth and depth, chest girth, waist girth, and hip girth). Height and weight, of course, are included in many of these reports.
METHOD
At each of 40 Iocations preselected randomly throughout the United States,c the children were brought to the centrally located mobile examination center for an examination which lasted about 2 l/2 hours. Six children were examined in the morning and six in the afternoon. They were trans-ported to and from school or home.
[#hen the children entered the examination canter, their oral temperature was taken and a cursory screening for acute illness was made; if illness was detected in a child, he was sent home and examined at a later date. The examinees changed into shorts, cotton sweat socks, and a light, sleeveless top and proceeded to different stages of the examination, each one following a . different route. There were six different stations where examinations were conducted simultaneously, and the stations were exchanged, somewhat like musical chairs, so that by the end of 2 l/2 hours each child had had essentially the same examinations by the same examiners but in 3 different sequence. At three of these stations a pediatrician, 3 dentist, and a psychologist made examinations, and at the other three stations highly trained technicians performed a number of other examinations-chest and hand-wrist X-rays, hearing and vision tests, respiratory function tests and electrocardiography, a bicycle exercise test, 3 battery of body mcasurem?nts, and 3 grip strength test.
The recording form for the battery of 30 body measurements is reproduced in appendix II, which also gives details on equipment and measuring technique. All lateral measurements were performed on the subject’s right side and recorded by a trained observer. Periodic quality control
‘See appendixI for sample design.

observation and training sessions were conducted by .the supervisory medical staff and outside consultants to insure continued proficiency and to obtain replicate data for the purpose of quantifying observer erroF. The results are presented indetail in appendix II.
As in all the HES reports, age is basically defined as age attained at last birthday (verified from a copy of the birth certificate in 95 percent of the Cycle II examinees). The mean age of each category therefore approximates the mi.dpoint of the whole year; for instance, the 8-year-oldmale group consists of a l-year cohortwhose meanage is 8.51 years, while the corresponding female sample averages 8.49 years.
“Race” was recorded as “white,” “Negro,” and “other races.” d White children comprised 85.69 percent of the total, Negro children 13.87 percent, and children of other races only 0.45 percent; e The differential response rate by age, sex, and race is discussed in appendix I.
RESULTS
Weight and Heighi
Weight and height in the Cycle II sample have been discussed at length in previous reports.1,2 They are included here to provide a more corn.plete picture of the anthropometry of American
. d The. classifkation scheme used in the 1960 census was
employed here. As described in the report on the operation of HES Cycle IL7 this information was obtained at the initial household interview by the U.S. Bureau of the Census field-worker. Its accuracy was checked at the subsequent home visit by the HES representative and again at the examination in the trailer. A final record check by birth certificate turned up only seven inconsistencies, and these were mostly pertaining to the category “other races.” Hence the possible extent of misclassification of the variable race is so minimal that it could have no effect on the data analyzed in this report. However, when comparing the HES findings to those on other variously defined racial groupings in the world, the degrees of genetic admixture, as discussed first by Herskowitz in 1928’ 2 and later by Glass and,L~, l3 by Roberts,14’l 5 and by Reed I6 should be taken into consideration.
eChildren of other races were included in Series 11, Number 123, when all the data were analyzed independently of race but are omitted, because they arc so few, when a white-Negro dichotomy is used, as in the present report.
‘Or MALE
30,-/ 201
Ol- I I I I I I 6 7 8 9 10 11 12
AGE
or I I I I I I 6 7 8 9 10 11 12
AGE
Figure 1. Median weight of white and Negro children by sex and age.
Negro and white children during middle childhood. Both weight and height are measures of gross body size and, as expected; increase linearly with age between 6 and 12 years (figures 1 and 2, tables 1 and 2).
Median body weights for white and Negro boys differ only slightly from 6 through 8 years, but by 9, 10, and 11 years differences inmedian body weights have become greater andare consistently larger in white boys. White girls have slightly greater median body weights than Negro girls at 6, 7, 8, and 9 years of age, but at 10 .and 11 years the median weights for Negro girls are slightly greater.
Racial differences in average stature are negligible for males, mean statures for Negro boys, being slightly greater at 6, 7, and 8 years of age and those for white boys slightly greater at 9 and 10 years. On the other hand, Negro girls have consistently greater mean statures than white girls in all age groups except the 8-year-old group, so that at ages 10 and 11 they are both taller and heavier than white girls.
A

5
z
150-
145 -
140 -
135 -
130 -
125 -
120 -
115k
or I I I I I I 6 7 6 9 10 11 12
AGE
150
145
I40
135
130
125
120
115 _,,,,,,
0 6 7 8 9 10 11 I2
AGE
Figure 2. Mean height of white and Negro children by sex and age.
Ponderal index
\‘iewing the relationship of height and weight (hcight/%?%$) as expressed in the ponderal index (figure 3, table 3) indicates consistently higher indexes for Negro children of both sexes than for whites. High ponderal indexes suggest linearity of physique, while low indexes suggest laterality. Thus the foregoing ratio of height and weight indicates a linear physique in Negro children of both sexes. The difference between mean ponderal indexes of Negro and white boys at each age is rather consistent from 6 through 11 years. For girls this difference is similarly consistent from 6 through 9 years, but at 10 and 11 years the in-
14.0
MALE
1 13.5 .- ._--..__-_......_-..... . . . . . . . . . . . . ..-........ .,
Ei 12.5
12.0s 13.0 I- ...C--‘- ~*..C... -
or I I I I I I6 7 a 9 10 11 12
AGE
14.0
:: I FEMALE P 13.5
; . . . . . . --.-- . . . ..-........ k 13.0
z” 2 12.5 - White
. . . . . . . Negro 12.0
or I I I I I I 6 7 a 9 10 11 12
AGE
Figure 3. Mean ponderal index of white and Negro children by sex and age.
dcxes for Negro and white girls approach each other. Note, however, that it is at these two ages that Negro girls are heavier than white girls. Nevertheless, the mean ponderal indexes for Negro girls at every age except 10 are higher than those for white girls.
Components of Stature: Sitting Height and Subischial Length
Partitioning standing height into sitting height (figure 4, table 4) and subischial length, or stature minus sitting height (figure 5, table 5), illustrates the well-established racial difference in the components of stature: Negroes are longer Iegged and shorter trunked; conversely, whites are shorter Iegged and longer trunked. This is true for both sexes, the difference between racial groups being generalIy consistent over the age range studied.

Sitting Height/Stature Ratio
*Or MALE The ratio of sitting height to stature (sitting height/standing height X 100) is consistently high-er in white children of both sexes (figure 6, table 6). This ratio indicates that a significantlygreat-er percentage of standing height is contributed by
~0~ or I6 7
I 8
I 9
I 10
I 11
_I12
the sitting height (head, neck, and trunk) and less by subischial or leg length in white than in Negro children, while of course the opposite is true
AGE for Negro children. The ratio of sitting height to acr stature decreases in a parallel manner with in-
creasing age from 6 to 11 years, indicating a greater contribution of the lower extremities to stature with advancing age during middle child-hood in children of both racial groups.
Or I I I I I I 6 7 8 9 10 11 12
AGE
Figure 4. Mean sitting height of white and Negrochildren by sex and age.
80-
MALE
70 -
60 - -..*
LY -5. ---..........*
a...L1 51 . . . . --*........... .._
E t 50 - E 5o!z or6 7
I 8 I
9 I
10 I
11 I
12 I or
7 I
8 I
9 I
10 I
11 ! I6 12
AGE AGE 80
2 FEMALE
s
~ I,/
5 . . . . . . . . . . . . . . . -* .....***s
E a...
.. . . . . . Negro j, 50 L-2
:: 50 I or I I I I I I6or 7I 8I 9I 10I I I 6 7 8 9 10 11 12 11 12 AGE
AGE
Figure 5. Mean subischial length of white and Negro children by Figure 6. Mean sitting height/stature ratio of white and Negro sex and age. childrm by sex and age.
6

Partitioning the Lower Extremity
Although traditional bone-to-bone landmark measurements of the lower extremity were not taken, two measurements used primarily for “human engineering” or “human factors” re-search purposes provide an approximation of
racial differences in the components of lower extremity length. Buttock-knee length, though affected by fatty tissue deposits over the buttocks, provides a rough approximation of thigh or upper leg length; popliteal height providzs an approximation of lower leg length. Buttock-knee length is consistently longer in Negro girls than in white girls, the mean differences being smaller at 6, 7, and 8 years than at 9, 10, and 11 (figure 7, table 7). The buttock-knee length of boys shows no consistent pattern of differences over the age range studied. Although Negro boys have longer buttock-knee length measurements at 6, 7, and 8
or I I I I I J6 7 8 9 10 11 12
AGE
55r FEMALE-
or I I I I I I 6 7 8 9 10 11 12
AGE
Figure 7. Mean buttock-knee length of white and Negro children by sex and age.
years, differences between Negro and white boys are negligibIe at 9, 10, and 11 years. Popliteal height is consistently greater in Negro children of both sexes over the age span, with the difference between means at each age group being very consistent (figure 8, table 8).
The data for buttock-knee length andpopliteal height, though both are only approximate measurements, suggest that the greater length of the lower extremity in Negro children is due especially to a longer lower leg, the differences in upper leg length being minor and inconsistent. This generalization is in agreement with recent observations on Negro and white children utilizing traditional bony landmarks, which givemoreprecise measurements.‘7
Foot lengfh is likewise consistently greater in Negro children of both sexes over the age range studied (figure 9, table 9). Again, the difference between means at each age is very consistent.
MALE
6 7 8 9 10 11 12
AGE
FEMALE
7 8 9 10 11 12 6
AGE
Figure 8. Mean popliteal height of white and Negro children by sex and age.
7

b
23-
18
l’t or I I I I I 1
6 7 8 9 10 11 12
AGE
g 22-f
15 21 -
B 5 20-
E P 19-4
2 18-
0r I I I I I I 6 7 8 9 10 11 12
AGE
Figure 9. Mean foot length of white and Negro children by sex and age.
0 2 35 MALE
pi
-White . . . ..blegro
Figure 10. Mean acromion-olecranon length of white and Negro children by sex and age.
Partitioning the Upper Extremity
A generally similar racial pattern to that observed for the lower extremity is evident for the upper extremity. Acromion-olecranon length (upper arm length) is consistently greater in Negro girls from 6 to 11 years (figure 10, table 10). In boys, however, the pattern of differences is not consistent. Negro boys have longer upper arms at 6, 7, 8, and 11 years of age, while white boys have longer upper arms at 10 years.
25 -
MALE 24 -
23 -
18 -
17 -
or I I I I I I 6 7 8 9 10 11 12
AGE
25 c
24 -
23 -
22 -
21 -
20 -
19 -
18 -
17!x
or I I I I I I 6 7 8 9 10 11 _ 12
AGE
Figure 11. Mean elbow-wrist length,of white and Negro children by sex and age.
8

Mean acromion-olecranon lengths in Negro and white boys are identical at 9 years of age. It should be noted that a similar pattern of mean differences between Negro and white boys and girls is apparent for buttock-knee length. Elbow-wrist lerqt/l (lower arm or forearm length) is consistently greater in Negro children of both sexes from (1 through 11 years (figure 11, table ll), and the difference between means is rather consistent at each age group.
Hand len.@ is also consistently longer in Negro children of both sexes (figure 12, table 12). The difference between means at each age is very consistent.
Negro children of both sexes have longer up-per extremities than do whites. This difference is largely due to the longer forearms and hands of Negro children, just as their longer lower extremities are especially due to longer lower legs. (This is considered in more detail in the discussion.)
or I I I I I I 6 7 8 9 10 11 12
AGE
17r
01 I I I I I I 6 7 8 9 10 11 12
AGE
Figure 12. Mean hand length of white and Negro children by sex and age.
Biacromial Breadth
Negro boys have slightly wider measurements of bony breadth of the shoulders at each age except 9 years (figure 13, table 13). Biacromial breadths of Negro girls are only slightly higher than those of white girls at 6 and 7 years (and are the same at age 8). At 9, 10, and 11 years, however, the difference between h’egro and white girls is greater, perhaps only reflecting the larger body size of the Negro girls at these ages (see figures 1 and 2).
33
r MALE
25t or6 7I 8
I 9 1
10 1
11 I
12 I
AGE
33r
32 -
31 -
30 -
23 -
28 -
27 -
26 -
25L. or 1 I I , I I
6 7 8 9 10 11 12
AGE
Figure 13. Mean biacromial breadth of white and Negro children by sex and age.
9

Bicristal Breadth
The bony breadth across the iliac crests is consistently larger in whites of both sexes over the age span studied (figure 14, table 14). Also, the difference between means at each age group is rather consistent from 6 through 11 years in males and 6 through 9 years in females. At 10 and 11 years the difference between bicristal breadth means in Negro and white females be-comes slightly smaller than at the younger ages, although average bicristal breadth is still larger in white females. Thus, even though Negro girls are generally larger in overall body size than white girls, especially at 10 and 11 years of age, white girls have wider bicristal breadths over the entire age span studied.
24 MALE
23 F
AGE
-White --..I Nsgro
6 7 8 9 10 11 12
AGE
Fi@re 14. Mean bicristal breadth of white and Negro children by sex and age.
Biacromia!, Breadth/Bicristal Breadth Relationship
The ratio of shoulder to hip breadth (biacromial breadth/bicristal breadth X 100) is consistently higher in Negro children of both sexes over the age range studied (figure 15, table 15). The higher ratio indicates that Negro children have more slender pelves relative to their shoulders than white children. Conversely, the lower ratio indicates that ,white children have broader hips relative to their shoulders than Negro children.
The magnitude of the biacromial/bicristaI ratio decreases with age in an almost parallel manner in Negro and white girls, indicating a greater widening of the breadth across the iliac crests relative to the breadth of the shoulders. The ratio in white boys is almost constant between 6 and 11 years. In Negro boys the ratio at 6, 7, 8, and 11 years of age is almost constant, but at 9 and 10 years of age it shows a sharp increase. Whether this fluctuation in the ratio is only due to sampling variation in the smaller Negro sample is not clear.
160
r . ..‘fNegro male / f..
,...-* 5
I... . . . . . . . . . . . . . . . ...*_*-*.. ‘.. *..*** 5.. f..
-e----C %* -c
‘% #----, \ .
Figure 15. Meen biacromial breadth/bicristal breadth ratio of white end Negro children by sex and age.
10

Chest Dimensions
Chest breadth is, on the average, slightly but consistently greater in white children of both sexes from 6 through 11 years (figure 16, table 16). Chest depth, on the other hand, shows noconsistent pattern of racial differences over the age span studied (figure 17, table 17). Interestingly, Negro children of both sexes have slightly higher mean values at 6 years of age; thereafter mean values for the chest depth measurement are generally slightly larger in white children.
MALE “r
L
or I I 1 I I I6 7 8 9 10 11 12
AGE
23 FEMALE
22 c
0r I I I 1 I I 6 7 8 e 10 11 12
AGE
Figure 16. Mean chest breadth of white and Negro children by sex and age.
6 7 8 9 10 11 12
AGE
16 r FEMALE
or I I I I I I 6 7 8 Q 10 11 12
AGE
Figure 17. Mean chest depth of white and Negro children by sex and age.
Bicondylar Breadth of the Femur
This measurement across the condyles of the femur shows only negligible differences be-tween Negro and white children of both sexes from 6 through 11 years (table 18).
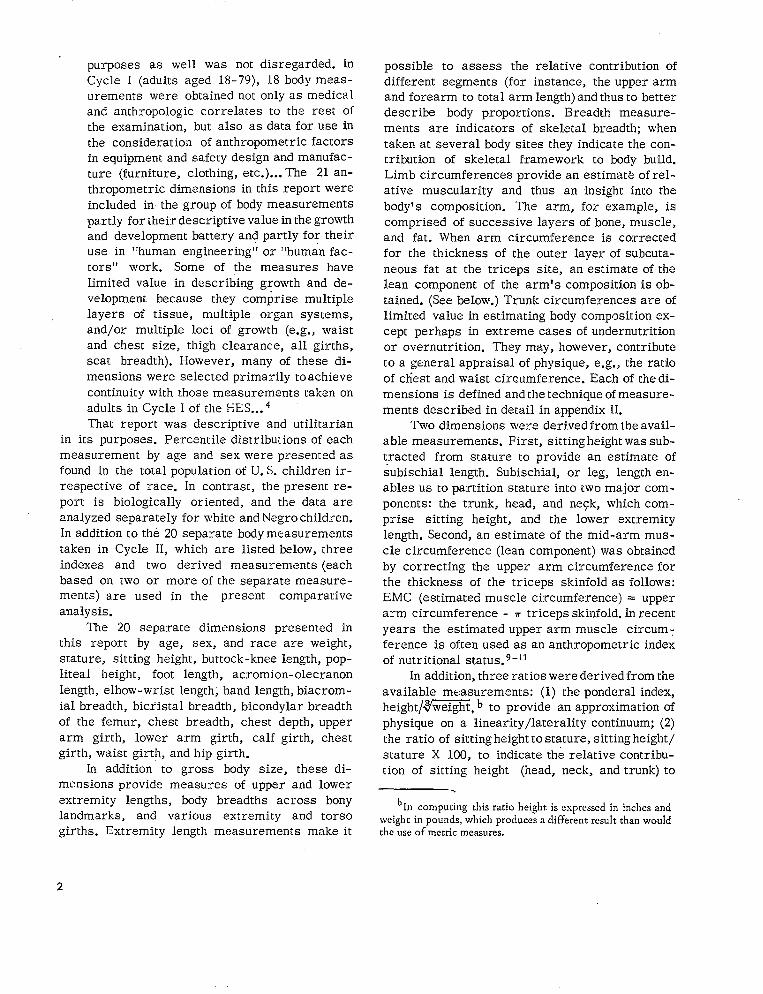
limb Girths
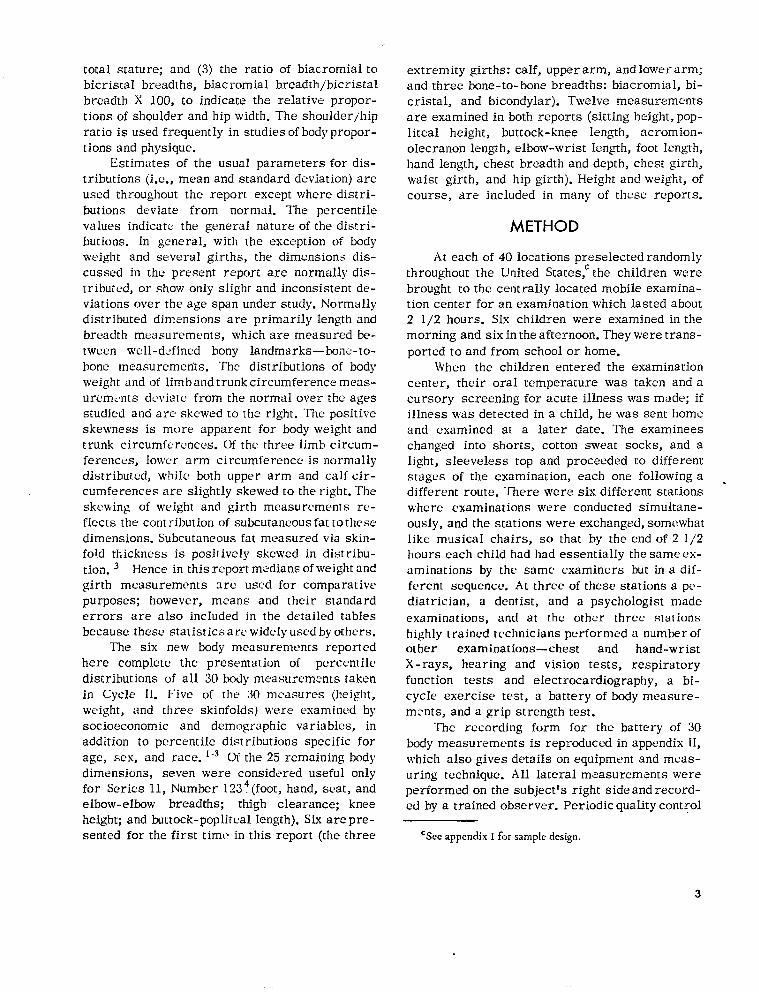
Median vahtes for Uppev arm girth are consistently larger in white boys and girls from 6 through 11 years (figure 18, table 19), and the difference between medians at each age is rather consistent. The significance of differences be-tween Negro and white children for this girth measurement will be considered in the discussion. In lower arm girth, medians for white boys are slightly though consistently larger than those for Negro boys from 6 through 11 yearsofage. White girls have larger lower arm girth medians at 6, 7, and 8 years of age, but from 9 through 11 years
11
22r
or-- 7l 8 I’
9 I
10 I
11 I
12 I6
AGE
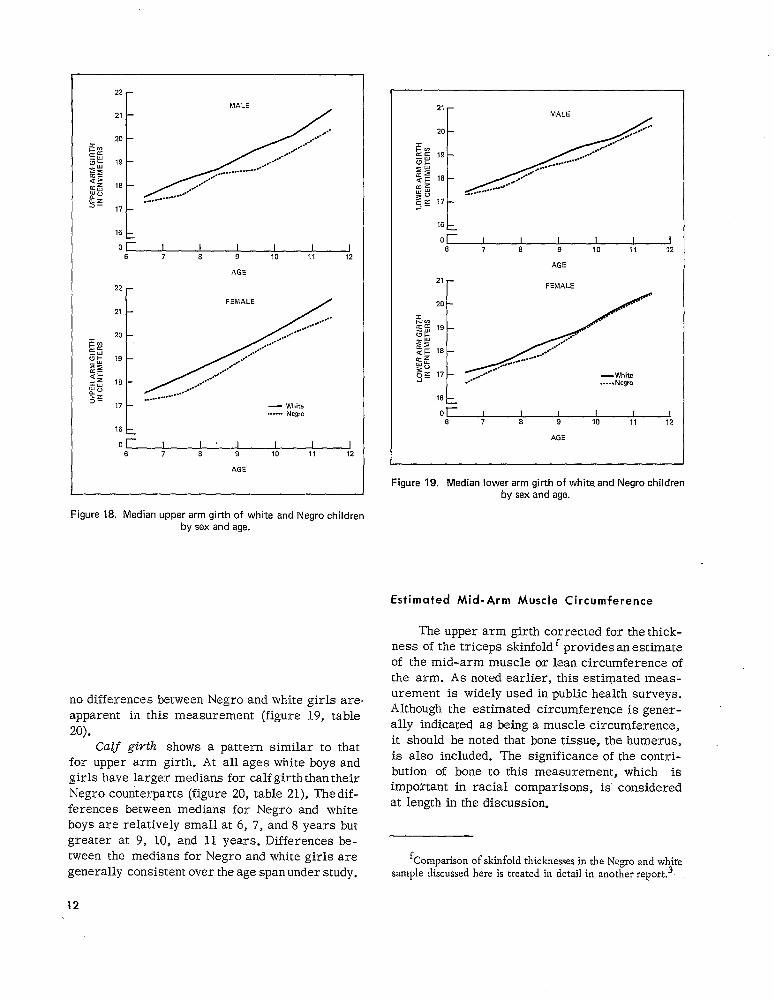
Figure 18. Median upper arm girth of white and Negro children by sex and age.
no differences between Negro and white girls are. apparent in this measurement (figure 19, table 20).
Calf girth shows a pattern similar to that for upper arm girth. At all ages white boys and girls have larger medians for calf girth than their Negro counterparts (figure 20, table 21). Thedifferences between medians for Negro and white boys are relatively small at 6, 7, and 8 years but greater at 9, 10, and 11 years. Differences be-tween the medians for Negro and white girls are generally consistent over the age span under study.
21 FEMALE
-White .-...Negro
or I I I I I I6 7 8 9 10 11 12
AGE
Figure 19. Median lower arm girth of white and Negro children by sex and age.
Estimated Mid-Arm Muscle Circumference
The upper arm girth corrected for the thickness of the triceps skinfold f provides an estimate of the mid-arm muscle or lean circumference of the arm. As noted earlier, this estimated measurement is widely used in public health surveys. Although the estimated circumference is generally indicated as being a muscle circumference, it should be noted that bone tissue, the humerus, is also included. The significance of the contribution of bone to this measurement, which is impoftant in racial comparisons, is considered at length in the discussion.
fCompa.rison of skinfold thicknessesin the Negro and white samplediscussedhere is treatedin detail in anotherreport.3.
12

MALE
AGE
AGE
Figure 20. Median calf girth of white and Negro children by sex and age.
Differences in estimated muscle or lean circumference of the arm between Negro and white children of both sexes are small; nevertheless, they are consistent. Negro boys and girls have, on the average, consistently larger estimated muscle or lean circumference of the arm than whites from 6 through 11 years (figure 21, table 22). Thus the larger upper arm girth of white children noted earlier appears to be due to more subcutaneous fat at the triceps site in white children from 6 through 11 years.
Torso Girths
White children of both sexes have consistently larger median values for chest .@9h than Negro children from 6 through 11 years of age (figure 22, table 23). W ith the exception of the
i or I I I 1 I I6 7 a 9 10 11 12
4GE
lgr FEM4LE
or- I I I I I 1 6 7 a 9 10 11 12
AGE
Figure 21. Mean estimated mid-arm muscle circumference of white and Negro children by sex and age.
‘7
=t 0r I I I I I I
6 7 a 9 10 11 12
AGE
73 r FEMALE
or I I I I I I 6 7 a 9 10 11 12
AGE
Figure 22. Median chest girth of white and Negro children by sex and age.
13

65 r MALE
or I I I I I I 6 7 6 9 10 11 12
AGE
Y-- FEMALE
0r I I I I I I 6 7 8 9 10 11 12
AGE
Figure 23. Median waist girth of white and Negro children by sex and age.
,,,,6 7 8 9 10 11 12
AGE
60 r FEMALE
75
60 - White .-.--. Negro
55
0 6 9 10 11 12
AGE
Figure 24. Median hip girth of white and Negro children by sex and age.
9-year-old sample, white boys also have larger waist girth measurements than Negro boys (figure 23, table 24). Differences in median values for waist girth between Negro and white girls, how-ever, are not consistently apparent over the ages studied. Hip gidh shows a pattern similar to that for chest girth: white boys and girls have consistently larger medians for this measurement from 6 through 11 years of age (figure 24, table 25). Median values for both chest and hip girths in girls show a pattern of decreasing racial differences with increasing age; so at 10 and 11 years of age differences between medians are small. These observations are probably related to the greater overall body size of Negro girls at these ages.
DISCUSSION
Patterns of growth as shown in a series of anthropometric dimensions and indexes were analyzed in a large, representative sample of U.S. Negro and white children 6 through 11 years of age. The data are cross-sectional (i.e., different children are represented at each age level) and are thus affected by the limitations of cross-sectional studies. In addition, emphasis is placed on comparisons of mean or median values for Negro and white children, despite considerable overlap between races in each age and sexgroup. Nevertheless, the present data provide updated anthropometric information which are reliable estimates of American Negro and white children of both sexes during middle childhood.
The Cycle II data for Negro and white children generally agree with existing data for con-temporary as well as for earlier samples. It is, however, difficult to make precise comparisons with most other studies on account of sampling and other methodological differences. One difference is that the HES data are grouped by chronological age, and so the average age is the mid-point of the year. For example, 6-year-old children range from 6.00 to 6.99 years, with the mean at approximately 6.5 years. In two recent studies of Negro and white children which include theage period under study>7118’children are grouped into yearly categories, with the whole year as the mid-point. In those studies 6-year-olds are classified as children aged 5.50 to 6.49 years, with the mean
14

at approximately 6,O years. Each of the two procedures refers to the 6-year-old age group, but the definitions are different.
Other technical difficulties in making comparisons relate to definition of sites and techniques of measurement. For example, upper extremity measurements used in the present report were made between specific landmarks (e.g., acromion to olecranon). Krogman’s measurements of upper extremity segments were derived by subtraction of measurements made at specific landmarks above floor level; for instance, acromial height minus radial height gives upper arm length. l7
It should be further noted that buttock-knee length and popliteal height, two of the measurements used in this report to partition the segments of the lower extremity, are essentially human engineering measurements. Because these measurements are made from surface to surface with light contact, they are confounded to some extent by variation in soft tissues. Therefore
’buttock-knee length and popliteal height provide only an approximation of actual segmental lengths and are not as precise as measurements using traditional bony landmarks.
Although there are some overall body size differences between Negro and white children during middle childhood, especially in girls, the major anthropometric differences between American Negro and white children are essentially in the proportions of the trunk and limbs. In comparison with white children, Negro children have shorter trunks, more slender hips and chests, longer lower extremities (especially a longer lower leg), and longer upper extremities (especially a longer forearm and hand). Conversely, in comparison with Negro children, white children have longer, thicker trunks, wider hips, shorter lower extremities, and shorter upperextremities. These dimensional and proportional differences between American Negro and white children were noted as far back as 1929 by Todd,i9 and are well documented in other studies of children and adults.‘7P20-24Further, such proportional differences have been reported to occur prenatally during the first trimester. 25-27 This implies that genetic factors affect skeletal dimensions: onets racial background predisposes the skeleton to certain proportions.
In an attempt to assess racial differences in the limb segments comprising the upper andlower extremities, the normal deviates for these segments were analyzed. For each age and sex group, the normal deviate
was computed. Instead of its usual use in statements of probability levels, this measure is used here as an indicator of reIative magnitudes. The larger the deviate, the greater the difference between whites and Negroes, since by dividing by the standard error of the difference, the problem of difference in relative magnitude is eliminated. Results of this analysis are presented in table 26.
A distinct pattern suggesting a proximal-distal gradient emerges for the three segments of the upper extremity. Differences between Negro and white children are least marked for the upper arm segment (acromion-olecranon length) and most marked for hand length, with the values for the forearm segment (elbow-wrist length) being intermediate. This pattern of racial differences for the upper limb segments is apparent in all age groups except the a-year-old boys and girls, in whom the deviation from a proximal-distal pattern was very slight.
In contrast to the proximal-distal gradient of racial differences in the upper limb segments, there is no consistently apparent pattern for the segments of the lower extremity in boys. The pattern for girls, however, is similar to that noted for the upper extremity (table 26); Differences between Negro and white children of both sexes are consistently least marked for thigh length (buttock-knee length). The pattern of differences for the lower leg and foot is not clear in boys. In all but one age group of girls (the 9-year-old group), however, racial differences are most marked for foot length, with the value for lower leg length (popliteal height) being inter-mediate.
The preceding observations on the lower extremity are in part a function of the measurements used and in part a function of the mechanics of the lower extremity. It should be carefully noted that two of the measurements of lower ex-
15

tremity segments are only indirect measures of segment length. Buttock-knee length, for example, is affected to some extent by the deposition of subcutaneous fat on the buttocks and also includes the thickness of the patella or knee cap. (See appendix II for discussion of measurement methods.) Hence it is not a true measure of thigh or femoral length. Similarly, popliteal height is an indirect measure of lower leg length. Because it is measured as the distance from the footrest to the popliteal fossa, it includes not only the tibia, the major bone of the lower leg, but also the bones of the ankle, especially the talus and calcaneus. Thus this measurement is not an accurate indicator of lower leg length per se.
In addition to measurement technique, the functional mechanics of the upper and lower extremities limit direct comparisons of their respective segment lengths. The foot, for example, is adapted as a weight-bearing unit in the upright posture, while the hand is adapted as primarily a prehensile organ, Thus the foot joins the remainder of the lower extremity at a 90-degree angle, while the hand is a continuous extension of the forearm.
Racial differences in girths are affected to a large extent by variation inamount of subcutaneous fat. This is especially apparent for upper arm girth. When corrected for the thickness of the triceps skinfold, the difference between Negro and white children in upper arm girth is seen to be due to an excess of triceps fat in white children. Comparing figures 18 (upper arm girth) and 21 (estimated muscle circumference of the arm), one can note a reversal in the positions of Negro and white children. White children have consistently larger arm girths, but Negro children have consistently larger estimated muscle or leancircumferences of the arm. Similar observations have been made by Malina,18 for a sample of Negro and white Philadelphia elementary school children studied longitudinally over a l- year period.
As indicated earlier, correcting the upper arm girth for the thickness of the triceps skin-fold results in what is generally termed the estimated mid-arm muscle circumference. The significance of the contribution of bone tissue to this estimated circumference is important in making racial comparisons. Data comparing the
breadth of the humerus (determined from a radiograph) in Negro and white children are lacking. Garn” and Smith and Risek,” however, reported little difference in periosteal diameters of the second metacarpal, but did note greater cortical bone thickness among adult Negroes of both sexes than among the corresponding white groups. This seems to suggest that adult Negroes have more cortical bone for the same periosteal diameter of bone. However, it is difficult to make inferences from measurements of second metacarpal width to the humerus; results of a study comparing radiographic bone breadth measurements of the second metacarpal, second metatarsal, humerus, and tibia indicated little predictive relationship from one bone to the other in a sample of white children aged 6 to 16.30>31
It is difficult to make inferences from one skeletal area to another. The available data on bone width measurements of the second metacarpal indicate little consistent racial difference, if any, in total width at the midshaft level. If the same is true for the humerus, the corrected arm circumference data would then indicate slightly but consistently greater muscularity in the upper arms of Negro compared with white children. Data from samples of Olympic athletes indicate a generally similar trend. Using radiographic techniques, Tanner 21 found that Negro athletes had slightly more muscle and bone tissue and less fat in the upper arm and thigh compared to white athletes; although in the calf they also had less fat and more bone tissue, they had less muscle than whites. Thus this sample of Negro athletes had substantially smaller calf muscles relative to muscular development in the arm and thigh than did white athletes.
Special -consideration should be given to the comparison of Negro and white girls. On the average, Negro girls are taller than white girls from 6 through 11 years of age and are heavier at 10 and 11 years of age. Cycle II data also show a reduction in the difference between median girths of Negro and white girls at ages IO and 11. It would be interesting to find out if there is a,maturational difference between Negro and white girls at these ages. Malina, 32 for example, noted Negro girls advanced over white girls in skeletal maturity from 9 through 12 years of age. Todd33 in 1931 reported somewhat similar observations,
16

noting greater variability between Negro and white girls than between boys. Todd’s small sample of Negro girls (r1=72) were frequently skeletally advanced compared to his larger sample of white girls.
The report assessing skeletal maturity of the Cycle II sample of children 6-11 years of age, which is currently in preparation, will contribute substantially to this question.
SUMMARY
Patterns of growth in 20 measured anthropometric dimensions, two derived dimensions, and three ratios are reported and discussed for U.S. white and Negro children 6 through 11 years of age. The 20 dimensions reported by age, sex, and race are weight, stature, sitting height, buttock-knee length, popliteal height, foot length, acromion-olecranon length, elbow-wrist length, hand length, biacromial breadth, bicristal breadth, bicondylar breadth of the femur, chest breadth, chest depth, upper arm girth, lower arm girth, calf girth, chest girth, waist girth, and hip girth. The two dimensions derived from available measurements are estimated leg (subischial) length and estimated mid-arm muscle circumference. The three ratios are the ponderal index, the ratio of sitting height to stature, and the ratio of biacromial (shoulder) to bicristal (hip) width.
These national estimates are based on cross-sectional data, which limit the analyses to attained size rather than velocities of growth. Emphasis is place upon comparisons of age- and sex-specific’means and medians for Negro and white children.
All dimensions reported here increase almost linearly with age from 6 through 11 years in Negro and white children, both male and female. Although there are some overall body size differences (height and weight) between Negro and
000
white children during middle childhood, especially in girls, the major anthropometric differences between Negro and white children are differences in the proportions of the trunk and limbs. Negro children, on the average, have shorter trunks, more slender hips and chests, longer lower extremities (especially longer lower iegs), and longer upper extremities (especially longer fore-arms and hands) than white children. White children, conversely, tend to have longer, thicker trunks, wider hips, and shorter lower and upper extremities than Negro children.
Limb (arm, forearm, and calf) and torso (chest, waist, and hip) girths are generally larger in white children over the age range studied. There are, nevertheless, exceptions, and the differences between Negro and white childrenare not apparent over all ages from 6 through 11 years. For in-stance, Negro girls are taller and heavier than white girls, especially at 10 and 11 years, and this is reflected in a reduction of median girth differences between Negro and white girls at these ages. Much of the racial difference in girths is explained by differences in the amount of sub-cutaneous fat. This is especially apparent for arm girth; when the arm circumference is corrected for the thickness of the triceps skinfold, it is obvious that the girth differences between Negro and white children are due essentially to alarger amount of triceps fat in white children. In fact, when corrected for the thickness of the t,riceps skinfold, estimated mid-arm muscle (including bone) circumference is consistently larger in Negro children.
The conclusions derived from these HES data generally agree with most other anthropometric comparisons of American white and Negro children; the statistics provide current, comprehensive, and reliable national estimates of body dimensions for American Negro and white children of both sexes during middle childhood.
-
17

REFERENCES
‘National Center for Health Statistics: Height and weight of children, United States. Vital and Health Statistics. PHS Pub. No. lOOO-Series 11-No. 104. Public Health Service. Washington. U.S. Government Printing Office, Sept. 1970.
‘National Center for Health Statistics: Height and weight of children: socioeconomic status, United States. Vital and Health Stattitics. Series 11-No. 119. DHEW Pub. No. (HSM) 73-1601. Washington. U.S. Government Printing Office, Oct. 1972. l
‘National Center for Health Statistics: Skinfold thickness of children 6-11 years, United States. Vital and He&k Statistics. Series II-No. 120. DHEW Pub. No. (HSM) 73-1602. Washington. U.S. Government Printing Office, Oct. 1972.
‘National Center for Health Statistics: Selected body measurements of children 6-l 1 years, United States. Vital and Health Statistics. Series 11-No. 123. DHEW Pub. No. (HSM) 73-1605. Washington. U.S. Government Printing Office, Jan. 1973.
‘National Center for Health Statistics: Plan and initial program of the Health Examination Survey. Vital and Health Statistics. PHS Pub. No. IOOO-Series l-No. 4. Public Health Service. Washington. U.S. Government Printing Office, July 1965.
‘National Center for Health Statistics: Cycle 1 of the Health Examination Survey, sample and response, United States, 1960-1962. Vita! and Health Statistics. PHS Pub. No. 1000~Series 1 l-No. 1. Public Health Service. Washington. U.S. Government Printing Office, Apr. 1964.
‘National Center for Health Statistics: Plan, operation, and response results of a program of children’s examinations. Vital and Health Statistics. PHS Pub. No. 1000~Series l-No. 5. Public Health Service. Washington. U.S. Government Printing Office, Oct. 1967.
‘National Center for Health Statistics: Plan and operation of a Health Examination Survey of U.S. youths 12-17 years of age. Vital and Health Statistics. PHS Pub. No. 1000~Series I-No. 8. Public Health Service. Washington. U.S. Government Printing Office, Sept. 1969.
‘Jelliffe, D. B.: The assessment of the nutritional status of the community. WHO Monog. Ser. No. 53, 1966.
“Jelliffe, D. B.: The arm circumference as a public health index of protein-caloric malnutrition of early childhood, in E. F. Jelliffe and D. B. Jelliffe, eds., J. Trap. Pediutr. Mon,ograph No.8. 15:177-260, 1969.
l1 Robinow, M.: Field measurement of growth and development, in N. S. Scrimshaw and J. E. Gordon, eds., Illalnutri-Con, Learning and Behavior. Cambridge, Mass. The M.I.T. Press, 1968. pp. 409-424.
“Herskowitz, M. J.: The American Negro, a Study in Racial Crossing. New York. A1fred.A. Knopf, 1928.
’ ‘Glass, B., and Li, C. C.: The dynamics of racial intermixture-an analysis based on the American Negro. Am. J. Hum. Genet. 5:1-20, 1953.
14Roberts, D. F.: The dynamics of racial intermixture in the American Negro-some anthropological considerations. Am. J. Hum. Genet. 7:361-367, 1955.
’5 Roberts, D. F., and Hioms, R. W.: The dynamics of racial intermixture. Am. J. Hum. Genet. 14:261-277, 1962.
IbReed, T. E.: Caucasian genes in American Negroes. Science 165(3895):762-768, Aug. 22, 1969.
’ 7Krogman, W. M.: Growth of head, face, trunk, and limbs in Philadelphia white and Negro children of elementary and high school age. Monogr. Sot. Res. Child Deu. 35(3), Serial No. 136,197O.
18Malina, R. M., Growth, Maturation, and Performance of Philadelphia Negro and White Elementary School Children. Unpublished doctoral dissertation, University of Pennsylvania, Philadelphia. 1968.-
“Todd, T. W.: Entrenched Negro physical features. Hum. Viol. 1:57-69, 1929. .I
20Metheny, E.: Some differences in bodily proportions between American Negro and white male college students as related to athletic performance. Res. Q. 10:41-53, 1939.
21’ranner, J. M.: The Physique of the Olympic Athlete. London. George Allen and Unwin, 1964.
22Malina, R. M.: Growth and physical performance of American Negro and white children. Clin. Pediutr. 8(8):476-483, Aug. 1969.
23Malina, R: M.: Biological substrata, in K. S. Miller and R. M. Dreger, eds., Comparatiue Studies of Blacks and Whites in the United States. New York. Seminar Press, 1973. pp. 53-123.
**Long, L., and Churchill, E.: Anthropometry of USAF Male Basic Trainees-Contrasts of Several Subgroups. Paper pre-pared for a meeting of the American Association of Physical Anthropologists, 1968. Mimeographed.
25Schultz, A. H.: Fetal growth in man. Am. J. Phys. Anthropal. 6:389-399, 1923.
26Schultz, A. H.: Fetal growth of man and other primates. Q. Rev. Biol. 1:465-521, 1926.
27Schultz, A. H.: Proportions, variability and asymmetries of the long bones of the l imbs and the clavicles in man and apes. Hum. Biol. 9:281-328, 1937.
28Gam, S. M.: The course of bone gain and the phases of bone loss. O&hop. Clin. North Am. 3:503-520, 1972.
2gSmith, R. W., Jr., and Risek, J.: Epidemiologic studies of osteoporosis in women of Puerto Rico and SoutheasternMichigan with special reference to age, race, national origin and to other related or associated findings, Clin. Orthop. 45:31-48, 1966.
18

30Johnston, F. E., and Malina, R. M.: Correlations of mid-shaft breadths and compact bone thickness among bones of the upper and Iower extremities of children aged 6 to 16 years. Am. J. Phys. Anthropol. n.s. 32:32-327, 1970.
31h~lalina, R. hl.: Quantification of fat, muscle and bone in man. Clin. Orthop. 65:9-38, 1969.
“Malina, R. M.: Skeletal maturation studied longitudinally over one year in American whites and Negroes six through thirteen years of age. Hum. Biol. 42(3):377-390, Sept. 1970.
33Todd, T. W.: Differential skeletal maturation in relation to sex, race, variability and disease. Child Dev. 2:49-65, 1931.
34Nationaf Center for Health Statistics: Replication: An approach to the analysis of data from complex surveys. V’itaI nnd Health Statistics. PHS Pub. No. 1000~Series ~-NO. 14. Public Health Service. Washington. U.S. Government Printing Office, Apr. 1966.
35 Hertzberg, I-I. T. E.: The Conference on Stamiartiization of Anthropometric Techniques an? Terminology. Am. J. Pkys. Antkropol. 28(l): l-16, Jan. 196%
36National Center for Health Statistics: Quality control in a National Health Examination Survey. Vital and IIealtk Statistics. Series ~-NO. 44. DHEW Pub. No. (HSM) 72-1023. Washingon. U.S. Government Printing Office, Feb. 1972.
19

LIST OF DETAILED TABLES
Page
Table 1. Weight of children by race, sex, and age at last birthday: sample size, mean,standard deviation, standard error of the mean, and selected percentiles, UnitedStates, 1963-65----------------------------------------------------------------- 22
2. Height of children by race, sex, and age at last birthday: sample size, mean,standard deviation, standard error of the mean, and selected percentiles, United states, 1963-65----------------------------------------------------------------- 23
3. Ponderal index of children by race, sex, and age at last birthday: sample size, mean, standard deviation, standard error of the mean, and selected percentiles,Unit-d St-t-s, 1963-65---------------------------------------------------------- 24
4. Sitting height of children by race, sex, and age at last birthday: sample size, mean, standard deviation, standard error of the mean, and selected percentiles,United States, 1963-65------------------------------ ---------------------------- 25
5. Subischial length of children by race, sex, and age at last birthday: samplesize,mean, standard deviation, standard error of the mean, and selected percent-iles, United States, 1963-65------------------------ ---------------------------- 26
6. Sitting height/stature ratio (times 100) of children by race, sex, and age at last birthday: sample size,mean, standard deviation, standard error of the mean, and selected percentiles, United States, 1963-65 -------------------------------- 27
7. Buttock-knee length of children by race, sex, and age at last birthday: samplesize, mean, standard deviation,standard error of the mean,' and selected percent-iles, United Stat-s, 1963-65---------------------------------------------------- 28
8. Popliteal height of children by race,sex, and age at last birthday: sample size,mean,standard deviation, standard error of the mean, and selected percentiles,United States, 1963-65 ______________-_____-------------------------------------- 29
9. Foot length of children by race, sex, and age at last birthday: sample size, mean, standard deviation, standard error of the mean, and selected percentiles,United States, 1963-65---------------------------------------------------------- 30
10. Acromion-olecranon length of children by race, sex, and age at last birthday:sample size, mean, standard deviation, standard error of the mean, and selectedpercentiles, United Stat-s, 1963-65--------------------------------------------- 31
11. Elbow-wrist length of children by race, sex, and age at last birthday: samplesiqmean, standard deviation, standard error of the mean, and selected percent-iles, United States, 1963-65------------------------- ---------^----------------- 32
12. Hand length of children by race, sex, and age at last birthday: sample size, mean, standard deviation, standard error of the mean, and selected percentiles,United States, 1963-65------------------------ _____-------------^--------------- 33
13. Biacromial breadth of children by race, sex, and age at last birthday: samplesize, mean, standard deviation, standard error of the mean, and selected per-centiles, United States, 1963-65--------------------- --------------------------- 34
14. Bicristal breadth of children by race, sex, and age at last birthday: sample size, mean, standard deviation,standard error of the mean, and selected percent-iles, hited States, 1963-65---------------------- ------------------------------ 35
15. Biacromial breadthlbicristal breadth ratio (times 100) of children by race, sex,and age at last birthday: sample size, mean, standard deviation, standard error of the mean, and selected percentiles, United States, 1963-65------------------- 36
16. Chest breadth of children by race, sex, and age at last birthday: sampie size, mean, standard deviation, standard error of the mean, and selected percentiles,Unit-d States, 1963-65---------------------------------------------------------- 37
20

LIST OF DETAILED TABLES-Con.
Table 17.
18.
19.
21.
22.
23.
24.
25.
26.
Chest depth of children by race, sex, and age at last birthday: sample size, mean, standard deviation, standard error of the mean, and selected percentiles,United States, 1963-65----------------------------------------------------------
Bicondylar breadth of the femur of children by race, sex, and age at last birth-day: sample size, mean, standard deviation, standard error of the mean, and selected percentiles, United States, 1963-65------------------------------------
Upper arm girth of children by race, sex, and age at last birthday: sample size, mean, standard deviation, standard error of the mean, and selected percentiles,United St-t-s, 1963-65----------------------------------------------------------
Lower arm girth of children by race, sex, and age at last birthday: sample size, mean, standard deviation, standard error of the mean, and selected percentiles,United States, 1963-65----------------------------------------------------------
Calf girth of children by race,sex, and age at last birthday: sample size, mean,standard deviation, standard error of the mean, and selected percentiles, UnitedStates, 1963-65-----------------------------------------------------------------
Estimated mid-arm muscle circumference of children by race, sex, and age at last birthday: sample size, mean, standard deviation, standard error of the mean, and selected percentiles, United States, 1963-65------------------------------------
Chest girth of children by race, sex, and age at last birthday: sample size, mean, standard deviation, standard error of the mean, and selected percentiles,United States, 1963-65----------------------------------------------------------
Waist girth of children by race, sex, and age at last birthday: sample size, mean, standard deviation, standard error of the mean, and selefted percentiles,United States, 1963-65----------------------------------------~-----------------
Hip girth of children by race, sex, and age at last birthday: sample size, mean,standard deviation, standard error of the mean, and selected percentiles, UnitedStates, 1963-65-----------------------------------------------------------------
Normal deviates of differences between measurements of various components of the extremities of white and Negro children and ranking of normal deviates within sex and age groups--------------------------------------------------------------
Page
38
39
40
41
42
43
44
45
46
47
21

Table 1. Weight of children by race, sex, and age at last birthday: sample size, mean, standarddeviation, standard error of the mean, and selected percentiles, United States, 1963-65
Percentile Race, sex, and age n N x s s-,
5th 10th 25th 50th 75th 90th 95th
WRITE In kilograms
Boys 6 years----------------- 489 1,787 22.0 3.39 0.18 17.4 18.2 19.9 23.7 25.97 years----------------- 551 1,781 24.8 4.11 0.21 19.4 20.5 22.2 2: 26.7 29.88 years----------------- 537 1,739 27.8 5.03 0.25 21.3 22.5 24.5 2711 29.9 34.1 g years----------------- 525 1,730 31.4 6.91 0.47 23.5 24.6 26.9 29.9 38.710 years---------------- 509 1,692 33.9 6.63 0.30 25.5 26.8 29.6 32.7 %!: 42.3 11 years---------------- 542 1,662 38.6 8.32 0.40 28.8 30.1 33.2 36.7 42:3 49.1
Girls
6 years----------------- 461 1,722 21.6 3.79 0.25 16.4 17.5 19.3 21.1 23.3 25.9 28.97 years----------------- 512 1,716 24.3 4.17 0.20 18.7 19.5 21.4 23.5 26.5 29.9 31.68 years----------------- 498 1,674 5.21 0.26 20.8 21.9 23.9 26.8 30.1 34.4 37.9 9 years----------------- 494 1,663 %X 6.84 0.42 22.8 24.3 26.6 29.9 34.6 41.8 45.7 10 years---------------- 505 1,632 35:o 7.97 0.44 24.8 26.2 34.1 39.4 11 years---------------- 477 1,605 39.8 8.75 0.36 28.6 30.0 E . 38.2 44.9 zi . % .
NEGRO
Boys 6 years----------------- 84 289 21.8 3.21 0.37 17.5 18.1 19.5 21.3 23.4 26.4 28.27 years----------------- 286 24.0 2.89 19.4 20.1 21.9 24.0 26.2 28,l 28.88 years -__-__-___ ---_--- :; 279 27.5 3.67 x5 22.4 22.9 24.9 27.2 29.4 31.9 34.4 9 years----------------- 269 29.4 5.57 0177 21.8 22.9 28.5 32.2 37.3 39.7 10 years---------------- ;t 264 32.4 5.36 0.72 26.4 z 42.2 11 years---------------- 83 255 36.8 6.29 0.50 f:+ . 29.5 32:4 21". %:: ";:*:. 48.7-.
Girls 6 years----------------- 281 21.1 2.95 0.36 15.9 19.0 21.2 22.7 24.8 26.37 years----------------- ;: 284 23.7 3.97 0.47 19.2 z*; 21.1 22.8 25.6 28.4 30.38 years----------------- 113 281 27.0 6.05 0.37 19.3 20:4 22.4 26.1 29.7 34.5 38.3 g years----------------- 84 265 31.2 6.74 0.62 23.0 24.6 26.5 29.4 34.6 42.0 44.8 10 years---------------- 266 35.7 9.02 0.89 25.2 26.3 29.0 34.4 39.5 48.1 11 years---------------- ;1 253 41.1 1.51 1.45 27.4 28.6 33.3 38.4 46.0 59.3 '69";.
NOTE: 1~~=sample size; Nzestimated number of children in population in thousands; Af =mean;s = standard deviation; SP -standard error of the mean.
22

Table 2. Height of children by race, sex, and age at last birthday: sample size, mean, standarddeviation, standard error of the mean, and selected percentiles, United States, 1963-65
PercentileRace, sex, n N x s s,-.
5th 10th 25th 50th 75th 90th 95th
In centimeters
6 years----------7 years----------8 years----------9 years----------10 years---------11 years---------
1,787 1,7811,7391,730 1,692 1,662
118.5 124.5129.8135.5140.3 145.7
5.15 5.52 5.70 6.77 6.626.69
0.30 0.38 0.29 0.50 0.37 0.30
110.4 111.7 115.0115.5 117.7 120.8
123.1 126.2:22 126.9 131.6129: 4 131.6 136.4134.6 137.3 141.1
118.4 124.3 129.7 :2;- : 145:B
121.8
EE140:2 144.6 150.5
125.7 131.8137.1143.4148.5 154.2
127.8134.4138.8145.4 151.3 156.9
Girls 6 years----------7 years----------8 years----------9 years----------10 years---------11 years---------
1,722 1,716 1,674 1,663 1,632 1,605
117.7 123.4129.4135.1 140.8 147.3
5.47 5.86 6.19 6.72 7.00 7.89
0.32 0.17 0.39 0.36 0.34 0.27
108.3 110.4 114.4 113.5 116.2 119.6
121.4 125.6K 127.1 130.6 129: 6 132.1 135.7 135.1 138.7 142.7
x 129: 7 135.3 140.7 147.3
121.5127.2133.5 139.6 145.6 152.5
124.6 130.5 137.1 144.4 149.7 157.4
126.4132.7 138.9 145.9 152.7 159.4
and age
NEGRO
Boys ij years---------- 119.1 5.11 0.72 111.3 112.7 115.4 118.6 122.8 125.5 129.5 7 years---------- “2% L25.2 5.50 0.59 118.4 121.3 124.8 129.9 131.9 134.58 years---------- 279 L31.3 5.33 0.57 ::z 125.0 127.7 130.8 134.8 139.4 140.7 9 years---------- 269 135.0 6.46 0.67 125:3 127.1 130.5 135.0 139.8 143.5 144.7 10 years--------- 264 139.6 7.92 0.97, 127.8 129.7 133.4 140.6 144.5 151.6 11 years--------- 255 145.7 8.08 0.50 134.5 136.1 141.6 146.0 149.8 :2*: . 159.2
Girls 6 years---------- 281 5.75 0.86 106.5 111.7 114.6 118.5 122.5 126.5 127.5 7 years---------- E-6 5.55 115.7 117.6 120.3 125.1 128.2 131.68 years---------- % 129:4 6.69 “0% 118.7 120.8 124.5 132.8 138.8 :2"2-1 9 years---------- 265 7.80 0:90 125.3 132.8 ::x 142.6 149.8 15O:B 10 years--------- 266 :2:*2 9.25 0.65 129.2 z:: 138.3 142:l 146.4 155.0 155.9 11 years--------- 253 149: 2 7.42 0.69 136.2 140:3 144.5 148.4 154.8 160.4 161.7
NOTE: ?l = sample size; N= estimated number of children in popuLation in :housands; x= mean;5 = standard deviation; Sji= standard error of the mean.
23

----
Table 3. Ponderal index of children by race, sex, and age at last birthday: sample size, mean,standard deviation, standard error of the mean, and selected percentiles, United States, 1963-65
Percentile Race, sex, and age n N x s 5;
5th 10th 25th 50th 75th 90th 95th -
WHITE Ponderal index
Boys
(j years-----------------7 years-----------------8 years-----------------9 years-----------------10 years----------------
489 551 537 525 509
1,787L,781
:% 1:692
12.8 12.9 13.0 13.1 13.2
0.41 0.44 0.48 0.60 0.53
0.02 0.02 0.02 0.05 0.02
12.0 12.1 12.0 12.1 12.0 12.2 11.9 12.1 12.1 12.2
12.4 12.7 12.4 12.9 12.6 12.6 3 12.8 1313
13.3 13.5 13.6 13.6 13.7
13.7 13.8 13.8 13.9 13.9
13.8 13.9 13.9 13.9
11 years---------------- 542 1,662 13.1 0.60 0.03 12.0 12.2 12.7 13.3 13.6 13.9 % .
Girls
6 years----------------- 461 L,722 12.8 0.45 0.02 12.0 12.1 12.4 12.8 13.3 13.77 years----------------- 512 1,716 12.9 0.50 0.03 12.0 12.1 12.4 12.9 13.5 13.8 %E8 years-------- --_-_ 498 13.0 0.55 0.03 12.0 12.1 12.5 13.6 13.8 13:9 9 years-------- _--- - --__ 494 xz 0.03 11.9 12.1 12.5 23 13.6 13.9 14.0 10 years---------------- 505 L:632 :E! FE38 0.03 11.9 12.2 12.6 1312 13.6 13.9 14.0 11 years---------------- 477 1,605 13:1 0:68 0.03 11.9 12.1 12.6 13.2 13.7 14.0 14.4
NEGRO
Boys 6 years----------------- 84 289 12.9 0.36 0.03 12.1 12.2 12.5 13.0 13.4 13.6 13.77 years----------------- 286 13.1 0.37 0.05 12.5 12.6 12.8 13.2 13.6 13.9 14.08 years----------------- :z 279 13.2 0.36 0.03 g; 12.6 12.9 13.3 13.7 13.9 14.0 9 years----------------- 269 13.3 0.07 12.4 13.7 13.9 14.1 10 years---------------- i-2 264 13.3 E 0.06 12:o 12.3 E E*: 13.8 14.0 14.3 11 years---------------- 83 255 13.3 0:65 0.06 12.1 12.4 13:o 13:4 13.8 14.0 14.2
Girls
6 years----------------- 281 13.0 0.34 0.05 12.3 12.4 12.6 13.0 13.4 13.6 13.77 years----------------- Zf 284 13.2 0.48 0.04 12.1 12.2 12.8 13.3 13.6 13.8 13.98 years----------------- 113 281 0.57 11.8 12.1 12.6 13.2 13.6 13.9 9 years----------------- 84 265 :z-: k% 12.1 12.4 13.0 13.4 14.0 :t*iL! 10 years---------------- 266 13:1 EE 0107 11.2 12.0 13.3 Ez 14.1 14:311 years- -__-----_--_--- 2 253 13.2 0174 0.09 11.6 12.1 3 . L 13.4 13:8 14.1 14.3
NOTE: n = sample size; N=estimated number of children in population in thousands; X - mean;S = standard deviation; s,- = standard error of the mean.
In computing this ratio height is expressed in inches and weight in pounds, which produces a different result than would the use of metric measures.
24

Table 4. Sitting height of children by race, sex, and age at last birthday: sample size, 1963-65standard deviation, standard error of the mean, and selected percentiles, United States,
mean, -
I Percentile
Race, sex, and age n iv x s sjz 5th 10th 25th 50th 75th 90th 95th
WHITE In centimeters
Boys 6 years-----------------7 years-----------------8 years-----------------9 years-----------------10 years----------------11 years----------------
489551 537 525
z;
1,7871,7811,7391,730
xi;,
65.0 67.2 69.571.6 73.3 75.6
2.682.74 2.94 3.153.073.10
0.130.15 0.12 0.19 0.200.13
60.463.065.1 66.4 68.370.6
61.464.C 65.7 67.4 ;;:;
63.2 65.467.6 69.6 71.473.5
65.167.2 69.6 71.6 73.375.5
66.7 68.9 71.5 73.775.4 77.7
68.570.873.3 75.6 77.3 79.6
69.771.8 74.376.7 78.780.7
Girls 6 years-----------------7 years-----------------8 years-----------------9 years-----------------10 years----------------11 years----------------
461 512 498 494505477
1,7221,7161,6741,6631,6321,605
64.266.4 68.871.1 73.576.5
3.00 2.99 2.893.19 3.393.96
0.180.12 0.13 0.170.14 0.15
59.2 61.563.7 65.868.2 70.4
60.462.6 64.867.1 69.2 72.0
62.3 64.367.1 68.971.1 74.2
64.3
z-z 71:1 73.576.2
66.1 68.470.8 73.4 75.778.8
68.2 70.472.4 75.377.681.6
69.1 71.473.3 76.379.1 83.7
NEGRO
Boys 6 years----------------- 289 63.2 2.48 0.35 59.2 59.7 63.2 64.8 68.17 years----------------- 782 286 65.6 2.58 0.29 61.6 62.3 z-2 65.6 67.5 70.18 years----------------- 279 67.8 2.81 0.29 63.5 64.3 66:2 67.5 69.4 72.7 9 years----------------- 3: 269 69.3 3.69 0.40 63.7 64.5 66.7 68.6 71.7 75.8 10 years---------------- 65 264 70.9 3.54 0.33 64.8 66.1 68.3 70.6 77.5 11 years---------------- 83 255 73.4 3.36 0.37 67.8 68.7 71.4 73.6 :2-i. 79.3
Girls 6 years----------------- 72 281 62.3 2.78 0.35 57.4 58.8 60.4 62.3 64.5 66.2 66.67 years----------------- 284 64.9 3.05 0.40 60.0 61.2 62.7 54.7 67.0 69.3 70.58 years----------------- 14: 281 66.6 0.26 61.5 62.4 56.3 68.6 71.5 73.4 9 years----------------- 265 69.6 E 64.2 % 71.6 75.5 10 years---------------- 7”; 266 71.9 3177 b% 66.3 E 69:3 :4-: 74.4 :ti 78.9 11 years---------------- 84 253 75.1 G.08 0:38 68.3 69:3 72.5 7513 78.4 80:3 81.4
NOTE: 12 = sample size; N= estimated number of children in population in thousands; x= mean;S = standard deviation; Sii = standard error of the mean.
25

----------
---
Table 5. Subischial length of children by race, sex, and age at last birthday: sample size, mean,standard deviation, standard error of the mean, and selected percentiles, United States, 1963-65
I I I Percentile
Race, sex, and age a N 1 8 s sj3 5th 10th 25th 50th 75th 90th 95th
WHITE In centimeters
Boys 6 years----------------- 489 1,787 53.6 3.24 0.20 48.5 49.6 51.5 53.3 55.77 years----------------- 551 1,781 57.2 3.53 0.25 53.1 55.0 57.1 59.2 z-9” 59.4
63.78 years----------------- 537 1,739 60.3 3.44 0.18 2: 55.9 58.2 60.3 62.5 6417 65.79 years----------------- 525 1,730 63.9 4.52 0.33 5713 59.1 61.3 64.1 66.6 69.0 70.310 years---------------- 509 1,692 66.9 4.33 0.21 60.2 61.6 64.3 67.0 69.7 72.2 73.711 years---------------- 542 1,662 70.1 4.43 0.21 63.0 64.8 67.5 70.1 73.1 75.4 77.0 Girls
6 years------- 461 53.5 3.47 0.18 48.2 49.3 51.1 53.5 55.7 57.77 years----------------- 512 x2 57.0 3.81 0.16 51.1 52.4 54.8 56.9 59.3 61.3 E g years----------------- 498 11674 60.5 4.29 54.5 56.0 58.2 60.5 63.2 65.6 67:09 years----------------- 494 1,663 64.0 4.32 E4 57.4 59.0 61.4 63.7 66.7 70.1 71.210 years---------------- 505 1,632 67.3 4.32 0:24 60.5 61.7 64.2 67.1 70.3 74.511 years---------------- 477 1,605 70.9 5.21 0.23 63.8 65.6 68.3 70.9 73.8 :::i 77.8 NEGRO
Boys 6 years----------------- 289 51.4 52.1 53.3 55.5 58.27 years----------------- 286 :z x69 :-";7" 54.5 55.3 56.8 59.3 61.8 %-ii %8 years----------------- 279 63:5 3:34 0:34 57.7 59.0 60.7 64.0 65.9 6717 68179 years----------------- 269 65.7 3.83 0.57 59.5 60.6 63.6 65.7 68.3 71.0 71.810 years---------------- 264 68.7 0.72 60.1 63.1 66.4 69.5 72.1 75.3 76.111 years---------------- 255 72.2 2-E 0.50 65.4 66.9 70.1 72.4 75.3 78.3 79.2.
Girls 6 years----------------- 72 56.2 3.59 0.57 50.3 51.4 53.5 56.5 59.07 years----------------- ;:z 59.7 3.22 0.25 54.9 55.5 57.2 59.5 62.1 E: %-5'8 years-----------------9 years-----------------
1;; z:
62.7 z::
0.32 56.1 58.0 60.0 62.8 65.3 68:2 71:184 67.9 0.56 60.1 62.0 64.5 67.5 71.1 75.1 77.410 years---------------- 77 266 69.9 7:06 0.54 62.4 65.2 67.2 70.8 73.6 77.2 79.111 years---------------- 84 253 74.0 4.18 0.41 67.3 68.5 71.1 73.6 77.3 79.8 81.3
NOTE: n = sample size; N= estimated number of children in population in thousands;x = mean;S = standard deviation; Sz = standard error of the mean.
26

----
Table 6. Sitting height/stature ratio (times 100) of childrenbyrace, sex, and age at last birth-day: sample size, mean, standard deviation, standard error of the mean, and selected percentiles, United States, 1963-65
Percentile Race, sex, and age n N x s sz
5th 10th 25th 50th 75th 90th 95th -
WHITE Sitting height/stature ratio
Boys 6 years----------------- $89 L,787 1.33 0.06 53.1 53.6 54.4 55.3 56.2 57.27 years----------------- 551 L,781 :E 1.34 0.07 52.2 52.8 53.7 54.5 55.4 22; 56.58 years----------------- 537 L,739 53:6 1.20 0.05 52.1 52.4 53.2 54.1 54.7 55:5 55.99 years----------------- 525 L ,730 52.9 1.66 0.10 51.2 51.6 52.4 53.3 54.2 54.8 55.410 years---------------- 509 52.3 1.41 0.06 50.8 51.2 51.9 52.7 53.6 54.3 54.711 years------~--------- 542 E, 51.9 1.36 0.06 50.4 51.0 51.5 52.3 53.2 53.8 54.5
Girls 6 years------------ - $61 L,722 54.6 1.54 0.08 52.8 54.2 56.8 57.37 years----------------- 512 L,716 53.8 1.51 0.08 52.1 55E 53.4 55.8 56.58 years----------------- $98 L,674 53.2 1.79 0.12 51.4 52:l 52.8 55.89 years----------------- $94 L,663 1.45 0.08 51.4 52.2 55.210 years---------------- 505 2: 1.28 0.06 ZY: 51.111 years---------------- 477 t%, 52:0 1.92 0.10 50:2 50.6 ::-:. :z .
NEGRO
Boys 6 years----------------- 289 1.39 0.10 51.2 51.7 52.6 53.67 years----------------- 286 :;-fl 1.19 0.14 51.0 51.3 52.1 52.8 z*;8 years----------------- 279 51:6 1.24 0.10 50.0 50.4 51.3 52.2 52:8 9 years----------------- 269 51.4 1.51 0.27 49.7 50.2 50.9 51.7 52.6 10 years---------------- 264 50.8 2.26 0.26 49.3 50.2 52.2 11 years---------------- 255 50.5 2.35 0.29 tB'-:. 49.3 50.1 :t; . 51.5
Girls 6 years----------------- 281 52.6 1.23 0.17 51.2 51.6 52.2 52.8 55.57 years----------------- 284 52.1 1.18 0.10 50.7 51.2 51.7 52.5 54.68 years----------------- 281 0.10 49.6 50.2 53.99 yeara----------------- 265 :23 0.19 48.8 49.3 2; 2: 53.610 years---------------- 266 2:77 0.35 48.8 49.2 49:9 51:1 53.411 years---------------- 253 1.23 0.14 49.0 49.3 50.1 50.7 51.6 53.3
NOTE: n = sample size; N-estimated number of children in population in thousands; x= mean;8 -standard deviation; Sz = standard error of the mean.
27

Table 7. Buttock-knee length of children by race, sex, and age at last birthday: sample size, mean, standard deviation, standard error of the mean, and selected percentiles, United States,1963-65
u Percentile Race, sex, and age n N
5th 10th 25th 50th 75th 90th 95th
WHITE In centimeters
Boys fj years---------------- 489 1,787 37.1 2.79 0.20 31.7 35.6 37.3 38.9 40.7 41.57 years---------------- 551 1,781 39.6 3.00 0.26 33.7 38.0 39.8 41.5 44.48 years---------------- 537 1,739 41.6 3.21 0.26 35.7 40.2 41.7 43.6 E 46.39 years---------------- 525 44.0 3.46 37.8 41.9 46.1 4718 49.510 years..-------------- 509 x;; 45.9 3.48 E 40.0 $24 48.2 49.9 50.911 years--------------- 542 11662 48.2 3.45 0:24 42.2 ti-; . 48:3 50.5 52.5 53.7
Girls 6 years---------------- 461 1,722 37.5 2.86 0.23 32.3 33.7 36.1 37.8 39.5 40.8 2.:7 years---------------- 512 1,716 39.7 3.07 0.24 34.4 35.8 38.2 39.9 41.78 years---------------- 498 1,674 42.3 3.09 0.19 37.2 38.7 40.5 42.5 44.4 tc2 47149 years---------------- 494 1,663 44.6 0.26 38.6 40.4 42.6 44.6 47.1 48:9 50.210 years--------------- 505 1,632 46.8 EZ 0.28 40.4 42.2 44.4 47.2 49.4 51.1 52.511 years--------------- 477 1,605 49.4 3147 0.22 43.8 45.3 47.3 49.4 51.7 53.8 55.6
NEGRO
Boys fj years---------------- 84 289 37.7 3.38 0.72 30.6 31.8 36.2 38.2 40.3 41.5 41.97 years---------------- 286 40.3 3.48 32.8 34.6 38.9 40.6 42.4 44.3 45.28 years---------------- :z 279 42.3 3.54 E; 35.6 36.8 40.3 42.8 46.49 years---------------- 269 43.8 3.75 pi
z-1 41.5 z-4 :z 4817 E 51:338.6 "4:-z %-:10 years--------------- 2 264 46.1 4.02
11 years--------------- 83 255 48.3 3.91 0:67 40:2 44.3 4617 4816 50.7 52:5 53.8
Girls 6 years---------------- 281 37.8 3.76 0.81 30.4 32.5 35.2 38.6 42.27 years---------------- E 284 40.4 3.44 0.56 33.1 35.3 39.2 40.7 44.1 :5-:8 years---------------- 113 281 42.8 3.78 0.50 35.6 37.7 40.6 43.1 47.5 48:99 years---------------- 84 265 45.9 4.10 0.74 38.6 40.5 43.2 46.1 53.110 years--------------- 266 48.4 3.96 0.82 41.7 46.3 48.4 2; 56.2.11 years--------------- 87; 253 51.0 4.67 0.78 41.8 tz . 48.3 51.1 5714 57.9 '.
NOTE: n = sample size; N= estimated number of children in population in thousands; X= mean;S = standard deviation; SX = standard error of the mean.

Table 8. Popliteal height of children by race, sex, and age at last birthday: sample size, mean,standard deviation, standard error of the mean, and selected percentiles, United States, 1963-65
Race, sex, and age n N 7 ' ' " 5th , lOth, 25t:;::::'rth 9Oth, 95th
WHITE In centimeters Boys
6 years----------------- 489 1,787 29.1 1.77 0.08 26.3 26.8 z-: 29.2 30.3 31.4 32.17 years----------------- 551 1,781 30.9 1.93 0.13 27.9 28.5 30.9 32.2 33.5 34.38 years----------------- 537 1,739 32.4 1.94 0.13 29.1 31:2 32.5 33.7 34.8 35.69 years----------------- 525 34.1 2.16 0.13 30.7 E 32.7 34.2 35.5 36.8 37.710 years---------------- 509 :2i'9: 35.7 2.20 0.12 32.1 3218 34.3 35.7 37.3 38.8 39.611 years---------------- 542 1:662 37.2 2.30 0.12 33.5 34.3 35.6 37.2 38.8 40.2 41.0 Girls
6 years----------------- 461 1,722 28.8 1.75 0.07 25.8 26.5 27.6 28.8 30.1 31.0 31.77 years----------------- 512 1,716 30.5 1.93 0.08 27.4 28.1 29.2 30.4 31.7 32.9 33.7; y~~~~"""""------- 498 1,674 32.3 2.01 0.13 29.0 31.1 32.4 33.6 34.7 35.6----------_----__ 494 1,663 34.0 2.26 0.12 30.2 z-: 32.5 33.9 35.4 37.2 37.910Yyears---------------- 505 1,632 35.5 2.48 0.15 31.6 $1: 38.8 39.711 years---------------- 477 1,605 37.4 2.58 0.14 33.2 . E . x . ~~~: 40.5 41.4. NEGRO
Boys 6 years----------------- 84 289 30.2 1.92 0.31 27.1 28.1 28.8 30.1 31.4 33.2 33.87 years----------------- 286 32.1 1.98 0.29 29.1 29.7 30.6 31.9 33.6 34.7 35.58 years-----------------9 years----------------- :; 279 33.9 1.95 0.18 31.0 31.4 32.5 33.9 35.3 36.7 37.5269 35.4 2.12 0.22 32.0 33.0 34.0 35.2 36.9 38.4 38.810 years---------------- ;32 264 36.8 2.26 0.28 33.1 34.1 35.3 36.8 38.5 39.6 40.311 years---------------- 83 255 38.4 2.16 0.18 35.1 35.6 36.8 38.5 39.8 41.3 42.2
Girls 6 years----------------- 281 2.03 0.30 26.4 27.2 28.7 29.7 31.5 33.47 years----------------- ;: 284 '3?z 1.96 0.19 29.2 30.4 31.7 33.2 Pi 35.28 years----------------- 113 281 33:2 2.35 0.25 29.7 '3:-z 31.7 33.1 34.5 36:39 years----------------- 84 265 35.7 2.39 0.24 31.9 32:5 34.0 35.7 37.6 38.8 :;*:10 years---------------- 266 36.9 2.37 0.35 33.1 33.7 35.3 36.9 38.4 39.6 40:311 years---------------- ii 253 38.5 2.66 0.38 34.2 35.1 36.4 38.4 $0.4 41.7 43.3
- i NOTE:
s = standard n = sample size; N-estimated number of children in population in thousands; x -mean;deviation; sX=standard error of the mean.
29

Table 9. Foot length of childrenbyrace, sex, and age at last birthday: sample size, mean, standard deviation, standard error of the mean, and sllected percentiles, United. States, 1963-65
-
Percentile Race, sex, and age n N 8 s sg
5th 10th 25th 50th 75th 90th 95th
WHITE In centimeters
Boys 6 years----------------- 489 1,787 17.9 1.01 0.06 16.2 16.5 17.2 17.8 18.6 19.4 19.87 years----------------- 551 1,781 18.8 1.05 0.06 17.1 17.4 18.1 18.8 19.6 20.4 20.88 years----------------- 537 1,739 19.6 1.20 0.07 17.7 18.1 18.7 19.6 20.5 21.3 21.79 years----------------- 525 1,730 20.7 1.23 0.07 18.5 19.1 19.9 20.6 21.5 22.4 22;810 years---------------- 509 21.4 1.30 0.06 19.2 20.0 20.4 22.4 23.211 years---------------- 542 :%; 22.3 1.34 0.07 20.1 20.4 21.3 %i . 23.2 24.1 ;2*:.2
Girls 6 years----------------- 461 1,722 17.7 1.07 0.08 15.7 16.2 17.1 17.7 18.5 19.2 19.67 years----------------- 512 1,716 18.5 1.06 0.04 16.6 17.1 17.7 18.5 19.3 19.9 20.5 g years----------------- 498 1,674 19.4 1.14 0.06 17.4 18.1 18.5 19.5 20.3 21.0 21.59 years----------------- 494 1,663 20.3 1.20 0.06 18.2 18.6 20.4 21.9 22.510 years---------------- 505 1,632 21.1 1.33 0.06 19.1 19.4 :E 21.2 %: 22.8 23.311 years---------------- 477 1,605 22.0 1.27 0.06 20.0 20.3 21:1 21.9 22:9 23. 7 24.2
NEGRO
Boys fj years----------------- 289 18.5 1.07 0.17 16.7 17.1 17.7 19.2 20.57 years----------------- 286 19.5 1.02 0.12 17.5 18.0 18.7 :z-: 20.2 E 21.38 years----------------- 279 20.4 1.06 0.14 18.8 19.1 19.6 20:4 21.2 22:o 22.49 years----------------- 269 21.2 0.12 18.9 19.4 20.3 21.2 22.8 24.110 years---------------- 264 22.0 :-zi 20.1 20.3 20.9 22.1 %Z 23.6 23.911 years---------------- 255 22.9 1:20 2::. 20.7 21.2 22.1 23.1 23:6 24.3 24.8
Girls 6 years----------------- 18.4 1.10 0.14 16.4 17.1 17.6 19.3 19.8 20.27 years----------------- % 19.3 0.10 17.6 17.8 18.6 :z 20.1 20.7 21.0 g years----------------- 281 20.0 Ei 0.10 18.2 18.4 20:1 21.8 22.49 years-------- _-_- -_-_- 265 21.2 1:40 0.18 18.8 19.2 E 21.0 % 23.2 23.710 years---------------- 266 22.2 1.20 20.5 21:3 22.2 23:l 23.8 24.411 years---------------- 253 22.7 1.52 Fx. ;Oo*: 20.6 21.5 22.7 23.8 24.9 25.3.
NOTE: ?8 = sample size; N = estimated number of children in population in thousands;x = mean; S = standard deviation; Sg = standard error of the mean.

Table 10. Acromion-olecranon length of children by race, sex, and age at last birthday: samplesize. mean. standard deviation, standard error of the mean, and selected percentiles, United States, 1963-65
Percentile Race, sex, and age n hr x s sg
WHITE
6 years-----------------7 years-----------------8 years-----------------9 years-----------------10 years----------------11 years----------------
489 551 537 525 509 542
1,787 1,7811,7391,7301,6921,662
23.7 25.0 26.2 27.6 28.6 30.0
1.31 1.37 1.39 1.60 1.66 1.85
0.08 0.08 0.08 0.11 0.07 0.08
21.5 22.6 23.9 25.1 25.8 27.2
22.1 23.2 24.4 25.5 26.4 27.7
Girls
6 years-----------------7 years-----------------8 years-----------------9 years-----------------10 years----------------11 years----------------
461 512
29’4” 505 477
1,722 1,716 1,674 1,663 1,632 1,605
2x 26:l 27.5 28.8 30.4
1.41 1.41 1.57 1.61 1.88 1.88
0.09 0.04 0.08 0.09 0.09 0.08
21.2 22.3 23.5 25.1 25.9 27.4
21.5 22.8 24.2 25.4 26.5 28.2
NEGRO
Boys
6 years----------------- 84 289 24.1 1.32 0.16 22.2 22.4 7 years----------------- 286 25.2 1.58 0.15 22.7 23.1 8 years-----------------9 years-----------------
:; 279 269
26.9 27.6
1.16 1.52
0.15 0.24 o;*g
25.3 25.4
10 years---------------- 6’4 264 28.2 1.88 0.22 ;5:2 26.2 11 years---------------- 83 255 30.2 1.64 0.15 27.8 28.2
Girls
6 years-----------------7 years-----------------8 years-----------------9 years-----------------
E 113
84
281 284 281 265
23.9 25.4 26.4 28.2
1.44 1.35 1.68 1.74
0.16 0.14 0.15 0.16
21.3 23.3 23.8 24.7
22.0 24.0 24.3 26.1
10 years---------------- 266 29.7 1.85 26.6 27.3 11 years---------------- E 253 31.1 2.00 X-E. 27.7 28.3
5th 10th 25th 50th
In centimeters
22.7 23.6 24.1 25.1 25.3 26.3 26.4 27.5
28.7fs7.:30.1.
22.5 23.5 23.6 24.6 25.2 26.2 26.4 fE22;::30:4
23.2 24.1 24.0 25.3 26.2 27.0 26.6 27.6 27.3 28.3 29.0 30.1
23.1 24.1 24.4 25.2 t2; 27.1 28:l 28.4 29.6 30.0 31.0
75th 90th 95th
24.6 25.6 25.9 25.9 26.7 27.4 27.2 28.1 28.7 28.6 29.8 30.5 29.8 30.8 31.4 31.2 32.3 33.0
24.5 25.3 25.8 25.7 26.5 26.8 27.2 28.3 29.0 28.6 29.7 30.4 30.1 31.3 31.8 31.8 32.9 33.6
25.1 25.9 26.6 26.3 27.6 28.2
28.4 28.8 f87-: 29.6 29.9 2917 30.6 30.8 31.3 32.7 33.5
24.9 25.7 26.2 26.4 27.4 27.8 27.5 28.8 29.6 29.4 30.6 31.1 30.9 32.2 32.8 32.6 33.8 34.3
NOTE: n = sample size; N - estimated number of children in population in thousands; x = mean; S = standard deviation; sz - standard error of the mean.
31

Table 11. Elbow-wrist length of children by race, sex, and age at last birthday: sample size, mean, standard deviation, standard error of the mean, and selected percentiles, United States,1963-65
Race, sex, and age n N
WHITE In centimeters
Boys 6 years----------------- 489 1,787 18.2 0.97 0.05 16.5 17.0 17.4 18.2 18.8 19.6 19.97 years----------------- 551 1,781 19.2 1.11 0.07 17.4 17.8 18.4 19.2 19.8 20.7 21.18 years----------------- 537 1,739 20.0 1.15 0.08 18.1 18.5 19.3 20.1 20.8 21.6 21.99 years----------------- 525 1,730 21.1 1.22 0.08 19.1 19.4 20.2 21.1 21.8 22.7 23.310 years---------------- 509 1,692 21.8 0.07 19.7 20.2 21.1 21.8 22.8 23.6 23.911 years---------------- 542 1,662 22.8 z::. 0.05 20.5 21.1 22.0 22.8 23.7 24.7 25.3
Girls 6 years----------------- 461 1,722 17.7 1.02 0.06 16.0 16.3 17.1 17.7 18.5 19.1 19.67 years----------------- 512 1,716 18.7 1.16 0.05 17.0 17.3 18.0 18.6 19.5 20.2 20.78 years----------------- 498 1,674 19.7 1.15 0.05 17.7 18.2 19.7 20.6 21.4 21.79 years----------------- 494 1,663 20.7 1.21 0.07 18.8 19.2 x 20.6 21.6 22.5 22.910 years-------- _--_____ 505 1,632 21.7 1.35 0.05 19.5 20.1 20:7 21.7 22.7 23.6 24.011 years---------------- 477 1,605 22.9 1.44 0.06 20.5 21.1 21.9 22.8 23.8 24.8 25.4
NEGRO
Boys 6 years----------------- 289 19.0 1.05 0.16 17.1 18.3 18.8 19.7 20.5 20.87 years----------------- 286 20.1 1.16 0.12 18.3 :z 19.2 19.9 20.8 21.8 22.48 years----------------- 279 21.0 1.13 0.13 19.2 19:5 20.2 21.0 21.8 22.7 23.19 years----------------- 269 21.9 0.14 20.1 20.3 20.9 21.7 22.7 24.510 years---------------- 264 22.6 x 0.20 20.6 21.2 21.8 22.6 23.5 %2-i 24.811 years---------------- 255 23.8 1:23 0.11 21.7 22.2 23.1 23.8 24.6 25:3 25.8
Girls 6 years----------------- 281 18.6 1.11 0.17 16.4 17.1 18.1 18.7 19f5 20.0 20.57 years----------------- 284 19.6 1.10 0.10 18.0 18.2 18.8 19.6 21.0 21.6-g years----------------- 281 20.6 1.34 0.11 18.6 19.1. 19.6 20.5 E 22.4 23.19 years----------------- 265 22.0 1.42 0.13 19.6 20.1 21.1 21.9 23:l 23.9 24.510 years---------------- 266 1.42 0.18 21.3 22.1 22.9 24:l 25.911 years---------------- 253 fZ . 1.59 0.22 2: . 22.2 22.9 24.3 25.4 f2; . 26.9
NOTE: fi= sample size; N= estimated number of children in population in thousands; I= mean; s = standard deviation; S2 = standard error of the mean.
32

Table 12. Hand length of children by race, sex, sample size, mean,standard deviation, standard error of the mean, and
and age at last birthday: United States, 1963-65selected percentiles,
- --
Percentile Race, sex, and age n N x s sz
5th 10th 25th 50th 75th 90th 95th
WHITE In centimeters
BOYS 6 years----------------- 489 1,787 12.9 0.68 0.04 11.7 12.1 12.4 13.1 13.6 13.9 16.57 years----------------- 551 1,781 13.5 0.71 0.04 12.2 12.4 13.1 13.5 14.0 14.6 14.38 years----------------- 537 1,739 14.1 0.81 12.5 13.1 13.5 14.7 15.3 14.8 9 years----------------- 525 1,730 14.6 0.78 E$ 13.2 13.5 14.2 :t-; 15.2 15.7 15.6 10 years---------------- 509 1,692 15.1 0.82 0:04 13.7 14.1 14.5 15:1 15.7 16.3 15.9 11 years---------------- 542 1,662 15.7 0.87 0.03 14.2 14.4 15.1 15.6 16.3 16.8 17.3
Girls 6 years----------------- 461 1,722 12.8 0.70 0.04 11.4 11.8 12.2 13.4 13.8 14.27 years----------------- 512 1,716 13.3 0.76 0.03 12.1 12.3 12.8 z 13.8 14.4 14.78 years----------------- 498 1,674 0.76 0.05 12.4 13.0 13.3 1318 14.5 14.9 15.4 9 years----------------- 494 1,663 :2-z 0.77 0.04 13.2 13.4 14.1 14.5 15.1 15.7 16.0 10 years---------------- 505 1,632 15:1 0.86 0.04 13.5 14.4 15.2 15.7 16.4 11 years---------------- 477 1,605 15.9 0.91 0.04 14.3 x f 15.2 15.8 16.6 17.2 x .
NEGRO
Boys 6 years-----------------7 years-----------------8 years-----------------9 years-----------------10 years----------------11 years----------------
84
:;
283
289286
f6'Z 264255
13.6 14.214.715.2 15.716.3
0.66 0.710.73 0.83 0.840.76
0.090.090.10 0.07 0.110.07
12.3 13.113.5 13.8
:i-:.
12.613.2 13.714.1 14.415.2
13.113.6 14.214.5 15.115.8
13.6
:23 15:2 15.716.4
14.1 14.715.4 i5.7 16.416.8
14.615.3 15.716.5 16.817.4
14.8 15.715.8 16.9 17.017.7
Girls 6 years-----------------7 years-----------------8 years-----------------9 years-----------------10 years----------------11 years----------------
E 113
84
2
281
24 265266 253
13.6 14.114.6 15.516.0 16.6
0.85 0.720.891.011.00 1.06
0.090.09 0.080.08 0.080.12
12.113.013.1 13.9 14.315.0
12.313.1 13.314.2 15.0 15.2
13.0 13.513.814.615.3 15.8
13.6 14.214.515.415.8 16.6
14.314.6 15.316.216.6 17.5
14.715.2 15.916.817.3 18.3
14.815.516.4 17.317.8 18.5
L L
NOTE: n= sample size; N = estimated number of children in population in thousands; x= mean;S = standard deviation; $ = standard error of the mean.

Table 13. Biacromial breadth of children by race, sex, and age at last birthday: sample size, mean, standard deviation, standard error of the mean, and selected percentiles, United States,1963-65
Race, sex, and age n N
WHITE In centimeters-Boys
6 years----------------- 26.1 27.2 28.1 28.8 7 years----------------- i51 1,781 27.3 1.57 0.09 24.7
689 II1,787 26.0 1.59 0.09 23.4 24.1 2: 27.3 28.4 29.5 30.1 8 Yeats----------------- 537 1,739 28.4 1.76 0.10 2.4 2713 28.4 30.7 31.4 9 years----------------- j25 1,730 29.6 1.92 0.11 %:-"d 2714 28.4 29.5 '32: 32.2 32.9 10 years---------------- 509 1,692 30.4 1.97 0.12 27:3 28.2 29.4 30.5 31:7 33.6 11 years---------------- j42 1,662 31.8 2.06 0.13 28.8 29.4 30.5 31.8 33.1 2: . 35.3
Girls
6 years----------------- ~61 1,722 1.53 0.09 23.3 24.0 24.7 25.7 26.7 28.57 years----------------- 512 4x 1.54 0.06 24.5 26.0 27.8 %*I: 29.68 years----------------- c98 :2:: 28:l 1.62 0.09 25.4 E 27.1 E, 29.4 30:5 30.89 years----------------- c94 L:663 29.2 1.87 0.09 26.3 2711 28.1 29:3 30.5 31.6 32.310 years---------------- jO5 1,632 30.4 1.93 0.09 27.4 28.1 30.4 31.7 33.1 33.711 years---------------- i77 1,605 31.8 2.23 0.10 28.6 29.3 ;z*;. 31.7 33.3 34.6 35.5 NEGRO
Boys 6 years----------------- 84 289 26.3 1.95 0.27 24.2 25.0 26.2 27.4 29.0 29.5 7 years----------------- 79 286 27.4 0.17 42.5' 25.3 26.4 27.3 28.4 29.5 30.0 8 years----------------- 79 279 28.9 % 0.22 2517 26.9 27.7 30.1 30.9 31.6 9 years----------------- 269 2:oo 0.25 26.3 27.0 28.3 4E 3X.1 31.9 10 years---------------- 2 264 5x 1.57 0.27 28.4 29.1 29.6 30:8 32.1 33.1 3E 11 years---------------- 83 255 32:0 1.90 0.16 28.9 30.0 30.8 32.1 33.0 34.3 3516
Girls
6 years _-_--_--_ _ ---_-__. 281 26.0 1.73 0.23 23.2 23.7 25.7 28.5 28.97 years----------------- 284 27.2 1.52 0.18 25.1 25.3 ;"e-: 27.2 f?2 30.18 years----------------- 281 28.1 2.01 0.25 25.5 26.1 26:79 years _____--_---__ _-__ 265 29.8 2.00 0.22 26.6 27.3 28.3 z*: g:; %3 31.5
3215 33.4 110 years---------------- 266 31.1 2.14 0.28 27.1 28.4 29.7 31:2 32:6 33.6 34.111 years---------------- 253 32.3 2.47 O&29 28.8 29.4 30.5 32.2 34,.4 35.6 35.9 _-
NOTE: n = sample size; N= estimated number of children in population in thousands;X = mean;S = standard deviation; S2 = standard error of the mean.

Table 14. Bicristal breadth of children by race, sex, and age at last birthday: sample size, mean, standard deviation, standard error of the mean, and selected percentiles, United States,1963-65
-
Percentile Race, sex, and age n N w s sz
5th 10th 25th 50th 75th 90th 95th
WHITE In centimeters Boys
6 years-----------------7 years-----------------8 years-----------------9 years-----------------10 years----------------11 years----------------
489551537525
::z
1,7871,7811,739
x;1;662
18.2 19.019.8 20.721.322.3
0.08:-“3:0.071:61 0.071.90 0.112.02 0.092.16 0.08
16.1 16.817.318.218.4 19.5
16.5 17.3 17.918.7 19.220.2
17.3 18.118.7 19.6
;t: *
18.2 19.119.720.621.222.2
19.219.820.6 21.622.3 23.4
19.8 20.721.622.7 23.4 24.8
20.421.2 22.4 23.924.4 25.9
Girls 6 years-----------------7 years-----------------8 years-----------------9 years-----------------10 years----------------11 years----------------
461 512498 494505477
1,7221,7161,6741,6631,6321,605
18.2 19.020.021.0
z-2.
1.44 0.08 1.47 0.061.86 0.112.01 0.122.13 0.122.46 0.11
16.1 16.5 17.218.1
E: .
16.5 17.1 18.018.7 19.420.5
17.3 18.1 18.819.720.521.6
18.2 19.1 20.120.821.723.2
19.220.021.122.3 23.124.7
20.1 20.922.4 23.825.026.6
20.7 21.6 23.024.826.2 27.7
NEGRO
Boys fj years----------------- 84 289 17.1 1.05 0.19 15.6 16.3 17.0 17.7 18.5 19.17 years----------------- 286 17.8 1.07 0.14 E 16.3 17.0 17.7 18.5 19.3 20.08 years----------------- :; 279 18.8 1.21 0.17 16:5 17.0 18.0 19.0 19.6 20.2 20.7 9 years----------------- 269 19.1 1.60 0.37 16.4 17.1 18.1 18.8 20.3 21.3 21.9 10 years---------------- i4, 264 19.6 1.66 0.31 17.2 17.6 18.5 19.5 20.6 21.8 22.7 11 years---------------- 83 255 20.9 1.56 0.13 18.6 19.2 20.1 20.7 21.8 22;8 23.5
Girls 6 years----------------- 281 1.27 14.9 16.2 17.0 17.8 18.7 19.17 years----------------- ii5 284 :z 1.43 XI 15.7 E-1 17.0 17.7 18.6 19.5 20.38 years--------~-------- 113 281 18:6 1.81 0:lS 16.2 16:6 17.3 18.3 19.7 21.3 22.6 9 years--------~-------- 84 265 19.7 1.78 0.27 17.1 17.5 18.4 19.5 20.8 21.9 22.8 10 years---------------- 266 21.3 2.39 0.25 17.8 18.6 19.6 21.1 22.8 24.5 25.1 11 years-------~~------- ii 253 22.4 2.65 0.33 19.0 19.4 20.5 21.7 23.9 26.3 27.6
-1 I
NOTE: n = simple size; N= es t' imated number of children in population in thousands; x= mean;5 = standard deviation; Sz = standard error of the mean.
35

----
Table 15. Biacromial breadth/bicristal breadth ratio (times 100) of children by race, sex, and age at last birthday: sample size, mean, standard deviation, standard error of the mean, andselected percentiles, United States, 1963-65
- --Percentile
Race, sex, and n N x s Sf age
5th 10th 25th 50th 75th 90th 95th
WHITE Biacromial breadthlbicristal~breadth ratio
Boys 6 years ---_ -___ $89 1,787 143.6 8.65 0.41 131.4 134.1 138.4 143.9 149.1 154.1 158.3 J years-------- 551 1,781 144.0 8.26 0.41 131.6 134.2 138.9 144.7 149.5 157.4 8 years _---_-_- 537 1,739 144.2 9.98 0.48 131.1 134.3 139.5 144.8 ES 158.8 9 years --_- ---_ 525 143.6 9.39 0.41 130.6 134.2 138.8 SE 15413 157.710 years------- 509 x; 144.1 12.64 0.86 129.5 133.3 138.5 E44* ; 150:2 155.7 159.811 years------- 542 1:662 143.1 11.12 0.60 126.8 131.3 137.2 144:2 149.8 155.0 158.8
Girls 6 years ---_-_ -_ 461 1,722 9.02 0.53 128.2 131.7 136.7 153.2 157.27 years-------- 512 1,716 :E? 8.64 0.41 128.6 131.9 137.1 ZKi 152.9 156.68 years ------..- $98 1,674 141:4 10.19 0.57 130.3 147:2 155.2 159.5 9 years-------- $94 1,663 139.5 10.72 0.47 E1 128.1 x 146.1 151.8 156.610 years------- 505 1,632 139.5 9.69 0.68 123:4 128.2 133: 7 146.5 152.4 155.111 years------- $77 1,605 137.7 12.62 0.52 120.5 125.6 131.7 143.8 150.6 155.3
NEGRO
Boys 6 years -___-- -_ 84 289 11.27 1.79 140.3 149.3 164.4 166.0 J years-------- 79 286 ::“4*: 8.94 140.0 ;E E: %'; 167.2 170.48 years --_----- 79 279 153:9 7.91 "0% 142.0 146:0 :$?; 153:3 160:4 164.8 167.5 9 years-------- 269 155.7 9.19 1:98 142.1 144.5 g:; 156.3 162.1 166.5 174.010 years------- 6’2 264 157.9 11.85 1.49 143.8 145.6 156.4 162.4 182.1 199.011 years------- 83 255 153.2 9.23 1.29 136.8 140.4 147:2 153.8 161.2 165.2 166.4
Girls 6 years-------- 281 153.2 9.41 0.65 141.4 142.5 145.7 153.6 158.2 166.6 168.6 J years-------- ;i 284 153.8 10.54 1.68 139.4 140.6 146.1 160;48 years -___ 113 281 151.6 11.11 1.38 133.8 138.9 159;6 E5"G zi;*5" 9 years -___- -__ 84 265 152.0 8.80 1.69 138.4 141.5 %: 158.4 164: 7 168:9 10 years------- 266 146.9 12.10 1.19 129.9 134.3 137:9 156.7 162.7 166.8 11 years------- iI 253 145.2 11.03 1.33 127.6 132.6 139.2 154.1 158.3 162.2
I
NOTE: n= sample size; N= estimated number of children in population in thousands; x= mean; s = standard deviation; sji = standard error of the mean.

Table 16. Chest breadth of children by race, sex, and age at Last birthday: sample size, mean,standard deviation, standard error of the mean, and selected percentiles, United States, 1963-65--
Percentile Race, sex, and age n 1Y x s SF
5th 10th 25th 50th 75th 90th 95thL
WHITE In centimeters Boys F
6 years----------------- 489 1,787 18.4 1.16 0.09 16.4 17.0 17.6 18.4 19.2 19.9 20.57 years----------------- 551 1,781 19.0 1.17 17.1 17.5 18.3 19.1 19.8 20.6 21.18 years----------------- 537 1,739 19.8 1.36 x! 18.0 18.2 18.9 19.7 20.7 21.6 22.19 years----------------- 525 1,730 20.6 1.60 0:10 18.3 18.8 19.6 20.5 21.6 22.6 23.310 years---------------- 509 1,692 21.0 1.41 0.07 19.0 19.3 20.2 21.0 21.9 22.8 23.611 years---------------- 542 1,662 22.1 1.60 0.10 19.9 20.3 21.1 21.9 23.1 24.4 24.9 Girls
6 years----------------- 461 1,722 17.9 1.23 0.08 16.1 16.3 17.1 17.8 18.6 19.5 19.97 years----------------- 512 1,716 18.6 1.29 0.09 16.6 17.1 17.8 18.5 19.4 20.0 20.78 years----------------- 498 1,674 19.2 1.22 0.07 L7.3 17.7 18.4 19.3 20.1 20.9 21.69 years----------------- 494 L,663 20.0 1.59 0.08 18.0 18.2 18.9 19.8 21.9 22.910 years---------------- 505 1,632 20.8 1.82 0.11 18.3 18.7 19.6 20.7 E 23.2 24.311 years---------------- 477 1,605 21.7 1.77 0.07 19.1 19.6 20.5 21.6 22:8 24.1 25.2 NEGRO
Boys 6 years----------------- 18.3 1.11 0.18 16.3 16.8 17.4 18.3 19.0 19.9 20.57 years----------------- ;z 18.7 1.31 0.17 L7.2 L7.4 18.0 18.6 19.4 20.1 21.28 years----------------- 279 19.6 1.01 0.13 La.1 La.4 19.1 19.6 20,.3 20.8 21.29 years----------------- 269 20.2 1.30 0.13 La.1 18.4 19.2 20.3 21.3 22.1 22.610 years---------------- 264 20.7 1.24 0.19 L9.1 !9.2 19.7 20.6 21.6 22.8 23.311 years---------------- 255 21.7 1.42 0.18 L9.4 20.0 20.6 21.6 22.6 23.5 24.0
Girls 6 years--------;-------- 281 17.7 1.05 0.14 16.0 L6.2 16.8 17.7 18.5 19.1 19.67 years----------------- E 284 18.2 1.58 0.21 16.3 16.8 L7.3 18.1 19.1 19.7 20.18 years----------------- 113 281 19.1 1.66 0.21 17.1 17.3 18.1 18.9 19.9 21.2 21.79 years----------------- 84 265 19.7 1.43 0.16 L7.7 18.2 18.8 Lg.6 20.6 21.7 22.610 years---------------- 20.5 1.48 0.17 18.2 18.6 Lg.6 20.6 21.5 22.5 22.811 years-------~-------- 2 2! 21.6 2.05, 0.25 L9.0 19.4 20.3 21;3 22.9 24.4 26.7
- - *
NOTE: n = sample size; N= estimated number of children in population in thousands; 8= mean;S = standard deviation; SE = standard error of the mean.
37.

Table 17. Chest depth of children by race, sex, and age at last birthday: sample size, mean,standard deviation, standard error of the mean, and selected percentiles, United States, 1963-65
Percentile Race, sex, and age 72 N x s sz
5th 10th 25th 50th 75th 90th 95th - _I
WHITE In centimeters Boys
6 years----------------- 489 1,787 13.3 1.19 0.11 11.5 12.0 12.4 13.2 14.1 14.8 15.37 years----------------- 551 1,781 13.7 1.29 0.12 11.8 12.2 13.0 13.6 15.4 15.98 years----------------- 537 1,739 14.2 1.43 0.10 12.2 12.5 13.3 14.2 :Ki 15.8 16.7 9 years----------------- 525 1,730 14.7 1.52 0.08 12.6 13.1 13.7 14.6 15:6 16.6 17.6 :; ~~~=~---------------- 15.0 1.43 13.3 14.1 16.8 17.6
------------me-- :z :%; 15.7 1.58 Lx? EZI. 14.0 14.7 :;:i :E . 17.8 18.7> . G=
6 years----------------- 461 1,722 12.8 1.08 0.07 11.5 12.2 12.7 13.6 14.4 14.87 years----------------- 512 1,716 13.3 1.30 0.09 ::+ 12.0 12.4 13.3 14.8 15.58 years----------------- 1,674 13.7 1.31 0.07 11:8 12.2 12.7 13.7 :";-: 15.6 16.3 9 years----------------- z 1,663 14.2 1.63 0.09 12.1 12.4 13.2 14.1 15:2 16.5 17.4 10 years---------------- 505 1,632 14.7 1.70 0.12 12.3 12.8 13.5 14.5 15.7 16.9 17.9 11 years---------------- 477 1,605 15.4 1.81 0.10 13.1 13.3 14.2 15.3 16.7 17.8 18.6
NEGRO
Boys 6
8 years-----------------9 years-----------------10 years----------------11 years----------------
:9'
;283
286
2;264 255
:2*:14:5 14.5 15.2
1.121.18 1.441.42 1.30
K0:31 0.23 0.18
12.112.212.3 13.1 13.2
12.2 12.6 12.913.2 13.6
12.8
:if-i 13:7 14.4
13.514.214.5 14.4 15.3
14.4
:z 15:2 16.3
15.3
:2: 16:2 16.8
15.716.016.8 16.6 17.4
Girls 6 years-----------------7 years-----------------8 years-----------------
9': 113
281 284 281
13.113.1 13.5
1.431.14 1.26
0.21 0.20 0.18
11.4 11.1 11.6
11.8 11.5 12.1
12.3 12.3 12.5
12.8 13.1 13.4
13.6 13.8 14.4
14.4 14.7 14.9
14.8 15.2 16.3
9 years-----------------10 years----------------11 years----------------
84
;I
265266 253
13.9 14.715.1
1.38
:2::.
0.14 0.160.26
12.1 12.5 12.3
12.3 12.8 12.7
13.0 13.6 14.1
13.8 14.5 14.8
14.8 15.616.3
15.7 16.8 17.7
16.3 18.320.0
years-----------------7 years-----------------
84 289 13.5 1.13 0.30 11.7 12,.1 12.6 13.5 14.4 14.9 15.7
NOTE: n = sample size; N = estimated number of children in population in thousands; X= mean; s = standard deviation; Sji= standard error of the mean.
38

Table 18. Bicondylar breadth of the femur of children by race, sex, and age at last birthday:sample size, mean, standard deviation, standard error of the mean, and selected percentiles,United States, 1963-65
- 1 Percentile
Race, sex, and age n N
I”s sz
5th 10th 25th 50th 75th 90th 95th
WHITE In centimeters
10
Boys 6 years-----------------7 years-----------------8 years-----------------9 years-----------------10 years----------------11 years----------------
489 551 537525 509542
1,7871,7811,7391,7301,6921,662
1.14 0.580.64 0.73
E.
0.06 0.050.05 0.04 0.05 0.06
6.60 7.04 7.097.20 7.36 7.84
6.90 7.12 7.23 7.44 7.778.10
7.20 7.377.62 8.09 8.228.43
7.54 7.788.24 8.48 8.62 9.07
7.8E 8.56 a.41 8.76 8.65 9.008.87 9.63
9.75;:2 10.31
8.76 8.87 9.519.88
10.09 10.71
Girls 6 years-----------------7 years-----------------8 years-----------------9 years-----------------
461 512498 494
1,722
x:: 11663
0.53 0.580.63 0.74
0.05 0.040.04 0.05
6.176.40 7.01 7.08
6.346.80 7.09 7.19
6.84
E 7153
7.34 7.547.78 8.18
7.70 8.13 7.88 a.578.45 8.82 8.71
8.53 8.78 9.23 9.73 years---------------- 505 1,632 0.77 0.06 7.17 7.38 8.05 8.49 9.07 Kl 9.89
11 years---------------- 477 1,605 0.79 0.04 7.40 7.83 8.25 8.68 9.39 9187 10.44 NEGRO
Boys 6 years----------------- 0.54 3.16 6.65 6.81 7.20 7.62 8.20 8.56 8.687 years----------------- fs8Z 0.51 3.10 6.87 7.06 7.28 7.65 8.23 8.65 a.798 years----------------- 279 0.60 3.09 7.20 7.30 7.59 8.16 8.60 8.86 9.50 9 years----------------- 269 0.66 3.09 7.24 7.48 8.09 a.47 8.85 9.51 9.74 10 years---------------- 264 0.62 3.09 7.76 7.83 a.13 8.49 8.84 9.54 9.78 11 years---------------- 255 0.63 3.08 6.01 8.09 8.36 8.81 9.50 9.88 10.36
Girls 6 years----------------- 281 0.43 1.07 5.41 6.85 7.30 7.64 7.84 8.01 7 years----------------- ;: 284 0.60 3.10 5.41 7.12 7.47 7.82 8.49 '8.75 8 years----------------- 113 281 0.78 1.10 5.82 7.34 7.79 8.52 9.10 9.57 9 years----------------- 84 265 0.78 I.10 5.86 7.54 8.23 8.69 9.32 9.71 10 years---------------- 266 0.89 1.09 7.20 8.04 a.49 9.09 9.82 LO.59 11 years---------------- iI 253 0.95 1.13 7.65 a.25 8.65 9.48 .0.51 11.02
NOTE: 72 = sample size; N= estimated number cf children in population in thousands; XC mean; s = standard deviation; St = standard error of the mean.
39.

--
Table 19. Upper arm girth of children by race, sex, and age at last birthday: sample size, mean,standard deviation, standard error of the mean, and selected percentiles, United States, 1963-65
-
Race, sex, and age n N
WHITE In centimeters BOYS
fj years-----------------7 years-----------------8 years-----------------9 years-----------------10 years----------------11 years----------------
$89551 537525509 542
1,7871,7811,7391,7301,6921,662
17.6 18.319.0 19.920.421.6
1.61 1.902.24 2.66
;:;ti
0.10 0.12 0.120.16 0.130.14
15.3 15.7
:2: ;;:;
.
15.816.2 16.717.218.018.8
16.5 17.117.618.3 18.819.7
17.518.2 18.7 :;*:21:2
18.519.320.321.1 g;.;
.
19.720.721.823.4 ;;.z
.
20.6 21.7 23.525.8 25.527.3
Girls 6 years-----------------7 years-----------------8 years-----------------9 years-----------------10 years----------------11 years----------------
461 512498494 505 477
1,7221,7161,6741,6631,6321,605
17.718.3 19.320.2 20.921.7
1.86 2.042.322.70 2.93 2.99
0.150.100.12 0.15 0.20 0.17
15.1 15.716.216.6 16.9 17.6
15.6 16.2 16.8 17.3 17.518.3
16.4 17.017.7 18.4 18.8 19.6
17.518.219.0 19.720.6 21.5
18.8 19.520.8 21.8 22.823.6
19.9 21.222.4 24.1 24.926.1
20.922.123.8 25.726.5 27.4
NEGRO
BOYS 6 years----------------- 84 289 17.4 1.55 0.28 15.1 16.3 18.5 19.6 20.5 7 years----------------- 79 286 17.7 1.28 0.18 15.6 :x 16.9 :z g.6' g.2 19.98 years----------------- 279 18.5 0.16 16.1 17:o 18:5 21.2 9 years----------------- :z 269 19.1 :-:: 0.28 16.3 17.1 % 18.7 20:3 22:8 23.8 10 years---------------- 264 2107 0.27 16.6 17.5 18:5 19.5 20.9 22.2 24.2 11 years---------------- :: 255 :E . 2.27 0.26 17.2 18.1 19.3 20.4 22.3 23.7 24.7
Girls 6 years----------------- 281 17.1 0.20 14.7 15.2 16.0 ;;.; g.; 20.1 7 years----------------- 9': 284 17.9 % 0.25 15.3 15.6 16.5 E-f 21.8 8 years----------------- 113 281 18.8 ;:g 0.17 15.3 15.7 16.8 18:3 2017 2213 23.7 9 years----------------- 84 265 0.24 17.7 20.8 22.8 24.810 years---------------- 266 E 3:22 0.42 E ::*i 18.4 :;*: 22.1 24.811 years---------------- 2 253 21:5 3.54 0.51 17:2 1717 19.3 20:8 23.2 27.0 z9'.
-L
NOTE: 12 = sample sire; N = estimated number of children in population in thousands;x = mean; s = standard deviation;SR = standard error of the mean.
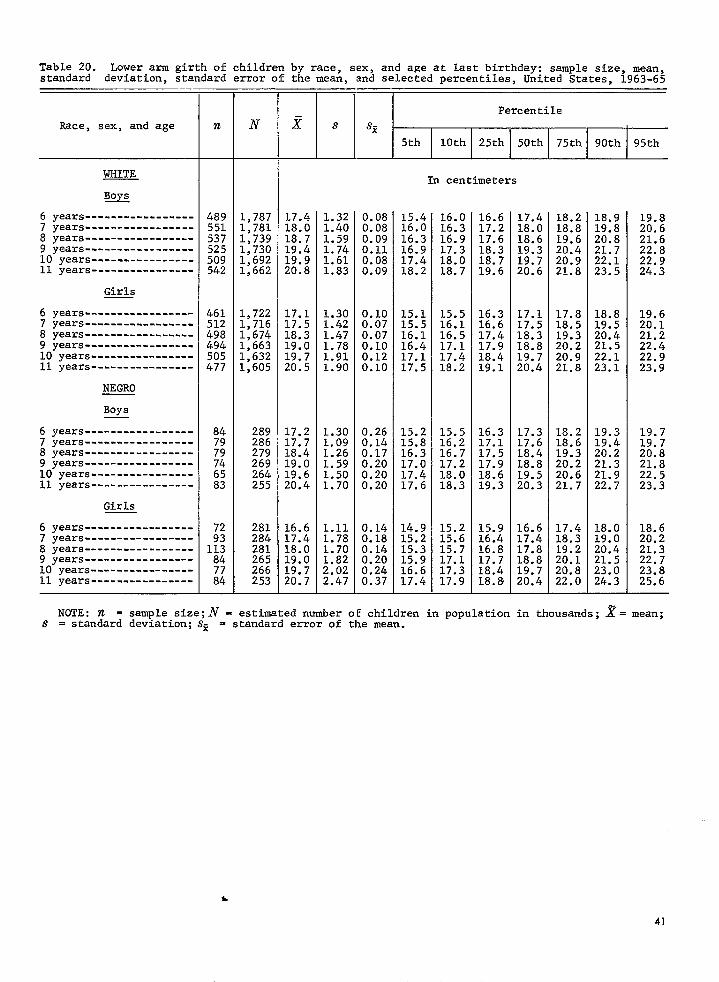
Table 20. Lower arm girth of children by race, sex, and age at last birthday: sample size, mean,standard deviation, standard error of the mean, and selected percentiles, United States, 1963-65
-I I I
Percentile Race, sex, and age n N Ix s SE
5th 10th 25th 50th 75th 90th 95th
WHITE In centimeters Bz
6 years----------------- 489 1,787 17.4 1.32 0.08 16.0 16.6 17.4 18.2 18.9 19.87 years----------------- 551 1,781 18.0 1.40 0.08 :z 16.3 17.2 18.0 18.8 19.8 20.68 years----------------- 537 1,739 18.7 1.59 0.09 16:3 16.9 17.6 18.6 19.6 20.8 9 years----------------- 525 1,730 19.4 1.74 0.11 16.9 17.3 18.3 19.3 20.4 21.7 2: 10 years---------------- 509 1,692 1.61 0.08 17.4 18.0 18.7 19.7 20.9 22.1 22:911 years---------------- 542 1,662 :E . 1.83 0.09 18.2 18.7 19.6 20.6 21.8 23.5 24.3
Girls
6 years----------------- 461 17.1 0.10 15.1 15.5 16.3 17.1 17.8 18.87 years----------------- 512 x 17.5 :-2; 0.07 15.5 16.1 16.6 17.5 18.5 19.5 K8 years----------------- 498 11674 18.3 1147 0.07 16.1 16.5 17.4 18.3 19.3 21:29 years----------------- 494 1,663 19.0 1.78 0.10 16.4 17.1 17.9 18.8 20.2 %!*s 22.410 years---------------- 505 1,632 19.7 1.91 0.12 17.1 17.4 18.4 19.7 20.9 2211 22.911 years---------------- 477 1,605 20.5 1.90 0.10 17.5 18.2 19.1 20.4 21.8 23.1 23.9
NEGRO
Boys
6 years-----------------7 years-----------------8 years-----------------9 years-----------------
84
:;
289 286 279 269
17.2 17.7 18.4 19.0
1.30 1.09 1.26 1.59
0.26 0.14 0.17 0.20
15.2 15.8 16.3 17.0
15.5 16.2 16.7 17.2
16.3 17.1 17.5 17.9
17.3 17.6 18.4 18.8
18.2 18.6 19.3 20.2
19.3 19.4 20.2
19.7 19.7 20.8 21.8
10 years---------------- 2 264 19.6 1.50 0.20 17.4 18.0 18.6 19.5 20.6 %E 22.5 11 years---------------- 83 255 20.4 1.70 0.20 17.6 18.3 19.3 20.3 21.7 22:7 23.3
Girls
6 years----------------- 281 16.6 1.11 0.14 14.9 15.2 15.9 16.6 17.4 18.0 18.67 years----------------- ii; 284 17.4 1.78 0.18 15.2 15.6 16.4 17.4 18.3 19.0 20.28 years----------- -__-_ - 113 281 18.0 1.70 15.3 15.7 16.8 17.8 19.2 20.4 21.3 9 years----------------- 84 265 19.0 1.82 i?:: 15.9 17.1 17.7 18.8 20.1 21.5 22.7 10 years---------------- 266 2.02 0:24 16.6 17.3 18.4 19.7 20.8 23.0 23.8 11 years---------------- zi 253 :;-:. 2.47 0.37 17.4 17.9 18.8 20.4 22.0 24.3 25.6
NOTE: ?t = sample size;N = estimated number oE children in population in thousands; x= mean;S = standard deviation; Sz = standard error of the mean.
41

Table 21. Calf girth of children byrace, sex, and age at last birthday: sample size, mean, standard deviation, standard error of the mean, and selected percentiles, United States, 1963-65
-
Percentile Race, sex, and age 12 N x
75th 90th 95th
WHITE
Boys 6 years-----------------7 years-----------------8 years-----------------9 years-----------------10 years----------------11 years~---------------
$89 551 537 525509542
1,787 23.6 1,781 24.7 1,739 25.71,730 26.81,6921,662
27,629.0
24.7 25.8
2: 29:330.6
26.1 27.3 28.7 30.430.7 32.8
27.1 28.4 29.931.8
E .
Girls 6 years-----------------7 years-----------------8 years-----------------9 years-----------------10 years----------------
Jl years----------------
461512498 494 505 477
x31:674 1,6631,6321,605
92.2 25:8 27.0 27.9 29.2
26.327.428.8 30.5 31.5 33.3
~Z 30:o 31.7 32.7 34.3
NEGRO
Boys 6 years-----------------7 years-----------------8 years-----------------9 years-----------------10 years----------------11 years----------------
289286279 269 264255
23.224.2 25.526.2
fi-P.
24.3
;z-:2717 28.5 29.9
27.826.628.1 29.6 30.3 31.7
26.6 27.4 28.930.7 31.7 32.5
Girls 6 years-----------------7 years-----------------8 years-----------------9 years-----------------10 years----------------11
97:113 84
281 284281 265266 253
23.2 24.2 25.4
19: 29:1
24.325.2 27.1 28.1 30.1 31.3
25.326.3 29.3 30.4 31.8 34.8
26.1 26,7 2;33:9 35.9
-- L
s Sf 5th 10th 25th 50th
In centimeters
1.87 0.12 20.8 21.3 22.3 2.14 0.12 21.6 22.3 23.3 2.35 0.14 22.3 23.1 24.32.65 0.16 24.1 25.1 2.49 0.14 2.4 24.7 26.02.82 0.16 2512 26.0 27.2
1.93 0.14 20.6 21.3 22.41.98 0.11 21.7 22.3 23.32.21 0.11 22.6 23.3 24.3 2.53 0.14 23.4 24.1 25.2 2.70 0.17 24.0 24.5 26.1 2.87 0.16 25.1 25.6 27.3
1.78 0.30 20.3 20.7 22.1 2.13 21.3 22.0 22.7
X-E 22.9 23.3 24.2E8 0:30 22.7 23.4 24.5 2:30 0.30 23.7 24.3 25.62.42 0.27 24.5 25.2 26.8
1.49 0.17 21.0 21.3 22.2 1.86 0.24 21.5 22.1 22.8 2.71 0.21 21.5 22.2 23.5 2.54 0.25 22.5 23.2 24.8 3.24 0.28 23.6 24.2 25.4 3.55 0.38 24.3 24.9 26.5
23.524.6 25.626.5
;;-z.
23.6 22 2617 27.9 28.9
23.324.225.5 25.7 26.8 27.9
23.1 24.324.926.2 27.6 28.6years- ____c_-_---_--_ tz
-
S NOTE: 12 = sample size; N=
standard deviation; estimated number of children
= sp = standard error of the mean.
42
in population in thousands; x= mean;

Table 22. Estimated mid-arm muscle circumference of children by race, sex, and age at last birth-day:United
sample size, mean, standard deviation, standard errorofthe mean,and selected percentiles,States, 1963-65
Percentile Race, sex, and age n 8 s sz
5th 10th 25th 50th 75th 90th 95th
WHITE In centimeters Boys
6 years-----------------
7 years-----------------
8 years-----------------
g years-----------------
10 years----------------
11 years----------------
489 551 537525
::2'
1,7871,7811,7391,7301,6921,662
15.015.6 16.1 16.6 17.1 18.0
1.21 1.30 1.49 1.57 1.54 1.73
0.060.09 0.070.08 0.080.09
13.1 13.3 14.013.4 13.9 14.614.0 14.3 15.114.1 14.7 15.615.0 15.3 16.115.5 16.1 16.0
14.8 15.516.0 16.6 17.0 17.9
15.816.4 16.9 17.6 18.0 19.0
16.7 17.3 17.9 18.6 18.920.3
17.2 17.8 18.7 19.319.8 21.1
Girls 6 years-----------------
7 years-----------------
8 years-----------------
g years-----------------10 years----------------11 years----------------
461 512 498 494505477
1,7221,7161,6741,6631,6321,605
14.5 14.9
E 16:817.7
1.20 1.381.51 1.621.852.01
0.100.06 0.070.090.120.14
12.5 13.0 13.713.0 13.3 14.113.4 13.8 14.513.7 14.2 15.114.1 14.6 15.614.8 15.2 16.2
14.514.8 15.5
:t *: 17:4
15.3 15.716.5 17.117.918.8
16.2 16.717.518.219.120.3
16.817.318.219.1 19.921.5
NEGRO
Boys 6 years-----------------
7 years----------------- 84 289 15.2 1.34 0.31 13.1 13.4 14.1 15.2 16.2 17.1 17.7286 15.7 1.18 0.17 13.5 14.1 14.9 15.7 17.1 17.88 years----------------- :; 16.2 1.19 0.12 14.7 15.4 16.2 22 17.9 18.59 years----------------- 74 2; 16.8 1.58 0.19 E-63 15.1 15.6 16.6 LB:1 18.8 19.710 years---------------- 264 17.4 1.43 0.22 15:o 15.6 16.5 17.4 18.3 19.3 19.811 years---------------- :: 255 18.1 1.61 0.17 15.3 15.9 17.2 18.1 19.1 20.4 20.9
Girls 6 years----------------- 281 14.6 1.25 0.17 12.5 12.8 13.6 14.7 15.6 16.3 16.7 7 years----------------- iis 284 15.3 1.73 0.24 13.0 13.3 14.2 15.2 16.2 17.2 17.7 8 years----------------- 113 281 15.8 1.74 0.16 13.2 13.5 14.4 15.6 16.8 18.2 18.8 9 years----------------- 84 265 16.3 1.61 0.14 14.0 14.3 15.2 16.3 17.2 18.6 19.3 10 years---------------- 77 266 17.4 2.16 0.29 14.2 15.0 15.8 17.0 18.7 20.3 21.5 11 years---------------- 84 253 18.1 2.34 0.35 15.1 15.6 16.6 17.7 19.2 20.8 23.1
NOTE: n = sample size; N= estimated number of childreninpopulationin thousands X= mean;S = standard deviation; sp = standard error of the mean.
43

---- --- ----
Table 23. Chest girth of children by race, sex, and age at last birthday: sample size, mean,standard deviation, standard error of the mean, and selected percentiles, United States, 1963-65
Percentile I Race, sex, and age n x s %
5th 10th 25th 50th 75th 90th 95th -
WRITE In centimeters Boys
6 yeass----------------- 489 1,787 58.7 3.50 0.17 54.2 54.9 56.4 58.4 60.6 63.1 64.4 7 years----------------- 551 1,781 60.9 4.08 0.23 55.5 56.5 58.3 60.5 62.9 65.8 68.2 8 years----------------- 537 1,739 63.3 4.90 0.29 57.3 60.1 62.5 65.7 68.8 71.8 9 years----------------- 525 1,730 66.3 5.92 0.41 59.3 E:: 62.5 65.4 68.6 72.8 10 years----- 509 1,692 67.6 60.4 61:8 64.3 67.2 70.1 ::*8' 11 years---------------- 542 1,662 71.3 21: E% 63.8 65.2 67.3 70.1 74.2 ?303-3983:3. .
Girls 6 years----------------- 1,722 57.0 3.94 0.20 51.8 52.8 54.5 56.7 59.1 61.3 63.87 years----------------- 1,716 59.0 4.21 0.23 53.3 56.3 58.5 64.6 67.38 years----------------- 1,674 61.9 5.16 0.20 55.5 :"8*"; 58.3 61.4 2:: 68.1 71.89 years----------------- 1,663 64.6 5.93 0.33 57.3 5813 60.6 63.5 68:o 72.7 76.910 years---------------- 1,632 67.2 6.67 0.37 58.6 60.0 62.5 66.4 71.0 76.6 80.011 years---------------- 1,605 70.6 7.12 0.33 60.4 62.6 65.6 69.5 75.5 80.3 83.2
NEGRO
Boys 6 years----------------- 289 58.0 3.22 0.61 53.4 54.7 55.5 57.8 60.3 62.6 63.77 years----------------- 286 59.8 2.75 0.38 56.5 57.9 59.7 63.5 64.9g years----------------- 279 62.4 2.89 0.38 z-z 59.2 60.4 62.2 % 65.7 67.59 years----------------- 269 64.1 4.48 5715 58.7 64.0 6712 70.8 71.710 years---------------- 264 66.0 4.17 Es2 60.8 61.4 3 65.5 68.2 72.411 years---------------- 255 68.3 4.77 0:46 61.4 63.0 6517 67.5 70.1 73.7 E:B
Girls 6 years----------------- 72 281 55.9 2.91 0.38 51.2 52.2 54.1 55.8 58.3 59.7 61.37 years----------------- 284 3.88 0.53 53.3 53.8 55.0 57.1 60.3 62.3 63.78 years-----------------
9 years-----------------233 281 z-i 5.01
ii% 53.8 54.9 56.6 59.2
2; 66.9 68.6
265 63:2 5.61 56.5 57.3 58.9 63.1 70.9 75.610 years---------------- 78; 266 66.2 6.64 0:73 60.2 61.8 65.4 69:0 73.2 81.011 years---------------- 84 253 69.7 7.09 0.97 E . 61.6 64.3 69.1 74.2 80.7 83.8 -
NOTE: 12 = sample size; N= estimated number of children in population in thousands; .$'= mean;S = standard deviation; SR = standard error of the mean.
44

-----------------
-----------------
Table 24. Waist girth of children by race, sex, and age at last birthday: sample size, mean,standard deviation, standard error of the mean. and selected percentiles. United States. 1963-65
Percentile Race, sex, and age II N
5th 10th 25th 50th 75th 90th 95th
WRITE In centimeters Boys
6 years----------------- 489 1,787 53.0 4.20 0.20 47.4 48.4 50.3 52.5 54.9 58.3 60.27 years----------------- 551 54.5 4.64 0.26 47.9 49.6 51.7 54.1 56.7 59.7 61.78 years----------------- 537 x; 56.4 5.64 0.30 49.5 50.7 53.0 55.8 58.7 62.5 66.1 g years----------------- 525 ::g 58.3 6.33 0.43 51.3 52.3 54.4 57.3 60.5 66.3 71.5 10 years---------------- 509 59.5 6.08 0.29 53.4 55.3 58.4 62.3 67.2 72.3 11 years---------------- 542 1:662 62.4 7.27 0.30 :2-2' 55.5 57.7 60.6 65.5 71.6 77.5.
Girls 6 years----------------- 461 1,722 51.8 4.58 0.24 45.4 46.8 49.1 51.6 53.9 56.97 years----------------- 512 1,716 53.1 4.54 0.29 47.2 48.3 50.2 52.5 55.5 59.0 E-58 years----------------- 498 1,674 54.9 5.34 0.24 47.7 49.4 51.6 54.0 57.4 61.7 66:l g years----------------- 494 1,663 57.1 5.87 50.1 50.9 53.3 56.1 59.9 65.3 68.4 10 years---------------- 505 1,632 58.2 6.38 E1 50.4 51.5 54.1 57.3 61.3 65.8 71.4 11 years---------------- 477 1,605 60.1 6.45 0:31 52.1 53.1 55.5 59.3 63.6 69.0 72.5
NEGRO
Boys 6 years----------------- 84 289 52.4 4.28 0.63 48.3 49.7 51.7 54.7 57.8 60.67 years----------------- 286 53.4 3.15 0.58 t?; 49.4 51.8 53.6 55.2 57.4 59.08 years :; 279 55.3 3.85 0.45 49:7 50.6 52.9 54.9 57.8 61.1 63.0 9 years----------------- 74 269 56.2 0.58 49.3 50.8 53.1 57.8 58.8 61.6 64.3 10 years---------------- 264 57.7 t-'2: 52.3 52.6 55.2 57.4 63.9 67.4 11 years---------------- 2 255 60.0 5:25 i-i:: 53.1 55.1 57.1 59.5 25:: 65.3 72.5.
Girls 6 years----------------- 281 3.28 0.38 45.5 46.7 51.87 years----------------- '99 284 2-Z 4.11 0.55 47.5 48.4 z-z 52.2 E :7'-: E8 years----------------- 113 281 5418 5.47 0.36 47.8 50:8 53.7 58:3 61:7 63:9 g years 265 56.8 5.27 0.52 51.0 2% 53.4 56.7 58.5 64.2 67.8 10 years---------------- E 266 58.3 5.57 0.59 51.1 5217 54.7 56.8 60.9 64.7 71.5 11 years------------~--- 84 253 60.9 8.80 1.22 53.0 53.5 56.2 58.8 63.1 68.6 78.4
NOTE: n = sample size; N= estimated number of children in population in thousands; a = mean; s = standard deviation; $ = standard error of zhe mean.
45

Table 25. Hip girth of children by race, sex, and age at last birthday: sample size, mean, standard deviation, standard error of the mean, and selected percentiles, United States, 1963-65
Percentile Race, sex, and age n N w 5 sz
5th 10th 25th 50th 75th 90th 95th -
WHITE In centimeters Boys
fj years----------------7 years----------------8 years----------------9 years----------------10 years---------------11 years---------------
489 1,787551 1,781537 1,73952.5 1,730509 1,692542 1,662
58.3 61.164.267.3 69.4 73.5
4.82 5.245.937.23 6.547.49
0.37 0.350.42
E 0:43
51.4 53.756.558.360.6 63.0
52.555.4 57.759.662.4 65.6
55.157.860.4 62.665.0 68.3
58.060.5 63.766.1 68.5 72.4
61.163.867.2 70.673.4 77.5
64.5 67.7
:Ei 7814 83.8
66.6 69.875.181.780.9 88.1
Girls 6 years----------------7 yeara----------------8 years----------------9 years------ -______ 10 years---..-----------11 years---------------
--_
461 512 498494505 477
59.162.3 65.768.9 72.476.6
5.21 5.556.14 7.12 7.898.25
0.340.32 0.360.49 0.570.46
51.1 54.656.2 59.161.264.6
53.156.1
z; ~~:~
.
55.658.3 61.763.7 66.771.0
58.861.665.4 68.0 71.875.7
62.365.8 69.3 73.7 76.982.2
65.669.6 73.5 79.282.787.4
67.672.5 76.781.6 86.3 92.0
NEGRO
Boys fj years---------------- 84 289 56.2 3.86 0.39 51.1 51.5 53.4 56.3 58.4 61.3 63.17 years---------------- 286 3.34 52.8 54.1 56.2 58.5 61.4 62.5 63.18 years---------------- :9' 279 2-; 4.74 E 55.2 56.5 60.1 62.8 68.6 71.09 years---------------- 269 64:9 6.14 1:04 57.3 58.1 60.3 64.7 22 72.5 77.910 years--------------- 2 264 67.4 5.79 0.84 58.8 59.9 64.3 66.7 70:1 75.3 78.911 years--------------- 83 255 70.9 6.32 0.88 61.1 62.0 66.8 70.8 74.7 78.0 80.2
Girls fj years---------------- 72 281 57.2 4.44 0.64 49.7 51.1 54.4 60.3 63.5 64.57 years---------------- 93 284 60.0 5.67 0.71 53.3 54.2 56.4 :x 62.4 66.6 70.58 years---------------- 113 281 64.3 6.90 0.53 54.5 55.9 59.3 63:6 69.0 73.4 76.99 years---------------- 84 265 67.8 7.53 0.85 58.1 59.6 62.6 66.7 71.4 77.6 79.810 years--------------- 266 72.4 a.55 0.88 60.1 61.9 66.9 71.5 76.8 83.8 86.711 years--------------- ia 253 77.1 10.56 1.64 63.4 64.9 70.4 74.9 81.8 91.5 100.7
NOTE: ?k= sample size; N= estimated number of children in population in thousands; x= mean;S = standard deviation; 5% = standard error of the mean.
46

Table 26. Normal deviates of differences between measurements of various components of the extremities ofwhite and Negro children and ranking of normal deviates within sex and age groups
Lower extremity Upper extremity
Sex and age I I Pop- Hand Elbow- Acromion-Foot . .
length ~~~~$ B"E::c,k - length yeiiEh olecranon length length
Boys Normal deviate 6 years------------------------- -3.13 -3.52 -0.81 -6.14 -4.80 -2.617 years------------------------- -4.64 -3.65 -1.12 -7.45 -6.47 -1.428 years------------------------- -5.14 -6.44 -0.98 -6.24 -6.64 -4.089 years------------------------- -3.66 -4.87 $0.17 -7.61 -5.4210 years------------------------ -3.57 -3.52 -0.22 -5.01 -3.61 +1.9;11 years------------------------ -4.50 -5.82 -0.20 -8.77 -7.96 -1.47
Girls
6 years------------------------- -4.44 -3.66 -0.31 -8.23 -4.98 -2.507 years------------------------- -7.12 -6.18 -1.15 -8.41 -8.38 -5.378 years------------------------- -5.14 -3.35 -0.97 -6.96 -7.17 -1.499 years------------------------- -6.46 -10.57 -8.78 -3.7510 years------------------------ I;-;; -3.54 2 % -9.79 -7.41 -3.8611 years------------------------ -3:59 -2.74 -1:98 -6.48 -6.09 -2.50
Boys Rank of normal deviate
6 years-------------------------7 years-------------------------8 years-------------------------9 years-------------------------10 years------------------------11 years------------------------
Girls
tj years-------------------------7 years-------------------------8 years-------------------------9 years-------------------------10 years------------------------
11 years------------------------ 1
47

APPENDIX I
STATISTICAL NOTES
The Survey Design
The sampling plan of the second cycle of the HES followed a highly stratified, multistage probability de-sign in which a sample of the U.S. population (including Alaska and Hawaii) from the ages of 6 through 11 years inclusive was selected. Excluded were those children confined to an institution or residing upon any of the reservation lands set up for the American Indians.
In the first stage of this design, the nearly 2,000 primary sampling units (PSU’s), geographic units into which the United States was divided, were grouped into 357 strata for the use of the Health Interview Survey and the Current Population Survey of the U.S. Bureau of the Census and were then further grouped into 40 superstrata for use in Cycle 11of the HES.
The average size of each Cycle 11stratum was 4.5 million persons, and all strata fell between the limits of 3.5 and 5.5 million. Grouping into 40 strata was done in a way that maximized homogeneity of the PSU’s included in each stratum, particularly with regard to the degree of urbanization, geographic proximity, and degree of industrialization. The 40 strata were classified into four broad geographic regions (each with 10 strata) of approximately equal population and cross-classified into four broad population density groups (each having 10 strata). Each of the resultant 16 cells contained either two or three strata. A single stratum might include only one PSU (or only part of a PSU as, for example, New York City, which represented two strata) or several score PSU’s.
To take account of the possible effect that the rate of *population change between the 1950 and the 1960 Census might have had on health, the 10 strata within each region were further classified into four classes ranging from those with no increase to those with the greatest relative increase. Each such class contained two or three strata.
One PSU was then selected from each of the 40 stiata. A controlled selection technique was used in which the probability of selection of a particular PSU was proportional to its 1960 population. In the con-trolled selection an attempt was also made tomaximize the spread of the PSU’s among the States. While not every one of the 64 cells in the 4x4x4 grid contributes
a PSU to the sample of 40 PSU’s, the controlled selection technique ensured the sample’s matching the marginal distributions in all three dimensions andbeing closely representative of all cross-classifications.
Generally, within a particular PSU, 20 ED’s (census enumeration districts) were selected with the probability of selection of a particular ED proportional to its population in the age groups 5-9 years in the 1960 Census, which by 1963 roughly approximated the population in the target age group for Cycle II. A similar method was used for selecting one segment (cluster of households) in each ED. Eadh of the resultant 20 segments was either a bounded area or a cluster of households (or addresses). All of the children in the age range properly resident at the address visited were EC’s (eligible children). Operational considerations made it n’ecessary to reduce the number of prospective examinees at any one location to a maximum of 200. The EC’s to be excluded for this reason from the SC (sample child) group were determined by systematic subsampling. If one of the sample children had a twin who was not a sample child, this other twin was brought in for examination, and while the results were recorded for use in a special substudy of twins, this twin was qot included in the 7,119 children under the present analysis.
The total sample included 7,417 children 6-11 years of age of whom 96 percent were finally examined. These 7,119 examined children represented theroughly 24 million children in the United States who met the general criteria for inclusion in the sampling universe as of mid-1964.
All data presented in this publication are based on “weighted” observations. That- is, data recorded for each sample child are inflated in the estimation process to characterize the larger universe of which the sample child is representative. The weights used in this inflation process are a product of the reciprocal of the probability of selecting the child, an adjustment for nonresponse cases, andapoststratifiedratioadjustment which increases precision by bringing survey results into closer glignment with known U.S. population figures by color and sex for single years of age 6-11.
In the second cycle of the HES the sample was the result of three stages of selection-the single PSU
40

from each stratum, the 20 segments from each sample PSU, and the sample children from the eligible children. The probability of selecting an individual child is the product of the probabilities of selection at each stage.
Since the strata are roughly equal in population size and a nearly equal number of sample children were examined in each of the sample PSI-I’s, the sample design is essentially self-weighting with respect to the target population; that is, each child 6-11 yearsold had about the same probability of being drawn into the sample.
The adjustment upward for nonresponse is intended to minimize the impact of nonresponse on final estimates by imputing to nonrespondents the characteristics of “similar” respondents. Here “similar” respondents were judged to be examined children in a sample PSU having the same age (in years) and sex as children not examined in that sample PSU.
The poststratified ratio adjustment used in the second cycle achieved most of the gains in precision which would have been attained if the sample had been drawn from a population stratified by age, color, and sex and made the final sample estimates of population agree exactly with independent controls prepared by the U.S. Bureau of the Census for the noninstitutional population of the United States as of August 1, 1964 (approximate midsurvey point) by color and sex for each single year of age 6-l 1. The weights of every responding sample child in each of the 24 age, color, and sex classes are adjusted upward or downward so that the weighted total within the class equals the independent population control.
A more detailed description of the sampling plan and estimation procedures is included in earlier re-ports of the Vk’al and Health Statistics series.6*7 Series 11, No. 1,” describes the techniques used in Cycle I, which are similar to those of Cycle III.
Notes on Response Rates
There were 7,417 children aged 6-11 years selected for examination. Of these, 7,119 were actually examined, which made an overall response rate of just under Qh percent. The response rate by sex and l-year age group is shown below.
Age Boys IGirls
96.5 94.996.5 95.595.2 97.097.6 94.8
95.1‘9::; 95.6
Total--------------------- 96.5 95.5
NOTE:Thelist of referencesfollowsthetext.
It can be seen that only at age 8 years was the response rate for girls better than that for boys.
A similar analysis can be done by age, race, and sex as shown below:
Boys Girls Age
Negro White Negro White
--------------___ 97.7 96.3 97.3 94.7;~~-------~ 97.5 96.3 98.98___-------------- 97.5 95.0 99.1 ;:-:____------------- 98.7 97.4 100.0 ;$;~&--------- 98.5 96.8 97.5ll---------------- 98.8 95.8 98.8 95:o Total -------__-___ 98.1 96.2 98.7 94.9
A striking difference in response is readily seen. Negro children responded better than their whitecounterparts at every age group, and 9-year-old Negro girls had an extraordinary loo-percent response rate.
Parameter and Variance Estimation
As each of the 7,119 sample children has an assigned statistical weight, all estimates of population parameters presented in HES publications are computed taking this weight into consideration. Thus,t?, the esti
mate of a population mean,“r,” is computed as follows:
3?=& wi xi/z wi, where Xi is the observation or
measurement taken on the ith person and wi is the statistical weight assigned to that person.
The HES has an extremely complex sampling plan, and obviously the estimation procedure is, by the very nature of the sample, complex as well. Amethod is required for estimating the reliability of findings which “reflects both the losses from clustering sample cases at two stages and the gains from stratification, ratio estimation, and poststratification.” 35
The method for estimating variances in the HES is the half-sample replication technique. The method was developed at the U.S. Bureau of the Census prior to 1957 and has at times been given limited use in the estimation of the reliability of results from thecurrent Population Survey. This half-sample replication technique is particularly well suited to the HES because the sample, although complex in design, is relatively small (7,119 cases) and is based on but 40 strata. This feature permitted the development of a variance estimation computer program which produces tables containing desired estimates of aggregates, means, or distributions, together with a table identical in format but with the estimated variances instead of the estimated statistics. The computations required by the method are simple, and the internal storage require-
49

ments are well within the limitation of the IBM 360-50 cdmputer system utilized at the National Center for Health Statistics.
Variance estimates computed for this report were based on 20 balanced half-sample replications. A half sample was formed by choosing one sample PSU from each of 20 pairs of sample PSU’s. The composition of the 20 half samples was determined by an orthogonal plan. To compute the variance of any statistic, this statistic is computed for each of the 20 half samples. Using the mean as an example, this is denoted 57;. Tieen, the weighted mean of the entire, undivided sample (X )is computed. The variance of the mean is the mean square deviation of each of the 20 half-sample means about the overall mean. Symbolically,
and the standard error of the mean is the square root of this. In a similar manner, the standard error of any statistic may be computed.
A detailed description of this replication process by Philip J. McCarthy, Ph.D., has been published:5
Standards of Reliability and Precision
All means, variances, and percentage&-appearing in this report met defined standards before they were considered acceptably precise and reliable.
The rule for reporting means and percentiles consisted of two basic criteria. The first criterion was that a sample size of at least five was required. If this first criterion was met, then the second criterion, that the coefficient of variation [i.e., the standard error of the mean divided by the mean( was to be less than 25 percent, must have been demonstrated. Thus, if either the sample size was too small, or the variation with respect to the mean was too large, the estimate was considered neither precise nor reliable enough LO meet the standards establisheb. for publication.
NOTE: The list of referencesfdows the text.
000
Hypothesis Testing
Classically, to test the difference between two means (or, put differently, to test whether two samples could have been drawn from the same population), one could set up a test statistic which would utilize the means and standard errors of the means as computed from the samples. The statistic
1- z2 2=-J&T 2
3 i I’
would then be compared to a table of normal deviates to determine the probability of obtaining values of the test statistic as extreme or more extreme than that computed, if in fact the two population means were equal.
Because of the many breakdowns of the HES sample, innumerable tests of this nature could be per-formed. With each new test, the brobability of rejecting a hypothesis incorrectly may be .05; but if 10 such tests are performed, the probability of making at least one mistake somewhere in those 10 tests is closer to 0.60. This last “overall error rate” will get increasingly .large as the number of such tests increases, Therefore, while the data necessary to do I tests are provided in the tables of this report, no such tests were performed by the authors.
It was decided to place the greatest emphasis on a relationship remaining consistem over both sexes and all ages under consideration. In other words, to say, for instance, that “girls have bdtiock-knee lengths greater than boys for aU. ages between 6-11 years” has far more meaning and interpretability than to say “the mean butt&k-knee length for 6-year-old girls is significantly greater than the corresponding mean for 6-year-old boys,” as determined by a normal deviate. In these analyses con-&ten@, rather than a statement about a succession of individual probability levels, is the factor considered most important in demonstrating
.relationship.
50

--
-----
APPENDIX II
TKHNIQUES OF MEASUREMENT
Techniques of Measurement
Trained observers made all measurements, reading them to the nearest millimeter (tenth of a centimeter). All measurements were read aloud to a recorder, who repeated aloud each number back to the observer as it was recorded in the proper space on the record form.
AND QUALITY CONTROL
This repetition served both as a doublecheck on the measurement and to reduce recording errors.
Measurements were performed in a reguIar sequence to minimize the number of go&ion changes the child was required to make. The sequence is illustrated on the measurement recording form (figure I). It should be noted that not all the measurements taken in
HEALTH EXAMlNIirKm m-11
JREMENTS lco
-W
U-m.
*.Po. ,,‘- T.l.1,
- -*-
-.- -0-
- --•-
- -0-
-. -*-
-•-
- -•-
- -•-
I -*-
- -•,
- -*-
I -*--
- -a-
hKASUREWENT5 MOT WYC OR SIDE VlMEDuoi(y which ad riw - ..__ -.....-.--._-... _--..- _...____-___
51

the survey are reported in the present report. The three skinfolds, for example, have been analyzed and reported already, while other specific reports are still in preparation.
All of the technicians were experiencedx-ray technicians who had been trained in anatomy andthe identification of specific body landmarks. In addition, X-ray technicians, both by disposition and training, tend to workwell with people and are skilled in giving the examinee verbal orders along with the necessary handling to achieve proper positioning.
Each technician received more than a month of intensive training before being considered minimally proficient in making body measurements. In this training, he became skilled with the equipment, the precise locations of the body at which the measurements were to be taken, and the technique of measurement itself. The major sources of measurement error areimproper positioning of subject’s body, improper selection of specific body landmarks, and improper application of instrument (for instance, not perpendicular when measuring a diameter or circumference, or improperly compressing the soft tissue over bony landmarks). Incorrect reading of the instrument (usually trans-position of numbers) also occurs with discouraging frequency. When these errors were mostly overcome, the new technician’s data were carefully compared with those of the other three technicians and the two super-visors before they were officially accepted as recorded data.
As was emphatically stated by Hertzberg when summarizing the Conference on Standardization of Anthropometric Techniques and Terminology in 1968,36 every effort must be made to insure accuracy of measurement and standardization of procedure if the data are to be useful. The preceding discussion sketches the chief procedures used to reduce both systematic andvariable measurement error. As discussed in the lengthy sub-sequent section, “Quality Control and Estimation of Residual Measurement Error,” the absolute amount of systematic error can never truly be known unless one agrees on the “perfect measurer with perfect equipment perfectly applied, etc.” A good estimate of the residual variahle measurement error can, however, be achieved by replicate examinations for both inter- and intra-ohscrver variability.
In the subsequent pages, the equipment, measurements, and specific procedures used’in the survey are described and illustrated. Next the quality control procedures which were used to monitor the bodymeasurements are discussed extensively.
Equipment
The mcusuring equipment con;;isted of several anthropometers, small sliding calipers. steel tapes, and a measuring table with an ndjustablc footrest.
NOTE: The list of referencesfollows the test.
52
Figure II. Anthropcnnetric instruments used in Health Examination Survey, United States, 1968-65. A: anthropometer;B: sliding caliper; C: steel tape.
The anthropometer (figure II) was used tomeasure various body lengths, heights, and breadths. It is a rod consisting of four sections and two crossbars, or measuring arms. One of the crossbars is fixed, while the other is movable. The anthropometer is calibrated in centimeters amd millimeters. It has two scales, one reading from the top down and the other from the bottom up. In this survey, a section of one anthropometer was fitted with a base for stabilizing purposes (to avoid tilting when making various height measurements), while another was fitted into the sliding backboard of the measuring table,
The small sliding caliper (figure II) was used to measure hand length and breadth. It consists of a flat metal bar upon which a slide moves. One of the cross-bars is fixed, while the other is movable. The small sliding calipers are calibrated in centimeters and millimeters.
The steel tape (figure II) was used to measure various body circumferences. It is a flexible tape with a spring rewind and it is scaled in centimeters and millimeters on one side, in inches on the other.
The measuriq fable was such that it could accommodate children of varying sizes and proportions. It was equipped with an adjustable footrest in order to maintain a standardized position of the lower extrem-

ities during the measurement process. The surface of the table was also equipped with a measurement scale in centimeters and millimeters and with a sliding backboard at right angles to the scale.
Measuring Procedures and Definitions
Wei& was measured on aToledo self-balancing weight scale which mechanically printed the body weight directly onto a permanent record. It was recorded to the nearest 0.5 pounds.’
Height was measured as the distance from the standing surface to the top of the head. The child was in stocking feet with feet together, back and heels against the upright bar of the height scale, head in the Frankfort plane (looking directly forward), and standing erectly (“standing up tall”).l
Ceneml position fov sitting measurements. The child sat on the measuring table with the popliteal fossae at the front edge of the table. The footrest was adjusted so that the child sat with his knees and feet together, heels against the heel rests, feet at right angles to the lower legs, and lower legs at right angles to the thighs. Elbows were held at the sides with fore-arms at right angles, hands open, and palms facing each other, or with hands resting on knees. Arm positions were adjueted when necessary to meet the requirements of specific measurements.
Gewt~l position fW standing measurements. The child stood erectlywith the head oriented in the Frank-fort plane, i.e., looking directly aLead and feet together. Arms were held relaxed at the sides. Postural adjustments were made to meet the requirements of specific measurements.
Sitting height was measured as the vertical distance from the sitting surface to the top of the head. With the subject seated as described above, the backboardon the measuring table was brought up firmly against the buttocks. The movable arm of the anthropometer (which was inserted into the backboard) was brought down firmly to the midline of the top of the head.
Buttock-knee length was measured as the distance from the rearmost projection of the buttock to the front of the right kneecap. With the subject seated as previously described, the fixed crossbar of the anthropom cter was placed in Ii&t contact with the rearmost projection of the buttock, and the movable crossbar
I was brought into light contact with the front surface of the right kneecap (patella).
Popliteul height was measured as rhe distance from the surface of the footrest to the underside of the right knee. With the subject seatedat; previously described, the anthropometer with its attached base was pIaced
I on the footrest adjacent to the right foot and the movable arm was brought to the level of the table surface on which the child was seated. This isthelevel at which
NOTE:The list of references follows the text.
the under side of the right knee (tendon of the biceps femoris muscle) comes into contact with the table surface.
Foot length was measured as the distance from the back of the right heel to the tip of the longest toe. With the child seated as previously described, the fixed arm of the anthropometer was lightly applied behind the heel with the rod parallel to the long axis of the foot. The movable bar of the anthropometer was then brought into light contact with rhe tip of the longest toe.
Acromion-olecvanon length was measured as the distance from the acromial process of the right scapula (outer point of the shoulder) to theolecranonprocess of the ulna (elbow). With the subject standing, right arm at his side and elbow bent at a 90-degree angle, the fixed crossbar of the anthropometer was placed firm/y at the right acromial process and the movable crossbar was brought into firm contact with the olecranon process (tip of the elbow).
Elbow-w&t length was measured as the distance from the olecranon process (elbow) to the distal end of the styloid process of the ulna. With the subject seated as previously described but with palm facing downward, the fixed arm of the anthropometer was firmly placed at the olecranon process (tip of theelbow) and the movable arm wasfirmly placed at the distal end of the styloid process of the ulna.
Hand length was measured as the distance from the wrist (midpoint of most distal crease or groove) to the tip of the middle finger. With the right hand fully ex-tended, palm up and thumb straight but relaxed, the fixed end of the sliding caliper was placed at the mid-point of the distal crease at the wrist {located by having the child flex the hand at the wrist), and the movable crossbar of the caliper was placed in light contact with the distal tip of the middle finger.
Biacromial breadth was measured as the maxi-mum distance between the right and left acromial processes of the scapula. With the subject standing and the observer standing behind him, the fixed arm of the anthropometer was placed at the most lateral point of the left acromial process and the movable bar brought to the most lateral point of the right acromial process. The measurement was made with firm confact.
Bicristal breadth was measured as the distance between the most lateral points of the iliac crests. With the subject standing and the observer standing behind him, the crossbars of the upper segment of the anthropometer were brought intofimz contact with the edges of the iliac crests.on each side. This measurement was made with firm pressure.
Chest breadth was measured as the breadth of the rib cage under f&m pvessure. With the subject standing and breathing normally, the fixed crossbar of the anthropometer was applied firmly at one side of the rib cage and the movable crossbar was apelied firmly to the other side at the level of the nipples. The cross-bars were angled slightly downward to avoid slipping
53

Sitting height
Popliteal height Foot length
Elbow-wrist length Hand length
Buttock-knee length
,
Biacromial breadth
Figure III. Schematic illustration of anthropometric dimensions taken on children aged 6-11 years in the Health Examination Survey, United States, 1963-65.
54

Bicristal breadth
Bicondylar breadth
.
V
‘I
~
Chest girth
-
.
V
,I ‘I
~
Figure III. Schematic
Chest breadth
of the Jpvy&m Lower arm femur girth
Waist girth
V
,a‘I
~
Chest depth
L
Calf girth
c
Hip girth
illustration of anthropometric dimensions taken on children aged 6-11 years in the Health Examination Survey, United States, 1963-66-Con.
55

into the spaces between the ribs. At all t imes the rod of the anthropometer was parallel to the floor. In older girls who had a noticeable degree of breast development, the level of the junction of the fourth rib with the sternum was used as the measurement landmark.
Chest depth was measured as the distance or depth from the front to the back of the rib cage under fi’rm pressure during normal breathing. With the subject in the same position as for the chest breadth measurement and with the observer approaching the child from the right side, the fixed arm ofthe anthropometer was applied firmly to the back of the chest and the movable arm was applied firmly to the sternum aE the level of the nipples. At all t imes the measuring instrument was parallel to the floor. In older girls who had a notice-able degree of breast development, the level of the junction of the fourth rib with the sternum was used as the measurement level.
Bicondylav breadth of the femur was measured as the maximum width between the condyles of the right femur. With the subject standing, the fixed bar of the anthropometer was placed firmly on the medialcondyle and the movable bar brought to the lateral condvle with firm pressure.
Upper aym giz’ythwas measured at the level mid-way between the acromial and olecranon processes of the right arm. The midlevel was located while the subject held the forearm at a right angle to the upper arm. The measurement was made while the right arm hung loosely, with the tape horizontal and in contact with the skin without deforming the skin contours, i.e., with-out compressing tiie underlying tissues. Note that this measurement was made at the same level as the triceps skinfold measurement.
Lower a’ym girth was measured as the maximum circumference of the right forearm just below the el-bow joint. The girth was measured just below the elbow at the widest part of the forearm while the arm hung ldosely. The tape was applied horizontally in confact with the skin without defovming the skin contours.
Calf girth was measured as the maximum circumference of the right calf at right angles to the long axis of the leg. With the subject standing, legs several inches apart and weight equally distributed on both feet, the girth was measured at the level of maximum circumference. The tape was placed in contact with the skin without depressing the skin contours.
Chest girth was measured as the circumference of the chest during normal breathing at the level of the fourth intercostal space. With the subject standing as for the measurement of chest breadth and depth, the steel tape was applied firmly but without depressing the skin. Special care was taken to make certain that the tape was horizontal.
Waist @yth was measured as the circumference of the waist, abdomen relaxed, at the level midway between the lower edge of the ribs and the iliac crests. With the subject standing and breathing normally, the
steel tape was applied firmly but without depressing the skin. Special care was taken to make certain the tape was horizontal.
Hip g&th was measured as the circumference of the hips at the level of the greater trochanters (the widest bony part of the hips). With the child standing, feet together, the steel tape was applied firmly to compensate for clothing (this girth was measured over shorts). Special care was taken to make certain the tape was horizontal.
Each dimension measured is schematicall; illustrated in figure III.
Derived Measurements
Subischial length was obtained by subtracting sitting height from standing height. It provides an estimate of the length of the lower extremities.
Estimated mid-arm muscle circumference was derived from the upper arm circumference and thetriceps skinfold, both of which were measuredat the same level of the arm midway between the acromial and olecranon processes. The arm in cross section consists of skin, subcutane&s fat, muscle, and bone. The skin-fold measurement is a double fold of skin and under-lying subcutaneous fat. If it is assumed that the upper arm is a cylinder and the principles of circle geometry are applied, the arm circumference can be corrected for the thickness of the triceps skinfold, leaving an estimated mid-arm muscle-bone circumference or, for the sake of simplicity, estimated mid-arm muscle circumference. Thus,
EMC=AC-rSt
where EMC is the estimated mid-arm muscle circumference in cm., AC is the upper arin circumference in cm., and S, is the triceps skinfold in cm. Since the estimated mid-arm muscle circuhference for large numbers of ‘children is generally calculated via computers and skinfold thicknesses are usually measured in millimeters, the following formula was used:
Indexes and Ratios
Pondeval index provides an approximation of physique or body build on a linearity-laterality continuum. It was obtained as follows: standing height in inches divided by the cube root of body weight in pounds (height/m).
Sitting height/stature ratio indicates the relative contribution of sitting height (i.e., head, neck, and ‘, trunk) to total stature. It was obtained as follows: sit- I ting height divided by standing height t imes 100. This I ratio is expressed as a percentage.
56

Biacromial breadth/bicrik!al breadth ratio indicates the relative proportion of shoulder width to hip width. It was obtained as follows: biacromial breadth divided by bicristal breadth times 100. This ratio is expressed as a percentage.
Quality Control and Estimation of Residual Measurement Error’
Monitoring Systems
Despite efforts to reduce measurement errors, residual errors of a magnitude large enough towarrant concern occur with some regularity in any anthropometric survey. There is, therefore, a real and urgent need to have a system whereby these residual errors can be monitored. The concept of quality control is based on the desire to obtain end products of a specified quality. Thus, one of the main purposes of a monitoring system is to indicate whether the measurements produced by a certain measurement process have attained the desired quality. A second major purpose is to make possible quantitative summary descriptions of residual measurement errors to aid in the interpretation of survey data.
Perhaps the most direct monitoring system used in the Health Examination Survey was observation of the measurement process as it was being applied to an examinee. hledical, dental, and psychological ad-visors from HES and other advisors and consultants regularly visited the examination center to observe examination procedures and to retrain examiners if necessary. A good example of how routine observation was used as a monitoring system can be found in the taking of body measurements. One member of the examining team, a trained anthropomerrist, acted as a recorder and aided in positioning of the examinees, while he was additionally responsible for observing and correcting any errors in measurement technique.
As a careful and thoughtful quality control pro-gram tends to be an evolving process, the most extensive systematic monitoring of body measurements performed in any of the cycles of the Health Examination Survey was achieved in Cycle III (youths 12-17 years, data collection 1966-70). The formal system of replicate examinations which was finally instituted in Cycle III is described later in this appendix along with a discussion of its applicability to Cycle II.
Replicate measurements are useful for a variety of reasons, e.g., as a means of increasing precision of individual measurement estimates. as a training technique, and as a monitoring system which includes the objective of final evaluationof measurement errors. These three objectives are compatible, and replicate
RThis section is in part based upon Scbaible’s lucid and systematic discussion of quaity control and error estimation in the HES. Series 2. Number 44.37
data collected primarily for one of them often indirectly: if not directly. accomplish one or both of the remaining two. For this reason replicate data are most often collected with a combination of these objectives in mind. The single most important source of replicate data in Cycle III was the replicate examination procedure, in which approximaEely 5 percent of the regular examinees were returned to the examination center for a second complete examination (except for drawing blood and taking X-rays).
Biases and Controls in Replicate Measurements
A major source of uncertainty in estimates de-rived from replicate measurements is inability tomake the replicate measurement under precisely the same conditions and in the same manner as the original measurement. This uncertainty is difficult to evaluate, and most attempts to do so are restricted to subjective statements concerning the direction and/or size of the bias and the need for concern in the analysis of data.
Several policies regarding Cycle III replicate examinations were designed specifically to obtain measurements under the same conditions and in the same manner as the initial (original) exam. Replicate examinations were not conducted at a specific time. When-ever possible, they were interspersed among the regular examin?tions. An original examination was given priority over a replicate examination in that none would be scheduled if it occupied time needed for a regular examination. There was often space to interject replicate examinations in the schedule without interfering with regular examinations, hut this priority, plus the fact that replicates were drawn from those previously examined, increased the likelihood that a replicate examination would be scheduled toward the end of the cxamination period. Nevertheless, the attempt to space replicate examinations throughout the regular schedule was a valuable policy in that the interspacing of replicate and original examinations created an atmosphere more conducive to both examinations being conducted in essentially the same manner.
The examiners were informed of the purpose and importance of the reexaminations. It was emphasized that they should not vary their procedures on a replicate examination or in any way try to collect “better” data than they would normally. Thereafter, instrUCtiOnS on the conduct of replicate examinations were not given greater emphasis than any other instruction beCaUse overemphasizing “sameness” might have created more bias than it would have eliminated.
At the time of the original examination neither the observer TWY the examinee kxew whether OY not the examinee would be returned for a replicate examina-Con. During the replicate examination, observers were not specifically informed that an examinee was a replicate, although no attempt was made to conceal this
57

fact since in an examination as lengthy as that given in HES the examinee would undoubtedly be remembered by several, if not all, examiners. Even though an examinee might be remembered, it was extremely unlikely that an examiner would remember a specific measurement after a time lapse of 2 or 3 weeks. Some bias might be introduced by the examiner’s knowledge of the replicate status of an examinee, but generally this bias would seem quite small when compared to the measurement error and in some cases to the biases associated with the knowledge and familiarity gained by the examinee during the original examination. Examinee bias can be important, especially when a response is elicited or when the true value of the measurement has changed because of a time lapse. Since the time lapse was usually 2 or 3 weeks, some appreciable changes might occur in certain measurements such as weight. However, for most of the data collected, the actual change over this short period of time can only be very small and this effect may usually be neglected. Previous experience is much more likely to affect the true replicability of psychological tests and those physiologic tests requiring high levels of subjectparticipation (such as the treadmill and spirometry); with procedures in which the subject is passive and very little learning is involved, such as EKG and body measurements, the effect of previous experience is almost zero.
In Cycle III replicate data were obtained on approximately 70 percent of those selected for such examinations. One explanation for this low rate is that persuasion and followup efforts were not as intensive as for regular examinees. This is partially because regular examinees were given priority if interviewer or examination time was limited. There also appeared to be an increased frequency of objection to returning for a second examination, as demonstrated in the most frequent reasons for refusal: “One time is enough” and “I can’t miss school again.”
Selection of Replicate Examinees
The selection of Cycle III youths for replicate examinations was random within certain restrictions imposed by practical considerations. One restriction was that replicates were selected only from those examined during the first week and a half of the approximately 3% weeks of examinations at any one lo-cation. This time period was chosen to facilitate the interspersing of replicate examinations with originals in the examining schedule without interfering with the time allotted for original examinations and without scheduling additional t ime to accommodate replicates. In a voluntary survey it is obviously impossible to follow a statistically random process in scheduling subjects, so those scheduled during the first week and a half are not, in the strict sense, a random sample of all those scheduled, though they may be randomly distributed for those features which are significant.
Evidence that replicates might be considered “representative” is found in the fact that youths of certain ages, locations, incomes, etc., were not routinely more likely to be scheduled during any particular segment of the examination schedule. However, the availability and desires of the subjects do influence the composition of the replicate sample. For in-stance, an examinee whose participation in an original examination was achieved only after repeated contacts by survey personnel was less likely to have been included in a replicate examination since it is unlikely that he would have received an original examination during the first week and a half. The schedule of lo-cations, time of year, sequence of examinations, and other related factors which might make subjects more or less readily available show no obvious discriminatory effect in the selection of replicate examinees. After examining these and other relatively minor considerations, there appears to be no reason to believe that subjects scheduled and examined during the first part of a stand differed from those scheduled and examined during the latter portion with respect to the data gathered.
Another restriction on complete randomness in the selection of youths for replicate examinations was the exclusion of those examinees living somewhere “geographically inconvenient” to the examination center, “Geographically inconvenient” was arbitrarily defined as a distance of 30 miles or more although exceptions were sometimes allowed if conditions dictated. A primary consideration in choosing a site for the examination center was the centrality of the location inrelation to the sample segments (a segment is a cluster of households). Since segments were drawn with probability proportional to population, most segments were in relatively populated areas, so the examination center
was also in or adjacent to a relatively populated area. Therefore, the subjects deleted by this 30-mile restriction usually resided in relatively less populated areas. Thus this restriction may createa bias in replicate data if, in fact, characteristics differed with population density. Even if differences did exist, the total effect of this restraint would not be great since it excluded only approximately 10 percent of the eligible examinees. There were other minor restrictions of a medical and operational nature imposed on the complete randomness of the replicate sample. They were not, however, readily associated with large ’ differences since at most only l-2 percent of the eligible examinees were deleted for these reasons.
Since the purpose of replicate examinations is to give information about errors, the matter of concern between those excluded and those eligible for selection is not- possible differences in measurement values but possible differences in the errors associatedwith measurements as shown by the discrepancy between two measurements on the same subject. For example, measurements may vary markedly by some demographic
58 I’

classification, but this is not as relevant as the question of whether or not the measurement errors vary by this classification. A similar differential in the active and passive participation of subjects (e.g., spirometry versus body measurements) is assumed to operate here also, but in a different way. That is, it must be assumed that the most cooperative subjects, by and large, self-select themselves, and that their scores aretruerestimates of the variable being tested. It is thus likely that their test-retest difference would be smaller. On the other hand, although subjects did influence measurement errors, it should also be noted that the environment, procedures, and examiners were also highly influential in the final measurement. Consideration of these additional influences causes a completely random selection of subjects to be of somewhat less concern.
The Analysis of Replicate Data on Body
Measuremelits
Although a variety of monitoring systems for body measurements were in effect in HES from the beginning of Cycle I, it was not until Cycle III that a formal system was instituted of recalling approximately 5 per-cent of the subjects already examined for a replicate examination. However, during Cycle II, which is the concern of the present report, several “in-field” at-tempts at assessing replicate body measurementswere made. These included the following:
(1) Several formal training sessions were held in which the examining technicians performed duplicate sets of measurements on a small group of subjects producing data for immediate examination of intra- and inter-examiner differences.
(2) The two Cycle II examining caravans converged from the east and west for a measurement stand in the Greater Chicagoarea. After scheduled examinations were completed in the normal manner, one of the caravans (Caravan I) re-examined (for our purposes, remeasured) approximately 50 children who had been initially examined by the staff of the other caravan (Caravan II), and vice versa. This operation permitted the technicians an “in-field” examination and discussion of the replicate measurements.
(3) Finally, a total of five intensive 2-day sessions were conducted by the supervisors in the field examination centers.
No formal, detailed analysis of the data in the statistical sense was carried out, primarily because the aboveattempts were more training than evaluation sessions.
In Cycle III, on the other hand, a systematic attempt at analysis of replicate body measurements was made.
. A total of 301 replicate examinations from Cycle III were collected and subjected to an extensive analysis of
intra- and inter-examiner variation in body measurements, i.e., variation within the same observer and variation between different observers. Since the conditions under which the body measurements were made were essentially identical in Cycles II and III, there is reason to believe that the results of the quantitative assessment of replicate measurements of data collected in Cycle III can be effectively applied to Cycle II. In other words, should the analysis indicate a reasonably good degree of accuracy within and between examiners in Cycle III, it can be safely assumed that a simiIar degree of measurement accuracy was apparent in Cycle II.
Although the anthropometry in Cycles II and III was very similar, there were four relatively minor differences. First, the children in Cycle II were younger and smaller in size. (There is, however, no reason to assume that the relative measurement ewor is different for younger and smaller individuals.) Second, four of the human engineering measurements taken in Cycle II were not measured in Cycle III; they were replaced by several segmental length measurements of greater biological significance and interest. Third, a total of 11 technicians made measurements during Cycle III, but in Cycle II, the same four technicians participated in equaldegrees throughout the entire cycle. Fourth, a more elaborate, systematic collection of replicate data with greater numbers of subjects was utilized in Cycle III. Other factors-the instruments and their calibration, techniques of measurement, methods of training, selection of technicians, examination environment, and the chief medical examiner and the physical anthropologic consultant-were the same. It should be noted further that two of the four technicians who participated in Cycle II of the HES continued for several years into Cycle III. In summary, the only significant differences in quality
control considerations for body measurements between Cycles II and III were the addition of the systematic collection of replicate data and the use of a greater number of technicians in Cycle III. The authors have concluded that these two differences approximately counterbalance one another, resulting in equivalent degrees of measurement variation.
Cycle III Systematic Replicate Procedure
Body measurements were taken on&768 youths and these data comprise the HES findings. Replicate body measurements were obtained on 301 youths at 30 of the 40 locations (or stands) visited throughout the United States. That is, an average of 10 youths were reexamined at each stand. Of the 301 youths, 224 were reexamined by a technician other than the one initially measuring the youth, while the remaining 77 were reexamined by the same technician. Altogether during the 4 years, 11 technicians participated in replicate measurements for this phase of the quality control program.
It is of interest toascertainwhethereach of the examiners had a representative number of replicate measurement sessions with respect to the number of examina-
59

Table I. Percentage of regular and replicate examinations performed by each technician
I I Replicate examinations
Percentage of regularTechnician number Cycle III examinations I Percentage of intra- Percentage of inter-
examinations examinations
i I 0.8 1.3 100’92 2 2::; 21:4 . 5 13.5 I 10.7 162::
3:
tions he performed during the survey. It should be care-fully noted that it was not possible to insure thar. each technician had equal chances to measure replicate examinees since the length of time technicans were associated with the survey team varied. Table I presents the percentages of total examinations, intra-examiner replicates, and inter-examiner replicates participated in by each of the 11 technicians.
Table I clearly indicates some possible sources of bias which may affect the analysis of replicate data. For example, assume technician No. 9 was able to replicate his own measurements well but his readings were very different from the other examiners. Obviously, his results would be overrepresented in the replicate analysis since he examined only i 1.3 percent of all. youths in the actual survey but did 16 percent of the intra-examiner replicate examinations and 13.3percent of the inter-examiner replicate examinations. Because of this technician’s overrepresentation,the distribution of intra-examiner differences would cluster closer to zero than it really should have since this examiner self-replicated well. On the other hand, the inter-examiner distribution of differences would be considerably more skewed than it should have been since this technician did not agree well with the other technicians’ measurements. Similar discrepancies are obvious for other technicians, An example of an opposite effect to that cited above is technician No. 2, who did only 2.7 percent of the intra-examiner replicate measurements and 10.2 percent of the inter-examiner replicatemeasurements, but did 13.4 percent of all examinations in Cycle III.
Thus, the various combinations of observers for the inter-esaminer replicates and the proportions of intraexaminer replicates were not controlled so as to be balanced among the observers. In the survey proper the examinations were similarly not proportionately distributed among the observers, since the Iength of time
NOTE: The list of referencesfollows the test.
16:4E 24:0 16.0
‘?Z 3:6
-
the various.technicians were associated with the survey varied.
The foregoing indicates that the distribution of numbers of replicate examinations done by each technician is not the same as the distribution of the total number of survey examinations done by each in Cycle III. This represents one of the inherent problems of the present .replicate data and limits to some extent implications to the survey as a whole. Nevertheless, the reader should be aware of the many problems confront!ng those who conduct large-scale health surveys, and in this context, the present systematic approach to the collection of replicate body measuremeht data is adequate.
Results of the Replicate Analysis;
The absolute differences between the first and second measurements of the same child were computedfor each dimension measured during Cycle III. The present analysis concerns itself with all body measurements except skinfold thicknesses, -which have been reported separately with the results of the analysis of skinfold data.3
A distribution of absolute diffkrences was compiled for each body measurement for the intra- and inter-examiner groups separately. The median and mode for each body measurement were extracted from the distribution of absolute differences. -The mean absolute difference (&) was computed by summing the differences and dividing by either 77 or 224, depending on which group (intra- and inter-examiner, respecti,vely) was being considered.
A widely used measure of replicability is the statistic a,, the “technical error of measurement.” It is de-fined as IJ~=Jw the square root of the sum of the squared differences of replicates divided by twice the number of pairs. This statistic assumes that the distribution of replicate differences is normal and that errors of all pairs can be pooled.
Since squaring a technical error of measurement
60

yields a variance, and since the ratio of two variances has the F distribution, a very simple test exists for comparing intra- and inter-examiner replicability. In table II the final column gives, for each variable, the F ratio (i.e., the ratfo of the squares of the inter-examiner (I, to the intra-examiner 0. ). As willbenoted later, in three instances the variance for the intra-examiner group was larger and in these cases the ratios were reversed. A significant, F statistic indicates the presence of a “technician-effect” or some characteristic which makes a particular measurement more easily replicated by the same technician than by another.
The coefficient of variation (CV), O&Z, the technical error of measurement divided by the overall mean (the mean of all subjects) for the particular variable under study, was also calculated. The coefficient of variation is a measure of relative variability, i.e., variation in
Table II. Results of ictra-examiner -
Measuring device and T Intra-examiner
dimension measured
replicability relative to the overall magnitude of the measure.
In the context of the present analysis, great care must be used in dealing with this statistic. It is not a coefficient of variation in the traditional sense since the numerator contains a measure of dispersion of differences (between replicates) whereas the denominator contains a mean-not a mean difference but a mean magnitude of the measurement taken.
The value of this statistic lies in its adjustment of the technical error by the magnitude of the original measurement. It attempts to answer the argument that replicability is likely to be much better for a variable of small magnitude than for one of great magnitude. As will be expanded later, dividing by the mean measurement may overadjust for such biases.
In the presentation of results of the replicate oband inter-examiner replicate analysis
-results T Inter-examiner results
F value
dedian Mode % CV 4 rledian Mode % cv
Automated recordingHeight --__-_------___-_-_------------ 0.1 0.494 0.563 0.1 0.681 0.417 1.90 Weight------------------------------- 1.0 1.173 1.335 1.0 1.228 2.218 1.10
Anthropcmeter-height measurement Standing
Cemicale height------------------- 0.692 1.054 0.5 0.953 0.689A.=raial height __--_---_____--____- x34 z-i 0.795 0.875 E: 0.1 0.891 0.673 E Radial height---------------------- 0:890 0:1 1.063 0.916 0:7 0.949 0.932 1125
2:Sty&,,, height--------------------- 1.114 0.1 1.424 1.819 1.032 0.8 0:5 1.01a 1.290 1.99
f 0.7 Iliac crest height----------------- 0.700 0.3 0.646 3.644 1.134 0.9 0.3 1.059 1.055 2.69
1.510 1.722 1.06Trochanteric height---------------- 1.413 E
1.672 Ei8 E E-i: 0.719 0.564 1.62Tibia1 height---------------------- 0.613 k::
Sphpion height-------------------- 0.266 0:1 0:247 :-2a2 0:380 0:3 0:1 0.343 5.298 1.93. sitting
Sitting height--------------------. 0.535 0.631 0.7 0.705 0.832 1.74 'yJ-,igh clearance-------------------- 2; 0.439 2.853 "0%; 0.5 ::; 0.544 3.535 1.54.
Anthropometer-length and breadth measurement
Foot measurements Fo,,t breadth----------------------- :*:z:. 0.1 0.122 EZ. 0.226 ::; c:. 0.202 2.200 2.74
Across bony landmarks on torso ~ia,=r&al breadth----------------- 0.553 0.544 1.529 0.807 0.5 0.1 0.915 2.571 2.54 Bicristal b-eadth------------------Bitrochanteric breadth-------------
0.7750.552
0.711 0.523
2.926 1.778
1.590 1.760
1.1 0.5
0.1 0.1
1.545 0.836
6.358 2.843
4.72 2.56
.
Sliding caliperKnee breadth-------------------------Elbow breadth-----------------------. Ankle breadth------------------------
0.112 0.105 0.097
2: 0.106 0.117 0.092
E 11367
0.183 0.152 0.186
2: ::: 0.244 0.154 0.171
2.683 2.368 2.540
'1% 3145
Foot length-----------------------. 0.1 0.264 0.296 0.524 2.158 3.94
Across torso Seat breadth----------------------- 0.610 0.909 0.993 3.057 .1.16Elbow-elbow breadth---------------- 1.104 8:; K%: f .% 1.425 ::2' 2: 1.346 4.065 1.42
",--St breadth----------------------. 0.108 2: 0.115 2.208 0.150 E 2: 0.139 2.669 1.46 Spreading caliper
BQonial breadth----------------- 0.075 0.076 0.158 0.1 .255Bizygomatic
breadth--------------------- 0.147 0.156 0.295 0.2 .746 f %. Steel tape
Torso girthsChest girth------------------------ 0.8 1.816 2.256 2.75Waist girth------------------------ :% :%! :*i 1.561 2.300 1.42Hip girth-------------------------- 1:168 A:: 1:514 1:3 1,375 1.558 1.24
Extremity circumferenceupper am girth-------------------- 0.339 0.458 0.425 I.664 1.50For-am girth---------------------- 2; 0.404 2'; 29 0.582 2.453Calf girth------------------------- k% 0:2 0.353 0:3 0:2 0.340 1.009 25":. .
NOTE: For definition of symbols, see above.
61

servation analysis, data were grouped according to the measuring instrument used in order to facilitate comparison since there is the possibility that differences between or within certain examiners might be peculiar to the particular measuring device used. First, height and weight were treated as a single group because they were machine-recorded. Note, however, that height measurement can be affected by variations in posirioning. The secondgroup was comprised of various height measurements which include the distance from the standing or sitting surface to the specific landmark. In most instances, the anthropometer was used to its full extent; nevertheless, as the landmarks approached the leg and ankle, the measuring distance was shorter. The third group of measurements included those made with the upper portion of the anthropometer. These measurements were made with the fixed arm of the anthropometer at one landmark while the free end was moved to the other landmark, which defined the measurement. This group included two foot measurements, three bony breadth measurements across the torso which required firm pressure, human engineering measurements which required light surface contact of the anthropometer. The fourth group included those made with a small sliding caliper. As a group these measurements represent the distance across a single bone or two bones at specific extremity joints. Compared to the height measurements mentioned above, the distance traversed by these measurements is rather small. The fifth group comprised only two facial breadths made with a spreading caliper. The sixth group consisted of measurements made with a steel tape and included six circumferences, three on the torso and three on the extremities.
Clearly body weight differs from all other values here since it was measured to the nearest half pound, while all others were measured to the nearest tenth of a centimeter, i.e., the nearest millimeter. Body weight is the only variable in which there is no chance of either intra- or inter-observer error. All weights were taken on a Toledo self-balancing scale which mechanically printed the child’s weight directly onto the permanent record. It was not even important that the technician position the examinee rigidly, which was a significant factor in other measurements, for example, height. Any variability evident in replicate readings would thus be due to a gain or loss of body weight by the subject between examination sessions. Note that the F ratio for body weight was not significant, thus underlining the lack of technician effect in obtaining this measurement.
There were a total of 77 intra-examiner replications, i.e., the same technician re-examining the subject on two different occasions, and 224 inter-examiner replications, i.e., two different technicians doing the. initial examination and replicate examination respectively, performed during Cycle III. Intra-examiner and inter-examiner results are presented separately in
table II, and all analyses were done within the group under consideration.
Taking the data in table II as a whole, the technical error of measurement was, with three exceptions, consistently less wi.thin examiners than between examiners. This was not entirely unexpected, for experience indicated greater intra-examiner consistency, i.e., there was greater consistency within the same technician than between different technicians. The three exceptions wer e radial height, stylion height, and calf circumference. Since each value was squared in calculating the technical error of measurement, this statistic can be greatly distorted by one or two highly divergent replicate values. That seems to be the case with these three divergent values.
Results of the variance analyses indicated that 25 of 31 F ratios were significant at the .05 level (or conversely, only 6 of 31 F ratios were not significant at the .05 level), Thus, in 25 measurements, intra-examiner differences were significantly smaller than inter-examiner differences. On the surface, such a tendency in the results might appear discouraging. How-ever, such a tendency might function to eliminate or reduce systematic bias in large-scale surveys by eliminating or reducing the effects of individual idiosyncrasies (biases) of individual examiners.
For 29 out of 31 measurements, the mean differences for intra-examiner observations were less than those for inter-examiner observations, These results were in the same general direction as those reported above for the technical error of measurement. The two measurements in which intra-examiner mean differences were the greater of the two were stylion height and calf circumference, both of which, as indicated above, had discrepant replicate readings which functioned to inflate the intra-examiner mean differences.
*The median represents the midpoint of the distribution, i.e., 50 percent of the cases in the distribution are above and 50 percent are below this point. As such, it is not affected by the extremes of isolated discrepant values, as is the technical error of measurement. An examination of the median differences between replicate readings on an intra- and inter-examiner basis indicated eight instances in which the median differences between replicate measurements were identical within and between examiners. In 22 instances, median differences were less within examiners than between examiners, while in one instance the median difference was less between examiners than within examiners. In this last mentioned case, the difference between medians was only 0.1 cm. Thus, these observations are in general agreement with those indicated by comparison of ue and j7, .
The magnitude of the differences between medians of replicate readings within and between examiners was only 0.1 cm. for 13 measurements, 0.15 cm. for one measurement, 0.3 cm. for five measurements, 0.4 cm.
62

for two measurements, and 0.5 cm. for two measurements. Incorporating the eight measurements in which median differences for replicate readings were identical within and between examiners with the above distribution indicated that in 22 of the 31 measurements the difference in median differences of replicate readings within and between examiners was 0.15 cm. or less. This indicates a reasonable degree of consistency in the replicate measurements. It does not, however, consider the magnitude of the actual differences between replicate readings by the same observer and by different observers.
Before going into a discussion of specificgroups of measurements, the limitations of the technical error of measurement and the coefficient of variation should again be noted. As indicated earlier, the u* is generally an important and revesling statistic. By itself, however, it can be somewhat misleading at times. Consider, for example, the variables of standing height and knee breadth in table II for the intra-examiner group of data. Just considering 0, would lead one to believe that knee breadth is a much better replicated measurement than is standing height since the variation for knee breadth is markedly smaller. It should be carefully
noted, however, that the magnitude of standing height is far greater than that of knee breadth, and the margin of error is far greater for the greater measurement. To adjust for this factor, the coefficient of variation (u*/@ can be used. Examination of the coefficients of variation for these two variables indicates that standing height is more closely duplicated by the same examiner than is knee breadth.
On the other hand, coefficients of variation must be used with great caution. To divide IJ! for standing height by the entire mean for standing height is a bit drastic. For example, if an individual is 172 cm. tall, repeated measurements cannot vary by the whole 172 cm. Even if a technician makes a markedly discrepant replicate measurement of 10 cm., for example, this represents only 5.8 percent of the total height measurement. On the other hand, an error of 1.0 cm. for knee breadth, which for the sake of example is assumed to be 12.0 cm., represents 9.3 percent of the measurement. What isbeing suggested here is that there is noway errors of sufficiently large magnitude can be made for large measurements (of the order, say, of 170 cm. for height). Thus, to divide u* by the full mean for the particular measurement distorts the reality of the situation. This is why it is best to compare coefficients of variation within variables measured by the same instrument and within variables of about epual magnitudes.
Results of the replicate analysis for specific measurements and/or groups of measurements are now considered. As noted earlier, the data were grouped according to measurement instrument used.
Although body weight showed some variation within and between observers, the F ratio was not significant, indicating that all observers did comparable jobs in
measuring this variable. It should be noted, however, that there was no chance for individual idiosyncrasies of a given observer to affect the body weight measurement. All weights were taken on a Toledo self-balancing scale which mechanically printed the weight directly onto the child’s permanent record. Hence the variation between observation sessions is due to the weight gain or loss occurring during the time lapse. Mean differences for body weight within and between examiners are well within the range of variation associated with diurnal changes in body weight.
As a group, measurements made with the sliding caliper had a high degree of replicability. This category included two measurements across single bones, i.e., knee breadth across the condyles of the femur and elbow breadth across the epicondyles of the humerus; and two measurements across two bones, i.e., ankle breadth across the distal aspects of the tibia and fibula and wrist breadth across the distal aspects of the radius and ulna. As a group the mean, median, and modal differences for the four extremity breadth measurements were the lowest relative to other variables measured during Cycle III. The technical errors of measurement were also lowest, indicating that these four measurements were quite accurately replicated. For example, these measurements averaged about 0.1 cm. difference for intra-examiner replications and about 0.16 cm. for inter-observer replications. Comparing the average differences for these four extremity breadth measurements to values for other body measurements in table II clearly Indicates that precision was greater in these than in any other group of measurements considered in this report.
Attempting to compare coefficients of variation of these measurements with any others is misleading, as discussed earlier. Thus, the coefficient of variation statistics should be used only within the groups of measurements considered. For intra-examiner differences, knee breadth was best replicated, followed by ankle, elbow, and wrist breadths. For inter-examiner differences, elbow breadth had the smallest coefficient of variation, followed by ankle, wrist, and knee breadths. Testing at the .05 level, the F ratios indicated that in all instances intra-examiner differences were significantly smaller than inter-examiner differences.
The two measul;ements made with the spreading caliper, bizygomatic breadth and bigonial breadth, were likewise well replicated. The mean, median, and modal differences for these two facial breadth measurements were of approximately the same magnitude as those for the extremity breadth measurements. In fact, bizygomatic breadth had the smallest intra-examiner difference of allmeasurements considered, anaverage difference of 0.075 cm. and 0. of 0.076. Gnan intra- and inter-examiner basis, bizygomatic breadth had a smaller coefficient of variation than bigonial breadth. The greater variability in replicating the latter might be related to variations in pressure in applying the
63

spreading caliper (slight variations producing an error of 0.1 cm.) and to variations in palpating the measuring landmark, the gonial angles of the mandible. Experience indicates that some observers allow the calipers to “slip” off the landmark, Similarly, if a child tenses his lower jaw, this also alters the measurement to some extent. In contrast to the measurement of bigonial breadth, bizygomatic breadth is a maximum measurement, in which the technician moves the spreading calipers until he notes the maximum reading. For both facial breadth measurements, the intra-examiner differences were significantly smaller than the inter-examizr differences at the .05 level.
The group of dimensions measured with the upper segment of the anthropometer included two foot measurements (length and breadth), three bony breadth measurements (biacromial, bicristal, and bitrochanteric breadths), and two human engineering breadth measurements (elbow-elbow and seat breadths). In making these measurements, the fixed arm of the anthropometer is set at one landmark, while the free arm is moved to the other landmark defining the particular measurement.
The two foot dimensions showed a high degree of replicability. Mean, median, and modal differences for foot breadth were less than or equal to those for foot length and were of the same magnitude as those for measurements made with the spreading and sliding calipers. This might be a function of the overall size of the dimensions being measured. The technical errors of measurement for both foot dimensions were smaller within than between examiners, and the intra-examiner differences were significantly smaller than the inter-examiner differences. The two foot measurements had consistently smaller technical errors of measurement and coefficients of variation than the other measurements made with the upper segment of the anthropometer.
The bony breadth measurements across the shoulders (biacromial breadth) and across the hips (bicristal and bitrochanteric breadths) also appeared to be reasonably well replicable measurements. Biacromial breadth and bitrochanteric breadth had essentially identical mean differences in the intra-examiner comparisons-O.553 andO. cm., respectively. Bicristal breadth, on the other hand, had a larger aver-age error in the intra-examiner comparisons, 0.775 cm. On an inter-examiner basis, biacromial breadth had the smallest average difference (0.807 cm.), while bitrochanteric breadth had the largest (1.760 cm,), with bicristal breadth very similar to it (1.590 cm.). These average differences are misleading and are perhaps influenced by extreme readings. Median differences in the inter-examiner comparisons are identical for both biacromial and bitrochanteric breadths (0.5 cm.), while that for bicristal.breadth is much greater (1.1 cm.). All mean, median, and modal differences, as well as the technical errors of measurement for the three bony
breadth measurements, were smaller for intra-examiner comparisons than for inter-examiner comparisons. The intra-examiner differences were also significantly smaller than the inter-examiner differences. Within this group of three bony breadth measurements, biacromial breadth had the least relative variation, as indicated by the lower coefficients of variation on both an intra- and inter-examiner basis. Bitrochanteric breadth was close to biacromial breadth but larger in relative variation in both intra- and inter-examiner comparisons. Bicristal breadth had the largest coefficients of variation. The relative variability for the inter-examiner replicates was more than twice that noted for the intra-examiner replicates, indicating that different observers had difficulty in replicating this measurement with accuracy. These observations might be related to the nature and location of the bony landmarks involved in making these three measurements. The acromial processes are relatively close to the surface and easily located. The same applies in general to the greater trochanters of the femur. The iliac crests, though rather easily identified, are perhaps difficult to accurately replicate because of their irregular shape. Contributing to the overall variation in bony breadth measurements is the need for .firm pressure in applying the arms of the anthropometer to the bony landmarks. Any inadvertent alteration of pressure applied can increase the error of measurement.
The two human engineering breadth measurements, elbow-elbow and seat breadths, appeared to be only moderately replicable when compared to other measurements made with the upper segment(s) of the anthropometer. Of the two measurements, elbow-elbow breadth had larger mean, median, and modal differences as well as larger technical errors of measurement in both the intra- ‘and inter-examiner comparisons than did seat breadth. Elbow-elbow breadth also had a larger coefficient of variation than seat breadth. All statistics were smaller for the intra-examiner replications than for the inter-examiner replications. These two breadth measurements also had the lowest F ratios, the ratio for seat breadth being insignificant and that for elbow-elbow breadth barely significant at the .05 level, which would seem to suggest that in both measurements the individual idiosyncrasies of specific examiners had small effects. This interpretation is offset, however, by the fact that the magnitude of the differences between replicate readings in both the intra- and inter-examiner comparisons was rather large. This is perhaps a function of the specific measurements, since both require only light surface contact (the slightest pressure might distort replicate readings). Also, in measuring elbow-elbow breadth rather rigid positioning is required, and inadvertent alterations in positioning by the subject from one measurement session to the next might affect the replicate readings.
The six circumference measurements taken in Cycle III can be divided into those made on the torso

and those made on the extremities. The three torso girths-chest, waist, and hip girths-are essentially human engineering-type measurements, and the replicate analysis is similar to that noted for the two human engineering breadth measurements above. Chest, waist, and hip girths appeared only moderately replicable. Testing at the .05 level, the F ratios indicated no significant differences for hip girth, just barely significant differences for waist girth (F =1.42), and significant differences for chest girth (F- 2.75) between intra- and inter-examiner replicates. These observations suggest that in such girth measurements individual idiosyncrasies of specific examiners had small effects. This interpretation is offset, however, by the magnitude of the differences between replicate examinations in both the intra- and inter-examiner comparisons, which were among the largest for the entire series of 31 measurements. Clearly, the same observer as well as different observers had difficulty replicating these three circumference measurements.
The three extremity circumferences hadconsiderably smaller average differences between replicate readings, both within and between examiners, than did the three torso circumferences. This is perhaps a function of the magnitude of the circumferences measured. AII but calf circumference appeared to be highly replicable measurements. Mean, median, and modal differences as weII as the technical errors of measurement were slightly smaller for the intra-examiner than for the inter-examiner analysis. Observations for calf circumference were in the opposite direction; theaverage difference and the technical error of measurement were larger for the intra-examiner than for the inter-examiner analysis. However, the median and modal differences were identical on an intra- and inter-examiner basis. The effects of two or threediscrepant replicate readings were responsible for inflating the intra-examiner mean difference value and the technical error of measurement. This is contrary to general measurement experience, for calf circumference is generally a highly replicable measurement. The present observations are probably a chance occurrence.
Although standing height was grouped with body weight on the basis of the automated measuring procedures used, the replicate observations for height will be considered here with other height measurements. Of all the height measurements, including standing height, sitting height, and segmental height measurements, it appeared that, both within and between examiners, standing height was best replicated. While sphyrion height and thigh clearance (really height above the sitting surface) had smaller technical errors of measurement, this can be attributed to the smaller margin of error in taking the measurement. Problems encountered in radial and stylion heights have been discussed earlier. In these twomeasurements, the technical error of measurement was larger for the intra-examiner replicates than for the inter-examiner replicates. This was en
tirely a function of one or two discrepant replicate readings, which distorted the technical error of measurement. Median differences between intra- and inter-examiner replicates were negligible for radial and stylion heights.
Examination of the F ratios for the various height measurements indicated that for all measurements except acromial height, radial height, and trochanteric height, there were significantly larger differences when two different observers made the measurements than when a single one did them. It should be noted in table II that the three height measurements for which the F ratio was not significant had among the largest mean differences both within and between examiners. For ex-ample, trochanteric height, which had the smallest F ratio (F - IOh), had the largest mean differences on both intra-examiner replicates (1.413 cm.) and inter-examiner replicates (1.600 cm.). These observations perhaps depend on the measurements involved and factors affecting the taking of thesemeasurements. In addition to the location of landmarks, acromial and radial height are greatly affected by slight changes in the posture and attitude of the subjects, while in the case of trochanteric height, location of the trochanteric land-mark can be difficult in individuals with a lot of soft tissue over this area.
Discussion and Summary of Replicate Analysis
The preceding discussion of results of the replicate analysis of Cycle III body measurements was not aimed at determining which measurements were easiest or most difficult to perform but at evaluating the use of single and multiple examiners in a large-scale survey. Reports of large-scale surveys generally donot include discussions of replicate analyses of multiple examiner effects. One general impression derived from the analysis of the present data is that there is an obvious need to publish replicate studies inanthropometric surveys. This would insure better comparability of surveys and would aid in establishing tolerance limits for various body dimensions.
It should be emphasized that many of themeasurements comprising the Cycle III (12-17 years) replicate analysis were taken in Cycle II (6-11 years). For ex-ample, six of the dimepsions utilized in this report of Cycle II data and 11 of the 21 dimensions described in the previous report (Series II, No. 123) are included among the measurements discussed in the replicate analysis. Hence, of the 31 measurements used in the replicate analysis, 17 were also taken in Cycle II. The primary difference is in the replacement of traditional human engineering dimensions in Cycle II (buttock-knee length, buttock-popliteal length, popliteal height, knee height) and specific segmental lengths (acromionolecranon length, elbow-wrist length, hand length) by eight segmental heights in Cycle III. Specific segmental lengths are estimated in the Cycle III data by subtrac-
65

tion. For example, acromial, height minus olecranon height provides an estimate of upper arm length similar to that provided by direct measurement of acromion-olecranon length.
In addition, conditions under which the various anthropometric dimensions were measured were essentially identical in Cycles II and III, although several of the measurements were different. Instrumentation, instruction, and measurement technique were likewise basically the same in both cycles. Hence, the observations derived from the Cycle IIIreplicate analysis are generally applicable to the Cycle II data.
Measurement of various body dimensions presents a unique situation. There are a large number of variables (sources of error) that must be controlled in the measurement environment in general and at the moment of measurement in particular. General sources of error can be grouped into three categories: the subject, the instrument, and the observer. Subject position, though carefully standardized, is difficult to controlprecisely. Postural attitude, phase of the breathing cycle, degree of tension and/or relaxation,and soonarefactors which make it almost impossible to fully control the examinee so as to permit identical conditions during each of two measurement sessions that comprise replicate studies. In, for example, measurement of segmental heights, an inadvertent shifting of body weight from one leg to another can alter the height of a specific landmark from the standing surface, or tensing of the shoulders might make accurate location of acromiale difficult to replicate.
Instruments are carefully calibrated and checked out during the course of the survey. Hence, instrument variability is reasonably controlled. It isdifficult, how-ever, to control completely the observers’ use and application of instruments to specific body landmarks in addition to the problem of consistently locating these Iandmarks. Differences betweenobservers areinevitable, as the present replicate analysis indicates. Training, both prior to and in the field, helps reduce differences between observers, but it will not eliminate them completely. In light of this reality, there is an obvious need. to establish tolerance limits within which two or more observers are permitted to vary in making aparticular measurement. Similarly, the same observer varies to some extent within his own replicate measurements, although intra-observer variation, as expected, is consistently less thanvariation betweenobservers. Perhaps the results of the Cycle III replicate analysis can be used to establish tolerance limits within which a single observer is permitted to vary in an intra-examiner replication and within which two or moreobservers are permitted to vary in an inter-examiner replication.
Since variation between observers is inevitable, what can be concluded from this analysis? In general, measurements made with the sliding and spreading calipers are highly replicable. These instruments are used in making bone-to-bone measurements requiring firm pressure and traversing relatively small distances. Further, the landmarks for these measurements are
rather easily located. Measurements made with the upper segment(s) of the anthropometer appear to vary with the specific measurement, The two foot measurements, breadth and length, are highly replicable. The three bony breadth measurements across the torsobiacromial, bicristal, and bitrochanteric breadths-are reasonably replicable. The apparent problem with these measurements relates to the consistent location of the landmarks, especially the iliac crests, and the application of firm pressure to compress underlying soft tissues, especially in the case of bitrochanteric breadth. It would be interesting to see a replicate analysis of the two hip breadth measurements by sex, since adolescent girls tend to accumulate adipose tissue over these sites. The two human engineering breadth measurements, elbow-elbow breadth and seat breadth, fhich are made with the upper segment of the anthropometer, are some-what difficult to replicate, perhaps because light surface contact is required in making these measurements. Girth measurements on the torso are also difficult to replicate. Like the two human engineering breadth measurements, these dimensions require light surface contact with no soft tissue compression. Girth measurements on the extremities are, in general, well replicated. The di?crepancy noted for calf circumference in the present analysis is somewhat of a surprise and is probably a chance occurrence. Calf circumference is generally a well-replicated girth measurement, and the result of the present analysis can be overlooked to some extent.
Height measurements, standing or sitting, are reasonably well replicated; there is, however, considerable variation in the replicability of the series of measurements evaluated. This variation is probably related to both subject and observer variation. Although the subject’s position is standardized, inadvertent change in his postural attitude can alter the height of the segment landmark from the standing surface. It is almost impossible to control for this. Inter-observer variation is present for all measurements. Interestingly, it was least for standing height.
As indicated earlier, differences between examiners are inevitable in a large-scale anthropometric survey. This is true regardless of efforts at control and/or elimination. Tlie extent of variation between observers should, however, be noted and reported. Error introduced by multiple observers, i.e., differences be-tween examiners, have two apparent effects: first, they increase variable error, but second, they reduce the probability of a systematic error being introduced into the measuring process by idiosyncrasies of individual observers. An increase in the variable error must be tolerated to achieve a reduction of probable systematic error. Although variation is apparent in the present analysis of replicate measurements, the general impression is one of reasonable consistency in the measurement process utilizing multiple examiners. Comparative data from other large-scale anthropometric surveys of children are apparently not available.
66

VITAL AND HEALTH STATISTICS PUBLICATION SERIES
Originally fiblic Health Service Publication No. 1000
Series 1. Progmms and collection procedures.- Reports which describe the general programs of the National Center for Health Statistics and its offices and divisions, data collection methods used, definitions, and other material necessary for understanding the data.
Series 2. Data ewluation and methods research. -Studies of new statistical methodology including: experimental tests of new survey methods, studies of vital statistics collection methods, new analytical techniques, objective evaluadons of reliability of collected data, contributions to stadsdcal theory.
Series 3. Analvtical &u&es.-Reports presenting analytical or interpretive studies basedon vital and health statistics, carrying the analysis further than the expository types of reports in the other series.
Series 4. Documents and committee reports.- Final reports of major committees concerned with vital and health statistics, and documents such as recommended model vital registradon laws and revised birth and death certificates.
Series 10. Qatcrfrom the Health Inte-rview Survev. -Stadsdcs on illness, accidental injuries, disability, use of hospital, medical, dental, and other services, and other health-related topics, based on data collected in a continuing national household interview survey..
Series 11. Data porn the Health Exzzmination Survey. -Data from direct examination, testing, and measurement of national samples of the civilian, noninsdtutionalpopuladon provide the basis for two types of reports: (1) estimates of the medically defined prevalence of specific diseases in the United States and the distributions of the population with respect to physical, physiological, and psycho-logical characteristics; and (2) analysis of relationships among the various measurements without reference to an explicit finite universe.of persons.
Series 12. Data from the Institutional Po@lation Surveys.- Statistics relating to the health characteristics of persons in institutions, and their medical, nursing, and personal care received, based on national samples of establishments providing these services and samples of the residents or patients.
Series 13. Data from the Hospital Discharge Survey. -Statistics relating to discharged patients in short-stay hospitals, based on a sample of patient records in a national sample of hospitals.
Series 14. Data on health resources: manpower and facilities. -Statistics on the numbers, geographic distribudon, and characteristics of health resources including physicians,dendsts, nurses, other health occupations, hospitals, nursing homes, and outpatient facilides.
Series 20. Data on mortality .-Various statistics on mortality other than as included in regular annual or monthly reports-special analyses by cause of death, age, and other demographic variables, also geographic and time series analyses.
Series 21. Data on nakality, marriage, and divorce. -Various statistics on natality, marriage, and divorce other than as included in regular annual or monthly reports--special analyses by demographic variables, also geographic and time series analyses, studies of fertility.
Series 22. Data from the National Natnlity and Mortality Surveys.- Statisdcs on characteristics of births and deaths not available from the vital records, based on sample surveys stemming from these records, including such topics as mortality by socioeconomic class, hospital experience in the last year of life, medical care during pregnancy, health insurance coverage, etc.
For a list of titles of reports published in these series, write to: Office of Information National Center for Health Statistics Public Health Service, HRA Rockville, Md. 20852