boiling crisis phenomenon part2
TRANSCRIPT

7/28/2019 Boiling Crisis Phenomenon Part2
http://slidepdf.com/reader/full/boiling-crisis-phenomenon-part2 1/18
The boiling crisis phenomenonPart II: dryout dynamics and burnout
T.G. Theofanous *, T.N. Dinh, J.P. Tu, A.T. Dinh
Center for Risk Studies and Safety, University of California, Santa Barbara, 6740 Cortona Drive, Goleta CA 93117, USA
Accepted 10 December 2001
Abstract
This is Part II of a two-part paper on the boiling crisis phenomenon. Here we report on burnout experiments conducted on fresh
and aged heaters in pool boiling. Critical heat fluxes (CHFs) were found to vary from 50% to 140% of the hydrodynamic limit,
previously thought to exist at well-wetting conditions. The burnout events were captured in action (for the first time), using high-
speed, high-resolution infrared thermometry. Based on these observations and in conjunction with the levels of CHF reached, we are
led to conclude that the phenomenon cannot be (macro)hydrodynamically limited, at least at normal pressure and gravity conditions.
Based on infrared thermometry, and aided by X-ray radiography data on void fraction, the case for a scale separation phe-
nomenon in high heat flux pool boiling is argued. This indicates that boiling crisis is controlled by the microhydrodynamics and
rupture of an extended liquid microlayer, sitting and vaporizing autonomously on the heater surface. Further, the detailed dynamics
of this microlayer, as revealed by our experiments, demonstrates that all previous thermally based models of boiling crisis are in-
appropriate.
Ó 2002 Elsevier Science Inc. All rights reserved.
Keywords: Boiling crisis; Burnout; Critical heat flux
1. Introduction
More than half a century ago Kutateladze [1–3] in-
troduced his ‘‘hydrodynamic’’ concept for burnout.
Twenty years later [4], he followed with his famous
‘‘barbotage’’ experiments that specifically related burn-
out (in pool boiling) to a ‘‘liquid repulsion’’ mechanism
due to the counter-current flow of vapor at the heater
surface. The experiments involved injection of different
gases through microporous surfaces, and the incidence
of ‘‘repulsion’’ was identified by the formation of astable gas ‘‘cushion’’ in the immediate vicinity of the
surface. The ‘‘cushion’’ was detected by loss of electrical
contact between an electrode (wire) embedded flush with
the microporous surface, and an electrode immersed in
the bulk of the liquid. This break of stability was found
to be captured well by a fixed value of a grouping now
known as the Kutateladze number (Ku). Namely,
Ku ¼ U cr
ffiffiffiffiffiffiffiffiffiffiffiffiffiffiffiffiffiffiffiffiffiffiffiffiq2
v
r g ðq‘ À qvÞ
4
s ð1Þ
where U cr is the critical gas velocity for instability, q‘
and qv are the liquid and vapor densities respectively, r
is the surface tension, and g is the acceleration due to
gravity. Gogonin and Kutateladze [5] went on to show
by means of extensive experiments boiling ethanol on
stainless steel plates, that
(a) Ku ¼ 0:145 within Æ15%, and(b) the results were independent of the heater size for
dÃP 2,
where dà is the heater length scale, L, made dimension-
less by the capillary length d $ r= g ðq‘ À qvÞf g1=2
. In
boiling, the vapor flow is related to the heat flux as
U cr ¼ qcr= H lvqv ð2Þ
where qcr is the critical heat flux (CHF) (burnout flux),
and H lv is the latent heat of vaporization. Eqs. (1) and
(2) lead to the Kutateladze–Zuber equation, discussed in
Part I:
Experimental Thermal and Fluid Science 26 (2002) 793–810
www.elsevier.com/locate/etfs
* Corresponding author. Tel.: +1-805-894-4900; fax: +1-805-893-
4927.
E-mail address: [email protected] (T.G. Theofanous).
0894-1777/02/$ - see front matter Ó 2002 Elsevier Science Inc. All rights reserved.
PII: S 0 8 9 4 - 1 7 7 7 ( 0 2 ) 0 0 1 9 3 - 0

7/28/2019 Boiling Crisis Phenomenon Part2
http://slidepdf.com/reader/full/boiling-crisis-phenomenon-part2 2/18
qcr ¼ C kqv H lvr g ðq‘ À qvÞ
q2v
1=4
ð3Þ
Due to variation of thermodynamic properties, the CHF
predicted by Eq. (3) for ethanol exhibits a broad maxi-
mum with pressure, rising from 0.5 MW/m2 at 1 bar
to $1.2 MW/m2 at $24 bar, and then gradually falling
off to 0.7 MW/m2 at $50 bar (the critical pressure of
ethanol is 63.8 bar), and this was borne out by the data
as well (within Æ15%).
As noted in Part I, the Kutateladze constant was
obtained theoretically by Zuber [6,7], and the idea of burnout limited solely by external (to the heater) hy-
drodynamics was pursued most prominently by the ex-
tensive works of Lienhard, Dhir and their co-workers
[8,9], as well as by Katto and his co-workers [10,11]. The
renditions (and interpretations) varied widely in their
specifics, as well as degree of specificity, but the result,
being the same, became entrenched at least as an upper
limit both quantitatively as well as conceptually [12].
But there have also been objections in principle to the
various specific hydrodynamic models (Zuber, Katto),
as well as detracting experimental evidences. One of
these is well established and concerns the decrease of
CHF on poorly wetted heaters (see Fig. 3 of Part I), as
found by Costello and Frea [13] almost contemporane-
ously to the works of Kutateladze and Zuber. This does
not violate the ‘‘limit’’, and therefore is not directly
detracting; it does provide, however, a prelude of the
difficulty by the need to introduce a regime transition
that is sharp and not understood. The other two kinds
of detraction are directly challenging to the limit, but,
supported by scant and/or uncertain data, their in-
fluence has remained largely isolated. One of these
pertains to the ability of Eq. (1) to cope with subat-
mospheric ambient pressures and the other with devia-
tions from the predicted trend under fractional and
microgravities.
Extensive work on the subatmospheric boiling was
performed in Russia [14–18]. Labulsov et al. reported
CHF of water and ethanol boiling on a disk heater of 32
mm in diameter [16]. Samokhin and Yagov obtained
CHF in boiling of organic liquids on a larger disk (64
mm in diameter) [18]. Avksentyuk and Mesrakesshvili
performed subatmospheric boiling experiments with
benzen and water [17]. All these data show a trend of
CHF deviating from predictions of the Kutateladze
correlation with the decreasing pressure. In experimentswith water, this difference becomes as much as 3–4 times
as the ambient pressure is decreased below 6 kPa [19].
The subatmospheric experimental data should however
be treated with caution with respect to the applicability
of the Kutateladze–Zuber theory to their conditions.
The effect of gravitational acceleration is important
for space applications and has been investigated more
broadly. Straub et al. performed boiling experiments in
parabolic aircraft flights using a rectangular plate of
40 Â 20 mm both in horizontal and vertical orientations
[20]. They noted that at reduced gravity observed re-
ductions in CHF are slower than the 1
4
-power prediction
by Kutateladze–Zuber equation, Eq. (3). More recent
results from experiments conducted in parabolic aircraft
flights yielded a CHF reduction by 60%, as compared to
the approximately 94% predicted by the Kutateladze–
Zuber equation for the 10À5 g in these experiments [21].
In a follow-on work, Oka et al. reported that for 10À5 g ,
CHF in water is more than 50% of that at normal
gravity [22]. These results are challenged by other CHF
data obtained by Shatto and Peterson [23], also in par-
abolic flights, using a cylindrical cartridge heater (9.4
mm in diameter) immersed in water. Specifically, at re-
duced pressures and microgravity (0.0005 g to 0.044 g )
Nomenclature
C p coefficient of heat capacity, J/kg K
g gravitational acceleration, m/s2
H lv latent heat of evaporation, J/kg
k thermal conductivity, W/m KKu Kutateladze number
l distance between nucleation sites, cm
L heater size, m
N nucleation site density, cmÀ2
q heat flux, kW/m2
t time, s
T temperature, °C
U velocity, m/s
Greek symbols
d capillary length, or thickness, m
q density, kg/m3
r coefficient of surface tension, N/m
DT temperature difference, K
Subscripts and superscripts
cr critical
K–Z Kutateladze–Zuber
‘ liquid
s saturation
v gas, vapor
w wall, heater
à dimensionless
794 T.G. Theofanous et al. / Experimental Thermal and Fluid Science 26 (2002) 793–810

7/28/2019 Boiling Crisis Phenomenon Part2
http://slidepdf.com/reader/full/boiling-crisis-phenomenon-part2 3/18
they obtained CHF smaller than the Kutateladze–Zuber
predictions. The authors [23] concluded that even for
gravity as low as 10À3 g boiling crisis is governed by the
Taylor–Helmholz instability mechanism on vapor jet
emanating from the heater’s surface.
However intuitively appealing as the ‘‘hydrodynamic-
limit’’ idea may be, quantitatively it turns out to be verypuzzling. Take for example water boiling at atmospheric
pressure. From Eq. (1) we have U cr $ 0:9 m/s, so that
qcr $ 1:2 MW/m2, and with q‘=qv $ 1600, the needed
liquid supply is found to be only $0.6 mm/s. This means
that in order to interfere with such a minuscule rate of
supply, the vapor, in counterflow, has to ‘‘lift’’ essen-
tially all the liquid up against gravity to the point of
barely allowing it to touch the heater surface. A condi-
tion known as flooding, this would require more than an
order of magnitude greater velocities (and heat fluxes).
That this is so can be seen readily from Kutateladze’s
own flooding criterion, Ku ¼ 3:2 [24], and also from
balancing the drag force on a capillary drop (d $ d)
suspended against gravity. This being as straightforward
as it is basic, the other puzzle is: How could it have gone
unattended for so long?
Could it be that the effect of this ‘‘limitation’’ is in-
direct? That is, could it be that this apparent ‘‘break of
stability’’ in external (macro) hydrodynamics triggers an
‘‘inner’’ sequence of events that lead to dryouts? But
then for Eq. (1) to still work, this inner sequence must be
universal; that is, it should not introduce any other pa-
rameters. Or, could it be that Eq. (1) is simply a reduced
form (note the absence of viscosity) of some ‘‘inner’’
(micro)hydrodynamics problem that defines the onset of dryout in the limit of very well-wetting conditions? Or,
finally, could it be that (macro)hydrodynamics control is
so far out (as our estimates above indicate), that burn-
out is always controlled by heater-surface properties,
and that experimentally observed burnouts have been
fortuitously connected to such a ‘‘limit’’? With the re-
sults of our BETA experiment, we can now begin to
develop definitive answers to these questions.
The paper is organized as follows. In Section 2, we
begin with the overall behavior as manifest by the CHFs
measured. The principal parameter is heater-surface
aging, which, as discussed in Part I, is a feature not
captured by static or receding contact angle measure-
ments. A key point is that at each burnout condition we
now also have the nucleation pattern, and hence the
nucleation site density. We find these to exhibit a strong
positive correlation, and this is discussed relative to
current models and beliefs on the matter. The discussion
in Section 2 also includes all relevant previous work on
integral CHF measurements, as well as what is available
on the CHF behavior of very thin heaters. Our next step,
in Section 3, is to delve into the details of inception and
growth of the dryout spots, as eventually they become
responsible for burnout. We identify reversible and ir-
reversible dry spots and provide quantitative measures of
their temporal and spatial characteristics. Although
previous information on such matters is essentially
nonexistent, our discussion includes previous notewor-
thy attempts as pertinent for perspective and credit. A
complementary view of, and context for the so-charac-
terized dryout behaviors is provided in Section 4. Aidedby X-ray radiography, we are able to translate the ther-
mometric records into the detailed flow regime, and the
revelation of a scale separation phenomenon as a general
organizing principle of saturated high-flux boiling. On
this bases, we then proceed to define the key physics of
burnout. Examined in this light we find all previously
postulated thermal (heater)-control models to be inap-
propriate. The focus achieved by this definition of key
physics is suggestive of the kind of theoretical work
needed for further development of understanding, and of
the kinds of experiments that could best contribute to
such efforts. We close with a succinct listing on the major
conclusions in Section 5.
2. Critical heat flux
A total of 25 burnouts tests were conducted with
BETA heaters (see Part I) as summarized in Table 1.
The table also includes three representative burnout
events (C1, C2, and C3) obtained with a thick copper
heater fitted in the BETA test vessel. From the table we
can see that the BETA heaters ranged in thickness from
140 to 1000 nm, which, as expected, had no particular
influence. We also varied the water quality and mode of power delivery with apparently no strong direct effects.
On the other hand, a major variability was introduced
by heater aging, which, as explained in Part I, entailed
no significant change in static or receding contact an-
gles, nor in the macroscopic appearance of the heater
surface (mirror shine). A further variability was intro-
duced by extended exposure to boiling, and the atten-
dant cumulation of microscopic impurities (thereby
observing an indirect influence of water quality) as re-
vealed by SEM and AFM imaging (see Part I). Such
heaters were classified as ‘‘heavily aged’’.
Arranged in ascending order as in Fig. 1, these results
indicate an essentially continuous variation over a wide
range of burnout performance, from $50% to $140% of
the hydrodynamic ‘‘limit’’, and this leads to two im-
portant questions. One, having decisively violated the
quantitative Kutateladze–Zuber limit, now we must ask
whether there is any role left for the ‘‘external’’ hydro-
dynamics. In particular, could it be that a limit still
exists but it is simply at a higher heat flux level? Two,
viewed coherently as a single regime of heater-surface
control, is it reasonable to expect that the observed
variation could be related to measurable liquid/surface
properties and related mechanisms. We take up these
T.G. Theofanous et al. / Experimental Thermal and Fluid Science 26 (2002) 793–810 795

7/28/2019 Boiling Crisis Phenomenon Part2
http://slidepdf.com/reader/full/boiling-crisis-phenomenon-part2 4/18
questions in detail in the next two sections. In the re-
mainder of this section, we can prepare the way by
pointing to an immediate result –– the strong correlation
of CHFs measured to nucleation site densities. In ad-
dition, this is a good place to discuss other relevant
work, on integral burnout performance, including the
previously identified (special) effect of heater thermal
capacity.
From all tests for which we have IR records at, or
very near burnout, we could extract nucleation side
densities, as discussed in Part I, and the results are
shown in Fig. 2. Despite the considerable scatter, a
strong positive correlation is evident. This contradicts
the models of Kolev [25] and Ha and No [26], which,
based on the Wang and Dhir [27] data on nucleation site
density, predict instead a strongly negative correlation.
There are two possible ways to interpret this experi-
mentally found correlation. One, implying an indirect
effect, we could think that what makes the surface re-
sistant to burnout makes it also more amenable to nu-
cleation. Two, supposing a direct effect, we can think of
Table 1
BETA burnout experiments
Experiment Heater thickness
(nm)
Heater aging Water quality Power supply CHF (kW/m2) qcr=qK – Z
F1 1000 Fresh HPLC DC, SS 925 0.77
F2 450 Fresh HPLC DC, SS 950 0.79
F3 270 Fresh DI DC, SS 850 0.71
F4 500 Fresh HPLC DC, SS 800 0.67F5 500 Fresh HPLC DC, T 700 0.58
F6 500 Fresh HPLC DC, T 950 0.79
F7 1000 Fresh HPLC DC, SS 720 0.60
F8 1000 Fresh HPLC DC, SS 750 0.63
F9 140 Fresh DI AC/60 Hz, sin 670 0.56
F10 140 Fresh DI AC/60 Hz, sin 620 0.52
F11 140 Fresh DI AC/60 Hz, sin 600 0.50
F12 140 Fresh DI AC/30 Hz, square 750 0.63
A1 500 Aged HPLC DC, SS 1200 1.00
A2 300 Aged HPLC DC, T 1220 1.02
A3 270 Heavily aged HPLC DC, SS 1517 1.26
A4 500 Heavily aged HPLC DC, SS 1530 1.28
A5 270 Aged DI DC, SS 1156 0.96
A6 270 Heavily aged DI DC, SS 1380 1.15A7 500 Heavily aged HPLC DC, T 1610 1.34
A8 450 Aged HPLC DC, SS 1020 0.85
A9 500 Aged HPLC DC, SS 1000 0.83
A10 270 Aged DI DC, SS 938 0.78
A11 140 Aged DI AC/60 Hz, sin 1159 0.97
A12 140 Aged DI AC/60 Hz, sin 1062 0.88
A13 140 Aged DI AC/1000 Hz,
square
1185 0.99
C1 Copper block Heavily aged HPLC DC, SS 1640 1.37
C2 Copper block Heavily aged HPLC DC, SS 1710 1.43
C3a Copper block Heavily aged HPLC DC, SS 1630 1.36
qK – Z ¼ 1200 kW/m2; AC: alternating current; DC: direct current; SS: Steady State; T: Transient; HPLC: high-purity water used in liquid chro-
matography; DI: de-ionized, clean water.a
In C3, the test section subdivided into eight, 10 Â 10 mm cells.
Fig. 1. Results of the BETA experiment: (}) nanofilm heaters; (N)
thick copper heater with surface modification as noted; (j) thick
copper heater with test section volume subdivided into eight, 10Â 10
mm cells. As shown both extremes are highly reproducible.
qK – Z ¼ 1200 MW/m2. Results of the three AC tests (F9, F10 and F11)
are not shown.
796 T.G. Theofanous et al. / Experimental Thermal and Fluid Science 26 (2002) 793–810

7/28/2019 Boiling Crisis Phenomenon Part2
http://slidepdf.com/reader/full/boiling-crisis-phenomenon-part2 5/18
increasing nucleation with attendant smaller in size nu-
cleation-affected heater areas, and thus an easier resup-
ply of the microlayer in the most vulnerable central
region (see also Sections 3 and 4). In any case, the ob-
served behavior is inconsistent with a ‘‘repulsion’’ or
other external hydrodynamics control idea, as in our
uniform-flux experiments this (vapor flow) repulsion
does not depend on nucleation site density (see also
Section 4).
2.1. Discussion
Previous experiments on pool boiling crisis wereconducted on both horizontal and vertical surfaces,
using heaters of various sizes and shapes (plates, strips,
discs, cylinders, spheres, and wires) –– see, for example,
the reviews of Katto [28,29]. There is almost no atten-
tion paid to the effect of these features on the flow re-
gimes, and with just a few exceptions to be noted below,
nor to the applicability of the Kutateladze–Zuber result.
This has generated confusion not only on the experi-
mental validation of the hydrodynamic theory, but also,
it led to erroneous interpretations of flow structures, and
thus to inappropriate ‘‘models’’. Clarifications of these
matters is necessary if we are to decisively address the
mechanism of burnout in light of all experimental evi-
dence, including the present as well as all previous rel-
evant work.
The commonality of the Kutateladze and Zuber
ideas, expressing the external hydrodynamics control,
boils down to scaling a critical vapor velocity in terms of
the relevant fluid properties –– densities and surface ten-
sion –– and the body force field. There is no external
length scale, and this implies a limitation to horizontal
infinite flat plates. For both there is an ‘‘internal’’ length
scale, the capillary length, and this provides an ap-
proximate measure of the dimensions above which the
plate can be considered infinite –– say of the order of 10
capillary lengths. For water at 1 atmosphere, this means
a length scale of $25 mm. But there are also some basic
differences in the two ways of thinking that have to be
kept in mind in addressing issues of geometry, satisfying
respectively self-similarity.
Zuber’s postulated Rayleigh–Taylor controlled coun-ter-current flow is macroscopic, and it is easy to see that
self-similarity for it requires strict absence of external
length scales able to introduce departures from (on the
average) one-dimensional (1D) behavior [6]. In turn, this
requires that the liquid pool contains no bypass regions
(its cross-section is fully coincident with the heater’s
cross-section), and that it is of small aspect ratio (height
divided by the smallest lateral dimension). Costello et al.
[30] understood all these requirements and their exper-
iments (conforming to them) with a 50 Â 150 mm2
heater yielded a CHF of 1.1 MW/m2, almost in exact
agreement with Eq. (3). Also, Lienhard and Dhir un-
derstood this, as they pursued small length and other-
shape affects within the hydrodynamic context [8,9]. On
the other hand, Gaertner’s [31] experiment conducted
with a 5 cm in diameter disc placed at the bottom of a
deep (20 cm) and wide (14 cm) liquid pool fails to meet
these requirements. Yet, the observed flow regime, a
periodic formation, hovering, and departure of a vapor
‘‘mushroom’’ bubble, which is a direct consequence of
the particular, recirculation inducing, pool geometry,
had a prevailing influence, both in ‘‘re-deriving’’ the
general Kutateladze–Zuber result [28], as well as in in-
spiring several heater-surface-centered (thermal) models
[11,32,33]. Further, these models make use of a microjet-pierced liquid ‘‘macrolayer’’ at the base of the mushroom
bubble, presumably ‘‘seen’’ by Gaertner, but evident
nowhere in his paper. Gaertner [31] measured CHFs of
up to 1.55 MW/m2 (135% of the Kutateladze–Zuber
value) and he took this to be supportive of the hydro-
dynamic limit.
Kutateladze’s idea of ‘‘repulsion’’ is more vaguely
stated, and thus it allows a somewhat greater flexibility
in satisfying self-similarity. It appears that he is focused
in a boundary layer, right next to the heater surface, and
he thinks of a hydrodynamic transition occurring within
this layer. Following his experiments with Gogonin [5],
they assert that a width of even 2 capillary lengths ( $2
mm in their ethanol experiments) is sufficient to elimi-
nate the effect of an external length scale. Their water
pool was deep ($15 cm) and much wider than their
heater (10 cm). These experiments yielded the Ku ¼0:145 result (as in Eq. (3)). Excellent agreement with Eq.
(3) was also reported by Kutateladze and Malenkov in
later water boiling experiments [34]. Unfortunately, no
mention of the flow regimes observed was made in these
papers, but Kutateladze had no doubt that the two-
phase flow above the heater was dispersed and highly
chaotic (i.e., he disagreed with Zuber’s picture of a
Fig. 2. Relation between CHF and nucleation site density measured
just prior to burnout.
T.G. Theofanous et al. / Experimental Thermal and Fluid Science 26 (2002) 793–810 797

7/28/2019 Boiling Crisis Phenomenon Part2
http://slidepdf.com/reader/full/boiling-crisis-phenomenon-part2 6/18
relatively regular array of vapor jets). What remains
unclear is the extent of interplay between the external
hydrodynamics and the transition within the boundary
layer that was the focus of Kutateladze’s interest. In this
interpretation both Gaertner’s and Kutateladze’s own
experiments are open to question of such ‘‘external’’
influences. Remarkably, all other previous experimentsare even further removed from these self-similarity
requirements.
As indicated in Table 1 (and Fig. 1) the highest CHF
level reached in this work, 1.6–1.7 MW/m2, was both
on nanofilm as well as on thick copper heaters. This
is remarkable from a couple of different standpoints
and needs further elaboration. First is the effect(s) of
heater-surface properties already mentioned. Previous
knowledge is based mainly on the work of Hahne and
Diesselhorst [35] and of Liaw and Dhir [36], who ex-
pressed this effect in terms of surface wettability, as
measured by the static contact angle. The latter con-
ducted transition boiling experiments with water and
freon-113 on copper heaters, 63 Â 103 mm2, placed ver-
tically in a pool of liquid being boiled. Freon wets the
copper surface well. For water contact angles obtained
were in the range 18–107°. At 18°, the peak heat flux
measured was near (97%) the ‘‘hydrodynamic’’ limit,
while for higher contact angles the decreasing trend was
as illustrated in Fig. 3 of Part I. This is to be compared
with Fig. 1; all nanofilm heater data being at the same
static contact angle of $65°. Moreover, the highest level
reached with such heaters appears to coincide with the
CHFs measured on the thick copper heater whose sur-
face was treated (as described in Part I) to a highlysmooth and wetting finish –– a contact angle of under 15°.
Second is the effect of heater heat capacity. Previous
knowledge is based mainly on the work of Bergles and
co-workers [37,38], who following sporadic work such as
that of Tachibana et al. [39], Guglielmini and Nannei
[40], expressed the effect in terms of the quantity
DÃ $ dwðk wqwC p ;wÞ1=2, where the wall (heater) thickness
dw, is combined with the quantity containing the wall
thermal properties (conductivity k w, density qw, and
heat capacity C p ;w). They experimented with horizon-
tally suspended, vertically positioned, ribbon heaters (5
mm height by 50 mm length) of various thicknesses,
down to 10 lm, and constitution (copper, steel, mo-
lybdenum, etc.). Carvalho and Bergles [37] correlated
the data, including other data with both plates and
cylinders, independently of orientation (vertical, hori-
zontal), and the result is a gradual diminishing of CHF
from the ‘‘hydrodynamic-limit’’ value for DÃ $ 10, down
to $10% for DÃ $ 5 Â 10À3. The DÃ for our nanofilm
heaters is 10À3, or 0.24 if based on the glass substrate
thickness and properties, and according to the correla-
tion, our CHFs should be limited to $50% and below
10% of the hydrodynamic limit respectively. Instead, our
data show an exceedence to 140%.
3. Characterization of burnout
In Part I (Section 4.3) we identified hot spots that
appear within bubble bases as dry spots. Typically, a dry
spot temperature reaches a maximum, and then it drops
during an apparent rewetting event. We call these ‘‘re-
versible’’ dry spots. At higher heat fluxes, the number of such dry spots increases and so does their lifetime span.
Ultimately, when the CHF level is reached, one or more
of these dry spots take off in a thermal runaway,
growing in size, that quickly lead to heater failure–the
burnout. These are our ‘‘irreversible’’ dry spots. Clearly,
it is this transition from reversible to irreversible dry
spots that contains a major portion of the key physics,
and hence the quantitative definition of the burnout
process. This is the subject of this section. The remain-
der of the key physics is concerned with the hydrody-
namic context in which these dry spot dynamics take
place, that is, the mode of interaction with the external
(to the microlayer) hydrodynamics, and this is the sub-
ject of the next section. We begin with an overview of
previous relevant work found in the literature.
The essentially impossible task of directly observing
dry areas by photographic means was pursued early on
by several well-known investigators [10,31,41,42]. While
nothing concrete could be documented, interpretations
of such visualizations have remained influential (to this
day) in the conceptual perception and modelling of the
dryout phenomenon. In particular, this includes a peri-
odic ‘‘mushroom’’ bubble, fed by a steady, dense micro-
jet system on a liquid macrolayer at its base [11,32] –– a
regime which is negated by the findings of the presentwork.
Instrumentation for direct detection of dry areas was
introduced by Van Ouwerkerk [43]. The heater was a
transparent, vapor-deposited gold film, on a glass sub-
strate, and dry areas could be distinguished from wet
ones on the basis of total reflection of (white) light
shown in from below. Experiments were conducted
with n-heptane, on a 90 Â 90 mm2 heater, within an ap-
parently two-dimentional (2D) test section geometry
(200 Â 200 mm2). He reported observations of dry areas
formed beneath bubbles. At the atmospheric pressure,
burnout was found to occur at heat flux of 195 kW/
m2 –– that is $75% of the Kutateladze–Zuber prediction
(253 kW/m2) for n-heptane. This result is consistent with
CHF obtained in BETA experiments on fresh nanofilm
heaters. Van Ouwerkerk argued that dryout occurs
when a dry area is larger than a critical size.
Apparently unaware of Van Ouwerkerk’s work
Nishio et al. [44] resurrected the total reflection tech-
nique some 25 years later. For a substrate they used a
single sapphire crystal, 5 mm thick, and a transparent
electro-conductive film as the heater. The fluid boiled
was a refrigerant, R113. They used a high-speed video
camera to image a heater area of 9 Â 12 mm2 from
798 T.G. Theofanous et al. / Experimental Thermal and Fluid Science 26 (2002) 793–810

7/28/2019 Boiling Crisis Phenomenon Part2
http://slidepdf.com/reader/full/boiling-crisis-phenomenon-part2 7/18
below through a silicon oil bath. Information about the
heater’s surface characteristics and wettability by R113
is not given in the paper [44]. At low heat fluxes, round
dry areas were found in the bubble bases. As heat flux
increases, the primary dry areas coalesce and cover 40%
of the heater surface. Near CHF the wetted area was
found to exist as a network of wriggling continuouscanals of liquid. This behavior was not borne out by the
infrared thermometry results in BETA.
3.1. General observations of burnout in BETA
In running a test to burnout in BETA, we can observe
the complete heater thermal response in real time, and
as noted above, we have a qualitative warning of an
impending crisis by the number and lifetimes of the
reversible dry spots. Still, a crisis event occurs cata-
strophically in a time frame of less than a second, and
initially it proved difficult to capture by manually trig-
gering the ‘‘recoord’’ of the camera, which at 1000
frames/s allowed only 1 s of record time. Perhaps more
importantly, this forward-recoord trigger precluded cap-
turing the all-too-important sequence of events leading
up to burnout. The situation was remedied by devel-
oping back-trigger capability for our IR camera, and
expanding data transfer and storage to allow a total of
4000 full frames (4 s at 1000 frames/s). A total of four
runs, the F1, F2, A1, and A2 have been recorded in this
fashion so far, and these are the data discussed in this
section. We begin with overall qualitative observations
on representative thermometric images, shown in Figs.
3–6 for these four burnouts, respectively.In these figures, superposed to the two kinds of nu-
cleation patterns (for fresh and aged heaters) discussed
in Part I, we can see the dry areas as bright spots, that
appear and disappear, or grow, and eventually merge, to
the macroscopic patterns that cause failure (in the last
frame of each sequence). Significantly, the growth oc-
curs simultaneously in more than one of the hot spots,
and this is most evident in Fig. 3. On the other hand, as
seen in Fig. 4 (fourth frame) an initial attempt of as
many as five spots to grow and merge is forestalled byFig. 3. Burnout of a fresh heater (F1) at 925 kW/m 2.
Fig. 4. Burnout of a fresh heater (F2) at 950 kW/m2. Sample of nine
frames of IR image from a 4 s record. To illustrate chaotic nature and
variability we chose the frames not to be sequential.
Fig. 5. Burnout of an aged heater (A1) at 1200 kW/m2.
T.G. Theofanous et al. / Experimental Thermal and Fluid Science 26 (2002) 793–810 799
7/28/2019 Boiling Crisis Phenomenon Part2
http://slidepdf.com/reader/full/boiling-crisis-phenomenon-part2 8/18
an apparent rewetting event that lent way to a normal
nucleation pattern in subsequent frames. The same is
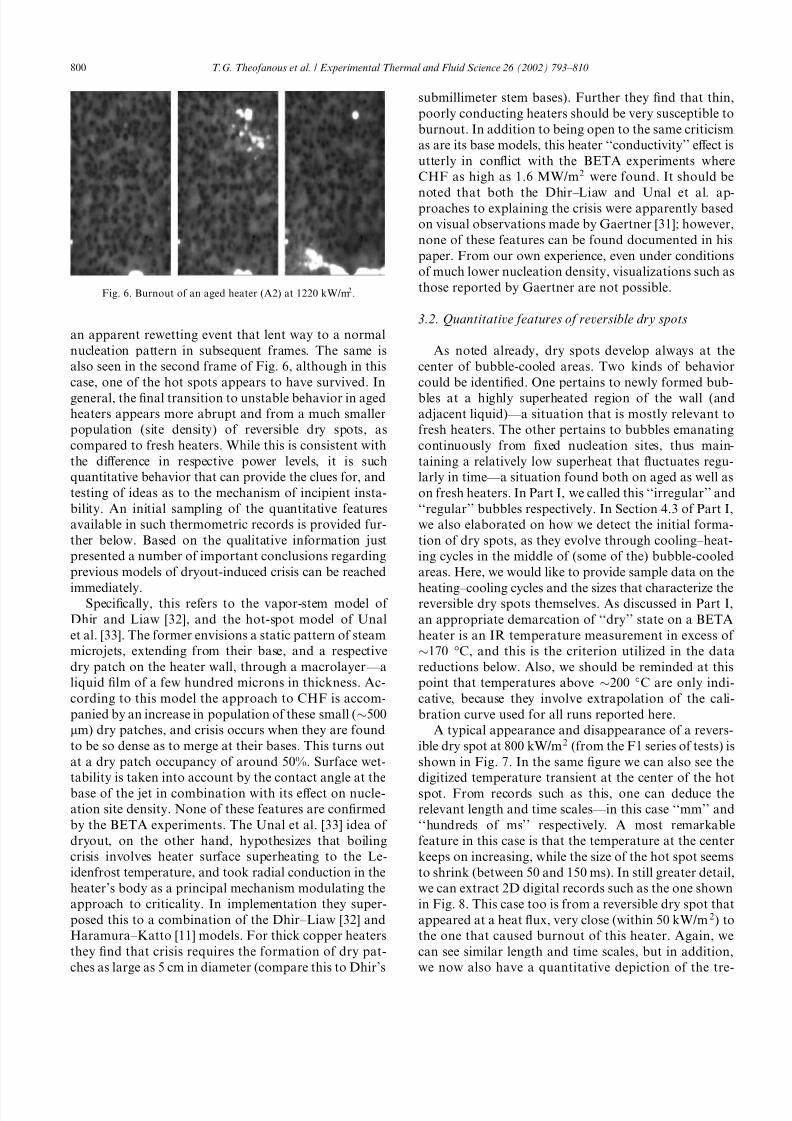
also seen in the second frame of Fig. 6, although in this
case, one of the hot spots appears to have survived. In
general, the final transition to unstable behavior in aged
heaters appears more abrupt and from a much smaller
population (site density) of reversible dry spots, as
compared to fresh heaters. While this is consistent with
the difference in respective power levels, it is such
quantitative behavior that can provide the clues for, and
testing of ideas as to the mechanism of incipient insta-
bility. An initial sampling of the quantitative features
available in such thermometric records is provided fur-
ther below. Based on the qualitative information just
presented a number of important conclusions regarding
previous models of dryout-induced crisis can be reached
immediately.Specifically, this refers to the vapor-stem model of
Dhir and Liaw [32], and the hot-spot model of Unal
et al. [33]. The former envisions a static pattern of steam
microjets, extending from their base, and a respective
dry patch on the heater wall, through a macrolayer –– a
liquid film of a few hundred microns in thickness. Ac-
cording to this model the approach to CHF is accom-
panied by an increase in population of these small ($500
lm) dry patches, and crisis occurs when they are found
to be so dense as to merge at their bases. This turns out
at a dry patch occupancy of around 50%. Surface wet-
tability is taken into account by the contact angle at the
base of the jet in combination with its effect on nucle-
ation site density. None of these features are confirmed
by the BETA experiments. The Unal et al. [33] idea of
dryout, on the other hand, hypothesizes that boiling
crisis involves heater surface superheating to the Le-
idenfrost temperature, and took radial conduction in the
heater’s body as a principal mechanism modulating the
approach to criticality. In implementation they super-
posed this to a combination of the Dhir–Liaw [32] and
Haramura–Katto [11] models. For thick copper heaters
they find that crisis requires the formation of dry pat-
ches as large as 5 cm in diameter (compare this to Dhir’s
submillimeter stem bases). Further they find that thin,
poorly conducting heaters should be very susceptible to
burnout. In addition to being open to the same criticism
as are its base models, this heater ‘‘conductivity’’ effect is
utterly in conflict with the BETA experiments where
CHF as high as 1.6 MW/m2 were found. It should be
noted that both the Dhir–Liaw and Unal et al. ap-proaches to explaining the crisis were apparently based
on visual observations made by Gaertner [31]; however,
none of these features can be found documented in his
paper. From our own experience, even under conditions
of much lower nucleation density, visualizations such as
those reported by Gaertner are not possible.
3.2. Quantitative features of reversible dry spots
As noted already, dry spots develop always at the
center of bubble-cooled areas. Two kinds of behavior
could be identified. One pertains to newly formed bub-
bles at a highly superheated region of the wall (and
adjacent liquid) –– a situation that is mostly relevant to
fresh heaters. The other pertains to bubbles emanating
continuously from fixed nucleation sites, thus main-
taining a relatively low superheat that fluctuates regu-
larly in time –– a situation found both on aged as well as
on fresh heaters. In Part I, we called this ‘‘irregular’’ and
‘‘regular’’ bubbles respectively. In Section 4.3 of Part I,
we also elaborated on how we detect the initial forma-
tion of dry spots, as they evolve through cooling–heat-
ing cycles in the middle of (some of the) bubble-cooled
areas. Here, we would like to provide sample data on the
heating–cooling cycles and the sizes that characterize thereversible dry spots themselves. As discussed in Part I,
an appropriate demarcation of ‘‘dry’’ state on a BETA
heater is an IR temperature measurement in excess of
$170 °C, and this is the criterion utilized in the data
reductions below. Also, we should be reminded at this
point that temperatures above $200 °C are only indi-
cative, because they involve extrapolation of the cali-
bration curve used for all runs reported here.
A typical appearance and disappearance of a revers-
ible dry spot at 800 kW/m2 (from the F1 series of tests) is
shown in Fig. 7. In the same figure we can also see the
digitized temperature transient at the center of the hot
spot. From records such as this, one can deduce the
relevant length and time scales –– in this case ‘‘mm’’ and
‘‘hundreds of ms’’ respectively. A most remarkable
feature in this case is that the temperature at the center
keeps on increasing, while the size of the hot spot seems
to shrink (between 50 and 150 ms). In still greater detail,
we can extract 2D digital records such as the one shown
in Fig. 8. This case too is from a reversible dry spot that
appeared at a heat flux, very close (within 50 kW/m 2) to
the one that caused burnout of this heater. Again, we
can see similar length and time scales, but in addition,
we now also have a quantitative depiction of the tre-
Fig. 6. Burnout of an aged heater (A2) at 1220 kW/m2.
800 T.G. Theofanous et al. / Experimental Thermal and Fluid Science 26 (2002) 793–810

7/28/2019 Boiling Crisis Phenomenon Part2
http://slidepdf.com/reader/full/boiling-crisis-phenomenon-part2 9/18
mendously steep temperature gradients (6000 K/mm) in
the region between the hot spot and the surrounding
‘‘cool’’ area. Even with our extremely thin and poorly
conducting heater-substrate assembly, at such tempera-
ture gradients, conduction cannot be completely ne-
glected, and a significant amount of additional work (in
data analysis) is needed in order to extract all that is
possible from such a detailed diagnostics. Remarkable
in this figure is the profile at 134 ms –– it shows simul-
taneous heatup (and dryout) at the center, and coolingin a surrounding (ring) area (a contact line moving
outwards).
Reversible dry spots are of immense interest, because
it is through them that the burnout runaway, that is the
irreversible dry spots, arise. Thus, we are especially in-
terested in reversible dry spot behavior very near and
during burnout, and this will be the focus of the rest of
our discussion in this subsection.
Typically, we found reversible dry spots to grow to a
size of 1–4 mm, the larger sizes favored by fresh heaters
and irregular bubbles. Corresponding lifetimes were
found to range from 60 to 600 ms. Representative data
are summarized in Fig. 9. Note that the character, in this
respect, of every heater is starkly different. Of these four
runs, it appears that F2 found itself at a final power level
that was particularly close to the transition to unstable
behavior, and thus it provided, by comparison to the
other runs, a much wider ‘‘action’’, and thus data, on
reversible dry spots (see Fig. 4). As we can see in Fig. 9,
these data show that sizes and lifetimes are correlated in
a manner that can be understood intuitively –– the bigger
spots live longer. On the other hand, the scatter ob-
served, especially for the smallest spots, can be under-
stood by recognizing the significant role of radial
Fig. 7. Illustration of the dynamics of a reversible dryspot on a fresh heater (F1), at 800 kW/m 2. The figures show an area of 6 mm  6 mm of the
heater. The temperature scales are shown to the right of each image. The temperature transient shown on the extreme right is for the center spot of
the images pictured, including intermediate frames not shown on the left.
Fig. 8. Evolution of the temperature field around a nucleation site that
becomes the origin of a dry spot in test F2.
T.G. Theofanous et al. / Experimental Thermal and Fluid Science 26 (2002) 793–810 801

7/28/2019 Boiling Crisis Phenomenon Part2
http://slidepdf.com/reader/full/boiling-crisis-phenomenon-part2 10/18
conduction in dissipating a portion of the thermal en-
ergy generated within the dry area. For example, for a
well-supplied (evaporating) meniscus around a 0.7 mm
in diameter dry spot, a heat flux of up to 1 MW/m2 can
be dissipated before the center exceeds 250 °C.
A further detail of behavior is available by looking at
the growth–collapse dynamics of the dry spots, as il-
lustrated in Figs. 10 and 11. In these figures, the time
and dry spot diameter have been normalized by the
lifetime (t total) and maximum diameter (d maxds ) of each dry
spot respectively. Two kinds of behavior have been
discerned. One (let us say Type 1) as depicted in Fig. 10,involves a very rapid growth to the maximum size,
within a time frame of $1=10th of the lifetime, and then
a gradual, pretty monotonic collapse. The other (Type
2), shown in Fig. 11, exhibits a ‘‘hesitant’’ or interrup-
tive growth, through a complex series of steps, over a
time frame that can extend up to $1=2 of the lifetime,
and then a gradual collapse, the tail end of which (last
$40%) appears to be quite more precipitous in com-
parison to the collapses seen in Fig. 10. Still another,
complementary perspective can be obtained from Fig.
12, showing the fractional growth time (t grow=t total) of
the dry spots analyzed against their maximum diameter.
We can see that Type 1 and Type 2 dry spots are dis-
tinguished by their large and small sizes respectively.
This method of presentation ––
dry spot diameter nor-malized by the mean distance between nucleation sites,
lns $ ffiffiffiffiffiffiffiffiffi
1= N p
’ 3:45 mm in this run –– also shows that the
size of dry spots is some fraction of this mean distance,
while being bounded by it from above. Along these lines
Fig. 9. Relation between size of reversible dry spots and their lifetime
span.
Fig. 10. Growth and collapse of three reversible Type 1 dry spots in
test F2.
Fig. 11. Growth and collapse of three reversible Type 2 dry spots in
test F2.
Fig. 12. Fractional expansion time versus maximum dry spot size
normalized by lns ’ 3:45 mm (Test F2).
802 T.G. Theofanous et al. / Experimental Thermal and Fluid Science 26 (2002) 793–810
7/28/2019 Boiling Crisis Phenomenon Part2
http://slidepdf.com/reader/full/boiling-crisis-phenomenon-part2 11/18
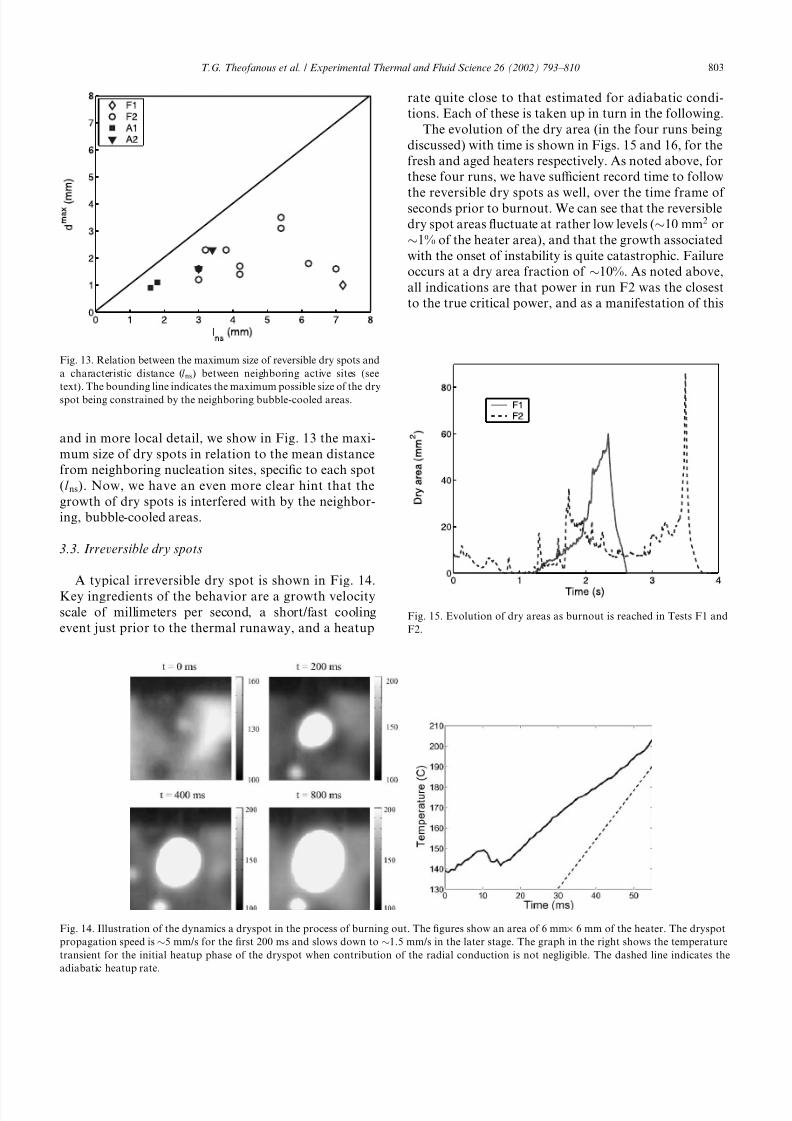
and in more local detail, we show in Fig. 13 the maxi-
mum size of dry spots in relation to the mean distance
from neighboring nucleation sites, specific to each spot
(lns). Now, we have an even more clear hint that the
growth of dry spots is interfered with by the neighbor-
ing, bubble-cooled areas.
3.3. Irreversible dry spots
A typical irreversible dry spot is shown in Fig. 14.
Key ingredients of the behavior are a growth velocity
scale of millimeters per second, a short/fast cooling
event just prior to the thermal runaway, and a heatup
rate quite close to that estimated for adiabatic condi-
tions. Each of these is taken up in turn in the following.
The evolution of the dry area (in the four runs being
discussed) with time is shown in Figs. 15 and 16, for the
fresh and aged heaters respectively. As noted above, for
these four runs, we have sufficient record time to follow
the reversible dry spots as well, over the time frame of seconds prior to burnout. We can see that the reversible
dry spot areas fluctuate at rather low levels ($10 mm2 or
$1% of the heater area), and that the growth associated
with the onset of instability is quite catastrophic. Failure
occurs at a dry area fraction of $10%. As noted above,
all indications are that power in run F2 was the closest
to the true critical power, and as a manifestation of this
Fig. 13. Relation between the maximum size of reversible dry spots and
a characteristic distance (lns) between neighboring active sites (see
text). The bounding line indicates the maximum possible size of the dry
spot being constrained by the neighboring bubble-cooled areas.
Fig. 15. Evolution of dry areas as burnout is reached in Tests F1 and
F2.
Fig. 14. Illustration of the dynamics a dryspot in the process of burning out. The figures show an area of 6 mm  6 mm of the heater. The dryspot
propagation speed is $5 mm/s for the first 200 ms and slows down to $1.5 mm/s in the later stage. The graph in the right shows the temperature
transient for the initial heatup phase of the dryspot when contribution of the radial conduction is not negligible. The dashed line indicates the
adiabatic heatup rate.
T.G. Theofanous et al. / Experimental Thermal and Fluid Science 26 (2002) 793–810 803
7/28/2019 Boiling Crisis Phenomenon Part2
http://slidepdf.com/reader/full/boiling-crisis-phenomenon-part2 12/18
we see again here the greatly expanded reversible dry
spot ‘‘activity’’ on a time scale of seconds.
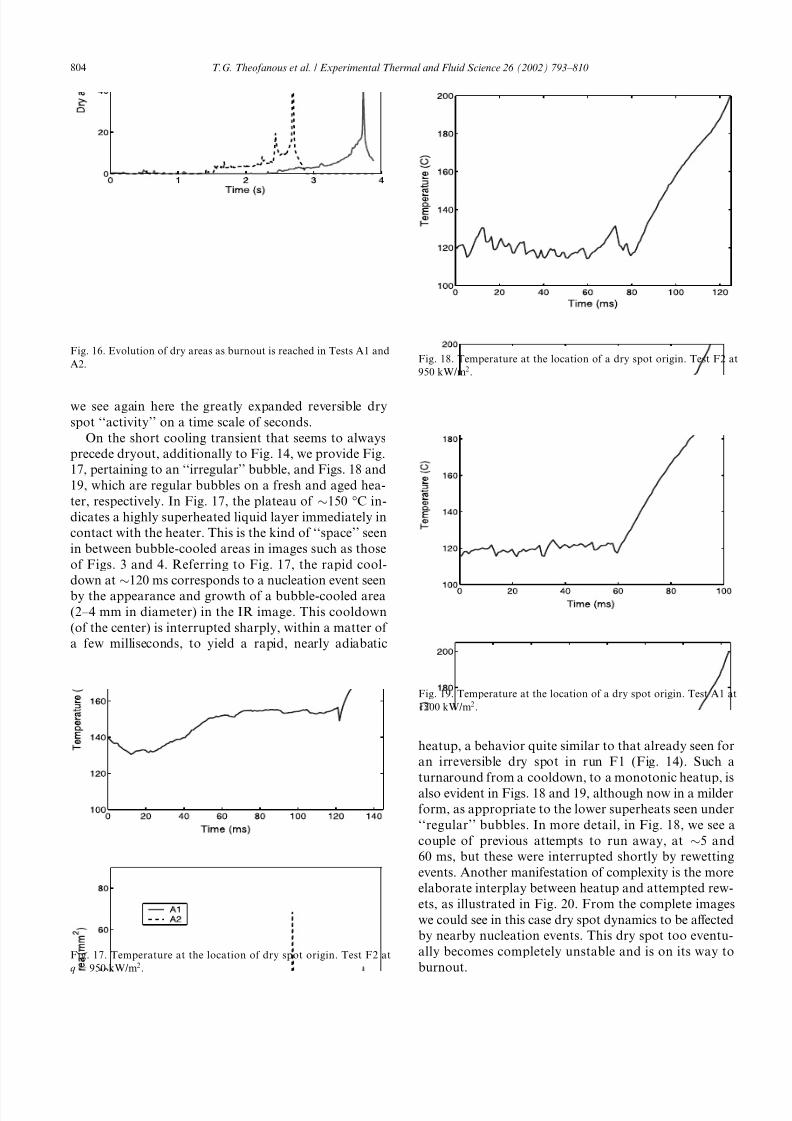
On the short cooling transient that seems to always
precede dryout, additionally to Fig. 14, we provide Fig.
17, pertaining to an ‘‘irregular’’ bubble, and Figs. 18 and
19, which are regular bubbles on a fresh and aged hea-
ter, respectively. In Fig. 17, the plateau of $150 °C in-
dicates a highly superheated liquid layer immediately in
contact with the heater. This is the kind of ‘‘space’’ seen
in between bubble-cooled areas in images such as those
of Figs. 3 and 4. Referring to Fig. 17, the rapid cool-
down at $120 ms corresponds to a nucleation event seen
by the appearance and growth of a bubble-cooled area
(2–4 mm in diameter) in the IR image. This cooldown
(of the center) is interrupted sharply, within a matter of
a few milliseconds, to yield a rapid, nearly adiabatic
heatup, a behavior quite similar to that already seen for
an irreversible dry spot in run F1 (Fig. 14). Such a
turnaround from a cooldown, to a monotonic heatup, is
also evident in Figs. 18 and 19, although now in a milder
form, as appropriate to the lower superheats seen under
‘‘regular’’ bubbles. In more detail, in Fig. 18, we see a
couple of previous attempts to run away, at $5 and
60 ms, but these were interrupted shortly by rewetting
events. Another manifestation of complexity is the more
elaborate interplay between heatup and attempted rew-
ets, as illustrated in Fig. 20. From the complete images
we could see in this case dry spot dynamics to be affected
by nearby nucleation events. This dry spot too eventu-
ally becomes completely unstable and is on its way to
burnout.
Fig. 16. Evolution of dry areas as burnout is reached in Tests A1 and
A2.
Fig. 17. Temperature at the location of dry spot origin. Test F2 at
q ¼ 950 kW/m2.
Fig. 18. Temperature at the location of a dry spot origin. Test F2 at
950 kW/m2.
Fig. 19. Temperature at the location of a dry spot origin. Test A1 at
1200 kW/m2.
804 T.G. Theofanous et al. / Experimental Thermal and Fluid Science 26 (2002) 793–810

7/28/2019 Boiling Crisis Phenomenon Part2
http://slidepdf.com/reader/full/boiling-crisis-phenomenon-part2 13/18
Remarkably, in none of the irreversible dry spots
observed did the heatup rate quite match that calculated
for an adiabatic condition, as one would expect for a
large ( D > 2 mm) dry spot. For example, while the ini-
tial heatup rate in Fig. 14 ($1400 K/s) is consistent with
an energy balance that accounts for radial conduction
through the glass substrate as the only loss mechanism,
later on it is seen to ‘‘fall off’’ (rather than approach) the
adiabatic heatup rate also shown in the figure ($2400 K/
s). Similarly, the heatup rates in Figs. 17–19, 2500, 1750
and 2233 K/s respectively, are lower than the adiabatic
values of 3166, 3166 and 4000 K/s. We have tried to bemeticulous about the thermophysical properties of the
glass utilized in these calculations, but the values used
for heat capacity could not be positively confirmed.
Similarly, we took extra pains to confirm the thermal
power delivered to our heater under both wet and dry
conditions, also taking into account the resistivity vari-
ation with temperature (see Part I). On the other hand,
we note that all thermal runaways show a smooth
monotonic increase, unlike the fluctuating behavior due
to losses to the fluid above seen in all other situations
preceding the thermal runaway (see Figs. 17–19). A
number of possible, but ‘‘exotic’’ mechanisms for losses
beyond film boiling come to mind, so this matter de-
serves further investigation.
In conclusion, these direct observations of the burn-
out process in BETA suggest that dryout is a sharply
defined critical phenomenon, with highly localized, but
not singularly so, incipience, and very rapid (runaway)
character. One key context of this incipience is a highly
dynamic appearance and collapse of (reversible) dry
spots, which are highly localized too, affecting less than
1% of the area. The other context is the microlayers that
feed the so-formed contact lines (microhydrodynamics),
and the interaction of these microlayers with the exter-
nal hydrodynamics –– the two-phase counter-current
flow on top of the heater. This is the subject of the next
section.
Views of burnout that are generally consistent with
the ‘‘critical’’ character of the phenomena identified/
quantified above, have been previously postulated by
Reyes and Wayner [45] and Sefiane et al. [46]. Reyes andWayner looked at the forces around a static contact line,
and tried to relate the onset of instability to a ‘‘critical’’
temperature. The BETA experiments show that burnout
on a heater may be initiated in the bubble bases with
local surface superheats varying from 20 to 60 K. This
contradicts the Reyes–Wayner concept that relates
burnout to a heater-surface-average critical superheat
($30 K for water). Sefiane and co-workers, on the other
hand, again focused on the stability of contact lines,
assigned a principal role on the vapor recoil as a de-
stabilizing mechanism as first introduced in the work of
Palmer [47] for liquid evaporation at reduced pressure.
Application of this mechanism to boiling crisis has
however been only discussed in qualitative terms. It is
interesting to note that for conditions of interest (water,
atmospheric pressure) the recoil pressure [D P ’ ðq= H lgÞ2=qv], being the driving force for the recoil insta-
bility, is about 0.25 Pa, while the stabilizing force due to
surface tension ($r=d) on a thin layer (d) is several order
of magnitudes larger.
4. Flow regimes
At a heat flux of 1 MW/m2 the superficial vapor
velocity is $1 m/s and the flow is well past the point
where a bubbly regime can be sustained. According to
Kutateladze [24], this kind of transition occurs at
Ku ¼ 0:3
ffiffiffiffiffiqv
q‘
r $ 10À2 ð4Þ
that is, at a heat flux of $100 kW/m2. At such relatively
high velocities then, the vapor flow is accommodated by
‘‘expanding’’ the two-phase region sufficiently to allow
an increasing amount of disengagement from the liquid
in the pool. In a 1D geometry this occurs by the co-
alescence into larger bubbles, and ultimately by the
formation of temporary vapor channels, that impart a
‘‘churning’’ or ‘‘chugging’’ quality to it. In this regime,
typically the void fractions reach, on a time-averaged
basis, to above $40%, and vary slowly with vapor flow.
The characteristic scales of such a flow pattern are much
greater than that of the capillary length, and the detailed
behavior now depends very much on the geometry and
dimensions of the flow domain. However, the key
character of the flow is ‘‘churning’’, in any case, over a
range of vapor velocities up to an order of magnitude
greater (see Section 1), and this we believe we captured
Fig. 20. Temperature at the location of a dry spot origin. Test F2 at
950 kW/m2.
T.G. Theofanous et al. / Experimental Thermal and Fluid Science 26 (2002) 793–810 805
7/28/2019 Boiling Crisis Phenomenon Part2
http://slidepdf.com/reader/full/boiling-crisis-phenomenon-part2 14/18
in our BETA test section, by operating with low aspect
ratio (height to the smaller lateral dimension) liquid
pools.
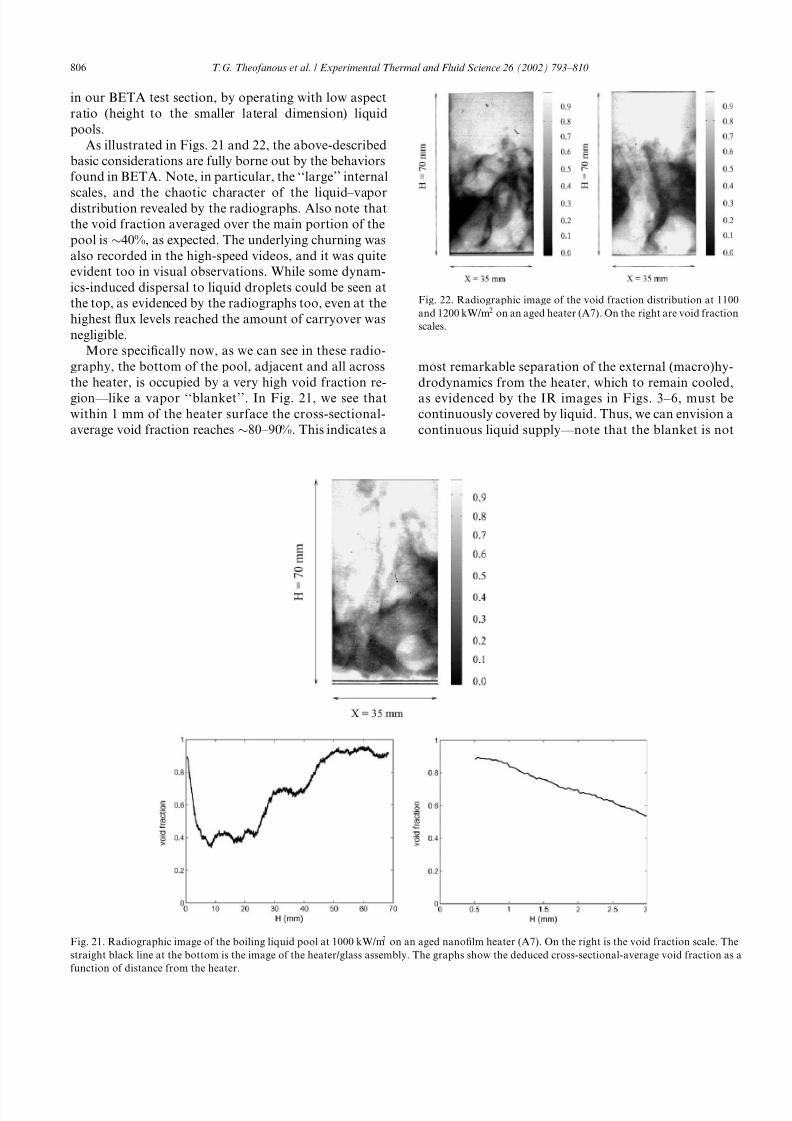
As illustrated in Figs. 21 and 22, the above-described
basic considerations are fully borne out by the behaviors
found in BETA. Note, in particular, the ‘‘large’’ internal
scales, and the chaotic character of the liquid–vapordistribution revealed by the radiographs. Also note that
the void fraction averaged over the main portion of the
pool is $40%, as expected. The underlying churning was
also recorded in the high-speed videos, and it was quite
evident too in visual observations. While some dynam-
ics-induced dispersal to liquid droplets could be seen at
the top, as evidenced by the radiographs too, even at the
highest flux levels reached the amount of carryover was
negligible.
More specifically now, as we can see in these radio-
graphy, the bottom of the pool, adjacent and all across
the heater, is occupied by a very high void fraction re-
gion ––
like a vapor ‘‘blanket’’. In Fig. 21, we see that
within 1 mm of the heater surface the cross-sectional-
average void fraction reaches $80–90%. This indicates a
most remarkable separation of the external (macro)hy-
drodynamics from the heater, which to remain cooled,
as evidenced by the IR images in Figs. 3–6, must be
continuously covered by liquid. Thus, we can envision a
continuous liquid supply –– note that the blanket is not
Fig. 21. Radiographic image of the boiling liquid pool at 1000 kW/m 2 on an aged nanofilm heater (A7). On the right is the void fraction scale. The
straight black line at the bottom is the image of the heater/glass assembly. The graphs show the deduced cross-sectional-average void fraction as a
function of distance from the heater.
Fig. 22. Radiographic image of the void fraction distribution at 1100
and 1200 kW/m2 on an aged heater (A7). On the right are void fraction
scales.
806 T.G. Theofanous et al. / Experimental Thermal and Fluid Science 26 (2002) 793–810

7/28/2019 Boiling Crisis Phenomenon Part2
http://slidepdf.com/reader/full/boiling-crisis-phenomenon-part2 15/18
100% vapor –– and an attendant action at the microhy-
drodynamic level, as this liquid spreads upon an ex-
tended microlayer, while nucleation events within it
participate in the spreading process, expelling any excess
to the region above.
That this ‘‘separation’’ is organic is further evidenced
by contrasting the chaotic macrohydrodynamics above,to the order, uniformity, and regularity of the micro-
hydrodynamics on the heater, as seen in the IR mov-
ies –– and only partly evident in the selected frames
shown in Figs. 3–6. We can thus refer to a ‘‘scales sep-
aration’’ phenomenon, in high heat flux, saturated pool
boiling. One implication is that the heater and the ex-
tended liquid microlayer on it operate autonomously,
that is, without any significant influence of the external
hydrodynamics. A subsequent implication is that since
the presence of the liquid pool is only incidental, the
burnout phenomenon can be studied in isolation by
focusing on the heater-microlayer system alone. This is
beneficial in eliminating the obscuring (and superfluous)
external hydrodynamics, allowing direct visual access
from above as well (Configuration B in Fig. 4 of Part I)
and an even better understanding of the microhydro-
dynamics through control of the liquid supply.
In conjunction with the above-identified scale sepa-
ration, we can now examine the IR records towards
understanding the flow regimes that govern microhy-
drodynamics. Ignoring transient effects (the time con-
stant of a 5 lm thick microlayer, heated on one side,
vaporizing on the other, is 0.5 ms) the temperature of
every pixel on the IR record can be converted to a mi-crolayer thickness (d) by d ¼ k ‘ðT w À T sÞ=q, where T wand T s are the heater and saturation temperatures re-
spectively. Sample results for a fresh and a heavily aged
heater are shown in Figs. 23 and 24 respectively. The
picture is one of an ‘‘extended’’ microlayer punctuated
by steep depressions (‘‘craters’’), where thicknesses reach
down to a few microns. Sequential arrangements of
frames such as these allow one to visualize the full dy-
namic pattern of the microhydrodynamics. The average
thickness of the microlayer in an aged heater is in the
range from 10 to 15 lm, while for fresh heaters this
range changes to 20–30 lm near-CHF conditions. The
thicker film (30 lm) corresponds to surface superheats
of up to 55 K. Such a high superheat is present in the
nucleation-free areas of fresh heater just prior to the dry
spot formation. In the region between bubble sites, heat
is removed from the heater surface to evaporating
Fig. 23. Map of microlayer thickness on a fresh heater (test F1) near burnout at q ¼ 850 kW/m2. The thickness map presented is pixel
(250 lm  250 lm) –– averaged and with an accuracy of Æ5% (relative) due to time response of the glass heater.
T.G. Theofanous et al. / Experimental Thermal and Fluid Science 26 (2002) 793–810 807

7/28/2019 Boiling Crisis Phenomenon Part2
http://slidepdf.com/reader/full/boiling-crisis-phenomenon-part2 16/18
interface by means of heat conduction through the liq-
uid film. The dynamics and stability of this liquid layer
are likely to be governed by the distance between the
neighboring nucleation sites. This explains the effect that
nucleation patterns have on the burnout.
Clearly, ‘‘rupture’’ of the liquid film under certain
conditions and subsequent dry spot spreading produces
boiling crisis. What is at play here is a complex set of
hydrodynamic phenomena coupled to capillarity, in-
cluding: long-range forces at the nucleation at the nu-
cleation-site-tips of the microlayer, viscous flow
supplying the microlayer from the surrounding thicker
regions, surface tension forces due to the curvature at
the tip. All these combine with the nucleation site den-
sity which supplies an ‘‘external’’ length scale, to medi-
ate conditions for which the supply (flow into the
depression) is not large enough to make up the demand
due to evaporation.
Digitized records, such as those shown in Figs. 23 and
24 provide the basis for more detailed quantitative
analysis, including possible corrections due to transient
and lateral conduction effects, as well as for guiding and
testing predictive models of the relevant processes. All in
all, we have here the ‘‘fingerprints’’ of boiling, all the
way into burnout, and a scale separation phenomenon
as a general organizing principle for saturated, high heat
flux boiling, that allows proper focusing on the micro-
hydrodynamics as the sole control of boiling crisis.
5. Concluding remarks
• This work addresses boiling heat transfer –– a subject
that despite its outstanding technological importance,
and indeed a most rich fluid-physics content, has re-
mained deeply misunderstood. We focused on boiling
crisis, a phenomenon that leads to ‘‘burnout’’, that is
the physical destruction of the heat-generating body,
once a certain value of heat flux is exceeded. Recog-
nizing that boiling is the most efficient mode of heat
transfer, this ‘‘limits to coolability’’ question is really
of profound character, both in the practical as well as
the scientific contexts.
• In this work we have found a new way to focus the
question, and this we believe creates new opportuni-
ties for rapid progress toward basic understanding,
and consequently toward prediction as needed for de-
sign. This is important for balancing construction/
Fig. 24. Map of microlayer thickness on a heavily aged heater (test A4) near burnout at q ¼ 1500 kW/m2. The thickness map presented is pixel
(250 lm  250 lm) –– averaged and with an accuracy of Æ5% (relative) due to time response of the glass heater.
808 T.G. Theofanous et al. / Experimental Thermal and Fluid Science 26 (2002) 793–810

7/28/2019 Boiling Crisis Phenomenon Part2
http://slidepdf.com/reader/full/boiling-crisis-phenomenon-part2 17/18
operation costs of engineering equipment against re-
liability/safety concerns. This is important, too, for
creating ‘‘designer’’ surfaces for specialized cooling
demands (microelectronics, refrigeration, etc.). Fi-
nally, this is (perhaps most crucially) important in
cases that prohibit trial-and-error approaches, such
as needed in certain space and nuclear applications.• The experimental approach developed and employed
in the present work was found to be crucial for the
understanding of the boiling crisis phenomenon.
The first key element of the experimental approach
is the ability to see the whole patterns of heat transfer
and fluid flow, and to obtain quantitative informa-
tion about what happens on the heater-surface prior
and during the burnout. This was achieved by means
of high-speed, high-resolution infrared thermometry
on a nanoscale heater, and X-ray radiographic imag-
ing of the boiling liquid volume. The other key element
is the ability to control and characterize experimental
conditions, through the use of high-purity water, the
contamination-free test section, a protocol for heater
aging, and the heater’s pre- and post-test microscopic
and nanoscopic examination.
• At high heat fluxes, both reversible and irreversible
dry spots were observed. The BETA experimental
data indicates that the dry spot growth is constrained
and guided by neighboring active nucleation sites.
Furthermore, the data obtained in burnout experi-
ments show a direct correlation between CHF and
nucleation site density. Nucleation site density in turn
was found to increase with the degree of heater aging.
This finding indicates a potential to improve the hea-ter performance through controlled surface oxidation
and microstructuring.
• The BETA infrared images show an increasing order
and regularity of the thermal pattern as the heat flux
increases. This contrasts with an increasingly chaotic
behavior of the two-phase flow dynamics above the
heater as evidenced by the X-ray images of the boil-
ing zone. Thus we can conclude that boiling heat
transfer is independent of the complex two-phase
flow hydrodynamics above the heater, and in partic-
ular that the previous hydrodynamic theory of boil-
ing crisis is not appropriate.
• This separation of scales creates a focus of inquiry for
the dynamics of microlayer sitting and vaporizing on
the heater surface as an autonomous system. This in
turn means that such an extended microlayer, and its
rupture, can be studied in its own, by direct observa-
tion, both from above, as well as by high-speed infra-
red thermometry from below.
• We believe the same organizing principle, that is the
scale separation, will be present at least under the
weak convection conditions most interesting for
space applications. Now, for both pool and convec-
tion boiling, the research must focus on the role of
heater-surface and liquid properties, as those alone
determine coolability limit, at 1 g , and we have strong
reasons to believe that this is true also for fractional
gravities (Moon, Mars) as well.
Acknowledgements
The multifaceted, long-range approach described in
this paper became possible thanks to the cooperative
support through NASA grant NAG3-2119 Office of Bio-
logical and Physical Research, US Nuclear Regulatory
Commission Contract NRC-04-98-051, and Lawrence
Livermore National Laboratory Contract B502686. We
are grateful to Dr. T. King (NRC), Dr. J. McQuillan
(NASA), and Dr. S. Dimolitsas (LLNL) for their en-
couragement and cooperation. We appreciate the help
of Mr. M. Vanderbroek (UCSB) in vapor-depositing
the nanofilm heaters and Dr. A. Adams (SBFP) in
technical support for the infrared camera. The authors
are thankful to the technical support for this work
provided by Mr. T. Salmassi and Dr. K. Gasljevic at
UCSB/CRSS on the design and construction of the
BETA test section, power supply, and X-ray operation.
The work made use of the MRL Central Facilities
supported by the National Science Foundation under
award DMR96-32716.
References
[1] S.S. Kutateladze, On the transition to film boiling under naturalconvection, Kotloturbostrenie 3 (1948) 10.
[2] S.S. Kutateladze, Hydrodynamic model of heat transfer crisis in
free-convection boiling, J. Tech. Phys. 20 (11) (1950) 1389–1392.
[3] S.S. Kutateladze, Hydrodynamic theory of boiling regime transi-
tion in free convection, Bull. Acad. Sci., USSR 4 (1951) 529–536.
[4] S.S. Kutateladze, I.G. Malenkov, Experimental investigation of
the analogy between the process of boiling and bubbling, J. Appl.
Mech. Tech. Phys. 7 (2) (1966) 97–99.
[5] I.I. Gogonin, S.S. Kutateladze, Critical heat flux as a function of
heater size for a liquid boiling in a large enclosure, J. Eng. Phys. 33
(5) (1977) 1286–1289.
[6] N. Zuber, On the stability of boiling heat transfer, ASME J. Heat
Transfer 80 (2) (1958) 711–720.
[7] N. Zuber, Hydrodynamic aspects of boiling heat transfer. Ph.D.
Thesis, UCLA, 1959 (also USAEC Rep. AECU-4439).[8] J.H. Lienhard, V.K. Dhir, Hydrodynamic prediction of peak
pool-boiling heat fluxes from finite bodies, Trans. ASME, J. Heat
Transfer 95 (2) (1973) 153–158.
[9] J.H. Lienhard, V.K. Dhir, D.M. Riherd, Peak pool boiling heat
flux measurement on finite horizontal flat plates, Trans. ASME,
J. Heat Transfer 95 (4) (1973) 477–482.
[10] Y. Katto, S. Yokoya, Principal mechanism of boiling crisis in pool
boiling, Int. J. Heat Mass Transfer 11 (6) (1968) 993–1002.
[11] Y. Haramura, Y. Katto, A new hydrodynamic model of critical
heat flux applicable widely to both pool and forced convection
boiling on submerged bodies in saturated liquids, Int. J. Heat
Mass Transfer 26 (3) (1983) 389–399.
[12] V.K. Dhir, Boiling heat transfer, Annu. Rev. Fluid Mech. 30
(1998) 365–401.
T.G. Theofanous et al. / Experimental Thermal and Fluid Science 26 (2002) 793–810 809

7/28/2019 Boiling Crisis Phenomenon Part2
http://slidepdf.com/reader/full/boiling-crisis-phenomenon-part2 18/18
[13] C.P. Costello, W.J. Frea, A salient non-hydrodynamic effect in
pool boiling burnout of small semi-cylinder heater, Chem. Eng.
Prog. Symp. Ser. 61 (1965) 258–268.
[14] E.A. Kazakova, Effect of pressure on first crisis in water boiling
on a horizontal plate, in: S.S. Kutateladze (Ed.), Issues in heat
transfer under phase change, GEI, Moscow, 1953, pp. 92–101.
[15] S.S. Kutateladze, N.N. Mamontova, Investigation of critical heat
fluxes with pool boiling of liquids under reduced pressure con-
ditions, Inzenerno-Fizicheski J. 12 (3) (1967) 181–186.
[16] D.A. Labulsov, V.V. Yagov, A.K. Gorodov, Critical heat fluxes
in boiling at low pressure region, in: Proceedings of the 6th
International Heat Transfer Conference, vol. 1, 1978, pp. 221–225.
[17] B.P. Avksentyuk, Z.S. Mesrakesshivili, The effect of subcooling
on critical heat fluxes with liquid boiling in the region of sub-
atmospheric pressures, in: Boiling and Condensation, Novosi-
birsk, Institute of Thermal Physics, USSR Academy of Sciences,
1986, pp. 46–51.
[18] G.I. Samokhin, V.V. Yagov, Heat transfer and critical fluxes with
liquids boiling in the region of low reduced pressures, Thermal
Eng. 35 (1988) 115–118.
[19] V.V. Yagov, A physical model and calculation formula for critical
heat fluxes with nucleate pool boiling of liquids, J. Thermal Eng.
35 (6) (1988) 333–339.
[20] J. Straub, M. Zell, B. Vogel, Pool boiling in reduced gravity field,
in: Proceedings of the 9th International Heat Transfer Conference,
Jerusalem, Israel, vol. 1, Hemisphere, NY, 1990, pp. 91–112.
[21] Y. Abe, T. Oka, Y. Mori, A. Nagashima, Pool boiling of a non-
azeotropic mixture under microgravity, Int. J. Heat Mass Transfer
37 (1994) 2405–2413.
[22] T. Oka, Y. Abe, Y.H. Mori, A. Nagashima, Pool boiling of
n-pentane, CFC-113, and water under reduced gravity: parabolic
flight experiments with a transparent heater, Trans. ASME J.
Heat Transfer 117 (2) (1995) 408–417.
[23] D.P.Shatto, G.P. Peterson, Pool boilingcritical heatflux in reduced
gravity, Trans. ASME J. Heat Transfer 121 (1999) 865–873.
[24] S.S. Kutateladze, Elements of the hydrodynamics of gas–liquid
systems, Fluid Mech. –– Soviet Res. 1 (4) (1972) 29–68.
[25] N.I. Kolev, How accurately can we predict nucleate boiling, Exp.Thermal Fluid Sci. 10 (1995) 370–378.
[26] S.J. Ha, H.C. No, A dry-spot model of critical heat flux applicable
to both pool boiling and subcooled forced convection boiling, Int.
J. Heat Mass Transfer 43 (2) (2000) 241–250.
[27] C.H. Wang, V.K. Dhir, Effect of surface wettability on active
nucleation site density during pool boiling of water on a vertical
surface, J. Heat Transfer 115 (3) (1993) 659–669.
[28] Y. Katto, Critical heat flux in pool boiling, in: V.K. Dhir, A.E.
Bergles (Eds.), Proceedings of Engineering Foundation Confer-
ence on ‘‘Pool and External Flow Boiling’’, ASME, New York,
1992, pp. 151–164.
[29] Y. Katto, Critical heat flux, Int. J. Multiphase Flow 20 (suppl.)
(1994) 53–90.
[30] C.P. Costello, C.O. Bock, C.C. Nichols, A study of induced
convective effects on pool boiling burnout, CEP Symp. 61 (59)(1966) 271–280.
[31] R.F. Gaertner, Photographic study of nucleate pool boiling on a
horizontal surface, J. Heat Transfer 87 (1965) 17–29.
[32] V.K. Dhir, S.P. Liaw, Framework for a unified model for nucleate
and transition pool boiling, J. Heat Transfer 111 (1989) 739–745.
[33] C. Unal, P. Sadasivan, R. Nelson, On the hot-spot-controlled
critical heat flux mechanism in pool boiling of saturated fluids, in:
V.K. Dhir, A.E. Bergles (Eds.), Proceedings of Engineering
Foundation Conference on ‘‘Pool and External Flow Boiling’’,
ASME, New York, 1992, pp. 193–201.
[34] S.S. Kutateladze, I.G. Malenkov, Hydrodynamic analogy be-
tween heat transfer and nucleate boiling crisis in boiling and
bubbling, Exp. data. Heat Transfer –– Soviet Res. 16 (4) (1984) 1–
46.
[35] E. Hahne, T. Diesselhorst, Hydrodynamic and surface effects on
the peak heat flux in pool boiling, in: Proceedings of the 6th
International Heat Transfer Conference, Toronto, vol. 1, 1978,
pp. 209–219.
[36] S.P. Liaw, V.K. Dhir, Effect of surface wettability on transition
boiling heat transfer from a vertical surface, in: Proceedings of the
8th International Heat Transfer Conference, San Fransisco, vol. 4,
1986, pp. 2031–2036.
[37] R.D.M. Carvalho, A.E. Bergles, The effects of the heater thermal
conductance/capacitance on the pool boiling critical heat flux, in:
V.K. Dhir, A.E. Bergles (Eds.), Proceedings of Engineering
Foundation Conference on ‘‘Pool and External Flow Boiling’’,
ASME, New York, 1992, pp. 203–211.
[38] I. Golobic, A.E. Bergles, Effects of heater-side factors on the
saturated pool boiling critical heat flux, Exp. Thermal Fluid Sci.
15 (1) (1997) 43–51.
[39] F. Tachibana, M. Akiyama, H. Kawamura, Non-hydrodynamic
aspects of pool boiling burnout, J. Nucl. Sci. Tech. 4 (1967) 121–
130.
[40] G. Guglielmini, E. Nannei, On the effect of heating wall thickness
on pool boiling burnout, Int. J. Heat Mass Transfer 19 (9) (1976)
1073–1075.
[41] R.F. Gaertner, J.W. Westwater, Population of active sites in
nucleate boiling heat transfer, Chem. Eng. Prof. Symp. Ser. 56
(30) (1960) 39–48.
[42] D.B. Kirby, J.W. Westwater, Bubble and vapor behavior on a
heated horizontal plate during pool boiling near burnout, Chem.Eng. Prog. Symp. Ser. 61 (57) (1965) 238–248.
[43] H.J. Van Ouwerkerk, Burnout in pool boiling. The stability of
boiling mechanisms, Int. J. Heat Mass Transfer 15 (1) (1972) 25–
34.
[44] S. Nishio, T. Gotoh, N. Nagai, Observation of boiling structures
in high heat-flux boiling, Int. J. Heat Mass Transfer 41 (1999)
3191–3201.
[45] R. Reyes, P.C. Wayner, An adsoprtion model for the superheat at
the critical heat flux, Trans. ASME J. Heat Transfer 117 (3) (1995)
779–782.
[46] K. Sefiane, D. Benielli, A. Steinchen, A new mechanism for
pool boiling crisis, recoil instability and contact angle influence,
J. Colloids Surf. A: Physicochem. Eng. Aspects 142 (1998) 361–
373;
Also A. Steinchen, K. Sefiane, Stability analysis of the pool-boiling crisis, J. Phys.: Condens. Matter 8 (47) (1996) 9565–9568.
[47] H.J. Palmer, The hydrodynamic stability of rapidly evaporating
liquids at reduced pressure, J. Fluid Mech. 75 (3) (1976) 487–511.
810 T.G. Theofanous et al. / Experimental Thermal and Fluid Science 26 (2002) 793–810