bolten, a.b. 2003. variation in sea turtle life history...
TRANSCRIPT

Bolten -- 1
Bolten, A.B. 2003. Variation in sea turtle life history patterns: neritic vs. oceanic developmental stages. Pages 243-257 in P.L. Lutz, J. Musick and J. Wyneken (editors), The Biology of Sea Turtles, volume II. CRC Press, Boca Raton, FL
CHAPTER 9
Variation in Sea Turtle Life History Patterns:
Neritic versus Oceanic Developmental Stages
Alan B. Bolten
Please address all correspondence to:
Alan B. Bolten Archie Carr Center for Sea Turtle Research Department of Zoology PO Box 118525 University of Florida Gainesville, FL 32611 USA Tel: 352-392-5194 Fax: 352-392-9166 Email: [email protected]

Bolten -- 2
CONTENTS
9.1 Introduction
9.2 Terminology
9.3 Sea Turtle Life History Patterns
9.3.1 Type 1: The Neritic Developmental Pattern
9.3.2 Type 2: The Oceanic – Neritic Developmental Pattern
9.3.3 Type 3: The Oceanic Developmental Pattern
9.4 Relationships of the Three Life History Patterns to
Phylogenic Patterns and Reproductive Traits
9.4.1 Phylogenetic Patterns
9.4.2 Reproductive Traits
9.5 A Closer Look at the Type 2 Pattern – Ontogenetic Habitat
Shifts
9.6 Anthropogenic Impacts on the Early Juvenile Stage
9.7 Conclusions – Research Directions
9.8 Acknowledgements
References
Bolten -- 3
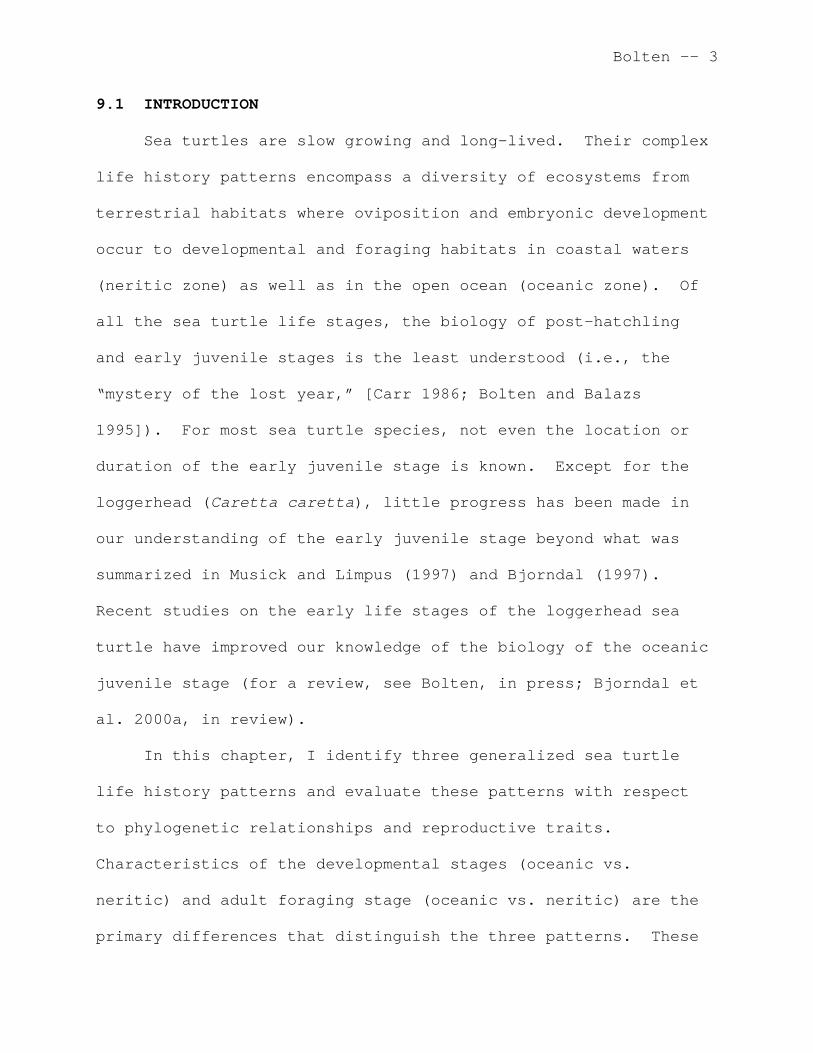
9.1 INTRODUCTION
Sea turtles are slow growing and long-lived. Their complex
life history patterns encompass a diversity of ecosystems from
terrestrial habitats where oviposition and embryonic development
occur to developmental and foraging habitats in coastal waters
(neritic zone) as well as in the open ocean (oceanic zone). Of
all the sea turtle life stages, the biology of post-hatchling
and early juvenile stages is the least understood (i.e., the
“mystery of the lost year,” [Carr 1986; Bolten and Balazs
1995]). For most sea turtle species, not even the location or
duration of the early juvenile stage is known. Except for the
loggerhead (Caretta caretta), little progress has been made in
our understanding of the early juvenile stage beyond what was
summarized in Musick and Limpus (1997) and Bjorndal (1997).
Recent studies on the early life stages of the loggerhead sea
turtle have improved our knowledge of the biology of the oceanic
juvenile stage (for a review, see Bolten, in press; Bjorndal et
al. 2000a, in review).
In this chapter, I identify three generalized sea turtle
life history patterns and evaluate these patterns with respect
to phylogenetic relationships and reproductive traits.
Characteristics of the developmental stages (oceanic vs.
neritic) and adult foraging stage (oceanic vs. neritic) are the
primary differences that distinguish the three patterns. These
Bolten -- 4
variations are reviewed, the consequences of oceanic vs. neritic
developmental stages are discussed, and finally, I speculate on
how these differences may have evolved. The dramatic decline in
sea turtle populations and the extensive degradation of their
ecosystems make it difficult to determine the functional roles
of sea turtles in their ecosystems (see Bjorndal and Jackson,
this volume), and, therefore, difficult to evaluate the
selective factors that led to the present day sea turtle life
history patterns. It is particularly difficult, in the context
of massive faunal declines and food web alterations, to
speculate on the relative importance of the evolutionary
pressures from competition for resources and predation that may
have resulted in these observed life history patterns.
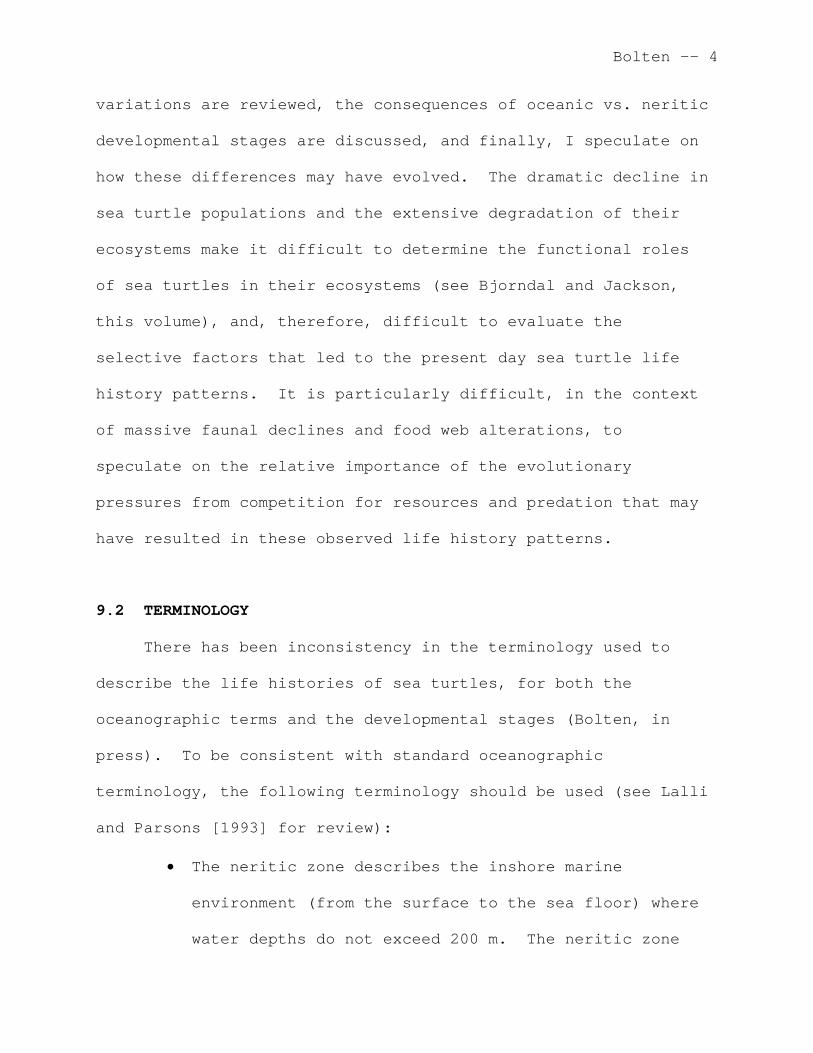
9.2 TERMINOLOGY
There has been inconsistency in the terminology used to
describe the life histories of sea turtles, for both the
oceanographic terms and the developmental stages (Bolten, in
press). To be consistent with standard oceanographic
terminology, the following terminology should be used (see Lalli
and Parsons [1993] for review):
• The neritic zone describes the inshore marine
environment (from the surface to the sea floor) where
water depths do not exceed 200 m. The neritic zone

Bolten -- 5
generally includes the continental shelf but in areas
where the continental shelf is very narrow or
nonexistent, the neritic zone conventionally extends
to areas where water depths are less than 200 m.
• The oceanic zone is the vast open ocean environment
(from the surface to the sea floor) where water depths
are greater than 200 m.
• Organisms are pelagic if they occupy the water column,
but not the sea floor, in either the neritic zone or
oceanic zone. Organisms are epipelagic if they occupy
the upper 200 m in the oceanic zone.
• Organisms on the sea floor in either the neritic zone
or oceanic zone are described as benthic or demersal.
Organisms can therefore be pelagic in shallow neritic
waters or in the deep oceanic waters. Similarly, organisms can
be benthic in shallow neritic waters as well as in the deep
ocean. We should describe sea turtle life stages by the oceanic
realm that they inhabit. Therefore, the early juvenile stage
found in the open ocean should be described as the oceanic
stage, not the pelagic stage, and the juvenile stage found in
coastal waters as the neritic stage, not the benthic stage.

Bolten -- 6
9.3 SEA TURTLE LIFE HISTORY PATTERNS
Although there are only seven extant species, sea turtles
exhibit a surprising diversity of life history traits that make
them good subjects for comparative life history studies.
Aspects of this diversity are illustrated by reproductive
extremes from arribadas to solitary nesting, dietary
specializations from seagrasses to sponges to jelly organisms,
and metabolic adaptations from hibernation to endothermy (sensu
lato). Despite this high diversity in life history traits among
sea turtle species, there have been few comparative analyses or
syntheses of their life history patterns. Hendrickson (1980)
was the first to attempt to summarize the ecological strategies
of sea turtles. However, his conclusions were limited by the
lack of information at the time of his synthesis in both life
history characteristics of the different sea turtle species and
their taxonomic relationships, which are now better understood
through molecular techniques. In another analysis, Van Buskirk
and Crowder (1994) developed a dendrogram to compare the
reproductive characteristics among the seven species. In this
chapter I will focus on an analysis of the variation in the
juvenile developmental stages.
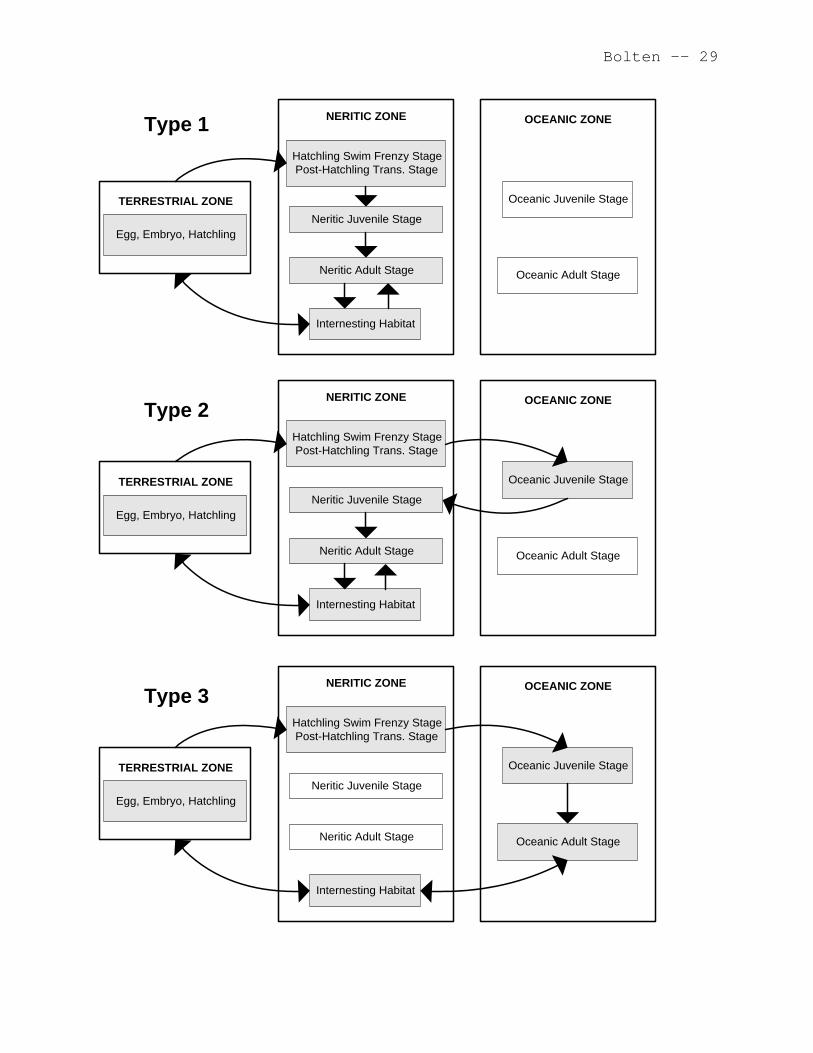
Once hatchlings emerge from their nests, crawl down the
beach, and enter the sea, post-hatchlings embark upon 1 of 3
basic developmental life history patterns:

Bolten -- 7
• complete development in the neritic zone (Type 1, Figure
9.1, top panel),
• early juvenile development in the oceanic zone and later
juvenile development in the neritic zone (Type 2, Figure
9.1, middle panel), or
• complete development in the oceanic zone (Type 3, Figure
9.1, bottom panel).
9.3.1 Type 1: The Neritic Developmental Pattern
The Type 1 life history pattern is characterized by
developmental and adult stages occurring completely in the
neritic zone (Figure 9.1, top panel). The Australian flatback
turtle (Natator depressus) apparently has a completely neritic
developmental pattern (Walker and Parmenter 1990; Walker 1994)
and is the only extant example of the Type 1 life history
pattern. Walker (1994) suggests there may be increased food
resources in the neritic zone but with a tradeoff of increased
predation. Flatback hatchlings are larger than those of other
cheloniid sea turtles (60 mm vs. 41-50 mm carapace length [Van
Buskirk and Crowder 1994]; 39 g vs. 15-25 g hatchling mass
[Miller 1997]). As would be expected from the evolutionary
tradeoff between the size and number of offspring, clutch size
is smaller in flatbacks (53 vs. 100-182 [Hirth 1980; Van Buskirk
and Crowder 1994] although East Pacific green turtles [Chelonia

Bolten -- 8
mydas] have small clutch sizes from 65 to 90 [Hirth 1997]).
Flatbacks thus produce fewer, larger progeny, a pattern typical
of marine species with shorter dispersal distances relative to
species that disperse more widely, such as Type 2 and 3 sea
turtles. Researchers have speculated that the larger hatchling
size of flatback turtles may reduce predation in the neritic
zone (Hirth 1980; Walker and Parmenter 1990; Walker 1994; Musick
and Limpus 1997). However, the size difference between flatback
turtles and those species exhibiting Type 2 or 3 patterns does
not seem to be great enough to make a significant difference
with respect to marine predators. The larger hatchling size of
the flatback may be a response to terrestrial predators and the
need to survive the predator gauntlet from the nest to the
water. The larger size of flatback hatchlings allows them to
escape some bird and crab predators on Australian beaches that
prey upon green turtle (Chelonia mydas) and loggerhead
hatchlings (Limpus 1971). The fact that other sea turtle
species have not also responded to terrestrial predators by
increasing hatchling body size suggests that our understanding
of the selective pressures leading to the increased size of
flatback hatchlings is still not fully understood. Knowledge of
the selective advantages of large hatchling size may be critical
for understanding the success of the Type 1 life history
pattern.

Bolten -- 9
The early juvenile stage of Type 1 species (including post-
hatchlings) probably feeds on the surface and within the water
column and may later develop a benthic feeding strategy once
they have gained buoyancy control and can dive to the sea floor.
In the shallow waters that Type 1 species inhabit, their
foraging behavior may be a mix of pelagic and benthic feeding
throughout life. Support for this mixed foraging strategy is
seen in the diet of both small and large flatback turtles
(Limpus et al. 1988; Zangerl et al. 1988). However, the number
of samples that have been evaluated are too small to be
conclusive; more studies on the diet of flatbacks are needed.
9.3.2 Type 2: The Oceanic - Neritic Developmental Pattern
The Type 2 life history pattern is characterized by early
development in the oceanic zone followed by later development in
the neritic zone (Figure 9.1, middle panel). The best known
example of this life history pattern is that of the loggerhead
turtle (for review see Bolten, in press). Use of genetic
markers has confirmed the relationships between oceanic foraging
grounds and rookeries (Bowen et al. 1995; Bolten et al. 1998)
that had been hypothesized based on length-frequency
distributions (Carr 1986; Bolten et al. 1993) and tag returns
(Bolten, in press). Although based on rather few data
(summarized in Carr 1987a), this life history pattern is thought

Bolten -- 10
to be the pattern for the green turtle, hawksbill (Eretmochelys
imbricata), and Kemp’s ridley (Lepidochelys kempi [Collard and
Ogren 1990]). Little is known about the ecology of juvenile
olive ridleys (Lepidochelys olivacea); differences among
populations from different ocean basins suggest that this
species exhibits either a Type 2 or a Type 3 life history
pattern, perhaps in response to differences in resource
availability. In the West Atlantic (Pritchard 1976; Reichart
1993; Bolten and Bjorndal, unpublished data) and Australia
(Harris 1994), olive ridleys appear to exhibit a Type 2 life
history pattern, whereas East Pacific populations (Pitman 1990)
appear to exhibit a Type 3 life history pattern.
Following the hatchling swim frenzy stage (Wyneken and
Salmon 1992), loggerheads have a transition period when the
post-hatchling begins to feed and moves from the neritic zone
into the oceanic zone (Bolten, in press). The duration,
movements, and distribution of the post-hatchlings during this
transition have been reviewed by Witherington (2002, in review
a). This transition is relatively passive in that oceanographic
and meteorological factors (e.g., currents, winds) have the
greatest influence on the movements and distribution patterns of
these turtles, although the post-hatchlings may actively
position themselves using magnetic orientation cues to maximize
the likelihood of successful transport (Lohmann and Lohmann, in

Bolten -- 11
press). After a developmental period in the oceanic zone
lasting from 7 to 11.5 years, when the turtles reach a size of
46 to 64 cm curved carapace length (Bjorndal et al. 2000a;
Bjorndal et al., in review), juvenile loggerheads in the
Atlantic leave the oceanic zone and complete their development
in the neritic zone (Musick and Limpus 1997; Bjorndal et al.
2001; Bolten, in press).
Other Type 2 species recruit to neritic habitats at smaller
sizes. Green turtles and hawksbills appear in neritic foraging
grounds at about 20-35 cm carapace length (CL) and Kemp’s
ridleys at 20-25 cm CL (Bjorndal 1997; Musick and Limpus 1997).
Based on size at recruitment to neritic habitats, the durations
of the oceanic stages in these species may be shorter than that
of Atlantic loggerheads. Size at recruitment is apparently not
a function of size at maturity. Adult size of loggerheads falls
between those of Kemp’s ridleys and green turtles (Miller 1997).
Recruitment from the oceanic, where the turtles are
primarily epipelagic, to the neritic, where they are primarily
benthic, may involve another transition period before the
juvenile turtles become fully neritic (Kamezaki and Matsui 1997;
Laurent et al. 1998; Bolten, in press; Tiwari et al., in press).
Adults of Type 2 species may leave neritic habitats during their
reproductive migrations, which may involve oceanic migration
corridors between the adult foraging areas (neritic) and
Bolten -- 12
internesting habitat (also neritic). Figure 9.2 presents the
details of the loggerhead life history from the North Atlantic.
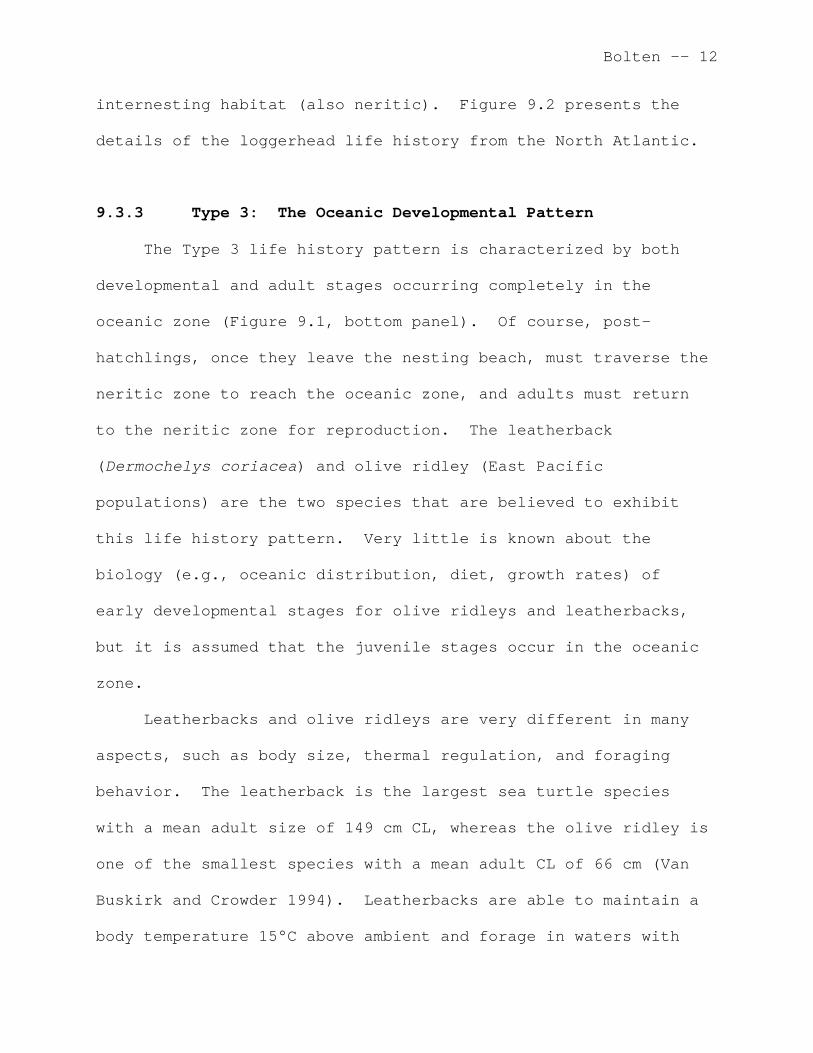
9.3.3 Type 3: The Oceanic Developmental Pattern
The Type 3 life history pattern is characterized by both
developmental and adult stages occurring completely in the
oceanic zone (Figure 9.1, bottom panel). Of course, post-
hatchlings, once they leave the nesting beach, must traverse the
neritic zone to reach the oceanic zone, and adults must return
to the neritic zone for reproduction. The leatherback
(Dermochelys coriacea) and olive ridley (East Pacific
populations) are the two species that are believed to exhibit
this life history pattern. Very little is known about the
biology (e.g., oceanic distribution, diet, growth rates) of
early developmental stages for olive ridleys and leatherbacks,
but it is assumed that the juvenile stages occur in the oceanic
zone.
Leatherbacks and olive ridleys are very different in many
aspects, such as body size, thermal regulation, and foraging
behavior. The leatherback is the largest sea turtle species
with a mean adult size of 149 cm CL, whereas the olive ridley is
one of the smallest species with a mean adult CL of 66 cm (Van
Buskirk and Crowder 1994). Leatherbacks are able to maintain a
body temperature 15°C above ambient and forage in waters with

Bolten -- 13
temperatures as low as 0-15°C (Spotila et al. 1997). The olive
ridley maintains a body temperature at most a few degrees above
ambient (Spotila et al. 1997) and appears to be limited to
warmer, tropical waters (Pitman 1990, 1993; Polovina et al., in
review). Leatherbacks are active predators and may not undergo
a substantial diet shift as they grow because the ability to
capture and consume gelatinous prey species is not size
dependent (Bjorndal 1997). Olive ridleys apparently spend more
time at the surface than leatherbacks (Pitman 1993) and may
exhibit a “float and wait” foraging strategy, although Polovina
et al. (in review) report that olive ridleys only spend 20% of
their time on the surface and 40% of their time diving deeper
than 40 m.
9.4 RELATIONSHIPS OF THE THREE LIFE HISTORY PATTERNS TO
PHYLOGENIC PATTERNS AND REPRODUCTIVE TRAITS
9.4.1 Phylogenetic Patterns
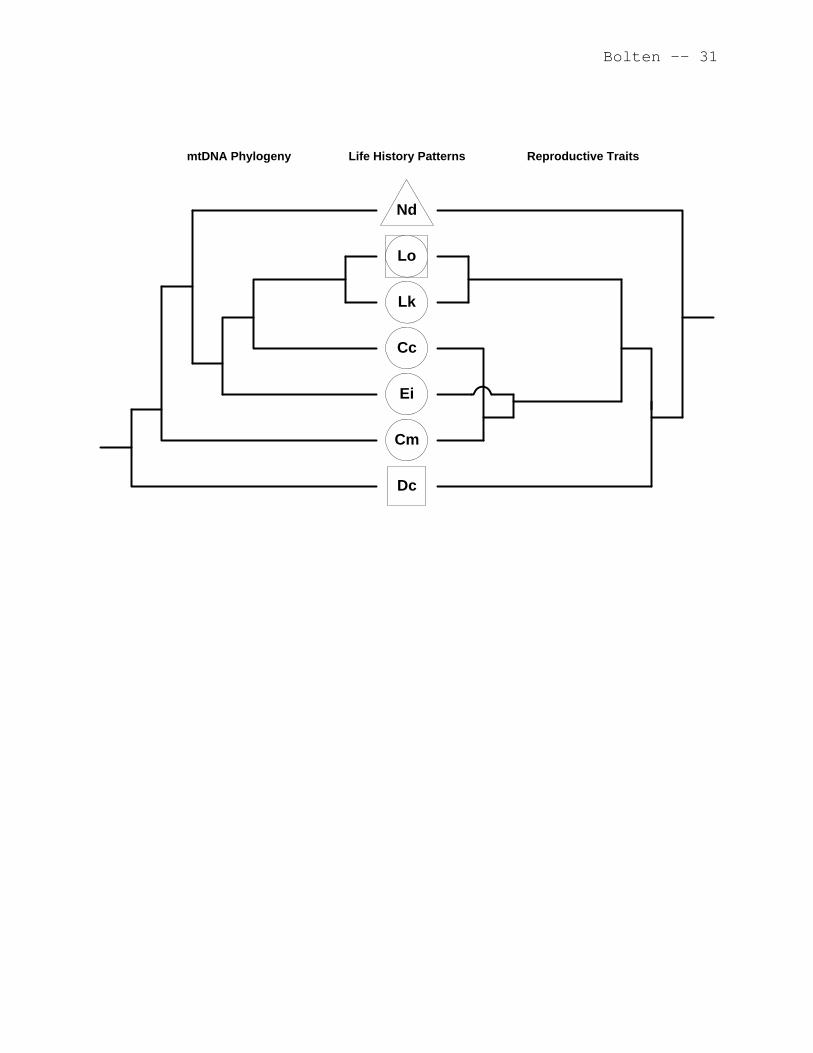
A comparison of the life history patterns (Type 1, 2, or 3)
of the seven species of extant sea turtles with their
phylogenetic patterns are presented in Figure 9.3, left
dendrogram (Bowen and Karl 1997). Sea turtles are generally
recognized as a monophyletic group (Bowen and Karl 1997). The
ancestor of sea turtles was probably a resident of coastal salt
marshes, estuaries, and tidal creeks. Once these ancestors
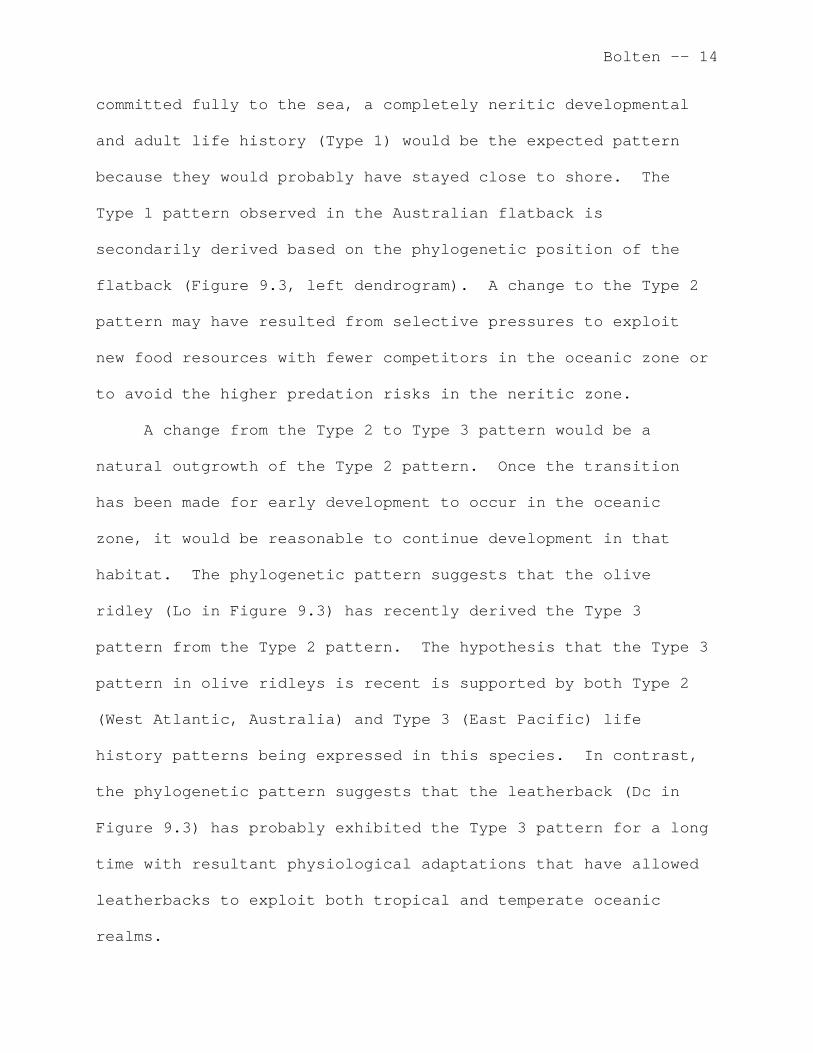
Bolten -- 14
committed fully to the sea, a completely neritic developmental
and adult life history (Type 1) would be the expected pattern
because they would probably have stayed close to shore. The
Type 1 pattern observed in the Australian flatback is
secondarily derived based on the phylogenetic position of the
flatback (Figure 9.3, left dendrogram). A change to the Type 2
pattern may have resulted from selective pressures to exploit
new food resources with fewer competitors in the oceanic zone or
to avoid the higher predation risks in the neritic zone.
A change from the Type 2 to Type 3 pattern would be a
natural outgrowth of the Type 2 pattern. Once the transition
has been made for early development to occur in the oceanic
zone, it would be reasonable to continue development in that
habitat. The phylogenetic pattern suggests that the olive
ridley (Lo in Figure 9.3) has recently derived the Type 3
pattern from the Type 2 pattern. The hypothesis that the Type 3
pattern in olive ridleys is recent is supported by both Type 2
(West Atlantic, Australia) and Type 3 (East Pacific) life
history patterns being expressed in this species. In contrast,
the phylogenetic pattern suggests that the leatherback (Dc in
Figure 9.3) has probably exhibited the Type 3 pattern for a long
time with resultant physiological adaptations that have allowed
leatherbacks to exploit both tropical and temperate oceanic
realms.

Bolten -- 15
9.4.2 Reproductive Traits
Van Buskirk and Crowder (1994) evaluated a number of
reproductive traits (e.g., female size, clutch size, egg volume,
hatchling size, clutch frequency, and remigration interval) and
developed a dendrogram illustrating the relationships among the
species (Figure 9.3, right dendrogram). The Van Buskirk and
Crowder (1994) dendrogram is not congruent with the phylogeny of
Bowen and Karl (1997) but has a greater similarity to the 3 life
history patterns presented in Figure 9.1. This better fit would
be expected between life history patterns (Figure 9.3, center)
and reproductive behavior and demographic traits (Figure 9.3,
right dendrogram). The two species with the greatest difference
in reproductive traits (leatherbacks and flatbacks) are also the
two species with the greatest difference in life history
patterns.
9.5 A CLOSER LOOK AT THE TYPE 2 PATTERN – ONTOGENETIC HABITAT
SHIFTS
Species exhibiting either the Type 1 or Type 3 pattern
commit to either the neritic or oceanic zone, respectively, for
their entire developmental stages as well as for the adult
foraging stage. Only turtles with the Type 2 pattern have a
major habitat change during their development. The Type 2

Bolten -- 16
pattern is the most successful pattern if success is defined by
the number of species with this life history pattern (5 of the 7
extant species exhibit the Type 2 pattern). As presented above
in section 9.4.1, the Type 1 pattern is hypothesized to be the
ancestral pattern that still exists today (although presumably
secondarily derived) in the Australian flatback. Why post-
hatchling turtles leave the neritic zone for the oceanic, and
why, after an extended development period in the oceanic zone,
the turtles return to the neritic to complete their development,
are two intriguing questions.
The existence of an early developmental stage in the
oceanic habitat may be a result of higher predator pressure in
neritic habitats and/or intra- and interspecific competition for
food in neritic habitats. Such competition may not be apparent
now because of depleted sea turtle populations, but evidence for
density-dependent effects on growth rates has been reported for
a population of green turtles in a neritic foraging habitat
(Bjorndal et al. 2000b).
Even more puzzling is the shift from oceanic to neritic
habitats. Why do juvenile turtles leave the oceanic zone where
they have spent the first years of their lives successfully
finding food, growing, and surviving? When they leave the
oceanic zone for the neritic zone, they enter a new habitat with
which they are unfamiliar, and must learn to find new food
Bolten -- 17
sources and avoid a new suite of predators. A current
hypothesis to explain why ontogenetic habitat shifts occur is
that a species shifts habitats to maximize growth rates (Werner
and Gilliam 1984). Bolten (in press) presents evidence for the
Atlantic loggerhead population that supports the Werner and
Gilliam hypothesis. The extrapolation of the size-specific
growth function for the oceanic stage intersects the size-
specific growth function for the neritic stage (Figure 9.4).
Therefore, for a given carapace length greater than
approximately 64 cm (a size by which almost all of the
loggerheads have left the oceanic zone [Bjorndal et al. 2000a]),
growth rates will be greater in the neritic zone than in the
oceanic zone. Snover et al. (2000) present data from a
skeletochronology study that also demonstrate increased growth
rates of turtles that have left the oceanic zone and entered the
neritic zone.
There is substantial variation among the species that have
the Type 2 pattern, suggesting a fair amount of variation in
lifestyles. Morphological differences in oceanic-stage turtles
include variation in countershading (suggesting different
predator avoidance behaviors) and front flipper length relative
to body length (suggesting differences in swimming activity and
resulting feeding behavior). The swimming behavior of post-
hatchling green turtles appears to be different than that of
Bolten -- 18
loggerheads (Wyneken 1997). Another source of variation is the
duration of the oceanic developmental stage that may be
significantly different for the different species based on the
size at which they recruit to neritic habitats (see section
9.3.2). In addition, resource partitioning along temperature
gradients and among foraging strategies probably occurs among
Type 2 species, but data are lacking. For example, loggerheads
(Type 2 species) and olive ridleys (Type 3 species) apparently
partition resources in the Pacific by water temperature;
loggerheads inhabit cooler waters than do olive ridleys (Pitman
1993; Polovina et al., in review). Thus, as more is learned
about this life stage, further divisions in the Type 2 pattern
may be required.
9.6 ANTHROPOGENIC IMPACTS ON THE EARLY JUVENILE STAGE
The future is bleak. Early juvenile-stage sea turtles face
a myriad of obstacles irrespective of whether they are in the
neritic or oceanic zones. Directed take of very small turtles
for food is not common. However, directed take for the souvenir
trade in polished shells or whole stuffed turtles, such as the
once-popular but now illegal tourist trade in Madeira, Portugal
(Brongersma 1982), still exists in some regions.
Indirect take in fisheries, whether it is the high seas
drift nets, longlines, or coastal trawlers, is a very serious

Bolten -- 19
problem for juvenile turtles (National Research Council 1990;
Wetherall et al. 1993; Balazs and Pooley 1994; Witzell 1999;
Bolten et al. 2000). Throughout the world’s oceans, the size
distribution of loggerhead turtles caught in longline fisheries
is the largest size class for the oceanic development stage
(Bolten et al. 1994; Ferreira et al. 2001; Bolten, in press),
which has significant demographic consequences (Crouse et al.
1987; Heppell et al., in press).
The lethal and sub-lethal effects of debris ingestion and
entanglement are also major concerns (Balazs 1985; Carr 1987b;
McCauley and Bjorndal 1999; Witherington, in review b). Habitat
loss, particularly in coastal areas, has been documented;
habitat degradation in the oceanic zone is more difficult to
document but nonetheless acute when the effects of pollution are
considered (Lutcavage et al. 1997). Both oceanic and neritic
ecosystems are changing as a result of overfishing and
pollution. Changes to the suite of species interactions and
food webs in these ecosystems are undoubtedly having a major
negative impact on sea turtles.
9.7 CONCLUSIONS – RESEARCH DIRECTIONS
Our ability to solve the “mystery of the lost year” for
those species for which the early juvenile stages remain unknown
has been improved by the development of new research tools.

Bolten -- 20
Biotechnology is providing molecular tags to identify
populations and track movements; biotelemetry is allowing
researchers to evaluate movement and distribution patterns.
Stable isotopes may provide clues where to look for early
juvenile stages and also provide information on their trophic
relationships. For researchers to make rapid progress in the
study of early juvenile stages, multidisciplinary teams should
be developed with expertise in the fields of physical and
biological oceanography, population genetics, statistical
modeling, demography, nutrition, and ecosystem analyses.
9.8 ACKNOWLEDGEMENTS
My research on the oceanic juvenile stage has focused on
the loggerhead population in the Atlantic and has been conducted
in collaboration with Karen Bjorndal whose inspiration and
enthusiasm has made this project possible. Our research has
been funded by the US National Marine Fisheries Service and the
Disney Wildlife Conservation Fund. Colleagues at the Department
of Oceanography and Fisheries at the University of the Azores,
especially Helen Martins and “equipa tartaruga,” have not only
made our research possible but most enjoyable. I would also
like to thank Karen Bjorndal, Jeffrey Seminoff, and Jack Musick
for their comments on earlier drafts of this manuscript.

Bolten -- 21
REFERENCES
Balazs, G. H. 1985. Impact of ocean debris on marine turtles: entanglement and ingestion. Pages 387-429 in R. S. Shomura and H. O. Yoshida, editors. Proceedings of the Workshop on the Fate and Impact of Marine Debris. NOAA Technical Memorandum NOAA-TM-NMFS-SWFS-54.
Balazs, G. H., and S. G. Pooley, editors. 1994. Research plan to assess marine turtle hooking mortality: results of an expert workshop held in Honolulu, Hawaii, November 16-18, 1993. NOAA Technical Memorandum NMFS-SWFSC-201.
Bjorndal, K. A. 1997. Foraging ecology and nutrition of sea turtles. Pages 199-231 in P. L. Lutz and J. A. Musick, editors. The biology of sea turtles. CRC Press, Boca Raton, Florida, USA.
Bjorndal, K. A., A. B. Bolten, and M. Y. Chaloupka. 2000b. Green turtle somatic growth model: evidence for density dependence. Ecological Applications 10:269-282.
Bjorndal K. A., A. B. Bolten, T. Dellinger, C. Delgado, and H. R. Martins. In review. Compensatory growth in oceanic loggerhead sea turtles: response to a stochastic environment.
Bjorndal, K. A., A. B. Bolten, B. Koike, B. A. Schroeder, D. J. Shaver, W. G. Teas, and W. N. Witzell. 2001. Somatic growth function for immature loggerhead sea turtles in southeastern U.S. waters. Fishery Bulletin 99:240-246.
Bjorndal, K. A., A. B. Bolten, and H. R. Martins. 2000a. Somatic growth model of juvenile loggerhead sea turtles Caretta caretta: duration of pelagic stage. Marine Ecology Progress Series 202:265-272.
Bolten, A. B. In press. Active swimmers — passive drifters: the oceanic juvenile stage of loggerheads in the Atlantic system. In A. B. Bolten and B. E. Witherington, editors. Biology and conservation of the loggerhead sea turtle. Smithsonian Institution Press, Washington, D.C., USA.
Bolten, A. B., and G. H. Balazs. 1995. Biology of the early pelagic stage--the "lost year." Pages 579-581 in K. A. Bjorndal, editor. Biology and conservation of sea turtles. Revised edition. Smithsonian Institution Press, Washington D.C., USA.
Bolten -- 22
Bolten, A. B., K. A. Bjorndal, and H. R. Martins. 1994. Life history model for the loggerhead sea turtle (Caretta caretta) population in the Atlantic: Potential impacts of a longline fishery. Pages 48-54 in G. H. Balazs and S. G. Pooley, editors. Research plan to assess marine turtle hooking mortality: results of an expert workshop held in Honolulu, Hawaii, November 16-18, 1993. NOAA Technical Memorandum NMFS-SWFSC-201.
Bolten, A. B., K. A. Bjorndal, H. R. Martins, T. Dellinger, M. J. Biscoito, S. E. Encalada, and B. W. Bowen. 1998. Transatlantic developmental migrations of loggerhead sea turtles demonstrated by mtDNA sequence analysis. Ecological Applications 8:1-7.
Bolten, A. B., H. R. Martins, and K. A. Bjorndal, editors. 2000. Proceedings of a workshop to design an experiment to determine the effects of longline gear modification on sea turtle bycatch rates [Workshop para a elaboração de uma experiência que possa diminuir as capturas acidentais de tartarugas marinhas nos Açores], 2-4 September 1998, Horta, Azores, Portugal. NOAA Technical Memorandum NMFS-OPR-19.
Bolten, A. B., H. R. Martins, K. A. Bjorndal, and J. Gordon. 1993. Size distribution of pelagic-stage loggerhead sea turtles (Caretta caretta) in the waters around the Azores and Madeira. Arquipélago 11A:49-54.
Bowen, B. W., F. A. Abreu-Grobois, G. H. Balazs, N. Kamezaki, C. J. Limpus, and R. J. Ferl. 1995. Trans-Pacific migrations of the loggerhead turtle (Caretta caretta) demonstrated with mitochondrial DNA markers. Proceedings of the National Academy of Sciences, USA 92:3731-3734.
Bowen, B. W., and S. A. Karl. 1997. Population genetics, phylogeography, and molecular evolution. Pages 29-50 in P. L. Lutz and J. A. Musick, editors. The biology of sea turtles. CRC Press, Boca Raton, Florida, USA.
Brongersma, L. D. 1982. Marine turtles of the eastern Atlantic Ocean. Pages 407-416 in K. A. Bjorndal, editor. Biology and conservation of sea turtles. Smithsonian Institution Press, Washington D.C., USA.
Carr, A. F. 1986. Rips, FADS, and little loggerheads. Bioscience 36:92-100.
Carr, A. F. 1987a. New perspectives on the pelagic stage of sea turtle development. Conservation Biology 1:103-121.

Bolten -- 23
Carr, A. F. 1987b. Impact of nondegradable marine debris on the ecology and survival outlook of sea turtles. Marine Pollution Bulletin 18:352-356.
Collard, S. B., and L. H. Ogren. 1990. Dispersal scenarios for pelagic post-hatchling sea turtles. Bulletin of Marine Science 47:233-243.
Crouse, D. T., L. B. Crowder, and H. Caswell. 1987. A stage-based population model for loggerhead sea turtles and implications for conservation. Ecology 68:1412-1423.
Ferreira, R. L., H. R. Martins, A. A. da Silva, and A. B. Bolten. 2001. Impact of swordfish fisheries on sea turtles in the Azores. Arquipélago 18A:75-79.
Harris, A. 1994. Species review: the olive ridley. Pages 63-67 in R. James, compiler. Proceedings of the Australian Marine Turtle Conservation Workshop held at Sea World Nara Resort, Gold Coast, 14-17 November 1990. Queensland Department of Environment and Heritage, and Australian Nature Conservation Agency, Canberra, Australia.
Hendrickson, J. R. 1980. The ecological strategies of sea turtles. American Zoologist 20:597-608.
Heppell, S. S., L. B. Crowder, D. T. Crouse, S. P. Epperly, and N. B. Frazer. In press. Population models for Atlantic loggerheads: past, present and future. In A. B. Bolten and B. E. Witherington, editors. Biology and conservation of the loggerhead sea turtle. Smithsonian Institution Press, Washington, D.C., USA.
Hirth, H. F. 1980. Some aspects of the nesting behavior and reproductive biology of sea turtles. American Zoologist 20:507-523.
Hirth, H. F. 1997. Synopsis of the biological data on the green turtle Chelonia mydas (Linneaus 1758). US Fish and Wildlife Service Biological Report 97(1), 120 pages.
Kamezaki, N., and M. Matsui. 1997. Allometry in the loggerhead turtle, Caretta caretta. Chelonian Conservation and Biology 2:421-425.
Lalli, C. M., and T. R. Parsons. 1993. Biological oceanography: an introduction. Pergamon Press, New York, New York, USA.
Bolten -- 24
Laurent, L., P. Casale, M. N. Bradai, B. J. Godley, G. Gerosa, A. C. Broderick, W. Schroth, B. Schierwater, A. M. Levy, D. Freggi, E. M. Abd El-Mawla, D. A. Hadoud, H. El-Gomati, M. Domingo, M. Hadjichristophorou, L. Kornaraki, F. Demirayak, and C. Gautier. 1998. Molecular resolution of marine turtle stock composition in fishery bycatch: a case study in the Mediterranean. Molecular Ecology 7:1529-1542.
Limpus, C. J. 1971. The flatback turtle, Chelonia depressa Garman in southeast Queensland, Australia. Herpetologica 27:431-446.
Limpus, C. J., E. Gyuris, and J. D. Miller. 1988. Reassessment of the taxonomic status of the sea turtle genus Natator McCulloch, 1908, with a redescription of the genus and species. Transactions of the Royal Society of South Australia 112:1-9.
Lohmann, K. J., and C. M. F. Lohmann. In press. Orientation mechanisms of hatchling loggerheads. In A. B. Bolten and B. E. Witherington, editors. Biology and conservation of the loggerhead sea turtle. Smithsonian Institution Press, Washington, D.C., USA.
Lutcavage, M. E., P. Plotkin, B. E. Witherington, and P. L. Lutz. 1997. Human impacts on sea turtle survival. Pages 387-409 in P. L. Lutz and J. A. Musick, editors. The biology of sea turtles. CRC Press, Boca Raton, Florida, USA.
McCauley, S. J., and K. A. Bjorndal. 1999. Conservation implications of dietary dilution from debris ingestion: sublethal effects in post-hatchling loggerhead sea turtles. Conservation Biology 13:925-929.
Miller, J. D. 1997. Reproduction in sea turtles. Pages 51-81 in P. L. Lutz and J. A. Musick, editors. The biology of sea turtles. CRC Press, Boca Raton, Florida, USA.
Musick, J. A., and C. J. Limpus. 1997. Habitat utilization and migration in juvenile sea turtles. Pages 137-164 in P. L. Lutz and J. A. Musick, editors. The biology of sea turtles. CRC Press, Boca Raton, Florida, USA.
National Research Council. 1990. Decline of the sea turtles: causes and prevention. National Academy Press, Washington, D.C., USA.
Pitman, R. L. 1990. Pelagic distribution and biology of sea turtles in the eastern tropical Pacific. Pages 143-148 in T. H.

Bolten -- 25
Richardson, J. I. Richardson, and M. Donnelly, compilers. Proceedings of the Tenth Annual Workshop on Sea Turtle Biology and Conservation. NOAA Technical Memorandum NMFS-SEFC-278.
Pitman, R. L. 1993. Seabird associations with marine turtles in the eastern Pacific Ocean. Colonial Waterbirds 16:194-201.
Polovina, J. J., G. H. Balazs, E. A. Howell, D. M. Parker, M. P. Seki, and P. H. Dutton. In review. Forage and migration habitat of loggerhead (Caretta caretta) and olive ridley (Lepidochelys olivacea) sea turtles in the Central North Pacific Ocean.
Pritchard, P. C. H. 1976. Post-nesting movements of marine turtles (Cheloniidae and Dermochelyidae) tagged in the Guianas. Copeia 1976:749-754.
Reichart, H. A. 1993. Synopsis of biological data on the olive ridley sea turtle Lepidochelys olivacea (Eschscholtz 1829) in the western Atlantic. NOAA Technical Memorandum NMFS-SEFSC-336.
Snover, M. L., A. A. Horn, and S. A. Macko. 2000. Detecting the precise time at settlement from pelagic to benthic habitats in the loggerhead sea turtle. Page 174 in H. Kalb and T. Wibbels, compilers. Proceedings of the Nineteenth International Symposium on Sea Turtle Biology and Conservation. NOAA Technical Memorandum NMFS-SEFSC-443.
Spotila, J. R., M. P. O’Connor, and F. V. Paladino. 1997. Thermal biology. Pages 297-314 in P. L. Lutz and J. A. Musick, editors. The biology of sea turtles. CRC Press, Boca Raton, Florida, USA.
Tiwari, M., K. A. Bjorndal, A. B. Bolten, and A. Moumni. In press. Morocco and Western Sahara: sites of an early neritic stage in the life history of loggerheads? In Twentieth Annual International Symposium on Sea Turtle Biology and Conservation. NOAA Technical Memorandum.
Van Buskirk, J., and L. B. Crowder. 1994. Life-history variation in marine turtles. Copeia 1994:66-81.
Walker, T. A. 1994. Post-hatchling dispersal of sea turtles. Pages 79-94 in R. James, compiler. Proceedings of the Australian Marine Turtle Conservation Workshop held at Sea World Nara Resort, Gold Coast, 14-17 November 1990. Queensland Department of Environment and Heritage, and Australian Nature Conservation Agency, Canberra, Australia.

Bolten -- 26
Walker, T. A., and C. J. Parmenter. 1990. Absence of a pelagic phase in the life cycle of the flatback turtle, Natator depressa (Garman). Journal of Biogeography 17:275-278.
Werner, E. E., and J. F. Gilliam. 1984. The ontogenetic niche and species interactions in size-structured populations. Annual Review of Ecology and Systematics 15:393-425.
Wetherall, J. A., G. H. Balazs, R. A. Tokunaga, and M. Y. Y. Yong. 1993. Bycatch of marine turtles in North Pacific high-seas driftnet fisheries and impacts on the stocks. International North Pacific Fisheries Commission Bulletin 53:519-38.
Witherington, B. E. 2002. Ecology of neonate loggerhead turtles inhabiting lines of downwelling near a Gulf Stream front. Marine Biology 140:843-853.
Witherington, B. E. In review a. A test of a “smart drifter” hypothesis describing the distribution of neonate loggerhead turtles in the open ocean.
Witherington, B. E. In review b. Frequency of tar and plastics ingestion by neonate loggerhead turtles captured from the western Gulf Stream off Florida, USA.
Witzell, W. N. 1999. Distribution and relative abundance of sea turtles caught incidentally by the U.S. pelagic longline fleet in the western North Atlantic Ocean, 1992-1995. Fishery Bulletin 97:200-211.
Wyneken, J. 1997. Sea turtle locomotion: mechanisms, behavior, and energetics. Pages 165-198 in P. L. Lutz and J. A. Musick, editors. The biology of sea turtles. CRC Press, Boca Raton, Florida, USA.
Wyneken, J., and M. Salmon. 1992. Frenzy and postfrenzy swimming activity in loggerhead, green, and leatherback hatchling sea turtles. Copeia 1992:478-484.
Zangerl, R., L. P. Hendrickson, and J. R. Hendrickson. 1988. A redescription of the Australian flatback sea turtle, Natator depressus. Bishop Museum Bulletin in Zoology I. Bishop Museum Press, Honolulu, Hawaii, USA.
Bolten -- 27
Figure Legends
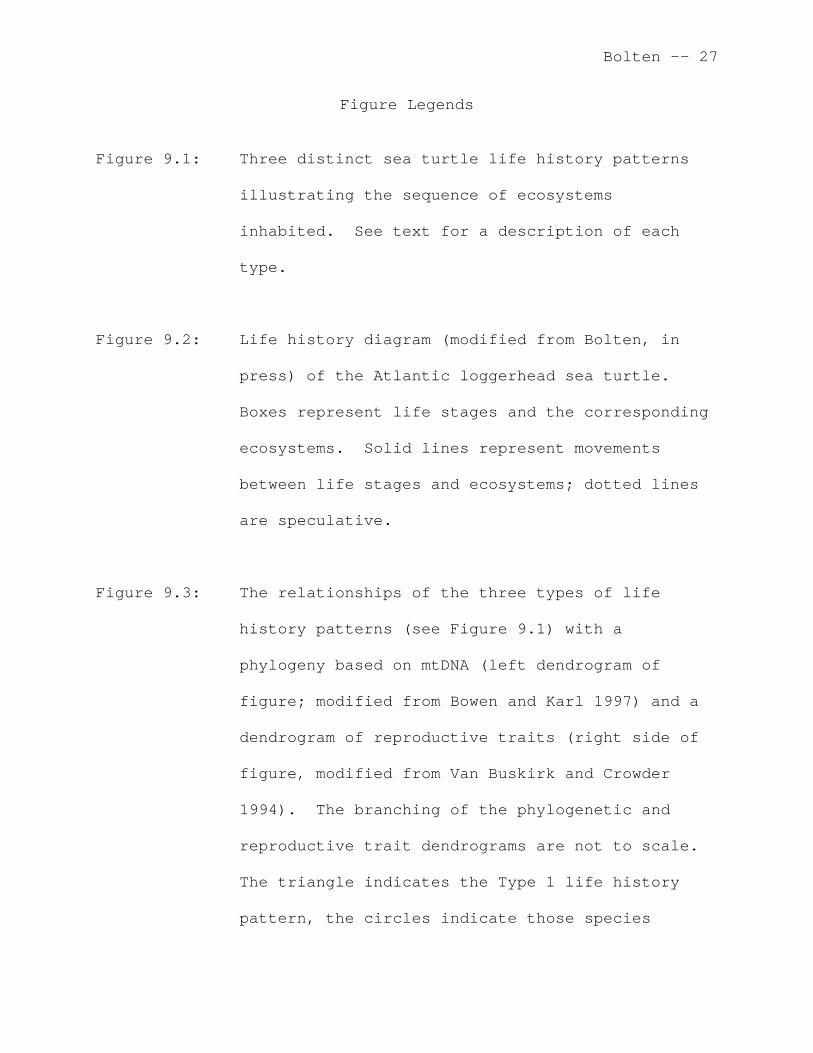
Figure 9.1: Three distinct sea turtle life history patterns
illustrating the sequence of ecosystems
inhabited. See text for a description of each
type.
Figure 9.2: Life history diagram (modified from Bolten, in
press) of the Atlantic loggerhead sea turtle.
Boxes represent life stages and the corresponding
ecosystems. Solid lines represent movements
between life stages and ecosystems; dotted lines
are speculative.
Figure 9.3: The relationships of the three types of life
history patterns (see Figure 9.1) with a
phylogeny based on mtDNA (left dendrogram of
figure; modified from Bowen and Karl 1997) and a
dendrogram of reproductive traits (right side of
figure, modified from Van Buskirk and Crowder
1994). The branching of the phylogenetic and
reproductive trait dendrograms are not to scale.
The triangle indicates the Type 1 life history
pattern, the circles indicate those species
Bolten -- 28
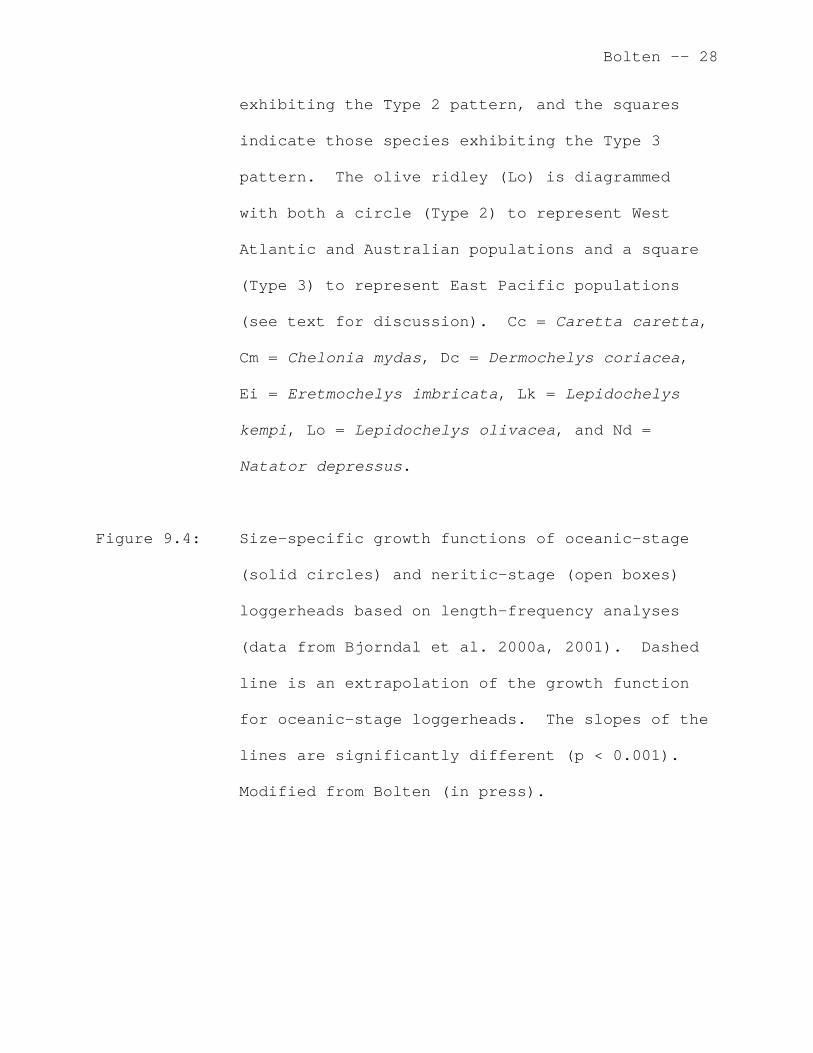
exhibiting the Type 2 pattern, and the squares
indicate those species exhibiting the Type 3
pattern. The olive ridley (Lo) is diagrammed
with both a circle (Type 2) to represent West
Atlantic and Australian populations and a square
(Type 3) to represent East Pacific populations
(see text for discussion). Cc = Caretta caretta,
Cm = Chelonia mydas, Dc = Dermochelys coriacea,
Ei = Eretmochelys imbricata, Lk = Lepidochelys
kempi, Lo = Lepidochelys olivacea, and Nd =
Natator depressus.
Figure 9.4: Size-specific growth functions of oceanic-stage
(solid circles) and neritic-stage (open boxes)
loggerheads based on length-frequency analyses
(data from Bjorndal et al. 2000a, 2001). Dashed
line is an extrapolation of the growth function
for oceanic-stage loggerheads. The slopes of the
lines are significantly different (p < 0.001).
Modified from Bolten (in press).
Bolten -- 29
NERITIC ZONE
Internesting Habitat
OCEANIC ZONE
Oceanic Juvenile Stage
Oceanic Adult Stage
Hatchling Swim Frenzy StagePost-Hatchling Trans. Stage
Neritic Juvenile Stage
Neritic Adult Stage
Egg, Embryo, Hatchling
TERRESTRIAL ZONE
NERITIC ZONE
Internesting Habitat
OCEANIC ZONE
Oceanic Juvenile Stage
Oceanic Adult Stage
Hatchling Swim Frenzy StagePost-Hatchling Trans. Stage
Neritic Juvenile Stage
Neritic Adult Stage
Egg, Embryo, Hatchling
TERRESTRIAL ZONE
NERITIC ZONE
Internesting Habitat
OCEANIC ZONE
Oceanic Juvenile Stage
Oceanic Adult Stage
Hatchling Swim Frenzy StagePost-Hatchling Trans. Stage
Neritic Juvenile Stage
Neritic Adult Stage
Egg, Embryo, Hatchling
TERRESTRIAL ZONE
Type 1
Type 3
Type 2

Bolten -- 30
NERITIC ZONE
Reproductive StageInternesting Habitat
TERRESTRIAL ZONENesting Beach (supralittoral)
OvipositionEgg, Embryo, Hatchling Stage
OCEANIC & NERITIC ZONES
Juvenile Transitional Stage
NERITIC ZONENeritic Juvenile Stage
Adult Stage
Reproductive Stage
Migration CorridorsBreeding Habitats
OCEANIC ZONEOceanic Juvenile Stage
NERITIC ZONE
Hatchling Swim Frenzy StagePost-Hatchling Transitional Stage
Pelagic (Epipelagic)
(Primary Habitat and Foraging Behavior)
Epibenthic / Demersal
Banks and Seamounts
Pelagic
Epibenthic / Demersal
(Primary Habitat and Foraging Behavior)
Seasonal Movements (North & South)Developmental Movements
NERITIC &OCEANIC ZONES
Bolten -- 31
Lo
Lk
Cc
Ei
Cm
Dc
Nd
mtDNA Phylogeny Reproductive TraitsLife History Patterns

Bolten -- 32
0
1
2
3
4
5
6
20 30 40 50 60 70 80 90
Carapace Length (cm)
Gro
wth
Rat
e (c
m/y
r)