bolton distribution centre - caledon · 5.2 signalized intersection analysis ... canadian tire real...
TRANSCRIPT
Bolton Distribution Centre Coleraine Drive & Holland Road Transportation Considerations December 2011
Bolton Distribution Centre
Transportat ion Considerations
PREPARED FOR: Canadian Tire Real Estate Limited P r e p a r e d b y B A C o n s u l t i n g G r o u p L t d . © D e c e m b e r , 2 0 1 1 b a g r o u p . c o m
B o l t o n D i s t r i b u t i o n C e n t r e DECEMBER | 2011
P:\57\67\38\Reports\TIS Report\Final Report\Bolton Warehouse - Urban Transportation Considerations 2011.12.07.doc
T A B L E O F C O N T E N T S
1 . 0 I N T R O D U C T I O N _ _ _ _ _ _ _ _ _ _ _ _ _ _ _ _ _ _ _ _ _ _ _ _ _ _ _ _ _ _ _ _ _ _ _ _ _ _ _ _ 1
2 . 0 T H E N E W D I S T R I B U T I O N C E N T R E P L A N _ _ _ _ _ _ _ _ _ _ _ _ _ _ _ _ _ _ _ _ 4
3 . 0 T R A N S P O R T A T I O N C O N T E X T _ _ _ _ _ _ _ _ _ _ _ _ _ _ _ _ _ _ _ _ _ _ _ _ _ _ _ _ _ 7
3.1 Existing Roads ________________________________________________________________ 7
3.2 Future Regional Road Improvements _____________________________________________ 8
3.3 Future Town of Caledon Road Improvements _____________________________________ 9
4 . 0 T R A F F I C F O R E C A S T S _ _ _ _ _ _ _ _ _ _ _ _ _ _ _ _ _ _ _ _ _ _ _ _ _ _ _ _ _ _ _ _ _ _ _ 1 3
4.1 Study Scope _________________________________________________________________ 13
4.2 Existing Conditions ___________________________________________________________ 14
4.3 Background Traffic Forecasts __________________________________________________ 17
4.3.1 Corridor Growth .............................................................................................. 17
4.3.2 Future Road Network Traffic Diversion ........................................................... 17
4.4 Forecast Site Traffic Volumes __________________________________________________ 21
4.4.1 Site Trip Generation ....................................................................................... 21
4.4.2 Site Trip Distribution ....................................................................................... 24
4.5 Future Total Traffic Volumes __________________________________________________ 25
5 . 0 T R A N S P O R T A T I O N E V A L U A T I O N _ _ _ _ _ _ _ _ _ _ _ _ _ _ _ _ _ _ _ _ _ _ _ _ _ 2 9
5.1 Basis of Evaluation ___________________________________________________________ 29
5.2 Signalized Intersection Analysis ________________________________________________ 32
5.2.1 Mayfield Road / Albion Vaughan Road / Highway 50 (2016) ............................ 32
5.2.2 Healey Road / Queen Street South / Highway 50 ............................................ 33
5.2.3 Other Signalized Intersections ........................................................................ 34
5.3 Unsignalized Intersection Analysis ______________________________________________ 35
5.3.1 Mayfield Road / Humber Station Road / Clarkway Drive .................................. 35
5.3.2 Other Unsignalized Intersections .................................................................... 36
5.4 Site Access Analysis __________________________________________________________ 36
5.5 Sensitivity Analyses __________________________________________________________ 40
5.5.1 Saturday Midday Analysis ............................................................................... 40
5.5.2 Site Peak Hour Analysis ................................................................................. 41
5.5.3 2021 Horizon Year .......................................................................................... 41
6 . 0 S I T E P A R K I N G R E V I E W _ _ _ _ _ _ _ _ _ _ _ _ _ _ _ _ _ _ _ _ _ _ _ _ _ _ _ _ _ _ _ _ _ 4 2
7 . 0 C O L L I S I O N A N A L Y S I S _ _ _ _ _ _ _ _ _ _ _ _ _ _ _ _ _ _ _ _ _ _ _ _ _ _ _ _ _ _ _ _ _ 4 3
8 . 0 S U M M A R Y A N D C O N C L U S I O N S _ _ _ _ _ _ _ _ _ _ _ _ _ _ _ _ _ _ _ _ _ _ _ _ _ 4 4

B o l t o n D i s t r i b u t i o n C e n t r e DECEMBER | 2011
P:\57\67\38\Reports\TIS Report\Final Report\Bolton Warehouse - Urban Transportation Considerations 2011.12.07.doc
L I S T O F T A B L E S Table 1: Passenger Car Equivalency (PCU) Table ............................................................................................................ 14
Table 2: Existing Brampton DC Trip Generation Volumes .......................................................................................... 22
Table 3: Future Site Traffic Volumes .................................................................................................................................... 23
Table 4: Employee Trip Distribution ..................................................................................................................................... 24
Table 5: Tractor Trailer / Bobtail Trip Distribution ......................................................................................................... 24
Table 6: Mayfield / Albion Vaughan / Highway 50 Analysis ...................................................................................... 33
Table 7: Healey / Queen Street South / Highway 50 Analysis .................................................................................. 34
Table 8: Other Signalized Intersection Overall Analysis .............................................................................................. 35
Table 9: Collision Evaluation for Intersections ................................................................................................................. 43
B o l t o n D i s t r i b u t i o n C e n t r e DECEMBER | 2011
P:\57\67\38\Reports\TIS Report\Final Report\Bolton Warehouse - Urban Transportation Considerations 2011.12.07.doc
L I S T O F F I G U R E S Figure 1 — Site Context .............................................................................................................................................................................. 3
Figure 2 — Concept Site Plan.................................................................................................................................................................... 6
Figure 3 — Key Road Improvements ................................................................................................................................................... 12
Figure 4 — Existing Traffic Volumes ................................................................................................................................................... 16
Figure 5 — Future Background Diversion Layer .............................................................................................................................. 19
Figure 6 — Future Background Traffic Volumes ............................................................................................................................. 20
Figure 7 — Employee Site Traffic Volumes (PCU) ......................................................................................................................... 26
Figure 8 — Tractor Trailer / Bobtail Traffic Volumes (PCU) ....................................................................................................... 27
Figure 9 — Future Total Traffic Volumes (PCU) ............................................................................................................................. 28
Figure 10 — Existing Lane Configurations ........................................................................................................................................ 30
Figure 11 — Planned Lane Configurations ........................................................................................................................................ 31
Figure 12 — Functional Design for Coleraine / Holland – Site Driveway ............................................................................. 38

B o l t o n D i s t r i b u t i o n C e n t r e 1
1 . 0 I n t r o d u c t i o n Canadian Tire Real Estate Limited (“CTREL”) is planning to relocate its distribution centre that
is currently located southeast of the Bramalea Road / Steeles Avenue intersection to a new
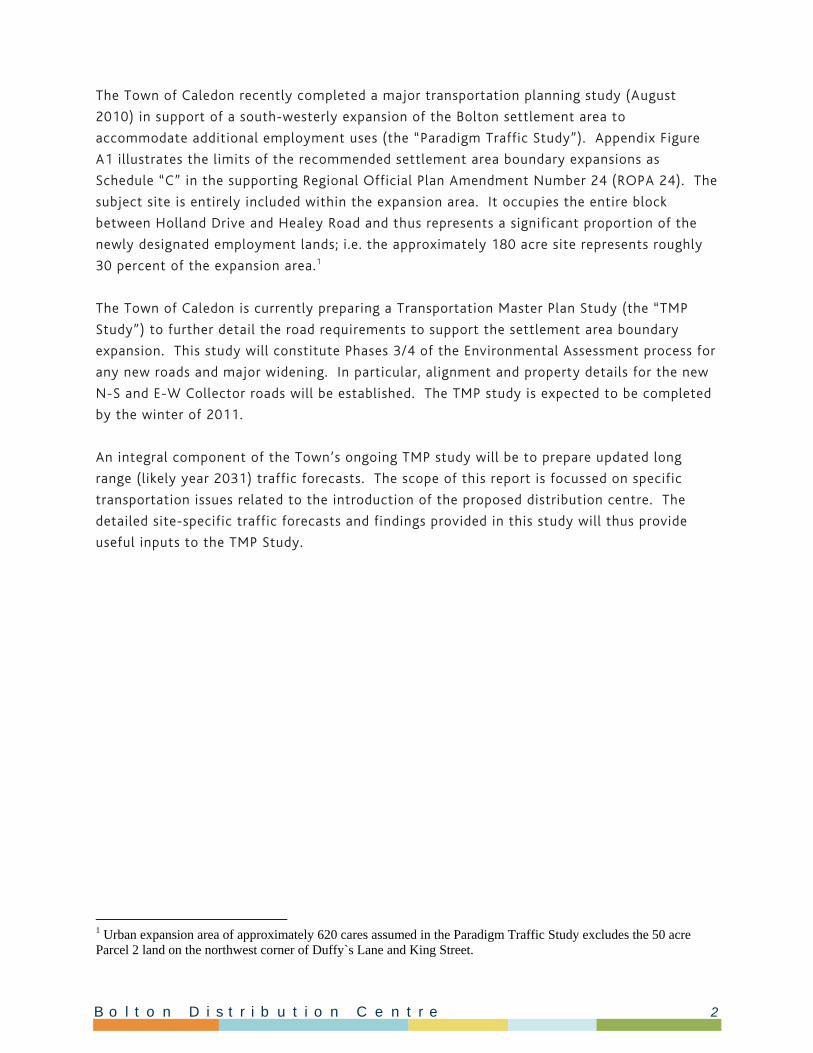
location in the Town of Caledon (“Bolton”). The replacement DC will be located on the west
side of Coleraine Drive, between Healey Road and Holland Drive.
Figure 1 illustrates the existing and proposed DC sites. Also shown are the CN/CP intermodal
facilities which service a portion of the DC truck activity and the other major DC (AJ Billes)
site operated by CTREL.
This report summarizes transportation considerations that affect the successful deployment
of a new (relocated) DC on these lands. Full occupancy of the new facility is not expected
until 2016.
Key sources consulted in the preparation of this report are listed as follows:
Bolton Arterial Roads and Bolton Traffic Mitigation Update, Report PWE-2010-006,
Town of Caledon, March 2, 2010 Town of Caledon Official Plan, Town of Caledon, December 31, 2008 Transportation Planning ROPA Draft Technical Report, Region of Peel, January 2009 Regional Official Plan Amendment: Bolton Rural Service Centre Settlement Boundary
Expansion, Town of Caledon, September 2010 South Albion-Bolton Community Plan Employment Lands Transportation Impact Study –
Part A: Existing Conditions, Constraints and Opportunities, Paradigm Transportation Solutions Ltd., August 2010
South Albion-Bolton Community Plan Employment Lands Transportation Impact Study – Part B: Evaluation of Alternatives, Paradigm Transportation Solutions Ltd., August 2010
Official Plan: Office Consolidation, Region of Peel, November 2008 Peel-Highway 427 Extension Area Transportation Master Plan: Final Report, iTrans, July
2009 Proposed Humber Station Village Community , Cole Engineering, September 2007 2010 Budget Document Transportation, Region of Peel Public Works: Capital Budget 2010 – 2014 Caledon, Region of Peel City of Brampton: 2011 – 2020 Road Capital Program, City of Brampton, January 26,
2011 Construction Program: 2010 – 10 Year Roads, York Region, December 16, 2009 GTA West Corridor Environmental Assessment – Transportation Development Strategy
Report, Ministry of Transportation (MTO), February 2011
B o l t o n D i s t r i b u t i o n C e n t r e 2
The Town of Caledon recently completed a major transportation planning study (August
2010) in support of a south-westerly expansion of the Bolton settlement area to
accommodate additional employment uses (the “Paradigm Traffic Study”). Appendix Figure
A1 illustrates the limits of the recommended settlement area boundary expansions as
Schedule “C” in the supporting Regional Official Plan Amendment Number 24 (ROPA 24). The
subject site is entirely included within the expansion area. It occupies the entire block
between Holland Drive and Healey Road and thus represents a significant proportion of the
newly designated employment lands; i.e. the approximately 180 acre site represents roughly
30 percent of the expansion area.1
The Town of Caledon is currently preparing a Transportation Master Plan Study (the “TMP
Study”) to further detail the road requirements to support the settlement area boundary
expansion. This study will constitute Phases 3/4 of the Environmental Assessment process for
any new roads and major widening. In particular, alignment and property details for the new
N-S and E-W Collector roads will be established. The TMP study is expected to be completed
by the winter of 2011.
An integral component of the Town’s ongoing TMP study will be to prepare updated long
range (likely year 2031) traffic forecasts. The scope of this report is focussed on specific
transportation issues related to the introduction of the proposed distribution centre. The
detailed site-specific traffic forecasts and findings provided in this study will thus provide
useful inputs to the TMP Study.
1 Urban expansion area of approximately 620 cares assumed in the Paradigm Traffic Study excludes the 50 acre Parcel 2 land on the northwest corner of Duffy`s Lane and King Street.
Brampton DC
AJ Billes DC
CP RailIntermodal
CN Rail
Intermodal
Proposed Site
Caledo
nBra
mpt
on
Mississ
auga
Bram
pton
SITE LOCATION
Bolton Distribution Centre5767-38 December 2011
Figure 1
B o l t o n D i s t r i b u t i o n C e n t r e 4
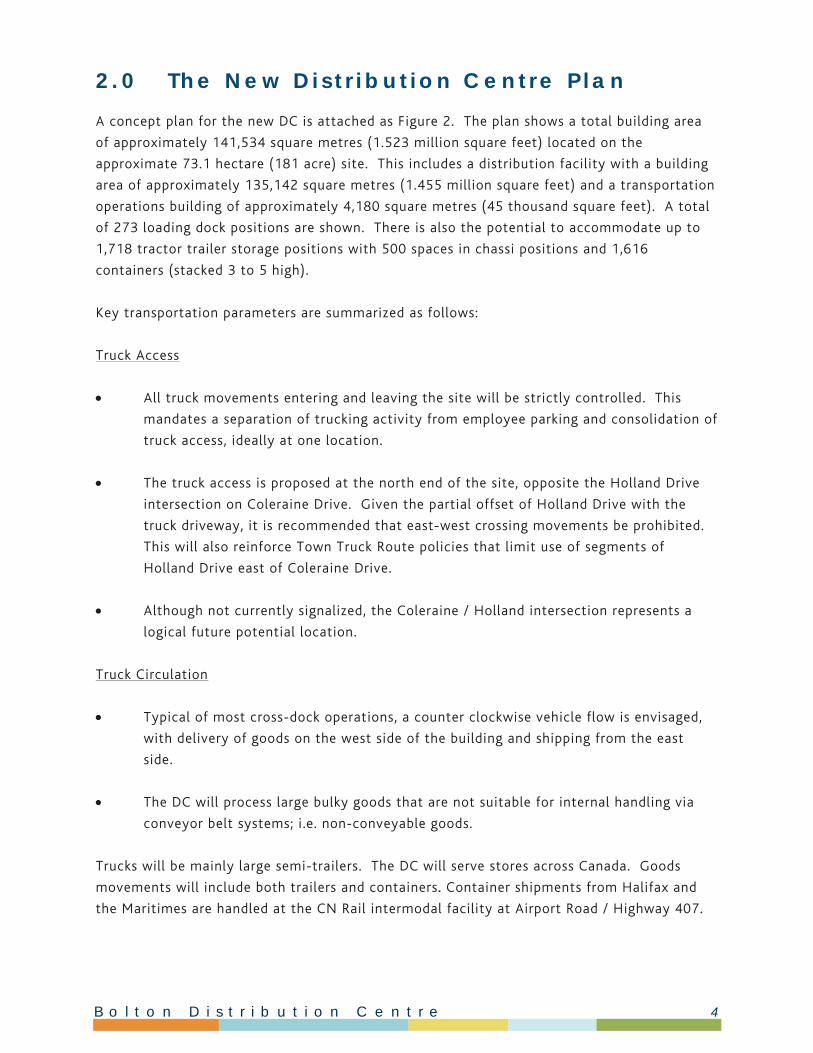
2 . 0 T h e N e w D i s t r i b u t i o n C e n t r e P l a n A concept plan for the new DC is attached as Figure 2. The plan shows a total building area
of approximately 141,534 square metres (1.523 million square feet) located on the
approximate 73.1 hectare (181 acre) site. This includes a distribution facility with a building
area of approximately 135,142 square metres (1.455 million square feet) and a transportation
operations building of approximately 4,180 square metres (45 thousand square feet). A total
of 273 loading dock positions are shown. There is also the potential to accommodate up to
1,718 tractor trailer storage positions with 500 spaces in chassi positions and 1,616
containers (stacked 3 to 5 high).
Key transportation parameters are summarized as follows:
Truck Access
All truck movements entering and leaving the site will be strictly controlled. This
mandates a separation of trucking activity from employee parking and consolidation of
truck access, ideally at one location.
The truck access is proposed at the north end of the site, opposite the Holland Drive
intersection on Coleraine Drive. Given the partial offset of Holland Drive with the
truck driveway, it is recommended that east-west crossing movements be prohibited.
This will also reinforce Town Truck Route policies that limit use of segments of
Holland Drive east of Coleraine Drive.
Although not currently signalized, the Coleraine / Holland intersection represents a
logical future potential location.
Truck Circulation
Typical of most cross-dock operations, a counter clockwise vehicle flow is envisaged,
with delivery of goods on the west side of the building and shipping from the east
side.
The DC will process large bulky goods that are not suitable for internal handling via
conveyor belt systems; i.e. non-conveyable goods.
Trucks will be mainly large semi-trailers. The DC will serve stores across Canada. Goods
movements will include both trailers and containers. Container shipments from Halifax and
the Maritimes are handled at the CN Rail intermodal facility at Airport Road / Highway 407.
B o l t o n D i s t r i b u t i o n C e n t r e 5
The majority of container shipments are handled at the CP Rail intermodal facility located at
Highway 50 / Rutherford Road and are done primarily at night.
Employee Traffic
A separate approximate 632-space lot is provided for distribution centre staff and
visitors, located at the south site limit. Access to the distribution centre parking lot is
proposed via a driveway onto Healey Road located approximately 565 metres west of
Coleraine Drive. The Coleraine / Healey intersection is currently signalized.
A separate approximate 208-space lot is provided for transportation operations
employees and visitors near the northeast site limit. Access to the transportation
operation lot is proposed via a driveway onto Coleraine Drive located approximately
180 metres south of Holland Drive.
A separate approximate 200-space lot is provided for truck cab parking as well as cab /
vendor drivers only and is located on the northern limit of the site. Access to this
parking lot is proposed via a driveway opposite to the proposed signalized intersection
at Holland Drive / Coleraine Drive.
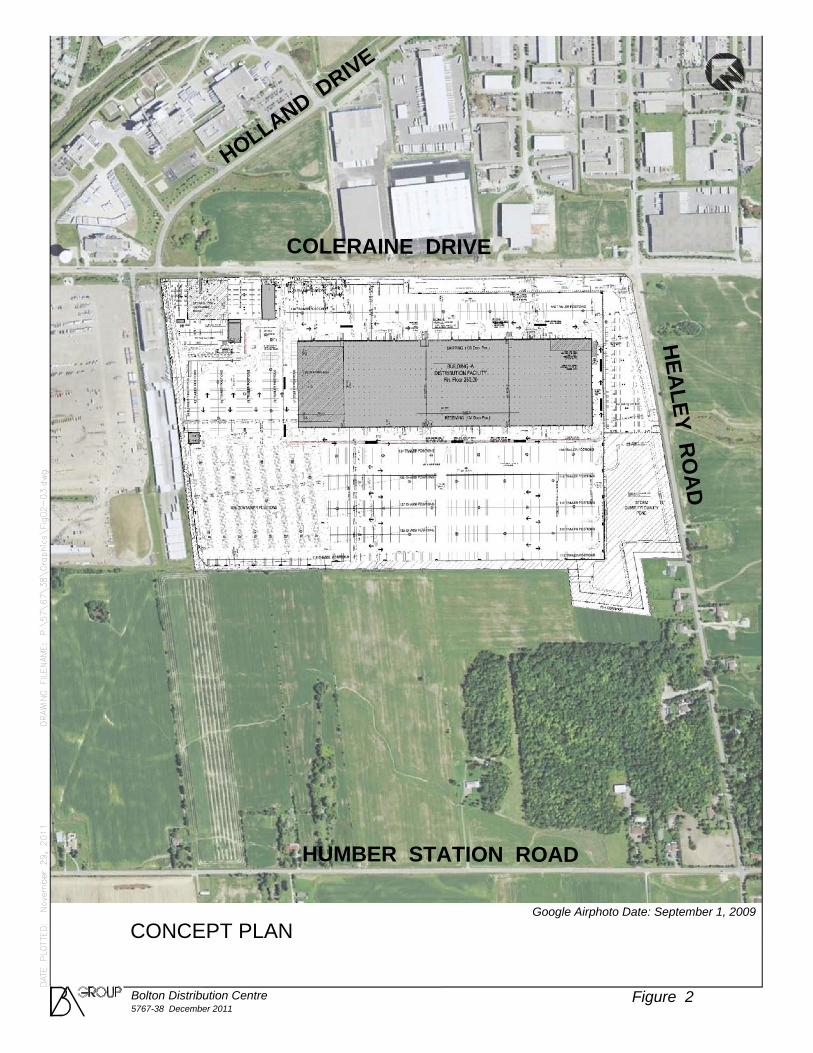
HUMBER STATION ROAD
HEA
LEY RO
AD
COLERAINE DRIVE
HOLLAND DRIVE
Google Airphoto Date: September 1, 2009
CONCEPT PLAN
Bolton Distribution Centre5767-38 December 2011
Figure 2
B o l t o n D i s t r i b u t i o n C e n t r e 7
3 . 0 T r a n s p o r t a t i o n C o n t e x t
3 . 1 E x i s t i n g R o a d s
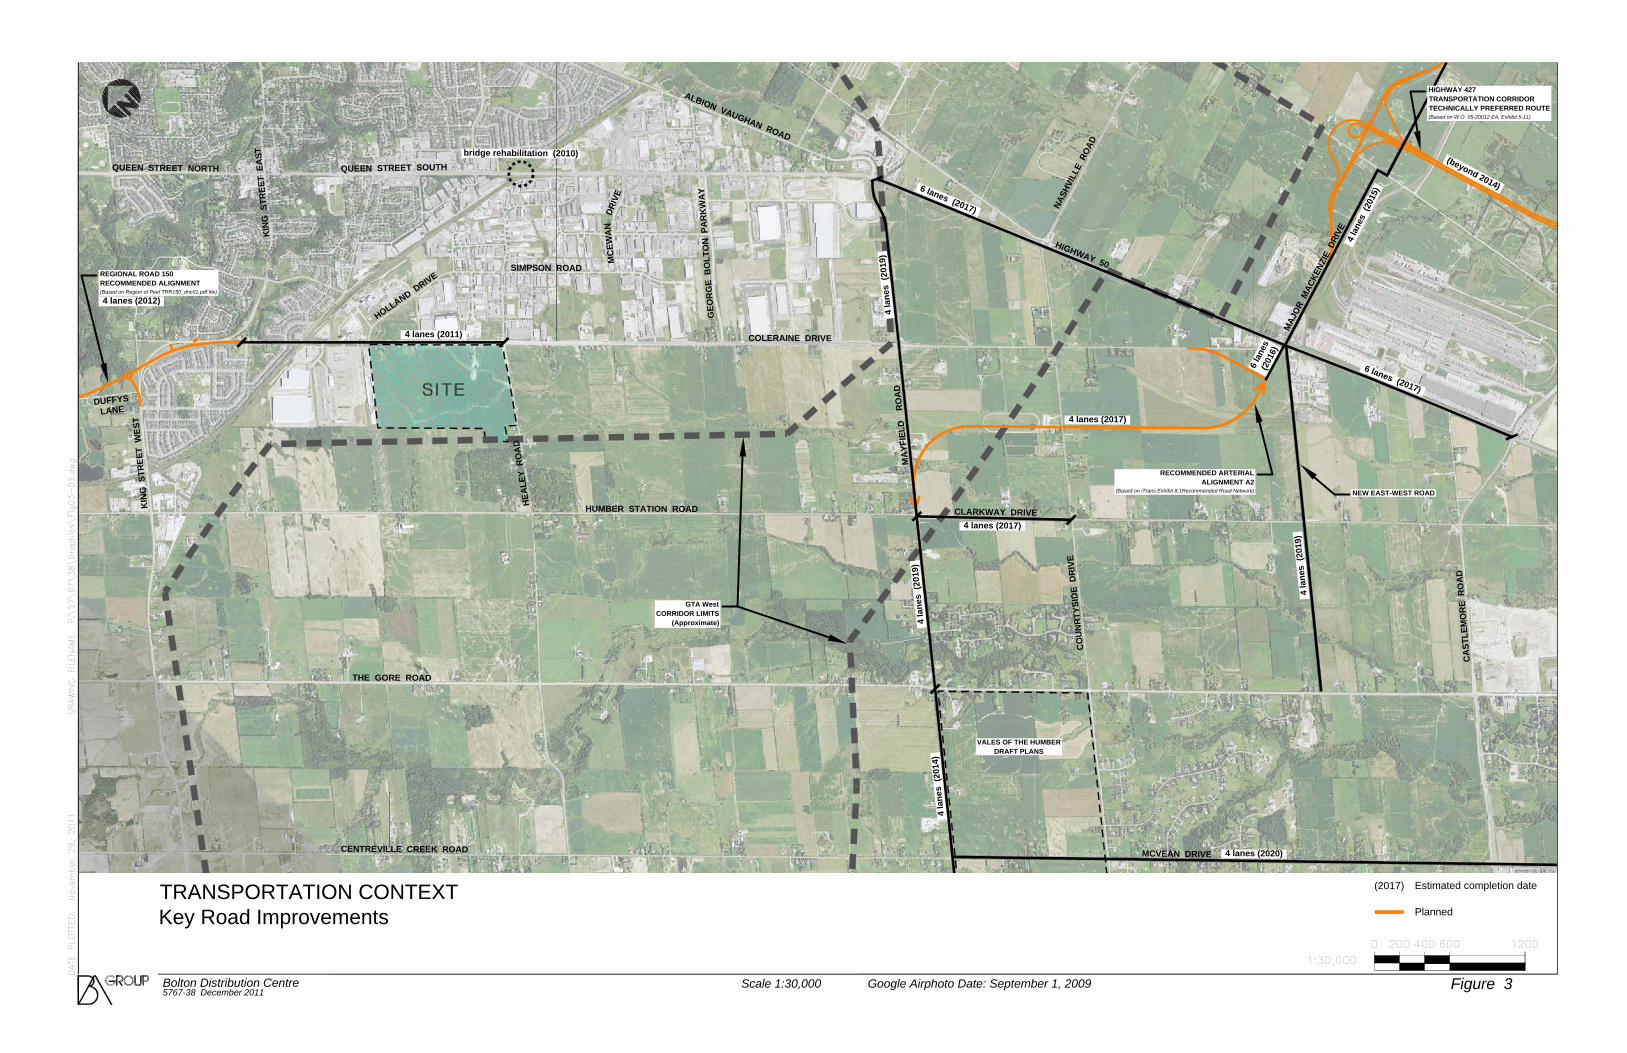
Figure 3 illustrates the existing and planned road network serving the site. Key linkages are
described as follows.
Coleraine Drive
This north-south road is under Town of Caledon jurisdiction. Over the last several years,
Coleraine Drive has been upgraded to a major 4 lane road (plus turning lanes) from its
signalized intersection at Mayfield Road, north to King Street. The posted speed limit is 60 to
70 km/h. Town access policy guidelines are in place to limit the potential for introducing new
private driveways onto Coleraine Drive.
Healey Road
This east-west Town of Caledon road abuts the south site limit. To the east, it connects to
Queen Street (RR 50) at a signalized intersection. To the west it connects with other north-
south arterial roads such as Humber Station Road and The Gore Road. Across the site
frontage, Healey Road has a rural 2 lane cross-section and a posted speed limit of 60 km/h.
Humber Station Road
This north-south road is under Town of Caledon jurisdiction. Humber Station Road has a rural
2 lane cross-section and a posted speed limit of 70 km/h. South of Mayfield Road, Humber
Station Road extends through the City of Brampton as Clarkway Road. The Humber Station –
Clarkway intersections are jogged across Mayfield road by approximately 25 metres
(centreline reference).
Holland Drive
This east-west Town of Caledon road intersects Coleraine Drive near the north site limit. To
the east, its curvilinear alignment intersects with Healey Road and other east-west streets,
thus affording indirect connections to Queen Street (RR 50).
Mayfield Road
This major east-west arterial road is under Peel Region jurisdiction. Mayfield Road extends
well east and west of the site, connecting to other north-south routes such as Highway 410.
In the site environs, Mayfield Road has a rural 2 lane cross-section and a posted speed limit of
60 to 80 km/h.

B o l t o n D i s t r i b u t i o n C e n t r e 8
Highway 50 (Queen Street)
This major north-south arterial road is under Peel Region jurisdiction. Highway 50 affords
numerous route connections for site traffic to the south. North of Mayfield Road, it extends
through the Bolton urban area as Queen Street. Highway 50 generally has an urban 4 lane
cross-section and a posted speed limit of 60 km/h.
3 . 2 F u t u r e R e g i o n a l R o a d I m p r o v e m e n t s
Figure 3 also illustrates planned future key road network linkages and anticipated
construction timings (where available). Key elements are described as follows:
GTA West Transportation Corridor
This new east-west controlled access highway is planned to extend between Highway 400 and
Highway 401 west of Toronto. The Stage 1 report for the GTA West Transportation Corridor
was released in January 2011. It defined a Study Area within which more detailed future road
alignment options and connections will be evaluated in a subsequent Stage 2 report. No date
has been set for initiation of a Stage 2 GTA West Transportation Corridor study. As noted in
Figure 3, the subject lands are located well outside of the defined GTA West Stage 2 Study
Area and thus should not be subject to detailed MTO review.
Highway 427 Extension
The Environmental Assessment for this major highway extension – up to the Major Mackenzie
Drive environs – has been completed and is approved. The Highway 427 Extension and
related improvements to the Major Mackenzie Drive corridor will provide enhanced southerly
routing options for site traffic.
MTO indicates implementation timing to be beyond their 5 year (committed) capital forecast.
Although no commitments have been made by MTO, planned capital works programs for
connecting road links by lower tier agencies anticipate this extension within a 10 year time
frame.
Highway 50 Widening
Environmental Assessment Studies are ongoing for the widening of Highway 50, north
through the Mayfield intersection, to 6 lanes. This is programmed for 2017.
B o l t o n D i s t r i b u t i o n C e n t r e 9
Mayfield Road Widening
Environmental Assessment Studies are ongoing for the widening of Mayfield Road in the site
environs. Widening to at least 4 lanes is planned in years 2014 and 2019 (west and east of
The Gore Road respectively). Provision for 6 lanes is contemplated on the westerly segments.
Mayfield to Highway 427 Connection
Peel Region completed a study (the “iTrans Traffic Study”) to determine, among other things,
an appropriate east-west regional road network configuration given the Highway 427
extension to Major Mackenzie Drive. As illustrated on Figure 3, the iTrans Traffic Study
recommended a curvilinear direct connection between Mayfield Road and Major Mackenzie
Drive.
This new link is planned for implementation in 2017. A joint City / Region Environmental
Assessment Study to confirm alignment / design details may be initiated in 2011. This study
will address issues such as: 1) the nature of the junction at Mayfield Road (perhaps a
roundabout), and 2) the configuration near the south limit of Coleraine Drive.
Brampton E-W Mid-Block Collector
The City of Brampton Capital Works Program shows a new mid-block east-west collector road
intersecting Highway 50 near its existing southern terminus with Coleraine Drive. As noted
previously, road network configuration issues require further study and are not yet resolved.
3 . 3 F u t u r e T o w n o f C a l e d o n R o a d I m p r o v e m e n t s
The Town of Caledon recently completed a major transportation planning study in support of
a south-westerly expansion of the Bolton urban area to accommodate additional employment
uses (the “Paradigm Traffic Study”). As indicated previously, the subject site is entirely
included within the recommended expansion area and represents a significant proportion of
the newly designated employment lands; i.e. the 180 acres site represents approximately 30
percent of the expansion area2.
Appendix Figure A2 is extracted from the Paradigm Traffic Study. It conceptually illustrates
additional area road links and extensions to serve the new employment area. Key comments
follow:
2 Urban expansion area of approximately 620 to acres assumed in the Paradigm Traffic Study excludes the 50 acre Parcel 2 land on the northwest corner of Duffy’s Lane and King Street.
B o l t o n D i s t r i b u t i o n C e n t r e 10
Coleraine Drive
Over the next 2 to 3 years, Coleraine Drive will be extended as a major 4 lane road from King
Street, north to connect with Highway 50 north of Bolton at a new roundabout. Future grade
separation of Coleraine Drive with the CPR line north of the site is contemplated, but
considered to be beyond 2021.
North-South Collector Road
Appendix Figure 2 illustrates a new North-South Collector Road serving the new employment
area, extending between Holland Drive (extended) and Mayfield Road. This new road is
generally aligned along the westerly limits of the new employment lands, including the
subject site.
To serve the new employment uses, there is general merit in planning for additional north–
south road connections to the Mayfield Road corridor. However the need to extend any such
North-South Collector north of Healey Road; i.e. across the west limits of the subject site; is
significantly diminished by the following factors:
The subject site occupies virtually the entire block of (future) designated employment
lands. Satisfactory vehicular site access can be provided from existing streets without
requiring multiple accesses to Coleraine Drive, which might otherwise arise with
smaller individual parcels.
No further extensions north of (extended) Holland Road are contemplated.
There is apparent very limited development potential for the lands west of the site; i.e.
over to Humber Station Road; due to the presence of significant woodlots and other
environmental features. This limits the potential need for future access to such lands
from this N-S Collector segment.
Given the lack of demonstrated need, this study makes no allowance for the segment of the
North-South Collector north of Healey Road. Final confirmation of this recommendation is
subject to the findings of the Town’s TMP Study.
Holland Drive Extension
Appendix Figure 2 illustrates Holland Drive extended west, from its present terminus at
Coleraine Drive, across the north limit of the subject site and connecting to the North-South
Collector (and potentially over to Humber Station Road). The feasibility of and need for this
Holland Street Extension are likewise significantly limited by the following factors:
B o l t o n D i s t r i b u t i o n C e n t r e 11
Without a connection to the North-South Collector, there is limited network
continuity benefit.
At Coleraine Drive, Holland Drive is slightly offset from the north property limit of the
subject site. Satisfactory east-west alignment of a public road would likely require
property acquisition from multiple landowners.
There is apparent very limited development potential for the lands west of the site; i.e.
over to Humber Station Road; due to the presence of significant woodlots and other
environmental features. This limits the potential benefits of any further westerly
extension.
Based on the foregoing, this study makes no allowance for the westerly extension of Holland
Drive. Final confirmation of this recommendation is subject to the findings of the Town’s
TMP Study.
REGIONAL ROAD 150RECOMMENDED ALIGNMENT(Based on Region of Peel TRR150_dnc01.pdf file)
RECOMMENDED ARTERIALALIGNMENT A2
(Based on iTrans Exhibit 8.1Recommended Road Network) NEW EAST-WEST ROAD
GTA WestCORRIDOR LIMITS
(Approximate)
VALES OF THE HUMBERDRAFT PLANS
CLARKWAY DRIVE
CO
UN
RTY
SID
E D
RIV
E
MA
YFIE
LD
RO
AD
HUMBER STATION ROAD
HEA
LEY
RO
AD
KIN
G S
TREE
T W
EST
THE GORE ROAD
HIGHWAY 50
MAJ
OR M
ACKE
NZIE
DRI
VE
NASH
VILL
E R
OAD
COLERAINE DRIVE
HOLLAND DRIVE
QUEEN STREET SOUTHQUEEN STREET NORTH
DUFFYSLANE
KIN
G S
TREE
T E
AST
CA
STLE
MO
RE
RO
AD
ALBION VAUGHAN ROAD
SIMPSON ROAD
MC
EWA
N
GEO
RG
E B
OLT
ON
PA
RK
WA
Y
DRIV
E
CENTREVILLE CREEK ROAD MCVEAN DRIVE
4 la
nes
(201
9)
4 la
nes
(201
9)
4 la
nes
(201
4)
6 lanes (2017)
6 lanes (2017)
(beyond 2014)
bridge rehabilitation (2010)
4 lanes (2012)
4 lanes (2011)
4 lanes (2017)
4 la
nes
(201
9)
4 la
nes
(201
5)
HIGHWAY 427TRANSPORTATION CORRIDORTECHNICALLY PREFERRED ROUTE(Based on W.O. 05-20012 EA, Exhibit 5-11)
4 lanes (2017)
6 la
nes
(201
6)
4 lanes (2020)
TRANSPORTATION CONTEXTKey Road Improvements
Bolton Distribution Centre5767-38 December 2011
Figure 3Scale 1:30,000 Google Airphoto Date: September 1, 2009
(2017) Estimated completion date
Planned
B o l t o n D i s t r i b u t i o n C e n t r e 13
4 . 0 T r a f f i c F o r e c a s t s
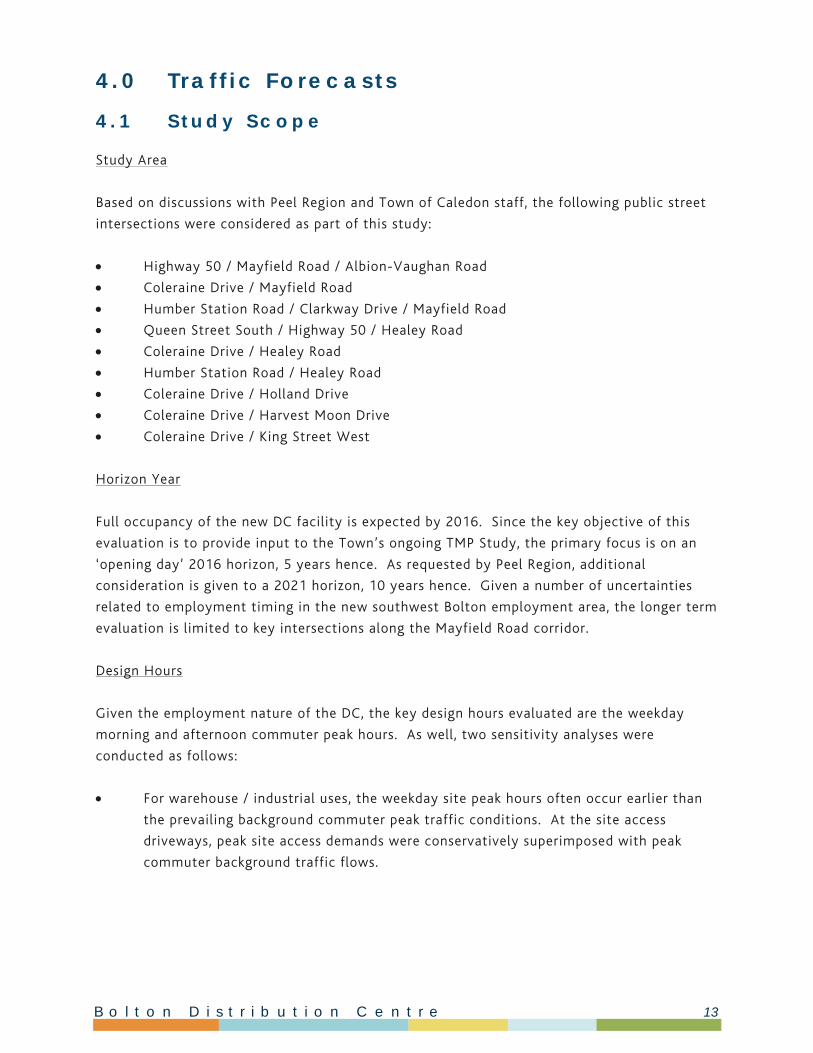
4 . 1 S t u d y S c o p e
Study Area
Based on discussions with Peel Region and Town of Caledon staff, the following public street
intersections were considered as part of this study:
Highway 50 / Mayfield Road / Albion-Vaughan Road
Coleraine Drive / Mayfield Road
Humber Station Road / Clarkway Drive / Mayfield Road
Queen Street South / Highway 50 / Healey Road
Coleraine Drive / Healey Road
Humber Station Road / Healey Road
Coleraine Drive / Holland Drive
Coleraine Drive / Harvest Moon Drive
Coleraine Drive / King Street West
Horizon Year
Full occupancy of the new DC facility is expected by 2016. Since the key objective of this
evaluation is to provide input to the Town’s ongoing TMP Study, the primary focus is on an
‘opening day’ 2016 horizon, 5 years hence. As requested by Peel Region, additional
consideration is given to a 2021 horizon, 10 years hence. Given a number of uncertainties
related to employment timing in the new southwest Bolton employment area, the longer term
evaluation is limited to key intersections along the Mayfield Road corridor.
Design Hours
Given the employment nature of the DC, the key design hours evaluated are the weekday
morning and afternoon commuter peak hours. As well, two sensitivity analyses were
conducted as follows:
For warehouse / industrial uses, the weekday site peak hours often occur earlier than
the prevailing background commuter peak traffic conditions. At the site access
driveways, peak site access demands were conservatively superimposed with peak
commuter background traffic flows.
B o l t o n D i s t r i b u t i o n C e n t r e 14
Given that the DC is open on Saturdays, Peel Region requested confirmation that this
design period would not represent governing conditions. For comparison purposes,
existing counts and operations analyses were conducted during Saturday midday
conditions at the key Highway 50 / Mayfield Road intersection.
Truck Traffic
The nature of the proposed distribution centre (DC) will generate a certain amount of
trucking activity. Most of the new site generated trucks will be large tractor trailers.
Information provided by Canadian Tire indicates that the maximum payload for a truck is
42,000 pounds. An average payload is not available. These trucks have relatively greater
operational impacts on the road network compared to typical passenger vehicles; i.e. cars and
vans.
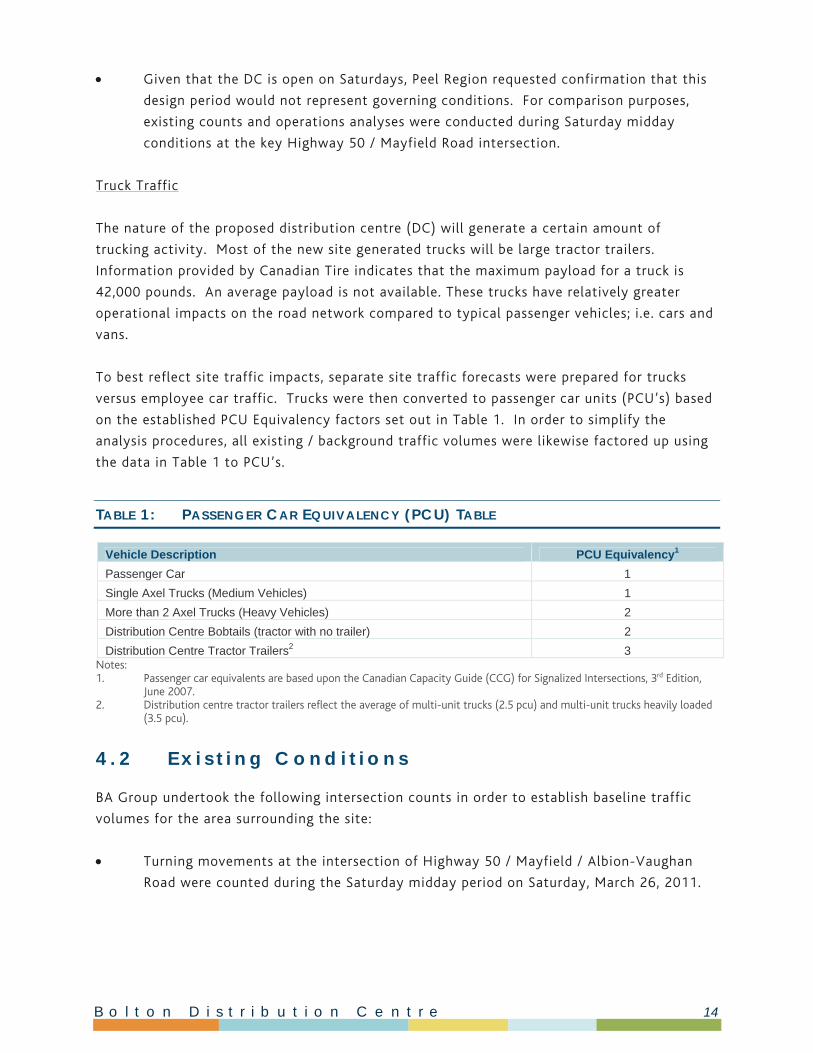
To best reflect site traffic impacts, separate site traffic forecasts were prepared for trucks
versus employee car traffic. Trucks were then converted to passenger car units (PCU’s) based
on the established PCU Equivalency factors set out in Table 1. In order to simplify the
analysis procedures, all existing / background traffic volumes were likewise factored up using
the data in Table 1 to PCU’s.
TABLE 1: PASSENGER CAR EQUIVALENCY (PCU) TABLE
Vehicle Description PCU Equivalency1
Passenger Car 1
Single Axel Trucks (Medium Vehicles) 1
More than 2 Axel Trucks (Heavy Vehicles) 2
Distribution Centre Bobtails (tractor with no trailer) 2
Distribution Centre Tractor Trailers2 3 Notes: 1. Passenger car equivalents are based upon the Canadian Capacity Guide (CCG) for Signalized Intersections, 3rd Edition,
June 2007. 2. Distribution centre tractor trailers reflect the average of multi-unit trucks (2.5 pcu) and multi-unit trucks heavily loaded
(3.5 pcu).
4 . 2 E x i s t i n g C o n d i t i o n s
BA Group undertook the following intersection counts in order to establish baseline traffic
volumes for the area surrounding the site:
Turning movements at the intersection of Highway 50 / Mayfield / Albion-Vaughan
Road were counted during the Saturday midday period on Saturday, March 26, 2011.
B o l t o n D i s t r i b u t i o n C e n t r e 15
Turning movements at the intersection of Queen Street South / Highway 50 / Healey
Road, Coleraine Drive / Healey Road, Humber Station Road / Healey Road, Coleraine
Drive / Holland Drive and Coleraine Drive / King Street West during the morning and
afternoon peak periods on Wednesday, January 19, 2011.
Turning movements at the intersection of Coleraine Drive / Harvest Moon Drive were
counted during the morning and afternoon peak periods on Wednesday, April 20, 2011.
Turning movements at the intersection of Humber Station Road / Clarkway Drive /
Mayfield Road were counted on Thursday, April 21, 2011 during the morning and
afternoon peak periods.
Turning movements at the intersection of Coleraine Drive and Mayfield Road were
counted during the morning and afternoon peak periods on Wednesday, May 4, 2011.
Peel Region undertook the following intersection counts that were used to establish baseline
traffic volumes for the area surrounding the site:
Turning movements at the intersection of Mayfield Road / Highway 50 / Albion-
Vaughan Road were counted during the morning and afternoon peak periods on
Thursday, March 4, 2010.
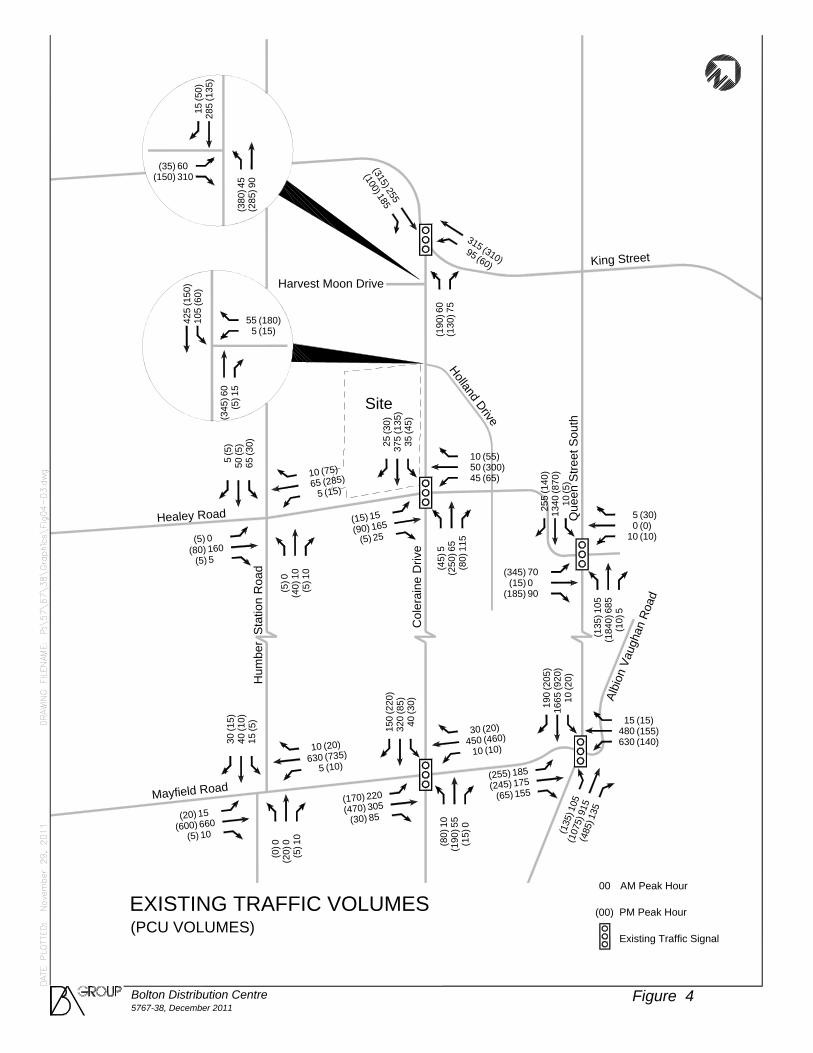
The foregoing counts were reviewed for consistency with other available data and found to
appropriately represent existing conditions3. Existing morning and afternoon peak hour traffic
volumes expressed as passenger car units (PCU’s) are illustrated on Figure 4.
3 In completing this review, it was determined that the base traffic count at the Mayfield Road / Highway 50 / Albion-Vaughan Road intersection that was used in the Paradigm Traffic Study had several atypically high left turn movements.
Site
(310)
315(60)
95
255
(315)185
(100)
King Street
Healey Road
Mayfield Road
Holland Drive
60(1
90) 75
(130
)
10(4
0)
(5)
50
0(5
) 10(5
)
(30)
65
(5)
5
(285)65(15)5
(75)10
160(80)0(5)
5(5)
(300)50(65)45
(55)1065
(250
)5(4
5)
115
(80)
(135
)37
5(4
5)35
(30)
25
165(90)15(15)
25(5)(0)0(10)10
(30)5
685
(184
0)10
5(1
35) 5
(10)
(870
)13
40(5
)10
(140
)25
5
60(35)
70(345)
310(150)
(155)480(140)630
(15)15
(920
)16
65(2
0)10
(205
)19
0
175(245)185(255)
155(65)
915
(107
5)10
5(1
35) 13
5(4
85)
(85)
320
(30)
40
(220
)15
0
(10)
40(5
)15
(15)
30
305(470)220(170)
85(30)660(600)15(20)
10(5)
55(1
90)10
(80)
0(1
5)
0(2
0)0
(0) 10
(5)
(735)630(10)5
(20)10(460)450(10)10
(20)30
Harvest Moon Drive
Hum
ber
Sta
tion
Roa
d
Col
erai
ne D
rive
Que
en S
treet
Sou
th
Albi
on V
augh
an R
oad
(15)5(180)55
60(3
45) 15
(5)
(60)
105
(150
)42
5
(135
)28
5(5
0)15
45(3
80) 90
(285
)
0(15)90(185)
00
(00)
AM Peak Hour
PM Peak Hour
Existing Traffic Signal
EXISTING TRAFFIC VOLUMES(PCU VOLUMES)
Bolton Distribution Centre5767-38, December 2011
Figure 4
B o l t o n D i s t r i b u t i o n C e n t r e 17
4 . 3 B a c k g r o u n d T r a f f i c F o r e c a s t s
4.3.1 Corridor Growth
BA Group conducted a review of corridor growth along Mayfield Road / Gore Road, Coleraine
Drive / Mayfield Road and Highway 50 / Mayfield Road based upon historical counts within
the area. Historical regression trends along these corridors can be found in Appendix B.
Based upon discussions with Peel Region and BA Group’s analysis, the following corridor
growth per annum has been applied to all movements based upon a compound growth rate
for 5 years4:
King Street West, Coleraine Road, Queen Street South / Highway 50 – 1.5% / annum
Mayfield Road – 2.5 % / annum
Given the near term focus of this evaluation and uncertainties about development timing in
the southwest Bolton employment area, these corridor growth factors are considered to
provide an appropriate basis for derivation of future background traffic conditions.
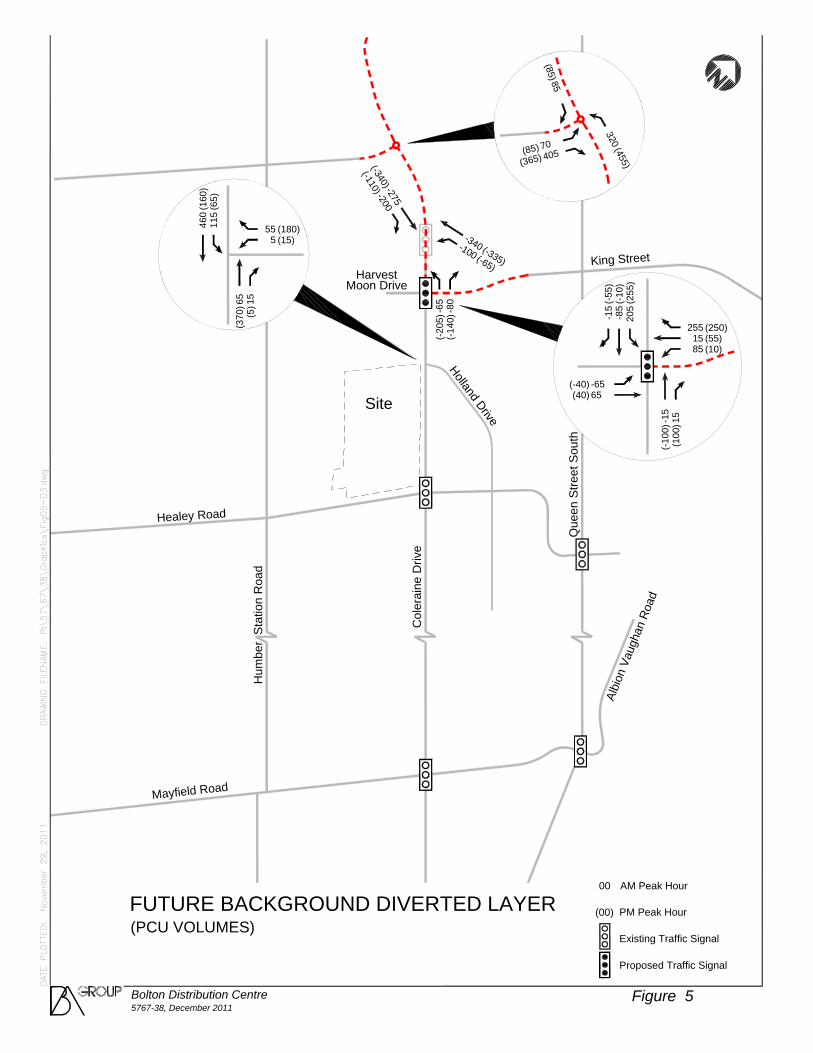
4.3.2 Future Road Network Traffic Diversion
As mentioned previously, Coleraine Drive will be completed as a major four-lane road,
connecting to Highway 50 north of Bolton at a new roundabout over the next 2 to 3 years.
In order for the northern connection of King Street West and Coleraine to be implemented,
King Street West, east of Coleraine Drive will be re-aligned at Harvest Moon Drive. This will
result in the effective ‘replacement’ of the existing Coleraine Drive / King Street West
intersection with a new intersection on Coleraine Drive at Harvest Moon Drive / King Street.
The following assumptions have been implemented to reflect the foregoing road network
changes:
Vehicles exiting / entering Harvest Moon Drive from / to the north (EBL, SBR) are
reassigned as through movements (EBT, WBT) along the new intersection of King
Street West.
4 For the year 2021 sensitivity analysis along the Mayfield Road corridor, the corridor growth factor was applied over a 10 year period.
B o l t o n D i s t r i b u t i o n C e n t r e 18
With the new connection of the westerly portion of King Street West and Highway 50
to be provided north of Bolton, it is assumed that 25% of the eastbound traffic
volumes heading into downtown Bolton along King Street West would divert towards
the north and use the new roundabout at King Street / Coleraine Drive to by-pass
Bolton. This represents approximately 70 and 85 trips during the morning and
afternoon peak hours, respectively.
Similar to the above, westbound traffic volumes along King Street West would by-pass
Bolton and use the northern extension of King Street West / Highway 50 to continue
travelling westbound. This represents approximately 85 trips during the morning and
afternoon peak hours.
All other existing volumes at the intersection of King Street West / Coleraine Drive are
reassigned to the new intersection of Harvest Moon Drive- King Street West /
Coleraine Drive, assuming the same travel patterns as existing.
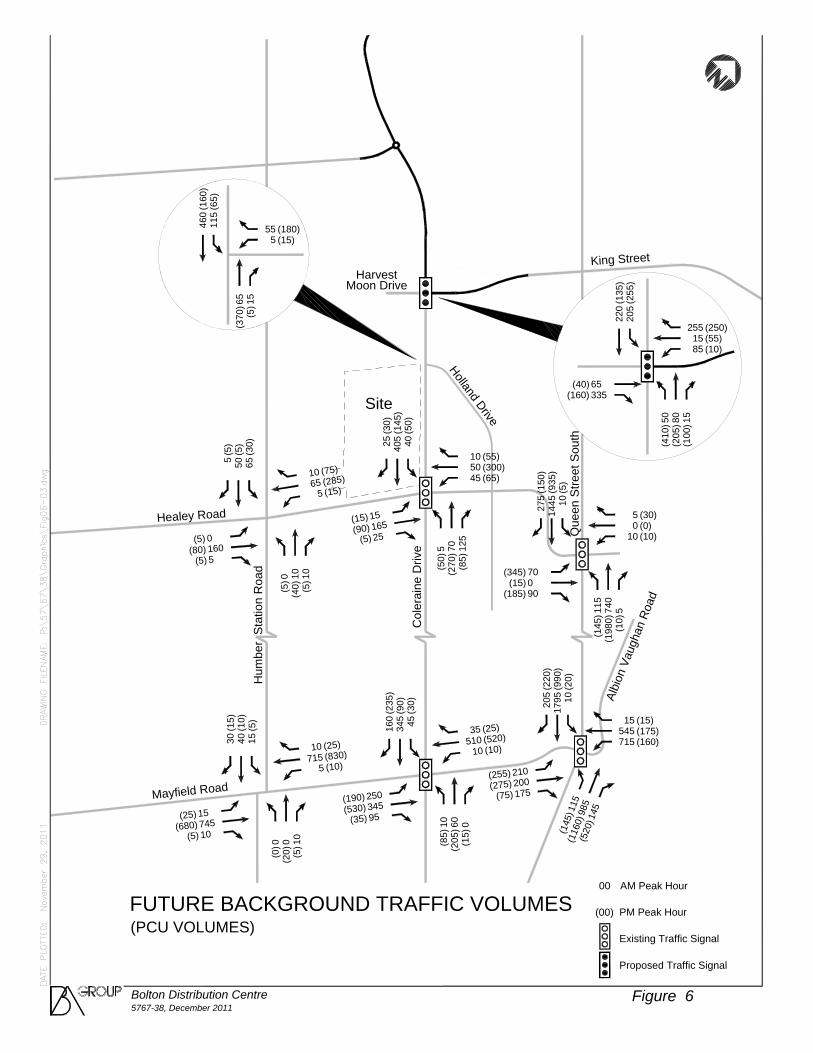
Future diverted / reassigned background volumes are illustrated on Figure 5.
Future background traffic, which is the sum of existing, corridor growth, and the diverted
traffic layer, is illustrated on Figure 6.
Site
(-335)
-340(-65)
-100
-275
(-340)-200
(-110)
King Street
Healey Road
Mayfield Road
(15)5(180)55
Holland Drive
-65
(-20
5)-8
0(-
140)
65(3
70) 15
(5)
(160
)46
0(6
5)11
5
Hum
ber
Sta
tion
Roa
d
Col
erai
ne D
rive
Que
en S
treet
Sou
th
Albi
on V
augh
an R
oad
Moon DriveHarvest
70(85)405
(365)
85(85)
(455)
320
-15
(-10
0)
(-10
)-8
5
15(1
00)
(255
)20
5
(-55
)-1
5
(55)15(10)85
(250)255
65(40)-65(-40)
00
(00)
AM Peak Hour
PM Peak Hour
Existing Traffic Signal
Proposed Traffic Signal
FUTURE BACKGROUND DIVERTED LAYER(PCU VOLUMES)
Bolton Distribution Centre5767-38, December 2011
Figure 5
Albi
on V
augh
an R
oad
Site
King Street
Healey Road
Holland Drive
10(4
0)
(5)
50
0(5
) 10(5
)
(30)
65
(5)
5
(285)65(15)5
(75)10
160(80)0(5)
5(5)
(300)50(65)45
(55)1070
(270
)5(5
0)
125
(85)
(145
)40
5(5
0)40
(30)
25
165(90)15(15)
25(5)(0)0(10)10
(30)5
740
(198
0)11
5(1
45) 5
(10)
(935
)14
45(5
)10
(150
)27
5
0(15)70(345)
90(185)
(175)545(160)715
(15)15
(990
)17
95(2
0)10
(220
)20
5
200(275)210(255)
175(75)
985
(116
0)11
5(1
45) 14
5(5
20)
(90)
345
(30)
45
(235
)16
0
(10)
40(5
)15
(15)
30
345(530)250(190)
95(35)745(680)15(25)
10(5)
60(2
05)10
(85)
0(1
5)
0(2
0)0
(0) 10
(5)
(830)715(10)5
(25)10(520)510(10)10
(25)35
Mayfield Road
Hum
ber
Sta
tion
Roa
d
Col
erai
ne D
rive
(15)5(180)55
65(3
70) 15
(5)
(160
)46
0(6
5)11
5
Que
en S
treet
Sou
th
Moon DriveHarvest
80(2
05)
(135
)22
0
15(1
00)
(255
)20
5
(55)15(10)85
(250)255
335(160)65(40)
50(4
10)
FUTURE BACKGROUND TRAFFIC VOLUMES(PCU VOLUMES)
Bolton Distribution Centre5767-38, December 2011
Figure 6
00
(00)
AM Peak Hour
PM Peak Hour
Existing Traffic Signal
Proposed Traffic Signal

B o l t o n D i s t r i b u t i o n C e n t r e 21
4 . 4 F o r e c a s t S i t e T r a f f i c V o l u m e s
Future site traffic volumes were calculated by factoring existing baseline volumes (at the
Brampton Distribution Centre Facility) in proportion to the planned increase in employment
opportunities at the new site in Bolton.
Canadian Tire has confirmed that the total number of truck movements will remain the same
as per existing activity at their Brampton DC facility.
The directional orientation of new site generated traffic has been determined as follows:
Toronto Transportation Survey (TTS) data for employees; and,
Canadian Tire data of store loads and vendor pickups for trucks.
Site traffic was assigned to the area road network based on the foregoing parameters and
practical local routing assumptions.
4.4.1 Site Trip Generation
BA Group undertook a study of the existing Brampton Distribution Facility (2111 Steeles
Avenue West) located on the southeast corner of Bramalea Road and Steeles Avenue West.
Existing employee vehicle trip baseline volumes were counted during the morning and
afternoon peak periods on Tuesday, January 25, 2011 (6:00 to 9:00am and 3:00 to 6:00pm.
Volumes counted on this day are representative of an average day at this distribution centre.
Traffic volumes were also differentiated between the staff at the Brampton Distribution
Centre versus Transportation Operation staff, since separate accesses and parking facilities
are provided for each group.
BA Group also obtained extensive data documenting existing tractor trailer volumes (in and
out volumes) at the Brampton Distribution Centre for the following time periods:
average week (Monday to Friday, February 22-26, 2010);
3rd busiest week (Monday to Friday, May 10-14, 2010); and,
10th busiest week (Monday to Friday, June 7-11, 2010).
Confidential data provided by Canadian Tire confirms that DC trucking activity is well
distributed throughout the day, with peaks typically occurring outside of the traditional street
peak periods.

B o l t o n D i s t r i b u t i o n C e n t r e 22
Based on a review of this data, (high) design hour tractor trailer in / out traffic volumes were
determined for the morning and afternoon street peak hours as well as a site peak hour. Input
provided by Canadian Tire staff indicated that bobtail traffic is estimated as an additional 45
percent of tractor trailer volumes – moving in the opposite directional orientation.
Existing morning and afternoon weekday street peak hour vehicular trips (expressed as PCU
equivalents) are summarized in Table 2 for the different categories of trips at the Brampton
Distribution Facility. Given the earlier shift change times of the Distribution Centre
employees, site traffic volumes are also shown for an afternoon site peak hour; i.e. 3:00 to
4:00pm. These higher afternoon site peak hour volumes clearly reflect governing two-way
traffic flow conditions for Distribution Facility staff5.
TABLE 2: EXISTING BRAMPTON DC TRIP GENERATION VOLUMES
Trip Category No. of
Employees In1 Out1 2-way1
Distribution Centre Employees2 (cars) 596 20 (15) [115] 15 (25) [70] 35 (40) [185]
Transportation Operations Employees3 254 60 (15) [30] 5 (85) [75] 65 (100) [105]
Tractor Trailers2 - 45 (40) [60] 30 (35) [45] 75 (75) [105]
Bobtails (Tractor with no trailer)2 - 10 (10) [15] 15 (10) [20] 25 (20) [35]
Total (PCU’s) - 135 (80) [220] 65 (155) [210] 200 (235) [430]
Notes: 1. xx (xx) [xx] – AM (PM) [Site Peak Hour]
Street peak hours: 7:00 to 8:00am and 4:00 to 5:00 pm. Afternoon site peak hour: 3:00 to 4:00 pm. 2. Distribution Centre employees work two extended shifts – a 5:45am to 3:00pm day shift and a 3:00pm to 1:45am
afternoon/evening shift. 3. Transportation Operations employees work between 8:00am to 5:00pm. 4. Refer to Table 1 for PCU equivalencies.
Future site traffic volumes are based upon the forecast employee volumes provided by
Canadian Tire. Baseline site traffic volumes were then increased proportionally to reflect
these changes. Distribution centre employee volumes are forecast to increase by 50 percent,
while Transportation Operation employees are forecast to increase by 25 percent.
5 Site traffic generation during an earlier morning site peak hour; i.e. 6:00 to 7:00 am are much lower than afternoon site peak hour volumes. Comparable inbound traffic flows for Distribution Centre staff may occur during a 5:00 to 6:00am hour, however overall background traffic volumes will be substantially reduced.
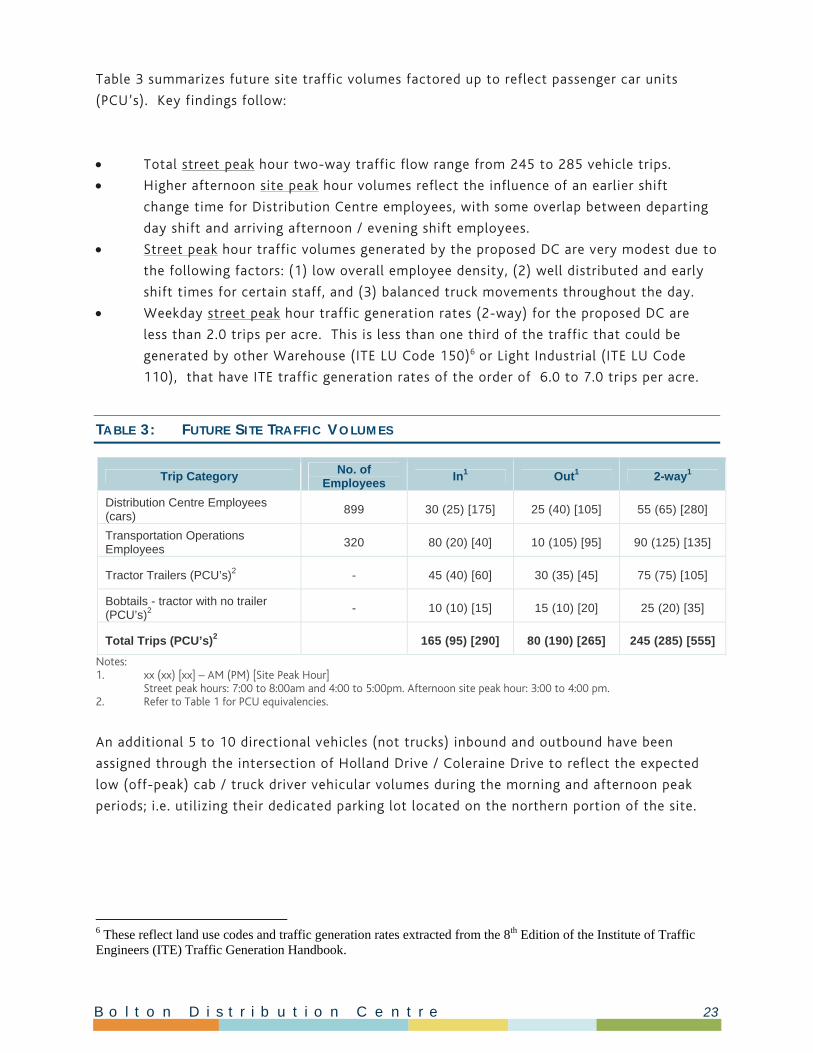
B o l t o n D i s t r i b u t i o n C e n t r e 23
Table 3 summarizes future site traffic volumes factored up to reflect passenger car units
(PCU’s). Key findings follow:
Total street peak hour two-way traffic flow range from 245 to 285 vehicle trips.
Higher afternoon site peak hour volumes reflect the influence of an earlier shift
change time for Distribution Centre employees, with some overlap between departing
day shift and arriving afternoon / evening shift employees.
Street peak hour traffic volumes generated by the proposed DC are very modest due to
the following factors: (1) low overall employee density, (2) well distributed and early
shift times for certain staff, and (3) balanced truck movements throughout the day.
Weekday street peak hour traffic generation rates (2-way) for the proposed DC are
less than 2.0 trips per acre. This is less than one third of the traffic that could be
generated by other Warehouse (ITE LU Code 150)6 or Light Industrial (ITE LU Code
110), that have ITE traffic generation rates of the order of 6.0 to 7.0 trips per acre.
TABLE 3: FUTURE SITE TRAFFIC VOLUMES
Trip Category No. of
Employees In1 Out1 2-way1
Distribution Centre Employees (cars) 899 30 (25) [175] 25 (40) [105] 55 (65) [280]
Transportation Operations Employees
320 80 (20) [40] 10 (105) [95] 90 (125) [135]
Tractor Trailers (PCU’s)2 - 45 (40) [60] 30 (35) [45] 75 (75) [105]
Bobtails - tractor with no trailer (PCU’s)2 - 10 (10) [15] 15 (10) [20] 25 (20) [35]
Total Trips (PCU’s)2 165 (95) [290] 80 (190) [265] 245 (285) [555]
Notes: 1. xx (xx) [xx] – AM (PM) [Site Peak Hour]
Street peak hours: 7:00 to 8:00am and 4:00 to 5:00pm. Afternoon site peak hour: 3:00 to 4:00 pm. 2. Refer to Table 1 for PCU equivalencies.
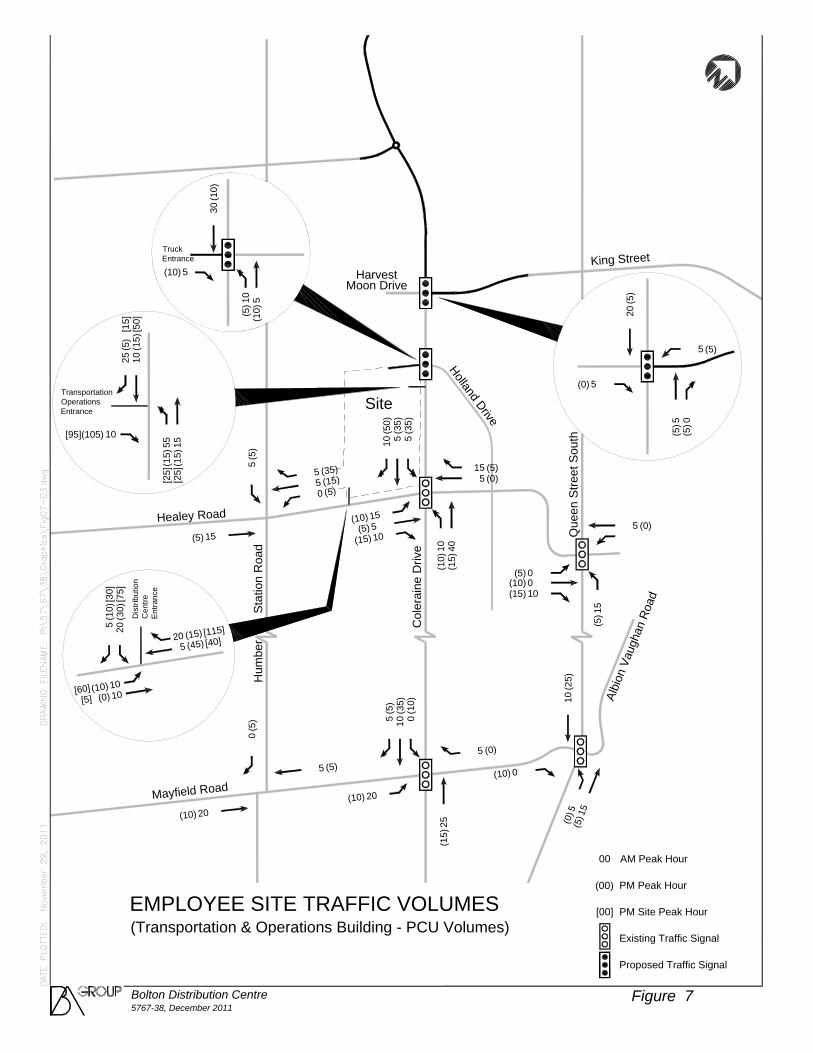
An additional 5 to 10 directional vehicles (not trucks) inbound and outbound have been
assigned through the intersection of Holland Drive / Coleraine Drive to reflect the expected
low (off-peak) cab / truck driver vehicular volumes during the morning and afternoon peak
periods; i.e. utilizing their dedicated parking lot located on the northern portion of the site.
6 These reflect land use codes and traffic generation rates extracted from the 8th Edition of the Institute of Traffic Engineers (ITE) Traffic Generation Handbook.
B o l t o n D i s t r i b u t i o n C e n t r e 24
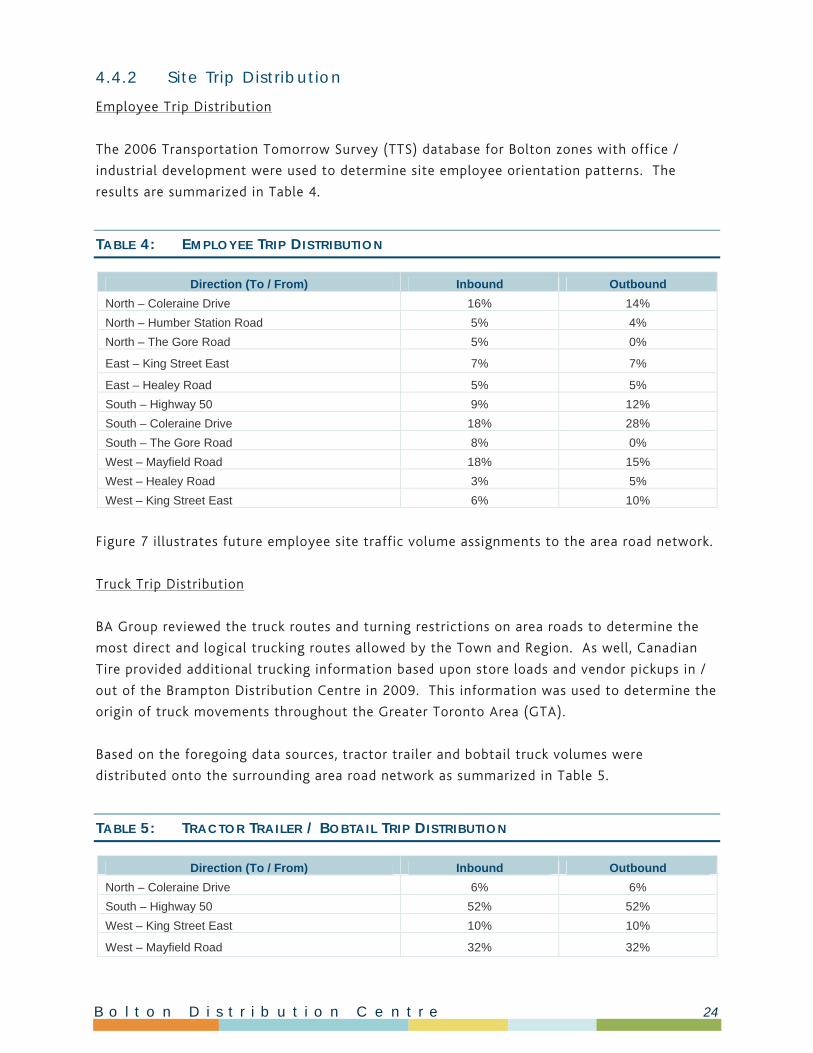
4.4.2 Site Trip Distribution
Employee Trip Distribution
The 2006 Transportation Tomorrow Survey (TTS) database for Bolton zones with office /
industrial development were used to determine site employee orientation patterns. The
results are summarized in Table 4.
TABLE 4: EMPLOYEE TRIP DISTRIBUTION
Direction (To / From) Inbound Outbound
North – Coleraine Drive 16% 14%
North – Humber Station Road 5% 4%
North – The Gore Road 5% 0%
East – King Street East 7% 7%
East – Healey Road 5% 5%
South – Highway 50 9% 12%
South – Coleraine Drive 18% 28%
South – The Gore Road 8% 0%
West – Mayfield Road 18% 15%
West – Healey Road 3% 5%
West – King Street East 6% 10%
Figure 7 illustrates future employee site traffic volume assignments to the area road network.
Truck Trip Distribution
BA Group reviewed the truck routes and turning restrictions on area roads to determine the
most direct and logical trucking routes allowed by the Town and Region. As well, Canadian
Tire provided additional trucking information based upon store loads and vendor pickups in /
out of the Brampton Distribution Centre in 2009. This information was used to determine the
origin of truck movements throughout the Greater Toronto Area (GTA).
Based on the foregoing data sources, tractor trailer and bobtail truck volumes were
distributed onto the surrounding area road network as summarized in Table 5.
TABLE 5: TRACTOR TRAILER / BOBTAIL TRIP DISTRIBUTION
Direction (To / From) Inbound Outbound
North – Coleraine Drive 6% 6%
South – Highway 50 52% 52%
West – King Street East 10% 10%
West – Mayfield Road 32% 32%

B o l t o n D i s t r i b u t i o n C e n t r e 25
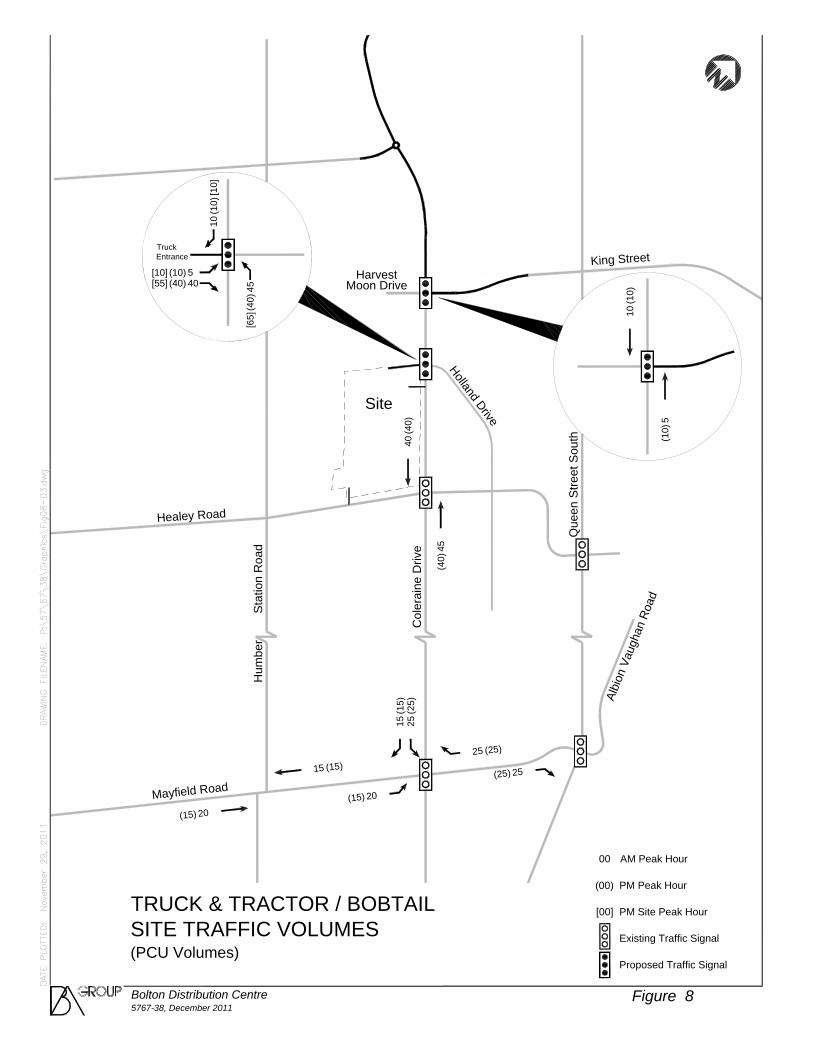
Figure 8 illustrates tractor trailer and bobtail traffic volumes assignments to the area road
network.
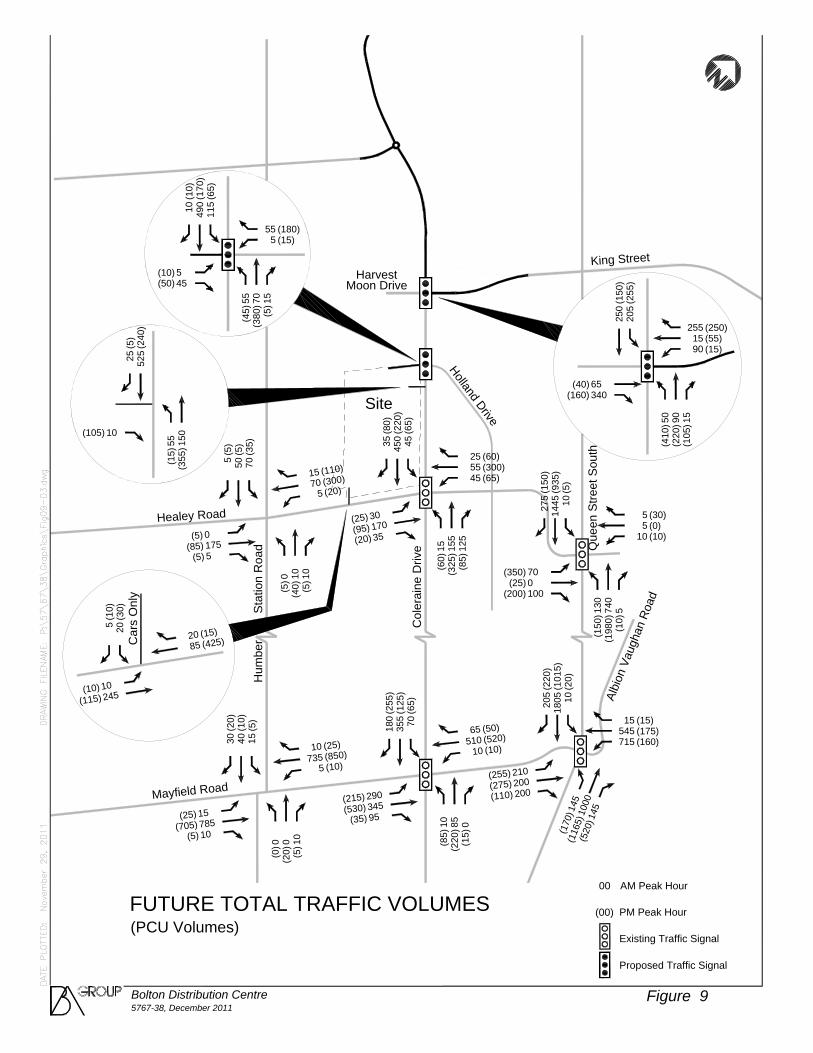
4 . 5 F u t u r e T o t a l T r a f f i c V o l u m e s
The sum of existing, future background growth, forecast future employee site traffic and
tractor trailer / bobtail site traffic constitutes the future total traffic volumes adopted for
analysis herein. Figure 9 illustrates the resultant future total year 2016 traffic volumes.
Albi
on V
augh
an R
oad
Site
King Street
Healey Road
Holland Drive
(5)
5
(15)5(5)0
(35)5
15(5)
40(1
5)10
(10)
(35)
5(3
5)5
(50)
10
5(5)15(10)
10(15)(0)5
15(5
)0(10)10(15)
(25)
10
0(10)
15(5
)5
(0)
(35)
10(1
0)0
(5)
5
(5)
0
20(10)
20(10)
25(1
5)
(5)5
(0)5
Mayfield Road
Hum
ber
Sta
tion
Roa
d
Col
erai
ne D
rive
Que
en S
treet
Sou
th
Moon DriveHarvest
5(5
)
(5)
20
0(5
)
(5)5
5(0)
(10)
30
(45)5(15)20
10(0)10(10)
(30)
20(1
0)5
15(1
5)
(5)
25(1
5)10
10(105)
55(1
5)
(0)5(5)15
[15]
[50]
[95]
[25]
[25]
[75]
[30]
[40][115]
[5][60]
TruckEntrance
TransportationOperationsEntrance
Dis
tribu
tion
Cen
treE
ntra
nce
5(1
0)10
(5)
5(10)
0(5)
EMPLOYEE SITE TRAFFIC VOLUMES(Transportation & Operations Building - PCU Volumes)
Bolton Distribution Centre5767-38, December 2011
Figure 7
00
(00)
[00]
AM Peak Hour
PM Peak Hour
PM Site Peak Hour
Existing Traffic Signal
Proposed Traffic Signal
Albi
on V
augh
an R
oad
Site
King Street
Healey Road
Holland Drive
45(4
0)
(40)
40
25(25)
(25)
25(1
5)15
20(15)
20(15)
(15)15
(25)25
Mayfield Road
Hum
ber
Sta
tion
Roa
d
Col
erai
ne D
rive
Que
en S
treet
Sou
th
Moon DriveHarvest
(10)
10
5(1
0)
45(4
0)
(10)
10
5(10)40(40)
[10]
[10][55]
[65]
TruckEntrance
TRUCK & TRACTOR / BOBTAILSITE TRAFFIC VOLUMES(PCU Volumes)
Bolton Distribution Centre5767-38, December 2011
Figure 8
00
(00)
[00]
AM Peak Hour
PM Peak Hour
PM Site Peak Hour
Existing Traffic Signal
Proposed Traffic Signal
Albi
on V
augh
an R
oad
Site
King Street
Healey Road
Holland Drive
10(4
0)
(5)
50
0(5
) 10(5
)
(35)
70
(5)
5
(300)70(20)5
(110)15
175(85)0(5)
5(5)
(300)55(65)45
(60)2515
5(3
25)15
(60)
125
(85)
(220
)45
0(6
5)45
(80)
35
170(95)30(25)
35(20)(0)5(10)10
(30)5
740
(198
0)13
0(1
50) 5
(10)
(935
)14
45(5
)10
(150
)27
5
0(25)70(350)
100(200)
(175)545(160)715
(15)15
(101
5)18
05(2
0)10
(220
)20
5
200(275)210(255)
200(110)
1000
(116
5)14
5(1
70) 14
5(5
20)
(125
)35
5(6
5)70
(255
)18
0
(10)
40(5
)15
(20)
30
345(530)290(215)
95(35)785(705)15(25)
10(5)
85(2
20)10
(85)
0(1
5)
0(2
0)0
(0) 10
(5)
(850)735(10)5
(25)10(520)510(10)10
(50)65
Mayfield Road
Hum
ber
Sta
tion
Roa
d
Col
erai
ne D
rive Q
ueen
Stre
et S
outh
Moon DriveHarvest
90(2
20)
(150
)25
0
15(1
05)
(255
)20
5
(55)15(15)90
(250)255
340(160)65(40)
50(4
10)
(15)5(180)55
70(3
80) 15
(5)
(170
)49
0(6
5)11
5
Car
s O
nly
(425)85(15)20
245(115)10(10)
(30)
20(1
0)5
150
(355
)
(5)
25(2
40)
525
10(105)
55(1
5)
55(4
5)
5(10)45(50)
(10)
10
FUTURE TOTAL TRAFFIC VOLUMES(PCU Volumes)
Bolton Distribution Centre5767-38, December 2011
Figure 9
00
(00)
AM Peak Hour
PM Peak Hour
Existing Traffic Signal
Proposed Traffic Signal
B o l t o n D i s t r i b u t i o n C e n t r e 29
5 . 0 T r a n s p o r t a t i o n E v a l u a t i o n
5 . 1 B a s i s o f E v a l u a t i o n
Signalized and unsignalized intersection traffic operations analysis has been undertaken using
the Synchro (version 7.0) capacity analysis software in accordance with the Region of Peel’s
Regional Guidelines for Using Synchro – Version 7.73 Rev 8 revised in December 2010.
Capacity analyses were undertaken during the morning and afternoon peak hours under
existing, future background and future total conditions.
Analyses have been undertaken in accordance with the methodologies outlined in the
Highway Capacity Manual (HCM), which provides a ‘level of service’ (LOS) indicator for each
turning movement / approach at the intersection. The LOS provides a measure of the average
delay that a motorist may experience when travelling through an intersection and ranges
from LOS A (little delay) to LOS F (extended delay). A complementary measurement also
provided is a ‘volume-to-capacity’ (V/C) ratio for each movement, which provides a relative
measure of the demand volume to capacity available to process that demand. A V/C ratio of
1.0 reflects ‘at-capacity’ conditions.
Existing signal cycle lengths and timings were provided by the Town of Caledon and the
Region of Peel and were used as a basis for analysis. Beginning with future background traffic
volume scenarios, optimization of signal phasing and timing parameters is adopted.
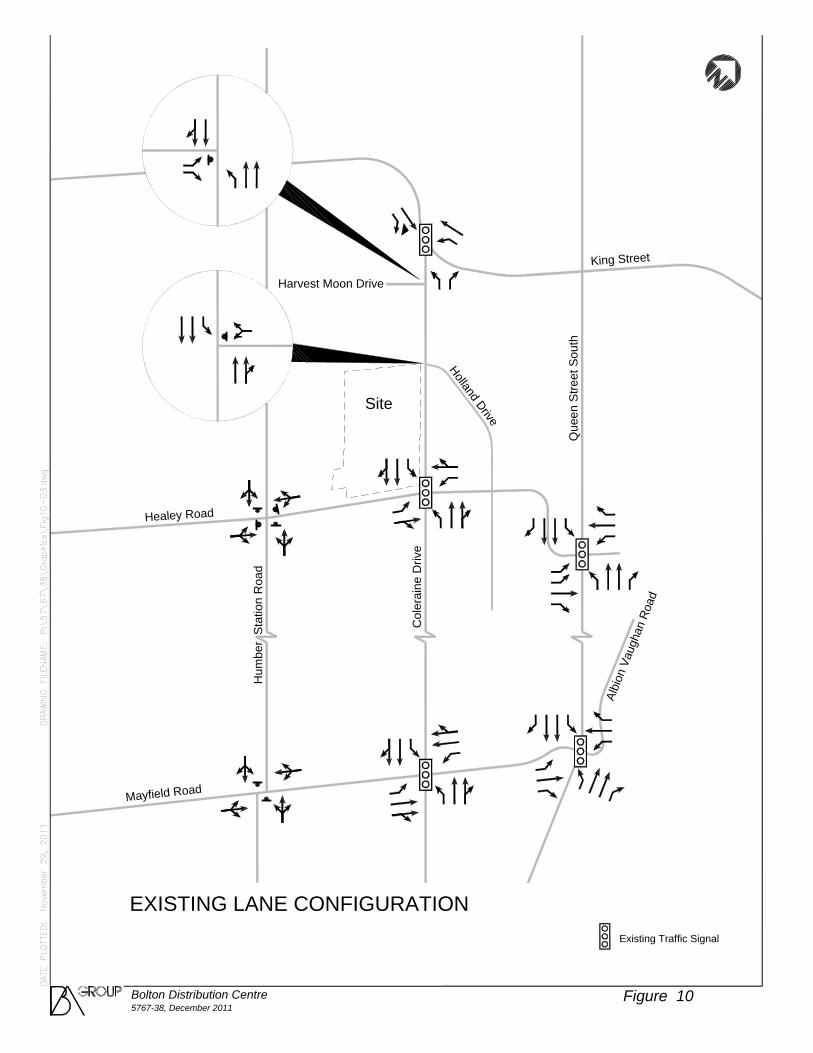
Figure 10 illustrates the existing lane configurations within the study area which have been
used under the existing analysis. Figure 11 illustrates proposed lane configurations based
upon the follow parameters:
King Street West / Coleraine Drive is realigned based upon the extension of the Bolton
Arterial Road (BAR) north of Harvest Moon Drive.
An east approach is added at the intersection of Harvest Moon Drive / new King Street
East.
Capacity constraints at certain intersections under future background traffic
conditions dictate that additional planned improvements be implemented earlier than
projected capital works timings.
One site access driveway is introduced along Healey Road and two site access
driveways are introduced along Coleraine Drive, the northerly one representing the
fourth (west) leg of the Coleraine Drive / Holland Drive intersection.
Proposed lane configurations have been implemented from future background traffic analyses
and carried forward to future total traffic analyses.
Site
Hum
ber
Sta
tion
Roa
d
Col
erai
ne D
rive
Que
en S
treet
Sou
th
Albi
on V
augh
an R
oad
King Street
Healey Road
Mayfield Road
Holland Drive
Harvest Moon Drive
Existing Traffic Signal
EXISTING LANE CONFIGURATION
Bolton Distribution Centre5767-38, December 2011
Figure 10

Site
Hum
ber
Sta
tion
Roa
d
Col
erai
ne D
rive
Que
en S
treet
Sou
th
Albi
on V
augh
an R
oad
King Street
Healey Road
Mayfield Road
Holland Drive
Moon DriveHarvest
Existing
Proposed
Existing Traffic Signal
Proposed Traffic Signal
PLANNED LANE CONFIGURATION
Bolton Distribution Centre5767-38, December 2011
Figure 11
B o l t o n D i s t r i b u t i o n C e n t r e 32
Consistent with the objectives of this report, a full traffic evaluation is conducted during the
weekday morning and afternoon commuter peak hours for year 2016 (5 years hence). As well,
three sensitivity analyses are undertaken as follows:
A Saturday midday analysis at the Highway 50 / Mayfield Road intersection to confirm
governing design hour conditions;
A weekday site peak hour analysis, to confirm site access requirements; and,
Selective additional analyses for an extended 2021 time horizon (10 years hence).
The following sections discuss the results of the operational analyses by key intersections
within the study area. Only individual through movements with a V/C ratio greater than or
equal to 0.85 or turn movements with a V/C ratio greater than or equal to 1.0 have been
highlighted in the following sections. Intersection capacity summary sheets and detailed
intersection capacity analyses worksheets are provided in Appendix C.
5 . 2 S i g n a l i z e d I n t e r s e c t i o n A n a l y s i s
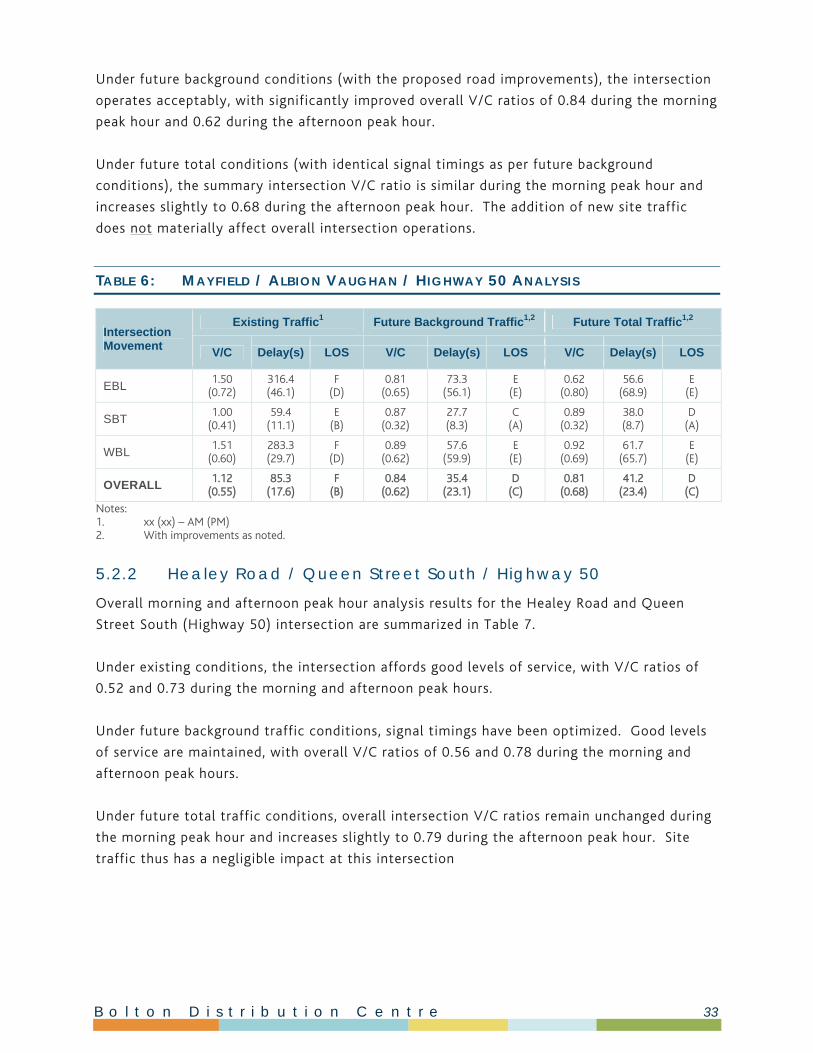
5.2.1 Mayfield Road / Albion Vaughan Road / Highway 50 (2016)
Summary weekday morning and afternoon peak hour analysis results for the Mayfield / Albion
Vaughan / Highway 50 intersection can be found in Table 6.
Under existing conditions, the intersection has a V/C ratio of 1.12 and 0.55 during the
morning and afternoon peak hour, respectively. During the morning peak hour, the eastbound
and westbound left turns operate at a V/C level of 1.50 and 1.51, respectively and the
southbound through volume operates at a V/C of 1.00. In practical terms V/C ratios
exceeding 1.0 cannot occur. These high morning V/C ratios thus reflect at or near capacity
operation, where the traffic saturation flow rates through the intersection exceed typical
criteria.
Under future background traffic conditions, improvements to this intersection are clearly
warranted. Recommended improvements include the addition of dual left turn lanes in both
the eastbound and westbound direction and optimized signal timings. As well, an additional
southbound through lane and a westbound shared through / right lane have been added to
optimize intersection capacity. The dual left turn lanes and additional southbound through
lane are consistent with the proposed widening of Highway 50 south of (through) Mayfield
Road in 2017 from a 4-lane road to a 6-lane road, as per York Region and Peel Region’s 10-
year road construction plan. The addition of a westbound shared through / right lane is
consistent with the Region’s proposed widening of Mayfield Road in 2019 from a 2-lane road
to a 4-lane road. This latter improvement might also be incorporated with the Region’s
earlier north-south Highway 50 widening.
B o l t o n D i s t r i b u t i o n C e n t r e 33
Under future background conditions (with the proposed road improvements), the intersection
operates acceptably, with significantly improved overall V/C ratios of 0.84 during the morning
peak hour and 0.62 during the afternoon peak hour.
Under future total conditions (with identical signal timings as per future background
conditions), the summary intersection V/C ratio is similar during the morning peak hour and
increases slightly to 0.68 during the afternoon peak hour. The addition of new site traffic
does not materially affect overall intersection operations.
TABLE 6: MAYFIELD / ALBION VAUGHAN / HIGHWAY 50 ANALYSIS
Intersection Movement
Existing Traffic1 Future Background Traffic1,2 Future Total Traffic1,2
V/C Delay(s) LOS V/C Delay(s) LOS V/C Delay(s) LOS
EBL 1.50
(0.72) 316.4 (46.1)
F (D)
0.81 (0.65)
73.3 (56.1)
E (E)
0.62 (0.80)
56.6 (68.9)
E (E)
SBT 1.00 (0.41)
59.4 (11.1)
E (B)
0.87 (0.32)
27.7 (8.3)
C (A)
0.89 (0.32)
38.0 (8.7)
D (A)
WBL 1.51 (0.60)
283.3 (29.7)
F (D)
0.89 (0.62)
57.6 (59.9)
E (E)
0.92 (0.69)
61.7 (65.7)
E (E)
OVERALL 1.12
(0.55) 85.3
(17.6) F
(B) 0.84
(0.62) 35.4
(23.1) D
(C) 0.81
(0.68) 41.2
(23.4) D
(C)
Notes: 1. xx (xx) – AM (PM) 2. With improvements as noted.
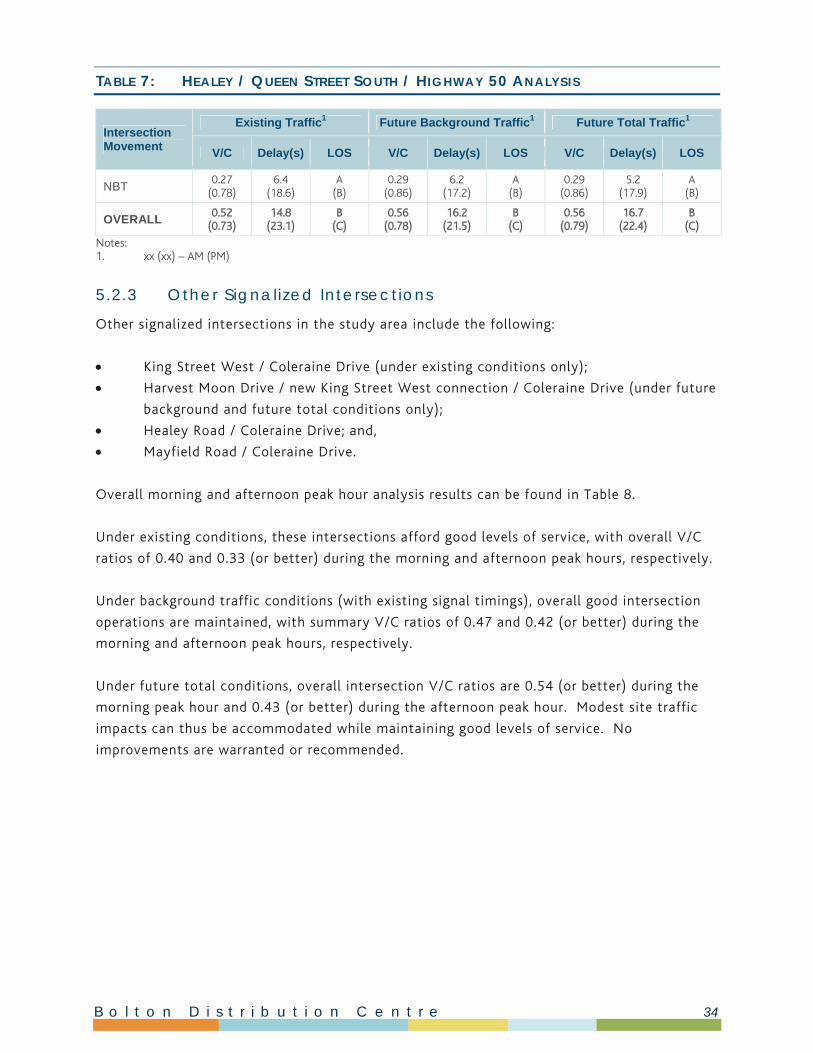
5.2.2 Healey Road / Queen Street South / Highway 50
Overall morning and afternoon peak hour analysis results for the Healey Road and Queen
Street South (Highway 50) intersection are summarized in Table 7.
Under existing conditions, the intersection affords good levels of service, with V/C ratios of
0.52 and 0.73 during the morning and afternoon peak hours.
Under future background traffic conditions, signal timings have been optimized. Good levels
of service are maintained, with overall V/C ratios of 0.56 and 0.78 during the morning and
afternoon peak hours.
Under future total traffic conditions, overall intersection V/C ratios remain unchanged during
the morning peak hour and increases slightly to 0.79 during the afternoon peak hour. Site
traffic thus has a negligible impact at this intersection
B o l t o n D i s t r i b u t i o n C e n t r e 34
TABLE 7: HEALEY / QUEEN STREET SOUTH / HIGHWAY 50 ANALYSIS
Intersection Movement
Existing Traffic1 Future Background Traffic1 Future Total Traffic1
V/C Delay(s) LOS V/C Delay(s) LOS V/C Delay(s) LOS
NBT 0.27
(0.78) 6.4
(18.6) A
(B) 0.29
(0.86) 6.2
(17.2) A
(B) 0.29
(0.86) 5.2
(17.9) A
(B)
OVERALL 0.52
(0.73) 14.8
(23.1) B
(C) 0.56
(0.78) 16.2
(21.5) B
(C) 0.56
(0.79) 16.7
(22.4) B
(C)
Notes: 1. xx (xx) – AM (PM)
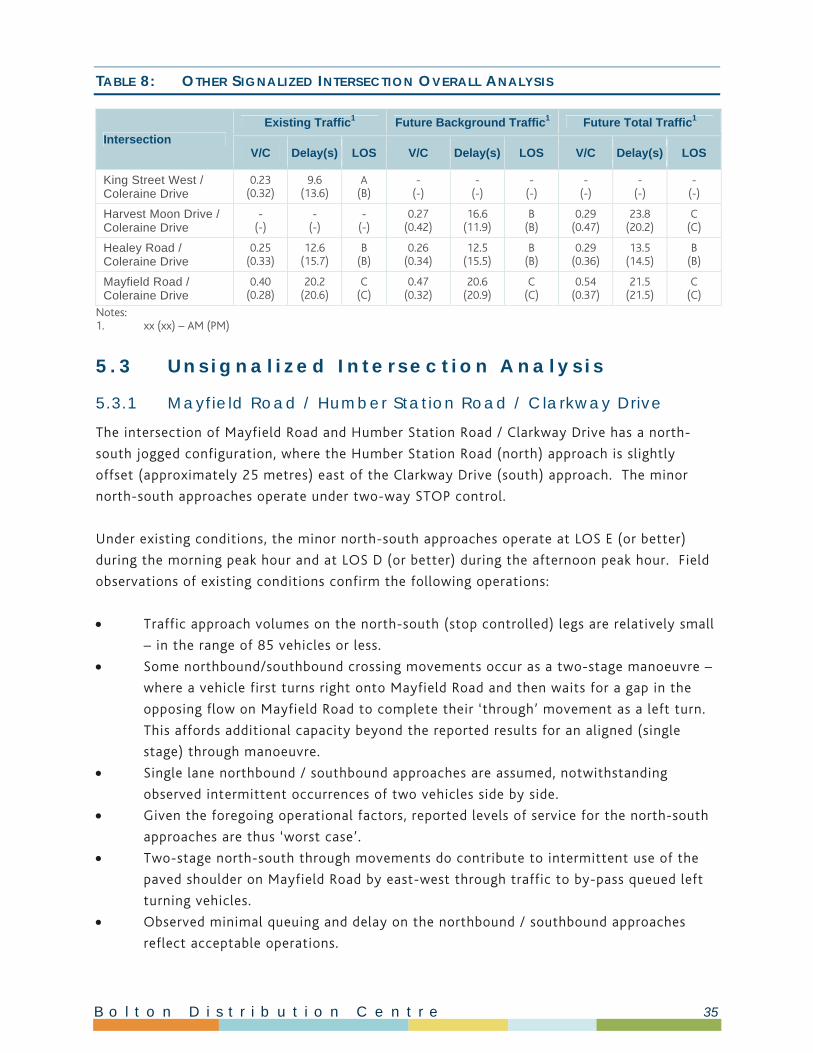
5.2.3 Other Signalized Intersections
Other signalized intersections in the study area include the following:
King Street West / Coleraine Drive (under existing conditions only);
Harvest Moon Drive / new King Street West connection / Coleraine Drive (under future
background and future total conditions only);
Healey Road / Coleraine Drive; and,
Mayfield Road / Coleraine Drive.
Overall morning and afternoon peak hour analysis results can be found in Table 8.
Under existing conditions, these intersections afford good levels of service, with overall V/C
ratios of 0.40 and 0.33 (or better) during the morning and afternoon peak hours, respectively.
Under background traffic conditions (with existing signal timings), overall good intersection
operations are maintained, with summary V/C ratios of 0.47 and 0.42 (or better) during the
morning and afternoon peak hours, respectively.
Under future total conditions, overall intersection V/C ratios are 0.54 (or better) during the
morning peak hour and 0.43 (or better) during the afternoon peak hour. Modest site traffic
impacts can thus be accommodated while maintaining good levels of service. No
improvements are warranted or recommended.
B o l t o n D i s t r i b u t i o n C e n t r e 35
TABLE 8: OTHER SIGNALIZED INTERSECTION OVERALL ANALYSIS
Intersection
Existing Traffic1 Future Background Traffic1 Future Total Traffic1
V/C Delay(s) LOS V/C Delay(s) LOS V/C Delay(s) LOS
King Street West / Coleraine Drive
0.23 (0.32)
9.6 (13.6)
A (B)
- (-)
- (-)
- (-)
- (-)
- (-)
- (-)
Harvest Moon Drive / Coleraine Drive
- (-)
- (-)
- (-)
0.27 (0.42)
16.6 (11.9)
B (B)
0.29 (0.47)
23.8 (20.2)
C (C)
Healey Road / Coleraine Drive
0.25 (0.33)
12.6 (15.7)
B (B)
0.26 (0.34)
12.5 (15.5)
B (B)
0.29 (0.36)
13.5 (14.5)
B (B)
Mayfield Road / Coleraine Drive
0.40 (0.28)
20.2 (20.6)
C (C)
0.47 (0.32)
20.6 (20.9)
C (C)
0.54 (0.37)
21.5 (21.5)
C (C)
Notes: 1. xx (xx) – AM (PM)
5 . 3 U n s i g n a l i z e d I n t e r s e c t i o n A n a l y s i s
5.3.1 Mayfield Road / Humber Station Road / Clarkway Drive
The intersection of Mayfield Road and Humber Station Road / Clarkway Drive has a north-
south jogged configuration, where the Humber Station Road (north) approach is slightly
offset (approximately 25 metres) east of the Clarkway Drive (south) approach. The minor
north-south approaches operate under two-way STOP control.
Under existing conditions, the minor north-south approaches operate at LOS E (or better)
during the morning peak hour and at LOS D (or better) during the afternoon peak hour. Field
observations of existing conditions confirm the following operations:
Traffic approach volumes on the north-south (stop controlled) legs are relatively small
– in the range of 85 vehicles or less.
Some northbound/southbound crossing movements occur as a two-stage manoeuvre –
where a vehicle first turns right onto Mayfield Road and then waits for a gap in the
opposing flow on Mayfield Road to complete their ‘through’ movement as a left turn.
This affords additional capacity beyond the reported results for an aligned (single
stage) through manoeuvre.
Single lane northbound / southbound approaches are assumed, notwithstanding
observed intermittent occurrences of two vehicles side by side.
Given the foregoing operational factors, reported levels of service for the north-south
approaches are thus ‘worst case’.
Two-stage north-south through movements do contribute to intermittent use of the
paved shoulder on Mayfield Road by east-west through traffic to by-pass queued left
turning vehicles.
Observed minimal queuing and delay on the northbound / southbound approaches
reflect acceptable operations.
B o l t o n D i s t r i b u t i o n C e n t r e 36
With the addition of background traffic, the southbound approach operates at a level of
service (LOS) F, with a reported delay of 57 seconds and a V/C ratio of 0.57. During the
afternoon peak hour, the northbound approach operates at LOS E with a delay of 43 seconds
and a V/C ratio of 0.21.
Under future total traffic conditions, during the morning peak hour the southbound approach
continues to operate at LOS F with a delay of 66 seconds and a V/C ratio of 0.62. During the
afternoon peak hour, the northbound approach continues to operate at LOS E with a delay of
46 seconds and a V/C of 0.22.
Under future conditions, the minor (north-south) approaches at this intersection will have
sufficient capacity. They will continue to operate acceptably, albeit with increasing delays,
due mostly to increasing through traffic along Mayfield Road. No improvements are
warranted or recommended based on the addition of site traffic.
5.3.2 Other Unsignalized Intersections
Other unsignalized intersections in the study area include the following:
Harvest Moon Drive / Coleraine Drive (existing conditions only)
Healey Road / Humber Station Road
Under existing conditions, minor (Stop-controlled) approaches at these intersections operate
at LOS B (or better) during the morning peak hour and at LOS D (or better) during the
afternoon peak hour. With the addition of background traffic and new site traffic, these
intersections continue to operate acceptably at LOS D (or better).
5 . 4 S i t e A c c e s s A n a l y s i s
Three site access points have been evaluated as follows:
addition of a west leg to the signalized intersection of Holland Drive / Coleraine Drive
for trucks only (no east / west through movements allowed)
a driveway onto Coleraine Drive located approximately 180 metres south of the
intersection of Holland Drive / Coleraine Drive for Transportation Operations Facility
staff and visitors
a driveway onto Healey Road located approximately 565 metres west of the
intersection of Healey Road / Coleraine Drive for the Distribution Centre staff and
visitors
B o l t o n D i s t r i b u t i o n C e n t r e 37
Truck Access (at Coleraine / Holland intersection)
Trucking activities are to take place at the intersection of Holland Drive and Coleraine Drive.
Under existing conditions, this intersection is a ‘T’-intersection which is STOP-controlled.
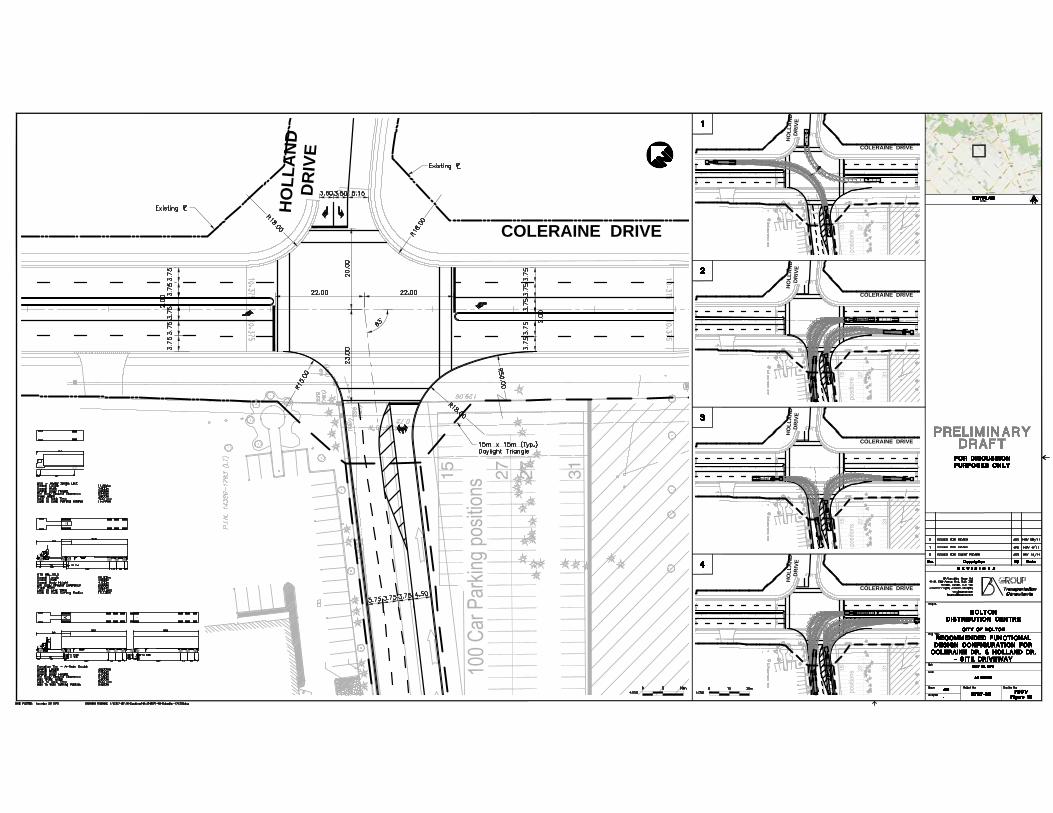
Figure 12 illustrates a recommend functional design configuration for adding the site truck
driveway as the west approach to the Coleraine / Holland intersection. Key design elements
are described as follows:
The site access driveway is (necessarily) slightly offset from Holland Drive.
Given the slight east-west offset and prevailing truck restrictions on Holland Drive,
east-west through movements can effectively be restricted.
A single wide egress lane will suffice. Sufficient width is provided to develop multiple
inbound queuing lanes and accommodate turning paths for the largest (future
potential) A-train commercial vehicles.
The (recently) widened Holland Drive approach is striped to accommodate two
westbound approach lanes and a wide single receiving lane.
Provide a northbound left turn lane queue storage length of at least 60 metres to
accommodate two semi-trailer vehicles.
Provide a (typical) daylight easement at the intersection on the west approach to
support future signalization.
Analysis of this intersection indicates that it could operate acceptably under side street
STOP-control. Although signal warrants are not met by the near-term traffic forecasts set
out herein, it is recommended that consideration be given to signalization of this intersection.
Key benefits would include: (1) enhanced accessibility for existing Holland Drive businesses,
(2) reduced conflicts between slower-moving (Canadian Tire Corporation) large trucks and
through traffic along Coleraine Drive, and (3) reduced conflicts between eastbound /
westbound left turns by signalized control as separate east / west sub-phases7.
7 Detection loops in the site driveway would limit the extent and duration of the eastbound (site egress) phase.
HO
LLA
ND
DR
IVE
COLERAINE DRIVE
HO
LLA
ND
DR
IVE
COLERAINE DRIVE
HO
LLA
ND
DR
IVE
COLERAINE DRIVE
HO
LLA
ND
DR
IVE
COLERAINE DRIVE
HO
LLA
ND
DR
IVE
COLERAINE DRIVE

B o l t o n D i s t r i b u t i o n C e n t r e 39
Transportation Operations Facility Access (Coleraine Drive)
As the transportation operations facility operates separately from the distribution centre, a
separate parking area has been provided for staff and visitors of this building. It is proposed
that an access be provided onto Coleraine Drive approximately 180 metres south of the
Holland Drive / Coleraine Drive intersection. This intersection affords sufficient spacing from
Holland Drive to the north to meet Peel Region criteria for a partial movement driveway. The
closest existing driveway to the south (on the east side of Coleraine Drive) is located
approximately 300 metres further south, thus not prejudicing future all movements access at
this location. Future operations were thus evaluated as a three-movement driveway, with
(eastbound) left turn egress movements restricted.
An existing Town of Caledon by-law seeks to limit introduction of new (private) driveways
onto Coleraine Drive in order to protect its through arterial road function. The proposed
driveway is considered to be appropriate due to the following considerations:
The consolidated DC site has an extensive frontage on Coleraine Drive – more than
1050 metres
As part of the application, six (6) existing driveways onto Coleraine Drive will be
closed.
The proposed driveway location will fully meet Peel Region access guidelines and pose
no operational conflicts with other existing driveways.
Security and operational issues related to the main truck entrance opposite Holland
Drive dictate provision of a separate access for Transportation Operations Facility
employees and visitors.
The volume of traffic will be modest and limited by the size of the parking lot.
The partial movement configuration (restricted left run egress) will ensure
maintenance of good levels of service under unsignalized operation.
Supportive channelization will be implemented as part of the Site Plan Approval
process to restrict the left turn egress movement.
As noted in Appendix C, this driveway will operate well under STOP-control, at LOS B during
the busiest afternoon peak hour. A single approach lane will suffice given the restricted right
turn egress orientation to the south.
This driveway provides access to approximately 208 parking spaces for staff and visitors for
this building. Using the MTO left turn warrant criteria (as found in Appendix D), it was
determined that a left turn lane is required to accommodate inbound traffic, especially during
the morning peak hour when the majority of the traffic volumes are heading into the site. A
nominal minimum left turn storage dimension of 30 metres is recommended. This will require
a minor widening of Coleraine Drive.
B o l t o n D i s t r i b u t i o n C e n t r e 40
Distribution Centre Access (Healey Road)
In order to accommodate the Distribution Centre staff and visitors, a separate parking area
consisting of approximately 632 spaces is provided on the south side of the site; i.e. near the
northwest corner of the Healey Road / Coleraine Drive intersection. The entrance of the
parking area is located approximately 565 metres west of the Healey Road / Coleraine Drive
intersection. This intersection is well spaced from Coleraine Drive and acceptable driver
sightlines are available looking to the east and west along Healey Road. Using the MTO left turn warrant criteria (as found in Appendix D), it was determined that a
left turn lane is not required to be provided on Healey Road.
5 . 5 S e n s i t i v i t y A n a l y s e s
Three sensitivity analyses have been undertaken as follows:
A Saturday midday analysis was completed at the key Mayfield /Highway 50
intersection to confirm design day requirements.
Site peak hour traffic generation is not all concurrent with street peak hour volumes.
For example, distribution centre employees work on two shifts – 5:45 am to 3:45 pm
and 3:45 pm to 1:45 am. Where significant differences were noted, site access
driveways were re-evaluated under peak site traffic flows.
Partial supplemental analyses were prepared for a 2021 horizon year; i.e. after the
proposed DC has been open for 10 years based on additional corridor growth
allowances.
5.5.1 Saturday Midday Analysis
Existing Saturday midday volumes were counted on Saturday, March 26, 2011 and compared
with the weekday morning and afternoon peak hour traffic volumes. Along Highway 50,
Saturday volumes are approximately one-third to one half less than weekday volumes. This
pattern is similarly reflected along Mayfield Road / Albion Vaughan Road.
Saturday analysis of the intersection of Highway 50 and Mayfield Road / Albion Vaughan
Road is provided in Appendix E. The results confirm that Saturday midday traffic operations
are significantly improved compared to the busiest weekday conditions. As a result, no
further analysis of traffic operations during Saturday midday conditions was undertaken since
this design hour clearly does not govern.

B o l t o n D i s t r i b u t i o n C e n t r e 41
5.5.2 Site Peak Hour Analysis
The majority of staff at the Transportation Operations Facility work between 8:00 am and
5:00 pm. These travel patterns generally coincide with both the morning and afternoon street
peak hours, hence no supplemental evaluation is required.
However Distribution Centre staff shifts occur at 5:45 am to 3:45 pm and 3:45 pm to 1:45
am. This was confirmed in the base traffic counts conducted at the existing Brampton DC
facility. For example, peak afternoon site traffic volumes occurred between 3:00pm to
4:00pm, when there is an overlap in shift changes.
In order to better understand the impacts of the afternoon site peak hour volumes, analysis
was undertaken at the Distribution Centre (Healey) site driveway with site peak volumes
entering / exiting the site and with background traffic volumes along Healey Road estimated
at 80 percent of street peak volumes. Analysis of this site driveway under peak afternoon site
traffic conditions confirms that it will continue to function at LOS C or better (see Appendix
E).
The need for introduction of an exclusive eastbound left turn lane on Healey Road was further
reviewed based on afternoon site peak hour traffic flows. The MTO left turn warrant criteria
confirmed that a left turn lane on Healey Road is still not warranted (see Appendix D).
5.5.3 2021 Horizon Year
A sensitivity analysis was undertaken to assess the need for any supplemental road
improvements along the Mayfield Road corridor based on an extended 10 year time horizon
(2021). Intersection analyses were undertaken at the key Coleraine Drive / Mayfield Road
and Highway 50 / Mayfield Road / Albion Vaughan Road intersections. Additional background
corridor traffic growth was applied consistent with the procedures noted herein. Resultant
future total traffic volumes and analysis results are provided in Appendix E.
Key findings for the 2021 time horizon are summarized as follows:
The Highway 50 / Mayfield Road / Albion Vaughan Road intersection continues to
operate acceptably, with overall V/C ratios of 0.86 during the morning peak hour and
0.66 during the afternoon peak hour.
The Coleraine Drive / Mayfield Road intersections continue to operate well, with
overall V/C ratios of 0.63 during the morning peak hour and 0.44 during the afternoon
peak hour.
No further improvements are warranted or recommended based on the foregoing year 2021
analyses.
B o l t o n D i s t r i b u t i o n C e n t r e 42
6 . 0 S i t e P a r k i n g R e v i e w The Distribution Centre parking is to be provided on the southern portion of the lot, with its
access on Healey Road located approximately 565 metres west of Coleraine Drive. It is
proposed that a total of approximately 632 parking spaces will be provided within this parking
lot. Based upon the existing parking demand at the Brampton Distribution Centre (2111
Steeles Avenue) and forecast employees, this supply is appropriate and will provide enough
parking for both employees and visitors.
The Transportation Operations parking is to be accessed from Coleraine Drive, approximately
180 metres south of the intersection of Coleraine Drive and Holland Drive. Based upon the
current plan, approximately 208 parking spaces are to be provided. However, based upon
existing counts at the Brampton Distribution Centre, and the growth in employees in the
future, it is suggested that 375 parking spaces be supplied in order to better accommodate
the growth in employees.
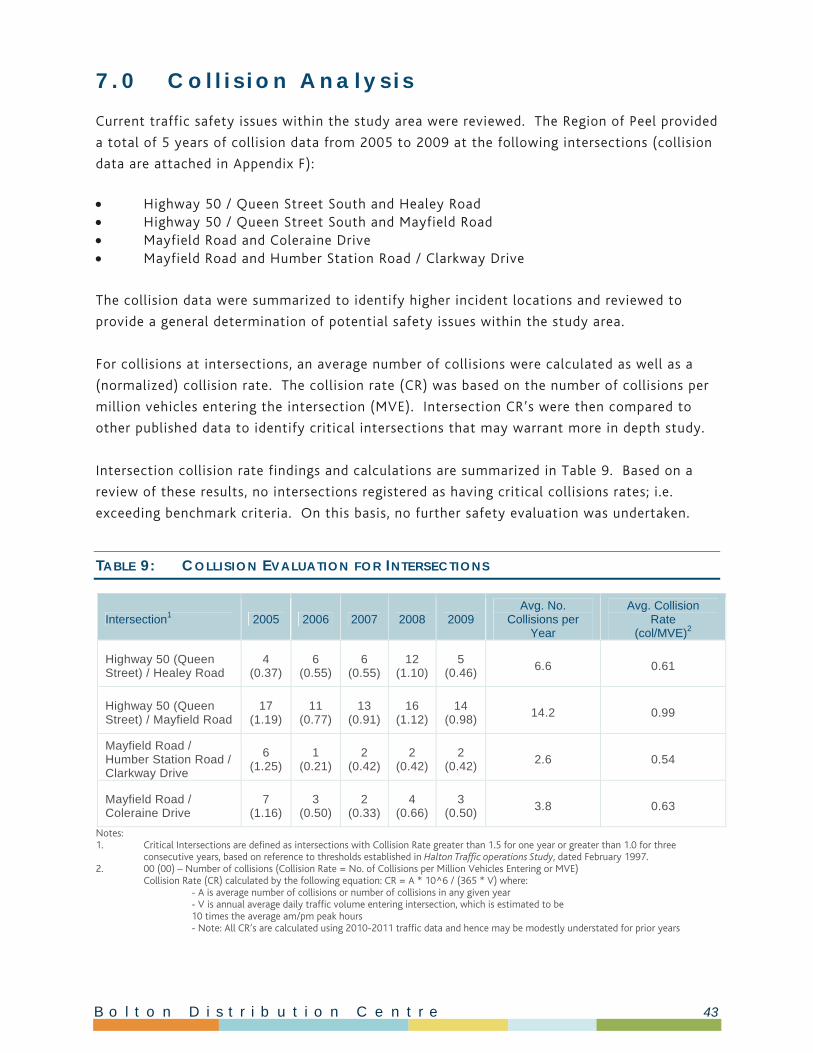
B o l t o n D i s t r i b u t i o n C e n t r e 43
7 . 0 C o l l i s i o n A n a l y s i s Current traffic safety issues within the study area were reviewed. The Region of Peel provided
a total of 5 years of collision data from 2005 to 2009 at the following intersections (collision
data are attached in Appendix F):
Highway 50 / Queen Street South and Healey Road Highway 50 / Queen Street South and Mayfield Road Mayfield Road and Coleraine Drive Mayfield Road and Humber Station Road / Clarkway Drive
The collision data were summarized to identify higher incident locations and reviewed to
provide a general determination of potential safety issues within the study area.
For collisions at intersections, an average number of collisions were calculated as well as a
(normalized) collision rate. The collision rate (CR) was based on the number of collisions per
million vehicles entering the intersection (MVE). Intersection CR’s were then compared to
other published data to identify critical intersections that may warrant more in depth study.
Intersection collision rate findings and calculations are summarized in Table 9. Based on a
review of these results, no intersections registered as having critical collisions rates; i.e.
exceeding benchmark criteria. On this basis, no further safety evaluation was undertaken.
TABLE 9: COLLISION EVALUATION FOR INTERSECTIONS
Intersection1 2005 2006 2007 2008 2009 Avg. No.
Collisions per Year
Avg. Collision Rate
(col/MVE)2
Highway 50 (Queen Street) / Healey Road
4 (0.37)
6 (0.55)
6 (0.55)
12 (1.10)
5 (0.46)
6.6 0.61
Highway 50 (Queen Street) / Mayfield Road
17 (1.19)
11 (0.77)
13 (0.91)
16 (1.12)
14 (0.98)
14.2 0.99
Mayfield Road / Humber Station Road / Clarkway Drive
6 (1.25)
1 (0.21)
2 (0.42)
2 (0.42)
2 (0.42)
2.6 0.54
Mayfield Road / Coleraine Drive
7 (1.16)
3 (0.50)
2 (0.33)
4 (0.66)
3 (0.50)
3.8 0.63
Notes: 1. Critical Intersections are defined as intersections with Collision Rate greater than 1.5 for one year or greater than 1.0 for three
consecutive years, based on reference to thresholds established in Halton Traffic operations Study, dated February 1997. 2. 00 (00) – Number of collisions (Collision Rate = No. of Collisions per Million Vehicles Entering or MVE) Collision Rate (CR) calculated by the following equation: CR = A * 10^6 / (365 * V) where: - A is average number of collisions or number of collisions in any given year - V is annual average daily traffic volume entering intersection, which is estimated to be 10 times the average am/pm peak hours
- Note: All CR’s are calculated using 2010-2011 traffic data and hence may be modestly understated for prior years
B o l t o n D i s t r i b u t i o n C e n t r e 44
8 . 0 S u m m a r y a n d C o n c l u s i o n s BA Group has been retained by Canadian Real Estate Limited (CTREL) to prepare a
Transportation Impact Study in support of a proposed distribution centre (DC) to be located
in the Town of Caledon. The new DC will be located on the west side of Coleraine Drive,
between Healey Road and Holland Drive. It will replace an existing Brampton facility located
southeast of the Bramalea Road / Steeles Avenue intersection.
The proposed DC comprises a total building area of approximately 141,534 square metres
(1.523 million square feet) on the approximate 73.1 hectare (181 acre) site. A total of 273
loading dock positions are provided. There is also the potential to accommodate up to 1,718
tractor trailer storage positions with 500 chassi positions and 1,616 containers (stacked 3 to
5 high).
Vehicular access is proposed as follows:
A separate truck access is proposed at the north end of the site, opposite the Holland
Drive intersection on Coleraine Drive.
A separate approximate 632-space lot is provided for distribution centre staff and
visitors, located at the south site limit. Access to the distribution centre parking lot is
proposed via a driveway onto Healey Road located approximately 565 metres west of
Coleraine Drive.
A separate approximate 208-space lot is provided for transportation operations
employees and visitors near the northeast site limit. Access to the transportation
operation lot is proposed via a driveway onto Coleraine Drive located approximately
180 metres south of Holland Drive.
A separate approximate 200-space lot is provided for truck cab parking as well as cab /
vendor drivers only and is located on the northern limit of the site. Access to this
parking lot is proposed via the proposed signalized intersection at Holland Drive /
Coleraine Drive.
The Town of Caledon recently completed a major transportation planning study in support of
a south-westerly expansion of the Bolton urban area to accommodate additional employment
uses (the “Paradigm Traffic Study”). The subject site is entirely included within the expansion
area. It occupies the entire block between Holland Drive and Healey Road and thus
represents a significant approximate 30 percent proportion of the newly designated
employment lands.

B o l t o n D i s t r i b u t i o n C e n t r e 45
The Town of Caledon is currently preparing a Transportation Master Plan Study (the “TMP
Study”) to further detail the road requirements to support its urban boundary expansion. An
integral component of the Town’s ongoing TMP Study will be to prepare updated long range
(likely year 2031) traffic forecasts. The scope of this report is focussed on specific
transportation issues related to introduction of the proposed distribution centre. The detailed
site-specific traffic forecasts and findings provided in this study can thus provide useful
inputs to the TMP Study.
Key transportation findings are summarized as follows:
1. Key design hours for evaluation of the area road network are the weekday morning and
afternoon street peak hours. A Saturday midday analysis was completed at the key
Mayfield /Highway 50 intersection to confirm that Saturday midday traffic operations
are significantly improved and hence do not reflect governing conditions.
2. Given the earlier shift change times of the Distribution Centre employees site
driveway operations are also reviewed for an afternoon site peak hour; i.e. 3:00 to
4:00pm. These higher afternoon site peak hour volumes clearly reflect governing two-
way traffic flow conditions for Distribution Facility staff.
3. The primary horizon year for road network evaluation was 2016, reflecting opening
day conditions. To assess the need for any supplemental road improvements along the
key Mayfield Road corridor, a sensitivity analysis was undertaken based on an
extended 10 year time horizon (2021).
4. To serve the new employment lands in southwest Bolton, the Paradigm Traffic Study
conceptually illustrates a new North-South Collector Road, extending between Holland
Drive (extended) and Mayfield Road. This new road would generally be aligned along
the westerly limits of the new employment lands, including the subject site. This study
makes no allowance for the segment of the North-South Collector north of Healey
Road due to the following factors:
(i) The subject site occupies virtually the entire block of (future) designated
employment lands. Satisfactory vehicular site access can be provided from
existing streets and without requiring multiple access to Coleraine Drive.
(ii) No further extensions north of (extended) Holland Road are contemplated.
(iii) There is apparent very limited development potential for the lands west of the
site; i.e. over to Humber Station Road; due to the presence of significant
woodlots and other environmental features. This limits the potential need for
future access to such lands from this N-S Collector segment.
B o l t o n D i s t r i b u t i o n C e n t r e 46
5. To serve the new employment lands in southwest Bolton, the Paradigm Traffic Study
conceptually illustrates a westerly extension of Holland Drive, from its present
terminus at Coleraine Drive, across the north limit of the subject site and connecting
to the North-South Collector (and potentially over to Humber Station Road). This
study makes no allowance for the westerly extension of Holland Drive due to the
following factors:
(i) Without a connection to the North-South Collector, there is limited network
continuity benefit.
(ii) At Coleraine Drive, Holland Drive is slightly offset from the north property
limit of the subject site. Satisfactory east-west alignment of a pubic road
would likely require property acquisition from multiple landowners.
(iii) There is apparent very limited development potential for the lands west of the
site; i.e. over to Humber Station Road; due to the presence of significant
woodlots and other environmental features. This limits the potential benefits
of any further westerly extension.
6. Total street peak hour two-way traffic flows (expressed as passenger car equivalents)
generated by the proposed DC range from 245 to 285 vehicle trips. These traffic
volumes are very modest due to the following factors: (1) low overall employee
density, (2) well distributed and early shift times for certain staff, and (3) balanced
truck movements throughout the day. By way of comparison, these site traffic flows
are less than one third of the traffic that could be generated by other typical
warehouse or light industrial land uses, as per ITE 8th edition trip generation rates.
7. Under existing conditions, the Mayfield / Highway 50 signalized intersection operates
at or near capacity during the governing morning peak hour. Future background traffic
conditions five years hence dictate the need for improvements to this intersection.
Recommended improvements for the background traffic conditions include the
following:
(i) Add dual left turn lanes in both the eastbound and westbound direction.
(ii) Optimize signal timings.
(iii) Add an additional southbound through lane and a westbound shared through /
right lane.
These improvements are consistent with the planned Peel Region improvements for
widening Highway 50 and Mayfield Road in the 2017 to 2019 time horizon. The
addition of new site traffic does not materially affect overall intersection operations at
this intersection.
B o l t o n D i s t r i b u t i o n C e n t r e 47
8. Acceptable traffic operations are maintained at all other study area intersections
under forecast 2016 traffic conditions. No improvements are warranted or
recommended.
9. Supplemental intersection analyses were undertaken at the key Coleraine Drive /
Mayfield Road and Highway 50 / Mayfield Road / Albion Vaughan Road intersections
for a ten year time horizon (2021). Other than those identified under the 2016 time
horizon, no further improvements are warranted or recommended.
10. A functional plan has been prepared for the site truck driveway on Coleraine Drive
opposite Holland Drive. Key design features are summarized as follows:
(i) Given the slight east-west offset and prevailing truck restrictions on Holland
Drive, east-west through movements can effectively be restricted.
(ii) A single wide egress lane plus multiple inbound queuing lanes can well
accommodate turning paths for the largest (future potential) LCV commercial
vehicles.
(iii) Provide a northbound left turn lane queue storage length of at least 60 metres
to accommodate two semi-trailer vehicles.
(iv) Provide a (typical) daylight easement at the intersection on the west approach
to support future signalization.
11. While the Coleraine Drive / Holland Drive – site driveway could operate acceptably
under side street STOP-control, it is recommended that consideration be given to
signalization of this intersection. Key benefits would include:
(i) Enhanced accessibility for existing Holland Drive businesses.
(ii) Reduced conflicts between slower-moving (Canadian Tire Corporation) large
trucks and through traffic along Coleraine Drive.
(iii) Reduced conflicts between eastbound / westbound left turns by signalized
control as separate east / west sub-phases.
12. The proposed Transportation Operations employee / visitor driveway onto Coleraine
Drive is located approximately 180 metres south of Holland Drive and approximately
300 metres north of the closest existing driveway on Coleraine Drive (east side). This
location fully meets Peel Region access guidelines for a partial movement driveway
(eastbound left turn egress restricted) and poses no operational conflicts with other
existing driveways. This driveway will effectively ‘replace’ six (6) existing driveways
onto Coleraine Drive that will be closed. Appropriate channelization will be
implemented to restrict the left-out movement.
B o l t o n D i s t r i b u t i o n C e n t r e 48
This driveway will operate well under STOP-control with a single lane approach. A
minor widening of Coleraine Drive is recommended in order to introduce a northbound
exclusive left turn lane with a nominal storage dimension of 30 metres.
13. The Distribution Centre employee / visitor driveway on Healey Road is well spaced
from Coleraine Drive and acceptable driver sightlines are available looking to the east
and west along Healey Road. Based on MTO left turn warrant criteria, introduction of
an exclusive eastbound left turn lane is not warranted on Healey Road.
14. Current traffic safety issues within the study area were reviewed based on 5 years of
collision data provided by Peel Region. Collision rates (CR’s) based on the number of
collisions per million vehicles entering the intersection (MVE) were calculated and
compared to other published data. No intersections registered as having critical
collisions rates; i.e. exceeding benchmark criteria. On this basis, no further safety
evaluation was undertaken.
Based on the findings of this report, the proposed Canadian Tire Distribution Centre
development can be reasonably accommodated on the study area road network.
P r o j e c t B o l t o n
APPENDIX A: Supplemental F igures

Bolton Distribution Centre5767-38 December 2011
Appendix Figure A1
RemnantParcel
Site
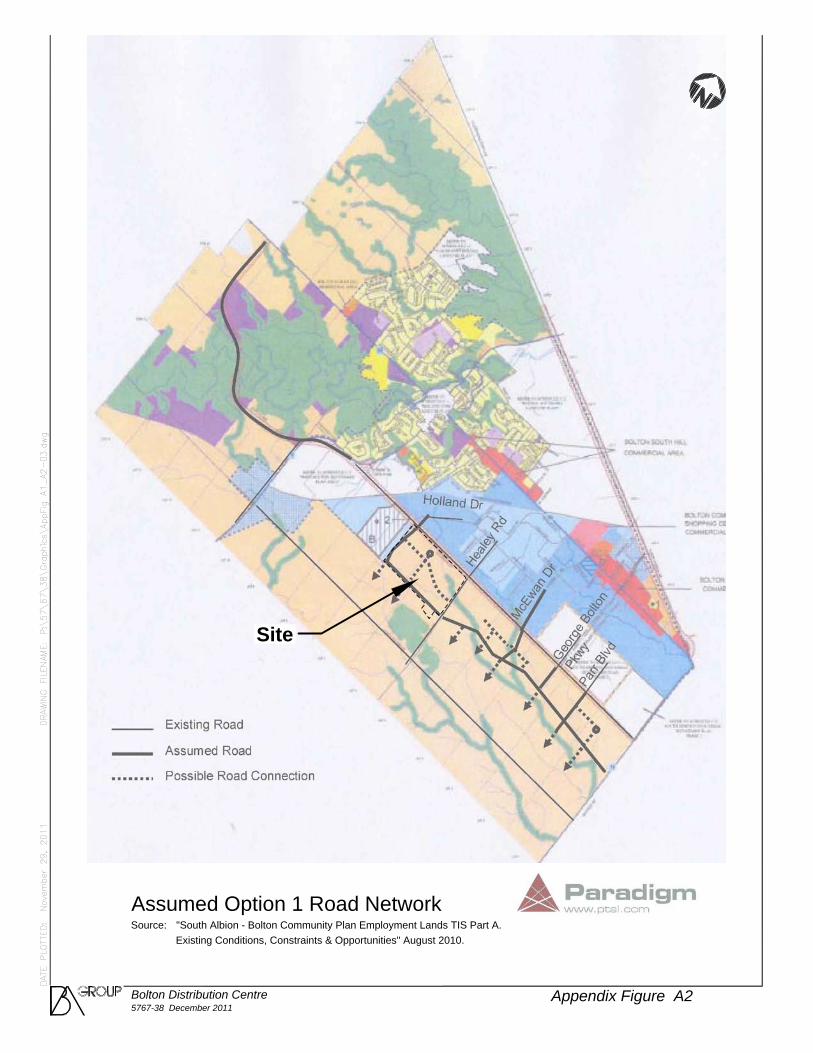
Bolton Distribution Centre5767-38 December 2011
Appendix Figure A2
Assumed Option 1 Road NetworkSource: "South Albion - Bolton Community Plan Employment Lands TIS Part A.
Existing Conditions, Constraints & Opportunities" August 2010.
Site

P r o j e c t B o l t o n
APPENDIX B: Histor ical Growth
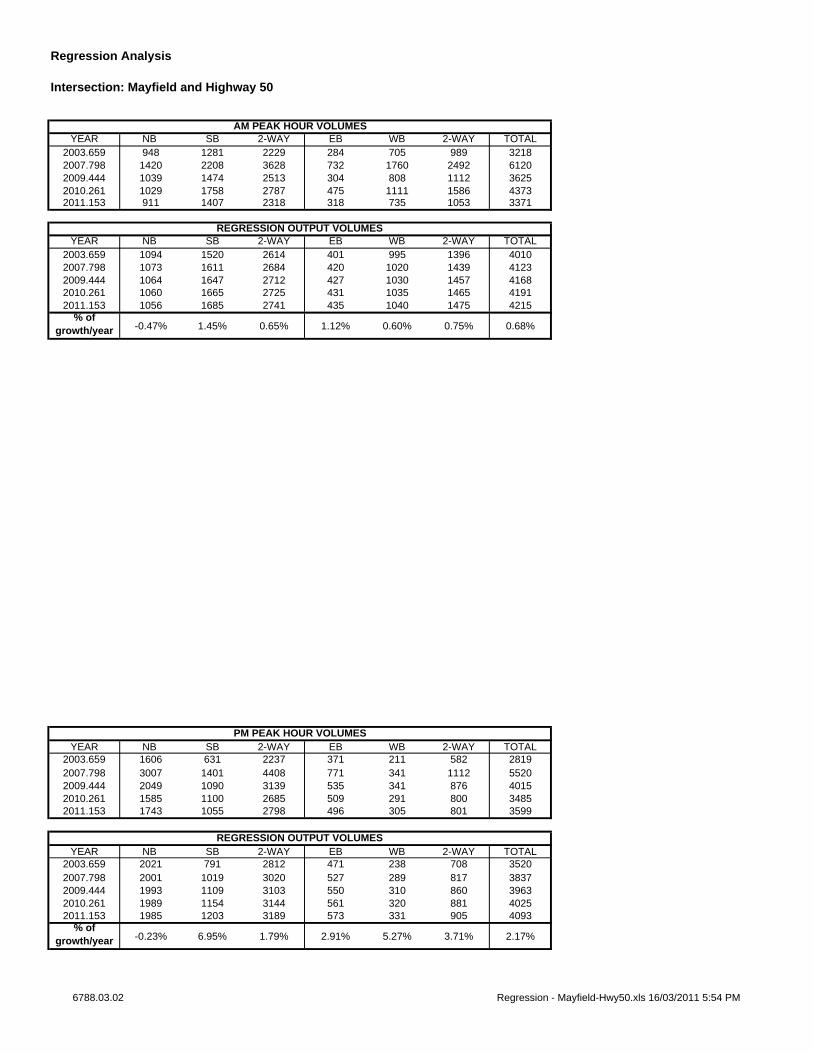
Regression Analysis
Intersection: Mayfield and Highway 50
YEAR NB SB 2-WAY EB WB 2-WAY TOTAL2003.659 948 1281 2229 284 705 989 32182007.798 1420 2208 3628 732 1760 2492 61202009.444 1039 1474 2513 304 808 1112 36252010.261 1029 1758 2787 475 1111 1586 43732011.153 911 1407 2318 318 735 1053 3371
YEAR NB SB 2-WAY EB WB 2-WAY TOTAL2003.659 1094 1520 2614 401 995 1396 40102007.798 1073 1611 2684 420 1020 1439 41232009.444 1064 1647 2712 427 1030 1457 41682010.261 1060 1665 2725 431 1035 1465 41912011.153 1056 1685 2741 435 1040 1475 4215
% of growth/year -0.47% 1.45% 0.65% 1.12% 0.60% 0.75% 0.68%
YEAR NB SB 2-WAY EB WB 2-WAY TOTAL2003.659 1606 631 2237 371 211 582 28192007.798 3007 1401 4408 771 341 1112 55202009.444 2049 1090 3139 535 341 876 40152010.261 1585 1100 2685 509 291 800 34852011.153 1743 1055 2798 496 305 801 3599
YEAR NB SB 2-WAY EB WB 2-WAY TOTAL2003.659 2021 791 2812 471 238 708 35202007.798 2001 1019 3020 527 289 817 38372009.444 1993 1109 3103 550 310 860 39632010.261 1989 1154 3144 561 320 881 40252011.153 1985 1203 3189 573 331 905 4093
% of growth/year -0.23% 6.95% 1.79% 2.91% 5.27% 3.71% 2.17%
AM PEAK HOUR VOLUMES
REGRESSION OUTPUT VOLUMES
PM PEAK HOUR VOLUMES
REGRESSION OUTPUT VOLUMES
6788.03.02 Regression - Mayfield-Hwy50.xls 16/03/2011 5:54 PM
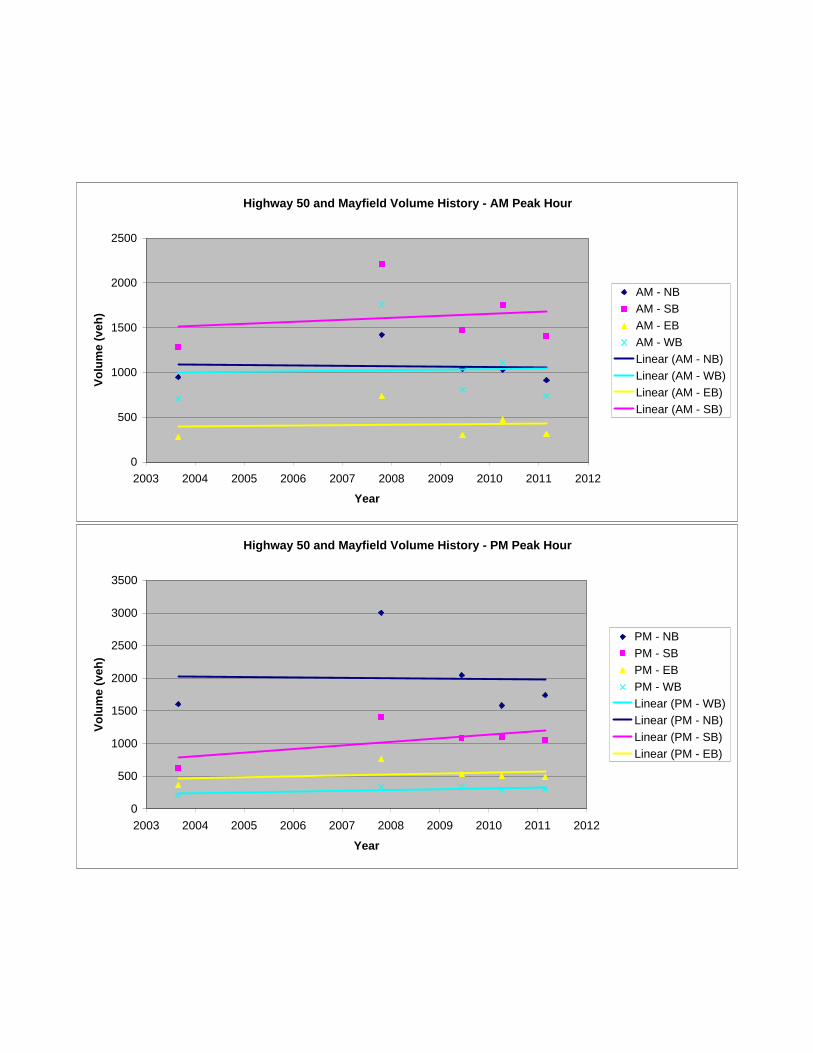
Highway 50 and Mayfield Volume History - AM Peak Hour
0
500
1000
1500
2000
2500
2003 2004 2005 2006 2007 2008 2009 2010 2011 2012
Year
Vo
lum
e (
ve
h)
AM - NB
AM - SB
AM - EB
AM - WB
Linear (AM - NB)
Linear (AM - WB)
Linear (AM - EB)
Linear (AM - SB)
Highway 50 and Mayfield Volume History - PM Peak Hour
0
500
1000
1500
2000
2500
3000
3500
2003 2004 2005 2006 2007 2008 2009 2010 2011 2012
Year
Vo
lum
e (v
eh)
PM - NB
PM - SB
PM - EB
PM - WB
Linear (PM - WB)
Linear (PM - NB)
Linear (PM - SB)
Linear (PM - EB)
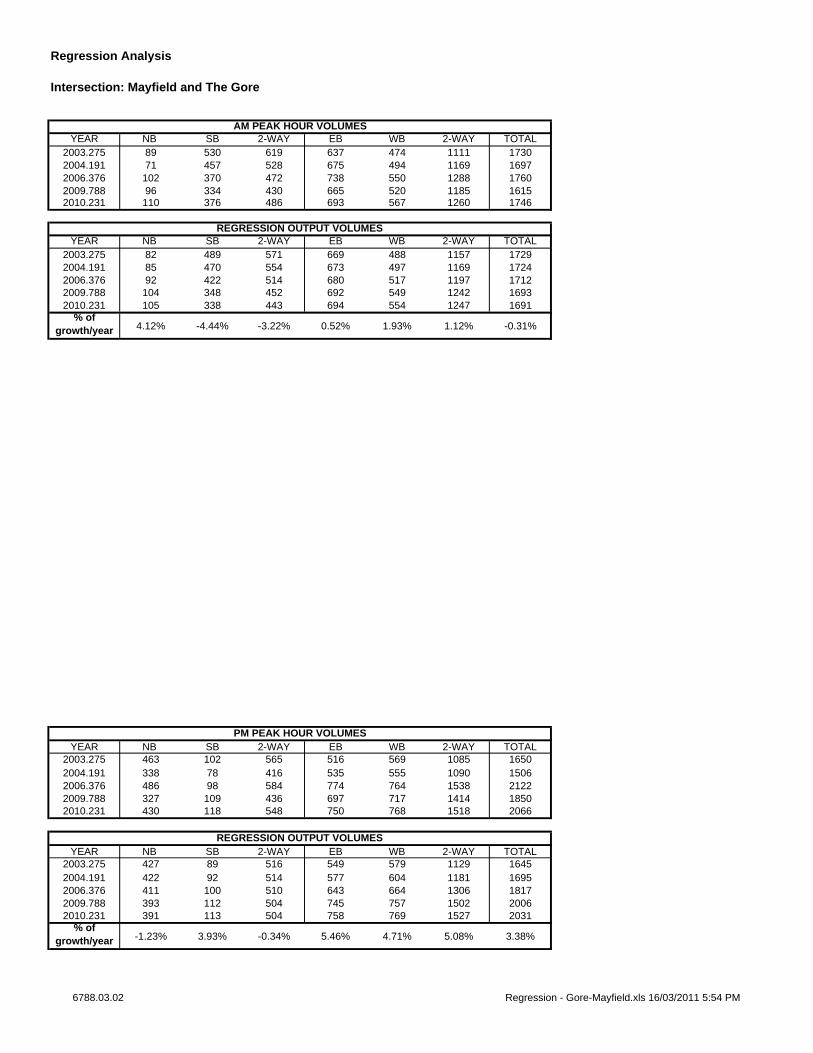
Regression Analysis
Intersection: Mayfield and The Gore
YEAR NB SB 2-WAY EB WB 2-WAY TOTAL2003.275 89 530 619 637 474 1111 17302004.191 71 457 528 675 494 1169 16972006.376 102 370 472 738 550 1288 17602009.788 96 334 430 665 520 1185 16152010.231 110 376 486 693 567 1260 1746
YEAR NB SB 2-WAY EB WB 2-WAY TOTAL2003.275 82 489 571 669 488 1157 17292004.191 85 470 554 673 497 1169 17242006.376 92 422 514 680 517 1197 17122009.788 104 348 452 692 549 1242 16932010.231 105 338 443 694 554 1247 1691
% of growth/year 4.12% -4.44% -3.22% 0.52% 1.93% 1.12% -0.31%
YEAR NB SB 2-WAY EB WB 2-WAY TOTAL2003.275 463 102 565 516 569 1085 16502004.191 338 78 416 535 555 1090 15062006.376 486 98 584 774 764 1538 21222009.788 327 109 436 697 717 1414 18502010.231 430 118 548 750 768 1518 2066
YEAR NB SB 2-WAY EB WB 2-WAY TOTAL2003.275 427 89 516 549 579 1129 16452004.191 422 92 514 577 604 1181 16952006.376 411 100 510 643 664 1306 18172009.788 393 112 504 745 757 1502 20062010.231 391 113 504 758 769 1527 2031
% of growth/year -1.23% 3.93% -0.34% 5.46% 4.71% 5.08% 3.38%
AM PEAK HOUR VOLUMES
REGRESSION OUTPUT VOLUMES
PM PEAK HOUR VOLUMES
REGRESSION OUTPUT VOLUMES
6788.03.02 Regression - Gore-Mayfield.xls 16/03/2011 5:54 PM
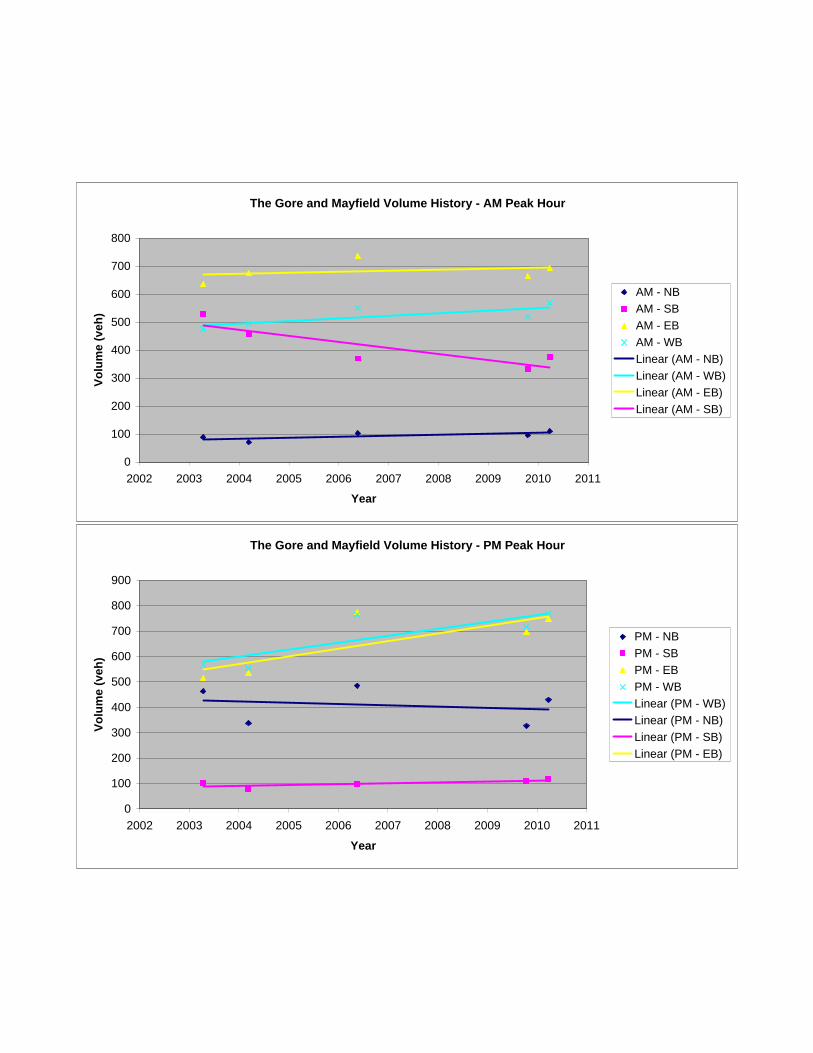
The Gore and Mayfield Volume History - AM Peak Hour
0
100
200
300
400
500
600
700
800
2002 2003 2004 2005 2006 2007 2008 2009 2010 2011
Year
Vo
lum
e (
ve
h)
AM - NB
AM - SB
AM - EB
AM - WB
Linear (AM - NB)
Linear (AM - WB)
Linear (AM - EB)
Linear (AM - SB)
The Gore and Mayfield Volume History - PM Peak Hour
0
100
200
300
400
500
600
700
800
900
2002 2003 2004 2005 2006 2007 2008 2009 2010 2011
Year
Vo
lum
e (v
eh)
PM - NB
PM - SB
PM - EB
PM - WB
Linear (PM - WB)
Linear (PM - NB)
Linear (PM - SB)
Linear (PM - EB)

P r o j e c t B o l t o n
APPENDIX C: Technical Analys is
Intersect ion Operat ions Worksheets

P r o j e c t B o l t o n
SIGNALIZED INTERSECTION SUMMARY TABLES

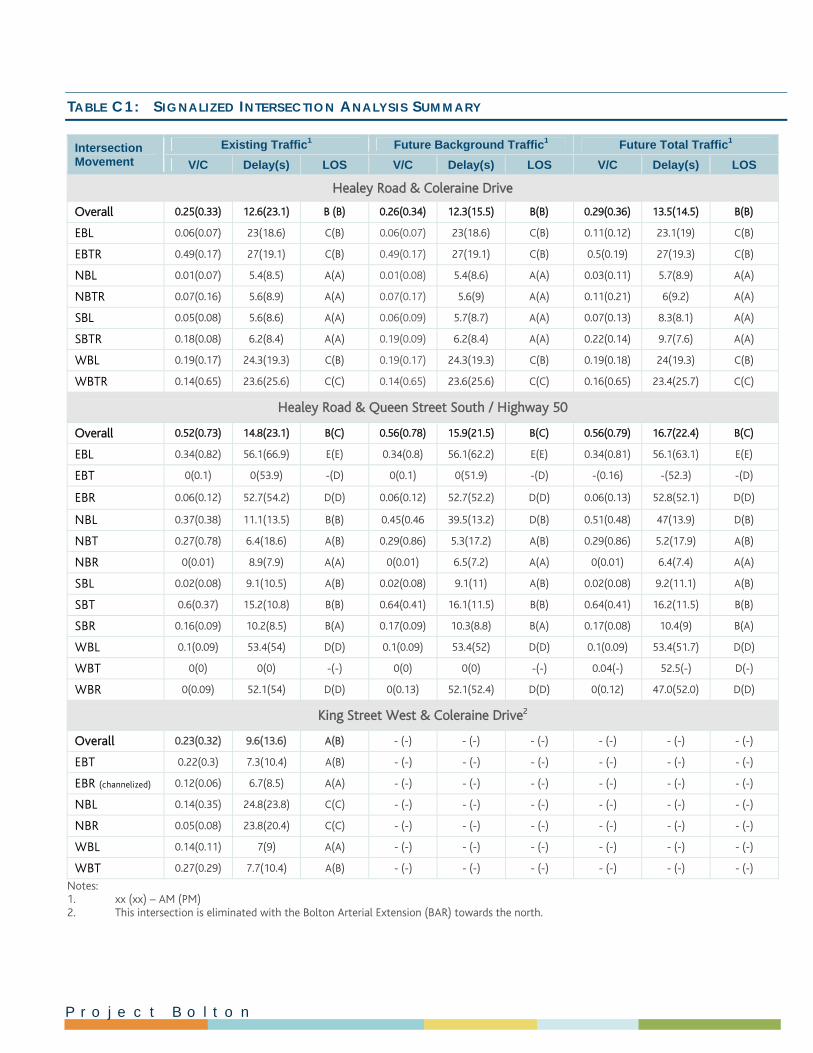
P r o j e c t B o l t o n
TABLE C1: SIGNALIZED INTERSECTION ANALYSIS SUMMARY
Intersection Movement
Existing Traffic1 Future Background Traffic1 Future Total Traffic1
V/C Delay(s) LOS V/C Delay(s) LOS V/C Delay(s) LOS
Healey Road & Coleraine Drive
Overall 0.25(0.33) 12.6(23.1) B (B) 0.26(0.34) 12.3(15.5) B(B) 0.29(0.36) 13.5(14.5) B(B)
EBL 0.06(0.07) 23(18.6) C(B) 0.06(0.07) 23(18.6) C(B) 0.11(0.12) 23.1(19) C(B)
EBTR 0.49(0.17) 27(19.1) C(B) 0.49(0.17) 27(19.1) C(B) 0.5(0.19) 27(19.3) C(B)
NBL 0.01(0.07) 5.4(8.5) A(A) 0.01(0.08) 5.4(8.6) A(A) 0.03(0.11) 5.7(8.9) A(A)
NBTR 0.07(0.16) 5.6(8.9) A(A) 0.07(0.17) 5.6(9) A(A) 0.11(0.21) 6(9.2) A(A)
SBL 0.05(0.08) 5.6(8.6) A(A) 0.06(0.09) 5.7(8.7) A(A) 0.07(0.13) 8.3(8.1) A(A)
SBTR 0.18(0.08) 6.2(8.4) A(A) 0.19(0.09) 6.2(8.4) A(A) 0.22(0.14) 9.7(7.6) A(A)
WBL 0.19(0.17) 24.3(19.3) C(B) 0.19(0.17) 24.3(19.3) C(B) 0.19(0.18) 24(19.3) C(B)
WBTR 0.14(0.65) 23.6(25.6) C(C) 0.14(0.65) 23.6(25.6) C(C) 0.16(0.65) 23.4(25.7) C(C)
Healey Road & Queen Street South / Highway 50
Overall 0.52(0.73) 14.8(23.1) B(C) 0.56(0.78) 15.9(21.5) B(C) 0.56(0.79) 16.7(22.4) B(C)
EBL 0.34(0.82) 56.1(66.9) E(E) 0.34(0.8) 56.1(62.2) E(E) 0.34(0.81) 56.1(63.1) E(E)
EBT 0(0.1) 0(53.9) -(D) 0(0.1) 0(51.9) -(D) -(0.16) -(52.3) -(D)
EBR 0.06(0.12) 52.7(54.2) D(D) 0.06(0.12) 52.7(52.2) D(D) 0.06(0.13) 52.8(52.1) D(D)
NBL 0.37(0.38) 11.1(13.5) B(B) 0.45(0.46 39.5(13.2) D(B) 0.51(0.48) 47(13.9) D(B)
NBT 0.27(0.78) 6.4(18.6) A(B) 0.29(0.86) 5.3(17.2) A(B) 0.29(0.86) 5.2(17.9) A(B)
NBR 0(0.01) 8.9(7.9) A(A) 0(0.01) 6.5(7.2) A(A) 0(0.01) 6.4(7.4) A(A)
SBL 0.02(0.08) 9.1(10.5) A(B) 0.02(0.08) 9.1(11) A(B) 0.02(0.08) 9.2(11.1) A(B)
SBT 0.6(0.37) 15.2(10.8) B(B) 0.64(0.41) 16.1(11.5) B(B) 0.64(0.41) 16.2(11.5) B(B)
SBR 0.16(0.09) 10.2(8.5) B(A) 0.17(0.09) 10.3(8.8) B(A) 0.17(0.08) 10.4(9) B(A)
WBL 0.1(0.09) 53.4(54) D(D) 0.1(0.09) 53.4(52) D(D) 0.1(0.09) 53.4(51.7) D(D)
WBT 0(0) 0(0) -(-) 0(0) 0(0) -(-) 0.04(-) 52.5(-) D(-)
WBR 0(0.09) 52.1(54) D(D) 0(0.13) 52.1(52.4) D(D) 0(0.12) 47.0(52.0) D(D)
King Street West & Coleraine Drive2
Overall 0.23(0.32) 9.6(13.6) A(B) - (-) - (-) - (-) - (-) - (-) - (-)
EBT 0.22(0.3) 7.3(10.4) A(B) - (-) - (-) - (-) - (-) - (-) - (-)
EBR (channelized) 0.12(0.06) 6.7(8.5) A(A) - (-) - (-) - (-) - (-) - (-) - (-)
NBL 0.14(0.35) 24.8(23.8) C(C) - (-) - (-) - (-) - (-) - (-) - (-)
NBR 0.05(0.08) 23.8(20.4) C(C) - (-) - (-) - (-) - (-) - (-) - (-)
WBL 0.14(0.11) 7(9) A(A) - (-) - (-) - (-) - (-) - (-) - (-)
WBT 0.27(0.29) 7.7(10.4) A(B) - (-) - (-) - (-) - (-) - (-) - (-)
Notes: 1. xx (xx) – AM (PM) 2. This intersection is eliminated with the Bolton Arterial Extension (BAR) towards the north.


P r o j e c t B o l t o n
TABLE C1: SIGNALIZED INTERSECTION ANALYSIS SUMMARY CONT’D
Intersection Movement
Existing Traffic1 Future Background Traffic1 Future Total Traffic1
V/C Delay(s) LOS V/C Delay(s) LOS V/C Delay(s) LOS
Mayfield Road & Queen Street South / Highway 502
Overall 1.12(0.55) 85.3(17.6) F(B) 0.84(0.62) 40.4(22.7) D(C) 0.81(0.68) 41.2(23.4) D(C)
EBL (single) 1.5(0.72) 316.4(45.8) F(D) - (-) - (-) - (-) - (-) - (-) - (-)
EBL (dual) - (-) - (-) - (-) 0.62(0.65) 56.6(56.1) E(E) 0.62(0.8) 56.6(68.9) E(E)
EBT 0.43(0.49) 46.7(35.4) D(D) 0.69(0.76) 56.8(56.6) E(E) 0.69(0.79) 56.8(59.7) E(E)
EBR 0.13(0.04) 42.6(29.9) D(C) 0.44(0.05) 49.1(40) D(D) 0.55(0.09) 51.6(41.1) D(D)
NBL 0.55(0.43) 33.6(15.1) C(B) 0.67(0.52) 44.5(21.6) D(C) 0.85(0.61) 63.9(24.5) E(C)
NBT 0.45(0.48) 18(12) B(B) 0.57(0.54) 24.2(16.1) C(B) 0.58(0.53) 24.4(15) C(B)
NBR 0.08(0.33) 14(10.9) B(B) 0.09(0.35) 17.7(14) B(B) 0.09(0.36) 17.7(13.3) B(B)
SBL 0.04(0.08) 20.4(9) C(A) 0.06(0.1) 28.1(9.3) C(A) 0.06(0.1) 28.1(8.3) C(A)
SBT 1.0(0.41) 59.4(11.2) E(B) 0.89(0.32) 37.7(9.6) D(A) 0.89(0.32) 38(8.7) D(A)
SBR 0.12(0.13) 21.2(8.9) C(A) 0.13(0.14) 48.2(4) D(A) 0.13(0.14) 48.2(3.3) D(A)
WBL (single) 1.51(0.6) 283.3(41) F(D) - (-) - (-) - (-) - (-) - (-) - (-)
WBL (dual) - (-) - (-) - (-) 0.92(0.62) 61.7(59.9) E(E) 0.92(0.69) 61.7(65.7) E(E)
WBT 0.72(0.31) 42.1(32.8) D(C) -(-) -(-) -(-) -(-) -(-) -(-)
WBR 0.02(0.01) 41.2(29.6) D(C) -(-) -(-) -(-) -(-) -(-) -(-)
WBTR - (-) - (-) - (-) 0.55(0.34) 38.1(46.5) D(D) 0.55(0.33) 38.1(45.7) D(D)
Mayfield Road & Coleraine Drive
Overall 0.4(0.28) 20.2(20.6) C(C) 0.47(0.32) 20.6(20.9) C(C) 0.54(0.37) 21.5(21.5) C(B)
EBL 0.44(0.31) 14(12.5) B(B) 0.53(0.37) 15.9(13.1) B(B) 0.64(0.43) 19.5(13.6) B(B)
EBTR 0.19(0.24) 12.5(12.5) B(B) 0.21(0.27) 12.7(12.8) B(B) 0.21(0.27) 12.7(12.8) B(C)
NBL 0.04(0.25) 25.7(31.5) C(C) 0.04(0.28) 25.8(32.1) C(C) 0.05(0.3) 25.9(33) C(C)
NBTR 0.05(0.18) 25.6(29.3) C(C) 0.05(0.19) 25.6(29.5) C(C) 0.07(0.21) 25.8(29.7) C(C)
SBL 0.09(0.08) 26.3(28.5) C(C) 0.1(0.08) 26.5(28.6) C(C) 0.17(0.19) 27.4(30.2) C(C)
SBTR 0.38(0.15) 29.5(29) C(C) 0.41(0.16) 30(29.2) C(C) 0.43(0.2) 30.3(29.6) C(C)
WBL 0.02(0.03) 16.2(17.9) B(B) 0.04(0.03) 16.4(18) B(B) 0.02(0.03) 16.2(18.2) B(B)
WBTR 0.29(0.3) 18.8(20.7) B(C) 0.33(34) 19.3(21.4) B(C) 0.34(0.35) 19.5(21.7) B(C)
Notes: 1. xx (xx) – AM (PM) 2. Under future background and future total conditions, there is the addition of eastbound and westbound dual left turn lanes, the addition of a
westbound through / right lane and an additional southbound through lane.

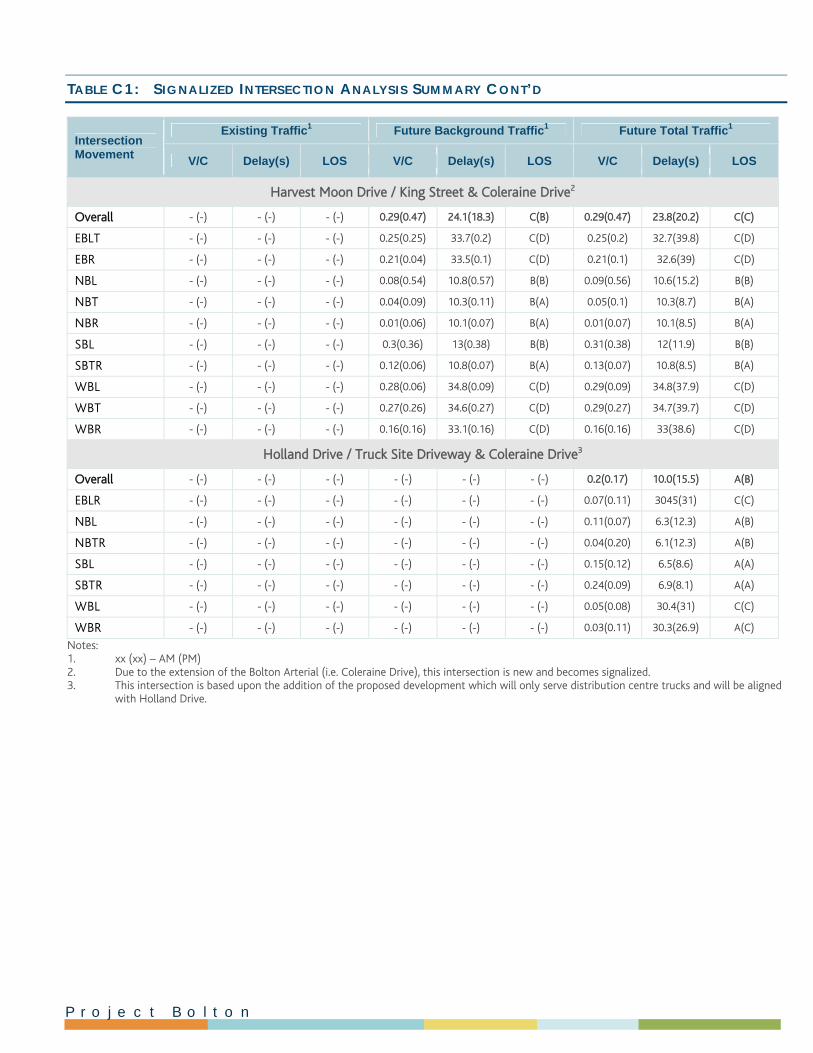
P r o j e c t B o l t o n
TABLE C1: SIGNALIZED INTERSECTION ANALYSIS SUMMARY CONT’D
Intersection Movement
Existing Traffic1 Future Background Traffic1 Future Total Traffic1
V/C Delay(s) LOS V/C Delay(s) LOS V/C Delay(s) LOS
Harvest Moon Drive / King Street & Coleraine Drive2
Overall - (-) - (-) - (-) 0.29(0.47) 24.1(18.3) C(B) 0.29(0.47) 23.8(20.2) C(C)
EBLT - (-) - (-) - (-) 0.25(0.25) 33.7(0.2) C(D) 0.25(0.2) 32.7(39.8) C(D)
EBR - (-) - (-) - (-) 0.21(0.04) 33.5(0.1) C(D) 0.21(0.1) 32.6(39) C(D)
NBL - (-) - (-) - (-) 0.08(0.54) 10.8(0.57) B(B) 0.09(0.56) 10.6(15.2) B(B)
NBT - (-) - (-) - (-) 0.04(0.09) 10.3(0.11) B(A) 0.05(0.1) 10.3(8.7) B(A)
NBR - (-) - (-) - (-) 0.01(0.06) 10.1(0.07) B(A) 0.01(0.07) 10.1(8.5) B(A)
SBL - (-) - (-) - (-) 0.3(0.36) 13(0.38) B(B) 0.31(0.38) 12(11.9) B(B)
SBTR - (-) - (-) - (-) 0.12(0.06) 10.8(0.07) B(A) 0.13(0.07) 10.8(8.5) B(A)
WBL - (-) - (-) - (-) 0.28(0.06) 34.8(0.09) C(D) 0.29(0.09) 34.8(37.9) C(D)
WBT - (-) - (-) - (-) 0.27(0.26) 34.6(0.27) C(D) 0.29(0.27) 34.7(39.7) C(D)
WBR - (-) - (-) - (-) 0.16(0.16) 33.1(0.16) C(D) 0.16(0.16) 33(38.6) C(D)
Holland Drive / Truck Site Driveway & Coleraine Drive3
Overall - (-) - (-) - (-) - (-) - (-) - (-) 0.2(0.17) 10.0(15.5) A(B)
EBLR - (-) - (-) - (-) - (-) - (-) - (-) 0.07(0.11) 3045(31) C(C)
NBL - (-) - (-) - (-) - (-) - (-) - (-) 0.11(0.07) 6.3(12.3) A(B)
NBTR - (-) - (-) - (-) - (-) - (-) - (-) 0.04(0.20) 6.1(12.3) A(B)
SBL - (-) - (-) - (-) - (-) - (-) - (-) 0.15(0.12) 6.5(8.6) A(A)
SBTR - (-) - (-) - (-) - (-) - (-) - (-) 0.24(0.09) 6.9(8.1) A(A)
WBL - (-) - (-) - (-) - (-) - (-) - (-) 0.05(0.08) 30.4(31) C(C)
WBR - (-) - (-) - (-) - (-) - (-) - (-) 0.03(0.11) 30.3(26.9) A(C)
Notes: 1. xx (xx) – AM (PM) 2. Due to the extension of the Bolton Arterial (i.e. Coleraine Drive), this intersection is new and becomes signalized. 3. This intersection is based upon the addition of the proposed development which will only serve distribution centre trucks and will be aligned
with Holland Drive.

P r o j e c t B o l t o n
SYNCHRO ANALYSIS WORKSHEETS

P r o j e c t B o l t o n
Existing Conditions


HCM Unsignalized Intersection Capacity Analysis Existing Conditions5: Holland Drive & Coleraine Drive Weekday AM Peak Hour
Canadian Tire Bolton Warehouse Synchro 7 - ReportBA Consulting Group Page 1
Movement WBL WBR NBT NBR SBL SBTLane ConfigurationsVolume (veh/h) 5 55 60 15 105 425Sign Control Stop Free FreeGrade 0% 0% 0%Peak Hour Factor 1.00 1.00 1.00 1.00 1.00 1.00Hourly flow rate (vph) 5 55 60 15 105 425PedestriansLane Width (m)Walking Speed (m/s)Percent BlockageRight turn flare (veh)Median type None NoneMedian storage veh)Upstream signal (m)pX, platoon unblockedvC, conflicting volume 490 38 75vC1, stage 1 conf volvC2, stage 2 conf volvCu, unblocked vol 490 38 75tC, single (s) 6.8 6.9 4.1tC, 2 stage (s)tF (s) 3.5 3.3 2.2p0 queue free % 99 95 93cM capacity (veh/h) 477 1033 1537
Direction, Lane # WB 1 WB 2 NB 1 NB 2 SB 1 SB 2 SB 3Volume Total 5 55 40 35 105 212 212Volume Left 5 0 0 0 105 0 0Volume Right 0 55 0 15 0 0 0cSH 477 1033 1700 1700 1537 1700 1700Volume to Capacity 0.01 0.05 0.02 0.02 0.07 0.13 0.13Queue Length 95th (m) 0.2 1.2 0.0 0.0 1.5 0.0 0.0Control Delay (s) 12.6 8.7 0.0 0.0 7.5 0.0 0.0Lane LOS B A AApproach Delay (s) 9.0 0.0 1.5Approach LOS A
Intersection SummaryAverage Delay 2.0Intersection Capacity Utilization 22.5% ICU Level of Service AAnalysis Period (min) 15

Queues Existing Conditions7: Healey Road & Coleraine Drive Weekday AM Peak Hour
Canadian Tire Bolton Warehouse Synchro 7 - ReportBA Consulting Group Page 2
Lane Group EBL EBT WBL WBT NBL NBT SBL SBTLane ConfigurationsVolume (vph) 15 165 45 50 5 65 35 375Lane Group Flow (vph) 15 190 45 60 5 180 35 400Turn Type Perm Perm Perm PermProtected Phases 8 4 6 2Permitted Phases 8 4 6 2Detector Phase 8 8 4 4 6 6 2 2Switch PhaseMinimum Initial (s) 8.0 8.0 8.0 8.0 8.0 8.0 8.0 8.0Minimum Split (s) 32.8 32.8 32.8 32.8 36.2 36.2 36.2 36.2Total Split (s) 33.0 33.0 33.0 33.0 37.0 37.0 37.0 37.0Total Split (%) 47.1% 47.1% 47.1% 47.1% 52.9% 52.9% 52.9% 52.9%Yellow Time (s) 4.0 4.0 4.0 4.0 4.6 4.6 4.6 4.6All-Red Time (s) 2.8 2.8 2.8 2.8 2.1 2.1 2.1 2.1Lost Time Adjust (s) 0.0 0.0 0.0 0.0 0.0 0.0 0.0 0.0Total Lost Time (s) 6.8 6.8 6.8 6.8 6.7 6.7 6.7 6.7Lead/LagLead-Lag Optimize?Recall Mode None None None None C-Max C-Max C-Max C-Maxv/c Ratio 0.06 0.50 0.19 0.16 0.01 0.09 0.05 0.18Control Delay 21.2 27.3 23.8 19.8 6.8 3.0 6.9 6.6Queue Delay 0.0 0.0 0.0 0.0 0.0 0.0 0.0 0.0Total Delay 21.2 27.3 23.8 19.8 6.8 3.0 6.9 6.6Queue Length 50th (m) 1.5 19.2 4.6 5.0 0.2 1.4 1.5 9.4Queue Length 95th (m) 5.1 32.5 11.0 12.0 1.5 5.3 5.2 17.5Internal Link Dist (m) 1348.4 958.2 2899.4 1053.0Turn Bay Length (m) 120.0 100.0 120.0 120.0Base Capacity (vph) 505 712 449 707 592 2058 731 2211Starvation Cap Reductn 0 0 0 0 0 0 0 0Spillback Cap Reductn 0 0 0 0 0 0 0 0Storage Cap Reductn 0 0 0 0 0 0 0 0Reduced v/c Ratio 0.03 0.27 0.10 0.08 0.01 0.09 0.05 0.18
Intersection SummaryCycle Length: 70Actuated Cycle Length: 70Offset: 0 (0%), Referenced to phase 2:SBTL and 6:NBTL, Start of GreenNatural Cycle: 70Control Type: Actuated-Coordinated
Splits and Phases: 7: Healey Road & Coleraine Drive
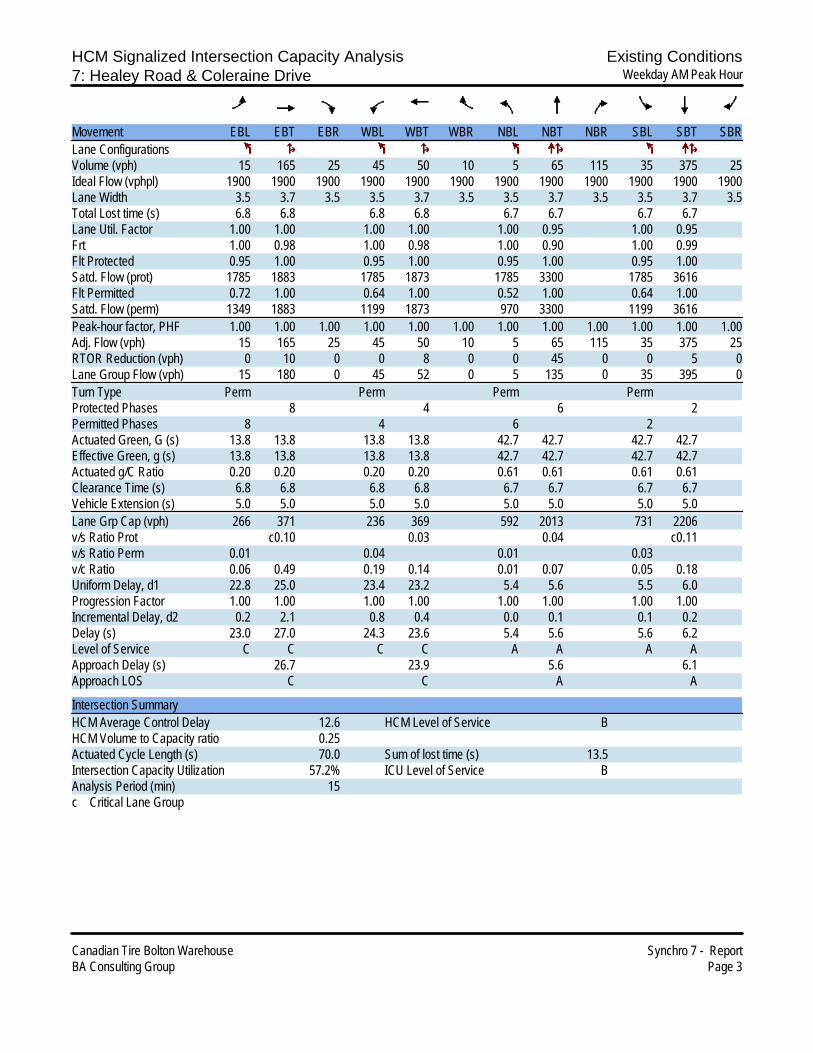
HCM Signalized Intersection Capacity Analysis Existing Conditions7: Healey Road & Coleraine Drive Weekday AM Peak Hour
Canadian Tire Bolton Warehouse Synchro 7 - ReportBA Consulting Group Page 3
Movement EBL EBT EBR WBL WBT WBR NBL NBT NBR SBL SBT SBRLane ConfigurationsVolume (vph) 15 165 25 45 50 10 5 65 115 35 375 25Ideal Flow (vphpl) 1900 1900 1900 1900 1900 1900 1900 1900 1900 1900 1900 1900Lane Width 3.5 3.7 3.5 3.5 3.7 3.5 3.5 3.7 3.5 3.5 3.7 3.5Total Lost time (s) 6.8 6.8 6.8 6.8 6.7 6.7 6.7 6.7Lane Util. Factor 1.00 1.00 1.00 1.00 1.00 0.95 1.00 0.95Frt 1.00 0.98 1.00 0.98 1.00 0.90 1.00 0.99Flt Protected 0.95 1.00 0.95 1.00 0.95 1.00 0.95 1.00Satd. Flow (prot) 1785 1883 1785 1873 1785 3300 1785 3616Flt Permitted 0.72 1.00 0.64 1.00 0.52 1.00 0.64 1.00Satd. Flow (perm) 1349 1883 1199 1873 970 3300 1199 3616Peak-hour factor, PHF 1.00 1.00 1.00 1.00 1.00 1.00 1.00 1.00 1.00 1.00 1.00 1.00Adj. Flow (vph) 15 165 25 45 50 10 5 65 115 35 375 25RTOR Reduction (vph) 0 10 0 0 8 0 0 45 0 0 5 0Lane Group Flow (vph) 15 180 0 45 52 0 5 135 0 35 395 0Turn Type Perm Perm Perm PermProtected Phases 8 4 6 2Permitted Phases 8 4 6 2Actuated Green, G (s) 13.8 13.8 13.8 13.8 42.7 42.7 42.7 42.7Effective Green, g (s) 13.8 13.8 13.8 13.8 42.7 42.7 42.7 42.7Actuated g/C Ratio 0.20 0.20 0.20 0.20 0.61 0.61 0.61 0.61Clearance Time (s) 6.8 6.8 6.8 6.8 6.7 6.7 6.7 6.7Vehicle Extension (s) 5.0 5.0 5.0 5.0 5.0 5.0 5.0 5.0Lane Grp Cap (vph) 266 371 236 369 592 2013 731 2206v/s Ratio Prot c0.10 0.03 0.04 c0.11v/s Ratio Perm 0.01 0.04 0.01 0.03v/c Ratio 0.06 0.49 0.19 0.14 0.01 0.07 0.05 0.18Uniform Delay, d1 22.8 25.0 23.4 23.2 5.4 5.6 5.5 6.0Progression Factor 1.00 1.00 1.00 1.00 1.00 1.00 1.00 1.00Incremental Delay, d2 0.2 2.1 0.8 0.4 0.0 0.1 0.1 0.2Delay (s) 23.0 27.0 24.3 23.6 5.4 5.6 5.6 6.2Level of Service C C C C A A A AApproach Delay (s) 26.7 23.9 5.6 6.1Approach LOS C C A A
Intersection SummaryHCM Average Control Delay 12.6 HCM Level of Service BHCM Volume to Capacity ratio 0.25Actuated Cycle Length (s) 70.0 Sum of lost time (s) 13.5Intersection Capacity Utilization 57.2% ICU Level of Service BAnalysis Period (min) 15c Critical Lane Group

Timing Report, Sorted By Phase Existing Conditions7: Healey Road & Coleraine Drive Weekday AM Peak Hour
Canadian Tire Bolton Warehouse Synchro 7 - ReportBA Consulting Group Page 4
Phase Number 2 4 6 8Movement SBTL WBTL NBTL EBTLLead/LagLead-Lag OptimizeRecall Mode C-Max None C-Max NoneMaximum Split (s) 37 33 37 33Maximum Split (%) 52.9% 47.1% 52.9% 47.1%Minimum Split (s) 36.2 32.8 36.2 32.8Yellow Time (s) 4.6 4 4.6 4All-Red Time (s) 2.1 2.8 2.1 2.8Minimum Initial (s) 8 8 8 8Vehicle Extension (s) 5 5 5 5Minimum Gap (s) 3 3 3 3Time Before Reduce (s) 0 0 0 0Time To Reduce (s) 0 0 0 0Walk Time (s) 5 5 5 5Flash Dont Walk (s) 24.5 21 24.5 21Dual Entry Yes Yes Yes YesInhibit Max Yes Yes Yes YesStart Time (s) 0 37 0 37End Time (s) 37 0 37 0Yield/Force Off (s) 30.3 63.2 30.3 63.2Yield/Force Off 170(s) 5.8 42.2 5.8 42.2Local Start Time (s) 0 37 0 37Local Yield (s) 30.3 63.2 30.3 63.2Local Yield 170(s) 5.8 42.2 5.8 42.2
Intersection SummaryCycle Length 70Control Type Actuated-CoordinatedNatural Cycle 70Offset: 0 (0%), Referenced to phase 2:SBTL and 6:NBTL, Start of Green
Splits and Phases: 7: Healey Road & Coleraine Drive
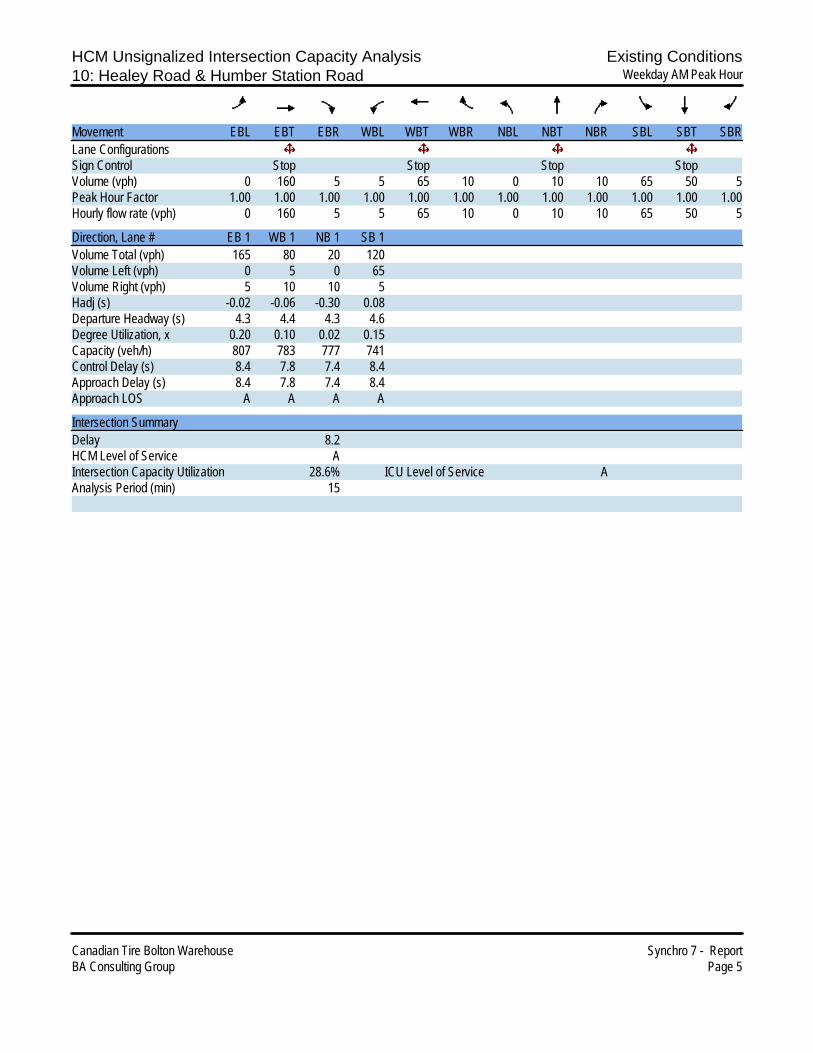
HCM Unsignalized Intersection Capacity Analysis Existing Conditions10: Healey Road & Humber Station Road Weekday AM Peak Hour
Canadian Tire Bolton Warehouse Synchro 7 - ReportBA Consulting Group Page 5
Movement EBL EBT EBR WBL WBT WBR NBL NBT NBR SBL SBT SBRLane ConfigurationsSign Control Stop Stop Stop StopVolume (vph) 0 160 5 5 65 10 0 10 10 65 50 5Peak Hour Factor 1.00 1.00 1.00 1.00 1.00 1.00 1.00 1.00 1.00 1.00 1.00 1.00Hourly flow rate (vph) 0 160 5 5 65 10 0 10 10 65 50 5
Direction, Lane # EB 1 WB 1 NB 1 SB 1Volume Total (vph) 165 80 20 120Volume Left (vph) 0 5 0 65Volume Right (vph) 5 10 10 5Hadj (s) -0.02 -0.06 -0.30 0.08Departure Headway (s) 4.3 4.4 4.3 4.6Degree Utilization, x 0.20 0.10 0.02 0.15Capacity (veh/h) 807 783 777 741Control Delay (s) 8.4 7.8 7.4 8.4Approach Delay (s) 8.4 7.8 7.4 8.4Approach LOS A A A A
Intersection SummaryDelay 8.2HCM Level of Service AIntersection Capacity Utilization 28.6% ICU Level of Service AAnalysis Period (min) 15
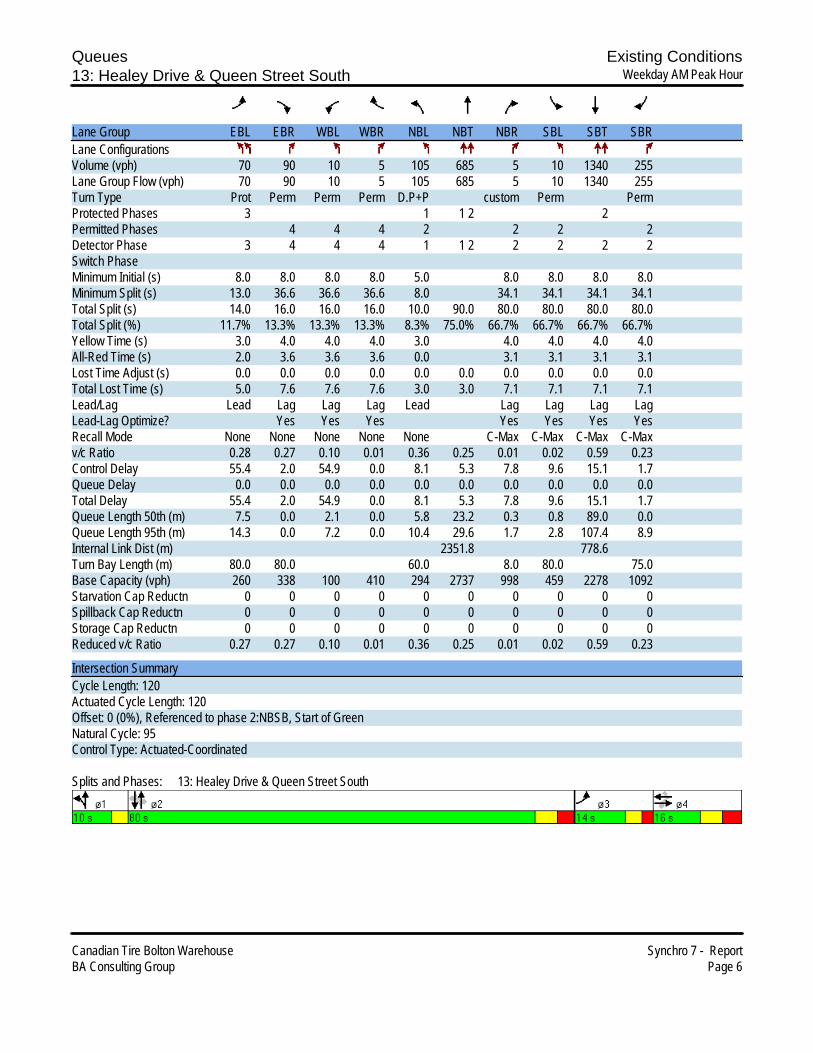
Queues Existing Conditions13: Healey Drive & Queen Street South Weekday AM Peak Hour
Canadian Tire Bolton Warehouse Synchro 7 - ReportBA Consulting Group Page 6
Lane Group EBL EBR WBL WBR NBL NBT NBR SBL SBT SBRLane ConfigurationsVolume (vph) 70 90 10 5 105 685 5 10 1340 255Lane Group Flow (vph) 70 90 10 5 105 685 5 10 1340 255Turn Type Prot Perm Perm Perm D.P+P custom Perm PermProtected Phases 3 1 1 2 2Permitted Phases 4 4 4 2 2 2 2Detector Phase 3 4 4 4 1 1 2 2 2 2 2Switch PhaseMinimum Initial (s) 8.0 8.0 8.0 8.0 5.0 8.0 8.0 8.0 8.0Minimum Split (s) 13.0 36.6 36.6 36.6 8.0 34.1 34.1 34.1 34.1Total Split (s) 14.0 16.0 16.0 16.0 10.0 90.0 80.0 80.0 80.0 80.0Total Split (%) 11.7% 13.3% 13.3% 13.3% 8.3% 75.0% 66.7% 66.7% 66.7% 66.7%Yellow Time (s) 3.0 4.0 4.0 4.0 3.0 4.0 4.0 4.0 4.0All-Red Time (s) 2.0 3.6 3.6 3.6 0.0 3.1 3.1 3.1 3.1Lost Time Adjust (s) 0.0 0.0 0.0 0.0 0.0 0.0 0.0 0.0 0.0 0.0Total Lost Time (s) 5.0 7.6 7.6 7.6 3.0 3.0 7.1 7.1 7.1 7.1Lead/Lag Lead Lag Lag Lag Lead Lag Lag Lag LagLead-Lag Optimize? Yes Yes Yes Yes Yes Yes YesRecall Mode None None None None None C-Max C-Max C-Max C-Maxv/c Ratio 0.28 0.27 0.10 0.01 0.36 0.25 0.01 0.02 0.59 0.23Control Delay 55.4 2.0 54.9 0.0 8.1 5.3 7.8 9.6 15.1 1.7Queue Delay 0.0 0.0 0.0 0.0 0.0 0.0 0.0 0.0 0.0 0.0Total Delay 55.4 2.0 54.9 0.0 8.1 5.3 7.8 9.6 15.1 1.7Queue Length 50th (m) 7.5 0.0 2.1 0.0 5.8 23.2 0.3 0.8 89.0 0.0Queue Length 95th (m) 14.3 0.0 7.2 0.0 10.4 29.6 1.7 2.8 107.4 8.9Internal Link Dist (m) 2351.8 778.6Turn Bay Length (m) 80.0 80.0 60.0 8.0 80.0 75.0Base Capacity (vph) 260 338 100 410 294 2737 998 459 2278 1092Starvation Cap Reductn 0 0 0 0 0 0 0 0 0 0Spillback Cap Reductn 0 0 0 0 0 0 0 0 0 0Storage Cap Reductn 0 0 0 0 0 0 0 0 0 0Reduced v/c Ratio 0.27 0.27 0.10 0.01 0.36 0.25 0.01 0.02 0.59 0.23
Intersection SummaryCycle Length: 120Actuated Cycle Length: 120Offset: 0 (0%), Referenced to phase 2:NBSB, Start of GreenNatural Cycle: 95Control Type: Actuated-Coordinated
Splits and Phases: 13: Healey Drive & Queen Street South

HCM Signalized Intersection Capacity Analysis Existing Conditions13: Healey Drive & Queen Street South Weekday AM Peak Hour
Canadian Tire Bolton Warehouse Synchro 7 - ReportBA Consulting Group Page 7
Movement EBL EBT EBR WBL WBT WBR NBL NBT NBR SBL SBT SBRLane ConfigurationsVolume (vph) 70 0 90 10 0 5 105 685 5 10 1340 255Ideal Flow (vphpl) 1900 1900 1900 1900 1900 1900 1900 1900 1900 1900 1900 1900Lane Width 3.5 3.7 3.5 3.5 3.7 3.5 3.5 3.7 3.5 3.5 3.7 3.5Total Lost time (s) 5.0 7.6 7.6 7.6 3.0 3.0 7.1 7.1 7.1 7.1Lane Util. Factor 0.97 1.00 1.00 1.00 1.00 0.95 1.00 1.00 0.95 1.00Frt 1.00 0.85 1.00 0.85 1.00 1.00 0.85 1.00 1.00 0.85Flt Protected 0.95 1.00 0.95 1.00 0.95 1.00 1.00 0.95 1.00 1.00Satd. Flow (prot) 3463 1597 1785 1597 1785 3650 1597 1785 3650 1597Flt Permitted 0.95 1.00 0.76 1.00 0.14 1.00 1.00 0.39 1.00 1.00Satd. Flow (perm) 3463 1597 1423 1597 266 3650 1597 735 3650 1597Peak-hour factor, PHF 1.00 1.00 1.00 1.00 1.00 1.00 1.00 1.00 1.00 1.00 1.00 1.00Adj. Flow (vph) 70 0 90 10 0 5 105 685 5 10 1340 255RTOR Reduction (vph) 0 0 84 0 0 5 0 0 1 0 0 98Lane Group Flow (vph) 70 0 6 10 0 0 105 685 4 10 1340 157Turn Type Prot Perm Perm Perm D.P+P custom Perm PermProtected Phases 3 4 4 1 1 2 2Permitted Phases 4 4 4 2 2 2 2Actuated Green, G (s) 7.2 8.2 8.2 8.2 81.9 84.9 73.9 73.9 73.9 73.9Effective Green, g (s) 7.2 8.2 8.2 8.2 81.9 84.9 73.9 73.9 73.9 73.9Actuated g/C Ratio 0.06 0.07 0.07 0.07 0.68 0.71 0.62 0.62 0.62 0.62Clearance Time (s) 5.0 7.6 7.6 7.6 3.0 7.1 7.1 7.1 7.1Vehicle Extension (s) 5.0 5.0 5.0 5.0 5.0 5.0 5.0 5.0 5.0Lane Grp Cap (vph) 208 109 97 109 283 2582 983 453 2248 983v/s Ratio Prot c0.02 c0.02 0.19 c0.37v/s Ratio Perm 0.00 c0.01 0.00 0.23 0.00 0.01 0.10v/c Ratio 0.34 0.06 0.10 0.00 0.37 0.27 0.00 0.02 0.60 0.16Uniform Delay, d1 54.1 52.3 52.4 52.1 9.4 6.3 8.9 9.0 14.0 9.8Progression Factor 1.00 1.00 1.00 1.00 1.00 1.00 1.00 1.00 1.00 1.00Incremental Delay, d2 2.0 0.5 1.0 0.0 1.7 0.1 0.0 0.1 1.2 0.3Delay (s) 56.1 52.7 53.4 52.1 11.1 6.4 8.9 9.1 15.2 10.2Level of Service E D D D B A A A B BApproach Delay (s) 54.2 53.0 7.1 14.3Approach LOS D D A B
Intersection SummaryHCM Average Control Delay 14.8 HCM Level of Service BHCM Volume to Capacity ratio 0.52Actuated Cycle Length (s) 120.0 Sum of lost time (s) 22.7Intersection Capacity Utilization 69.0% ICU Level of Service CAnalysis Period (min) 15c Critical Lane Group
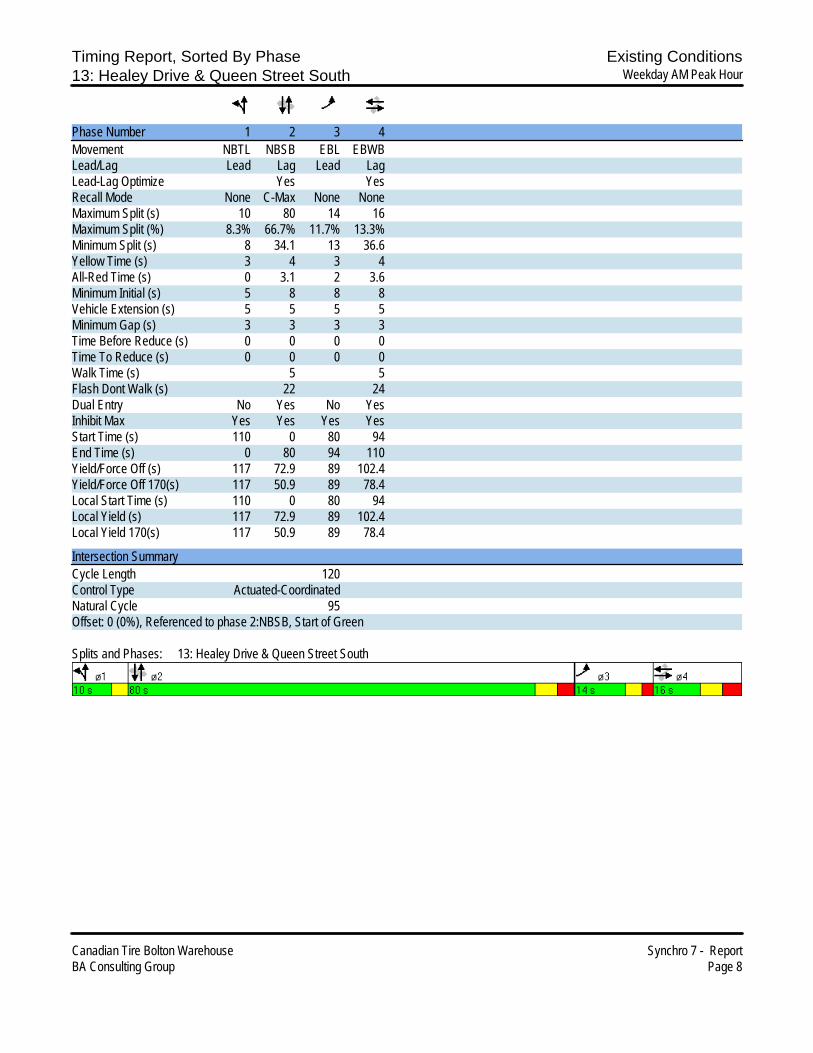
Timing Report, Sorted By Phase Existing Conditions13: Healey Drive & Queen Street South Weekday AM Peak Hour
Canadian Tire Bolton Warehouse Synchro 7 - ReportBA Consulting Group Page 8
Phase Number 1 2 3 4Movement NBTL NBSB EBL EBWBLead/Lag Lead Lag Lead LagLead-Lag Optimize Yes YesRecall Mode None C-Max None NoneMaximum Split (s) 10 80 14 16Maximum Split (%) 8.3% 66.7% 11.7% 13.3%Minimum Split (s) 8 34.1 13 36.6Yellow Time (s) 3 4 3 4All-Red Time (s) 0 3.1 2 3.6Minimum Initial (s) 5 8 8 8Vehicle Extension (s) 5 5 5 5Minimum Gap (s) 3 3 3 3Time Before Reduce (s) 0 0 0 0Time To Reduce (s) 0 0 0 0Walk Time (s) 5 5Flash Dont Walk (s) 22 24Dual Entry No Yes No YesInhibit Max Yes Yes Yes YesStart Time (s) 110 0 80 94End Time (s) 0 80 94 110Yield/Force Off (s) 117 72.9 89 102.4Yield/Force Off 170(s) 117 50.9 89 78.4Local Start Time (s) 110 0 80 94Local Yield (s) 117 72.9 89 102.4Local Yield 170(s) 117 50.9 89 78.4
Intersection SummaryCycle Length 120Control Type Actuated-CoordinatedNatural Cycle 95Offset: 0 (0%), Referenced to phase 2:NBSB, Start of Green
Splits and Phases: 13: Healey Drive & Queen Street South

Queues Existing Conditions17: Mayfield Road & Queen Street South Weekday AM Peak Hour
Canadian Tire Bolton Warehouse Synchro 7 - ReportBA Consulting Group Page 9
Lane Group EBL EBT EBR WBL WBT WBR NBL NBT NBR SBL SBT SBRLane ConfigurationsVolume (vph) 185 175 155 630 480 15 105 915 135 10 1665 190Lane Group Flow (vph) 185 175 155 630 480 15 105 915 135 10 1665 190Turn Type Perm Perm pm+pt custom pm+pt Perm Perm PermProtected Phases 4 3 3 4 1 1 2 2Permitted Phases 4 4 3 4 4 1 2 1 2 2 2Detector Phase 4 4 4 3 3 4 4 1 1 2 1 2 2 2 2Switch PhaseMinimum Initial (s) 12.0 12.0 12.0 5.0 12.0 5.0 20.0 20.0 20.0Minimum Split (s) 23.6 23.6 23.6 8.0 23.6 9.0 26.6 26.6 26.6Total Split (s) 34.6 34.6 34.6 18.0 52.6 34.6 13.0 79.6 79.6 66.6 66.6 66.6Total Split (%) 26.2% 26.2% 26.2% 13.6% 39.8% 26.2% 9.8% 60.2% 60.2% 50.4% 50.4% 50.4%Yellow Time (s) 4.6 4.6 4.6 3.0 4.6 3.0 4.6 4.6 4.6All-Red Time (s) 2.0 2.0 2.0 0.0 2.0 0.0 2.0 2.0 2.0Lost Time Adjust (s) 0.0 0.0 0.0 0.0 0.0 0.0 0.0 0.0 0.0 0.0 0.0 0.0Total Lost Time (s) 6.6 6.6 6.6 3.0 3.0 6.6 3.0 3.0 3.0 6.6 6.6 6.6Lead/Lag Lag Lag Lag Lead Lag Lead Lag Lag LagLead-Lag Optimize? Yes Yes Yes Yes Yes Yes Yes Yes YesRecall Mode None None None None None None C-Max C-Max C-Maxv/c Ratio 1.50 0.43 0.35 1.42 0.67 0.04 0.54 0.43 0.14 0.04 1.00 0.23Control Delay 300.7 49.1 11.2 231.5 39.9 22.5 29.2 16.4 2.3 20.9 59.3 3.5Queue Delay 0.0 0.0 0.0 0.0 0.0 0.0 0.0 0.0 0.0 0.0 0.0 0.0Total Delay 300.7 49.1 11.2 231.5 39.9 22.5 29.2 16.4 2.3 20.9 59.3 3.5Queue Length 50th (m) ~61.7 36.8 2.9 ~203.2 95.4 0.6 10.8 62.0 0.0 1.3 ~209.5 0.0Queue Length 95th (m) #105.1 57.5 19.6 #268.5 130.4 6.0 26.3 75.6 7.8 4.5 #258.7 11.9Internal Link Dist (m) 89.2 562.7 1481.1 2351.8Turn Bay Length (m) 85.0 85.0 300.0 70.0 60.0 175.0 40.0 120.0Base Capacity (vph) 123 407 449 445 721 348 196 2115 982 241 1657 829Starvation Cap Reductn 0 0 0 0 0 0 0 0 0 0 0 0Spillback Cap Reductn 0 0 0 0 0 0 0 0 0 0 0 0Storage Cap Reductn 0 0 0 0 0 0 0 0 0 0 0 0Reduced v/c Ratio 1.50 0.43 0.35 1.42 0.67 0.04 0.54 0.43 0.14 0.04 1.00 0.23
Intersection SummaryCycle Length: 132.2Actuated Cycle Length: 132.2Offset: 0 (0%), Referenced to phase 2:NBSB, Start of GreenNatural Cycle: 140Control Type: Actuated-Coordinated~ Volume exceeds capacity, queue is theoretically infinite. Queue shown is maximum after two cycles.# 95th percentile volume exceeds capacity, queue may be longer. Queue shown is maximum after two cycles.
Splits and Phases: 17: Mayfield Road & Queen Street South

HCM Signalized Intersection Capacity Analysis Existing Conditions17: Mayfield Road & Queen Street South Weekday AM Peak Hour
Canadian Tire Bolton Warehouse Synchro 7 - ReportBA Consulting Group Page 10
Movement EBL EBT EBR WBL WBT WBR NBL NBT NBR SBL SBT SBRLane ConfigurationsVolume (vph) 185 175 155 630 480 15 105 915 135 10 1665 190Ideal Flow (vphpl) 1900 1900 1900 1900 1900 1900 1900 1900 1900 1900 1900 1900Lane Width 3.5 3.7 3.5 3.5 3.7 3.5 3.5 3.7 3.5 3.5 3.7 3.5Total Lost time (s) 6.6 6.6 6.6 3.0 3.0 6.6 3.0 3.0 3.0 6.6 6.6 6.6Lane Util. Factor 1.00 1.00 1.00 1.00 1.00 1.00 1.00 0.95 1.00 1.00 0.95 1.00Frt 1.00 1.00 0.85 1.00 1.00 0.85 1.00 1.00 0.85 1.00 1.00 0.85Flt Protected 0.95 1.00 1.00 0.95 1.00 1.00 0.95 1.00 1.00 0.95 1.00 1.00Satd. Flow (prot) 1785 1921 1597 1785 1921 1597 1785 3650 1597 1785 3650 1597Flt Permitted 0.31 1.00 1.00 0.54 1.00 1.00 0.07 1.00 1.00 0.28 1.00 1.00Satd. Flow (perm) 579 1921 1597 1015 1921 1597 125 3650 1597 531 3650 1597Peak-hour factor, PHF 1.00 1.00 1.00 1.00 1.00 1.00 1.00 1.00 1.00 1.00 1.00 1.00Adj. Flow (vph) 185 175 155 630 480 15 105 915 135 10 1665 190RTOR Reduction (vph) 0 0 110 0 0 9 0 0 60 0 0 104Lane Group Flow (vph) 185 175 45 630 480 6 105 915 75 10 1665 86Turn Type Perm Perm pm+pt custom pm+pt Perm Perm PermProtected Phases 4 3 3 4 1 1 2 2Permitted Phases 4 4 3 4 4 1 2 1 2 2 2Actuated Green, G (s) 28.0 28.0 28.0 43.0 46.0 28.0 70.0 73.0 73.0 60.0 60.0 60.0Effective Green, g (s) 28.0 28.0 28.0 43.0 46.0 28.0 70.0 73.0 73.0 60.0 60.0 60.0Actuated g/C Ratio 0.21 0.21 0.21 0.33 0.35 0.21 0.53 0.55 0.55 0.45 0.45 0.45Clearance Time (s) 6.6 6.6 6.6 3.0 6.6 3.0 6.6 6.6 6.6Vehicle Extension (s) 5.0 5.0 5.0 5.0 5.0 5.0 5.0 5.0 5.0Lane Grp Cap (vph) 123 407 338 418 668 338 192 2016 882 241 1657 725v/s Ratio Prot 0.09 c0.17 0.25 c0.04 0.25 c0.46v/s Ratio Perm 0.32 0.03 c0.32 0.00 0.25 0.05 0.02 0.05v/c Ratio 1.50 0.43 0.13 1.51 0.72 0.02 0.55 0.45 0.08 0.04 1.00 0.12Uniform Delay, d1 52.1 45.2 42.2 42.9 37.5 41.2 28.1 17.7 13.9 20.1 36.1 20.8Progression Factor 1.00 1.00 1.00 1.00 1.00 1.00 1.00 1.00 1.00 1.00 1.00 1.00Incremental Delay, d2 264.3 1.5 0.4 240.4 4.6 0.0 5.5 0.3 0.1 0.3 23.3 0.3Delay (s) 316.4 46.7 42.6 283.3 42.1 41.2 33.6 18.0 14.0 20.4 59.4 21.2Level of Service F D D F D D C B B C E CApproach Delay (s) 142.4 177.1 19.0 55.3Approach LOS F F B E
Intersection SummaryHCM Average Control Delay 85.3 HCM Level of Service FHCM Volume to Capacity ratio 1.12Actuated Cycle Length (s) 132.2 Sum of lost time (s) 15.6Intersection Capacity Utilization 114.4% ICU Level of Service HAnalysis Period (min) 15c Critical Lane Group

Timing Report, Sorted By Phase Existing Conditions17: Mayfield Road & Queen Street South Weekday AM Peak Hour
Canadian Tire Bolton Warehouse Synchro 7 - ReportBA Consulting Group Page 11
Phase Number 1 2 3 4Movement NBTL NBSB WBTL EBWBLead/Lag Lead Lag Lead LagLead-Lag Optimize Yes Yes Yes YesRecall Mode None C-Max None NoneMaximum Split (s) 13 66.6 18 34.6Maximum Split (%) 9.8% 50.4% 13.6% 26.2%Minimum Split (s) 9 26.6 8 23.6Yellow Time (s) 3 4.6 3 4.6All-Red Time (s) 0 2 0 2Minimum Initial (s) 5 20 5 12Vehicle Extension (s) 5 5 5 5Minimum Gap (s) 3 3 3 3Time Before Reduce (s) 0 0 0 0Time To Reduce (s) 0 0 0 0Walk Time (s) 5 5Flash Dont Walk (s) 11 12Dual Entry No Yes Yes YesInhibit Max Yes Yes Yes YesStart Time (s) 119.2 0 66.6 84.6End Time (s) 0 66.6 84.6 119.2Yield/Force Off (s) 129.2 60 81.6 112.6Yield/Force Off 170(s) 129.2 49 81.6 100.6Local Start Time (s) 119.2 0 66.6 84.6Local Yield (s) 129.2 60 81.6 112.6Local Yield 170(s) 129.2 49 81.6 100.6
Intersection SummaryCycle Length 132.2Control Type Actuated-CoordinatedNatural Cycle 140Offset: 0 (0%), Referenced to phase 2:NBSB, Start of Green
Splits and Phases: 17: Mayfield Road & Queen Street South
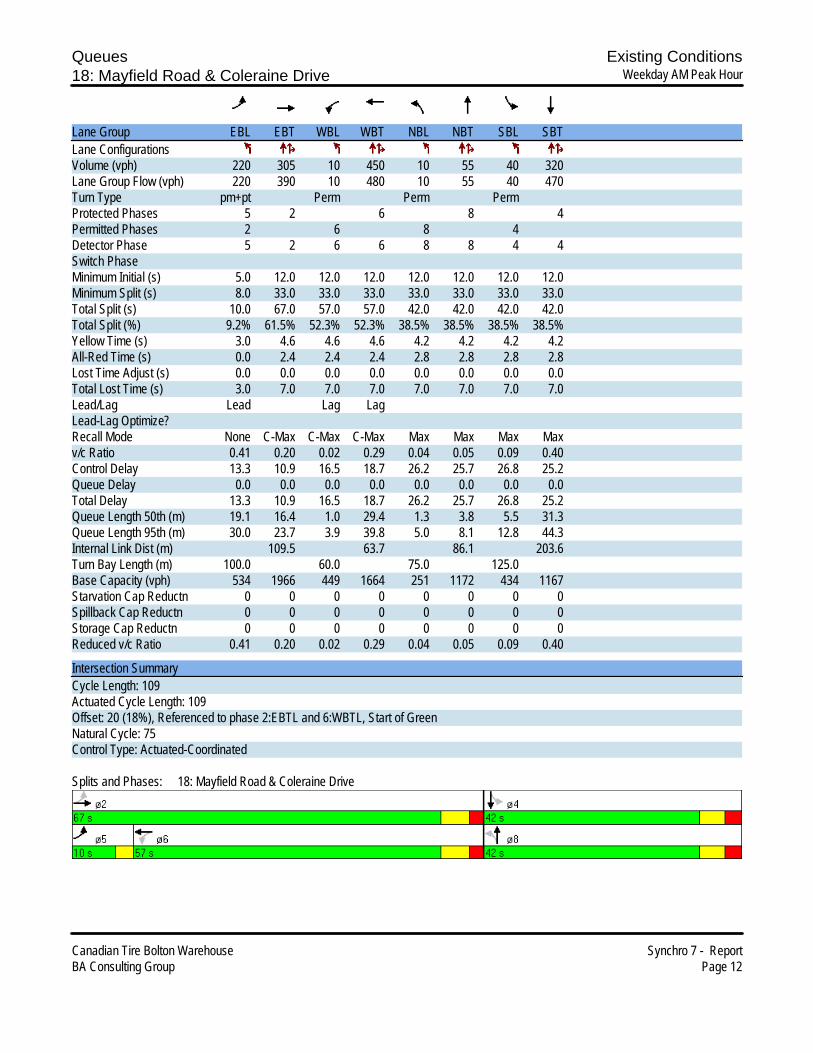
Queues Existing Conditions18: Mayfield Road & Coleraine Drive Weekday AM Peak Hour
Canadian Tire Bolton Warehouse Synchro 7 - ReportBA Consulting Group Page 12
Lane Group EBL EBT WBL WBT NBL NBT SBL SBTLane ConfigurationsVolume (vph) 220 305 10 450 10 55 40 320Lane Group Flow (vph) 220 390 10 480 10 55 40 470Turn Type pm+pt Perm Perm PermProtected Phases 5 2 6 8 4Permitted Phases 2 6 8 4Detector Phase 5 2 6 6 8 8 4 4Switch PhaseMinimum Initial (s) 5.0 12.0 12.0 12.0 12.0 12.0 12.0 12.0Minimum Split (s) 8.0 33.0 33.0 33.0 33.0 33.0 33.0 33.0Total Split (s) 10.0 67.0 57.0 57.0 42.0 42.0 42.0 42.0Total Split (%) 9.2% 61.5% 52.3% 52.3% 38.5% 38.5% 38.5% 38.5%Yellow Time (s) 3.0 4.6 4.6 4.6 4.2 4.2 4.2 4.2All-Red Time (s) 0.0 2.4 2.4 2.4 2.8 2.8 2.8 2.8Lost Time Adjust (s) 0.0 0.0 0.0 0.0 0.0 0.0 0.0 0.0Total Lost Time (s) 3.0 7.0 7.0 7.0 7.0 7.0 7.0 7.0Lead/Lag Lead Lag LagLead-Lag Optimize?Recall Mode None C-Max C-Max C-Max Max Max Max Maxv/c Ratio 0.41 0.20 0.02 0.29 0.04 0.05 0.09 0.40Control Delay 13.3 10.9 16.5 18.7 26.2 25.7 26.8 25.2Queue Delay 0.0 0.0 0.0 0.0 0.0 0.0 0.0 0.0Total Delay 13.3 10.9 16.5 18.7 26.2 25.7 26.8 25.2Queue Length 50th (m) 19.1 16.4 1.0 29.4 1.3 3.8 5.5 31.3Queue Length 95th (m) 30.0 23.7 3.9 39.8 5.0 8.1 12.8 44.3Internal Link Dist (m) 109.5 63.7 86.1 203.6Turn Bay Length (m) 100.0 60.0 75.0 125.0Base Capacity (vph) 534 1966 449 1664 251 1172 434 1167Starvation Cap Reductn 0 0 0 0 0 0 0 0Spillback Cap Reductn 0 0 0 0 0 0 0 0Storage Cap Reductn 0 0 0 0 0 0 0 0Reduced v/c Ratio 0.41 0.20 0.02 0.29 0.04 0.05 0.09 0.40
Intersection SummaryCycle Length: 109Actuated Cycle Length: 109Offset: 20 (18%), Referenced to phase 2:EBTL and 6:WBTL, Start of GreenNatural Cycle: 75Control Type: Actuated-Coordinated
Splits and Phases: 18: Mayfield Road & Coleraine Drive
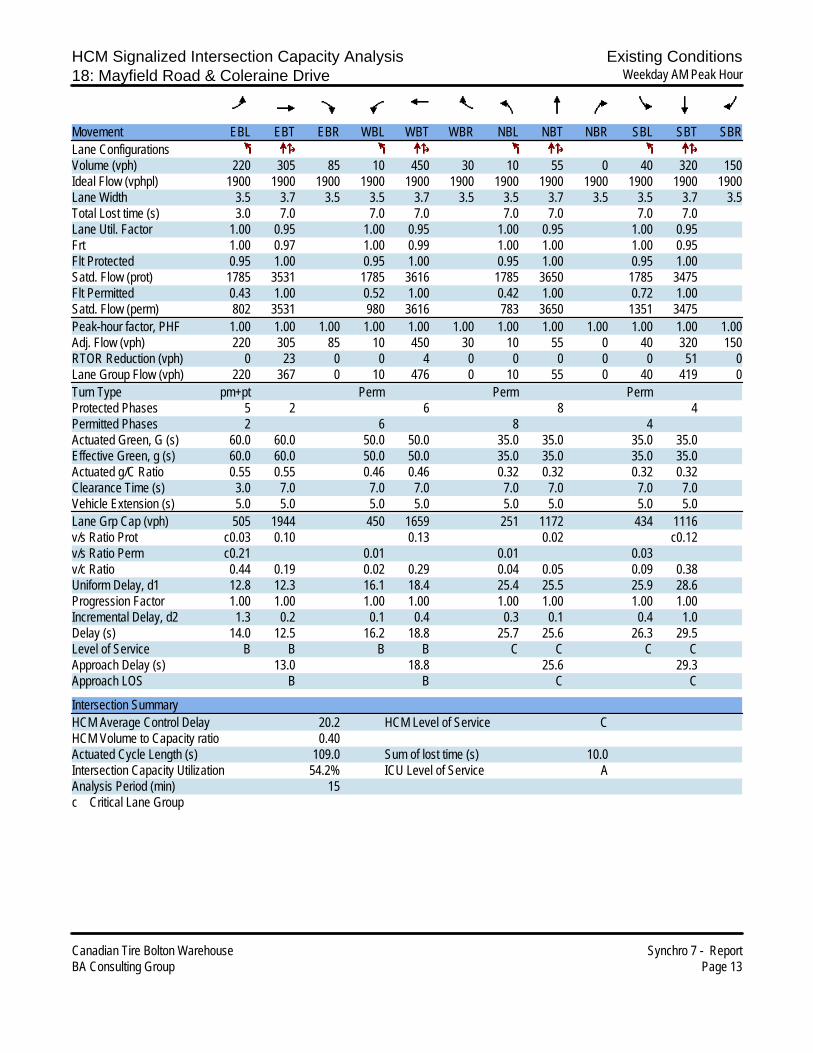
HCM Signalized Intersection Capacity Analysis Existing Conditions18: Mayfield Road & Coleraine Drive Weekday AM Peak Hour
Canadian Tire Bolton Warehouse Synchro 7 - ReportBA Consulting Group Page 13
Movement EBL EBT EBR WBL WBT WBR NBL NBT NBR SBL SBT SBRLane ConfigurationsVolume (vph) 220 305 85 10 450 30 10 55 0 40 320 150Ideal Flow (vphpl) 1900 1900 1900 1900 1900 1900 1900 1900 1900 1900 1900 1900Lane Width 3.5 3.7 3.5 3.5 3.7 3.5 3.5 3.7 3.5 3.5 3.7 3.5Total Lost time (s) 3.0 7.0 7.0 7.0 7.0 7.0 7.0 7.0Lane Util. Factor 1.00 0.95 1.00 0.95 1.00 0.95 1.00 0.95Frt 1.00 0.97 1.00 0.99 1.00 1.00 1.00 0.95Flt Protected 0.95 1.00 0.95 1.00 0.95 1.00 0.95 1.00Satd. Flow (prot) 1785 3531 1785 3616 1785 3650 1785 3475Flt Permitted 0.43 1.00 0.52 1.00 0.42 1.00 0.72 1.00Satd. Flow (perm) 802 3531 980 3616 783 3650 1351 3475Peak-hour factor, PHF 1.00 1.00 1.00 1.00 1.00 1.00 1.00 1.00 1.00 1.00 1.00 1.00Adj. Flow (vph) 220 305 85 10 450 30 10 55 0 40 320 150RTOR Reduction (vph) 0 23 0 0 4 0 0 0 0 0 51 0Lane Group Flow (vph) 220 367 0 10 476 0 10 55 0 40 419 0Turn Type pm+pt Perm Perm PermProtected Phases 5 2 6 8 4Permitted Phases 2 6 8 4Actuated Green, G (s) 60.0 60.0 50.0 50.0 35.0 35.0 35.0 35.0Effective Green, g (s) 60.0 60.0 50.0 50.0 35.0 35.0 35.0 35.0Actuated g/C Ratio 0.55 0.55 0.46 0.46 0.32 0.32 0.32 0.32Clearance Time (s) 3.0 7.0 7.0 7.0 7.0 7.0 7.0 7.0Vehicle Extension (s) 5.0 5.0 5.0 5.0 5.0 5.0 5.0 5.0Lane Grp Cap (vph) 505 1944 450 1659 251 1172 434 1116v/s Ratio Prot c0.03 0.10 0.13 0.02 c0.12v/s Ratio Perm c0.21 0.01 0.01 0.03v/c Ratio 0.44 0.19 0.02 0.29 0.04 0.05 0.09 0.38Uniform Delay, d1 12.8 12.3 16.1 18.4 25.4 25.5 25.9 28.6Progression Factor 1.00 1.00 1.00 1.00 1.00 1.00 1.00 1.00Incremental Delay, d2 1.3 0.2 0.1 0.4 0.3 0.1 0.4 1.0Delay (s) 14.0 12.5 16.2 18.8 25.7 25.6 26.3 29.5Level of Service B B B B C C C CApproach Delay (s) 13.0 18.8 25.6 29.3Approach LOS B B C C
Intersection SummaryHCM Average Control Delay 20.2 HCM Level of Service CHCM Volume to Capacity ratio 0.40Actuated Cycle Length (s) 109.0 Sum of lost time (s) 10.0Intersection Capacity Utilization 54.2% ICU Level of Service AAnalysis Period (min) 15c Critical Lane Group

Timing Report, Sorted By Phase Existing Conditions18: Mayfield Road & Coleraine Drive Weekday AM Peak Hour
Canadian Tire Bolton Warehouse Synchro 7 - ReportBA Consulting Group Page 14
Phase Number 2 4 5 6 8Movement EBTL SBTL EBL WBTL NBTLLead/Lag Lead LagLead-Lag OptimizeRecall Mode C-Max Max None C-Max MaxMaximum Split (s) 67 42 10 57 42Maximum Split (%) 61.5% 38.5% 9.2% 52.3% 38.5%Minimum Split (s) 33 33 8 33 33Yellow Time (s) 4.6 4.2 3 4.6 4.2All-Red Time (s) 2.4 2.8 0 2.4 2.8Minimum Initial (s) 12 12 5 12 12Vehicle Extension (s) 5 5 5 5 5Minimum Gap (s) 3 3 3 3 3Time Before Reduce (s) 0 0 0 0 0Time To Reduce (s) 0 0 0 0 0Walk Time (s) 5 5 5 5Flash Dont Walk (s) 21 21 21 21Dual Entry Yes Yes No Yes YesInhibit Max Yes Yes Yes Yes YesStart Time (s) 10 77 10 20 77End Time (s) 77 10 20 77 10Yield/Force Off (s) 70 3 17 70 3Yield/Force Off 170(s) 49 91 17 49 91Local Start Time (s) 99 57 99 0 57Local Yield (s) 50 92 106 50 92Local Yield 170(s) 29 71 106 29 71
Intersection SummaryCycle Length 109Control Type Actuated-CoordinatedNatural Cycle 75Offset: 20 (18%), Referenced to phase 2:EBTL and 6:WBTL, Start of Green
Splits and Phases: 18: Mayfield Road & Coleraine Drive

HCM Unsignalized Intersection Capacity Analysis Existing Conditions20: Mayfield Road & Humber Station Road Weekday AM Peak Hour
Canadian Tire Bolton Warehouse Synchro 7 - ReportBA Consulting Group Page 15
Movement EBL EBT EBR WBL WBT WBR NBL NBT NBR SBL SBT SBRLane ConfigurationsVolume (veh/h) 15 660 10 5 630 10 0 0 10 15 40 30Sign Control Free Free Stop StopGrade 0% 0% 0% 0%Peak Hour Factor 1.00 1.00 1.00 1.00 1.00 1.00 1.00 1.00 1.00 1.00 1.00 1.00Hourly flow rate (vph) 15 660 10 5 630 10 0 0 10 15 40 30PedestriansLane Width (m)Walking Speed (m/s)Percent BlockageRight turn flare (veh)Median type None NoneMedian storage veh)Upstream signal (m)pX, platoon unblockedvC, conflicting volume 640 670 1390 1345 665 1350 1345 635vC1, stage 1 conf volvC2, stage 2 conf volvCu, unblocked vol 640 670 1390 1345 665 1350 1345 635tC, single (s) 4.1 4.1 7.1 6.5 6.2 7.1 6.5 6.2tC, 2 stage (s)tF (s) 2.2 2.2 3.5 4.0 3.3 3.5 4.0 3.3p0 queue free % 98 99 100 100 98 88 73 94cM capacity (veh/h) 954 930 89 150 464 124 150 482
Direction, Lane # EB 1 WB 1 NB 1 SB 1Volume Total 685 645 10 85Volume Left 15 5 0 15Volume Right 10 10 10 30cSH 954 930 464 189Volume to Capacity 0.02 0.01 0.02 0.45Queue Length 95th (m) 0.3 0.1 0.5 14.8Control Delay (s) 0.4 0.1 12.9 38.8Lane LOS A A B EApproach Delay (s) 0.4 0.1 12.9 38.8Approach LOS B E
Intersection SummaryAverage Delay 2.7Intersection Capacity Utilization 63.3% ICU Level of Service BAnalysis Period (min) 15
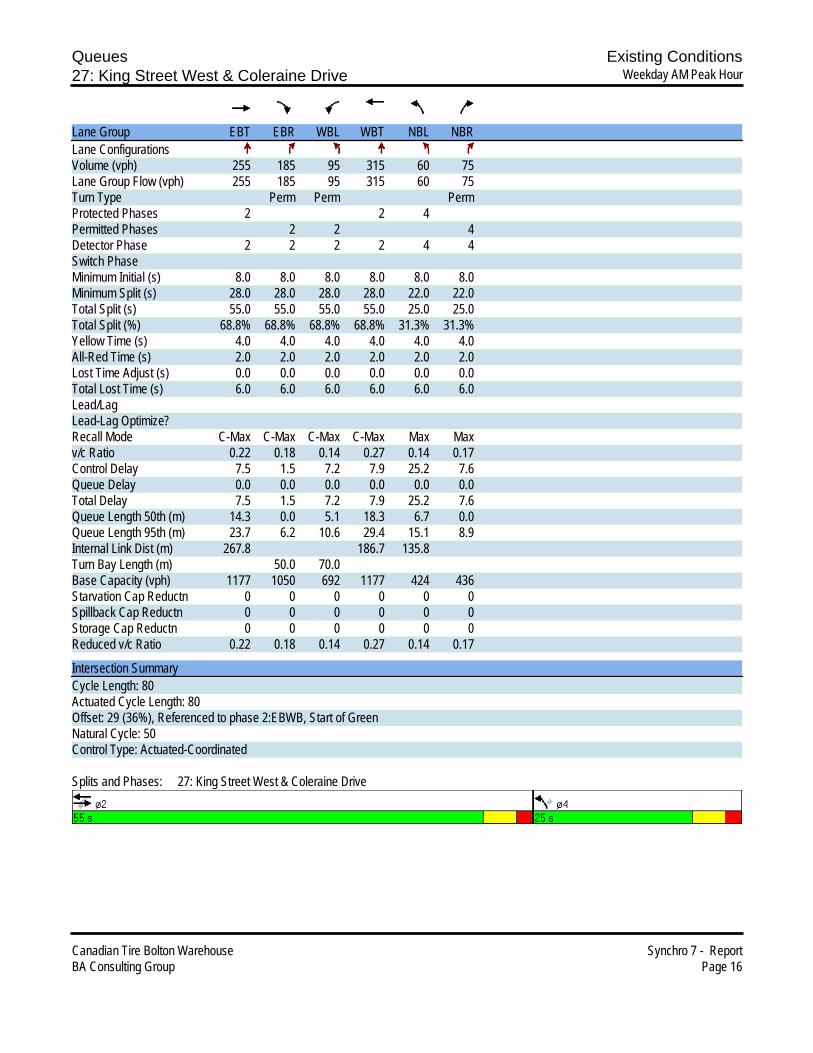
Queues Existing Conditions27: King Street West & Coleraine Drive Weekday AM Peak Hour
Canadian Tire Bolton Warehouse Synchro 7 - ReportBA Consulting Group Page 16
Lane Group EBT EBR WBL WBT NBL NBRLane ConfigurationsVolume (vph) 255 185 95 315 60 75Lane Group Flow (vph) 255 185 95 315 60 75Turn Type Perm Perm PermProtected Phases 2 2 4Permitted Phases 2 2 4Detector Phase 2 2 2 2 4 4Switch PhaseMinimum Initial (s) 8.0 8.0 8.0 8.0 8.0 8.0Minimum Split (s) 28.0 28.0 28.0 28.0 22.0 22.0Total Split (s) 55.0 55.0 55.0 55.0 25.0 25.0Total Split (%) 68.8% 68.8% 68.8% 68.8% 31.3% 31.3%Yellow Time (s) 4.0 4.0 4.0 4.0 4.0 4.0All-Red Time (s) 2.0 2.0 2.0 2.0 2.0 2.0Lost Time Adjust (s) 0.0 0.0 0.0 0.0 0.0 0.0Total Lost Time (s) 6.0 6.0 6.0 6.0 6.0 6.0Lead/LagLead-Lag Optimize?Recall Mode C-Max C-Max C-Max C-Max Max Maxv/c Ratio 0.22 0.18 0.14 0.27 0.14 0.17Control Delay 7.5 1.5 7.2 7.9 25.2 7.6Queue Delay 0.0 0.0 0.0 0.0 0.0 0.0Total Delay 7.5 1.5 7.2 7.9 25.2 7.6Queue Length 50th (m) 14.3 0.0 5.1 18.3 6.7 0.0Queue Length 95th (m) 23.7 6.2 10.6 29.4 15.1 8.9Internal Link Dist (m) 267.8 186.7 135.8Turn Bay Length (m) 50.0 70.0Base Capacity (vph) 1177 1050 692 1177 424 436Starvation Cap Reductn 0 0 0 0 0 0Spillback Cap Reductn 0 0 0 0 0 0Storage Cap Reductn 0 0 0 0 0 0Reduced v/c Ratio 0.22 0.18 0.14 0.27 0.14 0.17
Intersection SummaryCycle Length: 80Actuated Cycle Length: 80Offset: 29 (36%), Referenced to phase 2:EBWB, Start of GreenNatural Cycle: 50Control Type: Actuated-Coordinated
Splits and Phases: 27: King Street West & Coleraine Drive
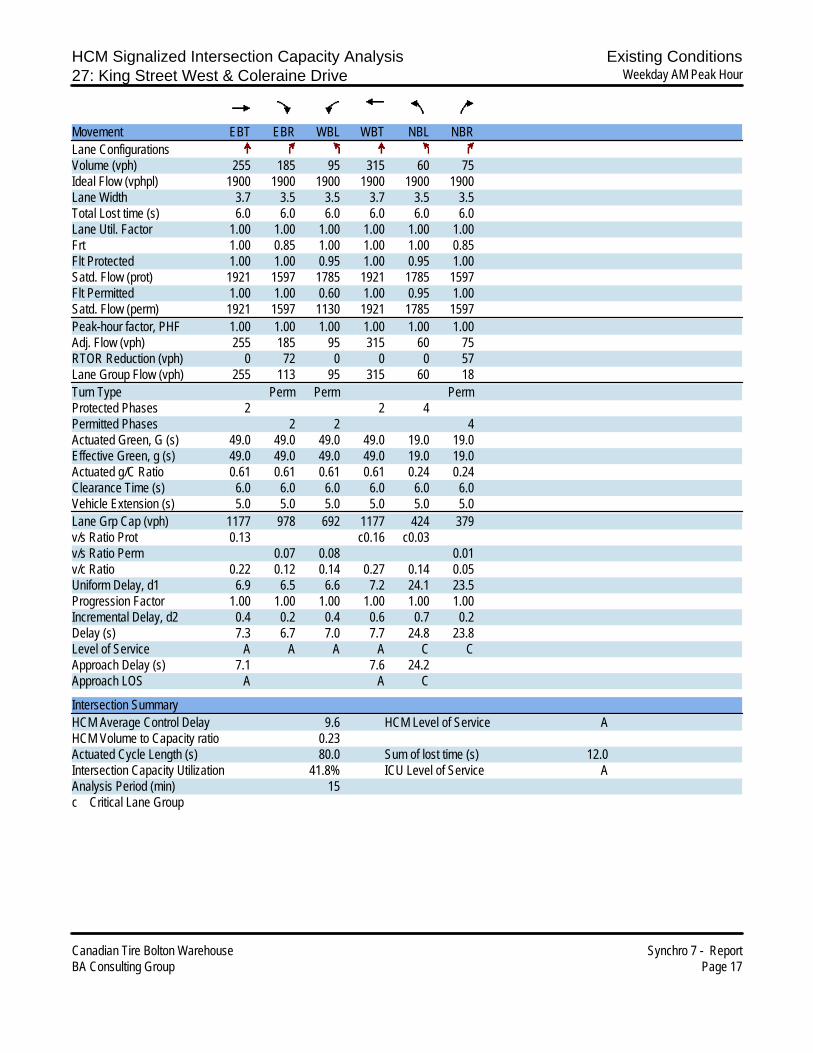
HCM Signalized Intersection Capacity Analysis Existing Conditions27: King Street West & Coleraine Drive Weekday AM Peak Hour
Canadian Tire Bolton Warehouse Synchro 7 - ReportBA Consulting Group Page 17
Movement EBT EBR WBL WBT NBL NBRLane ConfigurationsVolume (vph) 255 185 95 315 60 75Ideal Flow (vphpl) 1900 1900 1900 1900 1900 1900Lane Width 3.7 3.5 3.5 3.7 3.5 3.5Total Lost time (s) 6.0 6.0 6.0 6.0 6.0 6.0Lane Util. Factor 1.00 1.00 1.00 1.00 1.00 1.00Frt 1.00 0.85 1.00 1.00 1.00 0.85Flt Protected 1.00 1.00 0.95 1.00 0.95 1.00Satd. Flow (prot) 1921 1597 1785 1921 1785 1597Flt Permitted 1.00 1.00 0.60 1.00 0.95 1.00Satd. Flow (perm) 1921 1597 1130 1921 1785 1597Peak-hour factor, PHF 1.00 1.00 1.00 1.00 1.00 1.00Adj. Flow (vph) 255 185 95 315 60 75RTOR Reduction (vph) 0 72 0 0 0 57Lane Group Flow (vph) 255 113 95 315 60 18Turn Type Perm Perm PermProtected Phases 2 2 4Permitted Phases 2 2 4Actuated Green, G (s) 49.0 49.0 49.0 49.0 19.0 19.0Effective Green, g (s) 49.0 49.0 49.0 49.0 19.0 19.0Actuated g/C Ratio 0.61 0.61 0.61 0.61 0.24 0.24Clearance Time (s) 6.0 6.0 6.0 6.0 6.0 6.0Vehicle Extension (s) 5.0 5.0 5.0 5.0 5.0 5.0Lane Grp Cap (vph) 1177 978 692 1177 424 379v/s Ratio Prot 0.13 c0.16 c0.03v/s Ratio Perm 0.07 0.08 0.01v/c Ratio 0.22 0.12 0.14 0.27 0.14 0.05Uniform Delay, d1 6.9 6.5 6.6 7.2 24.1 23.5Progression Factor 1.00 1.00 1.00 1.00 1.00 1.00Incremental Delay, d2 0.4 0.2 0.4 0.6 0.7 0.2Delay (s) 7.3 6.7 7.0 7.7 24.8 23.8Level of Service A A A A C CApproach Delay (s) 7.1 7.6 24.2Approach LOS A A C
Intersection SummaryHCM Average Control Delay 9.6 HCM Level of Service AHCM Volume to Capacity ratio 0.23Actuated Cycle Length (s) 80.0 Sum of lost time (s) 12.0Intersection Capacity Utilization 41.8% ICU Level of Service AAnalysis Period (min) 15c Critical Lane Group
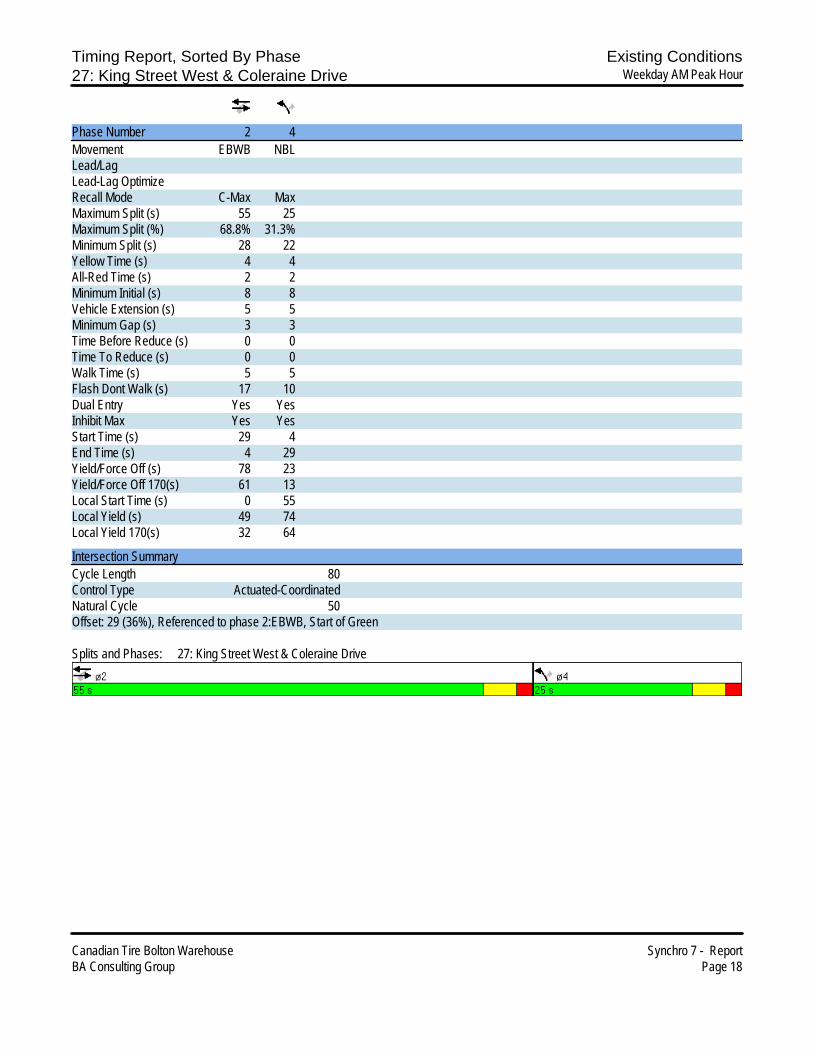
Timing Report, Sorted By Phase Existing Conditions27: King Street West & Coleraine Drive Weekday AM Peak Hour
Canadian Tire Bolton Warehouse Synchro 7 - ReportBA Consulting Group Page 18
Phase Number 2 4Movement EBWB NBLLead/LagLead-Lag OptimizeRecall Mode C-Max MaxMaximum Split (s) 55 25Maximum Split (%) 68.8% 31.3%Minimum Split (s) 28 22Yellow Time (s) 4 4All-Red Time (s) 2 2Minimum Initial (s) 8 8Vehicle Extension (s) 5 5Minimum Gap (s) 3 3Time Before Reduce (s) 0 0Time To Reduce (s) 0 0Walk Time (s) 5 5Flash Dont Walk (s) 17 10Dual Entry Yes YesInhibit Max Yes YesStart Time (s) 29 4End Time (s) 4 29Yield/Force Off (s) 78 23Yield/Force Off 170(s) 61 13Local Start Time (s) 0 55Local Yield (s) 49 74Local Yield 170(s) 32 64
Intersection SummaryCycle Length 80Control Type Actuated-CoordinatedNatural Cycle 50Offset: 29 (36%), Referenced to phase 2:EBWB, Start of Green
Splits and Phases: 27: King Street West & Coleraine Drive
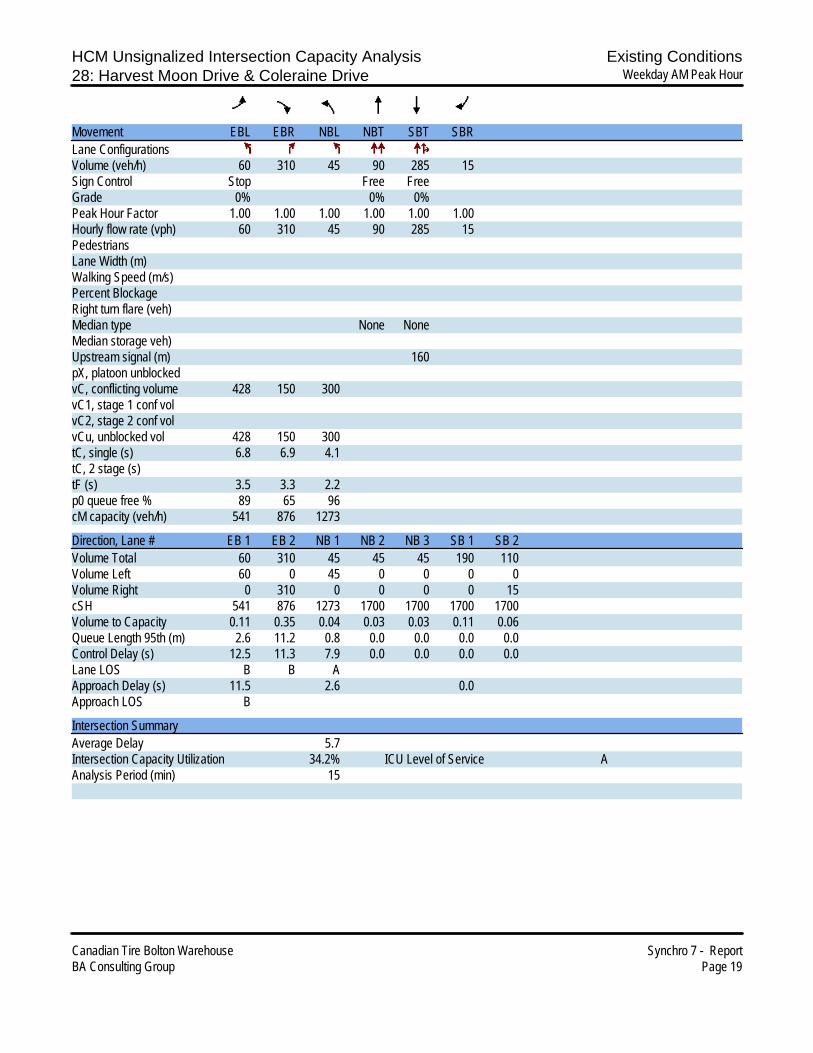
HCM Unsignalized Intersection Capacity Analysis Existing Conditions28: Harvest Moon Drive & Coleraine Drive Weekday AM Peak Hour
Canadian Tire Bolton Warehouse Synchro 7 - ReportBA Consulting Group Page 19
Movement EBL EBR NBL NBT SBT SBRLane ConfigurationsVolume (veh/h) 60 310 45 90 285 15Sign Control Stop Free FreeGrade 0% 0% 0%Peak Hour Factor 1.00 1.00 1.00 1.00 1.00 1.00Hourly flow rate (vph) 60 310 45 90 285 15PedestriansLane Width (m)Walking Speed (m/s)Percent BlockageRight turn flare (veh)Median type None NoneMedian storage veh)Upstream signal (m) 160pX, platoon unblockedvC, conflicting volume 428 150 300vC1, stage 1 conf volvC2, stage 2 conf volvCu, unblocked vol 428 150 300tC, single (s) 6.8 6.9 4.1tC, 2 stage (s)tF (s) 3.5 3.3 2.2p0 queue free % 89 65 96cM capacity (veh/h) 541 876 1273
Direction, Lane # EB 1 EB 2 NB 1 NB 2 NB 3 SB 1 SB 2Volume Total 60 310 45 45 45 190 110Volume Left 60 0 45 0 0 0 0Volume Right 0 310 0 0 0 0 15cSH 541 876 1273 1700 1700 1700 1700Volume to Capacity 0.11 0.35 0.04 0.03 0.03 0.11 0.06Queue Length 95th (m) 2.6 11.2 0.8 0.0 0.0 0.0 0.0Control Delay (s) 12.5 11.3 7.9 0.0 0.0 0.0 0.0Lane LOS B B AApproach Delay (s) 11.5 2.6 0.0Approach LOS B
Intersection SummaryAverage Delay 5.7Intersection Capacity Utilization 34.2% ICU Level of Service AAnalysis Period (min) 15
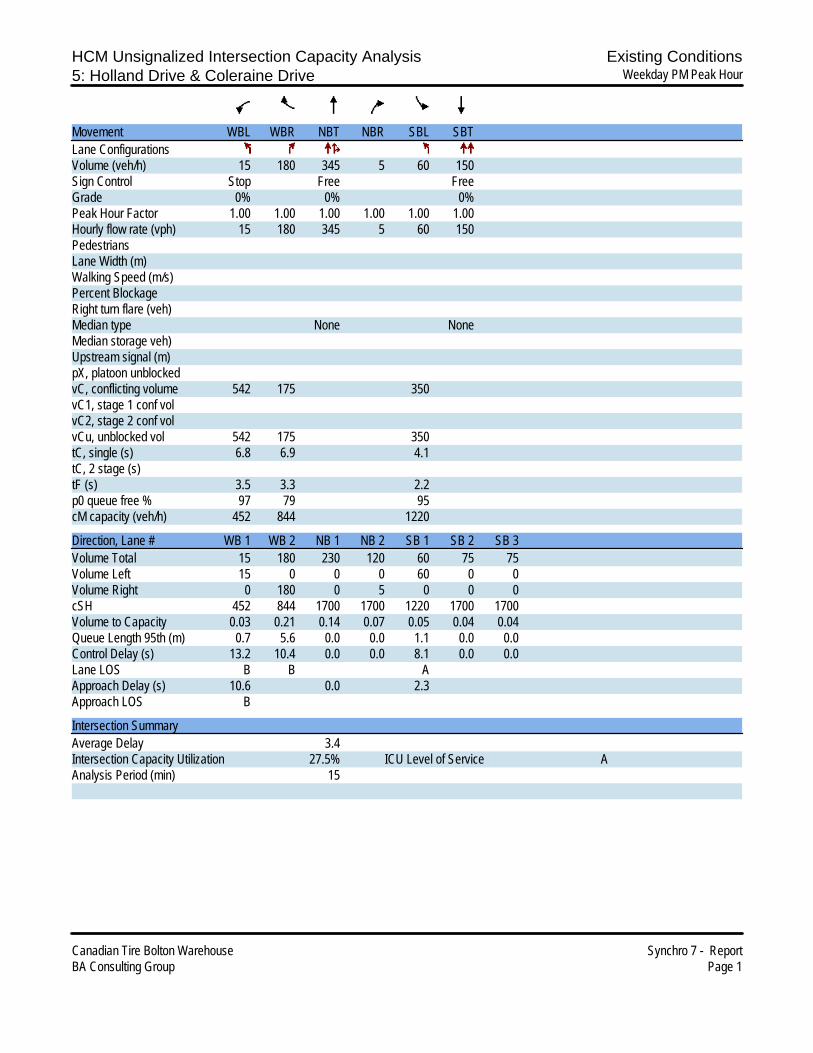
HCM Unsignalized Intersection Capacity Analysis Existing Conditions5: Holland Drive & Coleraine Drive Weekday PM Peak Hour
Canadian Tire Bolton Warehouse Synchro 7 - ReportBA Consulting Group Page 1
Movement WBL WBR NBT NBR SBL SBTLane ConfigurationsVolume (veh/h) 15 180 345 5 60 150Sign Control Stop Free FreeGrade 0% 0% 0%Peak Hour Factor 1.00 1.00 1.00 1.00 1.00 1.00Hourly flow rate (vph) 15 180 345 5 60 150PedestriansLane Width (m)Walking Speed (m/s)Percent BlockageRight turn flare (veh)Median type None NoneMedian storage veh)Upstream signal (m)pX, platoon unblockedvC, conflicting volume 542 175 350vC1, stage 1 conf volvC2, stage 2 conf volvCu, unblocked vol 542 175 350tC, single (s) 6.8 6.9 4.1tC, 2 stage (s)tF (s) 3.5 3.3 2.2p0 queue free % 97 79 95cM capacity (veh/h) 452 844 1220
Direction, Lane # WB 1 WB 2 NB 1 NB 2 SB 1 SB 2 SB 3Volume Total 15 180 230 120 60 75 75Volume Left 15 0 0 0 60 0 0Volume Right 0 180 0 5 0 0 0cSH 452 844 1700 1700 1220 1700 1700Volume to Capacity 0.03 0.21 0.14 0.07 0.05 0.04 0.04Queue Length 95th (m) 0.7 5.6 0.0 0.0 1.1 0.0 0.0Control Delay (s) 13.2 10.4 0.0 0.0 8.1 0.0 0.0Lane LOS B B AApproach Delay (s) 10.6 0.0 2.3Approach LOS B
Intersection SummaryAverage Delay 3.4Intersection Capacity Utilization 27.5% ICU Level of Service AAnalysis Period (min) 15
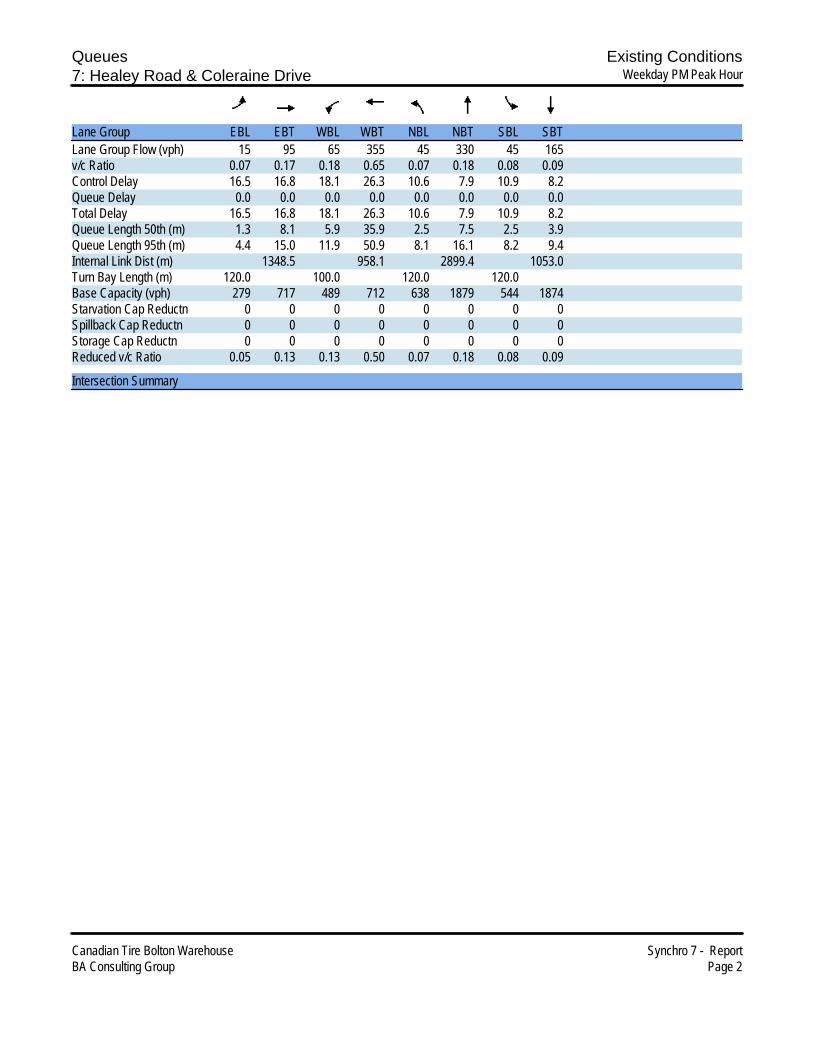
Queues Existing Conditions7: Healey Road & Coleraine Drive Weekday PM Peak Hour
Canadian Tire Bolton Warehouse Synchro 7 - ReportBA Consulting Group Page 2
Lane Group EBL EBT WBL WBT NBL NBT SBL SBTLane Group Flow (vph) 15 95 65 355 45 330 45 165v/c Ratio 0.07 0.17 0.18 0.65 0.07 0.18 0.08 0.09Control Delay 16.5 16.8 18.1 26.3 10.6 7.9 10.9 8.2Queue Delay 0.0 0.0 0.0 0.0 0.0 0.0 0.0 0.0Total Delay 16.5 16.8 18.1 26.3 10.6 7.9 10.9 8.2Queue Length 50th (m) 1.3 8.1 5.9 35.9 2.5 7.5 2.5 3.9Queue Length 95th (m) 4.4 15.0 11.9 50.9 8.1 16.1 8.2 9.4Internal Link Dist (m) 1348.5 958.1 2899.4 1053.0Turn Bay Length (m) 120.0 100.0 120.0 120.0Base Capacity (vph) 279 717 489 712 638 1879 544 1874Starvation Cap Reductn 0 0 0 0 0 0 0 0Spillback Cap Reductn 0 0 0 0 0 0 0 0Storage Cap Reductn 0 0 0 0 0 0 0 0Reduced v/c Ratio 0.05 0.13 0.13 0.50 0.07 0.18 0.08 0.09
Intersection Summary

HCM Signalized Intersection Capacity Analysis Existing Conditions7: Healey Road & Coleraine Drive Weekday PM Peak Hour
Canadian Tire Bolton Warehouse Synchro 7 - ReportBA Consulting Group Page 3
Movement EBL EBT EBR WBL WBT WBR NBL NBT NBR SBL SBT SBRLane ConfigurationsVolume (vph) 15 90 5 65 300 55 45 250 80 45 135 30Ideal Flow (vphpl) 1900 1900 1900 1900 1900 1900 1900 1900 1900 1900 1900 1900Lane Width 3.5 3.7 3.5 3.5 3.7 3.5 3.5 3.7 3.5 3.5 3.7 3.5Total Lost time (s) 6.8 6.8 6.8 6.8 6.7 6.7 6.7 6.7Lane Util. Factor 1.00 1.00 1.00 1.00 1.00 0.95 1.00 0.95Frt 1.00 0.99 1.00 0.98 1.00 0.96 1.00 0.97Flt Protected 0.95 1.00 0.95 1.00 0.95 1.00 0.95 1.00Satd. Flow (prot) 1785 1906 1785 1876 1785 3517 1785 3551Flt Permitted 0.40 1.00 0.70 1.00 0.65 1.00 0.55 1.00Satd. Flow (perm) 746 1906 1307 1876 1217 3517 1038 3551Peak-hour factor, PHF 1.00 1.00 1.00 1.00 1.00 1.00 1.00 1.00 1.00 1.00 1.00 1.00Adj. Flow (vph) 15 90 5 65 300 55 45 250 80 45 135 30RTOR Reduction (vph) 0 4 0 0 11 0 0 37 0 0 14 0Lane Group Flow (vph) 15 91 0 65 344 0 45 293 0 45 151 0Turn Type Perm Perm Perm PermProtected Phases 8 4 6 2Permitted Phases 8 4 6 2Actuated Green, G (s) 19.9 19.9 19.9 19.9 36.6 36.6 36.6 36.6Effective Green, g (s) 19.9 19.9 19.9 19.9 36.6 36.6 36.6 36.6Actuated g/C Ratio 0.28 0.28 0.28 0.28 0.52 0.52 0.52 0.52Clearance Time (s) 6.8 6.8 6.8 6.8 6.7 6.7 6.7 6.7Vehicle Extension (s) 5.0 5.0 5.0 5.0 5.0 5.0 5.0 5.0Lane Grp Cap (vph) 212 542 372 533 636 1839 543 1857v/s Ratio Prot 0.05 c0.18 c0.08 0.04v/s Ratio Perm 0.02 0.05 0.04 0.04v/c Ratio 0.07 0.17 0.17 0.65 0.07 0.16 0.08 0.08Uniform Delay, d1 18.3 18.8 18.9 22.0 8.3 8.7 8.3 8.3Progression Factor 1.00 1.00 1.00 1.00 1.00 1.00 1.00 1.00Incremental Delay, d2 0.3 0.3 0.5 3.7 0.2 0.2 0.3 0.1Delay (s) 18.6 19.1 19.3 25.6 8.5 8.9 8.6 8.4Level of Service B B B C A A A AApproach Delay (s) 19.1 24.6 8.8 8.5Approach LOS B C A A
Intersection SummaryHCM Average Control Delay 15.7 HCM Level of Service BHCM Volume to Capacity ratio 0.33Actuated Cycle Length (s) 70.0 Sum of lost time (s) 13.5Intersection Capacity Utilization 52.1% ICU Level of Service AAnalysis Period (min) 15c Critical Lane Group

Timing Report, Sorted By Phase Existing Conditions7: Healey Road & Coleraine Drive Weekday PM Peak Hour
Canadian Tire Bolton Warehouse Synchro 7 - ReportBA Consulting Group Page 4
Phase Number 2 4 6 8Movement SBTL WBTL NBTL EBTLLead/LagLead-Lag OptimizeRecall Mode C-Max None C-Max NoneMaximum Split (s) 37 33 37 33Maximum Split (%) 52.9% 47.1% 52.9% 47.1%Minimum Split (s) 36.2 32.8 36.2 32.8Yellow Time (s) 4.6 4 4.6 4All-Red Time (s) 2.1 2.8 2.1 2.8Minimum Initial (s) 8 8 8 8Vehicle Extension (s) 5 5 5 5Minimum Gap (s) 3 3 3 3Time Before Reduce (s) 0 0 0 0Time To Reduce (s) 0 0 0 0Walk Time (s) 5 5 5 5Flash Dont Walk (s) 24.5 21 24.5 21Dual Entry Yes Yes Yes YesInhibit Max Yes Yes Yes YesStart Time (s) 37 4 37 4End Time (s) 4 37 4 37Yield/Force Off (s) 67.3 30.2 67.3 30.2Yield/Force Off 170(s) 42.8 9.2 42.8 9.2Local Start Time (s) 0 37 0 37Local Yield (s) 30.3 63.2 30.3 63.2Local Yield 170(s) 5.8 42.2 5.8 42.2
Intersection SummaryCycle Length 70Control Type Actuated-CoordinatedNatural Cycle 70Offset: 37 (53%), Referenced to phase 2:SBTL and 6:NBTL, Start of Green
Splits and Phases: 7: Healey Road & Coleraine Drive

HCM Unsignalized Intersection Capacity Analysis Existing Conditions10: Healey Road & Humber Station Road Weekday PM Peak Hour
Canadian Tire Bolton Warehouse Synchro 7 - ReportBA Consulting Group Page 5
Movement EBL EBT EBR WBL WBT WBR NBL NBT NBR SBL SBT SBRLane ConfigurationsSign Control Stop Stop Stop StopVolume (vph) 5 80 5 15 285 75 5 40 5 30 5 5Peak Hour Factor 1.00 1.00 1.00 1.00 1.00 1.00 1.00 1.00 1.00 1.00 1.00 1.00Hourly flow rate (vph) 5 80 5 15 285 75 5 40 5 30 5 5
Direction, Lane # EB 1 WB 1 NB 1 SB 1Volume Total (vph) 90 375 50 40Volume Left (vph) 5 15 5 30Volume Right (vph) 5 75 5 5Hadj (s) -0.02 -0.11 -0.04 0.08Departure Headway (s) 4.5 4.1 4.9 5.1Degree Utilization, x 0.11 0.43 0.07 0.06Capacity (veh/h) 768 848 661 640Control Delay (s) 8.1 10.2 8.3 8.4Approach Delay (s) 8.1 10.2 8.3 8.4Approach LOS A B A A
Intersection SummaryDelay 9.5HCM Level of Service AIntersection Capacity Utilization 39.9% ICU Level of Service AAnalysis Period (min) 15
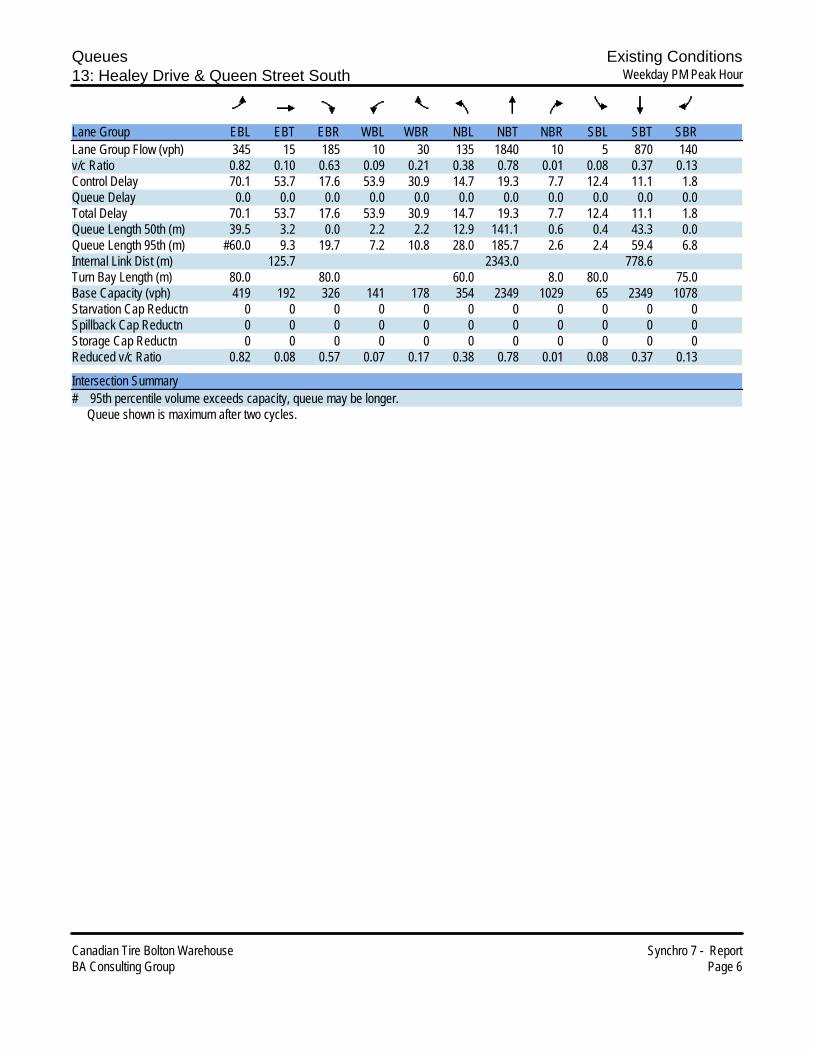
Queues Existing Conditions13: Healey Drive & Queen Street South Weekday PM Peak Hour
Canadian Tire Bolton Warehouse Synchro 7 - ReportBA Consulting Group Page 6
Lane Group EBL EBT EBR WBL WBR NBL NBT NBR SBL SBT SBRLane Group Flow (vph) 345 15 185 10 30 135 1840 10 5 870 140v/c Ratio 0.82 0.10 0.63 0.09 0.21 0.38 0.78 0.01 0.08 0.37 0.13Control Delay 70.1 53.7 17.6 53.9 30.9 14.7 19.3 7.7 12.4 11.1 1.8Queue Delay 0.0 0.0 0.0 0.0 0.0 0.0 0.0 0.0 0.0 0.0 0.0Total Delay 70.1 53.7 17.6 53.9 30.9 14.7 19.3 7.7 12.4 11.1 1.8Queue Length 50th (m) 39.5 3.2 0.0 2.2 2.2 12.9 141.1 0.6 0.4 43.3 0.0Queue Length 95th (m) #60.0 9.3 19.7 7.2 10.8 28.0 185.7 2.6 2.4 59.4 6.8Internal Link Dist (m) 125.7 2343.0 778.6Turn Bay Length (m) 80.0 80.0 60.0 8.0 80.0 75.0Base Capacity (vph) 419 192 326 141 178 354 2349 1029 65 2349 1078Starvation Cap Reductn 0 0 0 0 0 0 0 0 0 0 0Spillback Cap Reductn 0 0 0 0 0 0 0 0 0 0 0Storage Cap Reductn 0 0 0 0 0 0 0 0 0 0 0Reduced v/c Ratio 0.82 0.08 0.57 0.07 0.17 0.38 0.78 0.01 0.08 0.37 0.13
Intersection Summary# 95th percentile volume exceeds capacity, queue may be longer. Queue shown is maximum after two cycles.
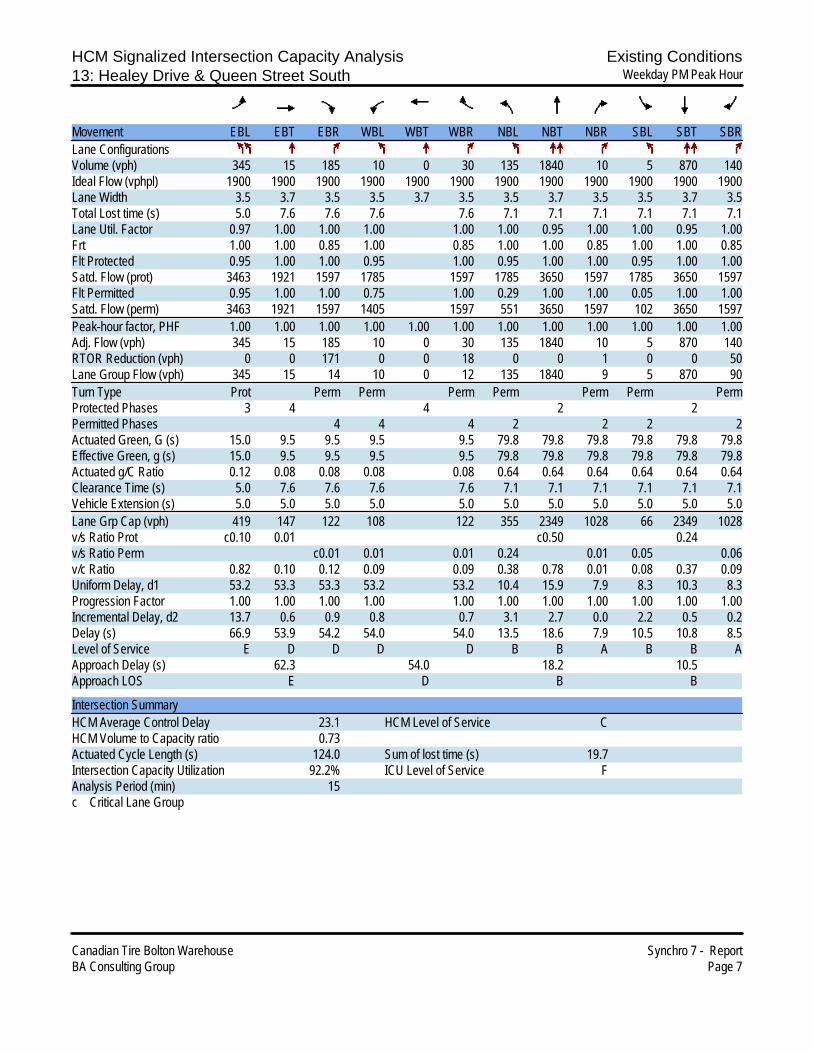
HCM Signalized Intersection Capacity Analysis Existing Conditions13: Healey Drive & Queen Street South Weekday PM Peak Hour
Canadian Tire Bolton Warehouse Synchro 7 - ReportBA Consulting Group Page 7
Movement EBL EBT EBR WBL WBT WBR NBL NBT NBR SBL SBT SBRLane ConfigurationsVolume (vph) 345 15 185 10 0 30 135 1840 10 5 870 140Ideal Flow (vphpl) 1900 1900 1900 1900 1900 1900 1900 1900 1900 1900 1900 1900Lane Width 3.5 3.7 3.5 3.5 3.7 3.5 3.5 3.7 3.5 3.5 3.7 3.5Total Lost time (s) 5.0 7.6 7.6 7.6 7.6 7.1 7.1 7.1 7.1 7.1 7.1Lane Util. Factor 0.97 1.00 1.00 1.00 1.00 1.00 0.95 1.00 1.00 0.95 1.00Frt 1.00 1.00 0.85 1.00 0.85 1.00 1.00 0.85 1.00 1.00 0.85Flt Protected 0.95 1.00 1.00 0.95 1.00 0.95 1.00 1.00 0.95 1.00 1.00Satd. Flow (prot) 3463 1921 1597 1785 1597 1785 3650 1597 1785 3650 1597Flt Permitted 0.95 1.00 1.00 0.75 1.00 0.29 1.00 1.00 0.05 1.00 1.00Satd. Flow (perm) 3463 1921 1597 1405 1597 551 3650 1597 102 3650 1597Peak-hour factor, PHF 1.00 1.00 1.00 1.00 1.00 1.00 1.00 1.00 1.00 1.00 1.00 1.00Adj. Flow (vph) 345 15 185 10 0 30 135 1840 10 5 870 140RTOR Reduction (vph) 0 0 171 0 0 18 0 0 1 0 0 50Lane Group Flow (vph) 345 15 14 10 0 12 135 1840 9 5 870 90Turn Type Prot Perm Perm Perm Perm Perm Perm PermProtected Phases 3 4 4 2 2Permitted Phases 4 4 4 2 2 2 2Actuated Green, G (s) 15.0 9.5 9.5 9.5 9.5 79.8 79.8 79.8 79.8 79.8 79.8Effective Green, g (s) 15.0 9.5 9.5 9.5 9.5 79.8 79.8 79.8 79.8 79.8 79.8Actuated g/C Ratio 0.12 0.08 0.08 0.08 0.08 0.64 0.64 0.64 0.64 0.64 0.64Clearance Time (s) 5.0 7.6 7.6 7.6 7.6 7.1 7.1 7.1 7.1 7.1 7.1Vehicle Extension (s) 5.0 5.0 5.0 5.0 5.0 5.0 5.0 5.0 5.0 5.0 5.0Lane Grp Cap (vph) 419 147 122 108 122 355 2349 1028 66 2349 1028v/s Ratio Prot c0.10 0.01 c0.50 0.24v/s Ratio Perm c0.01 0.01 0.01 0.24 0.01 0.05 0.06v/c Ratio 0.82 0.10 0.12 0.09 0.09 0.38 0.78 0.01 0.08 0.37 0.09Uniform Delay, d1 53.2 53.3 53.3 53.2 53.2 10.4 15.9 7.9 8.3 10.3 8.3Progression Factor 1.00 1.00 1.00 1.00 1.00 1.00 1.00 1.00 1.00 1.00 1.00Incremental Delay, d2 13.7 0.6 0.9 0.8 0.7 3.1 2.7 0.0 2.2 0.5 0.2Delay (s) 66.9 53.9 54.2 54.0 54.0 13.5 18.6 7.9 10.5 10.8 8.5Level of Service E D D D D B B A B B AApproach Delay (s) 62.3 54.0 18.2 10.5Approach LOS E D B B
Intersection SummaryHCM Average Control Delay 23.1 HCM Level of Service CHCM Volume to Capacity ratio 0.73Actuated Cycle Length (s) 124.0 Sum of lost time (s) 19.7Intersection Capacity Utilization 92.2% ICU Level of Service FAnalysis Period (min) 15c Critical Lane Group

Timing Report, Sorted By Phase Existing Conditions13: Healey Drive & Queen Street South Weekday PM Peak Hour
Canadian Tire Bolton Warehouse Synchro 7 - ReportBA Consulting Group Page 8
Phase Number 2 3 4Movement NBSB EBL EBWBLead/Lag Lead LagLead-Lag Optimize YesRecall Mode C-Max None NoneMaximum Split (s) 84 20 20Maximum Split (%) 67.7% 16.1% 16.1%Minimum Split (s) 34.1 13 36.6Yellow Time (s) 4 3 4All-Red Time (s) 3.1 2 3.6Minimum Initial (s) 8 8 8Vehicle Extension (s) 5 5 5Minimum Gap (s) 3 3 3Time Before Reduce (s) 0 0 0Time To Reduce (s) 0 0 0Walk Time (s) 5 5Flash Dont Walk (s) 22 24Dual Entry Yes No YesInhibit Max Yes Yes YesStart Time (s) 0 84 104End Time (s) 84 104 0Yield/Force Off (s) 76.9 99 116.4Yield/Force Off 170(s) 54.9 99 92.4Local Start Time (s) 0 84 104Local Yield (s) 76.9 99 116.4Local Yield 170(s) 54.9 99 92.4
Intersection SummaryCycle Length 124Control Type Actuated-CoordinatedNatural Cycle 115Offset: 0 (0%), Referenced to phase 2:NBSB, Start of Green
Splits and Phases: 13: Healey Drive & Queen Street South
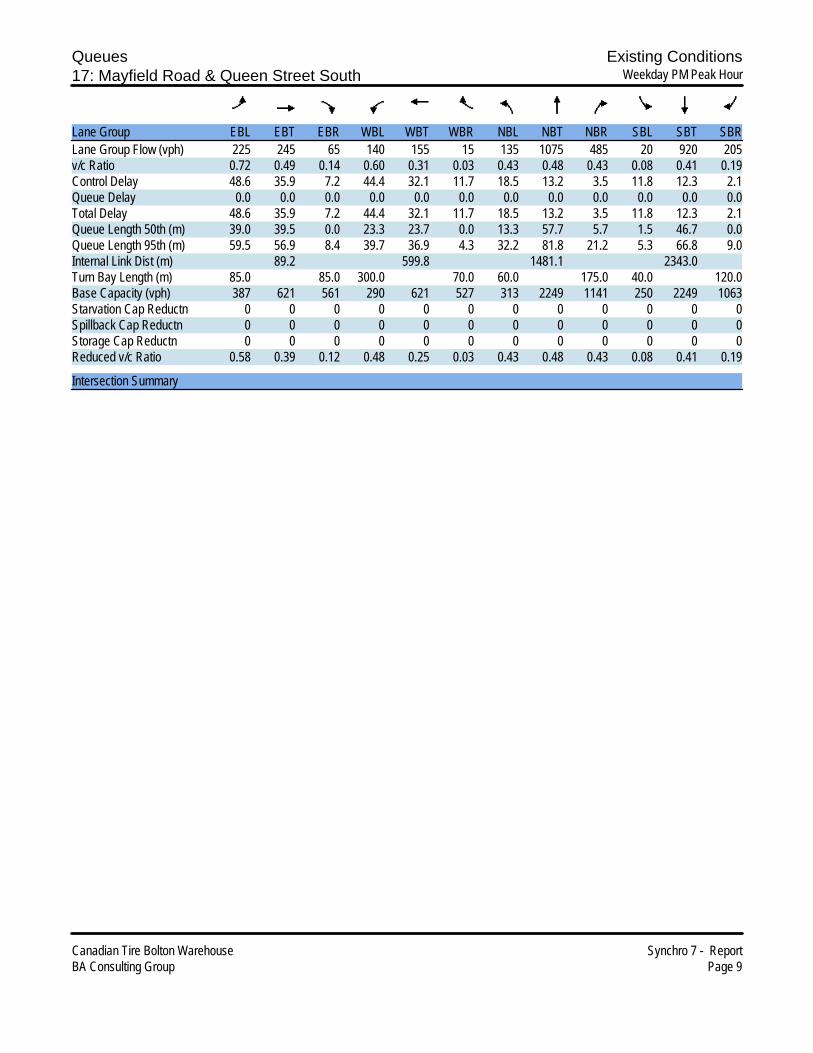
Queues Existing Conditions17: Mayfield Road & Queen Street South Weekday PM Peak Hour
Canadian Tire Bolton Warehouse Synchro 7 - ReportBA Consulting Group Page 9
Lane Group EBL EBT EBR WBL WBT WBR NBL NBT NBR SBL SBT SBRLane Group Flow (vph) 225 245 65 140 155 15 135 1075 485 20 920 205v/c Ratio 0.72 0.49 0.14 0.60 0.31 0.03 0.43 0.48 0.43 0.08 0.41 0.19Control Delay 48.6 35.9 7.2 44.4 32.1 11.7 18.5 13.2 3.5 11.8 12.3 2.1Queue Delay 0.0 0.0 0.0 0.0 0.0 0.0 0.0 0.0 0.0 0.0 0.0 0.0Total Delay 48.6 35.9 7.2 44.4 32.1 11.7 18.5 13.2 3.5 11.8 12.3 2.1Queue Length 50th (m) 39.0 39.5 0.0 23.3 23.7 0.0 13.3 57.7 5.7 1.5 46.7 0.0Queue Length 95th (m) 59.5 56.9 8.4 39.7 36.9 4.3 32.2 81.8 21.2 5.3 66.8 9.0Internal Link Dist (m) 89.2 599.8 1481.1 2343.0Turn Bay Length (m) 85.0 85.0 300.0 70.0 60.0 175.0 40.0 120.0Base Capacity (vph) 387 621 561 290 621 527 313 2249 1141 250 2249 1063Starvation Cap Reductn 0 0 0 0 0 0 0 0 0 0 0 0Spillback Cap Reductn 0 0 0 0 0 0 0 0 0 0 0 0Storage Cap Reductn 0 0 0 0 0 0 0 0 0 0 0 0Reduced v/c Ratio 0.58 0.39 0.12 0.48 0.25 0.03 0.43 0.48 0.43 0.08 0.41 0.19
Intersection Summary

HCM Signalized Intersection Capacity Analysis Existing Conditions17: Mayfield Road & Queen Street South Weekday PM Peak Hour
Canadian Tire Bolton Warehouse Synchro 7 - ReportBA Consulting Group Page 10
Movement EBL EBT EBR WBL WBT WBR NBL NBT NBR SBL SBT SBRLane ConfigurationsVolume (vph) 225 245 65 140 155 15 135 1075 485 20 920 205Ideal Flow (vphpl) 1900 1900 1900 1900 1900 1900 1900 1900 1900 1900 1900 1900Lane Width 3.5 3.7 3.5 3.5 3.7 3.5 3.5 3.7 3.5 3.5 3.7 3.5Total Lost time (s) 6.6 6.6 6.6 6.6 6.6 6.6 6.6 6.6 6.6 6.6 6.6 6.6Lane Util. Factor 1.00 1.00 1.00 1.00 1.00 1.00 1.00 0.95 1.00 1.00 0.95 1.00Frt 1.00 1.00 0.85 1.00 1.00 0.85 1.00 1.00 0.85 1.00 1.00 0.85Flt Protected 0.95 1.00 1.00 0.95 1.00 1.00 0.95 1.00 1.00 0.95 1.00 1.00Satd. Flow (prot) 1785 1921 1597 1785 1921 1597 1785 3650 1597 1785 3650 1597Flt Permitted 0.64 1.00 1.00 0.48 1.00 1.00 0.27 1.00 1.00 0.22 1.00 1.00Satd. Flow (perm) 1197 1921 1597 899 1921 1597 507 3650 1597 407 3650 1597Peak-hour factor, PHF 1.00 1.00 1.00 1.00 1.00 1.00 1.00 1.00 1.00 1.00 1.00 1.00Adj. Flow (vph) 225 245 65 140 155 15 135 1075 485 20 920 205RTOR Reduction (vph) 0 0 48 0 0 11 0 0 157 0 0 79Lane Group Flow (vph) 225 245 17 140 155 4 135 1075 328 20 920 126Turn Type Perm Perm Perm Perm Perm Perm Perm PermProtected Phases 4 4 2 2Permitted Phases 4 4 4 4 2 2 2 2Actuated Green, G (s) 28.3 28.3 28.3 28.3 28.3 28.3 66.7 66.7 66.7 66.7 66.7 66.7Effective Green, g (s) 28.3 28.3 28.3 28.3 28.3 28.3 66.7 66.7 66.7 66.7 66.7 66.7Actuated g/C Ratio 0.26 0.26 0.26 0.26 0.26 0.26 0.62 0.62 0.62 0.62 0.62 0.62Clearance Time (s) 6.6 6.6 6.6 6.6 6.6 6.6 6.6 6.6 6.6 6.6 6.6 6.6Vehicle Extension (s) 5.0 5.0 5.0 5.0 5.0 5.0 5.0 5.0 5.0 5.0 5.0 5.0Lane Grp Cap (vph) 313 502 418 235 502 418 313 2250 984 251 2250 984v/s Ratio Prot 0.13 0.08 c0.29 0.25v/s Ratio Perm c0.19 0.01 0.16 0.00 0.27 0.21 0.05 0.08v/c Ratio 0.72 0.49 0.04 0.60 0.31 0.01 0.43 0.48 0.33 0.08 0.41 0.13Uniform Delay, d1 36.3 33.8 29.8 34.9 32.1 29.6 10.8 11.3 10.0 8.4 10.6 8.6Progression Factor 1.00 1.00 1.00 1.00 1.00 1.00 1.00 1.00 1.00 1.00 1.00 1.00Incremental Delay, d2 9.4 1.6 0.1 6.0 0.7 0.0 4.3 0.7 0.9 0.6 0.6 0.3Delay (s) 45.8 35.4 29.9 41.0 32.8 29.6 15.1 12.0 10.9 9.0 11.2 8.9Level of Service D D C D C C B B B A B AApproach Delay (s) 39.1 36.3 11.9 10.7Approach LOS D D B B
Intersection SummaryHCM Average Control Delay 17.6 HCM Level of Service BHCM Volume to Capacity ratio 0.55Actuated Cycle Length (s) 108.2 Sum of lost time (s) 13.2Intersection Capacity Utilization 91.3% ICU Level of Service FAnalysis Period (min) 15c Critical Lane Group

Timing Report, Sorted By Phase Existing Conditions17: Mayfield Road & Queen Street South Weekday PM Peak Hour
Canadian Tire Bolton Warehouse Synchro 7 - ReportBA Consulting Group Page 11
Phase Number 2 4Movement NBSB EBWBLead/LagLead-Lag OptimizeRecall Mode C-Max NoneMaximum Split (s) 66.6 41.6Maximum Split (%) 61.6% 38.4%Minimum Split (s) 26.6 23.6Yellow Time (s) 4.6 4.6All-Red Time (s) 2 2Minimum Initial (s) 20 12Vehicle Extension (s) 5 5Minimum Gap (s) 3 3Time Before Reduce (s) 0 0Time To Reduce (s) 0 0Walk Time (s) 5 5Flash Dont Walk (s) 11 12Dual Entry Yes YesInhibit Max Yes YesStart Time (s) 0 66.6End Time (s) 66.6 0Yield/Force Off (s) 60 101.6Yield/Force Off 170(s) 49 89.6Local Start Time (s) 0 66.6Local Yield (s) 60 101.6Local Yield 170(s) 49 89.6
Intersection SummaryCycle Length 108.2Control Type Actuated-CoordinatedNatural Cycle 60Offset: 0 (0%), Referenced to phase 2:NBSB, Start of Green
Splits and Phases: 17: Mayfield Road & Queen Street South

Queues Existing Conditions18: Mayfield Road & Coleraine Drive Weekday PM Peak Hour
Canadian Tire Bolton Warehouse Synchro 7 - ReportBA Consulting Group Page 12
Lane Group EBL EBT WBL WBT NBL NBT SBL SBTLane Group Flow (vph) 170 500 10 480 80 205 30 305v/c Ratio 0.29 0.24 0.03 0.30 0.25 0.18 0.08 0.26Control Delay 11.3 12.4 18.6 20.8 32.3 28.5 29.0 9.4Queue Delay 0.0 0.0 0.0 0.0 0.0 0.0 0.0 0.0Total Delay 11.3 12.4 18.6 20.8 32.3 28.5 29.0 9.4Queue Length 50th (m) 14.3 25.0 1.1 32.4 12.3 15.6 4.4 6.5Queue Length 95th (m) 23.3 33.4 4.1 43.5 24.3 24.1 11.1 15.8Internal Link Dist (m) 109.5 63.7 86.1 203.6Turn Bay Length (m) 100.0 60.0 75.0 125.0Base Capacity (vph) 583 2066 392 1616 320 1113 360 1152Starvation Cap Reductn 0 0 0 0 0 0 0 0Spillback Cap Reductn 0 0 0 0 0 0 0 0Storage Cap Reductn 0 0 0 0 0 0 0 0Reduced v/c Ratio 0.29 0.24 0.03 0.30 0.25 0.18 0.08 0.26
Intersection Summary

HCM Signalized Intersection Capacity Analysis Existing Conditions18: Mayfield Road & Coleraine Drive Weekday PM Peak Hour
Canadian Tire Bolton Warehouse Synchro 7 - ReportBA Consulting Group Page 13
Movement EBL EBT EBR WBL WBT WBR NBL NBT NBR SBL SBT SBRLane ConfigurationsVolume (vph) 170 470 30 10 460 20 80 190 15 30 85 220Ideal Flow (vphpl) 1900 1900 1900 1900 1900 1900 1900 1900 1900 1900 1900 1900Lane Width 3.5 3.7 3.5 3.5 3.7 3.5 3.5 3.7 3.5 3.5 3.7 3.5Total Lost time (s) 3.0 7.0 7.0 7.0 7.0 7.0 7.0 7.0Lane Util. Factor 1.00 0.95 1.00 0.95 1.00 0.95 1.00 0.95Frt 1.00 0.99 1.00 0.99 1.00 0.99 1.00 0.89Flt Protected 0.95 1.00 0.95 1.00 0.95 1.00 0.95 1.00Satd. Flow (prot) 1785 3617 1785 3627 1785 3610 1785 3255Flt Permitted 0.42 1.00 0.47 1.00 0.55 1.00 0.62 1.00Satd. Flow (perm) 792 3617 881 3627 1041 3610 1171 3255Peak-hour factor, PHF 1.00 1.00 1.00 1.00 1.00 1.00 1.00 1.00 1.00 1.00 1.00 1.00Adj. Flow (vph) 170 470 30 10 460 20 80 190 15 30 85 220RTOR Reduction (vph) 0 4 0 0 3 0 0 5 0 0 152 0Lane Group Flow (vph) 170 496 0 10 477 0 80 200 0 30 153 0Turn Type pm+pt Perm Perm PermProtected Phases 5 2 6 8 4Permitted Phases 2 6 8 4Actuated Green, G (s) 65.0 65.0 50.7 50.7 35.0 35.0 35.0 35.0Effective Green, g (s) 65.0 65.0 50.7 50.7 35.0 35.0 35.0 35.0Actuated g/C Ratio 0.57 0.57 0.44 0.44 0.31 0.31 0.31 0.31Clearance Time (s) 3.0 7.0 7.0 7.0 7.0 7.0 7.0 7.0Vehicle Extension (s) 5.0 5.0 5.0 5.0 5.0 5.0 5.0 5.0Lane Grp Cap (vph) 550 2062 392 1613 320 1108 360 999v/s Ratio Prot c0.03 0.14 0.13 0.06 0.05v/s Ratio Perm c0.15 0.01 c0.08 0.03v/c Ratio 0.31 0.24 0.03 0.30 0.25 0.18 0.08 0.15Uniform Delay, d1 11.9 12.2 17.8 20.2 29.6 29.0 28.1 28.7Progression Factor 1.00 1.00 1.00 1.00 1.00 1.00 1.00 1.00Incremental Delay, d2 0.7 0.3 0.1 0.5 1.9 0.4 0.5 0.3Delay (s) 12.5 12.5 17.9 20.7 31.5 29.3 28.5 29.0Level of Service B B B C C C C CApproach Delay (s) 12.5 20.6 29.9 29.0Approach LOS B C C C
Intersection SummaryHCM Average Control Delay 20.6 HCM Level of Service CHCM Volume to Capacity ratio 0.28Actuated Cycle Length (s) 114.0 Sum of lost time (s) 10.0Intersection Capacity Utilization 67.3% ICU Level of Service CAnalysis Period (min) 15c Critical Lane Group

Timing Report, Sorted By Phase Existing Conditions18: Mayfield Road & Coleraine Drive Weekday PM Peak Hour
Canadian Tire Bolton Warehouse Synchro 7 - ReportBA Consulting Group Page 14
Phase Number 2 4 5 6 8Movement EBTL SBTL EBL WBTL NBTLLead/Lag Lead LagLead-Lag OptimizeRecall Mode C-Max Max None C-Max MaxMaximum Split (s) 72 42 15 57 42Maximum Split (%) 63.2% 36.8% 13.2% 50.0% 36.8%Minimum Split (s) 33 33 8 33 33Yellow Time (s) 4.6 4.2 3 4.6 4.2All-Red Time (s) 2.4 2.8 0 2.4 2.8Minimum Initial (s) 12 12 5 12 12Vehicle Extension (s) 5 5 5 5 5Minimum Gap (s) 3 3 3 3 3Time Before Reduce (s) 0 0 0 0 0Time To Reduce (s) 0 0 0 0 0Walk Time (s) 5 5 5 5Flash Dont Walk (s) 21 21 21 21Dual Entry Yes Yes No Yes YesInhibit Max Yes Yes Yes Yes YesStart Time (s) 5 77 5 20 77End Time (s) 77 5 20 77 5Yield/Force Off (s) 70 112 17 70 112Yield/Force Off 170(s) 49 91 17 49 91Local Start Time (s) 99 57 99 0 57Local Yield (s) 50 92 111 50 92Local Yield 170(s) 29 71 111 29 71
Intersection SummaryCycle Length 114Control Type Actuated-CoordinatedNatural Cycle 75Offset: 20 (18%), Referenced to phase 2:EBTL and 6:WBTL, Start of Green
Splits and Phases: 18: Mayfield Road & Coleraine Drive

HCM Unsignalized Intersection Capacity Analysis Existing Conditions20: Mayfield Road & Humber Station Road Weekday PM Peak Hour
Canadian Tire Bolton Warehouse Synchro 7 - ReportBA Consulting Group Page 15
Movement EBL EBT EBR WBL WBT WBR NBL NBT NBR SBL SBT SBRLane ConfigurationsVolume (veh/h) 20 600 5 10 735 20 0 20 5 5 10 15Sign Control Free Free Stop StopGrade 0% 0% 0% 0%Peak Hour Factor 1.00 1.00 1.00 1.00 1.00 1.00 1.00 1.00 1.00 1.00 1.00 1.00Hourly flow rate (vph) 20 600 5 10 735 20 0 20 5 5 10 15PedestriansLane Width (m)Walking Speed (m/s)Percent BlockageRight turn flare (veh)Median type None NoneMedian storage veh)Upstream signal (m)pX, platoon unblockedvC, conflicting volume 755 605 1428 1418 602 1422 1410 745vC1, stage 1 conf volvC2, stage 2 conf volvCu, unblocked vol 755 605 1428 1418 602 1422 1410 745tC, single (s) 4.1 4.1 7.1 6.5 6.2 7.1 6.5 6.2tC, 2 stage (s)tF (s) 2.2 2.2 3.5 4.0 3.3 3.5 4.0 3.3p0 queue free % 98 99 100 85 99 95 93 96cM capacity (veh/h) 865 983 101 134 503 98 135 417
Direction, Lane # EB 1 WB 1 NB 1 SB 1Volume Total 625 765 25 30Volume Left 20 10 0 5Volume Right 5 20 5 15cSH 865 983 157 186Volume to Capacity 0.02 0.01 0.16 0.16Queue Length 95th (m) 0.5 0.2 3.9 3.9Control Delay (s) 0.6 0.3 32.3 28.0Lane LOS A A D DApproach Delay (s) 0.6 0.3 32.3 28.0Approach LOS D D
Intersection SummaryAverage Delay 1.6Intersection Capacity Utilization 56.7% ICU Level of Service BAnalysis Period (min) 15
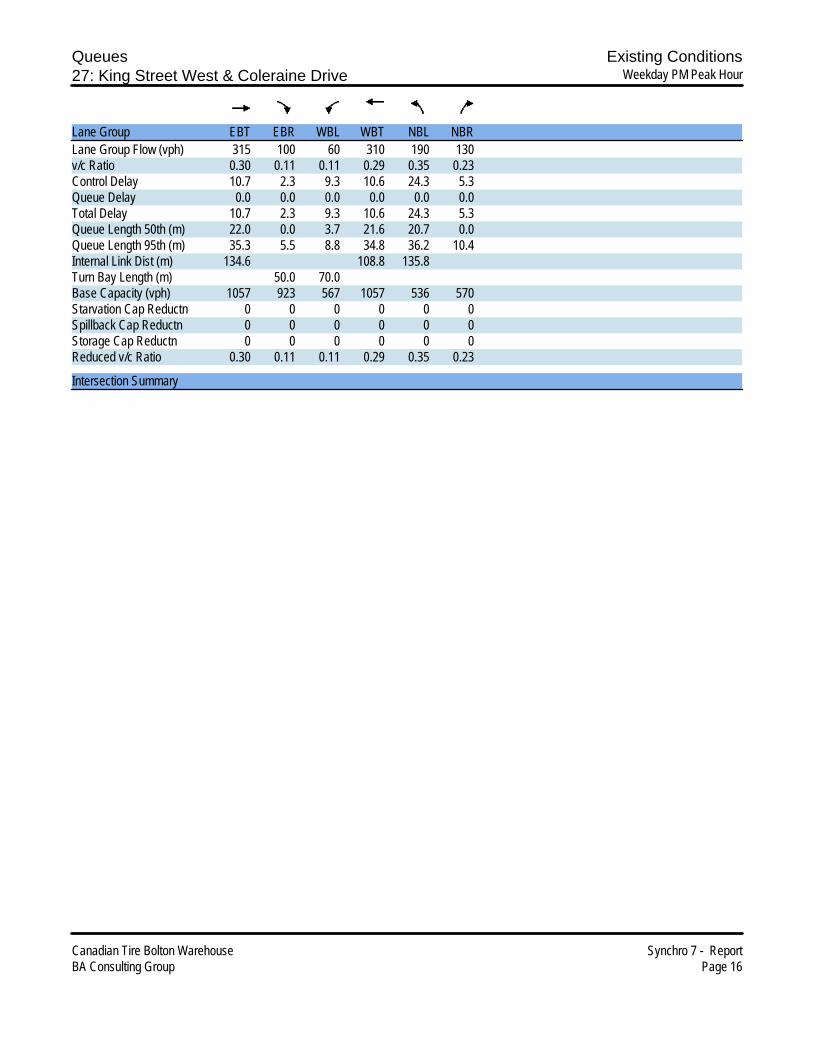
Queues Existing Conditions27: King Street West & Coleraine Drive Weekday PM Peak Hour
Canadian Tire Bolton Warehouse Synchro 7 - ReportBA Consulting Group Page 16
Lane Group EBT EBR WBL WBT NBL NBRLane Group Flow (vph) 315 100 60 310 190 130v/c Ratio 0.30 0.11 0.11 0.29 0.35 0.23Control Delay 10.7 2.3 9.3 10.6 24.3 5.3Queue Delay 0.0 0.0 0.0 0.0 0.0 0.0Total Delay 10.7 2.3 9.3 10.6 24.3 5.3Queue Length 50th (m) 22.0 0.0 3.7 21.6 20.7 0.0Queue Length 95th (m) 35.3 5.5 8.8 34.8 36.2 10.4Internal Link Dist (m) 134.6 108.8 135.8Turn Bay Length (m) 50.0 70.0Base Capacity (vph) 1057 923 567 1057 536 570Starvation Cap Reductn 0 0 0 0 0 0Spillback Cap Reductn 0 0 0 0 0 0Storage Cap Reductn 0 0 0 0 0 0Reduced v/c Ratio 0.30 0.11 0.11 0.29 0.35 0.23
Intersection Summary
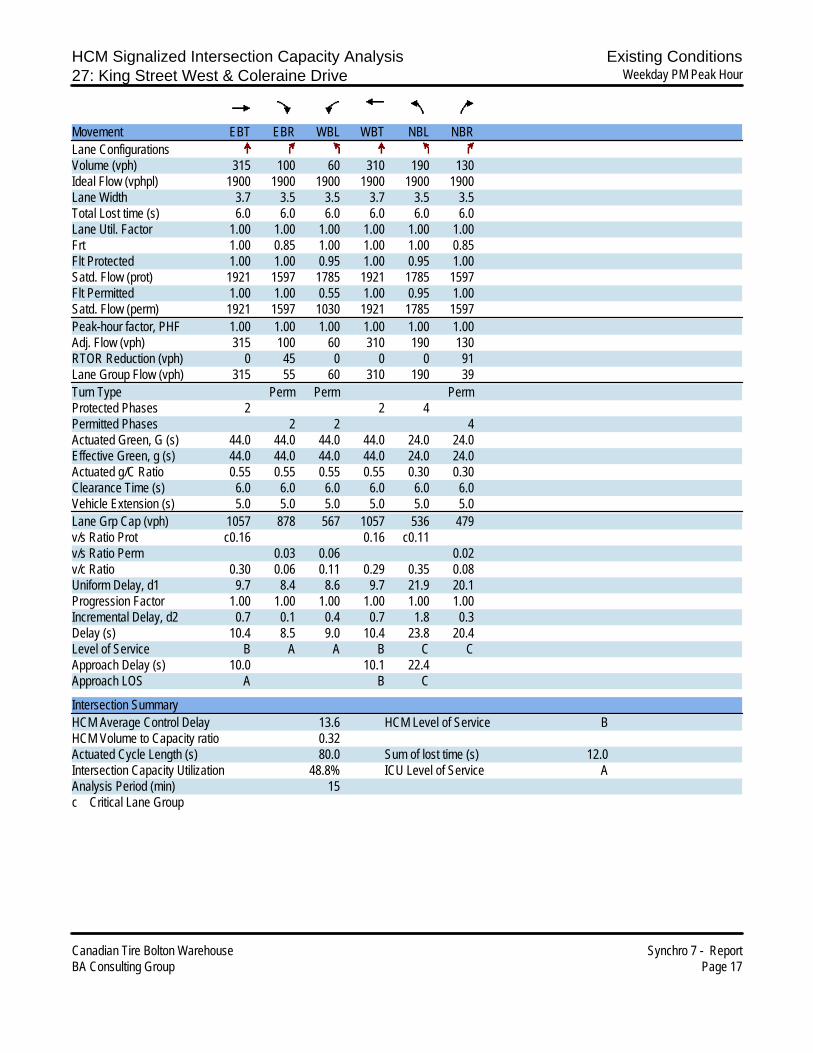
HCM Signalized Intersection Capacity Analysis Existing Conditions27: King Street West & Coleraine Drive Weekday PM Peak Hour
Canadian Tire Bolton Warehouse Synchro 7 - ReportBA Consulting Group Page 17
Movement EBT EBR WBL WBT NBL NBRLane ConfigurationsVolume (vph) 315 100 60 310 190 130Ideal Flow (vphpl) 1900 1900 1900 1900 1900 1900Lane Width 3.7 3.5 3.5 3.7 3.5 3.5Total Lost time (s) 6.0 6.0 6.0 6.0 6.0 6.0Lane Util. Factor 1.00 1.00 1.00 1.00 1.00 1.00Frt 1.00 0.85 1.00 1.00 1.00 0.85Flt Protected 1.00 1.00 0.95 1.00 0.95 1.00Satd. Flow (prot) 1921 1597 1785 1921 1785 1597Flt Permitted 1.00 1.00 0.55 1.00 0.95 1.00Satd. Flow (perm) 1921 1597 1030 1921 1785 1597Peak-hour factor, PHF 1.00 1.00 1.00 1.00 1.00 1.00Adj. Flow (vph) 315 100 60 310 190 130RTOR Reduction (vph) 0 45 0 0 0 91Lane Group Flow (vph) 315 55 60 310 190 39Turn Type Perm Perm PermProtected Phases 2 2 4Permitted Phases 2 2 4Actuated Green, G (s) 44.0 44.0 44.0 44.0 24.0 24.0Effective Green, g (s) 44.0 44.0 44.0 44.0 24.0 24.0Actuated g/C Ratio 0.55 0.55 0.55 0.55 0.30 0.30Clearance Time (s) 6.0 6.0 6.0 6.0 6.0 6.0Vehicle Extension (s) 5.0 5.0 5.0 5.0 5.0 5.0Lane Grp Cap (vph) 1057 878 567 1057 536 479v/s Ratio Prot c0.16 0.16 c0.11v/s Ratio Perm 0.03 0.06 0.02v/c Ratio 0.30 0.06 0.11 0.29 0.35 0.08Uniform Delay, d1 9.7 8.4 8.6 9.7 21.9 20.1Progression Factor 1.00 1.00 1.00 1.00 1.00 1.00Incremental Delay, d2 0.7 0.1 0.4 0.7 1.8 0.3Delay (s) 10.4 8.5 9.0 10.4 23.8 20.4Level of Service B A A B C CApproach Delay (s) 10.0 10.1 22.4Approach LOS A B C
Intersection SummaryHCM Average Control Delay 13.6 HCM Level of Service BHCM Volume to Capacity ratio 0.32Actuated Cycle Length (s) 80.0 Sum of lost time (s) 12.0Intersection Capacity Utilization 48.8% ICU Level of Service AAnalysis Period (min) 15c Critical Lane Group

Timing Report, Sorted By Phase Existing Conditions27: King Street West & Coleraine Drive Weekday PM Peak Hour
Canadian Tire Bolton Warehouse Synchro 7 - ReportBA Consulting Group Page 18
Phase Number 2 4Movement EBWB NBLLead/LagLead-Lag OptimizeRecall Mode C-Max MaxMaximum Split (s) 50 30Maximum Split (%) 62.5% 37.5%Minimum Split (s) 28 22Yellow Time (s) 4 4All-Red Time (s) 2 2Minimum Initial (s) 8 8Vehicle Extension (s) 5 5Minimum Gap (s) 3 3Time Before Reduce (s) 0 0Time To Reduce (s) 0 0Walk Time (s) 5 5Flash Dont Walk (s) 17 10Dual Entry Yes YesInhibit Max Yes YesStart Time (s) 29 79End Time (s) 79 29Yield/Force Off (s) 73 23Yield/Force Off 170(s) 56 13Local Start Time (s) 0 50Local Yield (s) 44 74Local Yield 170(s) 27 64
Intersection SummaryCycle Length 80Control Type Actuated-CoordinatedNatural Cycle 50Offset: 29 (36%), Referenced to phase 2:EBWB, Start of Green
Splits and Phases: 27: King Street West & Coleraine Drive
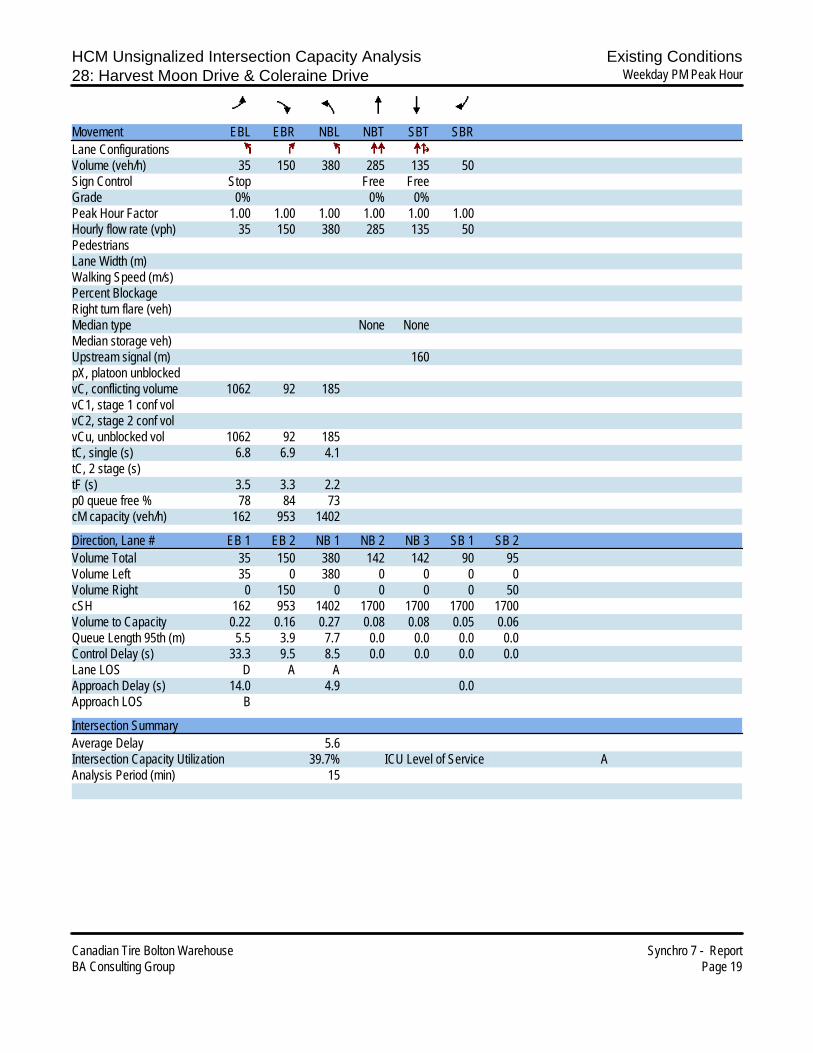
HCM Unsignalized Intersection Capacity Analysis Existing Conditions28: Harvest Moon Drive & Coleraine Drive Weekday PM Peak Hour
Canadian Tire Bolton Warehouse Synchro 7 - ReportBA Consulting Group Page 19
Movement EBL EBR NBL NBT SBT SBRLane ConfigurationsVolume (veh/h) 35 150 380 285 135 50Sign Control Stop Free FreeGrade 0% 0% 0%Peak Hour Factor 1.00 1.00 1.00 1.00 1.00 1.00Hourly flow rate (vph) 35 150 380 285 135 50PedestriansLane Width (m)Walking Speed (m/s)Percent BlockageRight turn flare (veh)Median type None NoneMedian storage veh)Upstream signal (m) 160pX, platoon unblockedvC, conflicting volume 1062 92 185vC1, stage 1 conf volvC2, stage 2 conf volvCu, unblocked vol 1062 92 185tC, single (s) 6.8 6.9 4.1tC, 2 stage (s)tF (s) 3.5 3.3 2.2p0 queue free % 78 84 73cM capacity (veh/h) 162 953 1402
Direction, Lane # EB 1 EB 2 NB 1 NB 2 NB 3 SB 1 SB 2Volume Total 35 150 380 142 142 90 95Volume Left 35 0 380 0 0 0 0Volume Right 0 150 0 0 0 0 50cSH 162 953 1402 1700 1700 1700 1700Volume to Capacity 0.22 0.16 0.27 0.08 0.08 0.05 0.06Queue Length 95th (m) 5.5 3.9 7.7 0.0 0.0 0.0 0.0Control Delay (s) 33.3 9.5 8.5 0.0 0.0 0.0 0.0Lane LOS D A AApproach Delay (s) 14.0 4.9 0.0Approach LOS B
Intersection SummaryAverage Delay 5.6Intersection Capacity Utilization 39.7% ICU Level of Service AAnalysis Period (min) 15

Queues Existing Conditions17: Mayfield Road & Queen Street South Saturday Peak Hour
Canadian Tire Bolton Warehouse Synchro 7 - ReportBA Consulting Group Page 1
Lane Group EBL EBT EBR WBL WBT WBR NBL NBT NBR SBL SBT SBRLane ConfigurationsVolume (vph) 172 72 56 184 70 12 55 601 186 10 608 136Lane Group Flow (vph) 172 72 56 184 70 12 55 601 186 10 608 136Turn Type Perm Perm Perm Perm Perm Perm Perm PermProtected Phases 4 4 2 2Permitted Phases 4 4 4 4 2 2 2 2Detector Phase 4 4 4 4 4 4 2 2 2 2 2 2Switch PhaseMinimum Initial (s) 12.0 12.0 12.0 12.0 12.0 12.0 20.0 20.0 20.0 20.0 20.0 20.0Minimum Split (s) 23.6 23.6 23.6 23.6 23.6 23.6 26.6 26.6 26.6 26.6 26.6 26.6Total Split (s) 41.6 41.6 41.6 41.6 41.6 41.6 66.6 66.6 66.6 66.6 66.6 66.6Total Split (%) 38.4% 38.4% 38.4% 38.4% 38.4% 38.4% 61.6% 61.6% 61.6% 61.6% 61.6% 61.6%Yellow Time (s) 4.6 4.6 4.6 4.6 4.6 4.6 4.6 4.6 4.6 4.6 4.6 4.6All-Red Time (s) 2.0 2.0 2.0 2.0 2.0 2.0 2.0 2.0 2.0 2.0 2.0 2.0Lost Time Adjust (s) 0.0 0.0 0.0 0.0 0.0 0.0 0.0 0.0 0.0 0.0 0.0 0.0Total Lost Time (s) 6.6 6.6 6.6 6.6 6.6 6.6 6.6 6.6 6.6 6.6 6.6 6.6Lead/LagLead-Lag Optimize?Recall Mode None None None None None None C-Max C-Max C-Max C-Max C-Max C-Maxv/c Ratio 0.60 0.17 0.14 0.64 0.17 0.03 0.11 0.25 0.17 0.02 0.25 0.12Control Delay 45.4 32.7 8.5 47.5 32.6 13.4 9.4 8.7 1.8 9.1 8.7 2.0Queue Delay 0.0 0.0 0.0 0.0 0.0 0.0 0.0 0.0 0.0 0.0 0.0 0.0Total Delay 45.4 32.7 8.5 47.5 32.6 13.4 9.4 8.7 1.8 9.1 8.7 2.0Queue Length 50th (m) 34.8 13.2 0.0 37.6 12.8 0.0 4.0 25.3 0.0 0.7 25.7 0.0Queue Length 95th (m) 50.7 22.7 9.2 54.6 22.0 4.5 12.0 45.0 9.4 3.4 45.6 8.2Internal Link Dist (m) 89.2 562.7 1481.1 2351.8Turn Bay Length (m) 85.0 85.0 300.0 70.0 60.0 175.0 40.0 120.0Base Capacity (vph) 432 621 554 432 621 525 515 2416 1120 520 2416 1103Starvation Cap Reductn 0 0 0 0 0 0 0 0 0 0 0 0Spillback Cap Reductn 0 0 0 0 0 0 0 0 0 0 0 0Storage Cap Reductn 0 0 0 0 0 0 0 0 0 0 0 0Reduced v/c Ratio 0.40 0.12 0.10 0.43 0.11 0.02 0.11 0.25 0.17 0.02 0.25 0.12
Intersection SummaryCycle Length: 108.2Actuated Cycle Length: 108.2Offset: 0 (0%), Referenced to phase 2:NBSB, Start of GreenNatural Cycle: 55Control Type: Actuated-Coordinated
Splits and Phases: 17: Mayfield Road & Queen Street South

HCM Signalized Intersection Capacity Analysis Existing Conditions17: Mayfield Road & Queen Street South Saturday Peak Hour
Canadian Tire Bolton Warehouse Synchro 7 - ReportBA Consulting Group Page 2
Movement EBL EBT EBR WBL WBT WBR NBL NBT NBR SBL SBT SBRLane ConfigurationsVolume (vph) 172 72 56 184 70 12 55 601 186 10 608 136Ideal Flow (vphpl) 1900 1900 1900 1900 1900 1900 1900 1900 1900 1900 1900 1900Lane Width 3.5 3.7 3.5 3.5 3.7 3.5 3.5 3.7 3.5 3.5 3.7 3.5Total Lost time (s) 6.6 6.6 6.6 6.6 6.6 6.6 6.6 6.6 6.6 6.6 6.6 6.6Lane Util. Factor 1.00 1.00 1.00 1.00 1.00 1.00 1.00 0.95 1.00 1.00 0.95 1.00Frt 1.00 1.00 0.85 1.00 1.00 0.85 1.00 1.00 0.85 1.00 1.00 0.85Flt Protected 0.95 1.00 1.00 0.95 1.00 1.00 0.95 1.00 1.00 0.95 1.00 1.00Satd. Flow (prot) 1785 1921 1597 1785 1921 1597 1785 3650 1597 1785 3650 1597Flt Permitted 0.71 1.00 1.00 0.71 1.00 1.00 0.41 1.00 1.00 0.42 1.00 1.00Satd. Flow (perm) 1337 1921 1597 1334 1921 1597 778 3650 1597 785 3650 1597Peak-hour factor, PHF 1.00 1.00 1.00 1.00 1.00 1.00 1.00 1.00 1.00 1.00 1.00 1.00Adj. Flow (vph) 172 72 56 184 70 12 55 601 186 10 608 136RTOR Reduction (vph) 0 0 44 0 0 9 0 0 63 0 0 46Lane Group Flow (vph) 172 72 12 184 70 3 55 601 123 10 608 90Turn Type Perm Perm Perm Perm Perm Perm Perm PermProtected Phases 4 4 2 2Permitted Phases 4 4 4 4 2 2 2 2Actuated Green, G (s) 23.4 23.4 23.4 23.4 23.4 23.4 71.6 71.6 71.6 71.6 71.6 71.6Effective Green, g (s) 23.4 23.4 23.4 23.4 23.4 23.4 71.6 71.6 71.6 71.6 71.6 71.6Actuated g/C Ratio 0.22 0.22 0.22 0.22 0.22 0.22 0.66 0.66 0.66 0.66 0.66 0.66Clearance Time (s) 6.6 6.6 6.6 6.6 6.6 6.6 6.6 6.6 6.6 6.6 6.6 6.6Vehicle Extension (s) 5.0 5.0 5.0 5.0 5.0 5.0 5.0 5.0 5.0 5.0 5.0 5.0Lane Grp Cap (vph) 289 415 345 288 415 345 515 2415 1057 519 2415 1057v/s Ratio Prot 0.04 0.04 0.16 c0.17v/s Ratio Perm 0.13 0.01 c0.14 0.00 0.07 0.08 0.01 0.06v/c Ratio 0.60 0.17 0.04 0.64 0.17 0.01 0.11 0.25 0.12 0.02 0.25 0.09Uniform Delay, d1 38.1 34.5 33.5 38.6 34.5 33.3 6.7 7.4 6.7 6.3 7.4 6.6Progression Factor 1.00 1.00 1.00 1.00 1.00 1.00 1.00 1.00 1.00 1.00 1.00 1.00Incremental Delay, d2 4.9 0.4 0.1 6.3 0.4 0.0 0.4 0.2 0.2 0.1 0.3 0.2Delay (s) 43.0 34.9 33.6 44.9 34.9 33.3 7.1 7.7 6.9 6.3 7.7 6.7Level of Service D C C D C C A A A A A AApproach Delay (s) 39.3 41.7 7.5 7.5Approach LOS D D A A
Intersection SummaryHCM Average Control Delay 16.1 HCM Level of Service BHCM Volume to Capacity ratio 0.35Actuated Cycle Length (s) 108.2 Sum of lost time (s) 13.2Intersection Capacity Utilization 66.8% ICU Level of Service CAnalysis Period (min) 15c Critical Lane Group
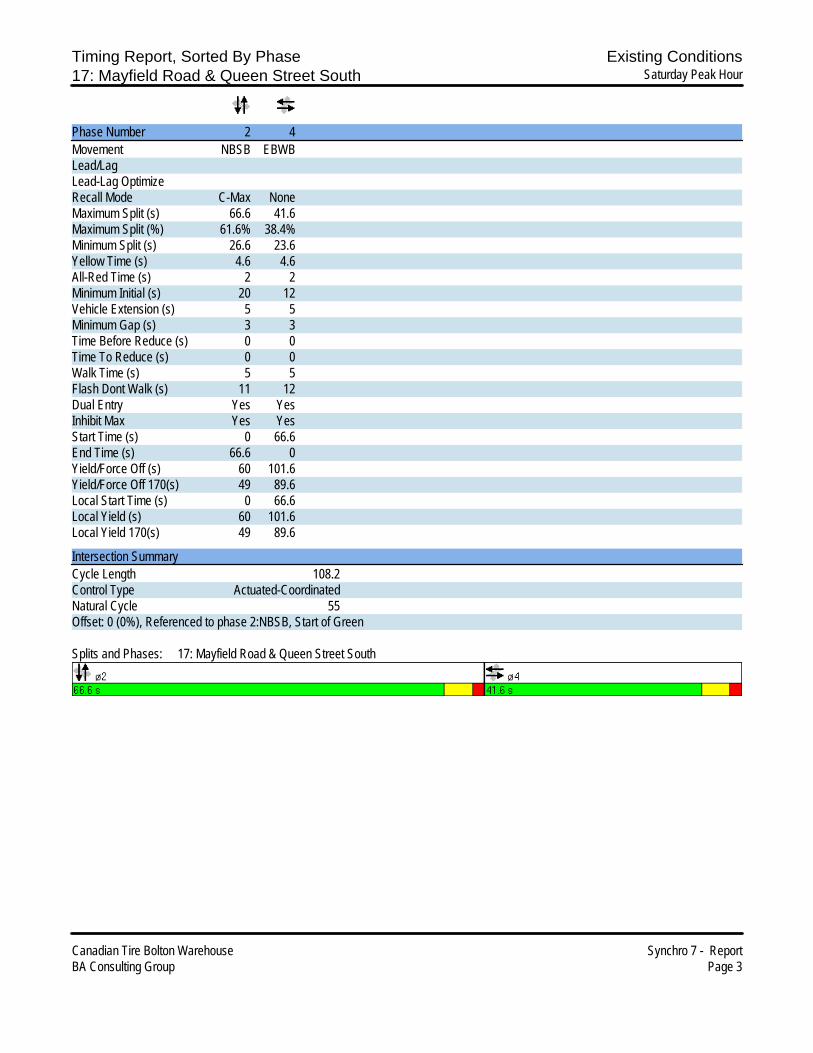
Timing Report, Sorted By Phase Existing Conditions17: Mayfield Road & Queen Street South Saturday Peak Hour
Canadian Tire Bolton Warehouse Synchro 7 - ReportBA Consulting Group Page 3
Phase Number 2 4Movement NBSB EBWBLead/LagLead-Lag OptimizeRecall Mode C-Max NoneMaximum Split (s) 66.6 41.6Maximum Split (%) 61.6% 38.4%Minimum Split (s) 26.6 23.6Yellow Time (s) 4.6 4.6All-Red Time (s) 2 2Minimum Initial (s) 20 12Vehicle Extension (s) 5 5Minimum Gap (s) 3 3Time Before Reduce (s) 0 0Time To Reduce (s) 0 0Walk Time (s) 5 5Flash Dont Walk (s) 11 12Dual Entry Yes YesInhibit Max Yes YesStart Time (s) 0 66.6End Time (s) 66.6 0Yield/Force Off (s) 60 101.6Yield/Force Off 170(s) 49 89.6Local Start Time (s) 0 66.6Local Yield (s) 60 101.6Local Yield 170(s) 49 89.6
Intersection SummaryCycle Length 108.2Control Type Actuated-CoordinatedNatural Cycle 55Offset: 0 (0%), Referenced to phase 2:NBSB, Start of Green
Splits and Phases: 17: Mayfield Road & Queen Street South

P r o j e c t B o l t o n
Future Background Conditions


HCM Unsignalized Intersection Capacity Analysis Future Background5: Holland Drive & Coleraine Drive Weekday AM Peak Hour
Canadian Tire Bolton Warehouse Synchro 7 - ReportBA Consulting Group Page 1
Movement WBL WBR NBT NBR SBL SBTLane ConfigurationsVolume (veh/h) 5 55 65 15 115 460Sign Control Stop Free FreeGrade 0% 0% 0%Peak Hour Factor 1.00 1.00 1.00 1.00 1.00 1.00Hourly flow rate (vph) 5 55 65 15 115 460PedestriansLane Width (m)Walking Speed (m/s)Percent BlockageRight turn flare (veh)Median type None NoneMedian storage veh)Upstream signal (m)pX, platoon unblockedvC, conflicting volume 532 40 80vC1, stage 1 conf volvC2, stage 2 conf volvCu, unblocked vol 532 40 80tC, single (s) 6.8 6.9 4.1tC, 2 stage (s)tF (s) 3.5 3.3 2.2p0 queue free % 99 95 92cM capacity (veh/h) 446 1029 1531
Direction, Lane # WB 1 WB 2 NB 1 NB 2 SB 1 SB 2 SB 3Volume Total 5 55 43 37 115 230 230Volume Left 5 0 0 0 115 0 0Volume Right 0 55 0 15 0 0 0cSH 446 1029 1700 1700 1531 1700 1700Volume to Capacity 0.01 0.05 0.03 0.02 0.08 0.14 0.14Queue Length 95th (m) 0.2 1.2 0.0 0.0 1.7 0.0 0.0Control Delay (s) 13.2 8.7 0.0 0.0 7.5 0.0 0.0Lane LOS B A AApproach Delay (s) 9.1 0.0 1.5Approach LOS A
Intersection SummaryAverage Delay 2.0Intersection Capacity Utilization 23.0% ICU Level of Service AAnalysis Period (min) 15

Queues Future Background7: Healey Road & Coleraine Drive Weekday AM Peak Hour
Canadian Tire Bolton Warehouse Synchro 7 - ReportBA Consulting Group Page 2
Lane Group EBL EBT WBL WBT NBL NBT SBL SBTLane ConfigurationsVolume (vph) 15 165 45 50 5 70 40 405Lane Group Flow (vph) 15 190 45 60 5 195 40 430Turn Type Perm Perm Perm PermProtected Phases 8 4 6 2Permitted Phases 8 4 6 2Detector Phase 8 8 4 4 6 6 2 2Switch PhaseMinimum Initial (s) 8.0 8.0 8.0 8.0 12.0 12.0 12.0 12.0Minimum Split (s) 32.8 32.8 32.8 32.8 36.2 36.2 36.2 36.2Total Split (s) 33.0 33.0 33.0 33.0 37.0 37.0 37.0 37.0Total Split (%) 47.1% 47.1% 47.1% 47.1% 52.9% 52.9% 52.9% 52.9%Yellow Time (s) 4.0 4.0 4.0 4.0 4.6 4.6 4.6 4.6All-Red Time (s) 2.8 2.8 2.8 2.8 2.1 2.1 2.1 2.1Lost Time Adjust (s) 0.0 0.0 0.0 0.0 0.0 0.0 0.0 0.0Total Lost Time (s) 6.8 6.8 6.8 6.8 6.7 6.7 6.7 6.7Lead/LagLead-Lag Optimize?Recall Mode None None None None C-Max C-Max C-Max C-Maxv/c Ratio 0.06 0.50 0.19 0.16 0.01 0.09 0.06 0.19Control Delay 21.2 27.3 23.8 19.8 6.8 2.9 7.0 6.7Queue Delay 0.0 0.0 0.0 0.0 0.0 0.0 0.0 0.0Total Delay 21.2 27.3 23.8 19.8 6.8 2.9 7.0 6.7Queue Length 50th (m) 1.5 19.2 4.6 5.0 0.2 1.5 1.7 10.3Queue Length 95th (m) 5.1 32.5 11.0 12.0 1.5 5.6 5.7 19.0Internal Link Dist (m) 1348.4 958.2 2899.4 1053.0Turn Bay Length (m) 120.0 100.0 120.0 120.0Base Capacity (vph) 505 712 449 707 575 2062 721 2211Starvation Cap Reductn 0 0 0 0 0 0 0 0Spillback Cap Reductn 0 0 0 0 0 0 0 0Storage Cap Reductn 0 0 0 0 0 0 0 0Reduced v/c Ratio 0.03 0.27 0.10 0.08 0.01 0.09 0.06 0.19
Intersection SummaryCycle Length: 70Actuated Cycle Length: 70Offset: 0 (0%), Referenced to phase 2:SBTL and 6:NBTL, Start of GreenNatural Cycle: 70Control Type: Actuated-Coordinated
Splits and Phases: 7: Healey Road & Coleraine Drive

HCM Signalized Intersection Capacity Analysis Future Background7: Healey Road & Coleraine Drive Weekday AM Peak Hour
Canadian Tire Bolton Warehouse Synchro 7 - ReportBA Consulting Group Page 3
Movement EBL EBT EBR WBL WBT WBR NBL NBT NBR SBL SBT SBRLane ConfigurationsVolume (vph) 15 165 25 45 50 10 5 70 125 40 405 25Ideal Flow (vphpl) 1900 1900 1900 1900 1900 1900 1900 1900 1900 1900 1900 1900Lane Width 3.5 3.7 3.5 3.5 3.7 3.5 3.5 3.7 3.5 3.5 3.7 3.5Total Lost time (s) 6.8 6.8 6.8 6.8 6.7 6.7 6.7 6.7Lane Util. Factor 1.00 1.00 1.00 1.00 1.00 0.95 1.00 0.95Frt 1.00 0.98 1.00 0.98 1.00 0.90 1.00 0.99Flt Protected 0.95 1.00 0.95 1.00 0.95 1.00 0.95 1.00Satd. Flow (prot) 1785 1883 1785 1873 1785 3299 1785 3618Flt Permitted 0.72 1.00 0.64 1.00 0.50 1.00 0.63 1.00Satd. Flow (perm) 1349 1883 1199 1873 942 3299 1182 3618Peak-hour factor, PHF 1.00 1.00 1.00 1.00 1.00 1.00 1.00 1.00 1.00 1.00 1.00 1.00Adj. Flow (vph) 15 165 25 45 50 10 5 70 125 40 405 25RTOR Reduction (vph) 0 10 0 0 8 0 0 49 0 0 4 0Lane Group Flow (vph) 15 180 0 45 52 0 5 146 0 40 426 0Turn Type Perm Perm Perm PermProtected Phases 8 4 6 2Permitted Phases 8 4 6 2Actuated Green, G (s) 13.8 13.8 13.8 13.8 42.7 42.7 42.7 42.7Effective Green, g (s) 13.8 13.8 13.8 13.8 42.7 42.7 42.7 42.7Actuated g/C Ratio 0.20 0.20 0.20 0.20 0.61 0.61 0.61 0.61Clearance Time (s) 6.8 6.8 6.8 6.8 6.7 6.7 6.7 6.7Vehicle Extension (s) 5.0 5.0 5.0 5.0 5.0 5.0 5.0 5.0Lane Grp Cap (vph) 266 371 236 369 575 2012 721 2207v/s Ratio Prot c0.10 0.03 0.04 c0.12v/s Ratio Perm 0.01 0.04 0.01 0.03v/c Ratio 0.06 0.49 0.19 0.14 0.01 0.07 0.06 0.19Uniform Delay, d1 22.8 25.0 23.4 23.2 5.4 5.6 5.5 6.0Progression Factor 1.00 1.00 1.00 1.00 1.00 1.00 1.00 1.00Incremental Delay, d2 0.2 2.1 0.8 0.4 0.0 0.1 0.1 0.2Delay (s) 23.0 27.0 24.3 23.6 5.4 5.6 5.7 6.2Level of Service C C C C A A A AApproach Delay (s) 26.7 23.9 5.6 6.2Approach LOS C C A A
Intersection SummaryHCM Average Control Delay 12.3 HCM Level of Service BHCM Volume to Capacity ratio 0.26Actuated Cycle Length (s) 70.0 Sum of lost time (s) 13.5Intersection Capacity Utilization 61.4% ICU Level of Service BAnalysis Period (min) 15c Critical Lane Group
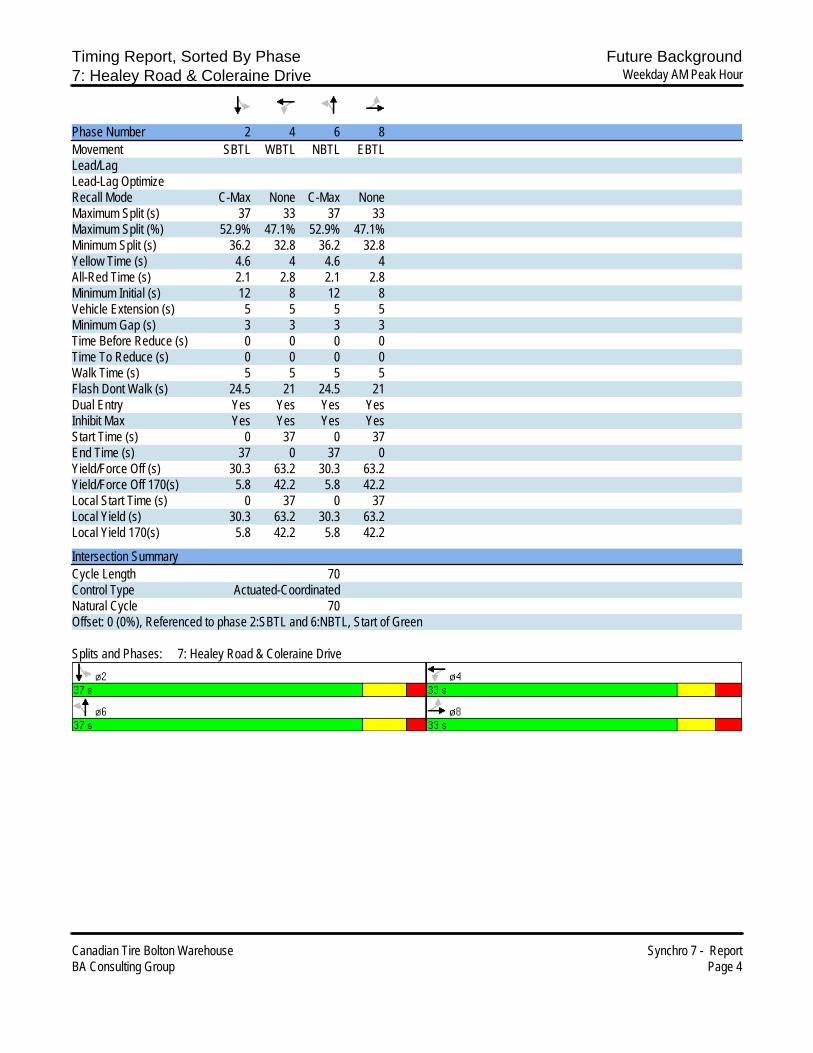
Timing Report, Sorted By Phase Future Background7: Healey Road & Coleraine Drive Weekday AM Peak Hour
Canadian Tire Bolton Warehouse Synchro 7 - ReportBA Consulting Group Page 4
Phase Number 2 4 6 8Movement SBTL WBTL NBTL EBTLLead/LagLead-Lag OptimizeRecall Mode C-Max None C-Max NoneMaximum Split (s) 37 33 37 33Maximum Split (%) 52.9% 47.1% 52.9% 47.1%Minimum Split (s) 36.2 32.8 36.2 32.8Yellow Time (s) 4.6 4 4.6 4All-Red Time (s) 2.1 2.8 2.1 2.8Minimum Initial (s) 12 8 12 8Vehicle Extension (s) 5 5 5 5Minimum Gap (s) 3 3 3 3Time Before Reduce (s) 0 0 0 0Time To Reduce (s) 0 0 0 0Walk Time (s) 5 5 5 5Flash Dont Walk (s) 24.5 21 24.5 21Dual Entry Yes Yes Yes YesInhibit Max Yes Yes Yes YesStart Time (s) 0 37 0 37End Time (s) 37 0 37 0Yield/Force Off (s) 30.3 63.2 30.3 63.2Yield/Force Off 170(s) 5.8 42.2 5.8 42.2Local Start Time (s) 0 37 0 37Local Yield (s) 30.3 63.2 30.3 63.2Local Yield 170(s) 5.8 42.2 5.8 42.2
Intersection SummaryCycle Length 70Control Type Actuated-CoordinatedNatural Cycle 70Offset: 0 (0%), Referenced to phase 2:SBTL and 6:NBTL, Start of Green
Splits and Phases: 7: Healey Road & Coleraine Drive

HCM Unsignalized Intersection Capacity Analysis Future Background10: Healey Road & Humber Station Road Weekday AM Peak Hour
Canadian Tire Bolton Warehouse Synchro 7 - ReportBA Consulting Group Page 5
Movement EBL EBT EBR WBL WBT WBR NBL NBT NBR SBL SBT SBRLane ConfigurationsSign Control Stop Stop Stop StopVolume (vph) 0 160 5 5 65 10 0 10 10 65 50 5Peak Hour Factor 1.00 1.00 1.00 1.00 1.00 1.00 1.00 1.00 1.00 1.00 1.00 1.00Hourly flow rate (vph) 0 160 5 5 65 10 0 10 10 65 50 5
Direction, Lane # EB 1 WB 1 NB 1 SB 1Volume Total (vph) 165 80 20 120Volume Left (vph) 0 5 0 65Volume Right (vph) 5 10 10 5Hadj (s) -0.02 -0.06 -0.30 0.08Departure Headway (s) 4.3 4.4 4.3 4.6Degree Utilization, x 0.20 0.10 0.02 0.15Capacity (veh/h) 807 783 777 741Control Delay (s) 8.4 7.8 7.4 8.4Approach Delay (s) 8.4 7.8 7.4 8.4Approach LOS A A A A
Intersection SummaryDelay 8.2HCM Level of Service AIntersection Capacity Utilization 28.6% ICU Level of Service AAnalysis Period (min) 15
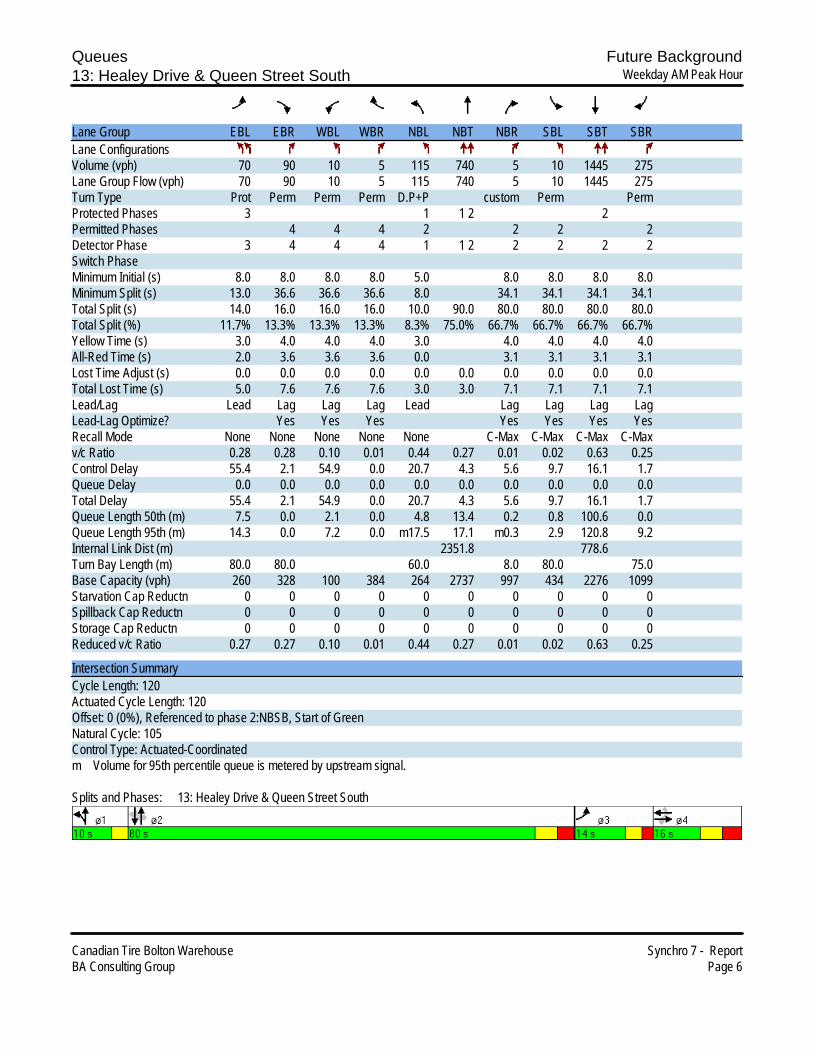
Queues Future Background13: Healey Drive & Queen Street South Weekday AM Peak Hour
Canadian Tire Bolton Warehouse Synchro 7 - ReportBA Consulting Group Page 6
Lane Group EBL EBR WBL WBR NBL NBT NBR SBL SBT SBRLane ConfigurationsVolume (vph) 70 90 10 5 115 740 5 10 1445 275Lane Group Flow (vph) 70 90 10 5 115 740 5 10 1445 275Turn Type Prot Perm Perm Perm D.P+P custom Perm PermProtected Phases 3 1 1 2 2Permitted Phases 4 4 4 2 2 2 2Detector Phase 3 4 4 4 1 1 2 2 2 2 2Switch PhaseMinimum Initial (s) 8.0 8.0 8.0 8.0 5.0 8.0 8.0 8.0 8.0Minimum Split (s) 13.0 36.6 36.6 36.6 8.0 34.1 34.1 34.1 34.1Total Split (s) 14.0 16.0 16.0 16.0 10.0 90.0 80.0 80.0 80.0 80.0Total Split (%) 11.7% 13.3% 13.3% 13.3% 8.3% 75.0% 66.7% 66.7% 66.7% 66.7%Yellow Time (s) 3.0 4.0 4.0 4.0 3.0 4.0 4.0 4.0 4.0All-Red Time (s) 2.0 3.6 3.6 3.6 0.0 3.1 3.1 3.1 3.1Lost Time Adjust (s) 0.0 0.0 0.0 0.0 0.0 0.0 0.0 0.0 0.0 0.0Total Lost Time (s) 5.0 7.6 7.6 7.6 3.0 3.0 7.1 7.1 7.1 7.1Lead/Lag Lead Lag Lag Lag Lead Lag Lag Lag LagLead-Lag Optimize? Yes Yes Yes Yes Yes Yes YesRecall Mode None None None None None C-Max C-Max C-Max C-Maxv/c Ratio 0.28 0.28 0.10 0.01 0.44 0.27 0.01 0.02 0.63 0.25Control Delay 55.4 2.1 54.9 0.0 20.7 4.3 5.6 9.7 16.1 1.7Queue Delay 0.0 0.0 0.0 0.0 0.0 0.0 0.0 0.0 0.0 0.0Total Delay 55.4 2.1 54.9 0.0 20.7 4.3 5.6 9.7 16.1 1.7Queue Length 50th (m) 7.5 0.0 2.1 0.0 4.8 13.4 0.2 0.8 100.6 0.0Queue Length 95th (m) 14.3 0.0 7.2 0.0 m17.5 17.1 m0.3 2.9 120.8 9.2Internal Link Dist (m) 2351.8 778.6Turn Bay Length (m) 80.0 80.0 60.0 8.0 80.0 75.0Base Capacity (vph) 260 328 100 384 264 2737 997 434 2276 1099Starvation Cap Reductn 0 0 0 0 0 0 0 0 0 0Spillback Cap Reductn 0 0 0 0 0 0 0 0 0 0Storage Cap Reductn 0 0 0 0 0 0 0 0 0 0Reduced v/c Ratio 0.27 0.27 0.10 0.01 0.44 0.27 0.01 0.02 0.63 0.25
Intersection SummaryCycle Length: 120Actuated Cycle Length: 120Offset: 0 (0%), Referenced to phase 2:NBSB, Start of GreenNatural Cycle: 105Control Type: Actuated-Coordinatedm Volume for 95th percentile queue is metered by upstream signal.
Splits and Phases: 13: Healey Drive & Queen Street South
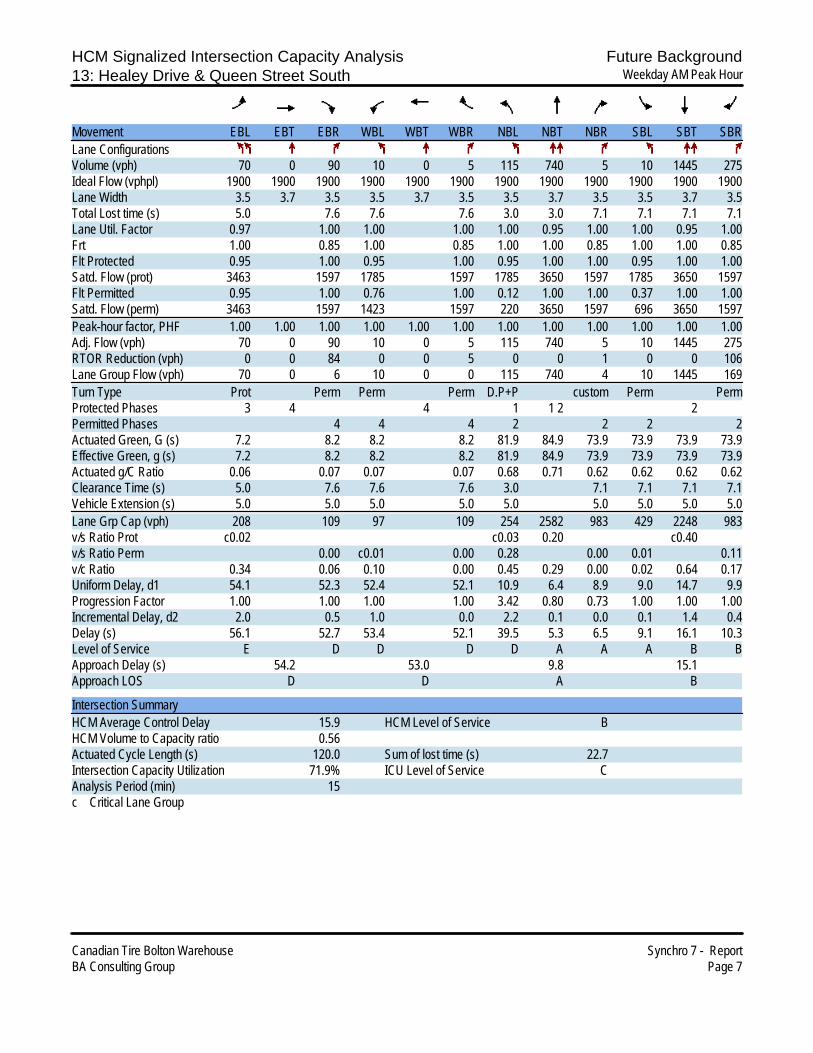
HCM Signalized Intersection Capacity Analysis Future Background13: Healey Drive & Queen Street South Weekday AM Peak Hour
Canadian Tire Bolton Warehouse Synchro 7 - ReportBA Consulting Group Page 7
Movement EBL EBT EBR WBL WBT WBR NBL NBT NBR SBL SBT SBRLane ConfigurationsVolume (vph) 70 0 90 10 0 5 115 740 5 10 1445 275Ideal Flow (vphpl) 1900 1900 1900 1900 1900 1900 1900 1900 1900 1900 1900 1900Lane Width 3.5 3.7 3.5 3.5 3.7 3.5 3.5 3.7 3.5 3.5 3.7 3.5Total Lost time (s) 5.0 7.6 7.6 7.6 3.0 3.0 7.1 7.1 7.1 7.1Lane Util. Factor 0.97 1.00 1.00 1.00 1.00 0.95 1.00 1.00 0.95 1.00Frt 1.00 0.85 1.00 0.85 1.00 1.00 0.85 1.00 1.00 0.85Flt Protected 0.95 1.00 0.95 1.00 0.95 1.00 1.00 0.95 1.00 1.00Satd. Flow (prot) 3463 1597 1785 1597 1785 3650 1597 1785 3650 1597Flt Permitted 0.95 1.00 0.76 1.00 0.12 1.00 1.00 0.37 1.00 1.00Satd. Flow (perm) 3463 1597 1423 1597 220 3650 1597 696 3650 1597Peak-hour factor, PHF 1.00 1.00 1.00 1.00 1.00 1.00 1.00 1.00 1.00 1.00 1.00 1.00Adj. Flow (vph) 70 0 90 10 0 5 115 740 5 10 1445 275RTOR Reduction (vph) 0 0 84 0 0 5 0 0 1 0 0 106Lane Group Flow (vph) 70 0 6 10 0 0 115 740 4 10 1445 169Turn Type Prot Perm Perm Perm D.P+P custom Perm PermProtected Phases 3 4 4 1 1 2 2Permitted Phases 4 4 4 2 2 2 2Actuated Green, G (s) 7.2 8.2 8.2 8.2 81.9 84.9 73.9 73.9 73.9 73.9Effective Green, g (s) 7.2 8.2 8.2 8.2 81.9 84.9 73.9 73.9 73.9 73.9Actuated g/C Ratio 0.06 0.07 0.07 0.07 0.68 0.71 0.62 0.62 0.62 0.62Clearance Time (s) 5.0 7.6 7.6 7.6 3.0 7.1 7.1 7.1 7.1Vehicle Extension (s) 5.0 5.0 5.0 5.0 5.0 5.0 5.0 5.0 5.0Lane Grp Cap (vph) 208 109 97 109 254 2582 983 429 2248 983v/s Ratio Prot c0.02 c0.03 0.20 c0.40v/s Ratio Perm 0.00 c0.01 0.00 0.28 0.00 0.01 0.11v/c Ratio 0.34 0.06 0.10 0.00 0.45 0.29 0.00 0.02 0.64 0.17Uniform Delay, d1 54.1 52.3 52.4 52.1 10.9 6.4 8.9 9.0 14.7 9.9Progression Factor 1.00 1.00 1.00 1.00 3.42 0.80 0.73 1.00 1.00 1.00Incremental Delay, d2 2.0 0.5 1.0 0.0 2.2 0.1 0.0 0.1 1.4 0.4Delay (s) 56.1 52.7 53.4 52.1 39.5 5.3 6.5 9.1 16.1 10.3Level of Service E D D D D A A A B BApproach Delay (s) 54.2 53.0 9.8 15.1Approach LOS D D A B
Intersection SummaryHCM Average Control Delay 15.9 HCM Level of Service BHCM Volume to Capacity ratio 0.56Actuated Cycle Length (s) 120.0 Sum of lost time (s) 22.7Intersection Capacity Utilization 71.9% ICU Level of Service CAnalysis Period (min) 15c Critical Lane Group

Timing Report, Sorted By Phase Future Background13: Healey Drive & Queen Street South Weekday AM Peak Hour
Canadian Tire Bolton Warehouse Synchro 7 - ReportBA Consulting Group Page 8
Phase Number 1 2 3 4Movement NBTL NBSB EBL EBWBLead/Lag Lead Lag Lead LagLead-Lag Optimize Yes YesRecall Mode None C-Max None NoneMaximum Split (s) 10 80 14 16Maximum Split (%) 8.3% 66.7% 11.7% 13.3%Minimum Split (s) 8 34.1 13 36.6Yellow Time (s) 3 4 3 4All-Red Time (s) 0 3.1 2 3.6Minimum Initial (s) 5 8 8 8Vehicle Extension (s) 5 5 5 5Minimum Gap (s) 3 3 3 3Time Before Reduce (s) 0 0 0 0Time To Reduce (s) 0 0 0 0Walk Time (s) 5 5Flash Dont Walk (s) 22 24Dual Entry No Yes No YesInhibit Max Yes Yes Yes YesStart Time (s) 110 0 80 94End Time (s) 0 80 94 110Yield/Force Off (s) 117 72.9 89 102.4Yield/Force Off 170(s) 117 50.9 89 78.4Local Start Time (s) 110 0 80 94Local Yield (s) 117 72.9 89 102.4Local Yield 170(s) 117 50.9 89 78.4
Intersection SummaryCycle Length 120Control Type Actuated-CoordinatedNatural Cycle 105Offset: 0 (0%), Referenced to phase 2:NBSB, Start of Green
Splits and Phases: 13: Healey Drive & Queen Street South
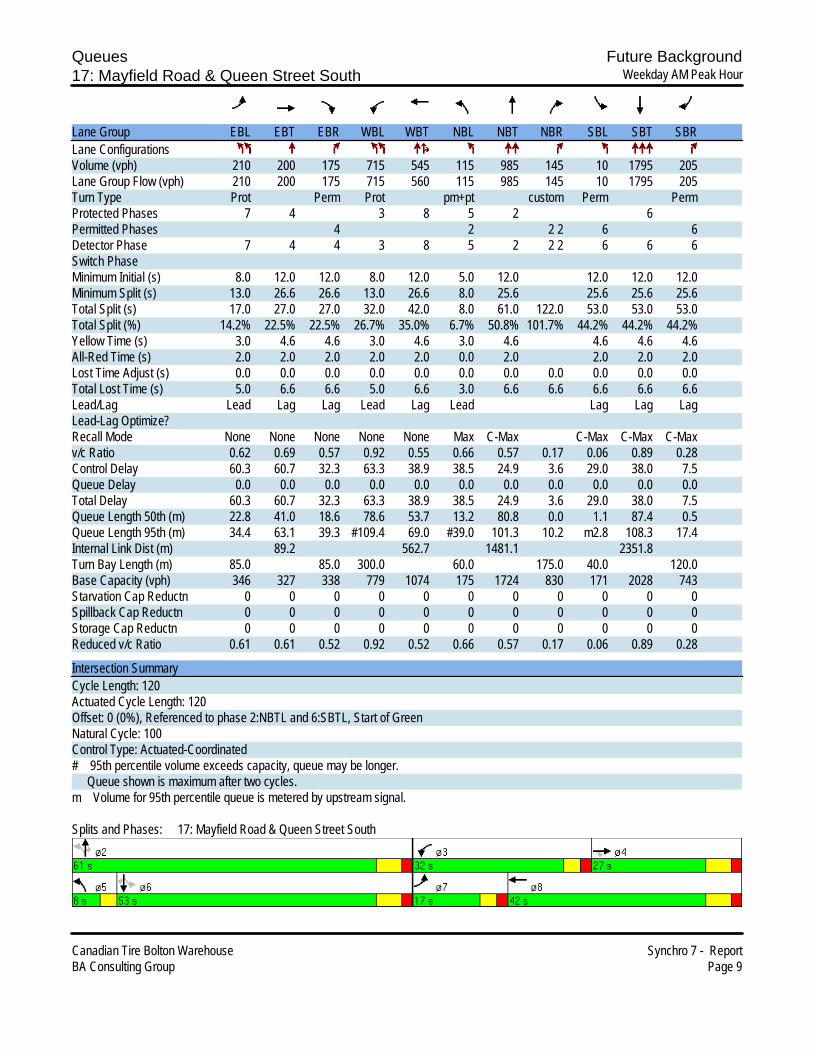
Queues Future Background17: Mayfield Road & Queen Street South Weekday AM Peak Hour
Canadian Tire Bolton Warehouse Synchro 7 - ReportBA Consulting Group Page 9
Lane Group EBL EBT EBR WBL WBT NBL NBT NBR SBL SBT SBRLane ConfigurationsVolume (vph) 210 200 175 715 545 115 985 145 10 1795 205Lane Group Flow (vph) 210 200 175 715 560 115 985 145 10 1795 205Turn Type Prot Perm Prot pm+pt custom Perm PermProtected Phases 7 4 3 8 5 2 6Permitted Phases 4 2 2 2 6 6Detector Phase 7 4 4 3 8 5 2 2 2 6 6 6Switch PhaseMinimum Initial (s) 8.0 12.0 12.0 8.0 12.0 5.0 12.0 12.0 12.0 12.0Minimum Split (s) 13.0 26.6 26.6 13.0 26.6 8.0 25.6 25.6 25.6 25.6Total Split (s) 17.0 27.0 27.0 32.0 42.0 8.0 61.0 122.0 53.0 53.0 53.0Total Split (%) 14.2% 22.5% 22.5% 26.7% 35.0% 6.7% 50.8% 101.7% 44.2% 44.2% 44.2%Yellow Time (s) 3.0 4.6 4.6 3.0 4.6 3.0 4.6 4.6 4.6 4.6All-Red Time (s) 2.0 2.0 2.0 2.0 2.0 0.0 2.0 2.0 2.0 2.0Lost Time Adjust (s) 0.0 0.0 0.0 0.0 0.0 0.0 0.0 0.0 0.0 0.0 0.0Total Lost Time (s) 5.0 6.6 6.6 5.0 6.6 3.0 6.6 6.6 6.6 6.6 6.6Lead/Lag Lead Lag Lag Lead Lag Lead Lag Lag LagLead-Lag Optimize?Recall Mode None None None None None Max C-Max C-Max C-Max C-Maxv/c Ratio 0.62 0.69 0.57 0.92 0.55 0.66 0.57 0.17 0.06 0.89 0.28Control Delay 60.3 60.7 32.3 63.3 38.9 38.5 24.9 3.6 29.0 38.0 7.5Queue Delay 0.0 0.0 0.0 0.0 0.0 0.0 0.0 0.0 0.0 0.0 0.0Total Delay 60.3 60.7 32.3 63.3 38.9 38.5 24.9 3.6 29.0 38.0 7.5Queue Length 50th (m) 22.8 41.0 18.6 78.6 53.7 13.2 80.8 0.0 1.1 87.4 0.5Queue Length 95th (m) 34.4 63.1 39.3 #109.4 69.0 #39.0 101.3 10.2 m2.8 108.3 17.4Internal Link Dist (m) 89.2 562.7 1481.1 2351.8Turn Bay Length (m) 85.0 85.0 300.0 60.0 175.0 40.0 120.0Base Capacity (vph) 346 327 338 779 1074 175 1724 830 171 2028 743Starvation Cap Reductn 0 0 0 0 0 0 0 0 0 0 0Spillback Cap Reductn 0 0 0 0 0 0 0 0 0 0 0Storage Cap Reductn 0 0 0 0 0 0 0 0 0 0 0Reduced v/c Ratio 0.61 0.61 0.52 0.92 0.52 0.66 0.57 0.17 0.06 0.89 0.28
Intersection SummaryCycle Length: 120Actuated Cycle Length: 120Offset: 0 (0%), Referenced to phase 2:NBTL and 6:SBTL, Start of GreenNatural Cycle: 100Control Type: Actuated-Coordinated# 95th percentile volume exceeds capacity, queue may be longer. Queue shown is maximum after two cycles.m Volume for 95th percentile queue is metered by upstream signal.
Splits and Phases: 17: Mayfield Road & Queen Street South
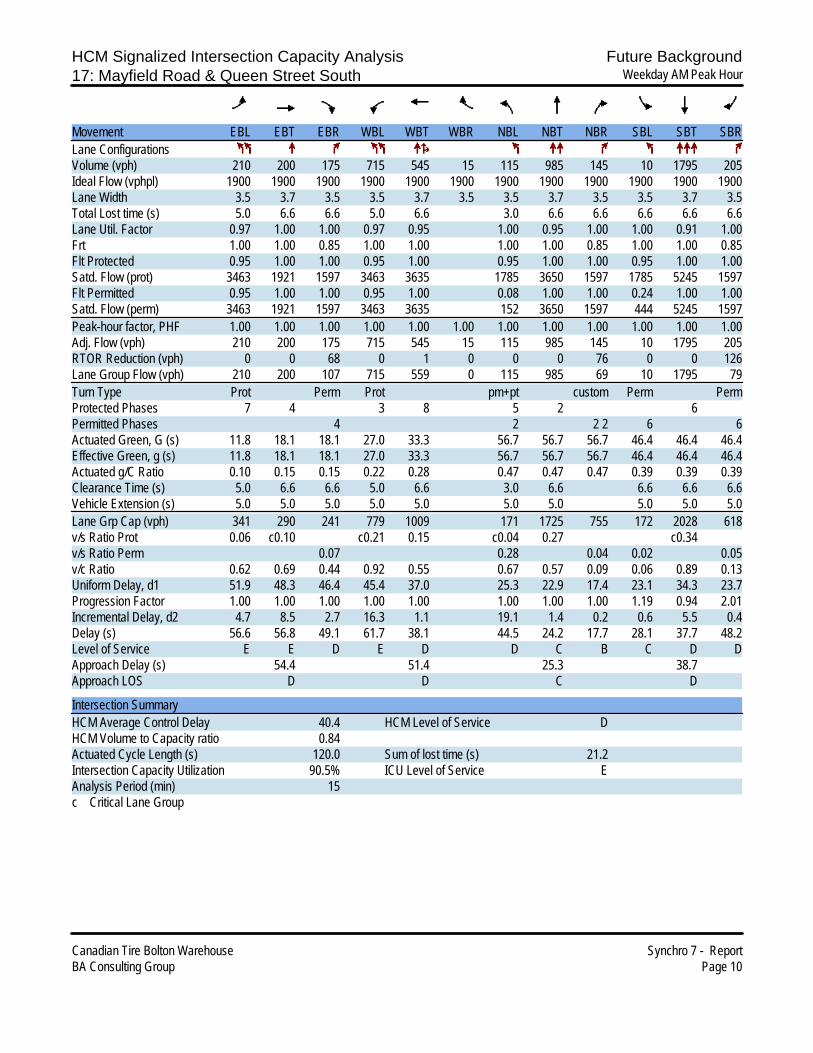
HCM Signalized Intersection Capacity Analysis Future Background17: Mayfield Road & Queen Street South Weekday AM Peak Hour
Canadian Tire Bolton Warehouse Synchro 7 - ReportBA Consulting Group Page 10
Movement EBL EBT EBR WBL WBT WBR NBL NBT NBR SBL SBT SBRLane ConfigurationsVolume (vph) 210 200 175 715 545 15 115 985 145 10 1795 205Ideal Flow (vphpl) 1900 1900 1900 1900 1900 1900 1900 1900 1900 1900 1900 1900Lane Width 3.5 3.7 3.5 3.5 3.7 3.5 3.5 3.7 3.5 3.5 3.7 3.5Total Lost time (s) 5.0 6.6 6.6 5.0 6.6 3.0 6.6 6.6 6.6 6.6 6.6Lane Util. Factor 0.97 1.00 1.00 0.97 0.95 1.00 0.95 1.00 1.00 0.91 1.00Frt 1.00 1.00 0.85 1.00 1.00 1.00 1.00 0.85 1.00 1.00 0.85Flt Protected 0.95 1.00 1.00 0.95 1.00 0.95 1.00 1.00 0.95 1.00 1.00Satd. Flow (prot) 3463 1921 1597 3463 3635 1785 3650 1597 1785 5245 1597Flt Permitted 0.95 1.00 1.00 0.95 1.00 0.08 1.00 1.00 0.24 1.00 1.00Satd. Flow (perm) 3463 1921 1597 3463 3635 152 3650 1597 444 5245 1597Peak-hour factor, PHF 1.00 1.00 1.00 1.00 1.00 1.00 1.00 1.00 1.00 1.00 1.00 1.00Adj. Flow (vph) 210 200 175 715 545 15 115 985 145 10 1795 205RTOR Reduction (vph) 0 0 68 0 1 0 0 0 76 0 0 126Lane Group Flow (vph) 210 200 107 715 559 0 115 985 69 10 1795 79Turn Type Prot Perm Prot pm+pt custom Perm PermProtected Phases 7 4 3 8 5 2 6Permitted Phases 4 2 2 2 6 6Actuated Green, G (s) 11.8 18.1 18.1 27.0 33.3 56.7 56.7 56.7 46.4 46.4 46.4Effective Green, g (s) 11.8 18.1 18.1 27.0 33.3 56.7 56.7 56.7 46.4 46.4 46.4Actuated g/C Ratio 0.10 0.15 0.15 0.22 0.28 0.47 0.47 0.47 0.39 0.39 0.39Clearance Time (s) 5.0 6.6 6.6 5.0 6.6 3.0 6.6 6.6 6.6 6.6Vehicle Extension (s) 5.0 5.0 5.0 5.0 5.0 5.0 5.0 5.0 5.0 5.0Lane Grp Cap (vph) 341 290 241 779 1009 171 1725 755 172 2028 618v/s Ratio Prot 0.06 c0.10 c0.21 0.15 c0.04 0.27 c0.34v/s Ratio Perm 0.07 0.28 0.04 0.02 0.05v/c Ratio 0.62 0.69 0.44 0.92 0.55 0.67 0.57 0.09 0.06 0.89 0.13Uniform Delay, d1 51.9 48.3 46.4 45.4 37.0 25.3 22.9 17.4 23.1 34.3 23.7Progression Factor 1.00 1.00 1.00 1.00 1.00 1.00 1.00 1.00 1.19 0.94 2.01Incremental Delay, d2 4.7 8.5 2.7 16.3 1.1 19.1 1.4 0.2 0.6 5.5 0.4Delay (s) 56.6 56.8 49.1 61.7 38.1 44.5 24.2 17.7 28.1 37.7 48.2Level of Service E E D E D D C B C D DApproach Delay (s) 54.4 51.4 25.3 38.7Approach LOS D D C D
Intersection SummaryHCM Average Control Delay 40.4 HCM Level of Service DHCM Volume to Capacity ratio 0.84Actuated Cycle Length (s) 120.0 Sum of lost time (s) 21.2Intersection Capacity Utilization 90.5% ICU Level of Service EAnalysis Period (min) 15c Critical Lane Group

Timing Report, Sorted By Phase Future Background17: Mayfield Road & Queen Street South Weekday AM Peak Hour
Canadian Tire Bolton Warehouse Synchro 7 - ReportBA Consulting Group Page 11
Phase Number 2 3 4 5 6 7 8Movement NBTL WBL EBT NBL SBTL EBL WBTLead/Lag Lead Lag Lead Lag Lead LagLead-Lag OptimizeRecall Mode C-Max None None Max C-Max None NoneMaximum Split (s) 61 32 27 8 53 17 42Maximum Split (%) 50.8% 26.7% 22.5% 6.7% 44.2% 14.2% 35.0%Minimum Split (s) 25.6 13 26.6 8 25.6 13 26.6Yellow Time (s) 4.6 3 4.6 3 4.6 3 4.6All-Red Time (s) 2 2 2 0 2 2 2Minimum Initial (s) 12 8 12 5 12 8 12Vehicle Extension (s) 5 5 5 5 5 5 5Minimum Gap (s) 3 3 3 3 3 3 3Time Before Reduce (s) 0 0 0 0 0 0 0Time To Reduce (s) 0 0 0 0 0 0 0Walk Time (s) 5 5 5 5Flash Dont Walk (s) 14 15 14 15Dual Entry Yes Yes Yes Yes Yes No YesInhibit Max Yes Yes Yes Yes Yes Yes YesStart Time (s) 112 53 85 112 0 53 70End Time (s) 53 85 112 0 53 70 112Yield/Force Off (s) 46.4 80 105.4 117 46.4 65 105.4Yield/Force Off 170(s) 32.4 80 90.4 117 32.4 65 90.4Local Start Time (s) 112 53 85 112 0 53 70Local Yield (s) 46.4 80 105.4 117 46.4 65 105.4Local Yield 170(s) 32.4 80 90.4 117 32.4 65 90.4
Intersection SummaryCycle Length 120Control Type Actuated-CoordinatedNatural Cycle 100Offset: 0 (0%), Referenced to phase 2:NBTL and 6:SBTL, Start of Green
Splits and Phases: 17: Mayfield Road & Queen Street South
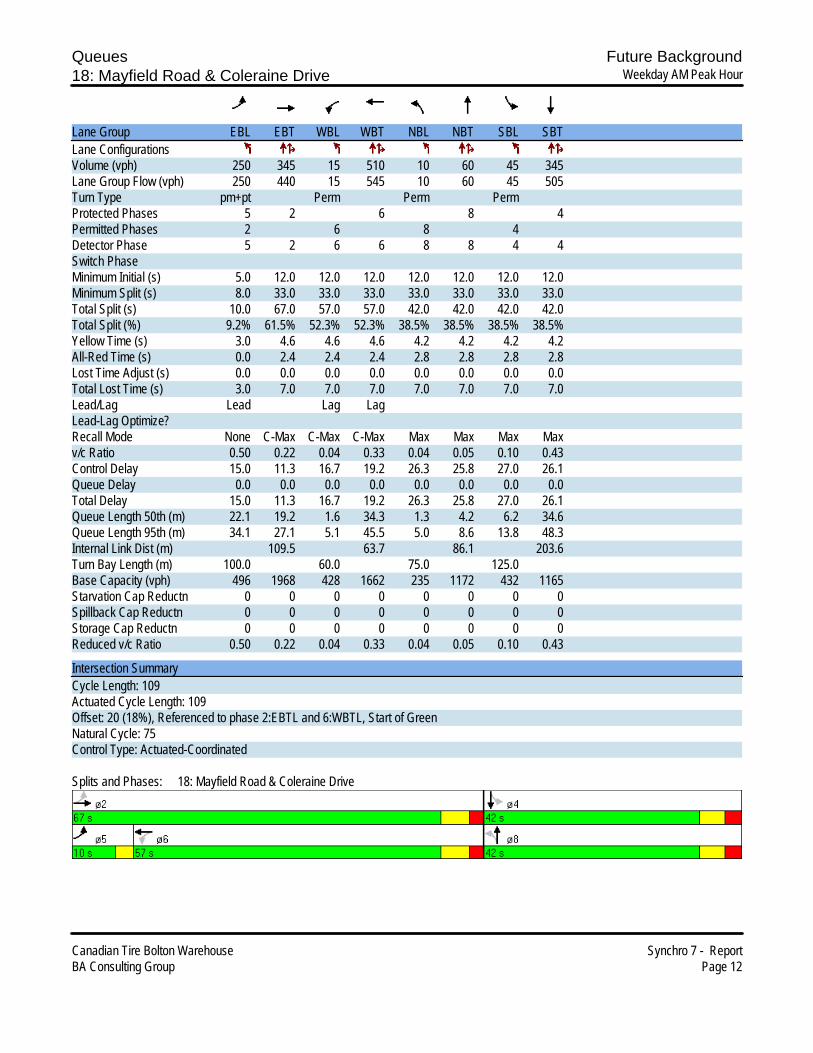
Queues Future Background18: Mayfield Road & Coleraine Drive Weekday AM Peak Hour
Canadian Tire Bolton Warehouse Synchro 7 - ReportBA Consulting Group Page 12
Lane Group EBL EBT WBL WBT NBL NBT SBL SBTLane ConfigurationsVolume (vph) 250 345 15 510 10 60 45 345Lane Group Flow (vph) 250 440 15 545 10 60 45 505Turn Type pm+pt Perm Perm PermProtected Phases 5 2 6 8 4Permitted Phases 2 6 8 4Detector Phase 5 2 6 6 8 8 4 4Switch PhaseMinimum Initial (s) 5.0 12.0 12.0 12.0 12.0 12.0 12.0 12.0Minimum Split (s) 8.0 33.0 33.0 33.0 33.0 33.0 33.0 33.0Total Split (s) 10.0 67.0 57.0 57.0 42.0 42.0 42.0 42.0Total Split (%) 9.2% 61.5% 52.3% 52.3% 38.5% 38.5% 38.5% 38.5%Yellow Time (s) 3.0 4.6 4.6 4.6 4.2 4.2 4.2 4.2All-Red Time (s) 0.0 2.4 2.4 2.4 2.8 2.8 2.8 2.8Lost Time Adjust (s) 0.0 0.0 0.0 0.0 0.0 0.0 0.0 0.0Total Lost Time (s) 3.0 7.0 7.0 7.0 7.0 7.0 7.0 7.0Lead/Lag Lead Lag LagLead-Lag Optimize?Recall Mode None C-Max C-Max C-Max Max Max Max Maxv/c Ratio 0.50 0.22 0.04 0.33 0.04 0.05 0.10 0.43Control Delay 15.0 11.3 16.7 19.2 26.3 25.8 27.0 26.1Queue Delay 0.0 0.0 0.0 0.0 0.0 0.0 0.0 0.0Total Delay 15.0 11.3 16.7 19.2 26.3 25.8 27.0 26.1Queue Length 50th (m) 22.1 19.2 1.6 34.3 1.3 4.2 6.2 34.6Queue Length 95th (m) 34.1 27.1 5.1 45.5 5.0 8.6 13.8 48.3Internal Link Dist (m) 109.5 63.7 86.1 203.6Turn Bay Length (m) 100.0 60.0 75.0 125.0Base Capacity (vph) 496 1968 428 1662 235 1172 432 1165Starvation Cap Reductn 0 0 0 0 0 0 0 0Spillback Cap Reductn 0 0 0 0 0 0 0 0Storage Cap Reductn 0 0 0 0 0 0 0 0Reduced v/c Ratio 0.50 0.22 0.04 0.33 0.04 0.05 0.10 0.43
Intersection SummaryCycle Length: 109Actuated Cycle Length: 109Offset: 20 (18%), Referenced to phase 2:EBTL and 6:WBTL, Start of GreenNatural Cycle: 75Control Type: Actuated-Coordinated
Splits and Phases: 18: Mayfield Road & Coleraine Drive

HCM Signalized Intersection Capacity Analysis Future Background18: Mayfield Road & Coleraine Drive Weekday AM Peak Hour
Canadian Tire Bolton Warehouse Synchro 7 - ReportBA Consulting Group Page 13
Movement EBL EBT EBR WBL WBT WBR NBL NBT NBR SBL SBT SBRLane ConfigurationsVolume (vph) 250 345 95 15 510 35 10 60 0 45 345 160Ideal Flow (vphpl) 1900 1900 1900 1900 1900 1900 1900 1900 1900 1900 1900 1900Lane Width 3.5 3.7 3.5 3.5 3.7 3.5 3.5 3.7 3.5 3.5 3.7 3.5Total Lost time (s) 3.0 7.0 7.0 7.0 7.0 7.0 7.0 7.0Lane Util. Factor 1.00 0.95 1.00 0.95 1.00 0.95 1.00 0.95Frt 1.00 0.97 1.00 0.99 1.00 1.00 1.00 0.95Flt Protected 0.95 1.00 0.95 1.00 0.95 1.00 0.95 1.00Satd. Flow (prot) 1785 3532 1785 3615 1785 3650 1785 3477Flt Permitted 0.39 1.00 0.50 1.00 0.39 1.00 0.72 1.00Satd. Flow (perm) 729 3532 933 3615 731 3650 1345 3477Peak-hour factor, PHF 1.00 1.00 1.00 1.00 1.00 1.00 1.00 1.00 1.00 1.00 1.00 1.00Adj. Flow (vph) 250 345 95 15 510 35 10 60 0 45 345 160RTOR Reduction (vph) 0 23 0 0 4 0 0 0 0 0 50 0Lane Group Flow (vph) 250 417 0 15 541 0 10 60 0 45 455 0Turn Type pm+pt Perm Perm PermProtected Phases 5 2 6 8 4Permitted Phases 2 6 8 4Actuated Green, G (s) 60.0 60.0 50.0 50.0 35.0 35.0 35.0 35.0Effective Green, g (s) 60.0 60.0 50.0 50.0 35.0 35.0 35.0 35.0Actuated g/C Ratio 0.55 0.55 0.46 0.46 0.32 0.32 0.32 0.32Clearance Time (s) 3.0 7.0 7.0 7.0 7.0 7.0 7.0 7.0Vehicle Extension (s) 5.0 5.0 5.0 5.0 5.0 5.0 5.0 5.0Lane Grp Cap (vph) 469 1944 428 1658 235 1172 432 1116v/s Ratio Prot c0.03 0.12 0.15 0.02 c0.13v/s Ratio Perm c0.26 0.02 0.01 0.03v/c Ratio 0.53 0.21 0.04 0.33 0.04 0.05 0.10 0.41Uniform Delay, d1 13.8 12.5 16.2 18.8 25.5 25.5 26.0 28.9Progression Factor 1.00 1.00 1.00 1.00 1.00 1.00 1.00 1.00Incremental Delay, d2 2.1 0.3 0.2 0.5 0.3 0.1 0.5 1.1Delay (s) 15.9 12.7 16.4 19.3 25.8 25.6 26.5 30.0Level of Service B B B B C C C CApproach Delay (s) 13.9 19.2 25.6 29.7Approach LOS B B C C
Intersection SummaryHCM Average Control Delay 20.6 HCM Level of Service CHCM Volume to Capacity ratio 0.47Actuated Cycle Length (s) 109.0 Sum of lost time (s) 10.0Intersection Capacity Utilization 58.7% ICU Level of Service BAnalysis Period (min) 15c Critical Lane Group

Timing Report, Sorted By Phase Future Background18: Mayfield Road & Coleraine Drive Weekday AM Peak Hour
Canadian Tire Bolton Warehouse Synchro 7 - ReportBA Consulting Group Page 14
Phase Number 2 4 5 6 8Movement EBTL SBTL EBL WBTL NBTLLead/Lag Lead LagLead-Lag OptimizeRecall Mode C-Max Max None C-Max MaxMaximum Split (s) 67 42 10 57 42Maximum Split (%) 61.5% 38.5% 9.2% 52.3% 38.5%Minimum Split (s) 33 33 8 33 33Yellow Time (s) 4.6 4.2 3 4.6 4.2All-Red Time (s) 2.4 2.8 0 2.4 2.8Minimum Initial (s) 12 12 5 12 12Vehicle Extension (s) 5 5 5 5 5Minimum Gap (s) 3 3 3 3 3Time Before Reduce (s) 0 0 0 0 0Time To Reduce (s) 0 0 0 0 0Walk Time (s) 5 5 5 5Flash Dont Walk (s) 21 21 21 21Dual Entry Yes Yes No Yes YesInhibit Max Yes Yes Yes Yes YesStart Time (s) 10 77 10 20 77End Time (s) 77 10 20 77 10Yield/Force Off (s) 70 3 17 70 3Yield/Force Off 170(s) 49 91 17 49 91Local Start Time (s) 99 57 99 0 57Local Yield (s) 50 92 106 50 92Local Yield 170(s) 29 71 106 29 71
Intersection SummaryCycle Length 109Control Type Actuated-CoordinatedNatural Cycle 75Offset: 20 (18%), Referenced to phase 2:EBTL and 6:WBTL, Start of Green
Splits and Phases: 18: Mayfield Road & Coleraine Drive

HCM Unsignalized Intersection Capacity Analysis Future Background20: Mayfield Road & Humber Station Road Weekday AM Peak Hour
Canadian Tire Bolton Warehouse Synchro 7 - ReportBA Consulting Group Page 15
Movement EBL EBT EBR WBL WBT WBR NBL NBT NBR SBL SBT SBRLane ConfigurationsVolume (veh/h) 15 745 10 5 715 10 0 0 10 15 40 30Sign Control Free Free Stop StopGrade 0% 0% 0% 0%Peak Hour Factor 1.00 1.00 1.00 1.00 1.00 1.00 1.00 1.00 1.00 1.00 1.00 1.00Hourly flow rate (vph) 15 745 10 5 715 10 0 0 10 15 40 30PedestriansLane Width (m)Walking Speed (m/s)Percent BlockageRight turn flare (veh)Median type None NoneMedian storage veh)Upstream signal (m)pX, platoon unblockedvC, conflicting volume 725 755 1560 1515 750 1520 1515 720vC1, stage 1 conf volvC2, stage 2 conf volvCu, unblocked vol 725 755 1560 1515 750 1520 1515 720tC, single (s) 4.1 4.1 7.1 6.5 6.2 7.1 6.5 6.2tC, 2 stage (s)tF (s) 2.2 2.2 3.5 4.0 3.3 3.5 4.0 3.3p0 queue free % 98 99 100 100 98 84 66 93cM capacity (veh/h) 887 865 62 118 415 94 118 431
Direction, Lane # EB 1 WB 1 NB 1 SB 1Volume Total 770 730 10 85Volume Left 15 5 0 15Volume Right 10 10 10 30cSH 887 865 415 150Volume to Capacity 0.02 0.01 0.02 0.57Queue Length 95th (m) 0.4 0.1 0.5 20.3Control Delay (s) 0.5 0.2 13.9 56.7Lane LOS A A B FApproach Delay (s) 0.5 0.2 13.9 56.7Approach LOS B F
Intersection SummaryAverage Delay 3.4Intersection Capacity Utilization 67.9% ICU Level of Service CAnalysis Period (min) 15
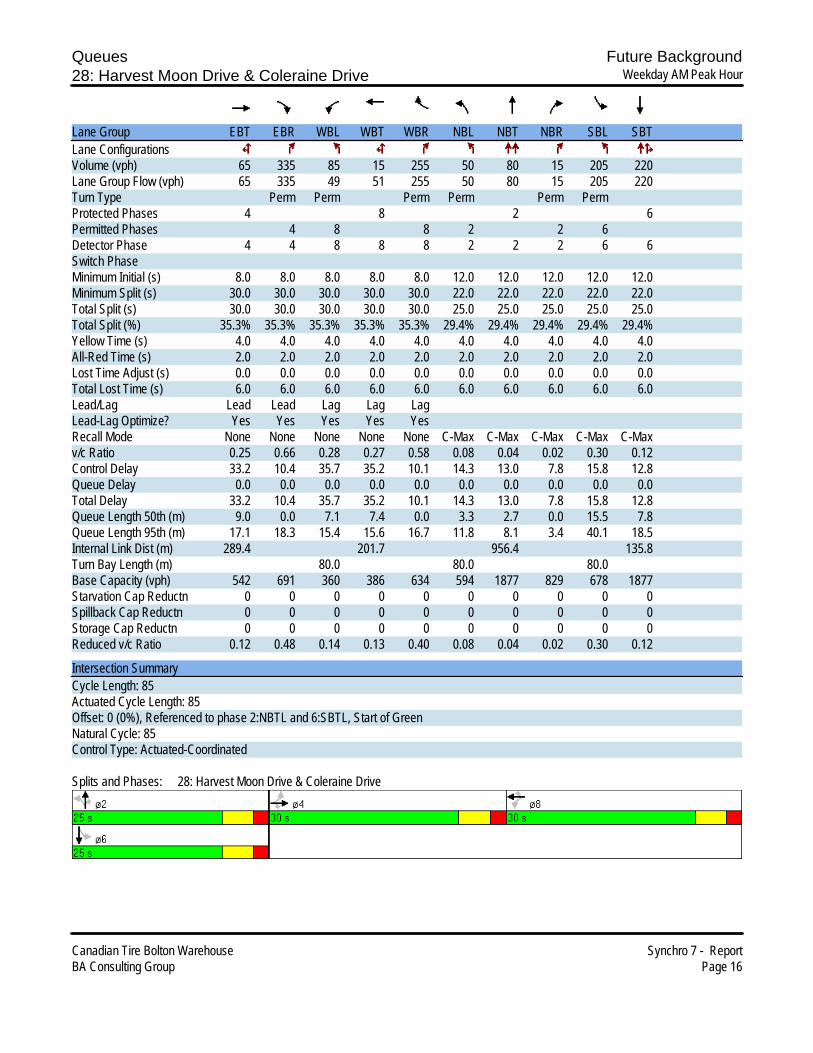
Queues Future Background28: Harvest Moon Drive & Coleraine Drive Weekday AM Peak Hour
Canadian Tire Bolton Warehouse Synchro 7 - ReportBA Consulting Group Page 16
Lane Group EBT EBR WBL WBT WBR NBL NBT NBR SBL SBTLane ConfigurationsVolume (vph) 65 335 85 15 255 50 80 15 205 220Lane Group Flow (vph) 65 335 49 51 255 50 80 15 205 220Turn Type Perm Perm Perm Perm Perm PermProtected Phases 4 8 2 6Permitted Phases 4 8 8 2 2 6Detector Phase 4 4 8 8 8 2 2 2 6 6Switch PhaseMinimum Initial (s) 8.0 8.0 8.0 8.0 8.0 12.0 12.0 12.0 12.0 12.0Minimum Split (s) 30.0 30.0 30.0 30.0 30.0 22.0 22.0 22.0 22.0 22.0Total Split (s) 30.0 30.0 30.0 30.0 30.0 25.0 25.0 25.0 25.0 25.0Total Split (%) 35.3% 35.3% 35.3% 35.3% 35.3% 29.4% 29.4% 29.4% 29.4% 29.4%Yellow Time (s) 4.0 4.0 4.0 4.0 4.0 4.0 4.0 4.0 4.0 4.0All-Red Time (s) 2.0 2.0 2.0 2.0 2.0 2.0 2.0 2.0 2.0 2.0Lost Time Adjust (s) 0.0 0.0 0.0 0.0 0.0 0.0 0.0 0.0 0.0 0.0Total Lost Time (s) 6.0 6.0 6.0 6.0 6.0 6.0 6.0 6.0 6.0 6.0Lead/Lag Lead Lead Lag Lag LagLead-Lag Optimize? Yes Yes Yes Yes YesRecall Mode None None None None None C-Max C-Max C-Max C-Max C-Maxv/c Ratio 0.25 0.66 0.28 0.27 0.58 0.08 0.04 0.02 0.30 0.12Control Delay 33.2 10.4 35.7 35.2 10.1 14.3 13.0 7.8 15.8 12.8Queue Delay 0.0 0.0 0.0 0.0 0.0 0.0 0.0 0.0 0.0 0.0Total Delay 33.2 10.4 35.7 35.2 10.1 14.3 13.0 7.8 15.8 12.8Queue Length 50th (m) 9.0 0.0 7.1 7.4 0.0 3.3 2.7 0.0 15.5 7.8Queue Length 95th (m) 17.1 18.3 15.4 15.6 16.7 11.8 8.1 3.4 40.1 18.5Internal Link Dist (m) 289.4 201.7 956.4 135.8Turn Bay Length (m) 80.0 80.0 80.0Base Capacity (vph) 542 691 360 386 634 594 1877 829 678 1877Starvation Cap Reductn 0 0 0 0 0 0 0 0 0 0Spillback Cap Reductn 0 0 0 0 0 0 0 0 0 0Storage Cap Reductn 0 0 0 0 0 0 0 0 0 0Reduced v/c Ratio 0.12 0.48 0.14 0.13 0.40 0.08 0.04 0.02 0.30 0.12
Intersection SummaryCycle Length: 85Actuated Cycle Length: 85Offset: 0 (0%), Referenced to phase 2:NBTL and 6:SBTL, Start of GreenNatural Cycle: 85Control Type: Actuated-Coordinated
Splits and Phases: 28: Harvest Moon Drive & Coleraine Drive

HCM Signalized Intersection Capacity Analysis Future Background28: Harvest Moon Drive & Coleraine Drive Weekday AM Peak Hour
Canadian Tire Bolton Warehouse Synchro 7 - ReportBA Consulting Group Page 17
Movement EBL EBT EBR WBL WBT WBR NBL NBT NBR SBL SBT SBRLane ConfigurationsVolume (vph) 0 65 335 85 15 255 50 80 15 205 220 0Ideal Flow (vphpl) 1900 1900 1900 1900 1900 1900 1900 1900 1900 1900 1900 1900Lane Width 3.5 3.7 3.5 3.5 3.7 3.5 3.5 3.7 3.5 3.5 3.7 3.5Total Lost time (s) 6.0 6.0 6.0 6.0 6.0 6.0 6.0 6.0 6.0 6.0Lane Util. Factor 1.00 1.00 0.95 0.95 1.00 1.00 0.95 1.00 1.00 0.95Frt 1.00 0.85 1.00 1.00 0.85 1.00 1.00 0.85 1.00 1.00Flt Protected 1.00 1.00 0.95 0.97 1.00 0.95 1.00 1.00 0.95 1.00Satd. Flow (prot) 1921 1597 1696 1763 1597 1785 3650 1597 1785 3650Flt Permitted 1.00 1.00 0.71 0.75 1.00 0.61 1.00 1.00 0.70 1.00Satd. Flow (perm) 1921 1597 1276 1367 1597 1154 3650 1597 1320 3650Peak-hour factor, PHF 1.00 1.00 1.00 1.00 1.00 1.00 1.00 1.00 1.00 1.00 1.00 1.00Adj. Flow (vph) 0 65 335 85 15 255 50 80 15 205 220 0RTOR Reduction (vph) 0 0 289 0 0 220 0 0 7 0 0 0Lane Group Flow (vph) 0 65 46 49 51 35 50 80 8 205 220 0Turn Type Perm Perm Perm Perm Perm Perm PermProtected Phases 4 8 2 6Permitted Phases 4 4 8 8 2 2 6Actuated Green, G (s) 11.7 11.7 11.6 11.6 11.6 43.7 43.7 43.7 43.7 43.7Effective Green, g (s) 11.7 11.7 11.6 11.6 11.6 43.7 43.7 43.7 43.7 43.7Actuated g/C Ratio 0.14 0.14 0.14 0.14 0.14 0.51 0.51 0.51 0.51 0.51Clearance Time (s) 6.0 6.0 6.0 6.0 6.0 6.0 6.0 6.0 6.0 6.0Vehicle Extension (s) 5.0 5.0 5.0 5.0 5.0 5.0 5.0 5.0 5.0 5.0Lane Grp Cap (vph) 264 220 174 187 218 593 1877 821 679 1877v/s Ratio Prot c0.03 0.02 0.06v/s Ratio Perm 0.03 c0.04 0.04 0.02 0.04 0.00 c0.16v/c Ratio 0.25 0.21 0.28 0.27 0.16 0.08 0.04 0.01 0.30 0.12Uniform Delay, d1 32.7 32.5 33.0 32.9 32.4 10.5 10.3 10.1 11.9 10.7Progression Factor 1.00 1.00 1.00 1.00 1.00 1.00 1.00 1.00 1.00 1.00Incremental Delay, d2 1.0 1.0 1.9 1.7 0.7 0.3 0.0 0.0 1.1 0.1Delay (s) 33.7 33.5 34.8 34.6 33.1 10.8 10.3 10.1 13.0 10.8Level of Service C C C C C B B B B BApproach Delay (s) 33.6 33.6 10.4 11.9Approach LOS C C B B
Intersection SummaryHCM Average Control Delay 24.1 HCM Level of Service CHCM Volume to Capacity ratio 0.29Actuated Cycle Length (s) 85.0 Sum of lost time (s) 18.0Intersection Capacity Utilization 52.4% ICU Level of Service AAnalysis Period (min) 15c Critical Lane Group
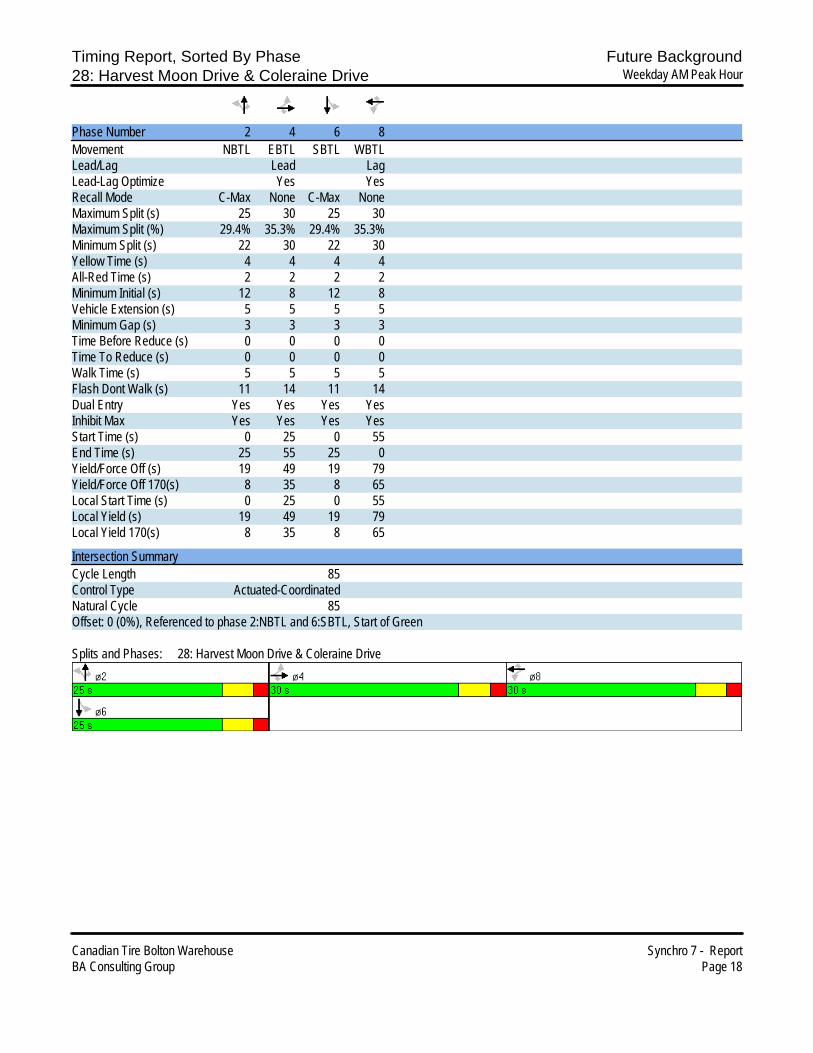
Timing Report, Sorted By Phase Future Background28: Harvest Moon Drive & Coleraine Drive Weekday AM Peak Hour
Canadian Tire Bolton Warehouse Synchro 7 - ReportBA Consulting Group Page 18
Phase Number 2 4 6 8Movement NBTL EBTL SBTL WBTLLead/Lag Lead LagLead-Lag Optimize Yes YesRecall Mode C-Max None C-Max NoneMaximum Split (s) 25 30 25 30Maximum Split (%) 29.4% 35.3% 29.4% 35.3%Minimum Split (s) 22 30 22 30Yellow Time (s) 4 4 4 4All-Red Time (s) 2 2 2 2Minimum Initial (s) 12 8 12 8Vehicle Extension (s) 5 5 5 5Minimum Gap (s) 3 3 3 3Time Before Reduce (s) 0 0 0 0Time To Reduce (s) 0 0 0 0Walk Time (s) 5 5 5 5Flash Dont Walk (s) 11 14 11 14Dual Entry Yes Yes Yes YesInhibit Max Yes Yes Yes YesStart Time (s) 0 25 0 55End Time (s) 25 55 25 0Yield/Force Off (s) 19 49 19 79Yield/Force Off 170(s) 8 35 8 65Local Start Time (s) 0 25 0 55Local Yield (s) 19 49 19 79Local Yield 170(s) 8 35 8 65
Intersection SummaryCycle Length 85Control Type Actuated-CoordinatedNatural Cycle 85Offset: 0 (0%), Referenced to phase 2:NBTL and 6:SBTL, Start of Green
Splits and Phases: 28: Harvest Moon Drive & Coleraine Drive

HCM Unsignalized Intersection Capacity Analysis Future Background5: Holland Drive & Coleraine Drive Weekday PM Peak Hour
Canadian Tire Bolton Warehouse Synchro 7 - ReportBA Consulting Group Page 1
Movement WBL WBR NBT NBR SBL SBTLane ConfigurationsVolume (veh/h) 15 180 370 5 65 160Sign Control Stop Free FreeGrade 0% 0% 0%Peak Hour Factor 1.00 1.00 1.00 1.00 1.00 1.00Hourly flow rate (vph) 15 180 370 5 65 160PedestriansLane Width (m)Walking Speed (m/s)Percent BlockageRight turn flare (veh)Median type None NoneMedian storage veh)Upstream signal (m)pX, platoon unblockedvC, conflicting volume 582 188 375vC1, stage 1 conf volvC2, stage 2 conf volvCu, unblocked vol 582 188 375tC, single (s) 6.8 6.9 4.1tC, 2 stage (s)tF (s) 3.5 3.3 2.2p0 queue free % 96 78 95cM capacity (veh/h) 424 829 1195
Direction, Lane # WB 1 WB 2 NB 1 NB 2 SB 1 SB 2 SB 3Volume Total 15 180 247 128 65 80 80Volume Left 15 0 0 0 65 0 0Volume Right 0 180 0 5 0 0 0cSH 424 829 1700 1700 1195 1700 1700Volume to Capacity 0.04 0.22 0.15 0.08 0.05 0.05 0.05Queue Length 95th (m) 0.8 5.8 0.0 0.0 1.2 0.0 0.0Control Delay (s) 13.8 10.5 0.0 0.0 8.2 0.0 0.0Lane LOS B B AApproach Delay (s) 10.8 0.0 2.4Approach LOS B
Intersection SummaryAverage Delay 3.3Intersection Capacity Utilization 28.2% ICU Level of Service AAnalysis Period (min) 15

Queues Future Background7: Healey Road & Coleraine Drive Weekday PM Peak Hour
Canadian Tire Bolton Warehouse Synchro 7 - ReportBA Consulting Group Page 2
Lane Group EBL EBT WBL WBT NBL NBT SBL SBTLane Group Flow (vph) 15 95 65 355 50 355 50 175v/c Ratio 0.07 0.17 0.18 0.65 0.08 0.19 0.09 0.09Control Delay 16.5 16.8 18.1 26.3 10.7 8.1 11.0 8.3Queue Delay 0.0 0.0 0.0 0.0 0.0 0.0 0.0 0.0Total Delay 16.5 16.8 18.1 26.3 10.7 8.1 11.0 8.3Queue Length 50th (m) 1.3 8.1 5.9 35.9 2.8 8.4 2.8 4.2Queue Length 95th (m) 4.4 15.0 11.9 50.9 8.8 17.4 8.9 10.0Internal Link Dist (m) 1348.5 958.1 2899.4 1053.0Turn Bay Length (m) 120.0 100.0 120.0 120.0Base Capacity (vph) 279 717 489 712 630 1878 530 1875Starvation Cap Reductn 0 0 0 0 0 0 0 0Spillback Cap Reductn 0 0 0 0 0 0 0 0Storage Cap Reductn 0 0 0 0 0 0 0 0Reduced v/c Ratio 0.05 0.13 0.13 0.50 0.08 0.19 0.09 0.09
Intersection Summary

HCM Signalized Intersection Capacity Analysis Future Background7: Healey Road & Coleraine Drive Weekday PM Peak Hour
Canadian Tire Bolton Warehouse Synchro 7 - ReportBA Consulting Group Page 3
Movement EBL EBT EBR WBL WBT WBR NBL NBT NBR SBL SBT SBRLane ConfigurationsVolume (vph) 15 90 5 65 300 55 50 270 85 50 145 30Ideal Flow (vphpl) 1900 1900 1900 1900 1900 1900 1900 1900 1900 1900 1900 1900Lane Width 3.5 3.7 3.5 3.5 3.7 3.5 3.5 3.7 3.5 3.5 3.7 3.5Total Lost time (s) 6.8 6.8 6.8 6.8 6.7 6.7 6.7 6.7Lane Util. Factor 1.00 1.00 1.00 1.00 1.00 0.95 1.00 0.95Frt 1.00 0.99 1.00 0.98 1.00 0.96 1.00 0.97Flt Protected 0.95 1.00 0.95 1.00 0.95 1.00 0.95 1.00Satd. Flow (prot) 1785 1906 1785 1876 1785 3519 1785 3556Flt Permitted 0.40 1.00 0.70 1.00 0.64 1.00 0.54 1.00Satd. Flow (perm) 746 1906 1307 1876 1205 3519 1013 3556Peak-hour factor, PHF 1.00 1.00 1.00 1.00 1.00 1.00 1.00 1.00 1.00 1.00 1.00 1.00Adj. Flow (vph) 15 90 5 65 300 55 50 270 85 50 145 30RTOR Reduction (vph) 0 4 0 0 11 0 0 36 0 0 14 0Lane Group Flow (vph) 15 91 0 65 344 0 50 319 0 50 161 0Turn Type Perm Perm Perm PermProtected Phases 8 4 6 2Permitted Phases 8 4 6 2Actuated Green, G (s) 19.9 19.9 19.9 19.9 36.6 36.6 36.6 36.6Effective Green, g (s) 19.9 19.9 19.9 19.9 36.6 36.6 36.6 36.6Actuated g/C Ratio 0.28 0.28 0.28 0.28 0.52 0.52 0.52 0.52Clearance Time (s) 6.8 6.8 6.8 6.8 6.7 6.7 6.7 6.7Vehicle Extension (s) 5.0 5.0 5.0 5.0 5.0 5.0 5.0 5.0Lane Grp Cap (vph) 212 542 372 533 630 1840 530 1859v/s Ratio Prot 0.05 c0.18 c0.09 0.05v/s Ratio Perm 0.02 0.05 0.04 0.05v/c Ratio 0.07 0.17 0.17 0.65 0.08 0.17 0.09 0.09Uniform Delay, d1 18.3 18.8 18.9 22.0 8.3 8.8 8.4 8.3Progression Factor 1.00 1.00 1.00 1.00 1.00 1.00 1.00 1.00Incremental Delay, d2 0.3 0.3 0.5 3.7 0.2 0.2 0.4 0.1Delay (s) 18.6 19.1 19.3 25.6 8.6 9.0 8.7 8.4Level of Service B B B C A A A AApproach Delay (s) 19.1 24.6 8.9 8.5Approach LOS B C A A
Intersection SummaryHCM Average Control Delay 15.5 HCM Level of Service BHCM Volume to Capacity ratio 0.34Actuated Cycle Length (s) 70.0 Sum of lost time (s) 13.5Intersection Capacity Utilization 56.1% ICU Level of Service BAnalysis Period (min) 15c Critical Lane Group

Timing Report, Sorted By Phase Future Background7: Healey Road & Coleraine Drive Weekday PM Peak Hour
Canadian Tire Bolton Warehouse Synchro 7 - ReportBA Consulting Group Page 4
Phase Number 2 4 6 8Movement SBTL WBTL NBTL EBTLLead/LagLead-Lag OptimizeRecall Mode C-Max None C-Max NoneMaximum Split (s) 37 33 37 33Maximum Split (%) 52.9% 47.1% 52.9% 47.1%Minimum Split (s) 36.2 32.8 36.2 32.8Yellow Time (s) 4.6 4 4.6 4All-Red Time (s) 2.1 2.8 2.1 2.8Minimum Initial (s) 12 8 12 8Vehicle Extension (s) 5 5 5 5Minimum Gap (s) 3 3 3 3Time Before Reduce (s) 0 0 0 0Time To Reduce (s) 0 0 0 0Walk Time (s) 5 5 5 5Flash Dont Walk (s) 24.5 21 24.5 21Dual Entry Yes Yes Yes YesInhibit Max Yes Yes Yes YesStart Time (s) 37 4 37 4End Time (s) 4 37 4 37Yield/Force Off (s) 67.3 30.2 67.3 30.2Yield/Force Off 170(s) 42.8 9.2 42.8 9.2Local Start Time (s) 0 37 0 37Local Yield (s) 30.3 63.2 30.3 63.2Local Yield 170(s) 5.8 42.2 5.8 42.2
Intersection SummaryCycle Length 70Control Type Actuated-CoordinatedNatural Cycle 70Offset: 37 (53%), Referenced to phase 2:SBTL and 6:NBTL, Start of Green
Splits and Phases: 7: Healey Road & Coleraine Drive

HCM Unsignalized Intersection Capacity Analysis Future Background10: Healey Road & Humber Station Road Weekday PM Peak Hour
Canadian Tire Bolton Warehouse Synchro 7 - ReportBA Consulting Group Page 5
Movement EBL EBT EBR WBL WBT WBR NBL NBT NBR SBL SBT SBRLane ConfigurationsSign Control Stop Stop Stop StopVolume (vph) 5 80 5 15 285 75 5 40 5 30 5 5Peak Hour Factor 1.00 1.00 1.00 1.00 1.00 1.00 1.00 1.00 1.00 1.00 1.00 1.00Hourly flow rate (vph) 5 80 5 15 285 75 5 40 5 30 5 5
Direction, Lane # EB 1 WB 1 NB 1 SB 1Volume Total (vph) 90 375 50 40Volume Left (vph) 5 15 5 30Volume Right (vph) 5 75 5 5Hadj (s) -0.02 -0.11 -0.04 0.08Departure Headway (s) 4.5 4.1 4.9 5.1Degree Utilization, x 0.11 0.43 0.07 0.06Capacity (veh/h) 768 848 661 640Control Delay (s) 8.1 10.2 8.3 8.4Approach Delay (s) 8.1 10.2 8.3 8.4Approach LOS A B A A
Intersection SummaryDelay 9.5HCM Level of Service AIntersection Capacity Utilization 39.9% ICU Level of Service AAnalysis Period (min) 15
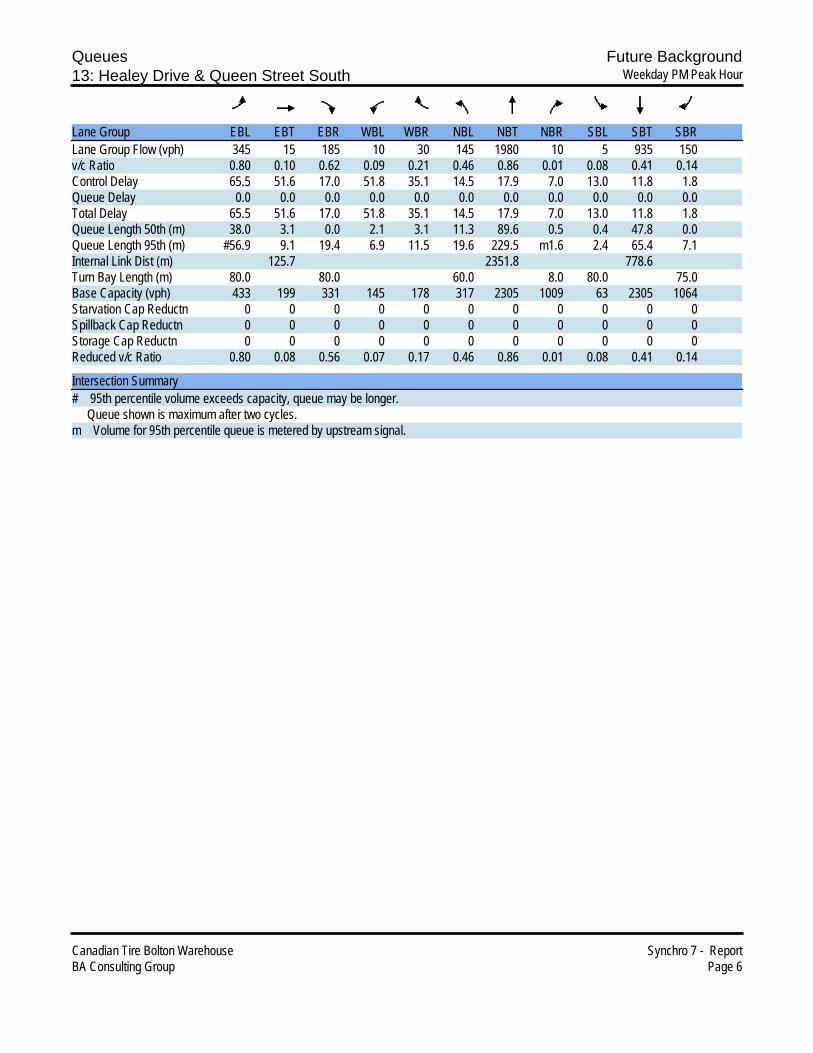
Queues Future Background13: Healey Drive & Queen Street South Weekday PM Peak Hour
Canadian Tire Bolton Warehouse Synchro 7 - ReportBA Consulting Group Page 6
Lane Group EBL EBT EBR WBL WBR NBL NBT NBR SBL SBT SBRLane Group Flow (vph) 345 15 185 10 30 145 1980 10 5 935 150v/c Ratio 0.80 0.10 0.62 0.09 0.21 0.46 0.86 0.01 0.08 0.41 0.14Control Delay 65.5 51.6 17.0 51.8 35.1 14.5 17.9 7.0 13.0 11.8 1.8Queue Delay 0.0 0.0 0.0 0.0 0.0 0.0 0.0 0.0 0.0 0.0 0.0Total Delay 65.5 51.6 17.0 51.8 35.1 14.5 17.9 7.0 13.0 11.8 1.8Queue Length 50th (m) 38.0 3.1 0.0 2.1 3.1 11.3 89.6 0.5 0.4 47.8 0.0Queue Length 95th (m) #56.9 9.1 19.4 6.9 11.5 19.6 229.5 m1.6 2.4 65.4 7.1Internal Link Dist (m) 125.7 2351.8 778.6Turn Bay Length (m) 80.0 80.0 60.0 8.0 80.0 75.0Base Capacity (vph) 433 199 331 145 178 317 2305 1009 63 2305 1064Starvation Cap Reductn 0 0 0 0 0 0 0 0 0 0 0Spillback Cap Reductn 0 0 0 0 0 0 0 0 0 0 0Storage Cap Reductn 0 0 0 0 0 0 0 0 0 0 0Reduced v/c Ratio 0.80 0.08 0.56 0.07 0.17 0.46 0.86 0.01 0.08 0.41 0.14
Intersection Summary# 95th percentile volume exceeds capacity, queue may be longer. Queue shown is maximum after two cycles.m Volume for 95th percentile queue is metered by upstream signal.
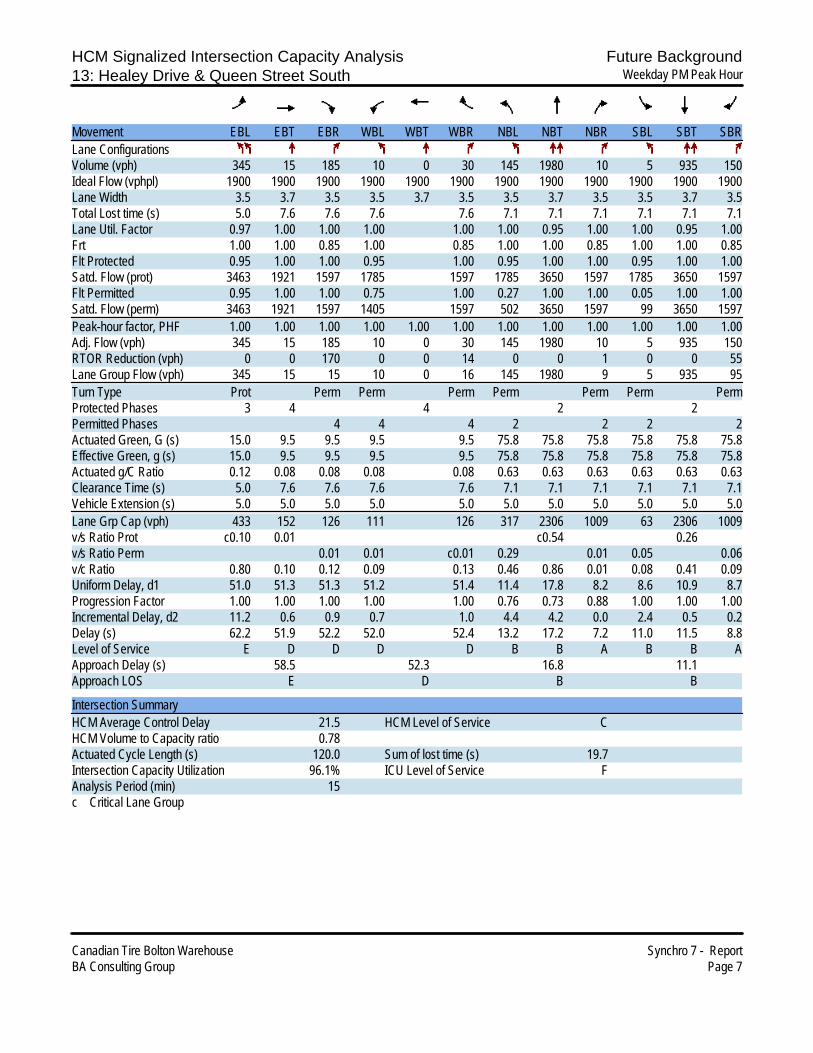
HCM Signalized Intersection Capacity Analysis Future Background13: Healey Drive & Queen Street South Weekday PM Peak Hour
Canadian Tire Bolton Warehouse Synchro 7 - ReportBA Consulting Group Page 7
Movement EBL EBT EBR WBL WBT WBR NBL NBT NBR SBL SBT SBRLane ConfigurationsVolume (vph) 345 15 185 10 0 30 145 1980 10 5 935 150Ideal Flow (vphpl) 1900 1900 1900 1900 1900 1900 1900 1900 1900 1900 1900 1900Lane Width 3.5 3.7 3.5 3.5 3.7 3.5 3.5 3.7 3.5 3.5 3.7 3.5Total Lost time (s) 5.0 7.6 7.6 7.6 7.6 7.1 7.1 7.1 7.1 7.1 7.1Lane Util. Factor 0.97 1.00 1.00 1.00 1.00 1.00 0.95 1.00 1.00 0.95 1.00Frt 1.00 1.00 0.85 1.00 0.85 1.00 1.00 0.85 1.00 1.00 0.85Flt Protected 0.95 1.00 1.00 0.95 1.00 0.95 1.00 1.00 0.95 1.00 1.00Satd. Flow (prot) 3463 1921 1597 1785 1597 1785 3650 1597 1785 3650 1597Flt Permitted 0.95 1.00 1.00 0.75 1.00 0.27 1.00 1.00 0.05 1.00 1.00Satd. Flow (perm) 3463 1921 1597 1405 1597 502 3650 1597 99 3650 1597Peak-hour factor, PHF 1.00 1.00 1.00 1.00 1.00 1.00 1.00 1.00 1.00 1.00 1.00 1.00Adj. Flow (vph) 345 15 185 10 0 30 145 1980 10 5 935 150RTOR Reduction (vph) 0 0 170 0 0 14 0 0 1 0 0 55Lane Group Flow (vph) 345 15 15 10 0 16 145 1980 9 5 935 95Turn Type Prot Perm Perm Perm Perm Perm Perm PermProtected Phases 3 4 4 2 2Permitted Phases 4 4 4 2 2 2 2Actuated Green, G (s) 15.0 9.5 9.5 9.5 9.5 75.8 75.8 75.8 75.8 75.8 75.8Effective Green, g (s) 15.0 9.5 9.5 9.5 9.5 75.8 75.8 75.8 75.8 75.8 75.8Actuated g/C Ratio 0.12 0.08 0.08 0.08 0.08 0.63 0.63 0.63 0.63 0.63 0.63Clearance Time (s) 5.0 7.6 7.6 7.6 7.6 7.1 7.1 7.1 7.1 7.1 7.1Vehicle Extension (s) 5.0 5.0 5.0 5.0 5.0 5.0 5.0 5.0 5.0 5.0 5.0Lane Grp Cap (vph) 433 152 126 111 126 317 2306 1009 63 2306 1009v/s Ratio Prot c0.10 0.01 c0.54 0.26v/s Ratio Perm 0.01 0.01 c0.01 0.29 0.01 0.05 0.06v/c Ratio 0.80 0.10 0.12 0.09 0.13 0.46 0.86 0.01 0.08 0.41 0.09Uniform Delay, d1 51.0 51.3 51.3 51.2 51.4 11.4 17.8 8.2 8.6 10.9 8.7Progression Factor 1.00 1.00 1.00 1.00 1.00 0.76 0.73 0.88 1.00 1.00 1.00Incremental Delay, d2 11.2 0.6 0.9 0.7 1.0 4.4 4.2 0.0 2.4 0.5 0.2Delay (s) 62.2 51.9 52.2 52.0 52.4 13.2 17.2 7.2 11.0 11.5 8.8Level of Service E D D D D B B A B B AApproach Delay (s) 58.5 52.3 16.8 11.1Approach LOS E D B B
Intersection SummaryHCM Average Control Delay 21.5 HCM Level of Service CHCM Volume to Capacity ratio 0.78Actuated Cycle Length (s) 120.0 Sum of lost time (s) 19.7Intersection Capacity Utilization 96.1% ICU Level of Service FAnalysis Period (min) 15c Critical Lane Group
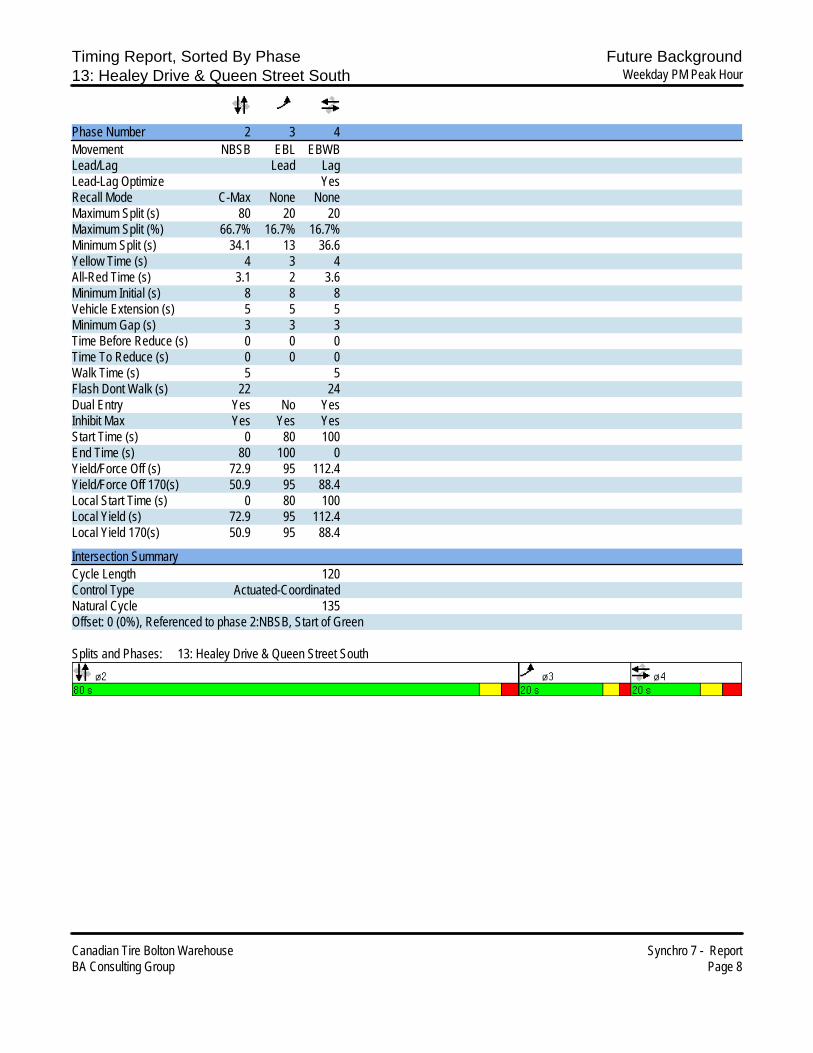
Timing Report, Sorted By Phase Future Background13: Healey Drive & Queen Street South Weekday PM Peak Hour
Canadian Tire Bolton Warehouse Synchro 7 - ReportBA Consulting Group Page 8
Phase Number 2 3 4Movement NBSB EBL EBWBLead/Lag Lead LagLead-Lag Optimize YesRecall Mode C-Max None NoneMaximum Split (s) 80 20 20Maximum Split (%) 66.7% 16.7% 16.7%Minimum Split (s) 34.1 13 36.6Yellow Time (s) 4 3 4All-Red Time (s) 3.1 2 3.6Minimum Initial (s) 8 8 8Vehicle Extension (s) 5 5 5Minimum Gap (s) 3 3 3Time Before Reduce (s) 0 0 0Time To Reduce (s) 0 0 0Walk Time (s) 5 5Flash Dont Walk (s) 22 24Dual Entry Yes No YesInhibit Max Yes Yes YesStart Time (s) 0 80 100End Time (s) 80 100 0Yield/Force Off (s) 72.9 95 112.4Yield/Force Off 170(s) 50.9 95 88.4Local Start Time (s) 0 80 100Local Yield (s) 72.9 95 112.4Local Yield 170(s) 50.9 95 88.4
Intersection SummaryCycle Length 120Control Type Actuated-CoordinatedNatural Cycle 135Offset: 0 (0%), Referenced to phase 2:NBSB, Start of Green
Splits and Phases: 13: Healey Drive & Queen Street South
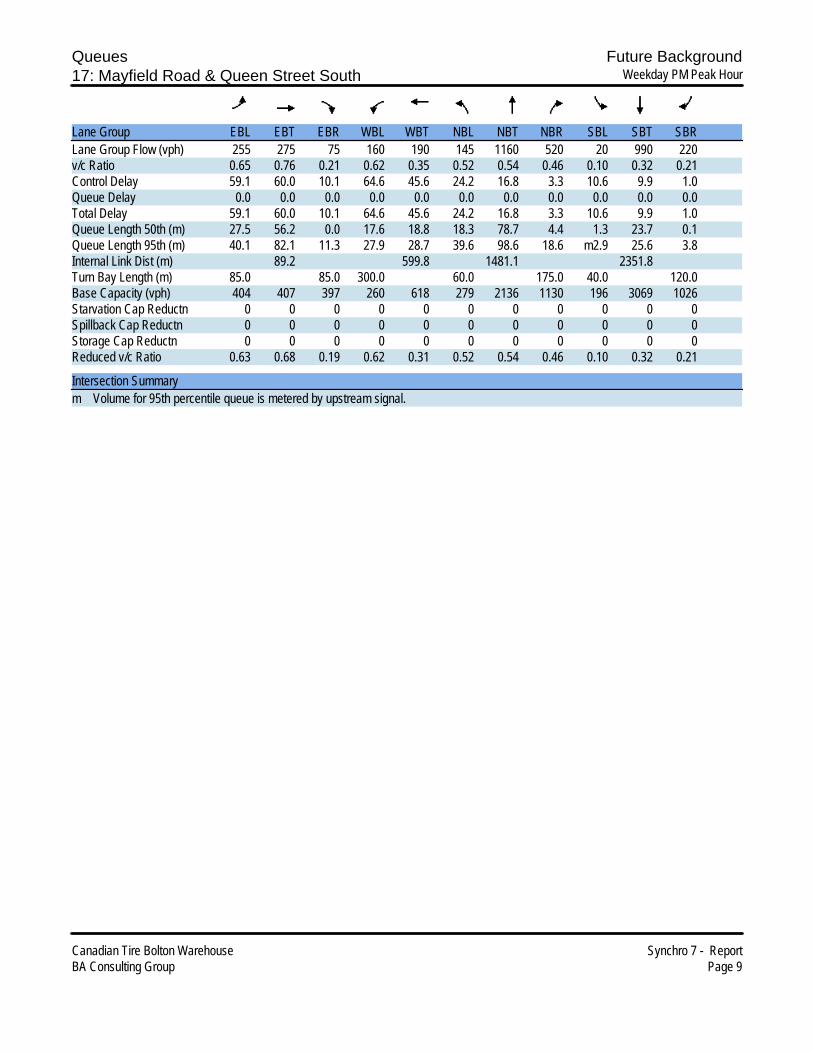
Queues Future Background17: Mayfield Road & Queen Street South Weekday PM Peak Hour
Canadian Tire Bolton Warehouse Synchro 7 - ReportBA Consulting Group Page 9
Lane Group EBL EBT EBR WBL WBT NBL NBT NBR SBL SBT SBRLane Group Flow (vph) 255 275 75 160 190 145 1160 520 20 990 220v/c Ratio 0.65 0.76 0.21 0.62 0.35 0.52 0.54 0.46 0.10 0.32 0.21Control Delay 59.1 60.0 10.1 64.6 45.6 24.2 16.8 3.3 10.6 9.9 1.0Queue Delay 0.0 0.0 0.0 0.0 0.0 0.0 0.0 0.0 0.0 0.0 0.0Total Delay 59.1 60.0 10.1 64.6 45.6 24.2 16.8 3.3 10.6 9.9 1.0Queue Length 50th (m) 27.5 56.2 0.0 17.6 18.8 18.3 78.7 4.4 1.3 23.7 0.1Queue Length 95th (m) 40.1 82.1 11.3 27.9 28.7 39.6 98.6 18.6 m2.9 25.6 3.8Internal Link Dist (m) 89.2 599.8 1481.1 2351.8Turn Bay Length (m) 85.0 85.0 300.0 60.0 175.0 40.0 120.0Base Capacity (vph) 404 407 397 260 618 279 2136 1130 196 3069 1026Starvation Cap Reductn 0 0 0 0 0 0 0 0 0 0 0Spillback Cap Reductn 0 0 0 0 0 0 0 0 0 0 0Storage Cap Reductn 0 0 0 0 0 0 0 0 0 0 0Reduced v/c Ratio 0.63 0.68 0.19 0.62 0.31 0.52 0.54 0.46 0.10 0.32 0.21
Intersection Summarym Volume for 95th percentile queue is metered by upstream signal.

HCM Signalized Intersection Capacity Analysis Future Background17: Mayfield Road & Queen Street South Weekday PM Peak Hour
Canadian Tire Bolton Warehouse Synchro 7 - ReportBA Consulting Group Page 10
Movement EBL EBT EBR WBL WBT WBR NBL NBT NBR SBL SBT SBRLane ConfigurationsVolume (vph) 255 275 75 160 175 15 145 1160 520 20 990 220Ideal Flow (vphpl) 1900 1900 1900 1900 1900 1900 1900 1900 1900 1900 1900 1900Lane Width 3.5 3.7 3.5 3.5 3.7 3.5 3.5 3.7 3.5 3.5 3.7 3.5Total Lost time (s) 5.0 6.6 6.6 5.0 6.6 6.6 6.6 6.6 6.6 6.6 6.6Lane Util. Factor 0.97 1.00 1.00 0.97 0.95 1.00 0.95 1.00 1.00 0.91 1.00Frt 1.00 1.00 0.85 1.00 0.99 1.00 1.00 0.85 1.00 1.00 0.85Flt Protected 0.95 1.00 1.00 0.95 1.00 0.95 1.00 1.00 0.95 1.00 1.00Satd. Flow (prot) 3463 1921 1597 3463 3607 1785 3650 1597 1785 5245 1597Flt Permitted 0.95 1.00 1.00 0.95 1.00 0.25 1.00 1.00 0.18 1.00 1.00Satd. Flow (perm) 3463 1921 1597 3463 3607 477 3650 1597 335 5245 1597Peak-hour factor, PHF 1.00 1.00 1.00 1.00 1.00 1.00 1.00 1.00 1.00 1.00 1.00 1.00Adj. Flow (vph) 255 275 75 160 175 15 145 1160 520 20 990 220RTOR Reduction (vph) 0 0 61 0 5 0 0 0 196 0 0 91Lane Group Flow (vph) 255 275 14 160 185 0 145 1160 324 20 990 129Turn Type Prot Perm Prot Perm Perm Perm PermProtected Phases 7 4 3 8 2 6Permitted Phases 4 2 2 6 6Actuated Green, G (s) 13.6 22.6 22.6 9.0 18.0 70.2 70.2 70.2 70.2 70.2 70.2Effective Green, g (s) 13.6 22.6 22.6 9.0 18.0 70.2 70.2 70.2 70.2 70.2 70.2Actuated g/C Ratio 0.11 0.19 0.19 0.08 0.15 0.59 0.59 0.59 0.59 0.59 0.59Clearance Time (s) 5.0 6.6 6.6 5.0 6.6 6.6 6.6 6.6 6.6 6.6 6.6Vehicle Extension (s) 5.0 5.0 5.0 5.0 5.0 5.0 5.0 5.0 5.0 5.0 5.0Lane Grp Cap (vph) 392 362 301 260 541 279 2135 934 196 3068 934v/s Ratio Prot c0.07 c0.14 0.05 0.05 c0.32 0.19v/s Ratio Perm 0.01 0.30 0.20 0.06 0.08v/c Ratio 0.65 0.76 0.05 0.62 0.34 0.52 0.54 0.35 0.10 0.32 0.14Uniform Delay, d1 50.9 46.1 39.9 53.8 45.7 14.8 15.1 13.0 11.0 12.7 11.2Progression Factor 1.00 1.00 1.00 1.00 1.00 1.00 1.00 1.00 0.76 0.74 0.33Incremental Delay, d2 5.1 10.5 0.1 6.1 0.8 6.8 1.0 1.0 1.0 0.3 0.3Delay (s) 56.1 56.6 40.0 59.9 46.5 21.6 16.1 14.0 9.3 9.6 4.0Level of Service E E D E D C B B A A AApproach Delay (s) 54.3 52.6 16.0 8.6Approach LOS D D B A
Intersection SummaryHCM Average Control Delay 22.7 HCM Level of Service CHCM Volume to Capacity ratio 0.62Actuated Cycle Length (s) 120.0 Sum of lost time (s) 18.2Intersection Capacity Utilization 83.9% ICU Level of Service EAnalysis Period (min) 15c Critical Lane Group
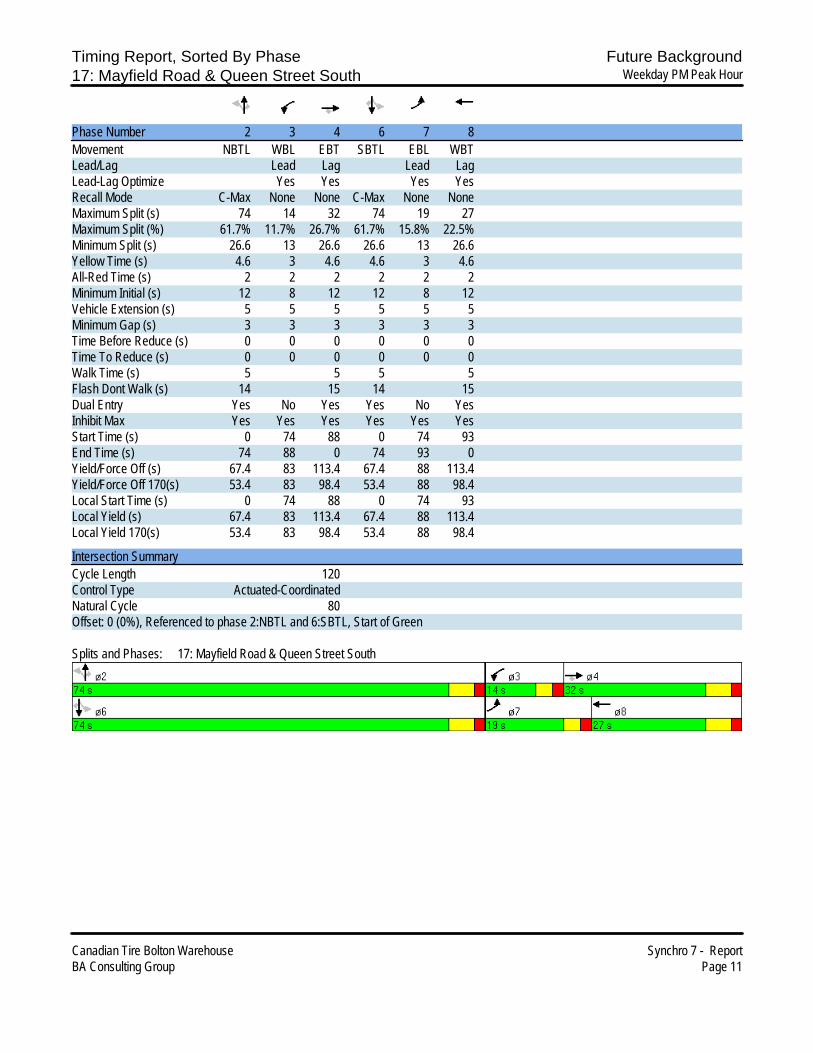
Timing Report, Sorted By Phase Future Background17: Mayfield Road & Queen Street South Weekday PM Peak Hour
Canadian Tire Bolton Warehouse Synchro 7 - ReportBA Consulting Group Page 11
Phase Number 2 3 4 6 7 8Movement NBTL WBL EBT SBTL EBL WBTLead/Lag Lead Lag Lead LagLead-Lag Optimize Yes Yes Yes YesRecall Mode C-Max None None C-Max None NoneMaximum Split (s) 74 14 32 74 19 27Maximum Split (%) 61.7% 11.7% 26.7% 61.7% 15.8% 22.5%Minimum Split (s) 26.6 13 26.6 26.6 13 26.6Yellow Time (s) 4.6 3 4.6 4.6 3 4.6All-Red Time (s) 2 2 2 2 2 2Minimum Initial (s) 12 8 12 12 8 12Vehicle Extension (s) 5 5 5 5 5 5Minimum Gap (s) 3 3 3 3 3 3Time Before Reduce (s) 0 0 0 0 0 0Time To Reduce (s) 0 0 0 0 0 0Walk Time (s) 5 5 5 5Flash Dont Walk (s) 14 15 14 15Dual Entry Yes No Yes Yes No YesInhibit Max Yes Yes Yes Yes Yes YesStart Time (s) 0 74 88 0 74 93End Time (s) 74 88 0 74 93 0Yield/Force Off (s) 67.4 83 113.4 67.4 88 113.4Yield/Force Off 170(s) 53.4 83 98.4 53.4 88 98.4Local Start Time (s) 0 74 88 0 74 93Local Yield (s) 67.4 83 113.4 67.4 88 113.4Local Yield 170(s) 53.4 83 98.4 53.4 88 98.4
Intersection SummaryCycle Length 120Control Type Actuated-CoordinatedNatural Cycle 80Offset: 0 (0%), Referenced to phase 2:NBTL and 6:SBTL, Start of Green
Splits and Phases: 17: Mayfield Road & Queen Street South
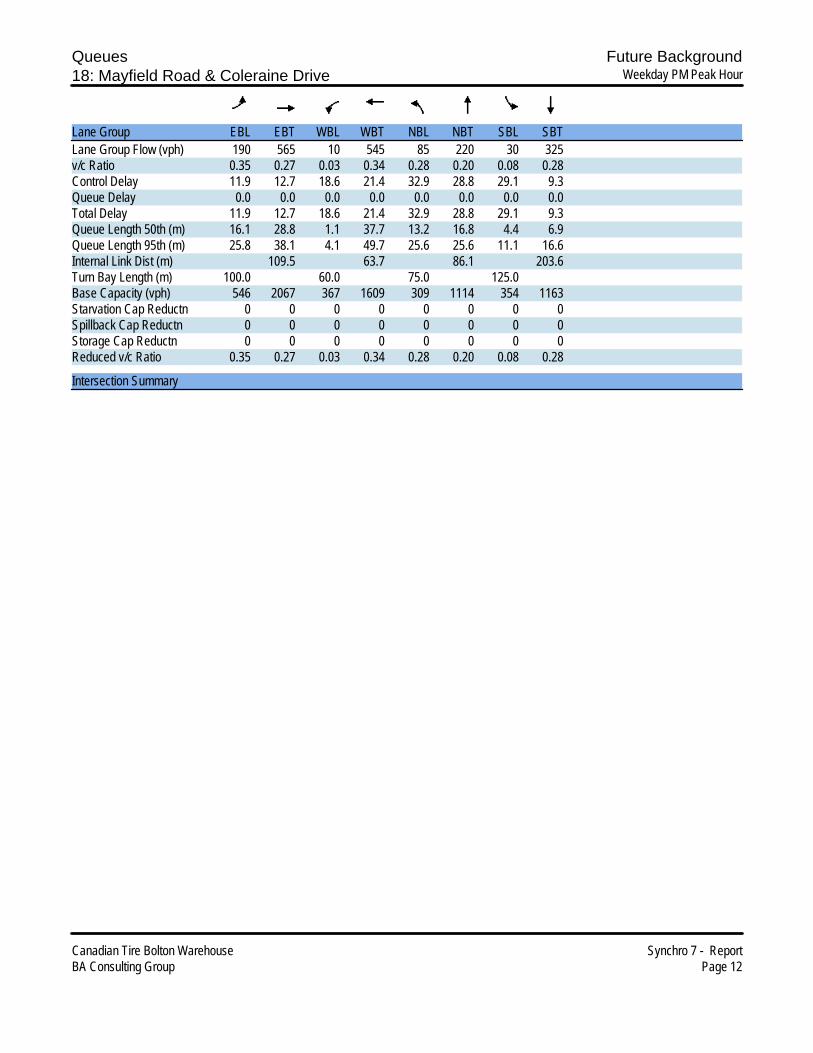
Queues Future Background18: Mayfield Road & Coleraine Drive Weekday PM Peak Hour
Canadian Tire Bolton Warehouse Synchro 7 - ReportBA Consulting Group Page 12
Lane Group EBL EBT WBL WBT NBL NBT SBL SBTLane Group Flow (vph) 190 565 10 545 85 220 30 325v/c Ratio 0.35 0.27 0.03 0.34 0.28 0.20 0.08 0.28Control Delay 11.9 12.7 18.6 21.4 32.9 28.8 29.1 9.3Queue Delay 0.0 0.0 0.0 0.0 0.0 0.0 0.0 0.0Total Delay 11.9 12.7 18.6 21.4 32.9 28.8 29.1 9.3Queue Length 50th (m) 16.1 28.8 1.1 37.7 13.2 16.8 4.4 6.9Queue Length 95th (m) 25.8 38.1 4.1 49.7 25.6 25.6 11.1 16.6Internal Link Dist (m) 109.5 63.7 86.1 203.6Turn Bay Length (m) 100.0 60.0 75.0 125.0Base Capacity (vph) 546 2067 367 1609 309 1114 354 1163Starvation Cap Reductn 0 0 0 0 0 0 0 0Spillback Cap Reductn 0 0 0 0 0 0 0 0Storage Cap Reductn 0 0 0 0 0 0 0 0Reduced v/c Ratio 0.35 0.27 0.03 0.34 0.28 0.20 0.08 0.28
Intersection Summary

HCM Signalized Intersection Capacity Analysis Future Background18: Mayfield Road & Coleraine Drive Weekday PM Peak Hour
Canadian Tire Bolton Warehouse Synchro 7 - ReportBA Consulting Group Page 13
Movement EBL EBT EBR WBL WBT WBR NBL NBT NBR SBL SBT SBRLane ConfigurationsVolume (vph) 190 530 35 10 520 25 85 205 15 30 90 235Ideal Flow (vphpl) 1900 1900 1900 1900 1900 1900 1900 1900 1900 1900 1900 1900Lane Width 3.5 3.7 3.5 3.5 3.7 3.5 3.5 3.7 3.5 3.5 3.7 3.5Total Lost time (s) 3.0 7.0 7.0 7.0 7.0 7.0 7.0 7.0Lane Util. Factor 1.00 0.95 1.00 0.95 1.00 0.95 1.00 0.95Frt 1.00 0.99 1.00 0.99 1.00 0.99 1.00 0.89Flt Protected 0.95 1.00 0.95 1.00 0.95 1.00 0.95 1.00Satd. Flow (prot) 1785 3616 1785 3625 1785 3613 1785 3254Flt Permitted 0.38 1.00 0.44 1.00 0.53 1.00 0.61 1.00Satd. Flow (perm) 716 3616 827 3625 1005 3613 1154 3254Peak-hour factor, PHF 1.00 1.00 1.00 1.00 1.00 1.00 1.00 1.00 1.00 1.00 1.00 1.00Adj. Flow (vph) 190 530 35 10 520 25 85 205 15 30 90 235RTOR Reduction (vph) 0 4 0 0 3 0 0 5 0 0 163 0Lane Group Flow (vph) 190 561 0 10 542 0 85 215 0 30 162 0Turn Type pm+pt Perm Perm PermProtected Phases 5 2 6 8 4Permitted Phases 2 6 8 4Actuated Green, G (s) 65.0 65.0 50.5 50.5 35.0 35.0 35.0 35.0Effective Green, g (s) 65.0 65.0 50.5 50.5 35.0 35.0 35.0 35.0Actuated g/C Ratio 0.57 0.57 0.44 0.44 0.31 0.31 0.31 0.31Clearance Time (s) 3.0 7.0 7.0 7.0 7.0 7.0 7.0 7.0Vehicle Extension (s) 5.0 5.0 5.0 5.0 5.0 5.0 5.0 5.0Lane Grp Cap (vph) 516 2062 366 1606 309 1109 354 999v/s Ratio Prot c0.04 0.16 0.15 0.06 0.05v/s Ratio Perm c0.17 0.01 c0.08 0.03v/c Ratio 0.37 0.27 0.03 0.34 0.28 0.19 0.08 0.16Uniform Delay, d1 12.2 12.5 17.9 20.8 29.9 29.1 28.1 28.8Progression Factor 1.00 1.00 1.00 1.00 1.00 1.00 1.00 1.00Incremental Delay, d2 0.9 0.3 0.1 0.6 2.2 0.4 0.5 0.3Delay (s) 13.1 12.8 18.0 21.4 32.1 29.5 28.6 29.2Level of Service B B B C C C C CApproach Delay (s) 12.9 21.3 30.2 29.1Approach LOS B C C C
Intersection SummaryHCM Average Control Delay 20.9 HCM Level of Service CHCM Volume to Capacity ratio 0.32Actuated Cycle Length (s) 114.0 Sum of lost time (s) 10.0Intersection Capacity Utilization 69.2% ICU Level of Service CAnalysis Period (min) 15c Critical Lane Group
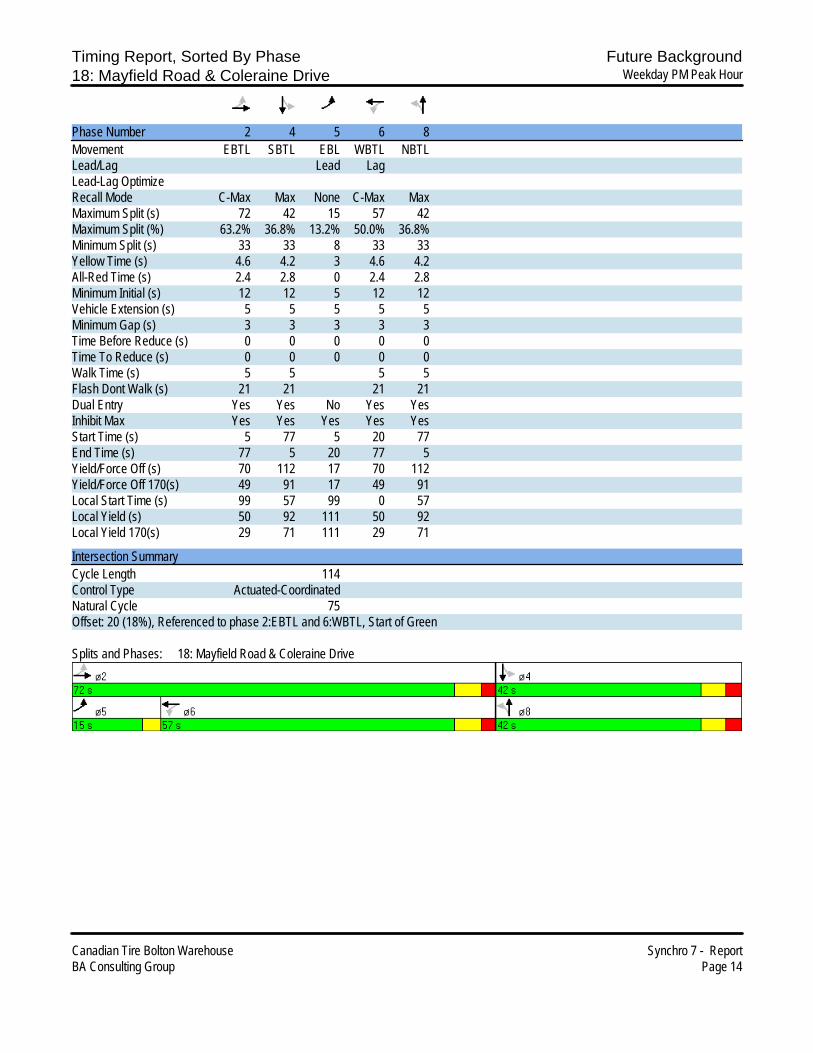
Timing Report, Sorted By Phase Future Background18: Mayfield Road & Coleraine Drive Weekday PM Peak Hour
Canadian Tire Bolton Warehouse Synchro 7 - ReportBA Consulting Group Page 14
Phase Number 2 4 5 6 8Movement EBTL SBTL EBL WBTL NBTLLead/Lag Lead LagLead-Lag OptimizeRecall Mode C-Max Max None C-Max MaxMaximum Split (s) 72 42 15 57 42Maximum Split (%) 63.2% 36.8% 13.2% 50.0% 36.8%Minimum Split (s) 33 33 8 33 33Yellow Time (s) 4.6 4.2 3 4.6 4.2All-Red Time (s) 2.4 2.8 0 2.4 2.8Minimum Initial (s) 12 12 5 12 12Vehicle Extension (s) 5 5 5 5 5Minimum Gap (s) 3 3 3 3 3Time Before Reduce (s) 0 0 0 0 0Time To Reduce (s) 0 0 0 0 0Walk Time (s) 5 5 5 5Flash Dont Walk (s) 21 21 21 21Dual Entry Yes Yes No Yes YesInhibit Max Yes Yes Yes Yes YesStart Time (s) 5 77 5 20 77End Time (s) 77 5 20 77 5Yield/Force Off (s) 70 112 17 70 112Yield/Force Off 170(s) 49 91 17 49 91Local Start Time (s) 99 57 99 0 57Local Yield (s) 50 92 111 50 92Local Yield 170(s) 29 71 111 29 71
Intersection SummaryCycle Length 114Control Type Actuated-CoordinatedNatural Cycle 75Offset: 20 (18%), Referenced to phase 2:EBTL and 6:WBTL, Start of Green
Splits and Phases: 18: Mayfield Road & Coleraine Drive
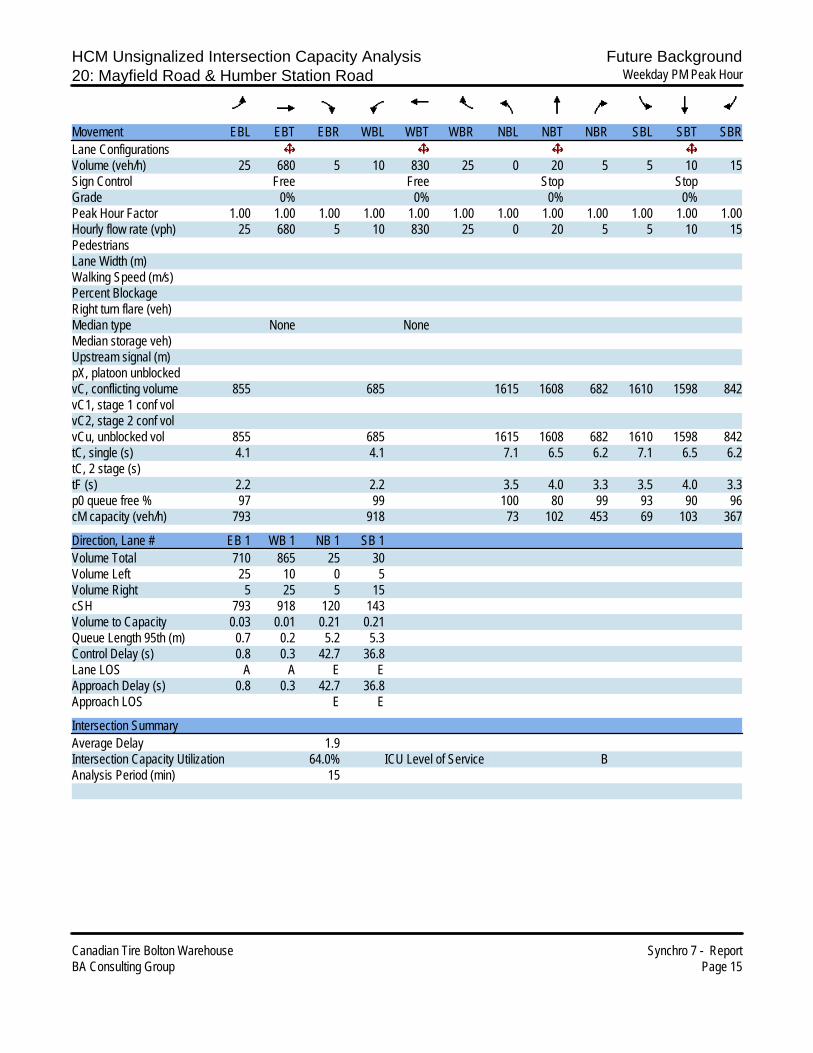
HCM Unsignalized Intersection Capacity Analysis Future Background20: Mayfield Road & Humber Station Road Weekday PM Peak Hour
Canadian Tire Bolton Warehouse Synchro 7 - ReportBA Consulting Group Page 15
Movement EBL EBT EBR WBL WBT WBR NBL NBT NBR SBL SBT SBRLane ConfigurationsVolume (veh/h) 25 680 5 10 830 25 0 20 5 5 10 15Sign Control Free Free Stop StopGrade 0% 0% 0% 0%Peak Hour Factor 1.00 1.00 1.00 1.00 1.00 1.00 1.00 1.00 1.00 1.00 1.00 1.00Hourly flow rate (vph) 25 680 5 10 830 25 0 20 5 5 10 15PedestriansLane Width (m)Walking Speed (m/s)Percent BlockageRight turn flare (veh)Median type None NoneMedian storage veh)Upstream signal (m)pX, platoon unblockedvC, conflicting volume 855 685 1615 1608 682 1610 1598 842vC1, stage 1 conf volvC2, stage 2 conf volvCu, unblocked vol 855 685 1615 1608 682 1610 1598 842tC, single (s) 4.1 4.1 7.1 6.5 6.2 7.1 6.5 6.2tC, 2 stage (s)tF (s) 2.2 2.2 3.5 4.0 3.3 3.5 4.0 3.3p0 queue free % 97 99 100 80 99 93 90 96cM capacity (veh/h) 793 918 73 102 453 69 103 367
Direction, Lane # EB 1 WB 1 NB 1 SB 1Volume Total 710 865 25 30Volume Left 25 10 0 5Volume Right 5 25 5 15cSH 793 918 120 143Volume to Capacity 0.03 0.01 0.21 0.21Queue Length 95th (m) 0.7 0.2 5.2 5.3Control Delay (s) 0.8 0.3 42.7 36.8Lane LOS A A E EApproach Delay (s) 0.8 0.3 42.7 36.8Approach LOS E E
Intersection SummaryAverage Delay 1.9Intersection Capacity Utilization 64.0% ICU Level of Service BAnalysis Period (min) 15
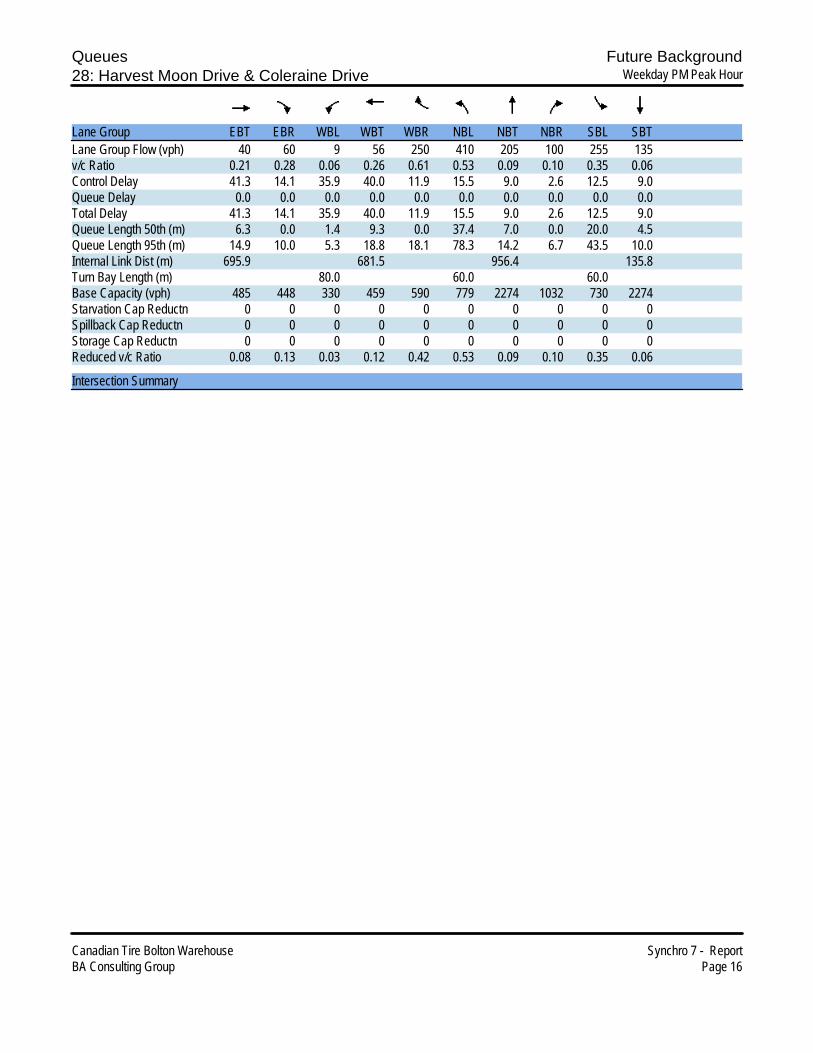
Queues Future Background28: Harvest Moon Drive & Coleraine Drive Weekday PM Peak Hour
Canadian Tire Bolton Warehouse Synchro 7 - ReportBA Consulting Group Page 16
Lane Group EBT EBR WBL WBT WBR NBL NBT NBR SBL SBTLane Group Flow (vph) 40 60 9 56 250 410 205 100 255 135v/c Ratio 0.21 0.28 0.06 0.26 0.61 0.53 0.09 0.10 0.35 0.06Control Delay 41.3 14.1 35.9 40.0 11.9 15.5 9.0 2.6 12.5 9.0Queue Delay 0.0 0.0 0.0 0.0 0.0 0.0 0.0 0.0 0.0 0.0Total Delay 41.3 14.1 35.9 40.0 11.9 15.5 9.0 2.6 12.5 9.0Queue Length 50th (m) 6.3 0.0 1.4 9.3 0.0 37.4 7.0 0.0 20.0 4.5Queue Length 95th (m) 14.9 10.0 5.3 18.8 18.1 78.3 14.2 6.7 43.5 10.0Internal Link Dist (m) 695.9 681.5 956.4 135.8Turn Bay Length (m) 80.0 60.0 60.0Base Capacity (vph) 485 448 330 459 590 779 2274 1032 730 2274Starvation Cap Reductn 0 0 0 0 0 0 0 0 0 0Spillback Cap Reductn 0 0 0 0 0 0 0 0 0 0Storage Cap Reductn 0 0 0 0 0 0 0 0 0 0Reduced v/c Ratio 0.08 0.13 0.03 0.12 0.42 0.53 0.09 0.10 0.35 0.06
Intersection Summary
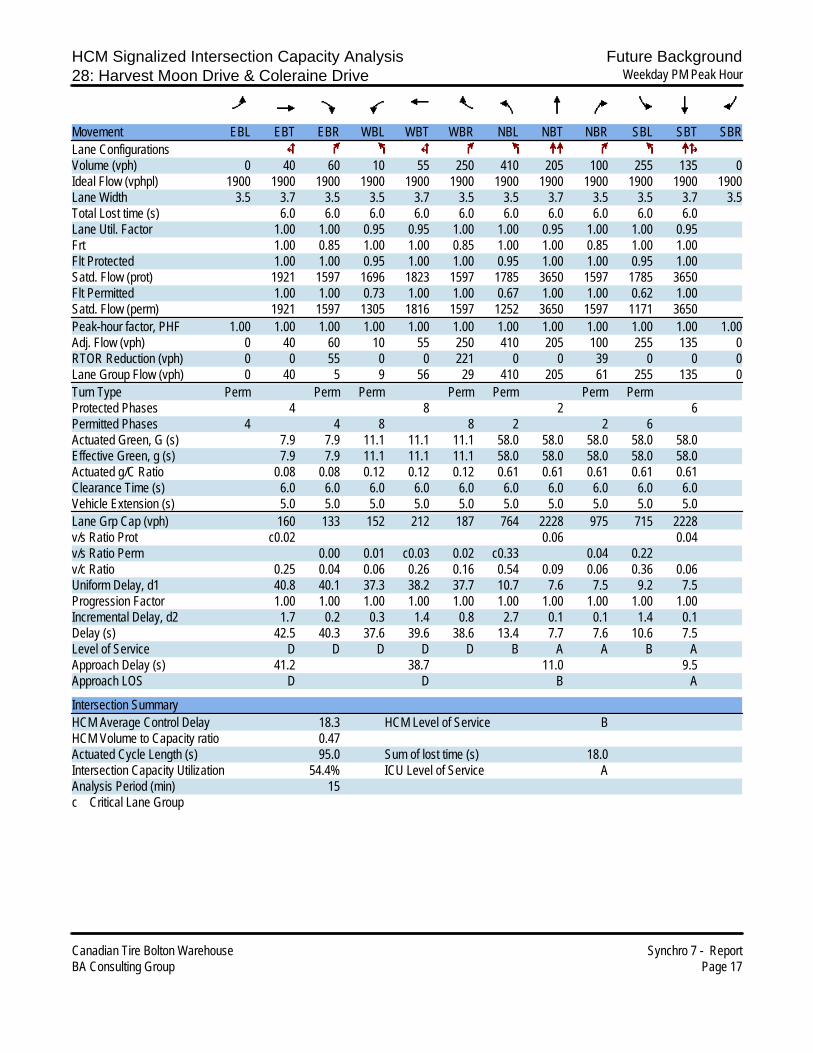
HCM Signalized Intersection Capacity Analysis Future Background28: Harvest Moon Drive & Coleraine Drive Weekday PM Peak Hour
Canadian Tire Bolton Warehouse Synchro 7 - ReportBA Consulting Group Page 17
Movement EBL EBT EBR WBL WBT WBR NBL NBT NBR SBL SBT SBRLane ConfigurationsVolume (vph) 0 40 60 10 55 250 410 205 100 255 135 0Ideal Flow (vphpl) 1900 1900 1900 1900 1900 1900 1900 1900 1900 1900 1900 1900Lane Width 3.5 3.7 3.5 3.5 3.7 3.5 3.5 3.7 3.5 3.5 3.7 3.5Total Lost time (s) 6.0 6.0 6.0 6.0 6.0 6.0 6.0 6.0 6.0 6.0Lane Util. Factor 1.00 1.00 0.95 0.95 1.00 1.00 0.95 1.00 1.00 0.95Frt 1.00 0.85 1.00 1.00 0.85 1.00 1.00 0.85 1.00 1.00Flt Protected 1.00 1.00 0.95 1.00 1.00 0.95 1.00 1.00 0.95 1.00Satd. Flow (prot) 1921 1597 1696 1823 1597 1785 3650 1597 1785 3650Flt Permitted 1.00 1.00 0.73 1.00 1.00 0.67 1.00 1.00 0.62 1.00Satd. Flow (perm) 1921 1597 1305 1816 1597 1252 3650 1597 1171 3650Peak-hour factor, PHF 1.00 1.00 1.00 1.00 1.00 1.00 1.00 1.00 1.00 1.00 1.00 1.00Adj. Flow (vph) 0 40 60 10 55 250 410 205 100 255 135 0RTOR Reduction (vph) 0 0 55 0 0 221 0 0 39 0 0 0Lane Group Flow (vph) 0 40 5 9 56 29 410 205 61 255 135 0Turn Type Perm Perm Perm Perm Perm Perm PermProtected Phases 4 8 2 6Permitted Phases 4 4 8 8 2 2 6Actuated Green, G (s) 7.9 7.9 11.1 11.1 11.1 58.0 58.0 58.0 58.0 58.0Effective Green, g (s) 7.9 7.9 11.1 11.1 11.1 58.0 58.0 58.0 58.0 58.0Actuated g/C Ratio 0.08 0.08 0.12 0.12 0.12 0.61 0.61 0.61 0.61 0.61Clearance Time (s) 6.0 6.0 6.0 6.0 6.0 6.0 6.0 6.0 6.0 6.0Vehicle Extension (s) 5.0 5.0 5.0 5.0 5.0 5.0 5.0 5.0 5.0 5.0Lane Grp Cap (vph) 160 133 152 212 187 764 2228 975 715 2228v/s Ratio Prot c0.02 0.06 0.04v/s Ratio Perm 0.00 0.01 c0.03 0.02 c0.33 0.04 0.22v/c Ratio 0.25 0.04 0.06 0.26 0.16 0.54 0.09 0.06 0.36 0.06Uniform Delay, d1 40.8 40.1 37.3 38.2 37.7 10.7 7.6 7.5 9.2 7.5Progression Factor 1.00 1.00 1.00 1.00 1.00 1.00 1.00 1.00 1.00 1.00Incremental Delay, d2 1.7 0.2 0.3 1.4 0.8 2.7 0.1 0.1 1.4 0.1Delay (s) 42.5 40.3 37.6 39.6 38.6 13.4 7.7 7.6 10.6 7.5Level of Service D D D D D B A A B AApproach Delay (s) 41.2 38.7 11.0 9.5Approach LOS D D B A
Intersection SummaryHCM Average Control Delay 18.3 HCM Level of Service BHCM Volume to Capacity ratio 0.47Actuated Cycle Length (s) 95.0 Sum of lost time (s) 18.0Intersection Capacity Utilization 54.4% ICU Level of Service AAnalysis Period (min) 15c Critical Lane Group
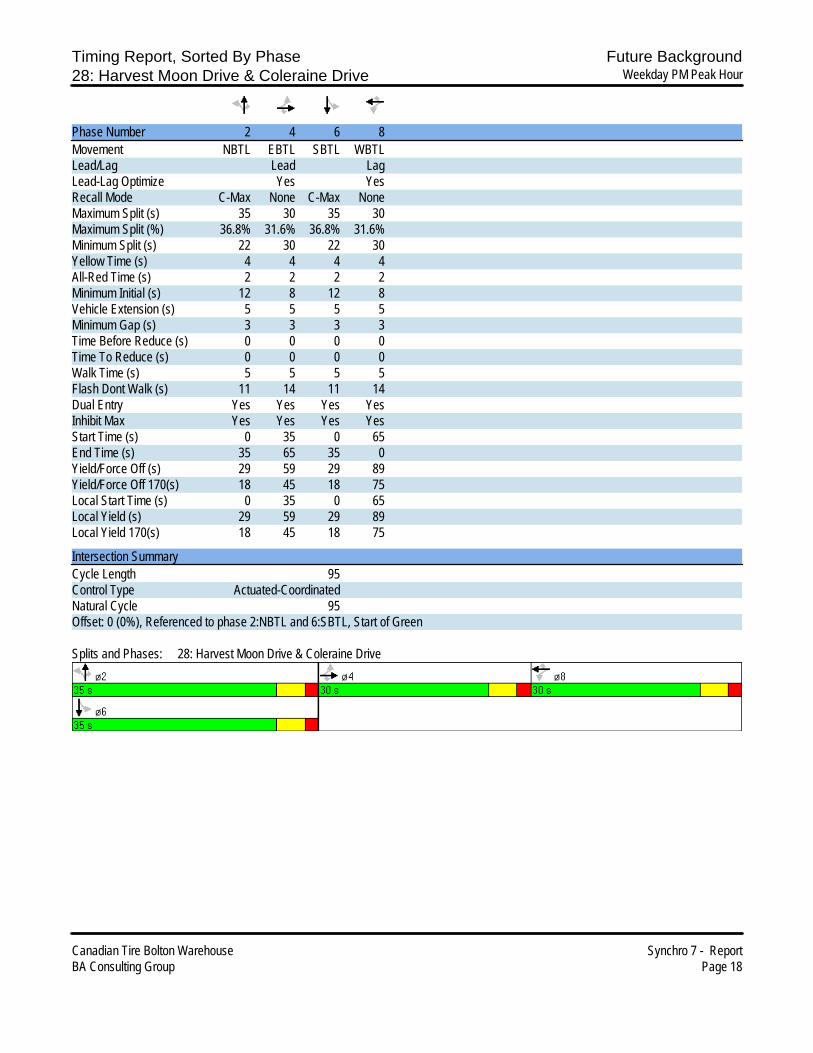
Timing Report, Sorted By Phase Future Background28: Harvest Moon Drive & Coleraine Drive Weekday PM Peak Hour
Canadian Tire Bolton Warehouse Synchro 7 - ReportBA Consulting Group Page 18
Phase Number 2 4 6 8Movement NBTL EBTL SBTL WBTLLead/Lag Lead LagLead-Lag Optimize Yes YesRecall Mode C-Max None C-Max NoneMaximum Split (s) 35 30 35 30Maximum Split (%) 36.8% 31.6% 36.8% 31.6%Minimum Split (s) 22 30 22 30Yellow Time (s) 4 4 4 4All-Red Time (s) 2 2 2 2Minimum Initial (s) 12 8 12 8Vehicle Extension (s) 5 5 5 5Minimum Gap (s) 3 3 3 3Time Before Reduce (s) 0 0 0 0Time To Reduce (s) 0 0 0 0Walk Time (s) 5 5 5 5Flash Dont Walk (s) 11 14 11 14Dual Entry Yes Yes Yes YesInhibit Max Yes Yes Yes YesStart Time (s) 0 35 0 65End Time (s) 35 65 35 0Yield/Force Off (s) 29 59 29 89Yield/Force Off 170(s) 18 45 18 75Local Start Time (s) 0 35 0 65Local Yield (s) 29 59 29 89Local Yield 170(s) 18 45 18 75
Intersection SummaryCycle Length 95Control Type Actuated-CoordinatedNatural Cycle 95Offset: 0 (0%), Referenced to phase 2:NBTL and 6:SBTL, Start of Green
Splits and Phases: 28: Harvest Moon Drive & Coleraine Drive

P r o j e c t B o l t o n
Future Total Conditions


Timings Future Total5: Site Entrance (Trucks) & Coleraine Drive Weekday AM Peak Hour
Canadian Tire Bolton Warehouse Synchro 7 - ReportBA Consulting Group Page 1
Lane Group EBT WBL WBR NBL NBT SBL SBTLane ConfigurationsVolume (vph) 0 5 55 55 70 115 490Turn Type custom custom Perm PermProtected Phases 4 2 6Permitted Phases 8 8 2 6Detector Phase 4 8 8 2 2 6 6Switch PhaseMinimum Initial (s) 8.0 8.0 8.0 12.0 12.0 12.0 12.0Minimum Split (s) 29.0 14.0 14.0 32.0 32.0 32.0 32.0Total Split (s) 29.0 14.0 14.0 47.0 47.0 47.0 47.0Total Split (%) 32.2% 15.6% 15.6% 52.2% 52.2% 52.2% 52.2%Yellow Time (s) 4.0 4.0 4.0 4.0 4.0 4.0 4.0All-Red Time (s) 2.0 2.0 2.0 2.0 2.0 2.0 2.0Lost Time Adjust (s) 0.0 0.0 0.0 0.0 0.0 0.0 0.0Total Lost Time (s) 6.0 6.0 6.0 6.0 6.0 6.0 6.0Lead/Lag Lead Lag LagLead-Lag Optimize? Yes Yes YesRecall Mode None None None C-Max C-Max C-Max C-MaxAct Effct Green (s) 11.2 8.2 8.2 66.3 66.3 66.3 66.3Actuated g/C Ratio 0.12 0.09 0.09 0.74 0.74 0.74 0.74v/c Ratio 0.20 0.04 0.28 0.08 0.03 0.12 0.19Control Delay 12.9 38.0 15.2 10.1 7.6 9.3 8.0Queue Delay 0.0 0.0 0.0 0.0 0.0 0.0 0.0Total Delay 12.9 38.0 15.2 10.1 7.6 9.3 8.0LOS B D B B A A AApproach Delay 12.9 8.6 8.2Approach LOS B A A
Intersection SummaryCycle Length: 90Actuated Cycle Length: 90Offset: 0 (0%), Referenced to phase 2:NBTL and 6:SBTL, Start of GreenNatural Cycle: 75Control Type: Actuated-CoordinatedMaximum v/c Ratio: 0.28Intersection Signal Delay: 9.2 Intersection LOS: AIntersection Capacity Utilization 46.4% ICU Level of Service AAnalysis Period (min) 15
Splits and Phases: 5: Site Entrance (Trucks) & Coleraine Drive
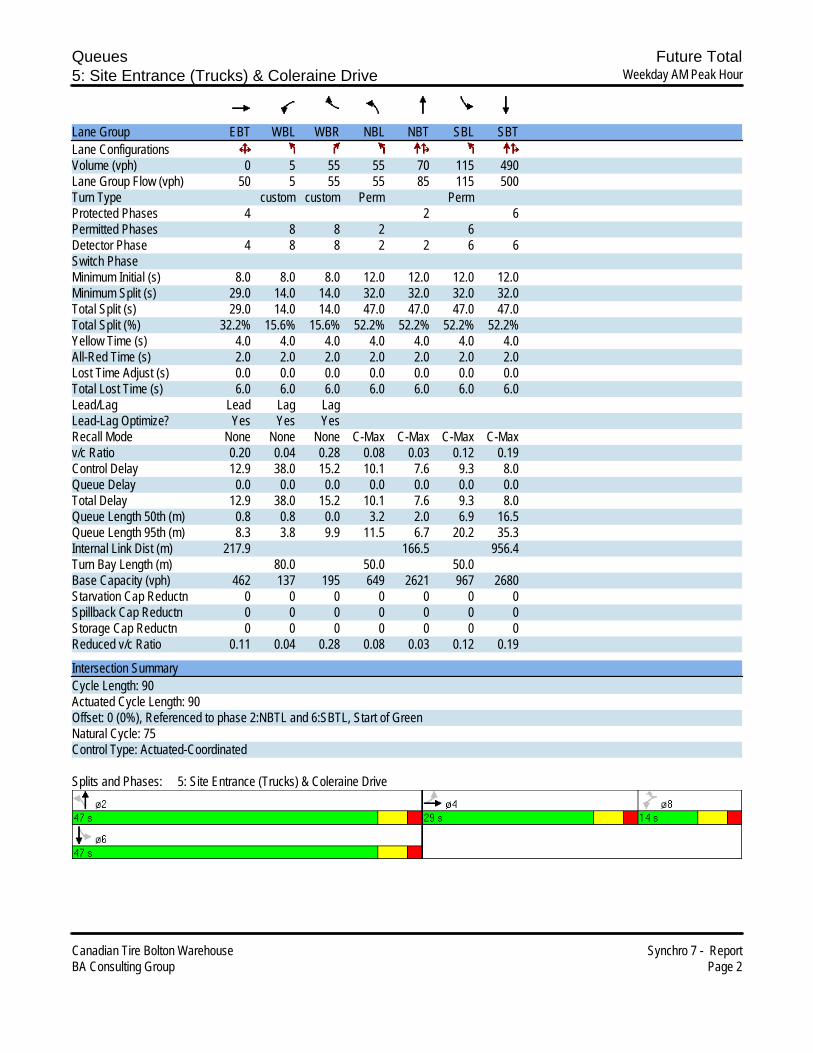
Queues Future Total5: Site Entrance (Trucks) & Coleraine Drive Weekday AM Peak Hour
Canadian Tire Bolton Warehouse Synchro 7 - ReportBA Consulting Group Page 2
Lane Group EBT WBL WBR NBL NBT SBL SBTLane ConfigurationsVolume (vph) 0 5 55 55 70 115 490Lane Group Flow (vph) 50 5 55 55 85 115 500Turn Type custom custom Perm PermProtected Phases 4 2 6Permitted Phases 8 8 2 6Detector Phase 4 8 8 2 2 6 6Switch PhaseMinimum Initial (s) 8.0 8.0 8.0 12.0 12.0 12.0 12.0Minimum Split (s) 29.0 14.0 14.0 32.0 32.0 32.0 32.0Total Split (s) 29.0 14.0 14.0 47.0 47.0 47.0 47.0Total Split (%) 32.2% 15.6% 15.6% 52.2% 52.2% 52.2% 52.2%Yellow Time (s) 4.0 4.0 4.0 4.0 4.0 4.0 4.0All-Red Time (s) 2.0 2.0 2.0 2.0 2.0 2.0 2.0Lost Time Adjust (s) 0.0 0.0 0.0 0.0 0.0 0.0 0.0Total Lost Time (s) 6.0 6.0 6.0 6.0 6.0 6.0 6.0Lead/Lag Lead Lag LagLead-Lag Optimize? Yes Yes YesRecall Mode None None None C-Max C-Max C-Max C-Maxv/c Ratio 0.20 0.04 0.28 0.08 0.03 0.12 0.19Control Delay 12.9 38.0 15.2 10.1 7.6 9.3 8.0Queue Delay 0.0 0.0 0.0 0.0 0.0 0.0 0.0Total Delay 12.9 38.0 15.2 10.1 7.6 9.3 8.0Queue Length 50th (m) 0.8 0.8 0.0 3.2 2.0 6.9 16.5Queue Length 95th (m) 8.3 3.8 9.9 11.5 6.7 20.2 35.3Internal Link Dist (m) 217.9 166.5 956.4Turn Bay Length (m) 80.0 50.0 50.0Base Capacity (vph) 462 137 195 649 2621 967 2680Starvation Cap Reductn 0 0 0 0 0 0 0Spillback Cap Reductn 0 0 0 0 0 0 0Storage Cap Reductn 0 0 0 0 0 0 0Reduced v/c Ratio 0.11 0.04 0.28 0.08 0.03 0.12 0.19
Intersection SummaryCycle Length: 90Actuated Cycle Length: 90Offset: 0 (0%), Referenced to phase 2:NBTL and 6:SBTL, Start of GreenNatural Cycle: 75Control Type: Actuated-Coordinated
Splits and Phases: 5: Site Entrance (Trucks) & Coleraine Drive
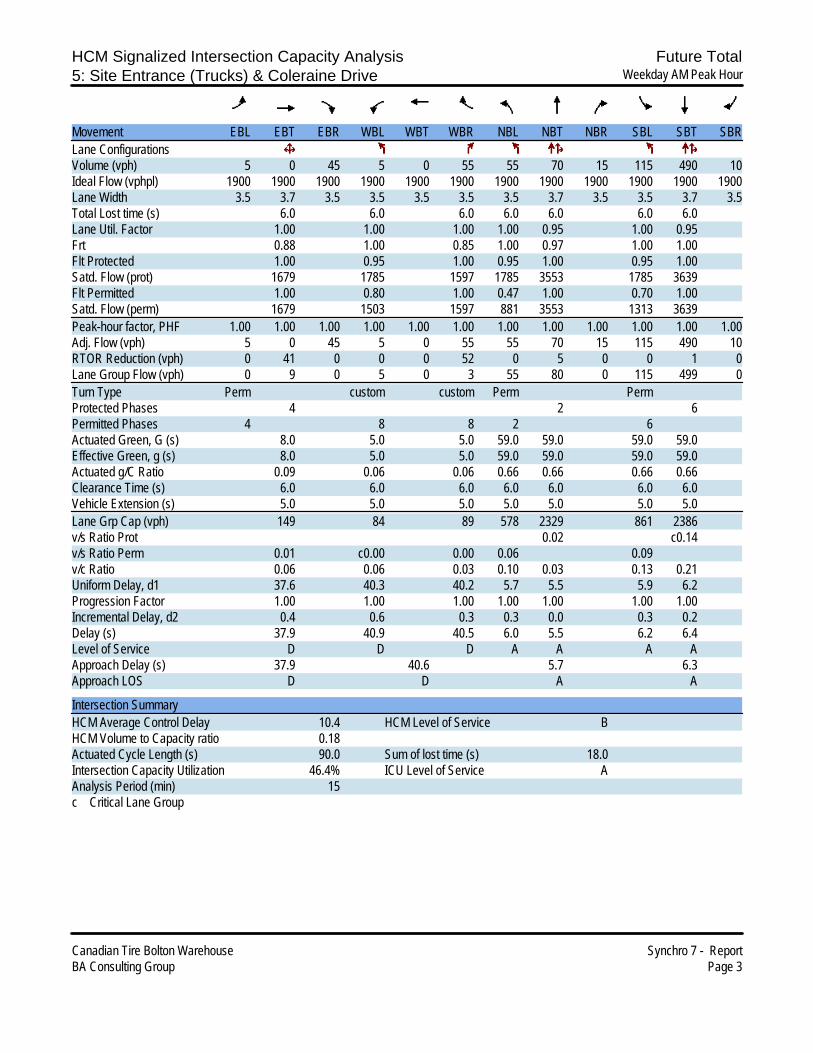
HCM Signalized Intersection Capacity Analysis Future Total5: Site Entrance (Trucks) & Coleraine Drive Weekday AM Peak Hour
Canadian Tire Bolton Warehouse Synchro 7 - ReportBA Consulting Group Page 3
Movement EBL EBT EBR WBL WBT WBR NBL NBT NBR SBL SBT SBRLane ConfigurationsVolume (vph) 5 0 45 5 0 55 55 70 15 115 490 10Ideal Flow (vphpl) 1900 1900 1900 1900 1900 1900 1900 1900 1900 1900 1900 1900Lane Width 3.5 3.7 3.5 3.5 3.5 3.5 3.5 3.7 3.5 3.5 3.7 3.5Total Lost time (s) 6.0 6.0 6.0 6.0 6.0 6.0 6.0Lane Util. Factor 1.00 1.00 1.00 1.00 0.95 1.00 0.95Frt 0.88 1.00 0.85 1.00 0.97 1.00 1.00Flt Protected 1.00 0.95 1.00 0.95 1.00 0.95 1.00Satd. Flow (prot) 1679 1785 1597 1785 3553 1785 3639Flt Permitted 1.00 0.80 1.00 0.47 1.00 0.70 1.00Satd. Flow (perm) 1679 1503 1597 881 3553 1313 3639Peak-hour factor, PHF 1.00 1.00 1.00 1.00 1.00 1.00 1.00 1.00 1.00 1.00 1.00 1.00Adj. Flow (vph) 5 0 45 5 0 55 55 70 15 115 490 10RTOR Reduction (vph) 0 41 0 0 0 52 0 5 0 0 1 0Lane Group Flow (vph) 0 9 0 5 0 3 55 80 0 115 499 0Turn Type Perm custom custom Perm PermProtected Phases 4 2 6Permitted Phases 4 8 8 2 6Actuated Green, G (s) 8.0 5.0 5.0 59.0 59.0 59.0 59.0Effective Green, g (s) 8.0 5.0 5.0 59.0 59.0 59.0 59.0Actuated g/C Ratio 0.09 0.06 0.06 0.66 0.66 0.66 0.66Clearance Time (s) 6.0 6.0 6.0 6.0 6.0 6.0 6.0Vehicle Extension (s) 5.0 5.0 5.0 5.0 5.0 5.0 5.0Lane Grp Cap (vph) 149 84 89 578 2329 861 2386v/s Ratio Prot 0.02 c0.14v/s Ratio Perm 0.01 c0.00 0.00 0.06 0.09v/c Ratio 0.06 0.06 0.03 0.10 0.03 0.13 0.21Uniform Delay, d1 37.6 40.3 40.2 5.7 5.5 5.9 6.2Progression Factor 1.00 1.00 1.00 1.00 1.00 1.00 1.00Incremental Delay, d2 0.4 0.6 0.3 0.3 0.0 0.3 0.2Delay (s) 37.9 40.9 40.5 6.0 5.5 6.2 6.4Level of Service D D D A A A AApproach Delay (s) 37.9 40.6 5.7 6.3Approach LOS D D A A
Intersection SummaryHCM Average Control Delay 10.4 HCM Level of Service BHCM Volume to Capacity ratio 0.18Actuated Cycle Length (s) 90.0 Sum of lost time (s) 18.0Intersection Capacity Utilization 46.4% ICU Level of Service AAnalysis Period (min) 15c Critical Lane Group
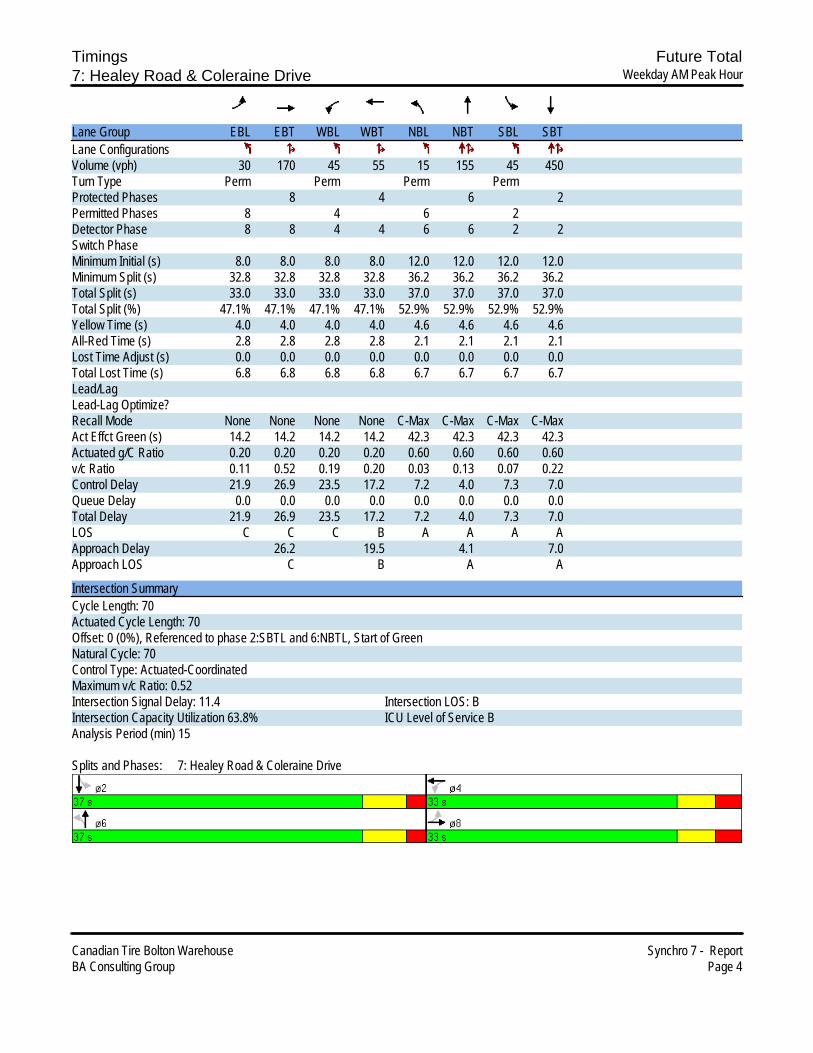
Timings Future Total7: Healey Road & Coleraine Drive Weekday AM Peak Hour
Canadian Tire Bolton Warehouse Synchro 7 - ReportBA Consulting Group Page 4
Lane Group EBL EBT WBL WBT NBL NBT SBL SBTLane ConfigurationsVolume (vph) 30 170 45 55 15 155 45 450Turn Type Perm Perm Perm PermProtected Phases 8 4 6 2Permitted Phases 8 4 6 2Detector Phase 8 8 4 4 6 6 2 2Switch PhaseMinimum Initial (s) 8.0 8.0 8.0 8.0 12.0 12.0 12.0 12.0Minimum Split (s) 32.8 32.8 32.8 32.8 36.2 36.2 36.2 36.2Total Split (s) 33.0 33.0 33.0 33.0 37.0 37.0 37.0 37.0Total Split (%) 47.1% 47.1% 47.1% 47.1% 52.9% 52.9% 52.9% 52.9%Yellow Time (s) 4.0 4.0 4.0 4.0 4.6 4.6 4.6 4.6All-Red Time (s) 2.8 2.8 2.8 2.8 2.1 2.1 2.1 2.1Lost Time Adjust (s) 0.0 0.0 0.0 0.0 0.0 0.0 0.0 0.0Total Lost Time (s) 6.8 6.8 6.8 6.8 6.7 6.7 6.7 6.7Lead/LagLead-Lag Optimize?Recall Mode None None None None C-Max C-Max C-Max C-MaxAct Effct Green (s) 14.2 14.2 14.2 14.2 42.3 42.3 42.3 42.3Actuated g/C Ratio 0.20 0.20 0.20 0.20 0.60 0.60 0.60 0.60v/c Ratio 0.11 0.52 0.19 0.20 0.03 0.13 0.07 0.22Control Delay 21.9 26.9 23.5 17.2 7.2 4.0 7.3 7.0Queue Delay 0.0 0.0 0.0 0.0 0.0 0.0 0.0 0.0Total Delay 21.9 26.9 23.5 17.2 7.2 4.0 7.3 7.0LOS C C C B A A A AApproach Delay 26.2 19.5 4.1 7.0Approach LOS C B A A
Intersection SummaryCycle Length: 70Actuated Cycle Length: 70Offset: 0 (0%), Referenced to phase 2:SBTL and 6:NBTL, Start of GreenNatural Cycle: 70Control Type: Actuated-CoordinatedMaximum v/c Ratio: 0.52Intersection Signal Delay: 11.4 Intersection LOS: BIntersection Capacity Utilization 63.8% ICU Level of Service BAnalysis Period (min) 15
Splits and Phases: 7: Healey Road & Coleraine Drive
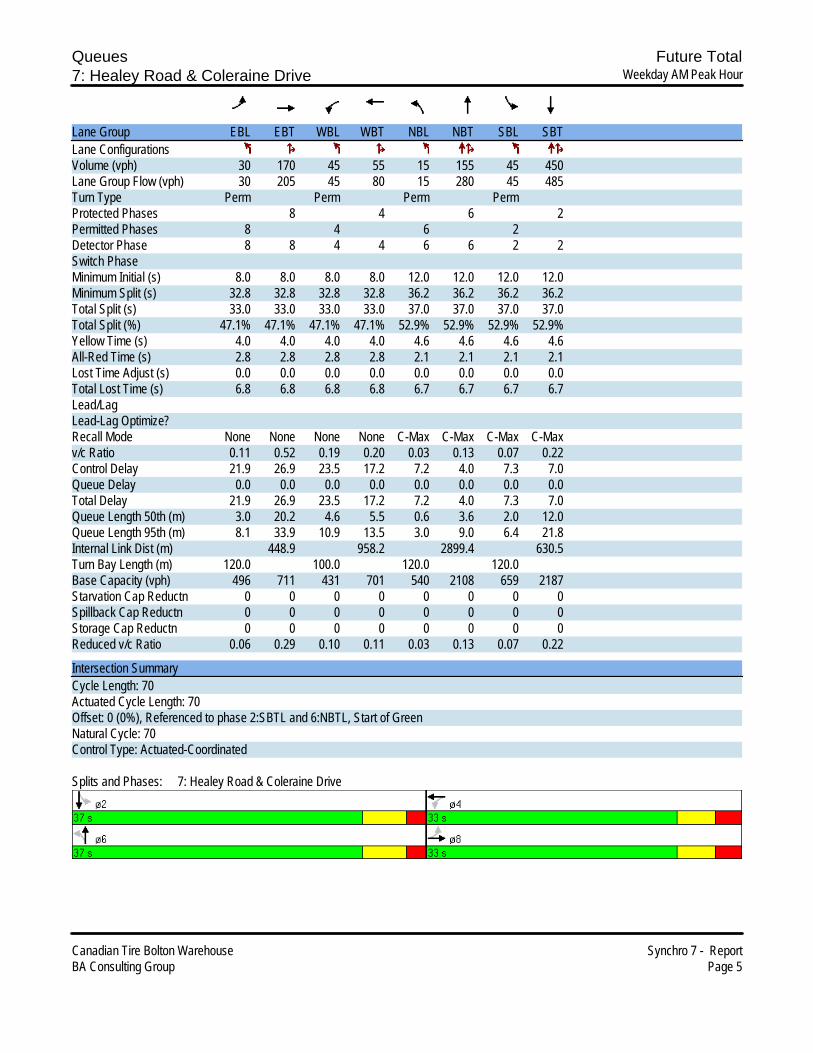
Queues Future Total7: Healey Road & Coleraine Drive Weekday AM Peak Hour
Canadian Tire Bolton Warehouse Synchro 7 - ReportBA Consulting Group Page 5
Lane Group EBL EBT WBL WBT NBL NBT SBL SBTLane ConfigurationsVolume (vph) 30 170 45 55 15 155 45 450Lane Group Flow (vph) 30 205 45 80 15 280 45 485Turn Type Perm Perm Perm PermProtected Phases 8 4 6 2Permitted Phases 8 4 6 2Detector Phase 8 8 4 4 6 6 2 2Switch PhaseMinimum Initial (s) 8.0 8.0 8.0 8.0 12.0 12.0 12.0 12.0Minimum Split (s) 32.8 32.8 32.8 32.8 36.2 36.2 36.2 36.2Total Split (s) 33.0 33.0 33.0 33.0 37.0 37.0 37.0 37.0Total Split (%) 47.1% 47.1% 47.1% 47.1% 52.9% 52.9% 52.9% 52.9%Yellow Time (s) 4.0 4.0 4.0 4.0 4.6 4.6 4.6 4.6All-Red Time (s) 2.8 2.8 2.8 2.8 2.1 2.1 2.1 2.1Lost Time Adjust (s) 0.0 0.0 0.0 0.0 0.0 0.0 0.0 0.0Total Lost Time (s) 6.8 6.8 6.8 6.8 6.7 6.7 6.7 6.7Lead/LagLead-Lag Optimize?Recall Mode None None None None C-Max C-Max C-Max C-Maxv/c Ratio 0.11 0.52 0.19 0.20 0.03 0.13 0.07 0.22Control Delay 21.9 26.9 23.5 17.2 7.2 4.0 7.3 7.0Queue Delay 0.0 0.0 0.0 0.0 0.0 0.0 0.0 0.0Total Delay 21.9 26.9 23.5 17.2 7.2 4.0 7.3 7.0Queue Length 50th (m) 3.0 20.2 4.6 5.5 0.6 3.6 2.0 12.0Queue Length 95th (m) 8.1 33.9 10.9 13.5 3.0 9.0 6.4 21.8Internal Link Dist (m) 448.9 958.2 2899.4 630.5Turn Bay Length (m) 120.0 100.0 120.0 120.0Base Capacity (vph) 496 711 431 701 540 2108 659 2187Starvation Cap Reductn 0 0 0 0 0 0 0 0Spillback Cap Reductn 0 0 0 0 0 0 0 0Storage Cap Reductn 0 0 0 0 0 0 0 0Reduced v/c Ratio 0.06 0.29 0.10 0.11 0.03 0.13 0.07 0.22
Intersection SummaryCycle Length: 70Actuated Cycle Length: 70Offset: 0 (0%), Referenced to phase 2:SBTL and 6:NBTL, Start of GreenNatural Cycle: 70Control Type: Actuated-Coordinated
Splits and Phases: 7: Healey Road & Coleraine Drive

HCM Signalized Intersection Capacity Analysis Future Total7: Healey Road & Coleraine Drive Weekday AM Peak Hour
Canadian Tire Bolton Warehouse Synchro 7 - ReportBA Consulting Group Page 6
Movement EBL EBT EBR WBL WBT WBR NBL NBT NBR SBL SBT SBRLane ConfigurationsVolume (vph) 30 170 35 45 55 25 15 155 125 45 450 35Ideal Flow (vphpl) 1900 1900 1900 1900 1900 1900 1900 1900 1900 1900 1900 1900Lane Width 3.5 3.7 3.5 3.5 3.7 3.5 3.5 3.7 3.5 3.5 3.7 3.5Total Lost time (s) 6.8 6.8 6.8 6.8 6.7 6.7 6.7 6.7Lane Util. Factor 1.00 1.00 1.00 1.00 1.00 0.95 1.00 0.95Frt 1.00 0.97 1.00 0.95 1.00 0.93 1.00 0.99Flt Protected 0.95 1.00 0.95 1.00 0.95 1.00 0.95 1.00Satd. Flow (prot) 1785 1872 1785 1831 1785 3406 1785 3611Flt Permitted 0.70 1.00 0.61 1.00 0.48 1.00 0.58 1.00Satd. Flow (perm) 1325 1872 1151 1831 893 3406 1089 3611Peak-hour factor, PHF 1.00 1.00 1.00 1.00 1.00 1.00 1.00 1.00 1.00 1.00 1.00 1.00Adj. Flow (vph) 30 170 35 45 55 25 15 155 125 45 450 35RTOR Reduction (vph) 0 14 0 0 20 0 0 49 0 0 6 0Lane Group Flow (vph) 30 191 0 45 60 0 15 231 0 45 479 0Turn Type Perm Perm Perm PermProtected Phases 8 4 6 2Permitted Phases 8 4 6 2Actuated Green, G (s) 14.2 14.2 14.2 14.2 42.3 42.3 42.3 42.3Effective Green, g (s) 14.2 14.2 14.2 14.2 42.3 42.3 42.3 42.3Actuated g/C Ratio 0.20 0.20 0.20 0.20 0.60 0.60 0.60 0.60Clearance Time (s) 6.8 6.8 6.8 6.8 6.7 6.7 6.7 6.7Vehicle Extension (s) 5.0 5.0 5.0 5.0 5.0 5.0 5.0 5.0Lane Grp Cap (vph) 269 380 233 371 540 2058 658 2182v/s Ratio Prot c0.10 0.03 0.07 c0.13v/s Ratio Perm 0.02 0.04 0.02 0.04v/c Ratio 0.11 0.50 0.19 0.16 0.03 0.11 0.07 0.22Uniform Delay, d1 22.8 24.8 23.1 23.0 5.6 5.9 5.7 6.3Progression Factor 1.00 1.00 1.00 1.00 1.00 1.00 1.00 1.00Incremental Delay, d2 0.4 2.2 0.8 0.4 0.1 0.1 0.2 0.2Delay (s) 23.1 27.0 24.0 23.4 5.7 6.0 5.9 6.6Level of Service C C C C A A A AApproach Delay (s) 26.5 23.6 6.0 6.5Approach LOS C C A A
Intersection SummaryHCM Average Control Delay 12.1 HCM Level of Service BHCM Volume to Capacity ratio 0.29Actuated Cycle Length (s) 70.0 Sum of lost time (s) 13.5Intersection Capacity Utilization 63.8% ICU Level of Service BAnalysis Period (min) 15c Critical Lane Group

HCM Unsignalized Intersection Capacity Analysis Future Total10: Healey Road & Humber Station Road Weekday AM Peak Hour
Canadian Tire Bolton Warehouse Synchro 7 - ReportBA Consulting Group Page 7
Movement EBL EBT EBR WBL WBT WBR NBL NBT NBR SBL SBT SBRLane ConfigurationsSign Control Stop Stop Stop StopVolume (vph) 0 175 5 5 70 15 0 10 10 70 50 5Peak Hour Factor 1.00 1.00 1.00 1.00 1.00 1.00 1.00 1.00 1.00 1.00 1.00 1.00Hourly flow rate (vph) 0 175 5 5 70 15 0 10 10 70 50 5
Direction, Lane # EB 1 WB 1 NB 1 SB 1Volume Total (vph) 180 90 20 125Volume Left (vph) 0 5 0 70Volume Right (vph) 5 15 10 5Hadj (s) -0.02 -0.09 -0.30 0.09Departure Headway (s) 4.3 4.4 4.4 4.6Degree Utilization, x 0.22 0.11 0.02 0.16Capacity (veh/h) 801 781 760 729Control Delay (s) 8.5 7.9 7.5 8.5Approach Delay (s) 8.5 7.9 7.5 8.5Approach LOS A A A A
Intersection SummaryDelay 8.3HCM Level of Service AIntersection Capacity Utilization 29.7% ICU Level of Service AAnalysis Period (min) 15

Timings Future Total13: Healey Drive & Queen Street South Weekday AM Peak Hour
Canadian Tire Bolton Warehouse Synchro 7 - ReportBA Consulting Group Page 8
Lane Group EBL EBR WBL WBT WBR NBL NBT NBR SBL SBT SBRLane ConfigurationsVolume (vph) 70 100 10 5 5 130 740 5 10 1445 275Turn Type Prot Perm Perm Perm D.P+P custom Perm PermProtected Phases 3 4 1 1 2 2Permitted Phases 4 4 4 2 2 2 2Detector Phase 3 4 4 4 4 1 1 2 2 2 2 2Switch PhaseMinimum Initial (s) 8.0 8.0 8.0 8.0 8.0 5.0 8.0 8.0 8.0 8.0Minimum Split (s) 13.0 36.6 36.6 36.6 36.6 8.0 34.1 34.1 34.1 34.1Total Split (s) 14.0 16.0 16.0 16.0 16.0 10.0 90.0 80.0 80.0 80.0 80.0Total Split (%) 11.7% 13.3% 13.3% 13.3% 13.3% 8.3% 75.0% 66.7% 66.7% 66.7% 66.7%Yellow Time (s) 3.0 4.0 4.0 4.0 4.0 3.0 4.0 4.0 4.0 4.0All-Red Time (s) 2.0 3.6 3.6 3.6 3.6 0.0 3.1 3.1 3.1 3.1Lost Time Adjust (s) 0.0 0.0 0.0 0.0 0.0 0.0 0.0 0.0 0.0 0.0 0.0Total Lost Time (s) 5.0 7.6 7.6 7.6 7.6 3.0 3.0 7.1 7.1 7.1 7.1Lead/Lag Lead Lag Lag Lag Lag Lead Lag Lag Lag LagLead-Lag Optimize? Yes Yes Yes Yes Yes Yes Yes YesRecall Mode None None None None None None C-Max C-Max C-Max C-MaxAct Effct Green (s) 8.8 8.2 8.2 8.2 8.2 87.0 90.0 74.6 74.6 74.6 74.6Actuated g/C Ratio 0.07 0.07 0.07 0.07 0.07 0.72 0.75 0.62 0.62 0.62 0.62v/c Ratio 0.28 0.31 0.10 0.04 0.04 0.49 0.27 0.01 0.02 0.64 0.25Control Delay 55.4 2.4 54.9 52.8 31.8 24.8 4.3 5.6 9.7 16.2 1.7Queue Delay 0.0 0.0 0.0 0.0 0.0 0.0 0.0 0.0 0.0 0.0 0.0Total Delay 55.4 2.4 54.9 52.8 31.8 24.8 4.3 5.6 9.7 16.2 1.7LOS E A D D C C A A A B AApproach Delay 48.6 7.3 13.9Approach LOS D A B
Intersection SummaryCycle Length: 120Actuated Cycle Length: 120Offset: 0 (0%), Referenced to phase 2:NBSB, Start of GreenNatural Cycle: 105Control Type: Actuated-CoordinatedMaximum v/c Ratio: 0.64Intersection Signal Delay: 12.7 Intersection LOS: BIntersection Capacity Utilization 71.9% ICU Level of Service CAnalysis Period (min) 15
Splits and Phases: 13: Healey Drive & Queen Street South
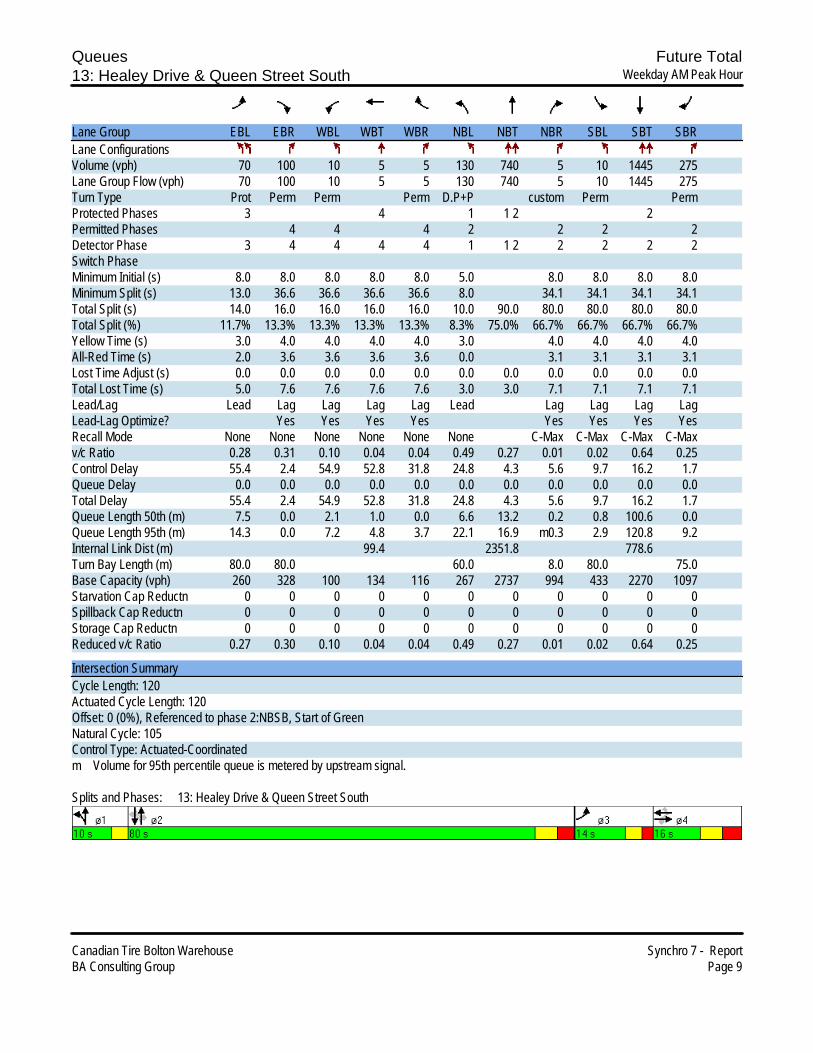
Queues Future Total13: Healey Drive & Queen Street South Weekday AM Peak Hour
Canadian Tire Bolton Warehouse Synchro 7 - ReportBA Consulting Group Page 9
Lane Group EBL EBR WBL WBT WBR NBL NBT NBR SBL SBT SBRLane ConfigurationsVolume (vph) 70 100 10 5 5 130 740 5 10 1445 275Lane Group Flow (vph) 70 100 10 5 5 130 740 5 10 1445 275Turn Type Prot Perm Perm Perm D.P+P custom Perm PermProtected Phases 3 4 1 1 2 2Permitted Phases 4 4 4 2 2 2 2Detector Phase 3 4 4 4 4 1 1 2 2 2 2 2Switch PhaseMinimum Initial (s) 8.0 8.0 8.0 8.0 8.0 5.0 8.0 8.0 8.0 8.0Minimum Split (s) 13.0 36.6 36.6 36.6 36.6 8.0 34.1 34.1 34.1 34.1Total Split (s) 14.0 16.0 16.0 16.0 16.0 10.0 90.0 80.0 80.0 80.0 80.0Total Split (%) 11.7% 13.3% 13.3% 13.3% 13.3% 8.3% 75.0% 66.7% 66.7% 66.7% 66.7%Yellow Time (s) 3.0 4.0 4.0 4.0 4.0 3.0 4.0 4.0 4.0 4.0All-Red Time (s) 2.0 3.6 3.6 3.6 3.6 0.0 3.1 3.1 3.1 3.1Lost Time Adjust (s) 0.0 0.0 0.0 0.0 0.0 0.0 0.0 0.0 0.0 0.0 0.0Total Lost Time (s) 5.0 7.6 7.6 7.6 7.6 3.0 3.0 7.1 7.1 7.1 7.1Lead/Lag Lead Lag Lag Lag Lag Lead Lag Lag Lag LagLead-Lag Optimize? Yes Yes Yes Yes Yes Yes Yes YesRecall Mode None None None None None None C-Max C-Max C-Max C-Maxv/c Ratio 0.28 0.31 0.10 0.04 0.04 0.49 0.27 0.01 0.02 0.64 0.25Control Delay 55.4 2.4 54.9 52.8 31.8 24.8 4.3 5.6 9.7 16.2 1.7Queue Delay 0.0 0.0 0.0 0.0 0.0 0.0 0.0 0.0 0.0 0.0 0.0Total Delay 55.4 2.4 54.9 52.8 31.8 24.8 4.3 5.6 9.7 16.2 1.7Queue Length 50th (m) 7.5 0.0 2.1 1.0 0.0 6.6 13.2 0.2 0.8 100.6 0.0Queue Length 95th (m) 14.3 0.0 7.2 4.8 3.7 22.1 16.9 m0.3 2.9 120.8 9.2Internal Link Dist (m) 99.4 2351.8 778.6Turn Bay Length (m) 80.0 80.0 60.0 8.0 80.0 75.0Base Capacity (vph) 260 328 100 134 116 267 2737 994 433 2270 1097Starvation Cap Reductn 0 0 0 0 0 0 0 0 0 0 0Spillback Cap Reductn 0 0 0 0 0 0 0 0 0 0 0Storage Cap Reductn 0 0 0 0 0 0 0 0 0 0 0Reduced v/c Ratio 0.27 0.30 0.10 0.04 0.04 0.49 0.27 0.01 0.02 0.64 0.25
Intersection SummaryCycle Length: 120Actuated Cycle Length: 120Offset: 0 (0%), Referenced to phase 2:NBSB, Start of GreenNatural Cycle: 105Control Type: Actuated-Coordinatedm Volume for 95th percentile queue is metered by upstream signal.
Splits and Phases: 13: Healey Drive & Queen Street South

HCM Signalized Intersection Capacity Analysis Future Total13: Healey Drive & Queen Street South Weekday AM Peak Hour
Canadian Tire Bolton Warehouse Synchro 7 - ReportBA Consulting Group Page 10
Movement EBL EBT EBR WBL WBT WBR NBL NBT NBR SBL SBT SBRLane ConfigurationsVolume (vph) 70 0 100 10 5 5 130 740 5 10 1445 275Ideal Flow (vphpl) 1900 1900 1900 1900 1900 1900 1900 1900 1900 1900 1900 1900Lane Width 3.5 3.7 3.5 3.5 3.7 3.5 3.5 3.7 3.5 3.5 3.7 3.5Total Lost time (s) 5.0 7.6 7.6 7.6 7.6 3.0 3.0 7.1 7.1 7.1 7.1Lane Util. Factor 0.97 1.00 1.00 1.00 1.00 1.00 0.95 1.00 1.00 0.95 1.00Frt 1.00 0.85 1.00 1.00 0.85 1.00 1.00 0.85 1.00 1.00 0.85Flt Protected 0.95 1.00 0.95 1.00 1.00 0.95 1.00 1.00 0.95 1.00 1.00Satd. Flow (prot) 3463 1597 1785 1921 1597 1785 3650 1597 1785 3650 1597Flt Permitted 0.95 1.00 0.76 1.00 1.00 0.12 1.00 1.00 0.37 1.00 1.00Satd. Flow (perm) 3463 1597 1423 1921 1597 219 3650 1597 696 3650 1597Peak-hour factor, PHF 1.00 1.00 1.00 1.00 1.00 1.00 1.00 1.00 1.00 1.00 1.00 1.00Adj. Flow (vph) 70 0 100 10 5 5 130 740 5 10 1445 275RTOR Reduction (vph) 0 0 93 0 0 5 0 0 1 0 0 106Lane Group Flow (vph) 70 0 7 10 5 0 130 740 4 10 1445 169Turn Type Prot Perm Perm Perm D.P+P custom Perm PermProtected Phases 3 4 4 1 1 2 2Permitted Phases 4 4 4 2 2 2 2Actuated Green, G (s) 7.2 8.2 8.2 8.2 8.2 81.9 84.9 73.7 73.7 73.7 73.7Effective Green, g (s) 7.2 8.2 8.2 8.2 8.2 81.9 84.9 73.7 73.7 73.7 73.7Actuated g/C Ratio 0.06 0.07 0.07 0.07 0.07 0.68 0.71 0.61 0.61 0.61 0.61Clearance Time (s) 5.0 7.6 7.6 7.6 7.6 3.0 7.1 7.1 7.1 7.1Vehicle Extension (s) 5.0 5.0 5.0 5.0 5.0 5.0 5.0 5.0 5.0 5.0Lane Grp Cap (vph) 208 109 97 131 109 256 2582 981 427 2242 981v/s Ratio Prot c0.02 0.00 c0.03 0.20 c0.40v/s Ratio Perm 0.00 c0.01 0.00 0.31 0.00 0.01 0.11v/c Ratio 0.34 0.06 0.10 0.04 0.00 0.51 0.29 0.00 0.02 0.64 0.17Uniform Delay, d1 54.1 52.3 52.4 52.2 52.1 11.3 6.4 9.0 9.1 14.8 10.0Progression Factor 1.00 1.00 1.00 1.00 1.00 3.92 0.79 0.72 1.00 1.00 1.00Incremental Delay, d2 2.0 0.5 1.0 0.3 0.0 2.7 0.1 0.0 0.1 1.4 0.4Delay (s) 56.1 52.8 53.4 52.5 52.1 47.0 5.2 6.4 9.2 16.2 10.4Level of Service E D D D D D A A A B BApproach Delay (s) 54.2 52.9 11.4 15.3Approach LOS D D B B
Intersection SummaryHCM Average Control Delay 16.7 HCM Level of Service BHCM Volume to Capacity ratio 0.56Actuated Cycle Length (s) 120.0 Sum of lost time (s) 22.7Intersection Capacity Utilization 71.9% ICU Level of Service CAnalysis Period (min) 15c Critical Lane Group
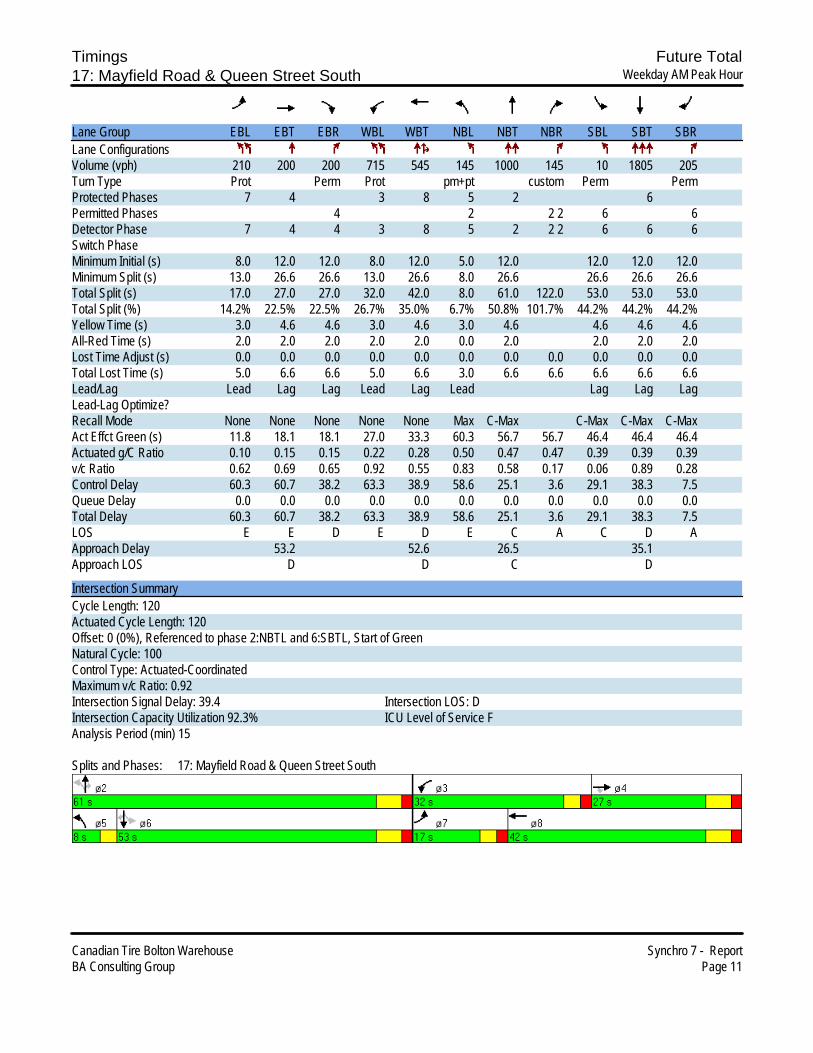
Timings Future Total17: Mayfield Road & Queen Street South Weekday AM Peak Hour
Canadian Tire Bolton Warehouse Synchro 7 - ReportBA Consulting Group Page 11
Lane Group EBL EBT EBR WBL WBT NBL NBT NBR SBL SBT SBRLane ConfigurationsVolume (vph) 210 200 200 715 545 145 1000 145 10 1805 205Turn Type Prot Perm Prot pm+pt custom Perm PermProtected Phases 7 4 3 8 5 2 6Permitted Phases 4 2 2 2 6 6Detector Phase 7 4 4 3 8 5 2 2 2 6 6 6Switch PhaseMinimum Initial (s) 8.0 12.0 12.0 8.0 12.0 5.0 12.0 12.0 12.0 12.0Minimum Split (s) 13.0 26.6 26.6 13.0 26.6 8.0 26.6 26.6 26.6 26.6Total Split (s) 17.0 27.0 27.0 32.0 42.0 8.0 61.0 122.0 53.0 53.0 53.0Total Split (%) 14.2% 22.5% 22.5% 26.7% 35.0% 6.7% 50.8% 101.7% 44.2% 44.2% 44.2%Yellow Time (s) 3.0 4.6 4.6 3.0 4.6 3.0 4.6 4.6 4.6 4.6All-Red Time (s) 2.0 2.0 2.0 2.0 2.0 0.0 2.0 2.0 2.0 2.0Lost Time Adjust (s) 0.0 0.0 0.0 0.0 0.0 0.0 0.0 0.0 0.0 0.0 0.0Total Lost Time (s) 5.0 6.6 6.6 5.0 6.6 3.0 6.6 6.6 6.6 6.6 6.6Lead/Lag Lead Lag Lag Lead Lag Lead Lag Lag LagLead-Lag Optimize?Recall Mode None None None None None Max C-Max C-Max C-Max C-MaxAct Effct Green (s) 11.8 18.1 18.1 27.0 33.3 60.3 56.7 56.7 46.4 46.4 46.4Actuated g/C Ratio 0.10 0.15 0.15 0.22 0.28 0.50 0.47 0.47 0.39 0.39 0.39v/c Ratio 0.62 0.69 0.65 0.92 0.55 0.83 0.58 0.17 0.06 0.89 0.28Control Delay 60.3 60.7 38.2 63.3 38.9 58.6 25.1 3.6 29.1 38.3 7.5Queue Delay 0.0 0.0 0.0 0.0 0.0 0.0 0.0 0.0 0.0 0.0 0.0Total Delay 60.3 60.7 38.2 63.3 38.9 58.6 25.1 3.6 29.1 38.3 7.5LOS E E D E D E C A C D AApproach Delay 53.2 52.6 26.5 35.1Approach LOS D D C D
Intersection SummaryCycle Length: 120Actuated Cycle Length: 120Offset: 0 (0%), Referenced to phase 2:NBTL and 6:SBTL, Start of GreenNatural Cycle: 100Control Type: Actuated-CoordinatedMaximum v/c Ratio: 0.92Intersection Signal Delay: 39.4 Intersection LOS: DIntersection Capacity Utilization 92.3% ICU Level of Service FAnalysis Period (min) 15
Splits and Phases: 17: Mayfield Road & Queen Street South
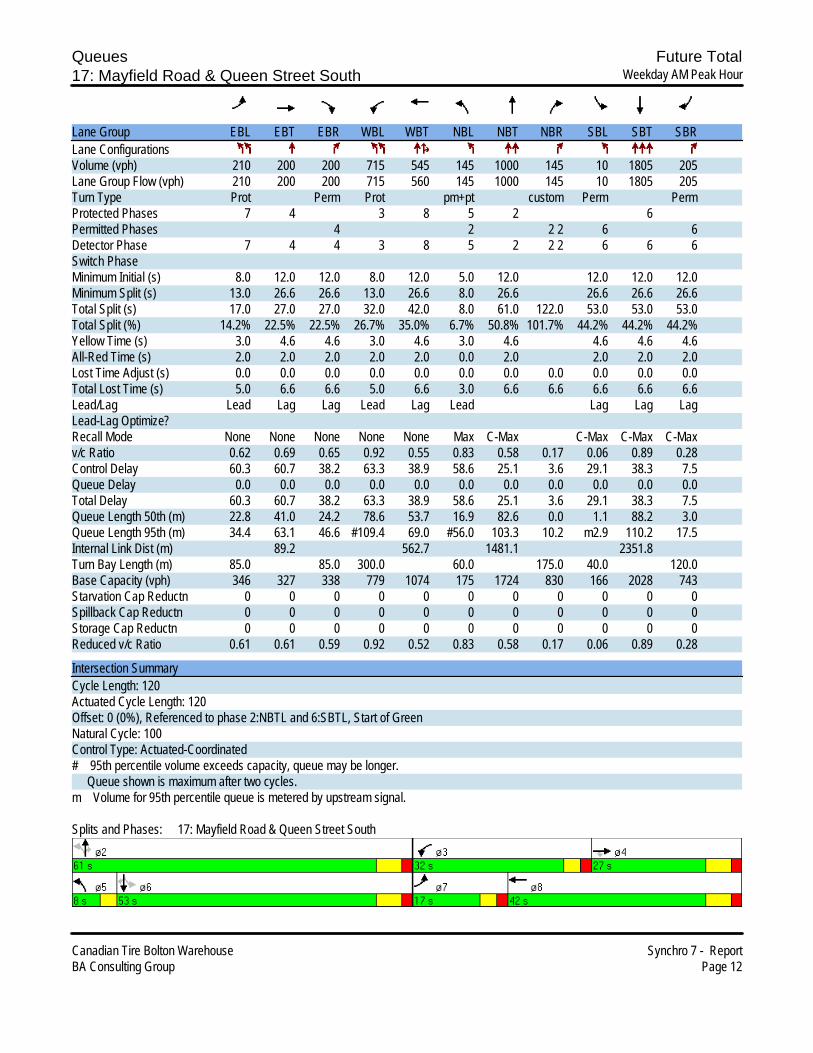
Queues Future Total17: Mayfield Road & Queen Street South Weekday AM Peak Hour
Canadian Tire Bolton Warehouse Synchro 7 - ReportBA Consulting Group Page 12
Lane Group EBL EBT EBR WBL WBT NBL NBT NBR SBL SBT SBRLane ConfigurationsVolume (vph) 210 200 200 715 545 145 1000 145 10 1805 205Lane Group Flow (vph) 210 200 200 715 560 145 1000 145 10 1805 205Turn Type Prot Perm Prot pm+pt custom Perm PermProtected Phases 7 4 3 8 5 2 6Permitted Phases 4 2 2 2 6 6Detector Phase 7 4 4 3 8 5 2 2 2 6 6 6Switch PhaseMinimum Initial (s) 8.0 12.0 12.0 8.0 12.0 5.0 12.0 12.0 12.0 12.0Minimum Split (s) 13.0 26.6 26.6 13.0 26.6 8.0 26.6 26.6 26.6 26.6Total Split (s) 17.0 27.0 27.0 32.0 42.0 8.0 61.0 122.0 53.0 53.0 53.0Total Split (%) 14.2% 22.5% 22.5% 26.7% 35.0% 6.7% 50.8% 101.7% 44.2% 44.2% 44.2%Yellow Time (s) 3.0 4.6 4.6 3.0 4.6 3.0 4.6 4.6 4.6 4.6All-Red Time (s) 2.0 2.0 2.0 2.0 2.0 0.0 2.0 2.0 2.0 2.0Lost Time Adjust (s) 0.0 0.0 0.0 0.0 0.0 0.0 0.0 0.0 0.0 0.0 0.0Total Lost Time (s) 5.0 6.6 6.6 5.0 6.6 3.0 6.6 6.6 6.6 6.6 6.6Lead/Lag Lead Lag Lag Lead Lag Lead Lag Lag LagLead-Lag Optimize?Recall Mode None None None None None Max C-Max C-Max C-Max C-Maxv/c Ratio 0.62 0.69 0.65 0.92 0.55 0.83 0.58 0.17 0.06 0.89 0.28Control Delay 60.3 60.7 38.2 63.3 38.9 58.6 25.1 3.6 29.1 38.3 7.5Queue Delay 0.0 0.0 0.0 0.0 0.0 0.0 0.0 0.0 0.0 0.0 0.0Total Delay 60.3 60.7 38.2 63.3 38.9 58.6 25.1 3.6 29.1 38.3 7.5Queue Length 50th (m) 22.8 41.0 24.2 78.6 53.7 16.9 82.6 0.0 1.1 88.2 3.0Queue Length 95th (m) 34.4 63.1 46.6 #109.4 69.0 #56.0 103.3 10.2 m2.9 110.2 17.5Internal Link Dist (m) 89.2 562.7 1481.1 2351.8Turn Bay Length (m) 85.0 85.0 300.0 60.0 175.0 40.0 120.0Base Capacity (vph) 346 327 338 779 1074 175 1724 830 166 2028 743Starvation Cap Reductn 0 0 0 0 0 0 0 0 0 0 0Spillback Cap Reductn 0 0 0 0 0 0 0 0 0 0 0Storage Cap Reductn 0 0 0 0 0 0 0 0 0 0 0Reduced v/c Ratio 0.61 0.61 0.59 0.92 0.52 0.83 0.58 0.17 0.06 0.89 0.28
Intersection SummaryCycle Length: 120Actuated Cycle Length: 120Offset: 0 (0%), Referenced to phase 2:NBTL and 6:SBTL, Start of GreenNatural Cycle: 100Control Type: Actuated-Coordinated# 95th percentile volume exceeds capacity, queue may be longer. Queue shown is maximum after two cycles.m Volume for 95th percentile queue is metered by upstream signal.
Splits and Phases: 17: Mayfield Road & Queen Street South
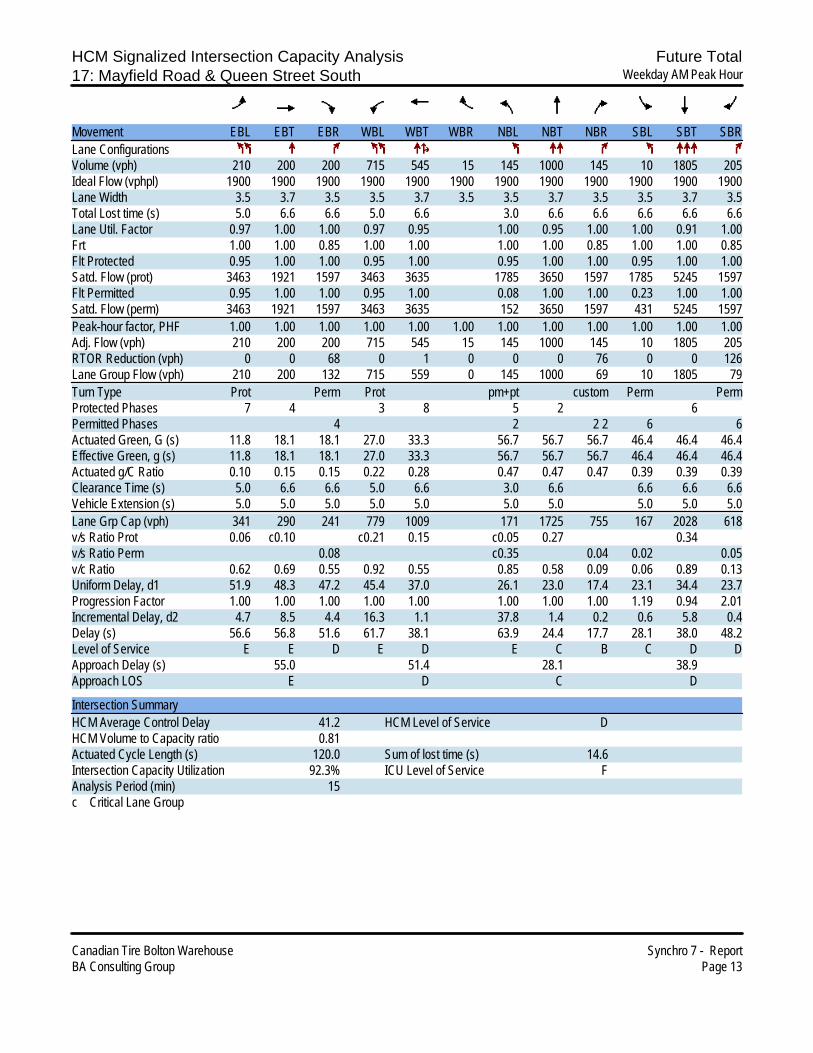
HCM Signalized Intersection Capacity Analysis Future Total17: Mayfield Road & Queen Street South Weekday AM Peak Hour
Canadian Tire Bolton Warehouse Synchro 7 - ReportBA Consulting Group Page 13
Movement EBL EBT EBR WBL WBT WBR NBL NBT NBR SBL SBT SBRLane ConfigurationsVolume (vph) 210 200 200 715 545 15 145 1000 145 10 1805 205Ideal Flow (vphpl) 1900 1900 1900 1900 1900 1900 1900 1900 1900 1900 1900 1900Lane Width 3.5 3.7 3.5 3.5 3.7 3.5 3.5 3.7 3.5 3.5 3.7 3.5Total Lost time (s) 5.0 6.6 6.6 5.0 6.6 3.0 6.6 6.6 6.6 6.6 6.6Lane Util. Factor 0.97 1.00 1.00 0.97 0.95 1.00 0.95 1.00 1.00 0.91 1.00Frt 1.00 1.00 0.85 1.00 1.00 1.00 1.00 0.85 1.00 1.00 0.85Flt Protected 0.95 1.00 1.00 0.95 1.00 0.95 1.00 1.00 0.95 1.00 1.00Satd. Flow (prot) 3463 1921 1597 3463 3635 1785 3650 1597 1785 5245 1597Flt Permitted 0.95 1.00 1.00 0.95 1.00 0.08 1.00 1.00 0.23 1.00 1.00Satd. Flow (perm) 3463 1921 1597 3463 3635 152 3650 1597 431 5245 1597Peak-hour factor, PHF 1.00 1.00 1.00 1.00 1.00 1.00 1.00 1.00 1.00 1.00 1.00 1.00Adj. Flow (vph) 210 200 200 715 545 15 145 1000 145 10 1805 205RTOR Reduction (vph) 0 0 68 0 1 0 0 0 76 0 0 126Lane Group Flow (vph) 210 200 132 715 559 0 145 1000 69 10 1805 79Turn Type Prot Perm Prot pm+pt custom Perm PermProtected Phases 7 4 3 8 5 2 6Permitted Phases 4 2 2 2 6 6Actuated Green, G (s) 11.8 18.1 18.1 27.0 33.3 56.7 56.7 56.7 46.4 46.4 46.4Effective Green, g (s) 11.8 18.1 18.1 27.0 33.3 56.7 56.7 56.7 46.4 46.4 46.4Actuated g/C Ratio 0.10 0.15 0.15 0.22 0.28 0.47 0.47 0.47 0.39 0.39 0.39Clearance Time (s) 5.0 6.6 6.6 5.0 6.6 3.0 6.6 6.6 6.6 6.6Vehicle Extension (s) 5.0 5.0 5.0 5.0 5.0 5.0 5.0 5.0 5.0 5.0Lane Grp Cap (vph) 341 290 241 779 1009 171 1725 755 167 2028 618v/s Ratio Prot 0.06 c0.10 c0.21 0.15 c0.05 0.27 0.34v/s Ratio Perm 0.08 c0.35 0.04 0.02 0.05v/c Ratio 0.62 0.69 0.55 0.92 0.55 0.85 0.58 0.09 0.06 0.89 0.13Uniform Delay, d1 51.9 48.3 47.2 45.4 37.0 26.1 23.0 17.4 23.1 34.4 23.7Progression Factor 1.00 1.00 1.00 1.00 1.00 1.00 1.00 1.00 1.19 0.94 2.01Incremental Delay, d2 4.7 8.5 4.4 16.3 1.1 37.8 1.4 0.2 0.6 5.8 0.4Delay (s) 56.6 56.8 51.6 61.7 38.1 63.9 24.4 17.7 28.1 38.0 48.2Level of Service E E D E D E C B C D DApproach Delay (s) 55.0 51.4 28.1 38.9Approach LOS E D C D
Intersection SummaryHCM Average Control Delay 41.2 HCM Level of Service DHCM Volume to Capacity ratio 0.81Actuated Cycle Length (s) 120.0 Sum of lost time (s) 14.6Intersection Capacity Utilization 92.3% ICU Level of Service FAnalysis Period (min) 15c Critical Lane Group
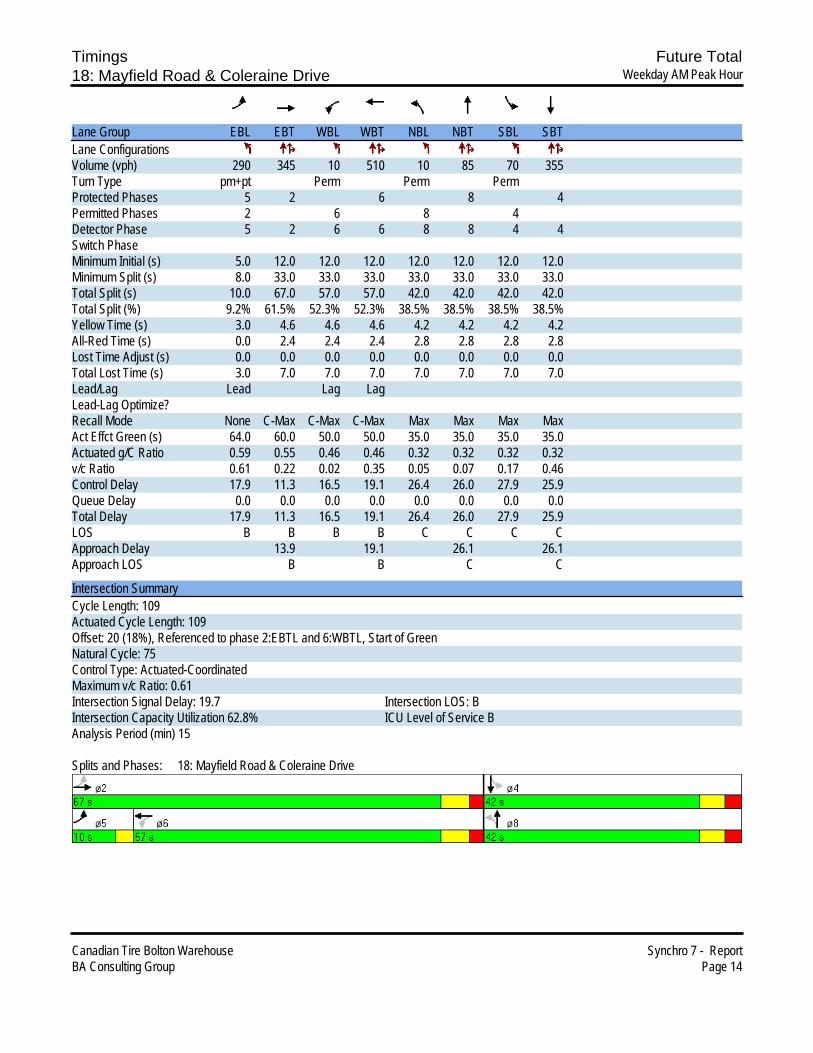
Timings Future Total18: Mayfield Road & Coleraine Drive Weekday AM Peak Hour
Canadian Tire Bolton Warehouse Synchro 7 - ReportBA Consulting Group Page 14
Lane Group EBL EBT WBL WBT NBL NBT SBL SBTLane ConfigurationsVolume (vph) 290 345 10 510 10 85 70 355Turn Type pm+pt Perm Perm PermProtected Phases 5 2 6 8 4Permitted Phases 2 6 8 4Detector Phase 5 2 6 6 8 8 4 4Switch PhaseMinimum Initial (s) 5.0 12.0 12.0 12.0 12.0 12.0 12.0 12.0Minimum Split (s) 8.0 33.0 33.0 33.0 33.0 33.0 33.0 33.0Total Split (s) 10.0 67.0 57.0 57.0 42.0 42.0 42.0 42.0Total Split (%) 9.2% 61.5% 52.3% 52.3% 38.5% 38.5% 38.5% 38.5%Yellow Time (s) 3.0 4.6 4.6 4.6 4.2 4.2 4.2 4.2All-Red Time (s) 0.0 2.4 2.4 2.4 2.8 2.8 2.8 2.8Lost Time Adjust (s) 0.0 0.0 0.0 0.0 0.0 0.0 0.0 0.0Total Lost Time (s) 3.0 7.0 7.0 7.0 7.0 7.0 7.0 7.0Lead/Lag Lead Lag LagLead-Lag Optimize?Recall Mode None C-Max C-Max C-Max Max Max Max MaxAct Effct Green (s) 64.0 60.0 50.0 50.0 35.0 35.0 35.0 35.0Actuated g/C Ratio 0.59 0.55 0.46 0.46 0.32 0.32 0.32 0.32v/c Ratio 0.61 0.22 0.02 0.35 0.05 0.07 0.17 0.46Control Delay 17.9 11.3 16.5 19.1 26.4 26.0 27.9 25.9Queue Delay 0.0 0.0 0.0 0.0 0.0 0.0 0.0 0.0Total Delay 17.9 11.3 16.5 19.1 26.4 26.0 27.9 25.9LOS B B B B C C C CApproach Delay 13.9 19.1 26.1 26.1Approach LOS B B C C
Intersection SummaryCycle Length: 109Actuated Cycle Length: 109Offset: 20 (18%), Referenced to phase 2:EBTL and 6:WBTL, Start of GreenNatural Cycle: 75Control Type: Actuated-CoordinatedMaximum v/c Ratio: 0.61Intersection Signal Delay: 19.7 Intersection LOS: BIntersection Capacity Utilization 62.8% ICU Level of Service BAnalysis Period (min) 15
Splits and Phases: 18: Mayfield Road & Coleraine Drive

Queues Future Total18: Mayfield Road & Coleraine Drive Weekday AM Peak Hour
Canadian Tire Bolton Warehouse Synchro 7 - ReportBA Consulting Group Page 15
Lane Group EBL EBT WBL WBT NBL NBT SBL SBTLane ConfigurationsVolume (vph) 290 345 10 510 10 85 70 355Lane Group Flow (vph) 290 440 10 575 10 85 70 535Turn Type pm+pt Perm Perm PermProtected Phases 5 2 6 8 4Permitted Phases 2 6 8 4Detector Phase 5 2 6 6 8 8 4 4Switch PhaseMinimum Initial (s) 5.0 12.0 12.0 12.0 12.0 12.0 12.0 12.0Minimum Split (s) 8.0 33.0 33.0 33.0 33.0 33.0 33.0 33.0Total Split (s) 10.0 67.0 57.0 57.0 42.0 42.0 42.0 42.0Total Split (%) 9.2% 61.5% 52.3% 52.3% 38.5% 38.5% 38.5% 38.5%Yellow Time (s) 3.0 4.6 4.6 4.6 4.2 4.2 4.2 4.2All-Red Time (s) 0.0 2.4 2.4 2.4 2.8 2.8 2.8 2.8Lost Time Adjust (s) 0.0 0.0 0.0 0.0 0.0 0.0 0.0 0.0Total Lost Time (s) 3.0 7.0 7.0 7.0 7.0 7.0 7.0 7.0Lead/Lag Lead Lag LagLead-Lag Optimize?Recall Mode None C-Max C-Max C-Max Max Max Max Maxv/c Ratio 0.61 0.22 0.02 0.35 0.05 0.07 0.17 0.46Control Delay 17.9 11.3 16.5 19.1 26.4 26.0 27.9 25.9Queue Delay 0.0 0.0 0.0 0.0 0.0 0.0 0.0 0.0Total Delay 17.9 11.3 16.5 19.1 26.4 26.0 27.9 25.9Queue Length 50th (m) 26.3 19.2 1.0 35.9 1.3 6.0 9.8 36.3Queue Length 95th (m) 39.9 27.1 3.9 47.7 5.0 11.2 19.7 50.7Internal Link Dist (m) 109.5 63.7 86.1 203.6Turn Bay Length (m) 100.0 60.0 75.0 125.0Base Capacity (vph) 478 1968 428 1655 221 1172 422 1172Starvation Cap Reductn 0 0 0 0 0 0 0 0Spillback Cap Reductn 0 0 0 0 0 0 0 0Storage Cap Reductn 0 0 0 0 0 0 0 0Reduced v/c Ratio 0.61 0.22 0.02 0.35 0.05 0.07 0.17 0.46
Intersection SummaryCycle Length: 109Actuated Cycle Length: 109Offset: 20 (18%), Referenced to phase 2:EBTL and 6:WBTL, Start of GreenNatural Cycle: 75Control Type: Actuated-Coordinated
Splits and Phases: 18: Mayfield Road & Coleraine Drive

HCM Signalized Intersection Capacity Analysis Future Total18: Mayfield Road & Coleraine Drive Weekday AM Peak Hour
Canadian Tire Bolton Warehouse Synchro 7 - ReportBA Consulting Group Page 16
Movement EBL EBT EBR WBL WBT WBR NBL NBT NBR SBL SBT SBRLane ConfigurationsVolume (vph) 290 345 95 10 510 65 10 85 0 70 355 180Ideal Flow (vphpl) 1900 1900 1900 1900 1900 1900 1900 1900 1900 1900 1900 1900Lane Width 3.5 3.7 3.5 3.5 3.7 3.5 3.5 3.7 3.5 3.5 3.7 3.5Total Lost time (s) 3.0 7.0 7.0 7.0 7.0 7.0 7.0 7.0Lane Util. Factor 1.00 0.95 1.00 0.95 1.00 0.95 1.00 0.95Frt 1.00 0.97 1.00 0.98 1.00 1.00 1.00 0.95Flt Protected 0.95 1.00 0.95 1.00 0.95 1.00 0.95 1.00Satd. Flow (prot) 1785 3532 1785 3588 1785 3650 1785 3466Flt Permitted 0.37 1.00 0.50 1.00 0.37 1.00 0.70 1.00Satd. Flow (perm) 696 3532 933 3588 688 3650 1313 3466Peak-hour factor, PHF 1.00 1.00 1.00 1.00 1.00 1.00 1.00 1.00 1.00 1.00 1.00 1.00Adj. Flow (vph) 290 345 95 10 510 65 10 85 0 70 355 180RTOR Reduction (vph) 0 23 0 0 9 0 0 0 0 0 58 0Lane Group Flow (vph) 290 417 0 10 566 0 10 85 0 70 477 0Turn Type pm+pt Perm Perm PermProtected Phases 5 2 6 8 4Permitted Phases 2 6 8 4Actuated Green, G (s) 60.0 60.0 50.0 50.0 35.0 35.0 35.0 35.0Effective Green, g (s) 60.0 60.0 50.0 50.0 35.0 35.0 35.0 35.0Actuated g/C Ratio 0.55 0.55 0.46 0.46 0.32 0.32 0.32 0.32Clearance Time (s) 3.0 7.0 7.0 7.0 7.0 7.0 7.0 7.0Vehicle Extension (s) 5.0 5.0 5.0 5.0 5.0 5.0 5.0 5.0Lane Grp Cap (vph) 453 1944 428 1646 221 1172 422 1113v/s Ratio Prot c0.04 0.12 0.16 0.02 c0.14v/s Ratio Perm c0.31 0.01 0.01 0.05v/c Ratio 0.64 0.21 0.02 0.34 0.05 0.07 0.17 0.43Uniform Delay, d1 15.3 12.5 16.1 19.0 25.5 25.7 26.5 29.1Progression Factor 1.00 1.00 1.00 1.00 1.00 1.00 1.00 1.00Incremental Delay, d2 4.2 0.3 0.1 0.6 0.4 0.1 0.8 1.2Delay (s) 19.5 12.7 16.2 19.5 25.9 25.8 27.4 30.3Level of Service B B B B C C C CApproach Delay (s) 15.4 19.5 25.8 30.0Approach LOS B B C C
Intersection SummaryHCM Average Control Delay 21.5 HCM Level of Service CHCM Volume to Capacity ratio 0.54Actuated Cycle Length (s) 109.0 Sum of lost time (s) 10.0Intersection Capacity Utilization 62.8% ICU Level of Service BAnalysis Period (min) 15c Critical Lane Group
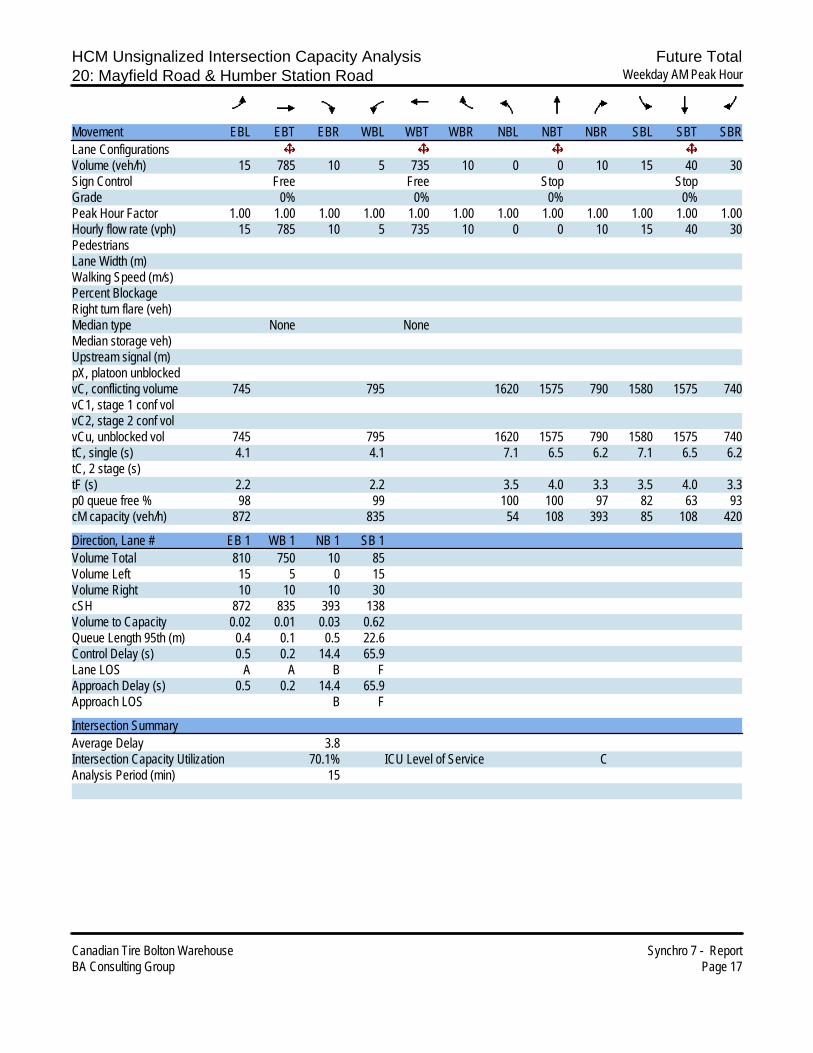
HCM Unsignalized Intersection Capacity Analysis Future Total20: Mayfield Road & Humber Station Road Weekday AM Peak Hour
Canadian Tire Bolton Warehouse Synchro 7 - ReportBA Consulting Group Page 17
Movement EBL EBT EBR WBL WBT WBR NBL NBT NBR SBL SBT SBRLane ConfigurationsVolume (veh/h) 15 785 10 5 735 10 0 0 10 15 40 30Sign Control Free Free Stop StopGrade 0% 0% 0% 0%Peak Hour Factor 1.00 1.00 1.00 1.00 1.00 1.00 1.00 1.00 1.00 1.00 1.00 1.00Hourly flow rate (vph) 15 785 10 5 735 10 0 0 10 15 40 30PedestriansLane Width (m)Walking Speed (m/s)Percent BlockageRight turn flare (veh)Median type None NoneMedian storage veh)Upstream signal (m)pX, platoon unblockedvC, conflicting volume 745 795 1620 1575 790 1580 1575 740vC1, stage 1 conf volvC2, stage 2 conf volvCu, unblocked vol 745 795 1620 1575 790 1580 1575 740tC, single (s) 4.1 4.1 7.1 6.5 6.2 7.1 6.5 6.2tC, 2 stage (s)tF (s) 2.2 2.2 3.5 4.0 3.3 3.5 4.0 3.3p0 queue free % 98 99 100 100 97 82 63 93cM capacity (veh/h) 872 835 54 108 393 85 108 420
Direction, Lane # EB 1 WB 1 NB 1 SB 1Volume Total 810 750 10 85Volume Left 15 5 0 15Volume Right 10 10 10 30cSH 872 835 393 138Volume to Capacity 0.02 0.01 0.03 0.62Queue Length 95th (m) 0.4 0.1 0.5 22.6Control Delay (s) 0.5 0.2 14.4 65.9Lane LOS A A B FApproach Delay (s) 0.5 0.2 14.4 65.9Approach LOS B F
Intersection SummaryAverage Delay 3.8Intersection Capacity Utilization 70.1% ICU Level of Service CAnalysis Period (min) 15
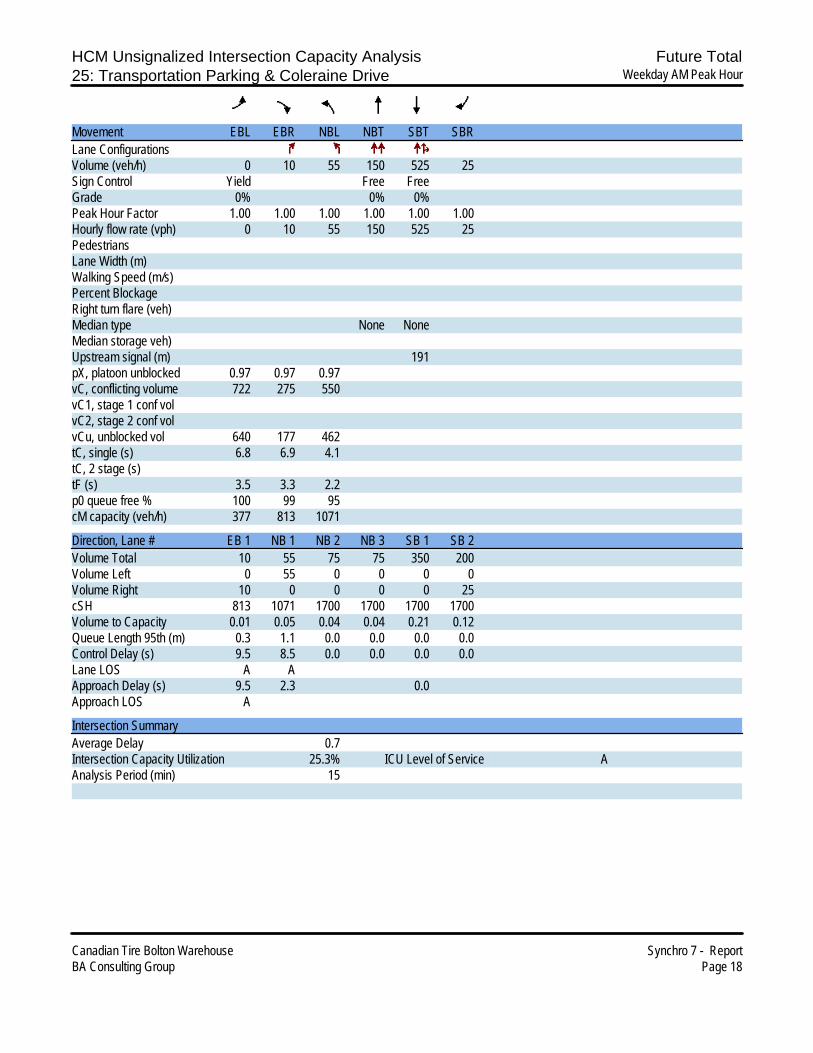
HCM Unsignalized Intersection Capacity Analysis Future Total25: Transportation Parking & Coleraine Drive Weekday AM Peak Hour
Canadian Tire Bolton Warehouse Synchro 7 - ReportBA Consulting Group Page 18
Movement EBL EBR NBL NBT SBT SBRLane ConfigurationsVolume (veh/h) 0 10 55 150 525 25Sign Control Yield Free FreeGrade 0% 0% 0%Peak Hour Factor 1.00 1.00 1.00 1.00 1.00 1.00Hourly flow rate (vph) 0 10 55 150 525 25PedestriansLane Width (m)Walking Speed (m/s)Percent BlockageRight turn flare (veh)Median type None NoneMedian storage veh)Upstream signal (m) 191pX, platoon unblocked 0.97 0.97 0.97vC, conflicting volume 722 275 550vC1, stage 1 conf volvC2, stage 2 conf volvCu, unblocked vol 640 177 462tC, single (s) 6.8 6.9 4.1tC, 2 stage (s)tF (s) 3.5 3.3 2.2p0 queue free % 100 99 95cM capacity (veh/h) 377 813 1071
Direction, Lane # EB 1 NB 1 NB 2 NB 3 SB 1 SB 2Volume Total 10 55 75 75 350 200Volume Left 0 55 0 0 0 0Volume Right 10 0 0 0 0 25cSH 813 1071 1700 1700 1700 1700Volume to Capacity 0.01 0.05 0.04 0.04 0.21 0.12Queue Length 95th (m) 0.3 1.1 0.0 0.0 0.0 0.0Control Delay (s) 9.5 8.5 0.0 0.0 0.0 0.0Lane LOS A AApproach Delay (s) 9.5 2.3 0.0Approach LOS A
Intersection SummaryAverage Delay 0.7Intersection Capacity Utilization 25.3% ICU Level of Service AAnalysis Period (min) 15
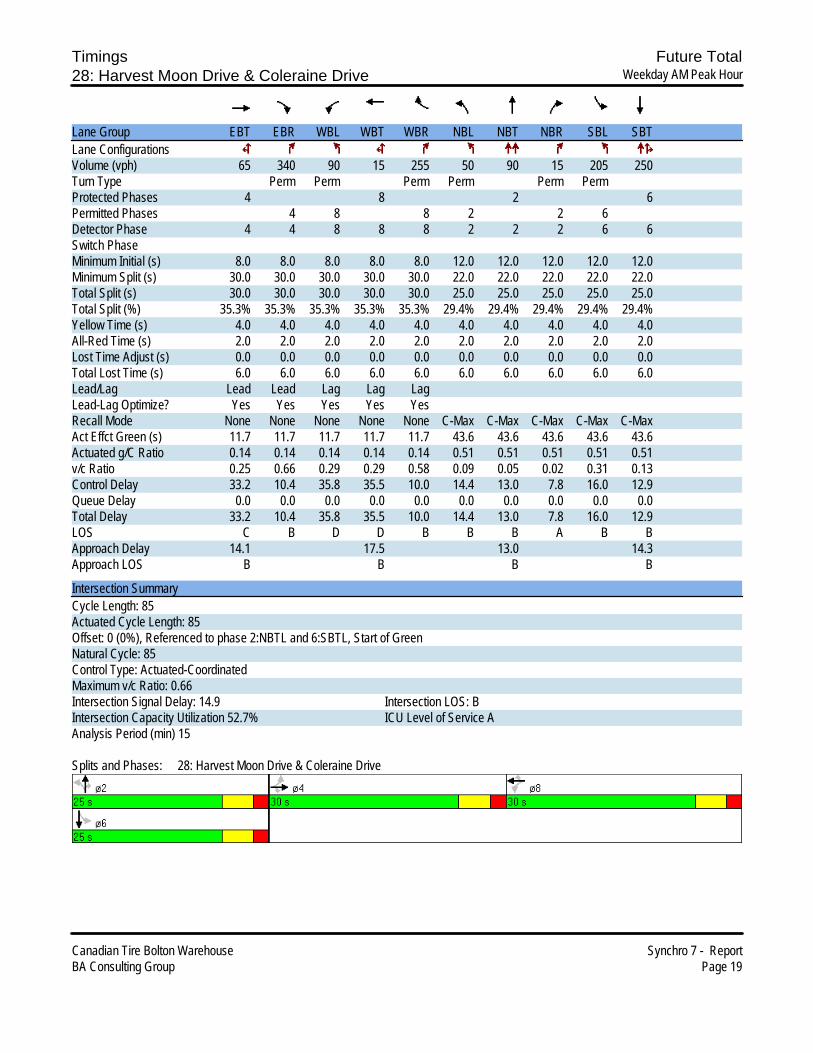
Timings Future Total28: Harvest Moon Drive & Coleraine Drive Weekday AM Peak Hour
Canadian Tire Bolton Warehouse Synchro 7 - ReportBA Consulting Group Page 19
Lane Group EBT EBR WBL WBT WBR NBL NBT NBR SBL SBTLane ConfigurationsVolume (vph) 65 340 90 15 255 50 90 15 205 250Turn Type Perm Perm Perm Perm Perm PermProtected Phases 4 8 2 6Permitted Phases 4 8 8 2 2 6Detector Phase 4 4 8 8 8 2 2 2 6 6Switch PhaseMinimum Initial (s) 8.0 8.0 8.0 8.0 8.0 12.0 12.0 12.0 12.0 12.0Minimum Split (s) 30.0 30.0 30.0 30.0 30.0 22.0 22.0 22.0 22.0 22.0Total Split (s) 30.0 30.0 30.0 30.0 30.0 25.0 25.0 25.0 25.0 25.0Total Split (%) 35.3% 35.3% 35.3% 35.3% 35.3% 29.4% 29.4% 29.4% 29.4% 29.4%Yellow Time (s) 4.0 4.0 4.0 4.0 4.0 4.0 4.0 4.0 4.0 4.0All-Red Time (s) 2.0 2.0 2.0 2.0 2.0 2.0 2.0 2.0 2.0 2.0Lost Time Adjust (s) 0.0 0.0 0.0 0.0 0.0 0.0 0.0 0.0 0.0 0.0Total Lost Time (s) 6.0 6.0 6.0 6.0 6.0 6.0 6.0 6.0 6.0 6.0Lead/Lag Lead Lead Lag Lag LagLead-Lag Optimize? Yes Yes Yes Yes YesRecall Mode None None None None None C-Max C-Max C-Max C-Max C-MaxAct Effct Green (s) 11.7 11.7 11.7 11.7 11.7 43.6 43.6 43.6 43.6 43.6Actuated g/C Ratio 0.14 0.14 0.14 0.14 0.14 0.51 0.51 0.51 0.51 0.51v/c Ratio 0.25 0.66 0.29 0.29 0.58 0.09 0.05 0.02 0.31 0.13Control Delay 33.2 10.4 35.8 35.5 10.0 14.4 13.0 7.8 16.0 12.9Queue Delay 0.0 0.0 0.0 0.0 0.0 0.0 0.0 0.0 0.0 0.0Total Delay 33.2 10.4 35.8 35.5 10.0 14.4 13.0 7.8 16.0 12.9LOS C B D D B B B A B BApproach Delay 14.1 17.5 13.0 14.3Approach LOS B B B B
Intersection SummaryCycle Length: 85Actuated Cycle Length: 85Offset: 0 (0%), Referenced to phase 2:NBTL and 6:SBTL, Start of GreenNatural Cycle: 85Control Type: Actuated-CoordinatedMaximum v/c Ratio: 0.66Intersection Signal Delay: 14.9 Intersection LOS: BIntersection Capacity Utilization 52.7% ICU Level of Service AAnalysis Period (min) 15
Splits and Phases: 28: Harvest Moon Drive & Coleraine Drive

Queues Future Total28: Harvest Moon Drive & Coleraine Drive Weekday AM Peak Hour
Canadian Tire Bolton Warehouse Synchro 7 - ReportBA Consulting Group Page 20
Lane Group EBT EBR WBL WBT WBR NBL NBT NBR SBL SBTLane ConfigurationsVolume (vph) 65 340 90 15 255 50 90 15 205 250Lane Group Flow (vph) 65 340 51 54 255 50 90 15 205 250Turn Type Perm Perm Perm Perm Perm PermProtected Phases 4 8 2 6Permitted Phases 4 8 8 2 2 6Detector Phase 4 4 8 8 8 2 2 2 6 6Switch PhaseMinimum Initial (s) 8.0 8.0 8.0 8.0 8.0 12.0 12.0 12.0 12.0 12.0Minimum Split (s) 30.0 30.0 30.0 30.0 30.0 22.0 22.0 22.0 22.0 22.0Total Split (s) 30.0 30.0 30.0 30.0 30.0 25.0 25.0 25.0 25.0 25.0Total Split (%) 35.3% 35.3% 35.3% 35.3% 35.3% 29.4% 29.4% 29.4% 29.4% 29.4%Yellow Time (s) 4.0 4.0 4.0 4.0 4.0 4.0 4.0 4.0 4.0 4.0All-Red Time (s) 2.0 2.0 2.0 2.0 2.0 2.0 2.0 2.0 2.0 2.0Lost Time Adjust (s) 0.0 0.0 0.0 0.0 0.0 0.0 0.0 0.0 0.0 0.0Total Lost Time (s) 6.0 6.0 6.0 6.0 6.0 6.0 6.0 6.0 6.0 6.0Lead/Lag Lead Lead Lag Lag LagLead-Lag Optimize? Yes Yes Yes Yes YesRecall Mode None None None None None C-Max C-Max C-Max C-Max C-Maxv/c Ratio 0.25 0.66 0.29 0.29 0.58 0.09 0.05 0.02 0.31 0.13Control Delay 33.2 10.4 35.8 35.5 10.0 14.4 13.0 7.8 16.0 12.9Queue Delay 0.0 0.0 0.0 0.0 0.0 0.0 0.0 0.0 0.0 0.0Total Delay 33.2 10.4 35.8 35.5 10.0 14.4 13.0 7.8 16.0 12.9Queue Length 50th (m) 9.0 0.0 7.4 7.8 0.0 3.4 3.1 0.0 15.6 9.0Queue Length 95th (m) 17.1 18.3 15.7 16.6 16.7 11.8 9.0 3.4 40.2 20.8Internal Link Dist (m) 258.9 596.1 956.4 135.8Turn Bay Length (m) 80.0 80.0 80.0Base Capacity (vph) 542 695 360 384 634 576 1872 826 671 1872Starvation Cap Reductn 0 0 0 0 0 0 0 0 0 0Spillback Cap Reductn 0 0 0 0 0 0 0 0 0 0Storage Cap Reductn 0 0 0 0 0 0 0 0 0 0Reduced v/c Ratio 0.12 0.49 0.14 0.14 0.40 0.09 0.05 0.02 0.31 0.13
Intersection SummaryCycle Length: 85Actuated Cycle Length: 85Offset: 0 (0%), Referenced to phase 2:NBTL and 6:SBTL, Start of GreenNatural Cycle: 85Control Type: Actuated-Coordinated
Splits and Phases: 28: Harvest Moon Drive & Coleraine Drive

HCM Signalized Intersection Capacity Analysis Future Total28: Harvest Moon Drive & Coleraine Drive Weekday AM Peak Hour
Canadian Tire Bolton Warehouse Synchro 7 - ReportBA Consulting Group Page 21
Movement EBL EBT EBR WBL WBT WBR NBL NBT NBR SBL SBT SBRLane ConfigurationsVolume (vph) 0 65 340 90 15 255 50 90 15 205 250 0Ideal Flow (vphpl) 1900 1900 1900 1900 1900 1900 1900 1900 1900 1900 1900 1900Lane Width 3.5 3.7 3.5 3.5 3.7 3.5 3.5 3.7 3.5 3.5 3.7 3.5Total Lost time (s) 6.0 6.0 6.0 6.0 6.0 6.0 6.0 6.0 6.0 6.0Lane Util. Factor 1.00 1.00 0.95 0.95 1.00 1.00 0.95 1.00 1.00 0.95Frt 1.00 0.85 1.00 1.00 0.85 1.00 1.00 0.85 1.00 1.00Flt Protected 1.00 1.00 0.95 0.97 1.00 0.95 1.00 1.00 0.95 1.00Satd. Flow (prot) 1921 1597 1696 1761 1597 1785 3650 1597 1785 3650Flt Permitted 1.00 1.00 0.71 0.74 1.00 0.60 1.00 1.00 0.70 1.00Satd. Flow (perm) 1921 1597 1276 1360 1597 1121 3650 1597 1307 3650Peak-hour factor, PHF 1.00 1.00 1.00 1.00 1.00 1.00 1.00 1.00 1.00 1.00 1.00 1.00Adj. Flow (vph) 0 65 340 90 15 255 50 90 15 205 250 0RTOR Reduction (vph) 0 0 293 0 0 220 0 0 7 0 0 0Lane Group Flow (vph) 0 65 47 51 54 35 50 90 8 205 250 0Turn Type Perm Perm Perm Perm Perm Perm PermProtected Phases 4 8 2 6Permitted Phases 4 4 8 8 2 2 6Actuated Green, G (s) 11.7 11.7 11.7 11.7 11.7 43.6 43.6 43.6 43.6 43.6Effective Green, g (s) 11.7 11.7 11.7 11.7 11.7 43.6 43.6 43.6 43.6 43.6Actuated g/C Ratio 0.14 0.14 0.14 0.14 0.14 0.51 0.51 0.51 0.51 0.51Clearance Time (s) 6.0 6.0 6.0 6.0 6.0 6.0 6.0 6.0 6.0 6.0Vehicle Extension (s) 5.0 5.0 5.0 5.0 5.0 5.0 5.0 5.0 5.0 5.0Lane Grp Cap (vph) 264 220 176 187 220 575 1872 819 670 1872v/s Ratio Prot c0.03 0.02 0.07v/s Ratio Perm 0.03 c0.04 0.04 0.02 0.04 0.00 c0.16v/c Ratio 0.25 0.21 0.29 0.29 0.16 0.09 0.05 0.01 0.31 0.13Uniform Delay, d1 32.7 32.6 32.9 32.9 32.3 10.6 10.3 10.1 12.0 10.8Progression Factor 1.00 1.00 1.00 1.00 1.00 1.00 1.00 1.00 1.00 1.00Incremental Delay, d2 1.0 1.0 1.9 1.8 0.7 0.3 0.0 0.0 1.2 0.1Delay (s) 33.7 33.6 34.8 34.7 33.0 10.9 10.4 10.2 13.1 11.0Level of Service C C C C C B B B B BApproach Delay (s) 33.6 33.5 10.5 11.9Approach LOS C C B B
Intersection SummaryHCM Average Control Delay 23.8 HCM Level of Service CHCM Volume to Capacity ratio 0.29Actuated Cycle Length (s) 85.0 Sum of lost time (s) 18.0Intersection Capacity Utilization 52.7% ICU Level of Service AAnalysis Period (min) 15c Critical Lane Group

HCM Unsignalized Intersection Capacity Analysis Future Total34: Healey Road & Site Entrance (Cars) Weekday AM Peak Hour
Canadian Tire Bolton Warehouse Synchro 7 - ReportBA Consulting Group Page 22
Movement EBL EBT WBT WBR SBL SBRLane ConfigurationsVolume (veh/h) 10 245 85 20 20 5Sign Control Free Free StopGrade 0% 0% 0%Peak Hour Factor 1.00 1.00 1.00 1.00 1.00 1.00Hourly flow rate (vph) 10 245 85 20 20 5PedestriansLane Width (m)Walking Speed (m/s)Percent BlockageRight turn flare (veh)Median type None NoneMedian storage veh)Upstream signal (m)pX, platoon unblockedvC, conflicting volume 105 360 95vC1, stage 1 conf volvC2, stage 2 conf volvCu, unblocked vol 105 360 95tC, single (s) 4.1 6.4 6.2tC, 2 stage (s)tF (s) 2.2 3.5 3.3p0 queue free % 99 97 99cM capacity (veh/h) 1499 639 967
Direction, Lane # EB 1 WB 1 SB 1Volume Total 255 105 25Volume Left 10 0 20Volume Right 0 20 5cSH 1499 1700 685Volume to Capacity 0.01 0.06 0.04Queue Length 95th (m) 0.1 0.0 0.8Control Delay (s) 0.3 0.0 10.5Lane LOS A BApproach Delay (s) 0.3 0.0 10.5Approach LOS B
Intersection SummaryAverage Delay 0.9Intersection Capacity Utilization 30.1% ICU Level of Service AAnalysis Period (min) 15
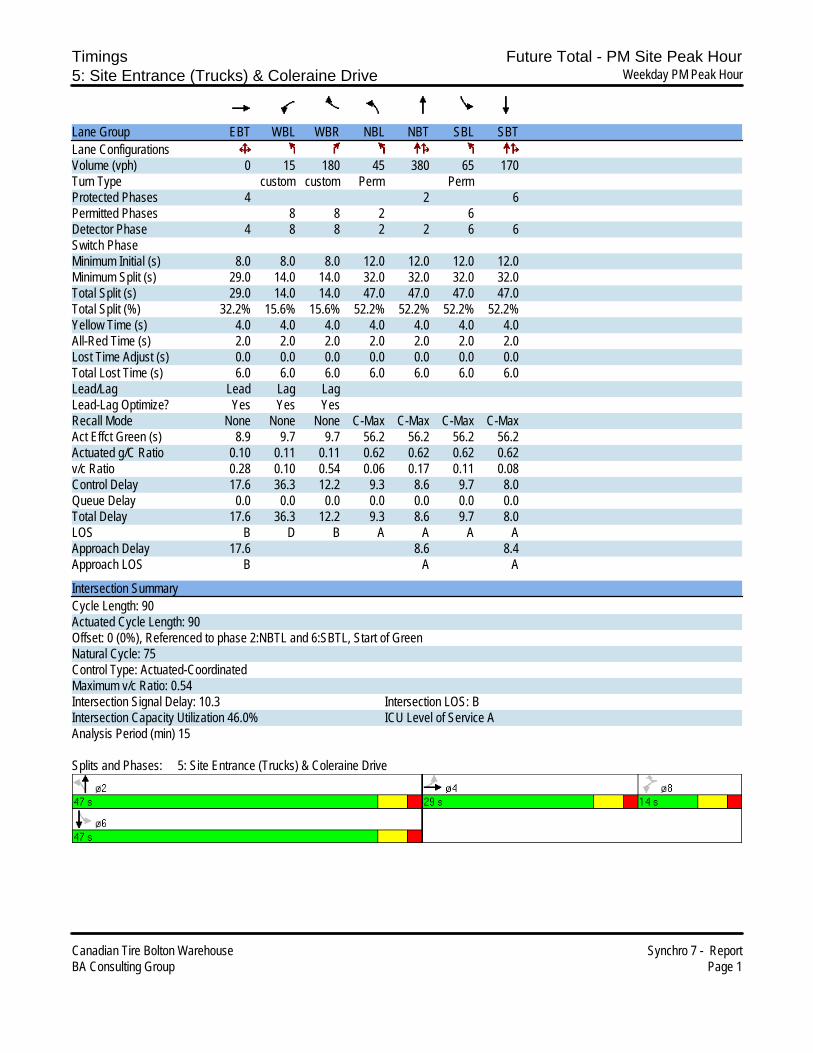
Timings Future Total - PM Site Peak Hour5: Site Entrance (Trucks) & Coleraine Drive Weekday PM Peak Hour
Canadian Tire Bolton Warehouse Synchro 7 - ReportBA Consulting Group Page 1
Lane Group EBT WBL WBR NBL NBT SBL SBTLane ConfigurationsVolume (vph) 0 15 180 45 380 65 170Turn Type custom custom Perm PermProtected Phases 4 2 6Permitted Phases 8 8 2 6Detector Phase 4 8 8 2 2 6 6Switch PhaseMinimum Initial (s) 8.0 8.0 8.0 12.0 12.0 12.0 12.0Minimum Split (s) 29.0 14.0 14.0 32.0 32.0 32.0 32.0Total Split (s) 29.0 14.0 14.0 47.0 47.0 47.0 47.0Total Split (%) 32.2% 15.6% 15.6% 52.2% 52.2% 52.2% 52.2%Yellow Time (s) 4.0 4.0 4.0 4.0 4.0 4.0 4.0All-Red Time (s) 2.0 2.0 2.0 2.0 2.0 2.0 2.0Lost Time Adjust (s) 0.0 0.0 0.0 0.0 0.0 0.0 0.0Total Lost Time (s) 6.0 6.0 6.0 6.0 6.0 6.0 6.0Lead/Lag Lead Lag LagLead-Lag Optimize? Yes Yes YesRecall Mode None None None C-Max C-Max C-Max C-MaxAct Effct Green (s) 8.9 9.7 9.7 56.2 56.2 56.2 56.2Actuated g/C Ratio 0.10 0.11 0.11 0.62 0.62 0.62 0.62v/c Ratio 0.28 0.10 0.54 0.06 0.17 0.11 0.08Control Delay 17.6 36.3 12.2 9.3 8.6 9.7 8.0Queue Delay 0.0 0.0 0.0 0.0 0.0 0.0 0.0Total Delay 17.6 36.3 12.2 9.3 8.6 9.7 8.0LOS B D B A A A AApproach Delay 17.6 8.6 8.4Approach LOS B A A
Intersection SummaryCycle Length: 90Actuated Cycle Length: 90Offset: 0 (0%), Referenced to phase 2:NBTL and 6:SBTL, Start of GreenNatural Cycle: 75Control Type: Actuated-CoordinatedMaximum v/c Ratio: 0.54Intersection Signal Delay: 10.3 Intersection LOS: BIntersection Capacity Utilization 46.0% ICU Level of Service AAnalysis Period (min) 15
Splits and Phases: 5: Site Entrance (Trucks) & Coleraine Drive

Queues Future Total - PM Site Peak Hour5: Site Entrance (Trucks) & Coleraine Drive Weekday PM Peak Hour
Canadian Tire Bolton Warehouse Synchro 7 - ReportBA Consulting Group Page 2
Lane Group EBT WBL WBR NBL NBT SBL SBTLane Group Flow (vph) 60 15 180 45 385 65 180v/c Ratio 0.28 0.10 0.54 0.06 0.17 0.11 0.08Control Delay 17.6 36.3 12.2 9.3 8.6 9.7 8.0Queue Delay 0.0 0.0 0.0 0.0 0.0 0.0 0.0Total Delay 17.6 36.3 12.2 9.3 8.6 9.7 8.0Queue Length 50th (m) 1.5 2.2 0.0 2.6 12.4 3.9 5.2Queue Length 95th (m) 11.4 7.1 15.8 8.3 23.5 11.3 11.5Internal Link Dist (m) 202.6 166.7 956.4Turn Bay Length (m) 80.0 80.0 80.0Base Capacity (vph) 469 145 333 749 2275 615 2263Starvation Cap Reductn 0 0 0 0 0 0 0Spillback Cap Reductn 0 0 0 0 0 0 0Storage Cap Reductn 0 0 0 0 0 0 0Reduced v/c Ratio 0.13 0.10 0.54 0.06 0.17 0.11 0.08
Intersection Summary

HCM Signalized Intersection Capacity Analysis Future Total - PM Site Peak Hour5: Site Entrance (Trucks) & Coleraine Drive Weekday PM Peak Hour
Canadian Tire Bolton Warehouse Synchro 7 - ReportBA Consulting Group Page 3
Movement EBL EBT EBR WBL WBT WBR NBL NBT NBR SBL SBT SBRLane ConfigurationsVolume (vph) 10 0 50 15 0 180 45 380 5 65 170 10Ideal Flow (vphpl) 1900 1900 1900 1900 1900 1900 1900 1900 1900 1900 1900 1900Lane Width 3.5 3.7 3.5 3.5 3.7 3.5 3.5 3.7 3.5 3.5 3.7 3.5Total Lost time (s) 6.0 6.0 6.0 6.0 6.0 6.0 6.0Lane Util. Factor 1.00 1.00 1.00 1.00 0.95 1.00 0.95Frt 0.89 1.00 0.85 1.00 1.00 1.00 0.99Flt Protected 0.99 0.95 1.00 0.95 1.00 0.95 1.00Satd. Flow (prot) 1691 1785 1597 1785 3643 1785 3620Flt Permitted 0.99 0.72 1.00 0.64 1.00 0.52 1.00Satd. Flow (perm) 1691 1349 1597 1199 3643 984 3620Peak-hour factor, PHF 1.00 1.00 1.00 1.00 1.00 1.00 1.00 1.00 1.00 1.00 1.00 1.00Adj. Flow (vph) 10 0 50 15 0 180 45 380 5 65 170 10RTOR Reduction (vph) 0 46 0 0 0 161 0 1 0 0 4 0Lane Group Flow (vph) 0 14 0 15 0 19 45 384 0 65 177 0Turn Type Perm custom custom Perm PermProtected Phases 4 2 6Permitted Phases 4 8 8 2 6Actuated Green, G (s) 7.3 9.7 9.7 55.0 55.0 55.0 55.0Effective Green, g (s) 7.3 9.7 9.7 55.0 55.0 55.0 55.0Actuated g/C Ratio 0.08 0.11 0.11 0.61 0.61 0.61 0.61Clearance Time (s) 6.0 6.0 6.0 6.0 6.0 6.0 6.0Vehicle Extension (s) 5.0 5.0 5.0 5.0 5.0 5.0 5.0Lane Grp Cap (vph) 137 145 172 733 2226 601 2212v/s Ratio Prot c0.11 0.05v/s Ratio Perm 0.01 0.01 c0.01 0.04 0.07v/c Ratio 0.10 0.10 0.11 0.06 0.17 0.11 0.08Uniform Delay, d1 38.3 36.2 36.3 7.1 7.6 7.3 7.2Progression Factor 1.00 1.00 1.00 1.00 1.00 1.00 1.00Incremental Delay, d2 0.7 0.7 0.6 0.2 0.2 0.4 0.1Delay (s) 39.0 36.9 36.9 7.2 7.8 7.7 7.2Level of Service D D D A A A AApproach Delay (s) 39.0 36.9 7.7 7.3Approach LOS D D A A
Intersection SummaryHCM Average Control Delay 15.8 HCM Level of Service BHCM Volume to Capacity ratio 0.16Actuated Cycle Length (s) 90.0 Sum of lost time (s) 18.0Intersection Capacity Utilization 46.0% ICU Level of Service AAnalysis Period (min) 15c Critical Lane Group

Timings Future Total - PM Site Peak Hour7: Healey Road & Coleraine Drive Weekday PM Peak Hour
Canadian Tire Bolton Warehouse Synchro 7 - ReportBA Consulting Group Page 4
Lane Group EBL EBT WBL WBT NBL NBT SBL SBTLane ConfigurationsVolume (vph) 25 95 65 300 60 325 65 220Turn Type Perm Perm Perm PermProtected Phases 8 4 6 2Permitted Phases 8 4 6 2Detector Phase 8 8 4 4 6 6 2 2Switch PhaseMinimum Initial (s) 8.0 8.0 8.0 8.0 12.0 12.0 12.0 12.0Minimum Split (s) 32.8 32.8 32.8 32.8 36.2 36.2 36.2 36.2Total Split (s) 33.0 33.0 33.0 33.0 37.0 37.0 37.0 37.0Total Split (%) 47.1% 47.1% 47.1% 47.1% 52.9% 52.9% 52.9% 52.9%Yellow Time (s) 4.0 4.0 4.0 4.0 4.6 4.6 4.6 4.6All-Red Time (s) 2.8 2.8 2.8 2.8 2.1 2.1 2.1 2.1Lost Time Adjust (s) 0.0 0.0 0.0 0.0 0.0 0.0 0.0 0.0Total Lost Time (s) 6.8 6.8 6.8 6.8 6.7 6.7 6.7 6.7Lead/LagLead-Lag Optimize?Recall Mode None None None None C-Max C-Max C-Max C-MaxAct Effct Green (s) 20.0 20.0 20.0 20.0 36.5 36.5 36.5 36.5Actuated g/C Ratio 0.29 0.29 0.29 0.29 0.52 0.52 0.52 0.52v/c Ratio 0.12 0.21 0.18 0.66 0.11 0.22 0.13 0.16Control Delay 17.6 15.5 18.1 26.4 11.1 8.9 11.4 7.5Queue Delay 0.0 0.0 0.0 0.0 0.0 0.0 0.0 0.0Total Delay 17.6 15.5 18.1 26.4 11.1 8.9 11.4 7.5LOS B B B C B A B AApproach Delay 15.9 25.1 9.2 8.2Approach LOS B C A A
Intersection SummaryCycle Length: 70Actuated Cycle Length: 70Offset: 37 (53%), Referenced to phase 2:SBTL and 6:NBTL, Start of GreenNatural Cycle: 70Control Type: Actuated-CoordinatedMaximum v/c Ratio: 0.66Intersection Signal Delay: 14.5 Intersection LOS: BIntersection Capacity Utilization 59.3% ICU Level of Service BAnalysis Period (min) 15
Splits and Phases: 7: Healey Road & Coleraine Drive

Queues Future Total - PM Site Peak Hour7: Healey Road & Coleraine Drive Weekday PM Peak Hour
Canadian Tire Bolton Warehouse Synchro 7 - ReportBA Consulting Group Page 5
Lane Group EBL EBT WBL WBT NBL NBT SBL SBTLane Group Flow (vph) 25 115 65 360 60 410 65 300v/c Ratio 0.12 0.21 0.18 0.66 0.11 0.22 0.13 0.16Control Delay 17.6 15.5 18.1 26.4 11.1 8.9 11.4 7.5Queue Delay 0.0 0.0 0.0 0.0 0.0 0.0 0.0 0.0Total Delay 17.6 15.5 18.1 26.4 11.1 8.9 11.4 7.5Queue Length 50th (m) 2.2 8.9 5.9 36.4 3.4 10.8 3.7 6.5Queue Length 95th (m) 6.2 16.6 12.0 51.9 10.2 21.2 11.1 14.4Internal Link Dist (m) 448.1 958.1 2899.4 862.3Turn Bay Length (m) 120.0 100.0 120.0 120.0Base Capacity (vph) 275 711 480 711 558 1874 501 1867Starvation Cap Reductn 0 0 0 0 0 0 0 0Spillback Cap Reductn 0 0 0 0 0 0 0 0Storage Cap Reductn 0 0 0 0 0 0 0 0Reduced v/c Ratio 0.09 0.16 0.14 0.51 0.11 0.22 0.13 0.16
Intersection Summary

HCM Signalized Intersection Capacity Analysis Future Total - PM Site Peak Hour7: Healey Road & Coleraine Drive Weekday PM Peak Hour
Canadian Tire Bolton Warehouse Synchro 7 - ReportBA Consulting Group Page 6
Movement EBL EBT EBR WBL WBT WBR NBL NBT NBR SBL SBT SBRLane ConfigurationsVolume (vph) 25 95 20 65 300 60 60 325 85 65 220 80Ideal Flow (vphpl) 1900 1900 1900 1900 1900 1900 1900 1900 1900 1900 1900 1900Lane Width 3.5 3.7 3.5 3.5 3.7 3.5 3.5 3.7 3.5 3.5 3.7 3.5Total Lost time (s) 6.8 6.8 6.8 6.8 6.7 6.7 6.7 6.7Lane Util. Factor 1.00 1.00 1.00 1.00 1.00 0.95 1.00 0.95Frt 1.00 0.97 1.00 0.97 1.00 0.97 1.00 0.96Flt Protected 0.95 1.00 0.95 1.00 0.95 1.00 0.95 1.00Satd. Flow (prot) 1785 1871 1785 1873 1785 3537 1785 3504Flt Permitted 0.39 1.00 0.68 1.00 0.57 1.00 0.51 1.00Satd. Flow (perm) 734 1871 1283 1873 1069 3537 961 3504Peak-hour factor, PHF 1.00 1.00 1.00 1.00 1.00 1.00 1.00 1.00 1.00 1.00 1.00 1.00Adj. Flow (vph) 25 95 20 65 300 60 60 325 85 65 220 80RTOR Reduction (vph) 0 12 0 0 11 0 0 28 0 0 38 0Lane Group Flow (vph) 25 103 0 65 349 0 60 382 0 65 262 0Turn Type Perm Perm Perm PermProtected Phases 8 4 6 2Permitted Phases 8 4 6 2Actuated Green, G (s) 20.0 20.0 20.0 20.0 36.5 36.5 36.5 36.5Effective Green, g (s) 20.0 20.0 20.0 20.0 36.5 36.5 36.5 36.5Actuated g/C Ratio 0.29 0.29 0.29 0.29 0.52 0.52 0.52 0.52Clearance Time (s) 6.8 6.8 6.8 6.8 6.7 6.7 6.7 6.7Vehicle Extension (s) 5.0 5.0 5.0 5.0 5.0 5.0 5.0 5.0Lane Grp Cap (vph) 210 535 367 535 557 1844 501 1827v/s Ratio Prot 0.05 c0.19 c0.11 0.07v/s Ratio Perm 0.03 0.05 0.06 0.07v/c Ratio 0.12 0.19 0.18 0.65 0.11 0.21 0.13 0.14Uniform Delay, d1 18.5 18.9 18.8 21.9 8.5 9.0 8.6 8.7Progression Factor 1.00 1.00 1.00 1.00 1.00 1.00 1.00 1.00Incremental Delay, d2 0.5 0.4 0.5 3.8 0.4 0.3 0.5 0.2Delay (s) 19.0 19.3 19.3 25.7 8.9 9.2 9.1 8.8Level of Service B B B C A A A AApproach Delay (s) 19.2 24.8 9.2 8.9Approach LOS B C A A
Intersection SummaryHCM Average Control Delay 14.8 HCM Level of Service BHCM Volume to Capacity ratio 0.36Actuated Cycle Length (s) 70.0 Sum of lost time (s) 13.5Intersection Capacity Utilization 59.3% ICU Level of Service BAnalysis Period (min) 15c Critical Lane Group
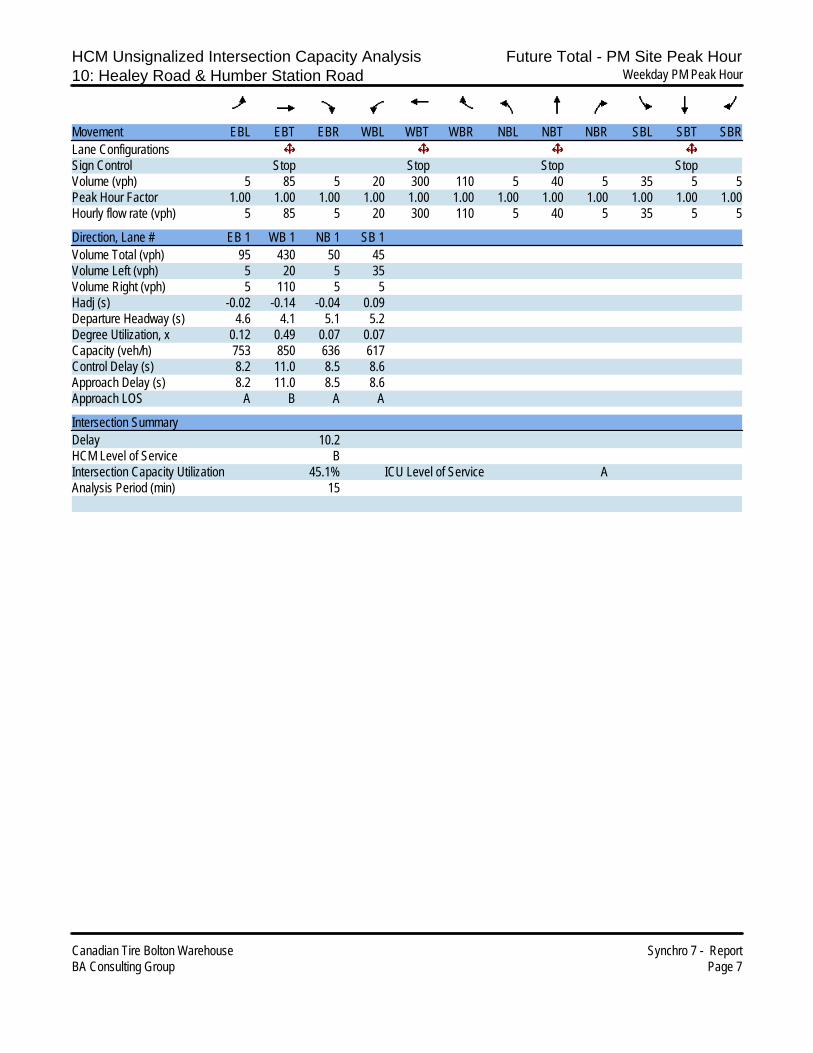
HCM Unsignalized Intersection Capacity Analysis Future Total - PM Site Peak Hour10: Healey Road & Humber Station Road Weekday PM Peak Hour
Canadian Tire Bolton Warehouse Synchro 7 - ReportBA Consulting Group Page 7
Movement EBL EBT EBR WBL WBT WBR NBL NBT NBR SBL SBT SBRLane ConfigurationsSign Control Stop Stop Stop StopVolume (vph) 5 85 5 20 300 110 5 40 5 35 5 5Peak Hour Factor 1.00 1.00 1.00 1.00 1.00 1.00 1.00 1.00 1.00 1.00 1.00 1.00Hourly flow rate (vph) 5 85 5 20 300 110 5 40 5 35 5 5
Direction, Lane # EB 1 WB 1 NB 1 SB 1Volume Total (vph) 95 430 50 45Volume Left (vph) 5 20 5 35Volume Right (vph) 5 110 5 5Hadj (s) -0.02 -0.14 -0.04 0.09Departure Headway (s) 4.6 4.1 5.1 5.2Degree Utilization, x 0.12 0.49 0.07 0.07Capacity (veh/h) 753 850 636 617Control Delay (s) 8.2 11.0 8.5 8.6Approach Delay (s) 8.2 11.0 8.5 8.6Approach LOS A B A A
Intersection SummaryDelay 10.2HCM Level of Service BIntersection Capacity Utilization 45.1% ICU Level of Service AAnalysis Period (min) 15

Timings Future Total - PM Site Peak Hour13: Healey Drive & Queen Street South Weekday PM Peak Hour
Canadian Tire Bolton Warehouse Synchro 7 - ReportBA Consulting Group Page 8
Lane Group EBL EBT EBR WBL WBR NBL NBT NBR SBL SBT SBRLane ConfigurationsVolume (vph) 350 25 210 10 30 150 1980 10 5 935 150Turn Type Prot Perm Perm Perm Perm Perm Perm PermProtected Phases 3 4 2 2Permitted Phases 4 4 4 2 2 2 2Detector Phase 3 4 4 4 4 2 2 2 2 2 2Switch PhaseMinimum Initial (s) 8.0 8.0 8.0 8.0 8.0 8.0 8.0 8.0 8.0 8.0 8.0Minimum Split (s) 13.0 36.6 36.6 36.6 36.6 34.1 34.1 34.1 34.1 34.1 34.1Total Split (s) 20.0 20.0 20.0 20.0 20.0 80.0 80.0 80.0 80.0 80.0 80.0Total Split (%) 16.7% 16.7% 16.7% 16.7% 16.7% 66.7% 66.7% 66.7% 66.7% 66.7% 66.7%Yellow Time (s) 3.0 4.0 4.0 4.0 4.0 4.0 4.0 4.0 4.0 4.0 4.0All-Red Time (s) 2.0 3.6 3.6 3.6 3.6 3.1 3.1 3.1 3.1 3.1 3.1Lost Time Adjust (s) 0.0 0.0 0.0 0.0 0.0 0.0 0.0 0.0 0.0 0.0 0.0Total Lost Time (s) 5.0 7.6 7.6 7.6 7.6 7.1 7.1 7.1 7.1 7.1 7.1Lead/Lag Lead Lag Lag Lag LagLead-Lag Optimize? Yes Yes Yes YesRecall Mode None None None None None C-Max C-Max C-Max C-Max C-Max C-MaxAct Effct Green (s) 15.0 9.7 9.7 9.7 9.7 75.6 75.6 75.6 75.6 75.6 75.6Actuated g/C Ratio 0.12 0.08 0.08 0.08 0.08 0.63 0.63 0.63 0.63 0.63 0.63v/c Ratio 0.81 0.16 0.65 0.09 0.21 0.47 0.86 0.01 0.08 0.41 0.14Control Delay 66.4 52.9 17.0 51.7 34.9 15.1 18.4 7.1 13.2 11.9 1.8Queue Delay 0.0 0.0 0.0 0.0 0.0 0.0 0.0 0.0 0.0 0.0 0.0Total Delay 66.4 52.9 17.0 51.7 34.9 15.1 18.4 7.1 13.2 11.9 1.8LOS E D B D C B B A B B AApproach Delay 48.1 18.2 10.5Approach LOS D B B
Intersection SummaryCycle Length: 120Actuated Cycle Length: 120Offset: 0 (0%), Referenced to phase 2:NBSB, Start of GreenNatural Cycle: 135Control Type: Actuated-CoordinatedMaximum v/c Ratio: 0.86Intersection Signal Delay: 20.7 Intersection LOS: CIntersection Capacity Utilization 96.2% ICU Level of Service FAnalysis Period (min) 15
Splits and Phases: 13: Healey Drive & Queen Street South

Queues Future Total - PM Site Peak Hour13: Healey Drive & Queen Street South Weekday PM Peak Hour
Canadian Tire Bolton Warehouse Synchro 7 - ReportBA Consulting Group Page 9
Lane Group EBL EBT EBR WBL WBR NBL NBT NBR SBL SBT SBRLane Group Flow (vph) 350 25 210 10 30 150 1980 10 5 935 150v/c Ratio 0.81 0.16 0.65 0.09 0.21 0.47 0.86 0.01 0.08 0.41 0.14Control Delay 66.4 52.9 17.0 51.7 34.9 15.1 18.4 7.1 13.2 11.9 1.8Queue Delay 0.0 0.0 0.0 0.0 0.0 0.0 0.0 0.0 0.0 0.0 0.0Total Delay 66.4 52.9 17.0 51.7 34.9 15.1 18.4 7.1 13.2 11.9 1.8Queue Length 50th (m) 38.6 5.2 0.0 2.1 3.1 12.2 93.8 0.5 0.4 48.4 0.0Queue Length 95th (m) #58.2 12.9 20.7 6.9 11.5 m20.5 229.4 m1.5 2.4 65.4 7.1Internal Link Dist (m) 125.7 2351.8 778.6Turn Bay Length (m) 80.0 80.0 60.0 8.0 80.0 75.0Base Capacity (vph) 433 199 353 144 178 316 2301 1007 63 2301 1062Starvation Cap Reductn 0 0 0 0 0 0 0 0 0 0 0Spillback Cap Reductn 0 0 0 0 0 0 0 0 0 0 0Storage Cap Reductn 0 0 0 0 0 0 0 0 0 0 0Reduced v/c Ratio 0.81 0.13 0.59 0.07 0.17 0.47 0.86 0.01 0.08 0.41 0.14
Intersection Summary# 95th percentile volume exceeds capacity, queue may be longer. Queue shown is maximum after two cycles.m Volume for 95th percentile queue is metered by upstream signal.

HCM Signalized Intersection Capacity Analysis Future Total - PM Site Peak Hour13: Healey Drive & Queen Street South Weekday PM Peak Hour
Canadian Tire Bolton Warehouse Synchro 7 - ReportBA Consulting Group Page 10
Movement EBL EBT EBR WBL WBT WBR NBL NBT NBR SBL SBT SBRLane ConfigurationsVolume (vph) 350 25 210 10 0 30 150 1980 10 5 935 150Ideal Flow (vphpl) 1900 1900 1900 1900 1900 1900 1900 1900 1900 1900 1900 1900Lane Width 3.5 3.7 3.5 3.5 3.7 3.5 3.5 3.7 3.5 3.5 3.7 3.5Total Lost time (s) 5.0 7.6 7.6 7.6 7.6 7.1 7.1 7.1 7.1 7.1 7.1Lane Util. Factor 0.97 1.00 1.00 1.00 1.00 1.00 0.95 1.00 1.00 0.95 1.00Frt 1.00 1.00 0.85 1.00 0.85 1.00 1.00 0.85 1.00 1.00 0.85Flt Protected 0.95 1.00 1.00 0.95 1.00 0.95 1.00 1.00 0.95 1.00 1.00Satd. Flow (prot) 3463 1921 1597 1785 1597 1785 3650 1597 1785 3650 1597Flt Permitted 0.95 1.00 1.00 0.74 1.00 0.27 1.00 1.00 0.05 1.00 1.00Satd. Flow (perm) 3463 1921 1597 1392 1597 501 3650 1597 99 3650 1597Peak-hour factor, PHF 1.00 1.00 1.00 1.00 1.00 1.00 1.00 1.00 1.00 1.00 1.00 1.00Adj. Flow (vph) 350 25 210 10 0 30 150 1980 10 5 935 150RTOR Reduction (vph) 0 0 193 0 0 14 0 0 1 0 0 56Lane Group Flow (vph) 350 25 17 10 0 16 150 1980 9 5 935 95Turn Type Prot Perm Perm Perm Perm Perm Perm PermProtected Phases 3 4 4 2 2Permitted Phases 4 4 4 2 2 2 2Actuated Green, G (s) 15.0 9.7 9.7 9.7 9.7 75.6 75.6 75.6 75.6 75.6 75.6Effective Green, g (s) 15.0 9.7 9.7 9.7 9.7 75.6 75.6 75.6 75.6 75.6 75.6Actuated g/C Ratio 0.12 0.08 0.08 0.08 0.08 0.63 0.63 0.63 0.63 0.63 0.63Clearance Time (s) 5.0 7.6 7.6 7.6 7.6 7.1 7.1 7.1 7.1 7.1 7.1Vehicle Extension (s) 5.0 5.0 5.0 5.0 5.0 5.0 5.0 5.0 5.0 5.0 5.0Lane Grp Cap (vph) 433 155 129 113 129 316 2300 1006 62 2300 1006v/s Ratio Prot c0.10 c0.01 c0.54 0.26v/s Ratio Perm 0.01 0.01 0.01 0.30 0.01 0.05 0.06v/c Ratio 0.81 0.16 0.13 0.09 0.13 0.47 0.86 0.01 0.08 0.41 0.09Uniform Delay, d1 51.1 51.4 51.2 51.1 51.2 11.7 17.9 8.3 8.7 11.0 8.7Progression Factor 1.00 1.00 1.00 1.00 1.00 0.77 0.75 0.89 1.00 1.00 1.00Incremental Delay, d2 12.0 1.0 1.0 0.7 0.9 4.7 4.3 0.0 2.5 0.5 0.2Delay (s) 63.1 52.4 52.2 51.8 52.1 13.8 17.7 7.3 11.2 11.6 8.9Level of Service E D D D D B B A B B AApproach Delay (s) 58.7 52.0 17.4 11.2Approach LOS E D B B
Intersection SummaryHCM Average Control Delay 22.3 HCM Level of Service CHCM Volume to Capacity ratio 0.79Actuated Cycle Length (s) 120.0 Sum of lost time (s) 19.7Intersection Capacity Utilization 96.2% ICU Level of Service FAnalysis Period (min) 15c Critical Lane Group

Timings Future Total - PM Site Peak Hour17: Mayfield Road & Queen Street South Weekday PM Peak Hour
Canadian Tire Bolton Warehouse Synchro 7 - ReportBA Consulting Group Page 11
Lane Group EBL EBT EBR WBL WBT NBL NBT NBR SBL SBT SBRLane ConfigurationsVolume (vph) 255 275 110 160 175 170 1165 520 20 1015 220Turn Type Prot Perm Prot Perm Perm Perm PermProtected Phases 7 4 3 8 2 6Permitted Phases 4 2 2 6 6Detector Phase 7 4 4 3 8 2 2 2 6 6 6Switch PhaseMinimum Initial (s) 8.0 12.0 12.0 8.0 12.0 12.0 12.0 12.0 12.0 12.0 12.0Minimum Split (s) 13.0 26.6 26.6 13.0 26.6 26.6 26.6 26.6 26.6 26.6 26.6Total Split (s) 16.0 30.0 30.0 13.0 27.0 77.0 77.0 77.0 77.0 77.0 77.0Total Split (%) 13.3% 25.0% 25.0% 10.8% 22.5% 64.2% 64.2% 64.2% 64.2% 64.2% 64.2%Yellow Time (s) 3.0 4.6 4.6 3.0 4.6 4.6 4.6 4.6 4.6 4.6 4.6All-Red Time (s) 2.0 2.0 2.0 2.0 2.0 2.0 2.0 2.0 2.0 2.0 2.0Lost Time Adjust (s) 0.0 0.0 0.0 0.0 0.0 0.0 0.0 0.0 0.0 0.0 0.0Total Lost Time (s) 5.0 6.6 6.6 5.0 6.6 6.6 6.6 6.6 6.6 6.6 6.6Lead/Lag Lead Lag Lag Lead LagLead-Lag Optimize? Yes Yes Yes Yes YesRecall Mode None None None None None C-Max C-Max C-Max C-Max C-Max C-MaxAct Effct Green (s) 11.0 21.8 21.8 8.0 18.8 72.0 72.0 72.0 72.0 72.0 72.0Actuated g/C Ratio 0.09 0.18 0.18 0.07 0.16 0.60 0.60 0.60 0.60 0.60 0.60v/c Ratio 0.80 0.79 0.29 0.69 0.33 0.61 0.53 0.46 0.10 0.32 0.21Control Delay 73.0 63.5 11.0 70.9 44.8 27.3 15.5 3.8 9.2 8.9 0.8Queue Delay 0.0 0.0 0.0 0.0 0.0 0.0 0.0 0.0 0.0 0.0 0.0Total Delay 73.0 63.5 11.0 70.9 44.8 27.3 15.5 3.8 9.2 8.9 0.8LOS E E B E D C B A A A AApproach Delay 58.2 56.8 13.3 7.5Approach LOS E E B A
Intersection SummaryCycle Length: 120Actuated Cycle Length: 120Offset: 0 (0%), Referenced to phase 2:NBTL and 6:SBTL, Start of GreenNatural Cycle: 90Control Type: Actuated-CoordinatedMaximum v/c Ratio: 0.80Intersection Signal Delay: 22.2 Intersection LOS: CIntersection Capacity Utilization 84.0% ICU Level of Service EAnalysis Period (min) 15
Splits and Phases: 17: Mayfield Road & Queen Street South

Queues Future Total - PM Site Peak Hour17: Mayfield Road & Queen Street South Weekday PM Peak Hour
Canadian Tire Bolton Warehouse Synchro 7 - ReportBA Consulting Group Page 12
Lane Group EBL EBT EBR WBL WBT NBL NBT NBR SBL SBT SBRLane Group Flow (vph) 255 275 110 160 190 170 1165 520 20 1015 220v/c Ratio 0.80 0.79 0.29 0.69 0.33 0.61 0.53 0.46 0.10 0.32 0.21Control Delay 73.0 63.5 11.0 70.9 44.8 27.3 15.5 3.8 9.2 8.9 0.8Queue Delay 0.0 0.0 0.0 0.0 0.0 0.0 0.0 0.0 0.0 0.0 0.0Total Delay 73.0 63.5 11.0 70.9 44.8 27.3 15.5 3.8 9.2 8.9 0.8Queue Length 50th (m) 28.4 56.5 1.1 17.8 18.5 22.7 76.3 8.0 1.2 22.6 0.0Queue Length 95th (m) #46.5 #87.9 14.8 #30.6 28.7 49.1 92.8 23.4 m2.6 23.9 3.2Internal Link Dist (m) 89.2 599.8 1481.1 2351.8Turn Bay Length (m) 85.0 85.0 300.0 60.0 175.0 40.0 120.0Base Capacity (vph) 317 375 395 231 618 280 2191 1131 206 3149 1047Starvation Cap Reductn 0 0 0 0 0 0 0 0 0 0 0Spillback Cap Reductn 0 0 0 0 0 0 0 0 0 0 0Storage Cap Reductn 0 0 0 0 0 0 0 0 0 0 0Reduced v/c Ratio 0.80 0.73 0.28 0.69 0.31 0.61 0.53 0.46 0.10 0.32 0.21
Intersection Summary# 95th percentile volume exceeds capacity, queue may be longer. Queue shown is maximum after two cycles.m Volume for 95th percentile queue is metered by upstream signal.
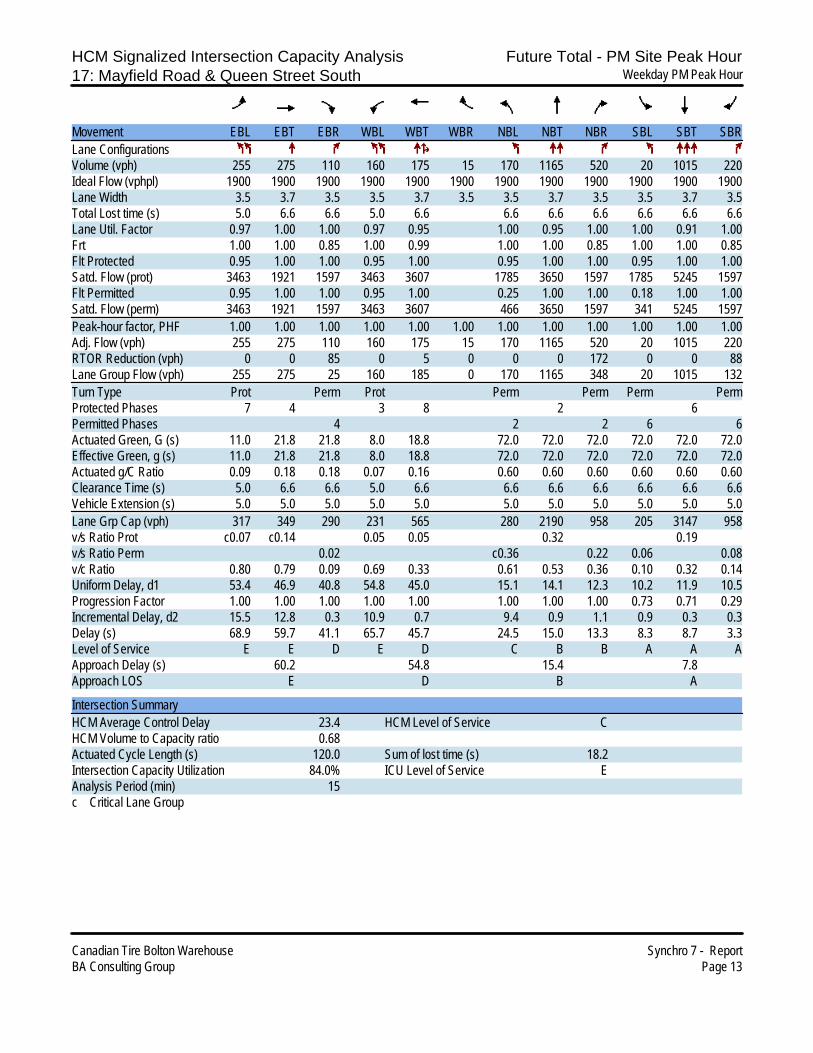
HCM Signalized Intersection Capacity Analysis Future Total - PM Site Peak Hour17: Mayfield Road & Queen Street South Weekday PM Peak Hour
Canadian Tire Bolton Warehouse Synchro 7 - ReportBA Consulting Group Page 13
Movement EBL EBT EBR WBL WBT WBR NBL NBT NBR SBL SBT SBRLane ConfigurationsVolume (vph) 255 275 110 160 175 15 170 1165 520 20 1015 220Ideal Flow (vphpl) 1900 1900 1900 1900 1900 1900 1900 1900 1900 1900 1900 1900Lane Width 3.5 3.7 3.5 3.5 3.7 3.5 3.5 3.7 3.5 3.5 3.7 3.5Total Lost time (s) 5.0 6.6 6.6 5.0 6.6 6.6 6.6 6.6 6.6 6.6 6.6Lane Util. Factor 0.97 1.00 1.00 0.97 0.95 1.00 0.95 1.00 1.00 0.91 1.00Frt 1.00 1.00 0.85 1.00 0.99 1.00 1.00 0.85 1.00 1.00 0.85Flt Protected 0.95 1.00 1.00 0.95 1.00 0.95 1.00 1.00 0.95 1.00 1.00Satd. Flow (prot) 3463 1921 1597 3463 3607 1785 3650 1597 1785 5245 1597Flt Permitted 0.95 1.00 1.00 0.95 1.00 0.25 1.00 1.00 0.18 1.00 1.00Satd. Flow (perm) 3463 1921 1597 3463 3607 466 3650 1597 341 5245 1597Peak-hour factor, PHF 1.00 1.00 1.00 1.00 1.00 1.00 1.00 1.00 1.00 1.00 1.00 1.00Adj. Flow (vph) 255 275 110 160 175 15 170 1165 520 20 1015 220RTOR Reduction (vph) 0 0 85 0 5 0 0 0 172 0 0 88Lane Group Flow (vph) 255 275 25 160 185 0 170 1165 348 20 1015 132Turn Type Prot Perm Prot Perm Perm Perm PermProtected Phases 7 4 3 8 2 6Permitted Phases 4 2 2 6 6Actuated Green, G (s) 11.0 21.8 21.8 8.0 18.8 72.0 72.0 72.0 72.0 72.0 72.0Effective Green, g (s) 11.0 21.8 21.8 8.0 18.8 72.0 72.0 72.0 72.0 72.0 72.0Actuated g/C Ratio 0.09 0.18 0.18 0.07 0.16 0.60 0.60 0.60 0.60 0.60 0.60Clearance Time (s) 5.0 6.6 6.6 5.0 6.6 6.6 6.6 6.6 6.6 6.6 6.6Vehicle Extension (s) 5.0 5.0 5.0 5.0 5.0 5.0 5.0 5.0 5.0 5.0 5.0Lane Grp Cap (vph) 317 349 290 231 565 280 2190 958 205 3147 958v/s Ratio Prot c0.07 c0.14 0.05 0.05 0.32 0.19v/s Ratio Perm 0.02 c0.36 0.22 0.06 0.08v/c Ratio 0.80 0.79 0.09 0.69 0.33 0.61 0.53 0.36 0.10 0.32 0.14Uniform Delay, d1 53.4 46.9 40.8 54.8 45.0 15.1 14.1 12.3 10.2 11.9 10.5Progression Factor 1.00 1.00 1.00 1.00 1.00 1.00 1.00 1.00 0.73 0.71 0.29Incremental Delay, d2 15.5 12.8 0.3 10.9 0.7 9.4 0.9 1.1 0.9 0.3 0.3Delay (s) 68.9 59.7 41.1 65.7 45.7 24.5 15.0 13.3 8.3 8.7 3.3Level of Service E E D E D C B B A A AApproach Delay (s) 60.2 54.8 15.4 7.8Approach LOS E D B A
Intersection SummaryHCM Average Control Delay 23.4 HCM Level of Service CHCM Volume to Capacity ratio 0.68Actuated Cycle Length (s) 120.0 Sum of lost time (s) 18.2Intersection Capacity Utilization 84.0% ICU Level of Service EAnalysis Period (min) 15c Critical Lane Group

Timings Future Total - PM Site Peak Hour18: Mayfield Road & Coleraine Drive Weekday PM Peak Hour
Canadian Tire Bolton Warehouse Synchro 7 - ReportBA Consulting Group Page 14
Lane Group EBL EBT WBL WBT NBL NBT SBL SBTLane ConfigurationsVolume (vph) 215 530 10 520 85 220 65 125Turn Type pm+pt Perm Perm PermProtected Phases 5 2 6 8 4Permitted Phases 2 6 8 4Detector Phase 5 2 6 6 8 8 4 4Switch PhaseMinimum Initial (s) 5.0 12.0 12.0 12.0 12.0 12.0 12.0 12.0Minimum Split (s) 8.0 33.0 33.0 33.0 33.0 33.0 33.0 33.0Total Split (s) 15.0 72.0 57.0 57.0 42.0 42.0 42.0 42.0Total Split (%) 13.2% 63.2% 50.0% 50.0% 36.8% 36.8% 36.8% 36.8%Yellow Time (s) 3.0 4.6 4.6 4.6 4.2 4.2 4.2 4.2All-Red Time (s) 0.0 2.4 2.4 2.4 2.8 2.8 2.8 2.8Lost Time Adjust (s) 0.0 0.0 0.0 0.0 0.0 0.0 0.0 0.0Total Lost Time (s) 3.0 7.0 7.0 7.0 7.0 7.0 7.0 7.0Lead/Lag Lead Lag LagLead-Lag Optimize?Recall Mode None C-Max C-Max C-Max Max Max Max MaxAct Effct Green (s) 69.0 65.0 50.3 50.3 35.0 35.0 35.0 35.0Actuated g/C Ratio 0.61 0.57 0.44 0.44 0.31 0.31 0.31 0.31v/c Ratio 0.41 0.27 0.03 0.36 0.30 0.21 0.19 0.32Control Delay 12.6 12.7 18.6 21.5 34.0 29.1 30.9 10.6Queue Delay 0.0 0.0 0.0 0.0 0.0 0.0 0.0 0.0Total Delay 12.6 12.7 18.6 21.5 34.0 29.1 30.9 10.6LOS B B B C C C C BApproach Delay 12.6 21.5 30.4 13.5Approach LOS B C C B
Intersection SummaryCycle Length: 114Actuated Cycle Length: 114Offset: 20 (18%), Referenced to phase 2:EBTL and 6:WBTL, Start of GreenNatural Cycle: 75Control Type: Actuated-CoordinatedMaximum v/c Ratio: 0.41Intersection Signal Delay: 17.9 Intersection LOS: BIntersection Capacity Utilization 70.8% ICU Level of Service CAnalysis Period (min) 15
Splits and Phases: 18: Mayfield Road & Coleraine Drive
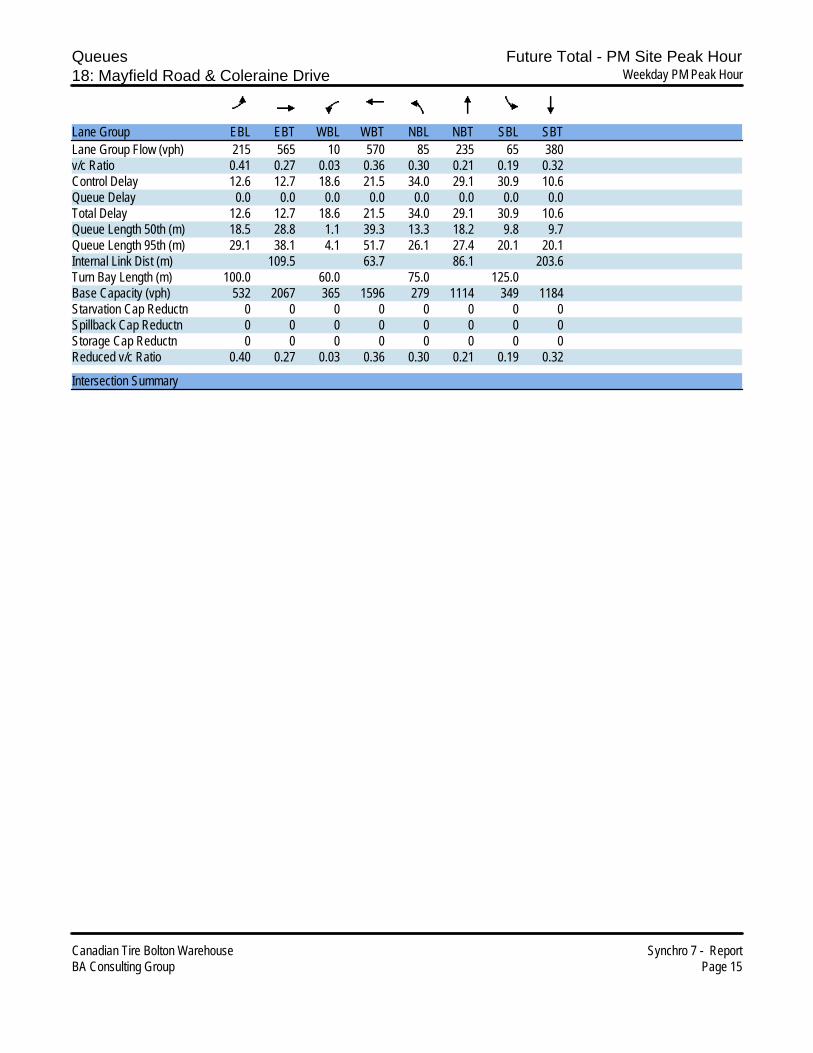
Queues Future Total - PM Site Peak Hour18: Mayfield Road & Coleraine Drive Weekday PM Peak Hour
Canadian Tire Bolton Warehouse Synchro 7 - ReportBA Consulting Group Page 15
Lane Group EBL EBT WBL WBT NBL NBT SBL SBTLane Group Flow (vph) 215 565 10 570 85 235 65 380v/c Ratio 0.41 0.27 0.03 0.36 0.30 0.21 0.19 0.32Control Delay 12.6 12.7 18.6 21.5 34.0 29.1 30.9 10.6Queue Delay 0.0 0.0 0.0 0.0 0.0 0.0 0.0 0.0Total Delay 12.6 12.7 18.6 21.5 34.0 29.1 30.9 10.6Queue Length 50th (m) 18.5 28.8 1.1 39.3 13.3 18.2 9.8 9.7Queue Length 95th (m) 29.1 38.1 4.1 51.7 26.1 27.4 20.1 20.1Internal Link Dist (m) 109.5 63.7 86.1 203.6Turn Bay Length (m) 100.0 60.0 75.0 125.0Base Capacity (vph) 532 2067 365 1596 279 1114 349 1184Starvation Cap Reductn 0 0 0 0 0 0 0 0Spillback Cap Reductn 0 0 0 0 0 0 0 0Storage Cap Reductn 0 0 0 0 0 0 0 0Reduced v/c Ratio 0.40 0.27 0.03 0.36 0.30 0.21 0.19 0.32
Intersection Summary

HCM Signalized Intersection Capacity Analysis Future Total - PM Site Peak Hour18: Mayfield Road & Coleraine Drive Weekday PM Peak Hour
Canadian Tire Bolton Warehouse Synchro 7 - ReportBA Consulting Group Page 16
Movement EBL EBT EBR WBL WBT WBR NBL NBT NBR SBL SBT SBRLane ConfigurationsVolume (vph) 215 530 35 10 520 50 85 220 15 65 125 255Ideal Flow (vphpl) 1900 1900 1900 1900 1900 1900 1900 1900 1900 1900 1900 1900Lane Width 3.5 3.7 3.5 3.5 3.7 3.5 3.5 3.7 3.5 3.5 3.7 3.5Total Lost time (s) 3.0 7.0 7.0 7.0 7.0 7.0 7.0 7.0Lane Util. Factor 1.00 0.95 1.00 0.95 1.00 0.95 1.00 0.95Frt 1.00 0.99 1.00 0.99 1.00 0.99 1.00 0.90Flt Protected 0.95 1.00 0.95 1.00 0.95 1.00 0.95 1.00Satd. Flow (prot) 1785 3616 1785 3602 1785 3615 1785 3283Flt Permitted 0.37 1.00 0.44 1.00 0.48 1.00 0.61 1.00Satd. Flow (perm) 688 3616 827 3602 908 3615 1138 3283Peak-hour factor, PHF 1.00 1.00 1.00 1.00 1.00 1.00 1.00 1.00 1.00 1.00 1.00 1.00Adj. Flow (vph) 215 530 35 10 520 50 85 220 15 65 125 255RTOR Reduction (vph) 0 4 0 0 6 0 0 4 0 0 177 0Lane Group Flow (vph) 215 561 0 10 564 0 85 231 0 65 203 0Turn Type pm+pt Perm Perm PermProtected Phases 5 2 6 8 4Permitted Phases 2 6 8 4Actuated Green, G (s) 65.0 65.0 50.3 50.3 35.0 35.0 35.0 35.0Effective Green, g (s) 65.0 65.0 50.3 50.3 35.0 35.0 35.0 35.0Actuated g/C Ratio 0.57 0.57 0.44 0.44 0.31 0.31 0.31 0.31Clearance Time (s) 3.0 7.0 7.0 7.0 7.0 7.0 7.0 7.0Vehicle Extension (s) 5.0 5.0 5.0 5.0 5.0 5.0 5.0 5.0Lane Grp Cap (vph) 505 2062 365 1589 279 1110 349 1008v/s Ratio Prot c0.04 0.16 0.16 0.06 0.06v/s Ratio Perm c0.20 0.01 c0.09 0.06v/c Ratio 0.43 0.27 0.03 0.35 0.30 0.21 0.19 0.20Uniform Delay, d1 12.4 12.5 18.0 21.1 30.2 29.2 29.0 29.2Progression Factor 1.00 1.00 1.00 1.00 1.00 1.00 1.00 1.00Incremental Delay, d2 1.2 0.3 0.1 0.6 2.8 0.4 1.2 0.5Delay (s) 13.6 12.8 18.2 21.7 33.0 29.7 30.2 29.6Level of Service B B B C C C C CApproach Delay (s) 13.0 21.7 30.6 29.7Approach LOS B C C C
Intersection SummaryHCM Average Control Delay 21.5 HCM Level of Service CHCM Volume to Capacity ratio 0.37Actuated Cycle Length (s) 114.0 Sum of lost time (s) 10.0Intersection Capacity Utilization 70.8% ICU Level of Service CAnalysis Period (min) 15c Critical Lane Group
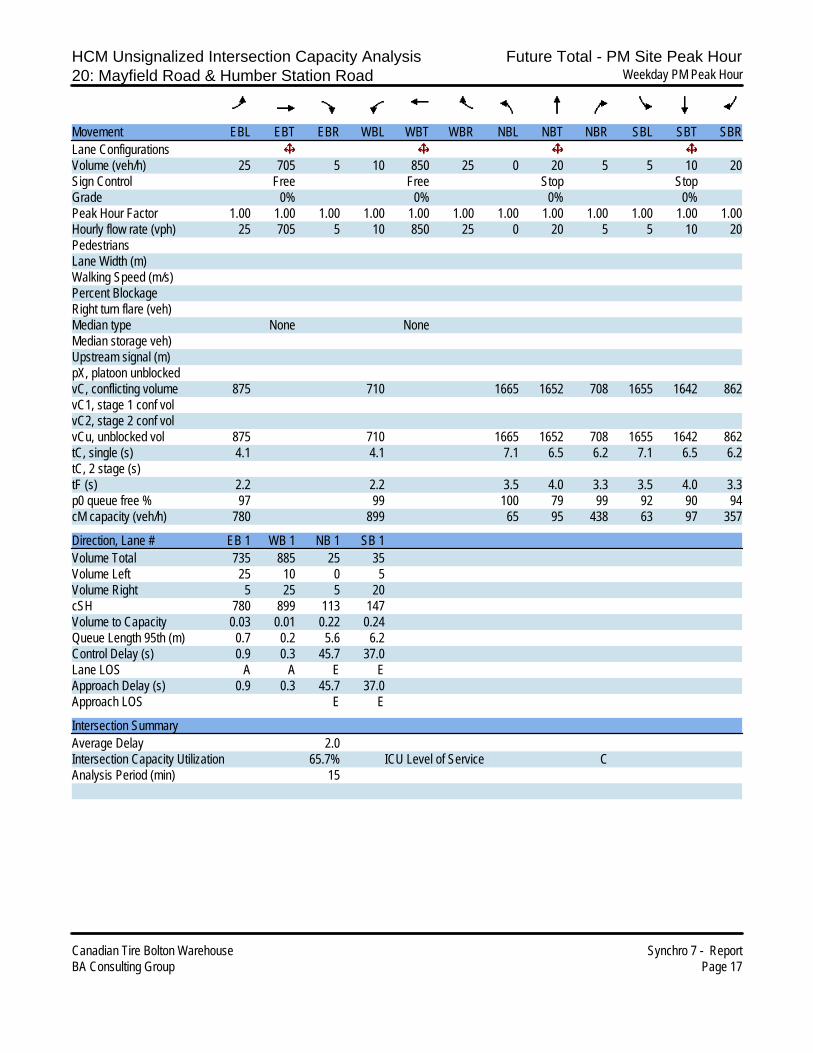
HCM Unsignalized Intersection Capacity Analysis Future Total - PM Site Peak Hour20: Mayfield Road & Humber Station Road Weekday PM Peak Hour
Canadian Tire Bolton Warehouse Synchro 7 - ReportBA Consulting Group Page 17
Movement EBL EBT EBR WBL WBT WBR NBL NBT NBR SBL SBT SBRLane ConfigurationsVolume (veh/h) 25 705 5 10 850 25 0 20 5 5 10 20Sign Control Free Free Stop StopGrade 0% 0% 0% 0%Peak Hour Factor 1.00 1.00 1.00 1.00 1.00 1.00 1.00 1.00 1.00 1.00 1.00 1.00Hourly flow rate (vph) 25 705 5 10 850 25 0 20 5 5 10 20PedestriansLane Width (m)Walking Speed (m/s)Percent BlockageRight turn flare (veh)Median type None NoneMedian storage veh)Upstream signal (m)pX, platoon unblockedvC, conflicting volume 875 710 1665 1652 708 1655 1642 862vC1, stage 1 conf volvC2, stage 2 conf volvCu, unblocked vol 875 710 1665 1652 708 1655 1642 862tC, single (s) 4.1 4.1 7.1 6.5 6.2 7.1 6.5 6.2tC, 2 stage (s)tF (s) 2.2 2.2 3.5 4.0 3.3 3.5 4.0 3.3p0 queue free % 97 99 100 79 99 92 90 94cM capacity (veh/h) 780 899 65 95 438 63 97 357
Direction, Lane # EB 1 WB 1 NB 1 SB 1Volume Total 735 885 25 35Volume Left 25 10 0 5Volume Right 5 25 5 20cSH 780 899 113 147Volume to Capacity 0.03 0.01 0.22 0.24Queue Length 95th (m) 0.7 0.2 5.6 6.2Control Delay (s) 0.9 0.3 45.7 37.0Lane LOS A A E EApproach Delay (s) 0.9 0.3 45.7 37.0Approach LOS E E
Intersection SummaryAverage Delay 2.0Intersection Capacity Utilization 65.7% ICU Level of Service CAnalysis Period (min) 15

HCM Unsignalized Intersection Capacity Analysis Future Total - PM Site Peak Hour26: Transportation Parking & Coleraine Drive Weekday PM Peak Hour
Canadian Tire Bolton Warehouse Synchro 7 - ReportBA Consulting Group Page 18
Movement EBL EBR NBL NBT SBT SBRLane ConfigurationsVolume (veh/h) 0 105 15 355 240 5Sign Control Yield Free FreeGrade 0% 0% 0%Peak Hour Factor 1.00 1.00 1.00 1.00 1.00 1.00Hourly flow rate (vph) 0 105 15 355 240 5PedestriansLane Width (m)Walking Speed (m/s)Percent BlockageRight turn flare (veh)Median type None NoneMedian storage veh)Upstream signal (m) 191pX, platoon unblockedvC, conflicting volume 450 122 245vC1, stage 1 conf volvC2, stage 2 conf volvCu, unblocked vol 450 122 245tC, single (s) 6.8 6.9 4.1tC, 2 stage (s)tF (s) 3.5 3.3 2.2p0 queue free % 100 88 99cM capacity (veh/h) 537 912 1333
Direction, Lane # EB 1 NB 1 NB 2 NB 3 SB 1 SB 2Volume Total 105 15 178 178 160 85Volume Left 0 15 0 0 0 0Volume Right 105 0 0 0 0 5cSH 912 1333 1700 1700 1700 1700Volume to Capacity 0.12 0.01 0.10 0.10 0.09 0.05Queue Length 95th (m) 2.7 0.2 0.0 0.0 0.0 0.0Control Delay (s) 9.5 7.7 0.0 0.0 0.0 0.0Lane LOS A AApproach Delay (s) 9.5 0.3 0.0Approach LOS A
Intersection SummaryAverage Delay 1.5Intersection Capacity Utilization 20.0% ICU Level of Service AAnalysis Period (min) 15

Timings Future Total - PM Site Peak Hour28: Harvest Moon Drive & Coleraine Drive Weekday PM Peak Hour
Canadian Tire Bolton Warehouse Synchro 7 - ReportBA Consulting Group Page 19
Lane Group EBT EBR WBL WBT WBR NBL NBT NBR SBL SBTLane ConfigurationsVolume (vph) 40 160 15 55 250 410 220 105 255 150Turn Type Perm Perm Perm Perm Perm PermProtected Phases 4 8 2 6Permitted Phases 4 8 8 2 2 6Detector Phase 4 4 8 8 8 2 2 2 6 6Switch PhaseMinimum Initial (s) 8.0 8.0 8.0 8.0 8.0 12.0 12.0 12.0 12.0 12.0Minimum Split (s) 30.0 30.0 30.0 30.0 30.0 22.0 22.0 22.0 22.0 22.0Total Split (s) 30.0 30.0 30.0 30.0 30.0 35.0 35.0 35.0 35.0 35.0Total Split (%) 31.6% 31.6% 31.6% 31.6% 31.6% 36.8% 36.8% 36.8% 36.8% 36.8%Yellow Time (s) 4.0 4.0 4.0 4.0 4.0 4.0 4.0 4.0 4.0 4.0All-Red Time (s) 2.0 2.0 2.0 2.0 2.0 2.0 2.0 2.0 2.0 2.0Lost Time Adjust (s) 0.0 0.0 0.0 0.0 0.0 0.0 0.0 0.0 0.0 0.0Total Lost Time (s) 6.0 6.0 6.0 6.0 6.0 6.0 6.0 6.0 6.0 6.0Lead/Lag Lead Lead Lag Lag LagLead-Lag Optimize? Yes Yes Yes Yes YesRecall Mode None None None None None C-Max C-Max C-Max C-Max C-MaxAct Effct Green (s) 10.0 10.0 11.1 11.1 11.1 55.9 55.9 55.9 55.9 55.9Actuated g/C Ratio 0.11 0.11 0.12 0.12 0.12 0.59 0.59 0.59 0.59 0.59v/c Ratio 0.20 0.51 0.08 0.27 0.61 0.56 0.10 0.11 0.38 0.07Control Delay 40.2 12.6 36.5 40.1 11.8 17.4 9.7 2.8 13.7 9.7Queue Delay 0.0 0.0 0.0 0.0 0.0 0.0 0.0 0.0 0.0 0.0Total Delay 40.2 12.6 36.5 40.1 11.8 17.4 9.7 2.8 13.7 9.7LOS D B D D B B A A B AApproach Delay 18.2 17.9 13.0 12.2Approach LOS B B B B
Intersection SummaryCycle Length: 95Actuated Cycle Length: 95Offset: 0 (0%), Referenced to phase 2:NBTL and 6:SBTL, Start of GreenNatural Cycle: 95Control Type: Actuated-CoordinatedMaximum v/c Ratio: 0.61Intersection Signal Delay: 14.4 Intersection LOS: BIntersection Capacity Utilization 55.7% ICU Level of Service BAnalysis Period (min) 15
Splits and Phases: 28: Harvest Moon Drive & Coleraine Drive
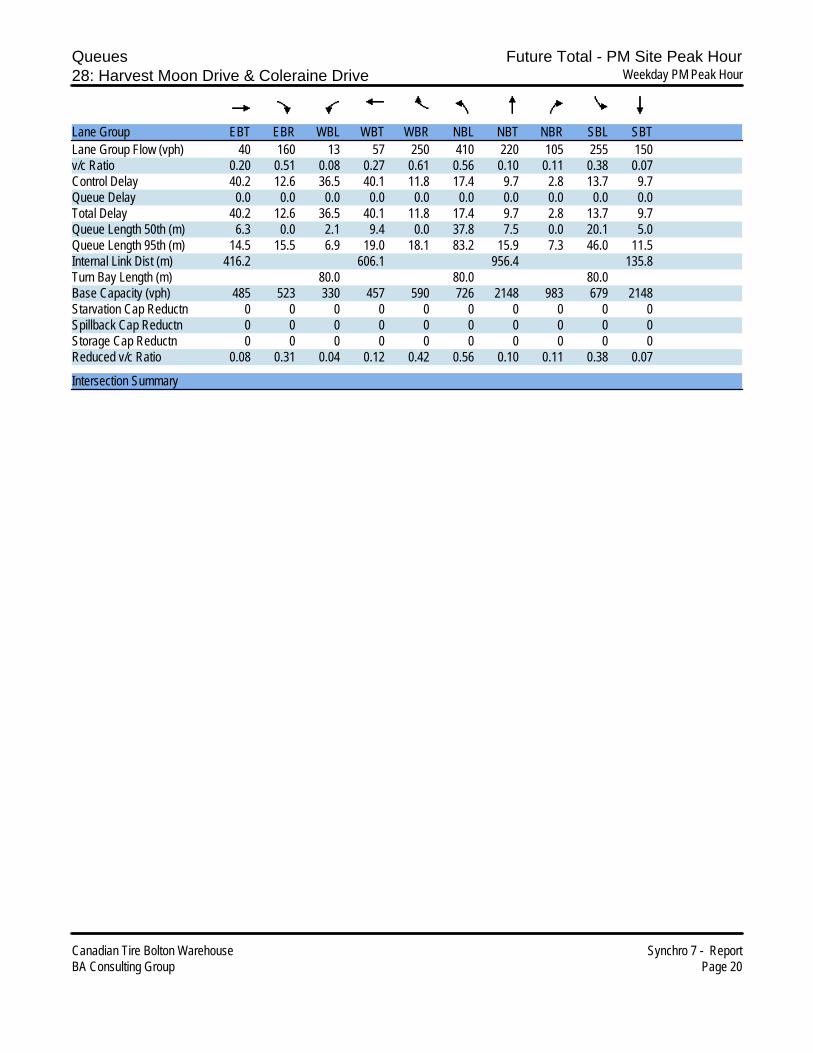
Queues Future Total - PM Site Peak Hour28: Harvest Moon Drive & Coleraine Drive Weekday PM Peak Hour
Canadian Tire Bolton Warehouse Synchro 7 - ReportBA Consulting Group Page 20
Lane Group EBT EBR WBL WBT WBR NBL NBT NBR SBL SBTLane Group Flow (vph) 40 160 13 57 250 410 220 105 255 150v/c Ratio 0.20 0.51 0.08 0.27 0.61 0.56 0.10 0.11 0.38 0.07Control Delay 40.2 12.6 36.5 40.1 11.8 17.4 9.7 2.8 13.7 9.7Queue Delay 0.0 0.0 0.0 0.0 0.0 0.0 0.0 0.0 0.0 0.0Total Delay 40.2 12.6 36.5 40.1 11.8 17.4 9.7 2.8 13.7 9.7Queue Length 50th (m) 6.3 0.0 2.1 9.4 0.0 37.8 7.5 0.0 20.1 5.0Queue Length 95th (m) 14.5 15.5 6.9 19.0 18.1 83.2 15.9 7.3 46.0 11.5Internal Link Dist (m) 416.2 606.1 956.4 135.8Turn Bay Length (m) 80.0 80.0 80.0Base Capacity (vph) 485 523 330 457 590 726 2148 983 679 2148Starvation Cap Reductn 0 0 0 0 0 0 0 0 0 0Spillback Cap Reductn 0 0 0 0 0 0 0 0 0 0Storage Cap Reductn 0 0 0 0 0 0 0 0 0 0Reduced v/c Ratio 0.08 0.31 0.04 0.12 0.42 0.56 0.10 0.11 0.38 0.07
Intersection Summary

HCM Signalized Intersection Capacity Analysis Future Total - PM Site Peak Hour28: Harvest Moon Drive & Coleraine Drive Weekday PM Peak Hour
Canadian Tire Bolton Warehouse Synchro 7 - ReportBA Consulting Group Page 21
Movement EBL EBT EBR WBL WBT WBR NBL NBT NBR SBL SBT SBRLane ConfigurationsVolume (vph) 0 40 160 15 55 250 410 220 105 255 150 0Ideal Flow (vphpl) 1900 1900 1900 1900 1900 1900 1900 1900 1900 1900 1900 1900Lane Width 3.5 3.7 3.5 3.5 3.7 3.5 3.5 3.7 3.5 3.5 3.7 3.5Total Lost time (s) 6.0 6.0 6.0 6.0 6.0 6.0 6.0 6.0 6.0 6.0Lane Util. Factor 1.00 1.00 0.95 0.95 1.00 1.00 0.95 1.00 1.00 0.95Frt 1.00 0.85 1.00 1.00 0.85 1.00 1.00 0.85 1.00 1.00Flt Protected 1.00 1.00 0.95 1.00 1.00 0.95 1.00 1.00 0.95 1.00Satd. Flow (prot) 1921 1597 1696 1822 1597 1785 3650 1597 1785 3650Flt Permitted 1.00 1.00 0.73 0.99 1.00 0.66 1.00 1.00 0.61 1.00Satd. Flow (perm) 1921 1597 1305 1807 1597 1234 3650 1597 1154 3650Peak-hour factor, PHF 1.00 1.00 1.00 1.00 1.00 1.00 1.00 1.00 1.00 1.00 1.00 1.00Adj. Flow (vph) 0 40 160 15 55 250 410 220 105 255 150 0RTOR Reduction (vph) 0 0 143 0 0 221 0 0 43 0 0 0Lane Group Flow (vph) 0 40 17 13 57 29 410 220 62 255 150 0Turn Type Perm Perm Perm Perm Perm Perm PermProtected Phases 4 8 2 6Permitted Phases 4 4 8 8 2 2 6Actuated Green, G (s) 10.0 10.0 11.1 11.1 11.1 55.9 55.9 55.9 55.9 55.9Effective Green, g (s) 10.0 10.0 11.1 11.1 11.1 55.9 55.9 55.9 55.9 55.9Actuated g/C Ratio 0.11 0.11 0.12 0.12 0.12 0.59 0.59 0.59 0.59 0.59Clearance Time (s) 6.0 6.0 6.0 6.0 6.0 6.0 6.0 6.0 6.0 6.0Vehicle Extension (s) 5.0 5.0 5.0 5.0 5.0 5.0 5.0 5.0 5.0 5.0Lane Grp Cap (vph) 202 168 152 211 187 726 2148 940 679 2148v/s Ratio Prot c0.02 0.06 0.04v/s Ratio Perm 0.01 0.01 c0.03 0.02 c0.33 0.04 0.22v/c Ratio 0.20 0.10 0.09 0.27 0.16 0.56 0.10 0.07 0.38 0.07Uniform Delay, d1 38.8 38.4 37.4 38.3 37.7 12.1 8.6 8.4 10.3 8.4Progression Factor 1.00 1.00 1.00 1.00 1.00 1.00 1.00 1.00 1.00 1.00Incremental Delay, d2 1.0 0.5 0.5 1.4 0.8 3.2 0.1 0.1 1.6 0.1Delay (s) 39.8 39.0 37.9 39.7 38.6 15.2 8.7 8.5 11.9 8.5Level of Service D D D D D B A A B AApproach Delay (s) 39.2 38.7 12.3 10.6Approach LOS D D B B
Intersection SummaryHCM Average Control Delay 20.2 HCM Level of Service CHCM Volume to Capacity ratio 0.47Actuated Cycle Length (s) 95.0 Sum of lost time (s) 18.0Intersection Capacity Utilization 55.7% ICU Level of Service BAnalysis Period (min) 15c Critical Lane Group

HCM Unsignalized Intersection Capacity Analysis Future Total - PM Site Peak Hour34: Healey Road & Site Entrance (Cars) Weekday PM Peak Hour
Canadian Tire Bolton Warehouse Synchro 7 - ReportBA Consulting Group Page 22
Movement EBL EBT WBT WBR SBL SBRLane ConfigurationsVolume (veh/h) 10 115 425 15 30 10Sign Control Free Free StopGrade 0% 0% 0%Peak Hour Factor 1.00 1.00 1.00 1.00 1.00 1.00Hourly flow rate (vph) 10 115 425 15 30 10PedestriansLane Width (m)Walking Speed (m/s)Percent BlockageRight turn flare (veh)Median type None NoneMedian storage veh)Upstream signal (m)pX, platoon unblockedvC, conflicting volume 440 568 432vC1, stage 1 conf volvC2, stage 2 conf volvCu, unblocked vol 440 568 432tC, single (s) 4.1 6.4 6.2tC, 2 stage (s)tF (s) 2.2 3.5 3.3p0 queue free % 99 94 98cM capacity (veh/h) 1131 484 627
Direction, Lane # EB 1 WB 1 SB 1Volume Total 125 440 40Volume Left 10 0 30Volume Right 0 15 10cSH 1131 1700 513Volume to Capacity 0.01 0.26 0.08Queue Length 95th (m) 0.2 0.0 1.8Control Delay (s) 0.7 0.0 12.6Lane LOS A BApproach Delay (s) 0.7 0.0 12.6Approach LOS B
Intersection SummaryAverage Delay 1.0Intersection Capacity Utilization 33.3% ICU Level of Service AAnalysis Period (min) 15
P r o j e c t B o l t o n
APPENDIX D: MTO Left Turn Warrant Sheets
P r o j e c t B o l t o n
COLERAINE DRIVE / TRANSPORTATION OPERATIONS SITE DRIVEWAY (STREET AND SITE PEAK HOUR)
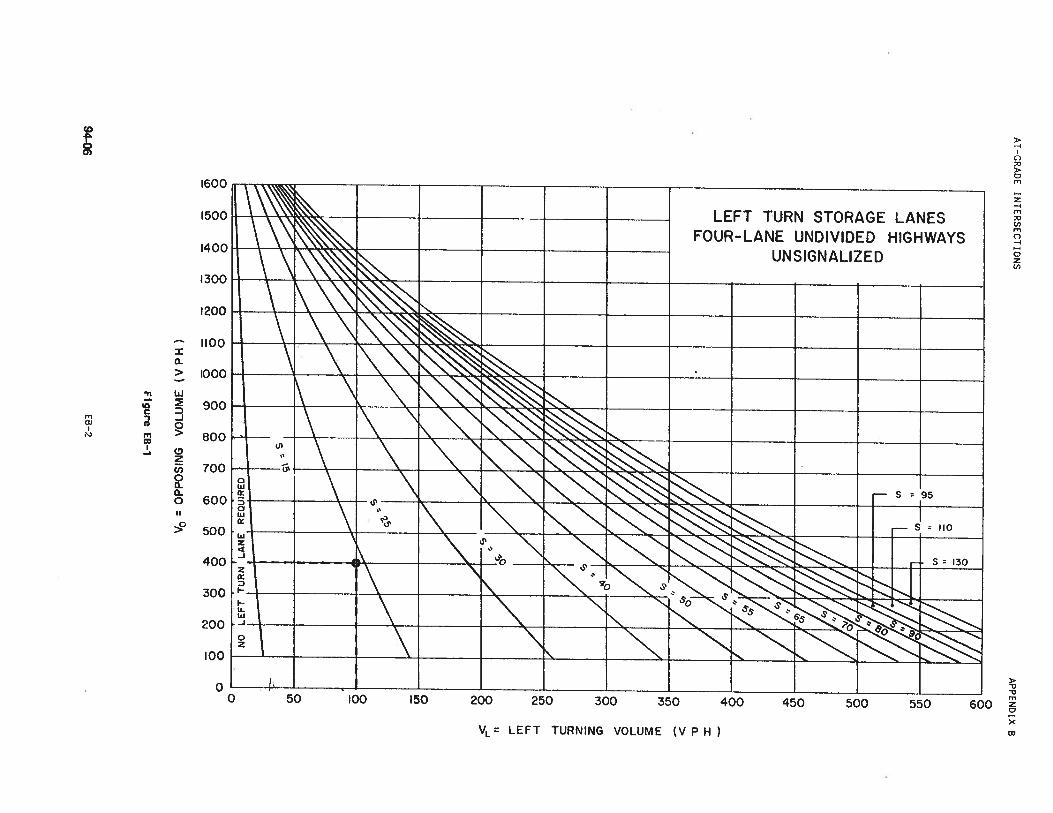
P r o j e c t B o l t o n
HEALEY ROAD / DISTRIBUTION CENTRE SITE ACCESS (STREET PEAK HOUR)
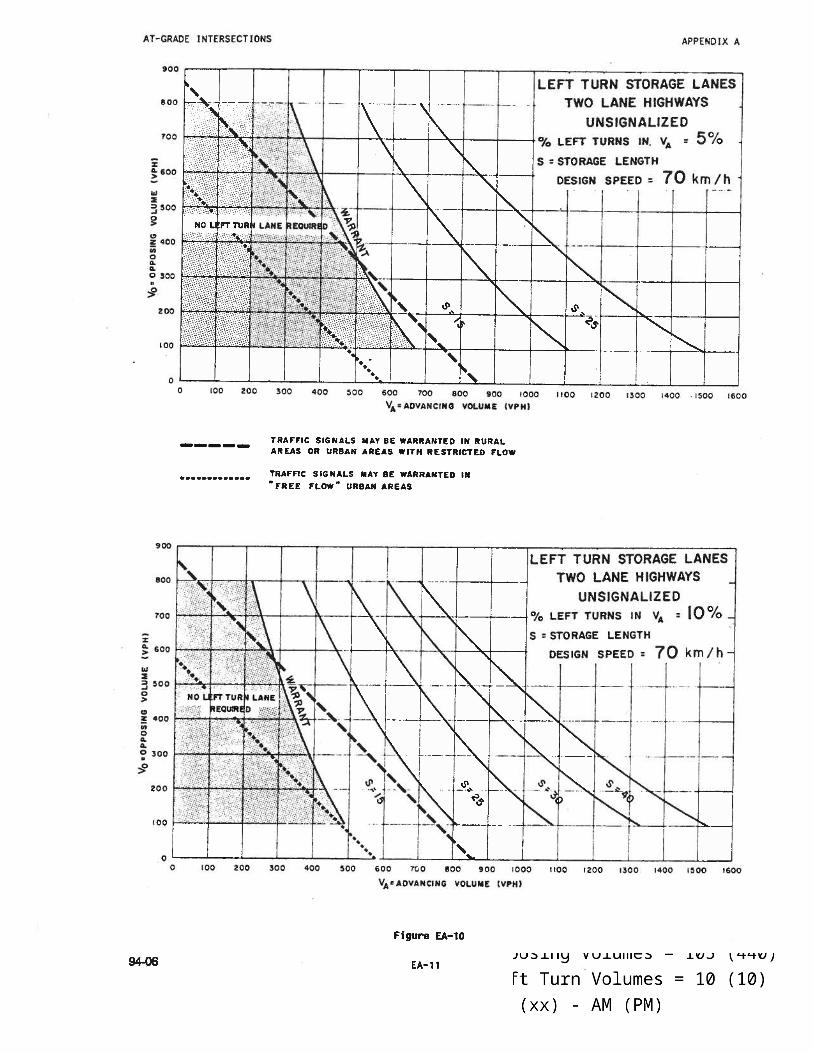

P r o j e c t B o l t o n
HEALEY ROAD / DISTRIBUTION CENTRE SITE ACCESS (SITE PEAK HOUR)
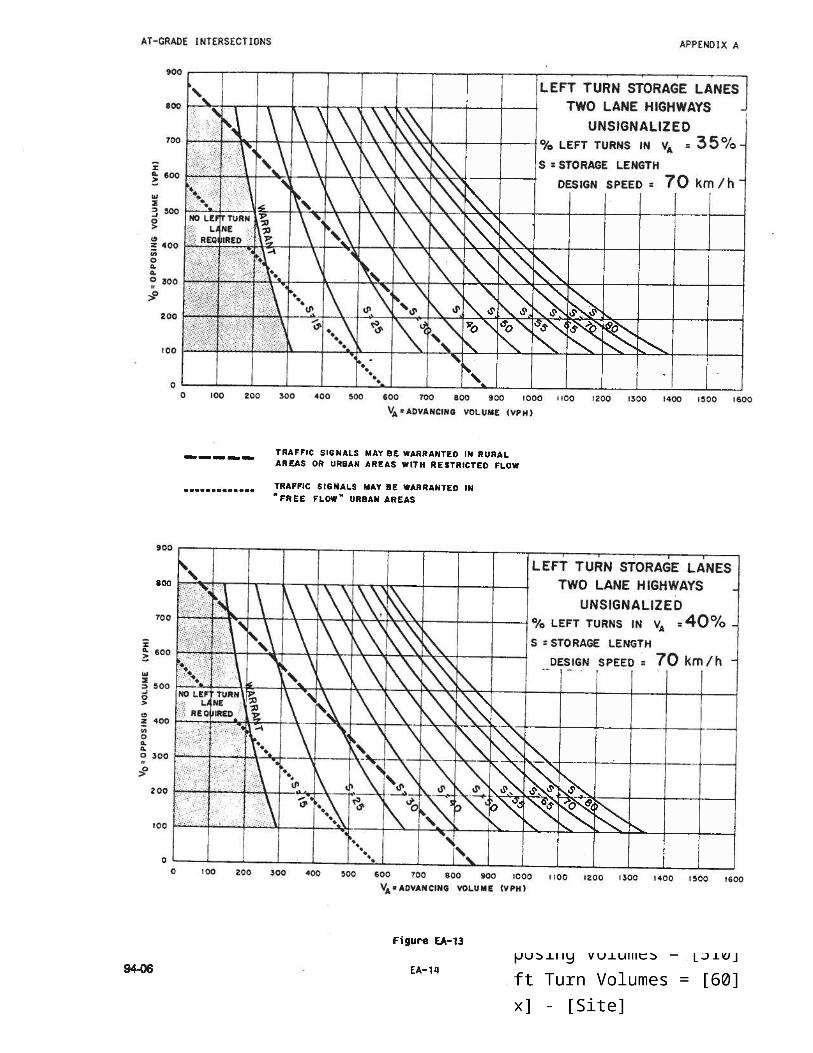
P r o j e c t B o l t o n
APPENDIX E: Sensit iv i ty Analys is
Intersect ion Operat ions Worksheets

P r o j e c t B o l t o n
SATURDAY MIDDAY PEAK HOUR

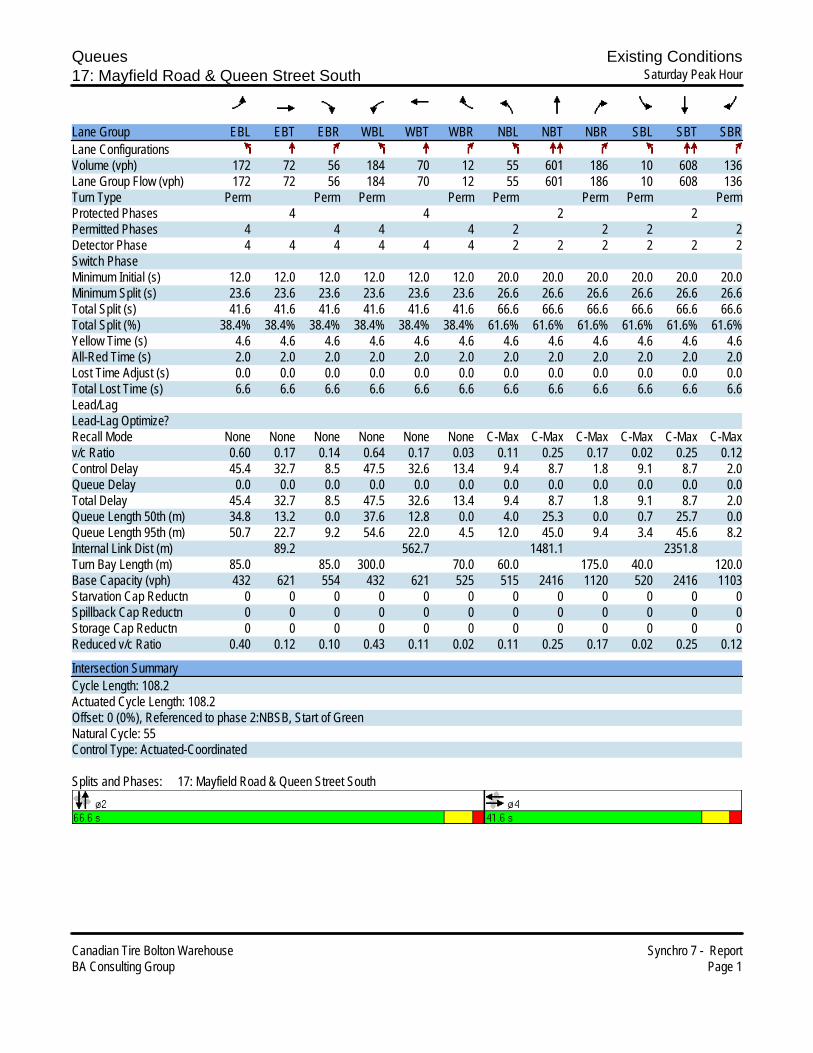
Queues Existing Conditions17: Mayfield Road & Queen Street South Saturday Peak Hour
Canadian Tire Bolton Warehouse Synchro 7 - ReportBA Consulting Group Page 1
Lane Group EBL EBT EBR WBL WBT WBR NBL NBT NBR SBL SBT SBRLane ConfigurationsVolume (vph) 172 72 56 184 70 12 55 601 186 10 608 136Lane Group Flow (vph) 172 72 56 184 70 12 55 601 186 10 608 136Turn Type Perm Perm Perm Perm Perm Perm Perm PermProtected Phases 4 4 2 2Permitted Phases 4 4 4 4 2 2 2 2Detector Phase 4 4 4 4 4 4 2 2 2 2 2 2Switch PhaseMinimum Initial (s) 12.0 12.0 12.0 12.0 12.0 12.0 20.0 20.0 20.0 20.0 20.0 20.0Minimum Split (s) 23.6 23.6 23.6 23.6 23.6 23.6 26.6 26.6 26.6 26.6 26.6 26.6Total Split (s) 41.6 41.6 41.6 41.6 41.6 41.6 66.6 66.6 66.6 66.6 66.6 66.6Total Split (%) 38.4% 38.4% 38.4% 38.4% 38.4% 38.4% 61.6% 61.6% 61.6% 61.6% 61.6% 61.6%Yellow Time (s) 4.6 4.6 4.6 4.6 4.6 4.6 4.6 4.6 4.6 4.6 4.6 4.6All-Red Time (s) 2.0 2.0 2.0 2.0 2.0 2.0 2.0 2.0 2.0 2.0 2.0 2.0Lost Time Adjust (s) 0.0 0.0 0.0 0.0 0.0 0.0 0.0 0.0 0.0 0.0 0.0 0.0Total Lost Time (s) 6.6 6.6 6.6 6.6 6.6 6.6 6.6 6.6 6.6 6.6 6.6 6.6Lead/LagLead-Lag Optimize?Recall Mode None None None None None None C-Max C-Max C-Max C-Max C-Max C-Maxv/c Ratio 0.60 0.17 0.14 0.64 0.17 0.03 0.11 0.25 0.17 0.02 0.25 0.12Control Delay 45.4 32.7 8.5 47.5 32.6 13.4 9.4 8.7 1.8 9.1 8.7 2.0Queue Delay 0.0 0.0 0.0 0.0 0.0 0.0 0.0 0.0 0.0 0.0 0.0 0.0Total Delay 45.4 32.7 8.5 47.5 32.6 13.4 9.4 8.7 1.8 9.1 8.7 2.0Queue Length 50th (m) 34.8 13.2 0.0 37.6 12.8 0.0 4.0 25.3 0.0 0.7 25.7 0.0Queue Length 95th (m) 50.7 22.7 9.2 54.6 22.0 4.5 12.0 45.0 9.4 3.4 45.6 8.2Internal Link Dist (m) 89.2 562.7 1481.1 2351.8Turn Bay Length (m) 85.0 85.0 300.0 70.0 60.0 175.0 40.0 120.0Base Capacity (vph) 432 621 554 432 621 525 515 2416 1120 520 2416 1103Starvation Cap Reductn 0 0 0 0 0 0 0 0 0 0 0 0Spillback Cap Reductn 0 0 0 0 0 0 0 0 0 0 0 0Storage Cap Reductn 0 0 0 0 0 0 0 0 0 0 0 0Reduced v/c Ratio 0.40 0.12 0.10 0.43 0.11 0.02 0.11 0.25 0.17 0.02 0.25 0.12
Intersection SummaryCycle Length: 108.2Actuated Cycle Length: 108.2Offset: 0 (0%), Referenced to phase 2:NBSB, Start of GreenNatural Cycle: 55Control Type: Actuated-Coordinated
Splits and Phases: 17: Mayfield Road & Queen Street South

HCM Signalized Intersection Capacity Analysis Existing Conditions17: Mayfield Road & Queen Street South Saturday Peak Hour
Canadian Tire Bolton Warehouse Synchro 7 - ReportBA Consulting Group Page 2
Movement EBL EBT EBR WBL WBT WBR NBL NBT NBR SBL SBT SBRLane ConfigurationsVolume (vph) 172 72 56 184 70 12 55 601 186 10 608 136Ideal Flow (vphpl) 1900 1900 1900 1900 1900 1900 1900 1900 1900 1900 1900 1900Lane Width 3.5 3.7 3.5 3.5 3.7 3.5 3.5 3.7 3.5 3.5 3.7 3.5Total Lost time (s) 6.6 6.6 6.6 6.6 6.6 6.6 6.6 6.6 6.6 6.6 6.6 6.6Lane Util. Factor 1.00 1.00 1.00 1.00 1.00 1.00 1.00 0.95 1.00 1.00 0.95 1.00Frt 1.00 1.00 0.85 1.00 1.00 0.85 1.00 1.00 0.85 1.00 1.00 0.85Flt Protected 0.95 1.00 1.00 0.95 1.00 1.00 0.95 1.00 1.00 0.95 1.00 1.00Satd. Flow (prot) 1785 1921 1597 1785 1921 1597 1785 3650 1597 1785 3650 1597Flt Permitted 0.71 1.00 1.00 0.71 1.00 1.00 0.41 1.00 1.00 0.42 1.00 1.00Satd. Flow (perm) 1337 1921 1597 1334 1921 1597 778 3650 1597 785 3650 1597Peak-hour factor, PHF 1.00 1.00 1.00 1.00 1.00 1.00 1.00 1.00 1.00 1.00 1.00 1.00Adj. Flow (vph) 172 72 56 184 70 12 55 601 186 10 608 136RTOR Reduction (vph) 0 0 44 0 0 9 0 0 63 0 0 46Lane Group Flow (vph) 172 72 12 184 70 3 55 601 123 10 608 90Turn Type Perm Perm Perm Perm Perm Perm Perm PermProtected Phases 4 4 2 2Permitted Phases 4 4 4 4 2 2 2 2Actuated Green, G (s) 23.4 23.4 23.4 23.4 23.4 23.4 71.6 71.6 71.6 71.6 71.6 71.6Effective Green, g (s) 23.4 23.4 23.4 23.4 23.4 23.4 71.6 71.6 71.6 71.6 71.6 71.6Actuated g/C Ratio 0.22 0.22 0.22 0.22 0.22 0.22 0.66 0.66 0.66 0.66 0.66 0.66Clearance Time (s) 6.6 6.6 6.6 6.6 6.6 6.6 6.6 6.6 6.6 6.6 6.6 6.6Vehicle Extension (s) 5.0 5.0 5.0 5.0 5.0 5.0 5.0 5.0 5.0 5.0 5.0 5.0Lane Grp Cap (vph) 289 415 345 288 415 345 515 2415 1057 519 2415 1057v/s Ratio Prot 0.04 0.04 0.16 c0.17v/s Ratio Perm 0.13 0.01 c0.14 0.00 0.07 0.08 0.01 0.06v/c Ratio 0.60 0.17 0.04 0.64 0.17 0.01 0.11 0.25 0.12 0.02 0.25 0.09Uniform Delay, d1 38.1 34.5 33.5 38.6 34.5 33.3 6.7 7.4 6.7 6.3 7.4 6.6Progression Factor 1.00 1.00 1.00 1.00 1.00 1.00 1.00 1.00 1.00 1.00 1.00 1.00Incremental Delay, d2 4.9 0.4 0.1 6.3 0.4 0.0 0.4 0.2 0.2 0.1 0.3 0.2Delay (s) 43.0 34.9 33.6 44.9 34.9 33.3 7.1 7.7 6.9 6.3 7.7 6.7Level of Service D C C D C C A A A A A AApproach Delay (s) 39.3 41.7 7.5 7.5Approach LOS D D A A
Intersection SummaryHCM Average Control Delay 16.1 HCM Level of Service BHCM Volume to Capacity ratio 0.35Actuated Cycle Length (s) 108.2 Sum of lost time (s) 13.2Intersection Capacity Utilization 66.8% ICU Level of Service CAnalysis Period (min) 15c Critical Lane Group

Timing Report, Sorted By Phase Existing Conditions17: Mayfield Road & Queen Street South Saturday Peak Hour
Canadian Tire Bolton Warehouse Synchro 7 - ReportBA Consulting Group Page 3
Phase Number 2 4Movement NBSB EBWBLead/LagLead-Lag OptimizeRecall Mode C-Max NoneMaximum Split (s) 66.6 41.6Maximum Split (%) 61.6% 38.4%Minimum Split (s) 26.6 23.6Yellow Time (s) 4.6 4.6All-Red Time (s) 2 2Minimum Initial (s) 20 12Vehicle Extension (s) 5 5Minimum Gap (s) 3 3Time Before Reduce (s) 0 0Time To Reduce (s) 0 0Walk Time (s) 5 5Flash Dont Walk (s) 11 12Dual Entry Yes YesInhibit Max Yes YesStart Time (s) 0 66.6End Time (s) 66.6 0Yield/Force Off (s) 60 101.6Yield/Force Off 170(s) 49 89.6Local Start Time (s) 0 66.6Local Yield (s) 60 101.6Local Yield 170(s) 49 89.6
Intersection SummaryCycle Length 108.2Control Type Actuated-CoordinatedNatural Cycle 55Offset: 0 (0%), Referenced to phase 2:NBSB, Start of Green
Splits and Phases: 17: Mayfield Road & Queen Street South

P r o j e c t B o l t o n
SITE DRIVEWAY PEAK HOUR


Timings Future Total - PM Site Peak Hour5: Site Entrance (Trucks) & Coleraine Drive Weekday PM Peak Hour
Canadian Tire Bolton Warehouse Synchro 7 - ReportBA Consulting Group Page 1
Lane Group EBT WBL WBR NBL NBT SBL SBTLane ConfigurationsVolume (vph) 0 15 180 70 390 65 215Turn Type custom custom Perm PermProtected Phases 4 2 6Permitted Phases 8 8 2 6Detector Phase 4 8 8 2 2 6 6Switch PhaseMinimum Initial (s) 8.0 8.0 8.0 12.0 12.0 12.0 12.0Minimum Split (s) 29.0 14.0 14.0 32.0 32.0 32.0 32.0Total Split (s) 29.0 14.0 14.0 47.0 47.0 47.0 47.0Total Split (%) 32.2% 15.6% 15.6% 52.2% 52.2% 52.2% 52.2%Yellow Time (s) 4.0 4.0 4.0 4.0 4.0 4.0 4.0All-Red Time (s) 2.0 2.0 2.0 2.0 2.0 2.0 2.0Lost Time Adjust (s) 0.0 0.0 0.0 0.0 0.0 0.0 0.0Total Lost Time (s) 6.0 6.0 6.0 6.0 6.0 6.0 6.0Lead/Lag Lead Lag LagLead-Lag Optimize? Yes Yes YesRecall Mode None None None C-Max C-Max C-Max C-MaxAct Effct Green (s) 9.0 9.7 9.7 56.1 56.1 56.1 56.1Actuated g/C Ratio 0.10 0.11 0.11 0.62 0.62 0.62 0.62v/c Ratio 0.33 0.10 0.54 0.10 0.17 0.11 0.10Control Delay 16.3 36.4 12.2 9.6 8.7 9.9 8.2Queue Delay 0.0 0.0 0.0 0.0 0.0 0.0 0.0Total Delay 16.3 36.4 12.2 9.6 8.7 9.9 8.2LOS B D B A A A AApproach Delay 16.3 8.8 8.6Approach LOS B A A
Intersection SummaryCycle Length: 90Actuated Cycle Length: 90Offset: 0 (0%), Referenced to phase 2:NBTL and 6:SBTL, Start of GreenNatural Cycle: 75Control Type: Actuated-CoordinatedMaximum v/c Ratio: 0.54Intersection Signal Delay: 10.3 Intersection LOS: BIntersection Capacity Utilization 47.2% ICU Level of Service AAnalysis Period (min) 15
Splits and Phases: 5: Site Entrance (Trucks) & Coleraine Drive

Queues Future Total - PM Site Peak Hour5: Site Entrance (Trucks) & Coleraine Drive Weekday PM Peak Hour
Canadian Tire Bolton Warehouse Synchro 7 - ReportBA Consulting Group Page 2
Lane Group EBT WBL WBR NBL NBT SBL SBTLane Group Flow (vph) 75 15 180 70 395 65 225v/c Ratio 0.33 0.10 0.54 0.10 0.17 0.11 0.10Control Delay 16.3 36.4 12.2 9.6 8.7 9.9 8.2Queue Delay 0.0 0.0 0.0 0.0 0.0 0.0 0.0Total Delay 16.3 36.4 12.2 9.6 8.7 9.9 8.2Queue Length 50th (m) 1.5 2.2 0.0 4.1 12.7 3.9 6.7Queue Length 95th (m) 12.4 7.1 15.8 11.8 24.5 11.4 14.2Internal Link Dist (m) 202.6 166.7 956.4Turn Bay Length (m) 80.0 80.0 80.0Base Capacity (vph) 479 143 333 715 2270 607 2260Starvation Cap Reductn 0 0 0 0 0 0 0Spillback Cap Reductn 0 0 0 0 0 0 0Storage Cap Reductn 0 0 0 0 0 0 0Reduced v/c Ratio 0.16 0.10 0.54 0.10 0.17 0.11 0.10
Intersection Summary

HCM Signalized Intersection Capacity Analysis Future Total - PM Site Peak Hour5: Site Entrance (Trucks) & Coleraine Drive Weekday PM Peak Hour
Canadian Tire Bolton Warehouse Synchro 7 - ReportBA Consulting Group Page 3
Movement EBL EBT EBR WBL WBT WBR NBL NBT NBR SBL SBT SBRLane ConfigurationsVolume (vph) 10 0 65 15 0 180 70 390 5 65 215 10Ideal Flow (vphpl) 1900 1900 1900 1900 1900 1900 1900 1900 1900 1900 1900 1900Lane Width 3.5 3.7 3.5 3.5 3.7 3.5 3.5 3.7 3.5 3.5 3.7 3.5Total Lost time (s) 6.0 6.0 6.0 6.0 6.0 6.0 6.0Lane Util. Factor 1.00 1.00 1.00 1.00 0.95 1.00 0.95Frt 0.88 1.00 0.85 1.00 1.00 1.00 0.99Flt Protected 0.99 0.95 1.00 0.95 1.00 0.95 1.00Satd. Flow (prot) 1685 1785 1597 1785 3643 1785 3626Flt Permitted 0.99 0.71 1.00 0.61 1.00 0.52 1.00Satd. Flow (perm) 1685 1331 1597 1149 3643 975 3626Peak-hour factor, PHF 1.00 1.00 1.00 1.00 1.00 1.00 1.00 1.00 1.00 1.00 1.00 1.00Adj. Flow (vph) 10 0 65 15 0 180 70 390 5 65 215 10RTOR Reduction (vph) 0 60 0 0 0 161 0 1 0 0 3 0Lane Group Flow (vph) 0 15 0 15 0 19 70 394 0 65 222 0Turn Type Perm custom custom Perm PermProtected Phases 4 2 6Permitted Phases 4 8 8 2 6Actuated Green, G (s) 7.4 9.7 9.7 54.9 54.9 54.9 54.9Effective Green, g (s) 7.4 9.7 9.7 54.9 54.9 54.9 54.9Actuated g/C Ratio 0.08 0.11 0.11 0.61 0.61 0.61 0.61Clearance Time (s) 6.0 6.0 6.0 6.0 6.0 6.0 6.0Vehicle Extension (s) 5.0 5.0 5.0 5.0 5.0 5.0 5.0Lane Grp Cap (vph) 139 143 172 701 2222 595 2212v/s Ratio Prot c0.11 0.06v/s Ratio Perm 0.01 0.01 c0.01 0.06 0.07v/c Ratio 0.11 0.10 0.11 0.10 0.18 0.11 0.10Uniform Delay, d1 38.3 36.2 36.3 7.3 7.7 7.3 7.3Progression Factor 1.00 1.00 1.00 1.00 1.00 1.00 1.00Incremental Delay, d2 0.7 0.7 0.6 0.3 0.2 0.4 0.1Delay (s) 39.0 36.9 36.9 7.6 7.8 7.7 7.4Level of Service D D D A A A AApproach Delay (s) 39.0 36.9 7.8 7.5Approach LOS D D A A
Intersection SummaryHCM Average Control Delay 15.5 HCM Level of Service BHCM Volume to Capacity ratio 0.16Actuated Cycle Length (s) 90.0 Sum of lost time (s) 18.0Intersection Capacity Utilization 47.2% ICU Level of Service AAnalysis Period (min) 15c Critical Lane Group

HCM Unsignalized Intersection Capacity Analysis Future Total - PM Site Peak Hour26: Transportation Parking & Coleraine Drive Weekday PM Peak Hour
Canadian Tire Bolton Warehouse Synchro 7 - ReportBA Consulting Group Page 4
Movement EBL EBR NBL NBT SBT SBRLane ConfigurationsVolume (veh/h) 0 95 25 430 330 15Sign Control Yield Free FreeGrade 0% 0% 0%Peak Hour Factor 1.00 1.00 1.00 1.00 1.00 1.00Hourly flow rate (vph) 0 95 25 430 330 15PedestriansLane Width (m)Walking Speed (m/s)Percent BlockageRight turn flare (veh)Median type None NoneMedian storage veh)Upstream signal (m) 191pX, platoon unblockedvC, conflicting volume 602 172 345vC1, stage 1 conf volvC2, stage 2 conf volvCu, unblocked vol 602 172 345tC, single (s) 6.8 6.9 4.1tC, 2 stage (s)tF (s) 3.5 3.3 2.2p0 queue free % 100 89 98cM capacity (veh/h) 427 847 1225
Direction, Lane # EB 1 NB 1 NB 2 NB 3 SB 1 SB 2Volume Total 95 25 215 215 220 125Volume Left 0 25 0 0 0 0Volume Right 95 0 0 0 0 15cSH 847 1225 1700 1700 1700 1700Volume to Capacity 0.11 0.02 0.13 0.13 0.13 0.07Queue Length 95th (m) 2.6 0.4 0.0 0.0 0.0 0.0Control Delay (s) 9.8 8.0 0.0 0.0 0.0 0.0Lane LOS A AApproach Delay (s) 9.8 0.4 0.0Approach LOS A
Intersection SummaryAverage Delay 1.3Intersection Capacity Utilization 22.1% ICU Level of Service AAnalysis Period (min) 15

HCM Unsignalized Intersection Capacity Analysis Future Total - PM Site Peak Hour34: Healey Road & Site Entrance (Cars) Weekday PM Peak Hour
Canadian Tire Bolton Warehouse Synchro 7 - ReportBA Consulting Group Page 5
Movement EBL EBT WBT WBR SBL SBRLane ConfigurationsVolume (veh/h) 60 120 420 115 75 30Sign Control Free Free StopGrade 0% 0% 0%Peak Hour Factor 1.00 1.00 1.00 1.00 1.00 1.00Hourly flow rate (vph) 60 120 420 115 75 30PedestriansLane Width (m)Walking Speed (m/s)Percent BlockageRight turn flare (veh)Median type None NoneMedian storage veh)Upstream signal (m)pX, platoon unblockedvC, conflicting volume 535 718 478vC1, stage 1 conf volvC2, stage 2 conf volvCu, unblocked vol 535 718 478tC, single (s) 4.1 6.4 6.2tC, 2 stage (s)tF (s) 2.2 3.5 3.3p0 queue free % 94 80 95cM capacity (veh/h) 1043 376 592
Direction, Lane # EB 1 WB 1 SB 1Volume Total 180 535 105Volume Left 60 0 75Volume Right 0 115 30cSH 1043 1700 420Volume to Capacity 0.06 0.31 0.25Queue Length 95th (m) 1.3 0.0 6.8Control Delay (s) 3.2 0.0 16.4Lane LOS A CApproach Delay (s) 3.2 0.0 16.4Approach LOS C
Intersection SummaryAverage Delay 2.8Intersection Capacity Utilization 54.7% ICU Level of Service AAnalysis Period (min) 15

P r o j e c t B o l t o n
2021 HORIZON YEAR ANALYIS

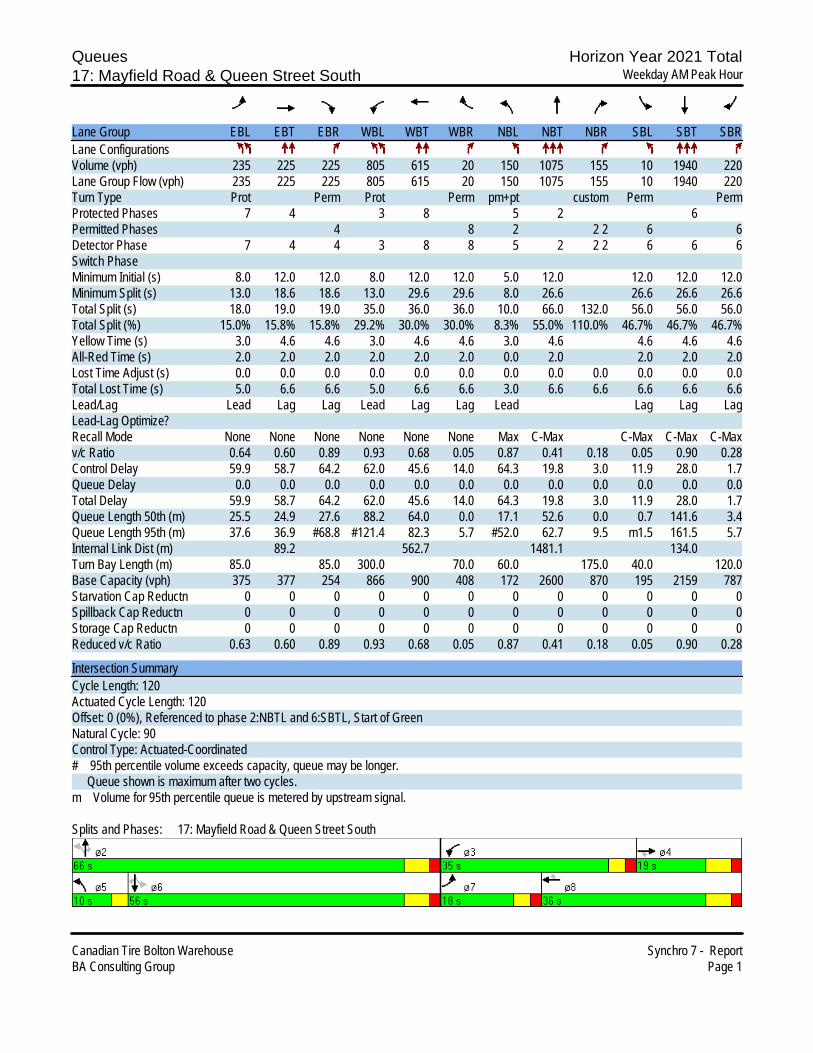
Queues Horizon Year 2021 Total17: Mayfield Road & Queen Street South Weekday AM Peak Hour
Canadian Tire Bolton Warehouse Synchro 7 - ReportBA Consulting Group Page 1
Lane Group EBL EBT EBR WBL WBT WBR NBL NBT NBR SBL SBT SBRLane ConfigurationsVolume (vph) 235 225 225 805 615 20 150 1075 155 10 1940 220Lane Group Flow (vph) 235 225 225 805 615 20 150 1075 155 10 1940 220Turn Type Prot Perm Prot Perm pm+pt custom Perm PermProtected Phases 7 4 3 8 5 2 6Permitted Phases 4 8 2 2 2 6 6Detector Phase 7 4 4 3 8 8 5 2 2 2 6 6 6Switch PhaseMinimum Initial (s) 8.0 12.0 12.0 8.0 12.0 12.0 5.0 12.0 12.0 12.0 12.0Minimum Split (s) 13.0 18.6 18.6 13.0 29.6 29.6 8.0 26.6 26.6 26.6 26.6Total Split (s) 18.0 19.0 19.0 35.0 36.0 36.0 10.0 66.0 132.0 56.0 56.0 56.0Total Split (%) 15.0% 15.8% 15.8% 29.2% 30.0% 30.0% 8.3% 55.0% 110.0% 46.7% 46.7% 46.7%Yellow Time (s) 3.0 4.6 4.6 3.0 4.6 4.6 3.0 4.6 4.6 4.6 4.6All-Red Time (s) 2.0 2.0 2.0 2.0 2.0 2.0 0.0 2.0 2.0 2.0 2.0Lost Time Adjust (s) 0.0 0.0 0.0 0.0 0.0 0.0 0.0 0.0 0.0 0.0 0.0 0.0Total Lost Time (s) 5.0 6.6 6.6 5.0 6.6 6.6 3.0 6.6 6.6 6.6 6.6 6.6Lead/Lag Lead Lag Lag Lead Lag Lag Lead Lag Lag LagLead-Lag Optimize?Recall Mode None None None None None None Max C-Max C-Max C-Max C-Maxv/c Ratio 0.64 0.60 0.89 0.93 0.68 0.05 0.87 0.41 0.18 0.05 0.90 0.28Control Delay 59.9 58.7 64.2 62.0 45.6 14.0 64.3 19.8 3.0 11.9 28.0 1.7Queue Delay 0.0 0.0 0.0 0.0 0.0 0.0 0.0 0.0 0.0 0.0 0.0 0.0Total Delay 59.9 58.7 64.2 62.0 45.6 14.0 64.3 19.8 3.0 11.9 28.0 1.7Queue Length 50th (m) 25.5 24.9 27.6 88.2 64.0 0.0 17.1 52.6 0.0 0.7 141.6 3.4Queue Length 95th (m) 37.6 36.9 #68.8 #121.4 82.3 5.7 #52.0 62.7 9.5 m1.5 161.5 5.7Internal Link Dist (m) 89.2 562.7 1481.1 134.0Turn Bay Length (m) 85.0 85.0 300.0 70.0 60.0 175.0 40.0 120.0Base Capacity (vph) 375 377 254 866 900 408 172 2600 870 195 2159 787Starvation Cap Reductn 0 0 0 0 0 0 0 0 0 0 0 0Spillback Cap Reductn 0 0 0 0 0 0 0 0 0 0 0 0Storage Cap Reductn 0 0 0 0 0 0 0 0 0 0 0 0Reduced v/c Ratio 0.63 0.60 0.89 0.93 0.68 0.05 0.87 0.41 0.18 0.05 0.90 0.28
Intersection SummaryCycle Length: 120Actuated Cycle Length: 120Offset: 0 (0%), Referenced to phase 2:NBTL and 6:SBTL, Start of GreenNatural Cycle: 90Control Type: Actuated-Coordinated# 95th percentile volume exceeds capacity, queue may be longer. Queue shown is maximum after two cycles.m Volume for 95th percentile queue is metered by upstream signal.
Splits and Phases: 17: Mayfield Road & Queen Street South

HCM Signalized Intersection Capacity Analysis Horizon Year 2021 Total17: Mayfield Road & Queen Street South Weekday AM Peak Hour
Canadian Tire Bolton Warehouse Synchro 7 - ReportBA Consulting Group Page 2
Movement EBL EBT EBR WBL WBT WBR NBL NBT NBR SBL SBT SBRLane ConfigurationsVolume (vph) 235 225 225 805 615 20 150 1075 155 10 1940 220Ideal Flow (vphpl) 1900 1900 1900 1900 1900 1900 1900 1900 1900 1900 1900 1900Lane Width 3.5 3.7 3.5 3.5 3.7 3.5 3.5 3.7 3.5 3.5 3.7 3.5Total Lost time (s) 5.0 6.6 6.6 5.0 6.6 6.6 3.0 6.6 6.6 6.6 6.6 6.6Lane Util. Factor 0.97 0.95 1.00 0.97 0.95 1.00 1.00 0.91 1.00 1.00 0.91 1.00Frt 1.00 1.00 0.85 1.00 1.00 0.85 1.00 1.00 0.85 1.00 1.00 0.85Flt Protected 0.95 1.00 1.00 0.95 1.00 1.00 0.95 1.00 1.00 0.95 1.00 1.00Satd. Flow (prot) 3463 3650 1597 3463 3650 1597 1785 5245 1597 1785 5245 1597Flt Permitted 0.95 1.00 1.00 0.95 1.00 1.00 0.08 1.00 1.00 0.25 1.00 1.00Satd. Flow (perm) 3463 3650 1597 3463 3650 1597 143 5245 1597 474 5245 1597Peak-hour factor, PHF 1.00 1.00 1.00 1.00 1.00 1.00 1.00 1.00 1.00 1.00 1.00 1.00Adj. Flow (vph) 235 225 225 805 615 20 150 1075 155 10 1940 220RTOR Reduction (vph) 0 0 89 0 0 15 0 0 78 0 0 129Lane Group Flow (vph) 235 225 136 805 615 5 150 1075 77 10 1940 91Turn Type Prot Perm Prot Perm pm+pt custom Perm PermProtected Phases 7 4 3 8 5 2 6Permitted Phases 4 8 2 2 2 6 6Actuated Green, G (s) 12.7 12.3 12.3 30.0 29.6 29.6 59.5 59.5 59.5 49.4 49.4 49.4Effective Green, g (s) 12.7 12.3 12.3 30.0 29.6 29.6 59.5 59.5 59.5 49.4 49.4 49.4Actuated g/C Ratio 0.11 0.10 0.10 0.25 0.25 0.25 0.50 0.50 0.50 0.41 0.41 0.41Clearance Time (s) 5.0 6.6 6.6 5.0 6.6 6.6 3.0 6.6 6.6 6.6 6.6Vehicle Extension (s) 5.0 5.0 5.0 5.0 5.0 5.0 5.0 5.0 5.0 5.0 5.0Lane Grp Cap (vph) 367 374 164 866 900 394 168 2601 792 195 2159 657v/s Ratio Prot 0.07 0.06 c0.23 0.17 c0.05 0.20 0.37v/s Ratio Perm c0.09 0.00 c0.39 0.05 0.02 0.06v/c Ratio 0.64 0.60 0.83 0.93 0.68 0.01 0.89 0.41 0.10 0.05 0.90 0.14Uniform Delay, d1 51.5 51.5 52.8 44.0 41.0 34.2 27.3 19.2 16.0 21.2 33.0 22.0Progression Factor 1.00 1.00 1.00 1.00 1.00 1.00 1.00 1.00 1.00 0.52 0.66 0.33Incremental Delay, d2 5.1 4.0 31.1 16.6 2.8 0.0 45.8 0.5 0.2 0.4 5.7 0.4Delay (s) 56.6 55.5 83.9 60.5 43.7 34.2 73.1 19.7 16.3 11.5 27.6 7.6Level of Service E E F E D C E B B B C AApproach Delay (s) 65.2 53.0 25.1 25.5Approach LOS E D C C
Intersection SummaryHCM Average Control Delay 37.2 HCM Level of Service DHCM Volume to Capacity ratio 0.86Actuated Cycle Length (s) 120.0 Sum of lost time (s) 14.6Intersection Capacity Utilization 97.3% ICU Level of Service FAnalysis Period (min) 15c Critical Lane Group
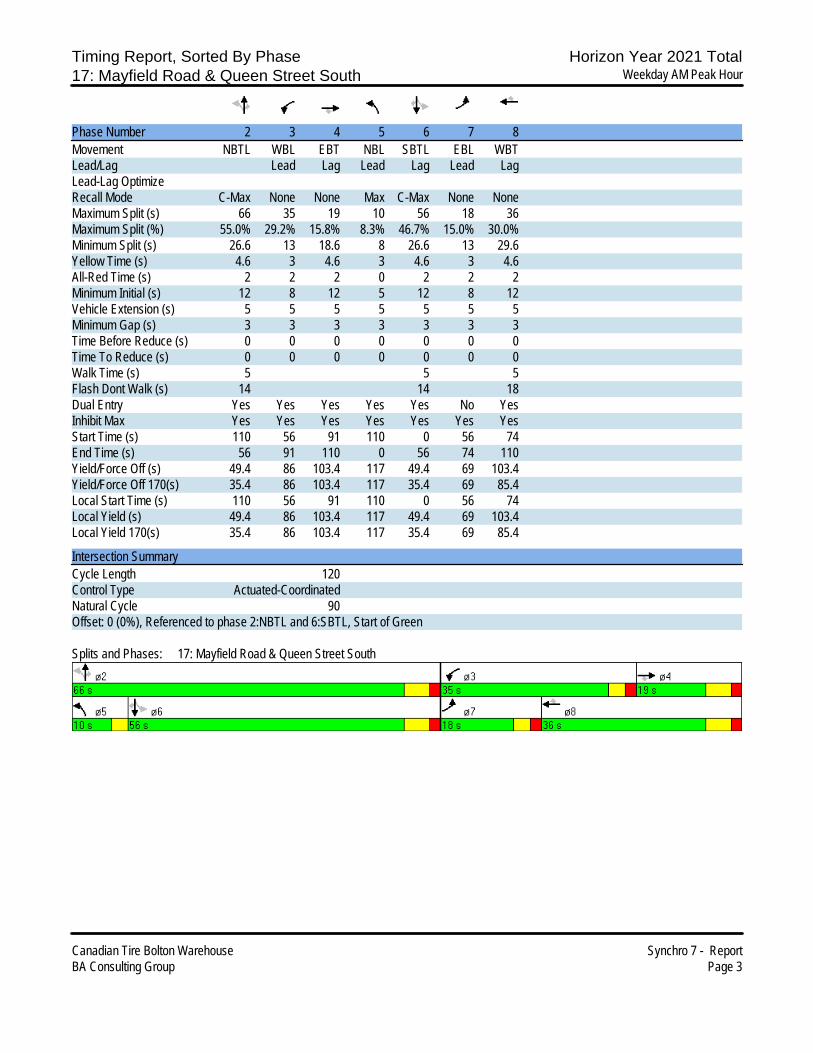
Timing Report, Sorted By Phase Horizon Year 2021 Total17: Mayfield Road & Queen Street South Weekday AM Peak Hour
Canadian Tire Bolton Warehouse Synchro 7 - ReportBA Consulting Group Page 3
Phase Number 2 3 4 5 6 7 8Movement NBTL WBL EBT NBL SBTL EBL WBTLead/Lag Lead Lag Lead Lag Lead LagLead-Lag OptimizeRecall Mode C-Max None None Max C-Max None NoneMaximum Split (s) 66 35 19 10 56 18 36Maximum Split (%) 55.0% 29.2% 15.8% 8.3% 46.7% 15.0% 30.0%Minimum Split (s) 26.6 13 18.6 8 26.6 13 29.6Yellow Time (s) 4.6 3 4.6 3 4.6 3 4.6All-Red Time (s) 2 2 2 0 2 2 2Minimum Initial (s) 12 8 12 5 12 8 12Vehicle Extension (s) 5 5 5 5 5 5 5Minimum Gap (s) 3 3 3 3 3 3 3Time Before Reduce (s) 0 0 0 0 0 0 0Time To Reduce (s) 0 0 0 0 0 0 0Walk Time (s) 5 5 5Flash Dont Walk (s) 14 14 18Dual Entry Yes Yes Yes Yes Yes No YesInhibit Max Yes Yes Yes Yes Yes Yes YesStart Time (s) 110 56 91 110 0 56 74End Time (s) 56 91 110 0 56 74 110Yield/Force Off (s) 49.4 86 103.4 117 49.4 69 103.4Yield/Force Off 170(s) 35.4 86 103.4 117 35.4 69 85.4Local Start Time (s) 110 56 91 110 0 56 74Local Yield (s) 49.4 86 103.4 117 49.4 69 103.4Local Yield 170(s) 35.4 86 103.4 117 35.4 69 85.4
Intersection SummaryCycle Length 120Control Type Actuated-CoordinatedNatural Cycle 90Offset: 0 (0%), Referenced to phase 2:NBTL and 6:SBTL, Start of Green
Splits and Phases: 17: Mayfield Road & Queen Street South
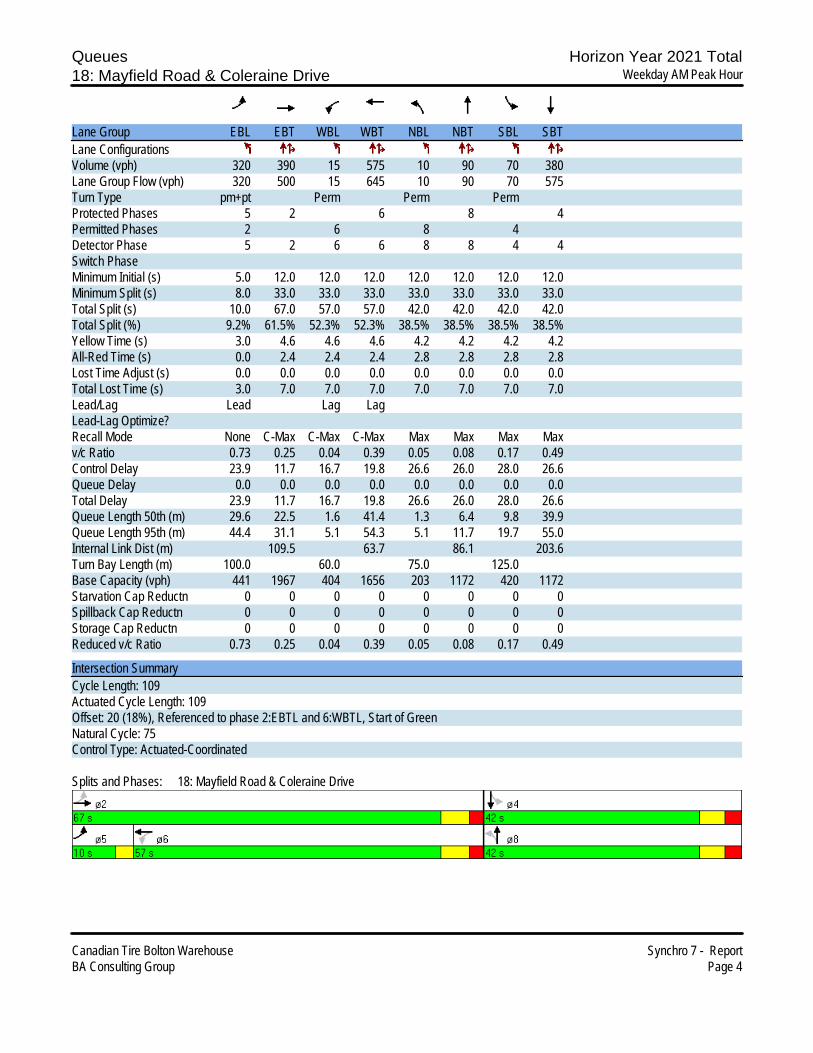
Queues Horizon Year 2021 Total18: Mayfield Road & Coleraine Drive Weekday AM Peak Hour
Canadian Tire Bolton Warehouse Synchro 7 - ReportBA Consulting Group Page 4
Lane Group EBL EBT WBL WBT NBL NBT SBL SBTLane ConfigurationsVolume (vph) 320 390 15 575 10 90 70 380Lane Group Flow (vph) 320 500 15 645 10 90 70 575Turn Type pm+pt Perm Perm PermProtected Phases 5 2 6 8 4Permitted Phases 2 6 8 4Detector Phase 5 2 6 6 8 8 4 4Switch PhaseMinimum Initial (s) 5.0 12.0 12.0 12.0 12.0 12.0 12.0 12.0Minimum Split (s) 8.0 33.0 33.0 33.0 33.0 33.0 33.0 33.0Total Split (s) 10.0 67.0 57.0 57.0 42.0 42.0 42.0 42.0Total Split (%) 9.2% 61.5% 52.3% 52.3% 38.5% 38.5% 38.5% 38.5%Yellow Time (s) 3.0 4.6 4.6 4.6 4.2 4.2 4.2 4.2All-Red Time (s) 0.0 2.4 2.4 2.4 2.8 2.8 2.8 2.8Lost Time Adjust (s) 0.0 0.0 0.0 0.0 0.0 0.0 0.0 0.0Total Lost Time (s) 3.0 7.0 7.0 7.0 7.0 7.0 7.0 7.0Lead/Lag Lead Lag LagLead-Lag Optimize?Recall Mode None C-Max C-Max C-Max Max Max Max Maxv/c Ratio 0.73 0.25 0.04 0.39 0.05 0.08 0.17 0.49Control Delay 23.9 11.7 16.7 19.8 26.6 26.0 28.0 26.6Queue Delay 0.0 0.0 0.0 0.0 0.0 0.0 0.0 0.0Total Delay 23.9 11.7 16.7 19.8 26.6 26.0 28.0 26.6Queue Length 50th (m) 29.6 22.5 1.6 41.4 1.3 6.4 9.8 39.9Queue Length 95th (m) 44.4 31.1 5.1 54.3 5.1 11.7 19.7 55.0Internal Link Dist (m) 109.5 63.7 86.1 203.6Turn Bay Length (m) 100.0 60.0 75.0 125.0Base Capacity (vph) 441 1967 404 1656 203 1172 420 1172Starvation Cap Reductn 0 0 0 0 0 0 0 0Spillback Cap Reductn 0 0 0 0 0 0 0 0Storage Cap Reductn 0 0 0 0 0 0 0 0Reduced v/c Ratio 0.73 0.25 0.04 0.39 0.05 0.08 0.17 0.49
Intersection SummaryCycle Length: 109Actuated Cycle Length: 109Offset: 20 (18%), Referenced to phase 2:EBTL and 6:WBTL, Start of GreenNatural Cycle: 75Control Type: Actuated-Coordinated
Splits and Phases: 18: Mayfield Road & Coleraine Drive

HCM Signalized Intersection Capacity Analysis Horizon Year 2021 Total18: Mayfield Road & Coleraine Drive Weekday AM Peak Hour
Canadian Tire Bolton Warehouse Synchro 7 - ReportBA Consulting Group Page 5
Movement EBL EBT EBR WBL WBT WBR NBL NBT NBR SBL SBT SBRLane ConfigurationsVolume (vph) 320 390 110 15 575 70 10 90 0 70 380 195Ideal Flow (vphpl) 1900 1900 1900 1900 1900 1900 1900 1900 1900 1900 1900 1900Lane Width 3.5 3.7 3.5 3.5 3.7 3.5 3.5 3.7 3.5 3.5 3.7 3.5Total Lost time (s) 3.0 7.0 7.0 7.0 7.0 7.0 7.0 7.0Lane Util. Factor 1.00 0.95 1.00 0.95 1.00 0.95 1.00 0.95Frt 1.00 0.97 1.00 0.98 1.00 1.00 1.00 0.95Flt Protected 0.95 1.00 0.95 1.00 0.95 1.00 0.95 1.00Satd. Flow (prot) 1785 3530 1785 3591 1785 3650 1785 3464Flt Permitted 0.33 1.00 0.47 1.00 0.34 1.00 0.70 1.00Satd. Flow (perm) 624 3530 881 3591 632 3650 1307 3464Peak-hour factor, PHF 1.00 1.00 1.00 1.00 1.00 1.00 1.00 1.00 1.00 1.00 1.00 1.00Adj. Flow (vph) 320 390 110 15 575 70 10 90 0 70 380 195RTOR Reduction (vph) 0 24 0 0 9 0 0 0 0 0 60 0Lane Group Flow (vph) 320 476 0 15 636 0 10 90 0 70 515 0Turn Type pm+pt Perm Perm PermProtected Phases 5 2 6 8 4Permitted Phases 2 6 8 4Actuated Green, G (s) 60.0 60.0 50.0 50.0 35.0 35.0 35.0 35.0Effective Green, g (s) 60.0 60.0 50.0 50.0 35.0 35.0 35.0 35.0Actuated g/C Ratio 0.55 0.55 0.46 0.46 0.32 0.32 0.32 0.32Clearance Time (s) 3.0 7.0 7.0 7.0 7.0 7.0 7.0 7.0Vehicle Extension (s) 5.0 5.0 5.0 5.0 5.0 5.0 5.0 5.0Lane Grp Cap (vph) 418 1943 404 1647 203 1172 420 1112v/s Ratio Prot c0.05 0.13 0.18 0.02 c0.15v/s Ratio Perm c0.37 0.02 0.02 0.05v/c Ratio 0.77 0.25 0.04 0.39 0.05 0.08 0.17 0.46Uniform Delay, d1 17.4 12.7 16.2 19.4 25.5 25.8 26.5 29.5Progression Factor 1.00 1.00 1.00 1.00 1.00 1.00 1.00 1.00Incremental Delay, d2 9.5 0.3 0.2 0.7 0.5 0.1 0.9 1.4Delay (s) 27.0 13.0 16.4 20.1 26.0 25.9 27.4 30.9Level of Service C B B C C C C CApproach Delay (s) 18.5 20.0 25.9 30.5Approach LOS B C C C
Intersection SummaryHCM Average Control Delay 22.8 HCM Level of Service CHCM Volume to Capacity ratio 0.63Actuated Cycle Length (s) 109.0 Sum of lost time (s) 10.0Intersection Capacity Utilization 67.6% ICU Level of Service CAnalysis Period (min) 15c Critical Lane Group
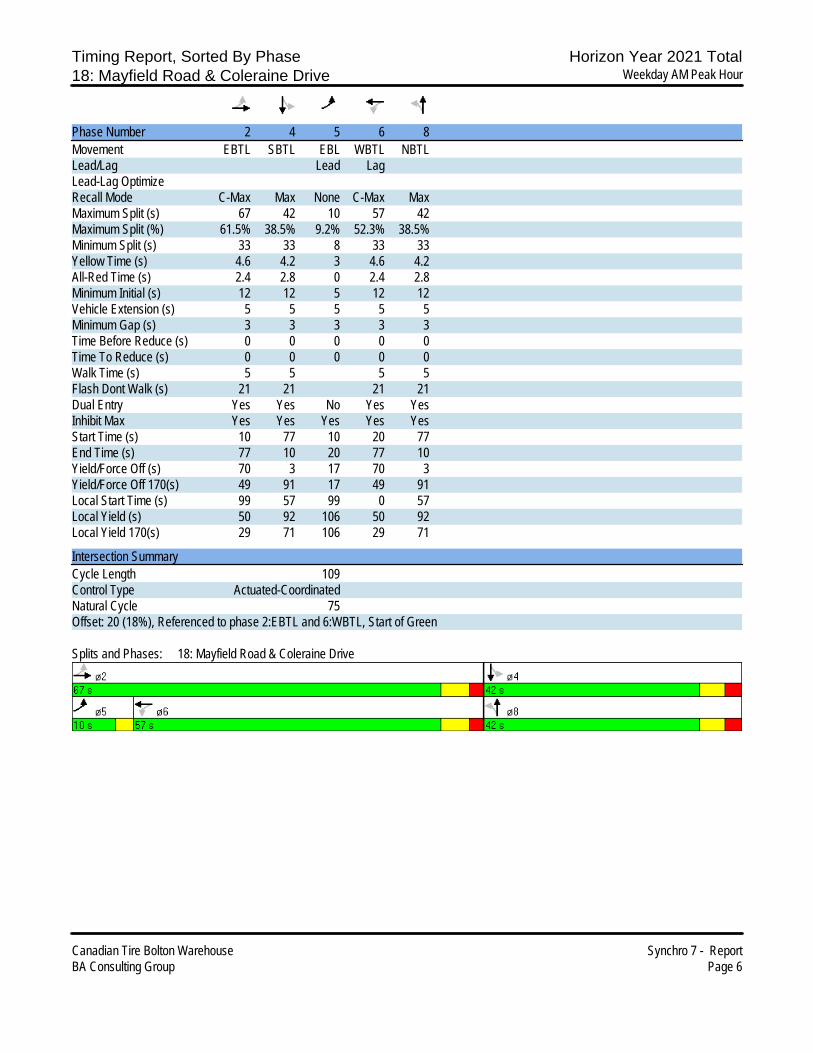
Timing Report, Sorted By Phase Horizon Year 2021 Total18: Mayfield Road & Coleraine Drive Weekday AM Peak Hour
Canadian Tire Bolton Warehouse Synchro 7 - ReportBA Consulting Group Page 6
Phase Number 2 4 5 6 8Movement EBTL SBTL EBL WBTL NBTLLead/Lag Lead LagLead-Lag OptimizeRecall Mode C-Max Max None C-Max MaxMaximum Split (s) 67 42 10 57 42Maximum Split (%) 61.5% 38.5% 9.2% 52.3% 38.5%Minimum Split (s) 33 33 8 33 33Yellow Time (s) 4.6 4.2 3 4.6 4.2All-Red Time (s) 2.4 2.8 0 2.4 2.8Minimum Initial (s) 12 12 5 12 12Vehicle Extension (s) 5 5 5 5 5Minimum Gap (s) 3 3 3 3 3Time Before Reduce (s) 0 0 0 0 0Time To Reduce (s) 0 0 0 0 0Walk Time (s) 5 5 5 5Flash Dont Walk (s) 21 21 21 21Dual Entry Yes Yes No Yes YesInhibit Max Yes Yes Yes Yes YesStart Time (s) 10 77 10 20 77End Time (s) 77 10 20 77 10Yield/Force Off (s) 70 3 17 70 3Yield/Force Off 170(s) 49 91 17 49 91Local Start Time (s) 99 57 99 0 57Local Yield (s) 50 92 106 50 92Local Yield 170(s) 29 71 106 29 71
Intersection SummaryCycle Length 109Control Type Actuated-CoordinatedNatural Cycle 75Offset: 20 (18%), Referenced to phase 2:EBTL and 6:WBTL, Start of Green
Splits and Phases: 18: Mayfield Road & Coleraine Drive
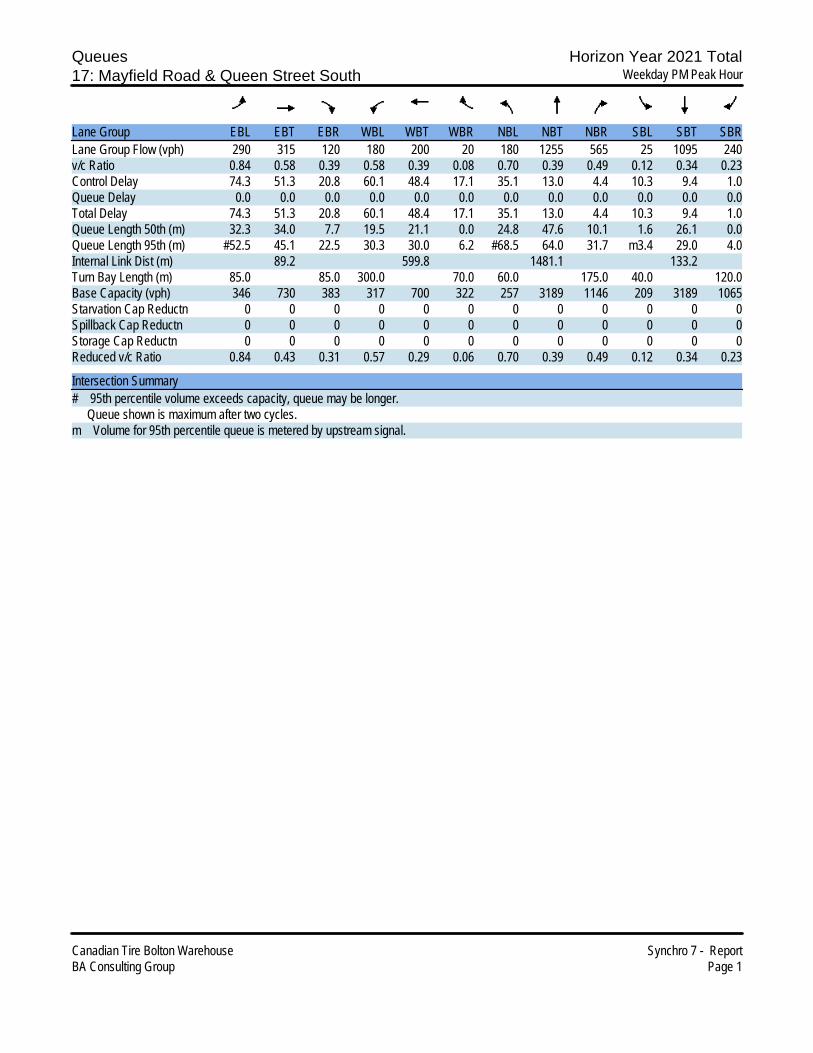
Queues Horizon Year 2021 Total17: Mayfield Road & Queen Street South Weekday PM Peak Hour
Canadian Tire Bolton Warehouse Synchro 7 - ReportBA Consulting Group Page 1
Lane Group EBL EBT EBR WBL WBT WBR NBL NBT NBR SBL SBT SBRLane Group Flow (vph) 290 315 120 180 200 20 180 1255 565 25 1095 240v/c Ratio 0.84 0.58 0.39 0.58 0.39 0.08 0.70 0.39 0.49 0.12 0.34 0.23Control Delay 74.3 51.3 20.8 60.1 48.4 17.1 35.1 13.0 4.4 10.3 9.4 1.0Queue Delay 0.0 0.0 0.0 0.0 0.0 0.0 0.0 0.0 0.0 0.0 0.0 0.0Total Delay 74.3 51.3 20.8 60.1 48.4 17.1 35.1 13.0 4.4 10.3 9.4 1.0Queue Length 50th (m) 32.3 34.0 7.7 19.5 21.1 0.0 24.8 47.6 10.1 1.6 26.1 0.0Queue Length 95th (m) #52.5 45.1 22.5 30.3 30.0 6.2 #68.5 64.0 31.7 m3.4 29.0 4.0Internal Link Dist (m) 89.2 599.8 1481.1 133.2Turn Bay Length (m) 85.0 85.0 300.0 70.0 60.0 175.0 40.0 120.0Base Capacity (vph) 346 730 383 317 700 322 257 3189 1146 209 3189 1065Starvation Cap Reductn 0 0 0 0 0 0 0 0 0 0 0 0Spillback Cap Reductn 0 0 0 0 0 0 0 0 0 0 0 0Storage Cap Reductn 0 0 0 0 0 0 0 0 0 0 0 0Reduced v/c Ratio 0.84 0.43 0.31 0.57 0.29 0.06 0.70 0.39 0.49 0.12 0.34 0.23
Intersection Summary# 95th percentile volume exceeds capacity, queue may be longer. Queue shown is maximum after two cycles.m Volume for 95th percentile queue is metered by upstream signal.

HCM Signalized Intersection Capacity Analysis Horizon Year 2021 Total17: Mayfield Road & Queen Street South Weekday PM Peak Hour
Canadian Tire Bolton Warehouse Synchro 7 - ReportBA Consulting Group Page 2
Movement EBL EBT EBR WBL WBT WBR NBL NBT NBR SBL SBT SBRLane ConfigurationsVolume (vph) 290 315 120 180 200 20 180 1255 565 25 1095 240Ideal Flow (vphpl) 1900 1900 1900 1900 1900 1900 1900 1900 1900 1900 1900 1900Lane Width 3.5 3.7 3.5 3.5 3.7 3.5 3.5 3.7 3.5 3.5 3.7 3.5Total Lost time (s) 5.0 6.6 6.6 5.0 6.6 6.6 6.6 6.6 6.6 6.6 6.6 6.6Lane Util. Factor 0.97 0.95 1.00 0.97 0.95 1.00 1.00 0.91 1.00 1.00 0.91 1.00Frt 1.00 1.00 0.85 1.00 1.00 0.85 1.00 1.00 0.85 1.00 1.00 0.85Flt Protected 0.95 1.00 1.00 0.95 1.00 1.00 0.95 1.00 1.00 0.95 1.00 1.00Satd. Flow (prot) 3463 3650 1597 3463 3650 1597 1785 5245 1597 1785 5245 1597Flt Permitted 0.95 1.00 1.00 0.95 1.00 1.00 0.22 1.00 1.00 0.18 1.00 1.00Satd. Flow (perm) 3463 3650 1597 3463 3650 1597 423 5245 1597 343 5245 1597Peak-hour factor, PHF 1.00 1.00 1.00 1.00 1.00 1.00 1.00 1.00 1.00 1.00 1.00 1.00Adj. Flow (vph) 290 315 120 180 200 20 180 1255 565 25 1095 240RTOR Reduction (vph) 0 0 68 0 0 17 0 0 175 0 0 94Lane Group Flow (vph) 290 315 52 180 200 3 180 1255 390 25 1095 146Turn Type Prot Perm Prot Perm Perm Perm Perm PermProtected Phases 7 4 3 8 2 6Permitted Phases 4 8 2 2 6 6Actuated Green, G (s) 12.0 18.0 18.0 10.9 16.9 16.9 72.9 72.9 72.9 72.9 72.9 72.9Effective Green, g (s) 12.0 18.0 18.0 10.9 16.9 16.9 72.9 72.9 72.9 72.9 72.9 72.9Actuated g/C Ratio 0.10 0.15 0.15 0.09 0.14 0.14 0.61 0.61 0.61 0.61 0.61 0.61Clearance Time (s) 5.0 6.6 6.6 5.0 6.6 6.6 6.6 6.6 6.6 6.6 6.6 6.6Vehicle Extension (s) 5.0 5.0 5.0 5.0 5.0 5.0 5.0 5.0 5.0 5.0 5.0 5.0Lane Grp Cap (vph) 346 548 240 315 514 225 257 3186 970 208 3186 970v/s Ratio Prot c0.08 c0.09 0.05 0.05 0.24 0.21v/s Ratio Perm 0.03 0.00 c0.43 0.24 0.07 0.09v/c Ratio 0.84 0.57 0.22 0.57 0.39 0.01 0.70 0.39 0.40 0.12 0.34 0.15Uniform Delay, d1 53.0 47.4 44.8 52.3 46.9 44.4 16.1 12.2 12.2 10.0 11.7 10.2Progression Factor 1.00 1.00 1.00 1.00 1.00 1.00 1.00 1.00 1.00 0.77 0.76 0.35Incremental Delay, d2 17.7 2.3 1.0 4.0 1.0 0.0 14.8 0.4 1.2 1.1 0.3 0.3Delay (s) 70.7 49.8 45.8 56.3 47.9 44.4 30.8 12.5 13.5 8.8 9.1 3.9Level of Service E D D E D D C B B A A AApproach Delay (s) 57.5 51.5 14.4 8.2Approach LOS E D B A
Intersection SummaryHCM Average Control Delay 22.8 HCM Level of Service CHCM Volume to Capacity ratio 0.66Actuated Cycle Length (s) 120.0 Sum of lost time (s) 11.6Intersection Capacity Utilization 73.2% ICU Level of Service DAnalysis Period (min) 15c Critical Lane Group

Timing Report, Sorted By Phase Horizon Year 2021 Total17: Mayfield Road & Queen Street South Weekday PM Peak Hour
Canadian Tire Bolton Warehouse Synchro 7 - ReportBA Consulting Group Page 3
Phase Number 2 3 4 6 7 8Movement NBTL WBL EBT SBTL EBL WBTLead/Lag Lead Lag Lead LagLead-Lag Optimize Yes Yes Yes YesRecall Mode C-Max None None C-Max None NoneMaximum Split (s) 73.4 16 30.6 73.4 17 29.6Maximum Split (%) 61.2% 13.3% 25.5% 61.2% 14.2% 24.7%Minimum Split (s) 26.6 13 29.6 26.6 13 29.6Yellow Time (s) 4.6 3 4.6 4.6 3 4.6All-Red Time (s) 2 2 2 2 2 2Minimum Initial (s) 12 8 12 12 8 12Vehicle Extension (s) 5 5 5 5 5 5Minimum Gap (s) 3 3 3 3 3 3Time Before Reduce (s) 0 0 0 0 0 0Time To Reduce (s) 0 0 0 0 0 0Walk Time (s) 5 5 5Flash Dont Walk (s) 14 14 18Dual Entry Yes No Yes Yes No YesInhibit Max Yes Yes Yes Yes Yes YesStart Time (s) 0 73.4 89.4 0 73.4 90.4End Time (s) 73.4 89.4 0 73.4 90.4 0Yield/Force Off (s) 66.8 84.4 113.4 66.8 85.4 113.4Yield/Force Off 170(s) 52.8 84.4 113.4 52.8 85.4 95.4Local Start Time (s) 0 73.4 89.4 0 73.4 90.4Local Yield (s) 66.8 84.4 113.4 66.8 85.4 113.4Local Yield 170(s) 52.8 84.4 113.4 52.8 85.4 95.4
Intersection SummaryCycle Length 120Control Type Actuated-CoordinatedNatural Cycle 90Offset: 0 (0%), Referenced to phase 2:NBTL and 6:SBTL, Start of Green
Splits and Phases: 17: Mayfield Road & Queen Street South

Queues Horizon Year 2021 Total18: Mayfield Road & Coleraine Drive Weekday PM Peak Hour
Canadian Tire Bolton Warehouse Synchro 7 - ReportBA Consulting Group Page 4
Lane Group EBL EBT WBL WBT NBL NBT SBL SBTLane Group Flow (vph) 245 640 15 640 95 250 70 410v/c Ratio 0.50 0.31 0.04 0.40 0.36 0.22 0.20 0.34Control Delay 14.0 13.1 18.9 22.3 35.7 29.3 31.2 10.6Queue Delay 0.0 0.0 0.0 0.0 0.0 0.0 0.0 0.0Total Delay 14.0 13.1 18.9 22.3 35.7 29.3 31.2 10.6Queue Length 50th (m) 21.6 33.5 1.7 45.3 15.2 19.5 10.6 10.5Queue Length 95th (m) 33.1 43.5 5.5 58.8 29.5 28.9 21.2 21.3Internal Link Dist (m) 109.5 63.7 86.1 203.6Turn Bay Length (m) 100.0 60.0 75.0 125.0Base Capacity (vph) 495 2067 338 1593 263 1115 344 1198Starvation Cap Reductn 0 0 0 0 0 0 0 0Spillback Cap Reductn 0 0 0 0 0 0 0 0Storage Cap Reductn 0 0 0 0 0 0 0 0Reduced v/c Ratio 0.49 0.31 0.04 0.40 0.36 0.22 0.20 0.34
Intersection Summary
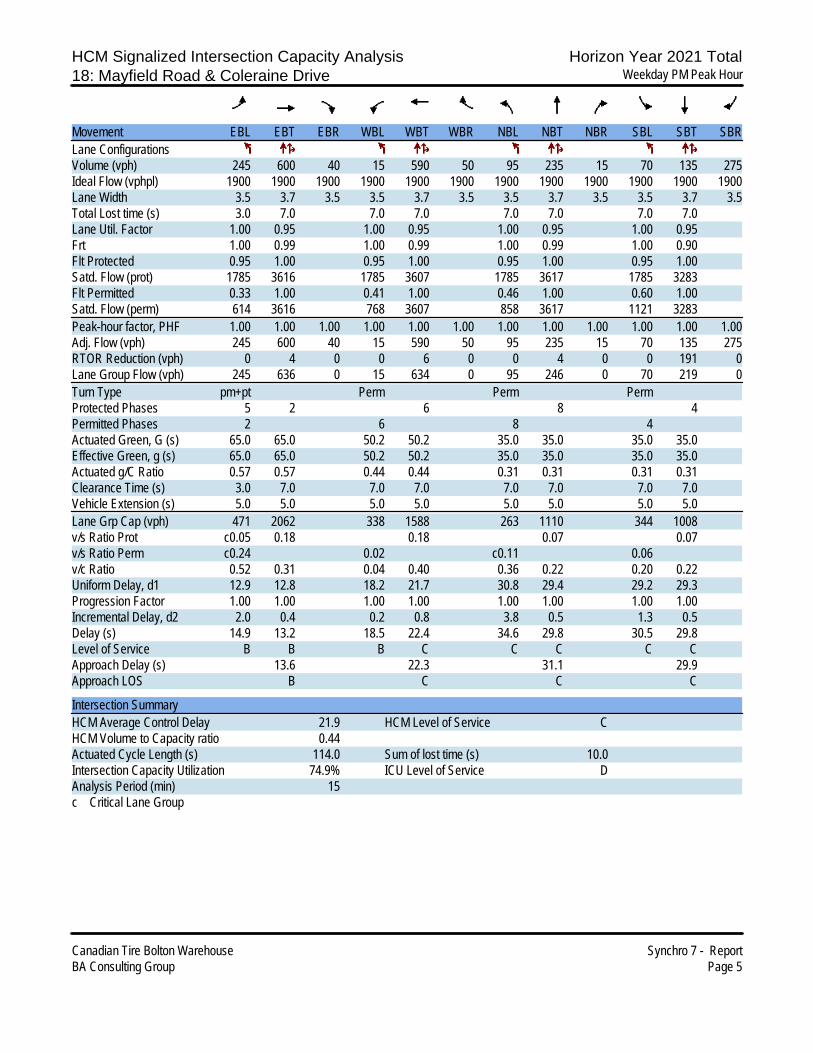
HCM Signalized Intersection Capacity Analysis Horizon Year 2021 Total18: Mayfield Road & Coleraine Drive Weekday PM Peak Hour
Canadian Tire Bolton Warehouse Synchro 7 - ReportBA Consulting Group Page 5
Movement EBL EBT EBR WBL WBT WBR NBL NBT NBR SBL SBT SBRLane ConfigurationsVolume (vph) 245 600 40 15 590 50 95 235 15 70 135 275Ideal Flow (vphpl) 1900 1900 1900 1900 1900 1900 1900 1900 1900 1900 1900 1900Lane Width 3.5 3.7 3.5 3.5 3.7 3.5 3.5 3.7 3.5 3.5 3.7 3.5Total Lost time (s) 3.0 7.0 7.0 7.0 7.0 7.0 7.0 7.0Lane Util. Factor 1.00 0.95 1.00 0.95 1.00 0.95 1.00 0.95Frt 1.00 0.99 1.00 0.99 1.00 0.99 1.00 0.90Flt Protected 0.95 1.00 0.95 1.00 0.95 1.00 0.95 1.00Satd. Flow (prot) 1785 3616 1785 3607 1785 3617 1785 3283Flt Permitted 0.33 1.00 0.41 1.00 0.46 1.00 0.60 1.00Satd. Flow (perm) 614 3616 768 3607 858 3617 1121 3283Peak-hour factor, PHF 1.00 1.00 1.00 1.00 1.00 1.00 1.00 1.00 1.00 1.00 1.00 1.00Adj. Flow (vph) 245 600 40 15 590 50 95 235 15 70 135 275RTOR Reduction (vph) 0 4 0 0 6 0 0 4 0 0 191 0Lane Group Flow (vph) 245 636 0 15 634 0 95 246 0 70 219 0Turn Type pm+pt Perm Perm PermProtected Phases 5 2 6 8 4Permitted Phases 2 6 8 4Actuated Green, G (s) 65.0 65.0 50.2 50.2 35.0 35.0 35.0 35.0Effective Green, g (s) 65.0 65.0 50.2 50.2 35.0 35.0 35.0 35.0Actuated g/C Ratio 0.57 0.57 0.44 0.44 0.31 0.31 0.31 0.31Clearance Time (s) 3.0 7.0 7.0 7.0 7.0 7.0 7.0 7.0Vehicle Extension (s) 5.0 5.0 5.0 5.0 5.0 5.0 5.0 5.0Lane Grp Cap (vph) 471 2062 338 1588 263 1110 344 1008v/s Ratio Prot c0.05 0.18 0.18 0.07 0.07v/s Ratio Perm c0.24 0.02 c0.11 0.06v/c Ratio 0.52 0.31 0.04 0.40 0.36 0.22 0.20 0.22Uniform Delay, d1 12.9 12.8 18.2 21.7 30.8 29.4 29.2 29.3Progression Factor 1.00 1.00 1.00 1.00 1.00 1.00 1.00 1.00Incremental Delay, d2 2.0 0.4 0.2 0.8 3.8 0.5 1.3 0.5Delay (s) 14.9 13.2 18.5 22.4 34.6 29.8 30.5 29.8Level of Service B B B C C C C CApproach Delay (s) 13.6 22.3 31.1 29.9Approach LOS B C C C
Intersection SummaryHCM Average Control Delay 21.9 HCM Level of Service CHCM Volume to Capacity ratio 0.44Actuated Cycle Length (s) 114.0 Sum of lost time (s) 10.0Intersection Capacity Utilization 74.9% ICU Level of Service DAnalysis Period (min) 15c Critical Lane Group

Timing Report, Sorted By Phase Horizon Year 2021 Total18: Mayfield Road & Coleraine Drive Weekday PM Peak Hour
Canadian Tire Bolton Warehouse Synchro 7 - ReportBA Consulting Group Page 6
Phase Number 2 4 5 6 8Movement EBTL SBTL EBL WBTL NBTLLead/Lag Lead LagLead-Lag OptimizeRecall Mode C-Max Max None C-Max MaxMaximum Split (s) 72 42 15 57 42Maximum Split (%) 63.2% 36.8% 13.2% 50.0% 36.8%Minimum Split (s) 33 33 8 33 33Yellow Time (s) 4.6 4.2 3 4.6 4.2All-Red Time (s) 2.4 2.8 0 2.4 2.8Minimum Initial (s) 12 12 5 12 12Vehicle Extension (s) 5 5 5 5 5Minimum Gap (s) 3 3 3 3 3Time Before Reduce (s) 0 0 0 0 0Time To Reduce (s) 0 0 0 0 0Walk Time (s) 5 5 5 5Flash Dont Walk (s) 21 21 21 21Dual Entry Yes Yes No Yes YesInhibit Max Yes Yes Yes Yes YesStart Time (s) 5 77 5 20 77End Time (s) 77 5 20 77 5Yield/Force Off (s) 70 112 17 70 112Yield/Force Off 170(s) 49 91 17 49 91Local Start Time (s) 99 57 99 0 57Local Yield (s) 50 92 111 50 92Local Yield 170(s) 29 71 111 29 71
Intersection SummaryCycle Length 114Control Type Actuated-CoordinatedNatural Cycle 75Offset: 20 (18%), Referenced to phase 2:EBTL and 6:WBTL, Start of Green
Splits and Phases: 18: Mayfield Road & Coleraine Drive
P r o j e c t B o l t o n
APPENDIX F: Col l i s ion Data Analys is Sheets
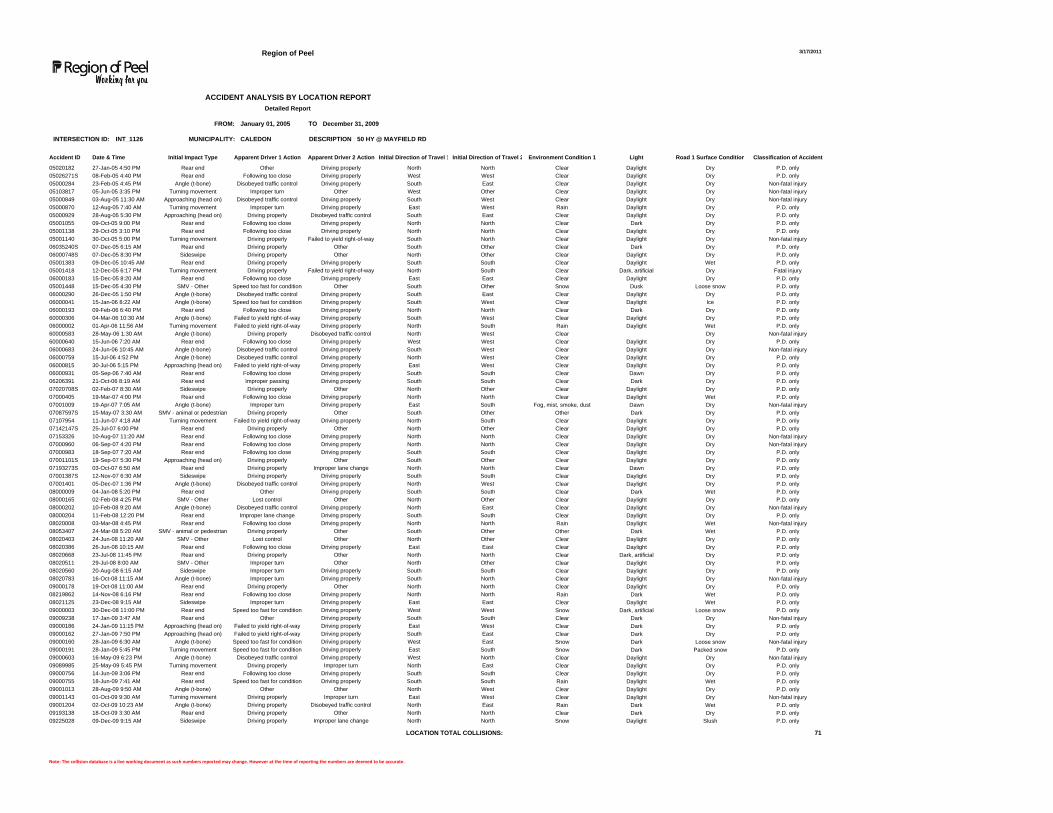
January 01, 2005 TO:
CALEDON
71
Region of Peel
ACCIDENT ANALYSIS BY LOCATION REPORT
Detailed Report
FROM: December 31, 2009
INTERSECTION ID: INT_1126 MUNICIPALITY: DESCRIPTION:
50 HY @ MAYFIELD RD
Accident ID Date & Time Initial Impact Type Apparent Driver 1 Action Apparent Driver 2 Action Initial Direction of Travel 1 Initial Direction of Travel 2
05020182 27-Jan-05 4:50 PM Rear end Other Driving properly North North05026271S 08-Feb-05 4:40 PM Rear end Following too close Driving properly West West05000284 23-Feb-05 4:45 PM Angle (t-bone) Disobeyed traffic control Driving properly South East05103817 05-Jun-05 3:35 PM Turning movement Improper turn Other West Other05000849 03-Aug-05 11:30 AM Approaching (head on) Disobeyed traffic control Driving properly South West05000870 12-Aug-05 7:40 AM Turning movement Improper turn Driving properly East West05000929 28-Aug-05 5:30 PM Approaching (head on) Driving properly Disobeyed traffic control South East05001055 09-Oct-05 9:00 PM Rear end Following too close Driving properly North North05001138 29-Oct-05 3:10 PM Rear end Following too close Driving properly North North05001140 30-Oct-05 5:00 PM Turning movement Driving properly Failed to yield right-of-way South North06035240S 07-Dec-05 6:15 AM Rear end Driving properly Other South Other06000748S 07-Dec-05 8:30 PM Sideswipe Driving properly Other North Other05001383 09-Dec-05 10:45 AM Rear end Driving properly Driving properly South South05001418 12-Dec-05 6:17 PM Turning movement Driving properly Failed to yield right-of-way North South06000183 15-Dec-05 8:20 AM Rear end Following too close Driving properly East East05001448 15-Dec-05 4:30 PM SMV - Other Speed too fast for condition Other South Other06000290 26-Dec-05 1:50 PM Angle (t-bone) Disobeyed traffic control Driving properly South East06000041 15-Jan-06 8:22 AM Angle (t-bone) Speed too fast for condition Driving properly South West06000193 09-Feb-06 6:40 PM Rear end Following too close Driving properly North North60000306 04-Mar-06 10:30 AM Angle (t-bone) Failed to yield right-of-way Driving properly South West06000002 01-Apr-06 11:56 AM Turning movement Failed to yield right-of-way Driving properly North South60000583 28-May-06 1:30 AM Angle (t-bone) Driving properly Disobeyed traffic control North West60000640 15-Jun-06 7:20 AM Rear end Following too close Driving properly West West06000683 24-Jun-06 10:45 AM Angle (t-bone) Disobeyed traffic control Driving properly South West06000759 15-Jul-06 4:52 PM Angle (t-bone) Disobeyed traffic control Driving properly North West06000815 30-Jul-06 5:15 PM Approaching (head on) Failed to yield right-of-way Driving properly East West06000931 05-Sep-06 7:40 AM Rear end Following too close Driving properly South South06206391 21-Oct-06 8:19 AM Rear end Improper passing Driving properly South South07020708S 02-Feb-07 8:30 AM Sideswipe Driving properly Other North Other07000405 19-Mar-07 4:00 PM Rear end Following too close Driving properly North North07001009 19-Apr-07 7:05 AM Angle (t-bone) Improper turn Driving properly East South
Other South Other07087597S 15-May-07 3:30 AM SMV - animal or pedestrian Driving properly07107954 11-Jun-07 4:18 AM Turning movement Failed to yield right-of-way Driving properly North South07142147S 25-Jul-07 6:00 PM Rear end Driving properly Other North Other07153326 10-Aug-07 11:20 AM Rear end Following too close Driving properly North North07000960 06-Sep-07 4:20 PM Rear end Following too close Driving properly North North07000983 18-Sep-07 7:20 AM Rear end Following too close Driving properly South South07001101S 19-Sep-07 5:30 PM Approaching (head on) Driving properly Other South Other07193273S 03-Oct-07 6:50 AM Rear end Driving properly Improper lane change North North07001387S 12-Nov-07 6:30 AM Sideswipe Driving properly Driving properly South South07001401 05-Dec-07 1:36 PM Angle (t-bone) Disobeyed traffic control Driving properly North West08000009 04-Jan-08 5:20 PM Rear end Other Driving properly South South08000165 02-Feb-08 4:25 PM SMV - Other Lost control Other North Other08000202 10-Feb-08 9:20 AM Angle (t-bone) Disobeyed traffic control Driving properly North East08000204 11-Feb-08 12:20 PM Rear end Improper lane change Driving properly South South08020008 03-Mar-08 4:45 PM Rear end Following too close Driving properly North North08053407 24-Mar-08 5:20 AM SMV - animal or pedestrian Driving properly Other South Other08020403 24-Jun-08 11:20 AM SMV - Other Lost control Other North Other08020386 26-Jun-08 10:15 AM Rear end Following too close Driving properly East East08020668 23-Jul-08 11:45 PM Rear end Driving properly Other North North08020511 29-Jul-08 8:00 AM SMV - Other Improper turn Other North Other08020560 20-Aug-08 6:15 AM Sideswipe Improper turn Driving properly South South08020783 16-Oct-08 11:15 AM Angle (t-bone) Improper turn Driving properly South North09000178 19-Oct-08 11:00 AM Rear end Driving properly Other North North08219862 14-Nov-08 6:16 PM Rear end Following too close Driving properly North North08021125 23-Dec-08 9:15 AM Sideswipe Improper turn Driving properly East East09000003 30-Dec-08 11:00 PM Rear end Speed too fast for condition Driving properly West West09009238 17-Jan-09 3:47 AM Rear end Other Driving properly South South09000186 24-Jan-09 11:15 PM Approaching (head on) Failed to yield right-of-way Driving properly East West09000162 27-Jan-09 7:50 PM Approaching (head on) Failed to yield right-of-way Driving properly South East09000160 28-Jan-09 6:30 AM Angle (t-bone) Speed too fast for condition Driving properly West East09000191 28-Jan-09 5:45 PM Turning movement Speed too fast for condition Driving properly East South09000603 16-May-09 6:23 PM Angle (t-bone) Disobeyed traffic control Driving properly West North09089985 25-May-09 5:45 PM Turning movement Driving properly Improper turn North East09000756 14-Jun-09 3:06 PM Rear end Following too close Driving properly South South09000755 18-Jun-09 7:41 AM Rear end Speed too fast for condition Driving properly South South09001013 28-Aug-09 9:50 AM Angle (t-bone) Other Other North West09001143 01-Oct-09 9:30 AM Turning movement Driving properly Improper turn East West09001204 02-Oct-09 10:23 AM Angle (t-bone) Driving properly09193138 18-Oct-09 3:30 AM Rear end Driving properly
North
Disobeyed traffic control North EastOther North North
Sideswipe Driving properly Improper lane change North
LOCATION TOTAL COLLISIONS:
Note: The collision database is a live working document as such numbers reported may change. However at the time of reporting the numbers are deemed to be accurate.
09225028 09-Dec-09 9:15 AM
3/17/2011
Classification of Accident
Clear Daylight Dry P.D. only
Environment Condition 1 Light Road 1 Surface Condition
Dry P.D. onlyClear Daylight Dry Non-fatal injuryClear Daylight
Dry Non-fatal injuryClear Daylight Dry Non-fatal injuryClear Daylight
Dry P.D. onlyClear Daylight Dry P.D. onlyRain Daylight
Dry P.D. onlyClear Daylight Dry P.D. onlyClear Dark
Dry Non-fatal injuryClear Dark Dry P.D. onlyClear Daylight
Dry P.D. onlyClear Daylight Wet P.D. onlyClear Daylight
Dry Fatal injuryClear Daylight Dry P.D. onlyClear Dark, artificial
Loose snow P.D. onlyClear Daylight Dry P.D. onlySnow Dusk
Ice P.D. onlyClear Dark Dry P.D. onlyClear Daylight
Dry P.D. onlyRain Daylight Wet P.D. onlyClear Daylight
Non-fatal injuryClear Daylight Dry P.D. onlyClear Dry
Dry Non-fatal injuryClear Daylight Dry P.D. onlyClear Daylight
Dry P.D. onlyClear Dawn Dry P.D. onlyClear Daylight
Dry P.D. onlyClear Daylight Dry P.D. onlyClear Dark
Wet P.D. onlyFog, mist, smoke, dust Dawn Dry Non-fatal injury
Clear Daylight
Dry P.D. onlyOther DarkDry P.D. only
Clear Daylight Dry P.D. onlyClear Daylight
Dry Non-fatal injuryClear Daylight Dry Non-fatal injuryClear Daylight
Dry P.D. onlyClear Daylight Dry P.D. onlyClear Daylight
Dry P.D. onlyClear Daylight Dry P.D. onlyClear Dawn
Dry P.D. onlyClear Dark Wet P.D. onlyClear Daylight
Dry P.D. onlyClear Daylight Dry Non-fatal injuryClear Daylight
Dry P.D. onlyRain Daylight Wet Non-fatal injuryClear Daylight
Wet P.D. onlyClear Daylight Dry P.D. onlyOther Dark
Dry P.D. onlyClear Dark, artificial Dry P.D. onlyClear Daylight
Dry P.D. onlyClear Daylight Dry P.D. onlyClear Daylight
Dry Non-fatal injuryClear Daylight Dry P.D. onlyClear Daylight
Wet P.D. onlyClear Daylight Wet P.D. onlyRain Dark
Loose snow P.D. onlyClear Dark Dry Non-fatal injurySnow Dark, artificial
Dry P.D. onlyClear Dark Dry P.D. onlyClear Dark
Loose snow Non-fatal injurySnow Dark Packed snow P.D. onlySnow Dark
Dry Non-fatal injuryClear Daylight Dry P.D. onlyClear Daylight
Dry P.D. onlyRain Daylight Wet P.D. onlyClear Daylight
Dry P.D. onlyClear Daylight Dry Non-fatal injuryClear Daylight
Wet P.D. onlyClear Dark Dry P.D. onlyRain Dark
Snow Daylight Slush P.D. only

January 01, 2005 TO:
BRAMPTON
4
Region of Peel
ACCIDENT ANALYSIS BY LOCATION REPORT
Detailed Report
FROM: December 31, 2009
INTERSECTION ID: INT_1173 MUNICIPALITY: DESCRIPTION: CLARKWAY DR @ MAYFIELD RD
Accident ID Date & Time Initial Impact Type Apparent Driver 1 Action Apparent Driver 2 Action Initial Direction of Travel 1 Initial Direction of Travel 2
05000245 11-Feb-05 7:50 AM Rear end Driving properly Other West West
05000571 18-May-05 5:00 PM Angle (t-bone) Other Driving properly East North
05000831 31-Jul-05 2:00 PM Angle (t-bone) Failed to yield right-of-way Driving properly North East
North East
LOCATION TOTAL COLLISIONS:
09000567 05-May-09 4:30 PM Angle (t-bone) Failed to yield right-of-way
Note: The collision database is a live working document as such numbers reported may change. However at the time of reporting the numbers are deemed to be accurate.
3/21/2011
Driving properly
Environment Condition 1 Light Road 1 Surface Condition Classification of Accident
Dry Non-fatal injury
Clear Daylight Dry P.D. only
Clear Daylight
Dry P.D. only
Clear Daylight Dry P.D. only
Clear Daylight

January 01, 2005 TO:
BRAMPTON
7
Region of Peel
ACCIDENT ANALYSIS BY LOCATION REPORT
Detailed Report
FROM: December 31, 2009
INTERSECTION ID: INT_1151 MUNICIPALITY: DESCRIPTION: COLERAINE DR W @ MAYFIELD RD
Accident ID Date & Time Initial Impact Type Apparent Driver 1 Action Apparent Driver 2 Action Initial Direction of Travel 1 Initial Direction of Travel 2
06001046 13-Oct-06 5:30 PM Rear end Following too close Driving properly East East08000068 18-Jan-08 8:00 AM Rear end Other Driving properly East East08020289 25-May-08 7:10 PM SMV - Other Lost control Other East Other
Other08021117 17-Dec-08 8:15 AM Rear end Speed too fast for condition Driving properly West West08020328 19-Jun-08 7:19 PM
SMV - Other Lost control
Other WestSMV - Other Lost control
Other10000115 28-Oct-09 5:30 PM Rear end Other Driving properly West West09000735 23-Jun-09 7:50 AM
LOCATION TOTAL COLLISIONS:
Note: The collision database is a live working document as such numbers reported may change. However at the time of reporting the numbers are deemed to be accurate.
Other East
3/21/2011
Classification of Accident
Clear Daylight Dry P.D. only
Environment Condition 1 Light Road 1 Surface Condition
Dry P.D. onlyClear Daylight Loose sand or gravel Non-fatal injuryClear Daylight
Loose sand or gravel Non-fatal injurySnow Daylight Loose snow P.D. onlyClear Daylight
Dry P.D. onlyClear Dusk Dry P.D. onlyClear Daylight
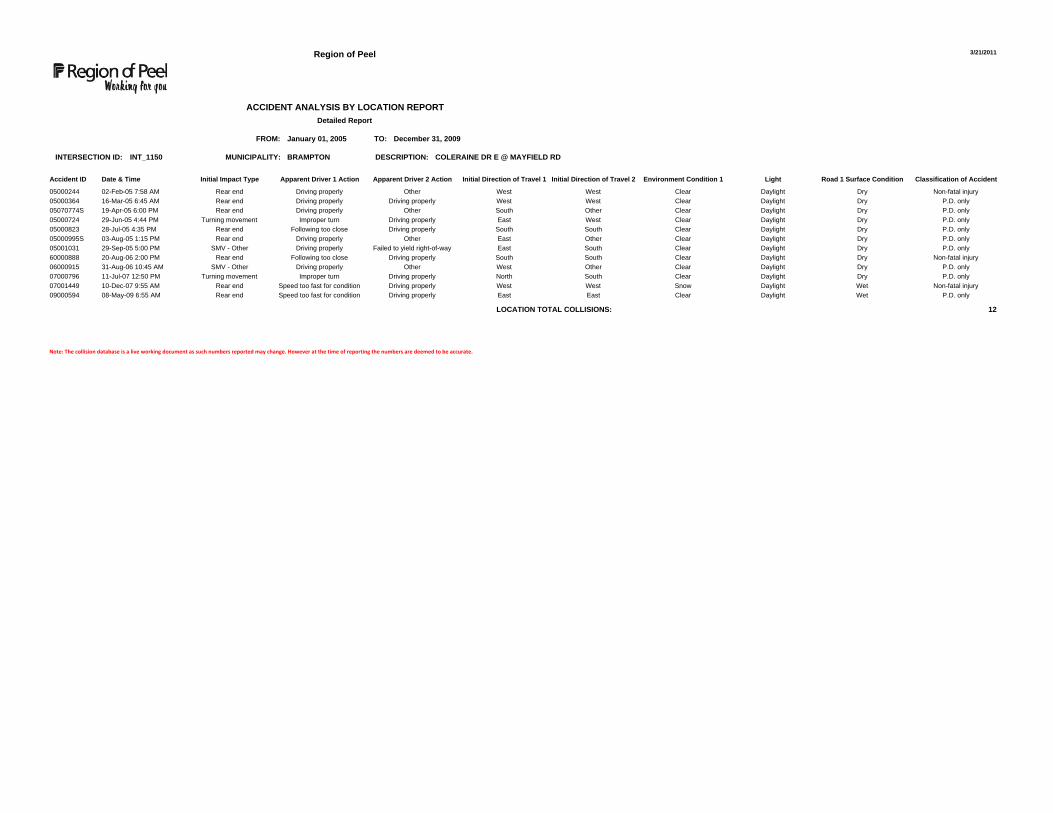
January 01, 2005 TO:
BRAMPTON
12
Region of Peel
ACCIDENT ANALYSIS BY LOCATION REPORT
Detailed Report
FROM: December 31, 2009
INTERSECTION ID: INT_1150 MUNICIPALITY: DESCRIPTION: COLERAINE DR E @ MAYFIELD RD
Accident ID Date & Time Initial Impact Type Apparent Driver 1 Action Apparent Driver 2 Action Initial Direction of Travel 1 Initial Direction of Travel 2
05000244 02-Feb-05 7:58 AM Rear end Driving properly Other West West
05000364 16-Mar-05 6:45 AM Rear end Driving properly Driving properly West West
05070774S 19-Apr-05 6:00 PM Rear end Driving properly Other South Other
05000724 29-Jun-05 4:44 PM Turning movement Improper turn Driving properly East West
05000823 28-Jul-05 4:35 PM Rear end Following too close Driving properly South South
05000995S 03-Aug-05 1:15 PM Rear end Driving properly Other East Other
05001031 29-Sep-05 5:00 PM SMV - Other Driving properly Failed to yield right-of-way East South
60000888 20-Aug-06 2:00 PM Rear end Following too close Driving properly South South
06000915 31-Aug-06 10:45 AM SMV - Other Driving properly Other West Other
07000796 11-Jul-07 12:50 PM Turning movement Improper turn Driving properly North South
07001449 10-Dec-07 9:55 AM Rear end Speed too fast for condition Driving properly West West
East East
LOCATION TOTAL COLLISIONS:
09000594 08-May-09 6:55 AM Rear end Speed too fast for condition
Note: The collision database is a live working document as such numbers reported may change. However at the time of reporting the numbers are deemed to be accurate.
3/21/2011
Driving properly
Environment Condition 1 Light Road 1 Surface Condition Classification of Accident
Dry Non-fatal injury
Clear Daylight Dry P.D. only
Clear Daylight
Dry P.D. only
Clear Daylight Dry P.D. only
Clear Daylight
Dry P.D. only
Clear Daylight Dry P.D. only
Clear Daylight
Dry P.D. only
Clear Daylight Dry Non-fatal injury
Clear Daylight
Dry P.D. only
Clear Daylight Dry P.D. only
Clear Daylight
Wet Non-fatal injury
Clear Daylight Wet P.D. only
Snow Daylight
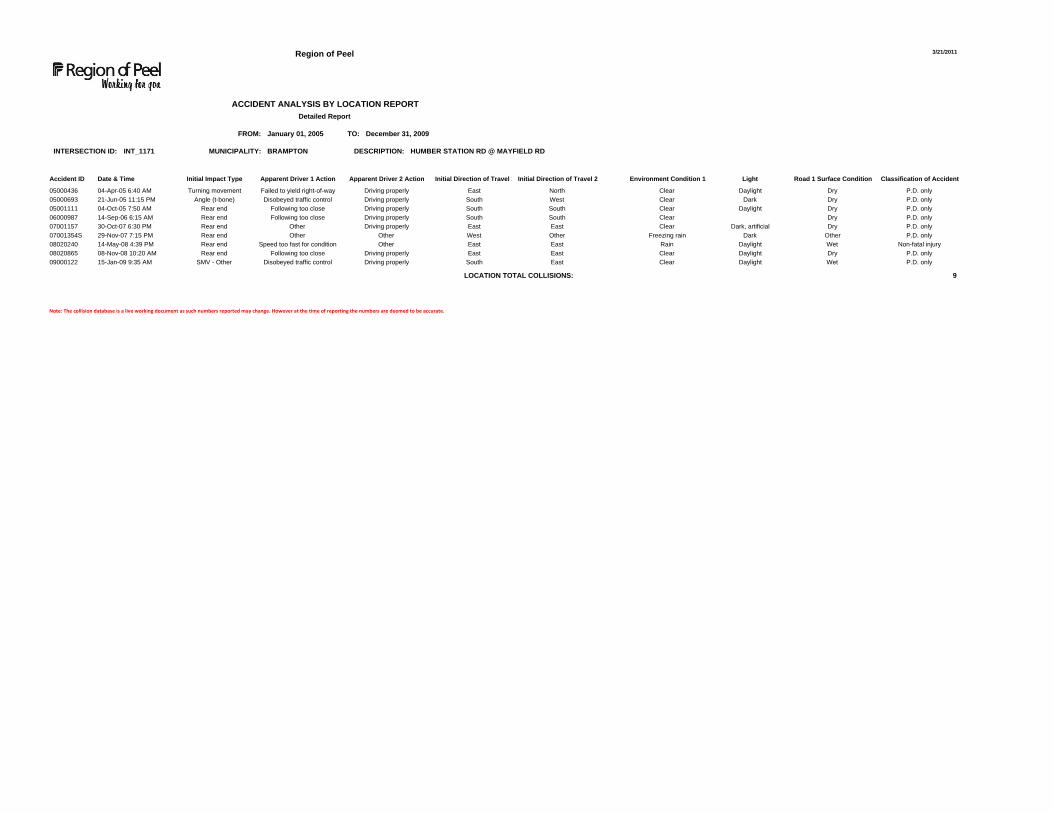
January 01, 2005 TO:
BRAMPTON
9
Note: The collision database is a live working document as such numbers reported may change. However at the time of reporting the numbers are deemed to be accurate.
Region of Peel
ACCIDENT ANALYSIS BY LOCATION REPORT
Detailed Report
FROM: December 31, 2009
INTERSECTION ID: INT_1171 MUNICIPALITY: DESCRIPTION: HUMBER STATION RD @ MAYFIELD RD
Accident ID Date & Time Initial Impact Type Apparent Driver 1 Action Apparent Driver 2 Action Initial Direction of Travel 1 Initial Direction of Travel 2
05000436 04-Apr-05 6:40 AM Turning movement Failed to yield right-of-way Driving properly East North
05000693 21-Jun-05 11:15 PM Angle (t-bone) Disobeyed traffic control Driving properly South West
05001111 04-Oct-05 7:50 AM Rear end Following too close Driving properly South South
06000987 14-Sep-06 6:15 AM Rear end Following too close Driving properly South South
07001157 30-Oct-07 6:30 PM Rear end Other Driving properly East East
Other
08020240 14-May-08 4:39 PM Rear end Speed too fast for condition Other East East
07001354S 29-Nov-07 7:15 PM
Rear end Following too close
Other WestRear end Other
East
09000122 15-Jan-09 9:35 AM SMV - Other Disobeyed traffic control Driving properly South East
08020865 08-Nov-08 10:20 AM
LOCATION TOTAL COLLISIONS:
Driving properly East
3/21/2011
Classification of AccidentEnvironment Condition 1 Light Road 1 Surface Condition
Clear Daylight Dry P.D. only
Dry P.D. only
Clear Daylight Dry P.D. only
Clear Dark
P.D. only
Clear Dark, artificial Dry P.D. only
Clear Dry
Other P.D. only
Rain Daylight Wet Non-fatal injury
Freezing rain Dark
Dry P.D. only
Clear Daylight Wet P.D. only
Clear Daylight

January 01, 2005 TO:
CALEDON
33
Region of Peel
ACCIDENT ANALYSIS BY LOCATION REPORTDetailed Report
FROM: December 31, 2009
INTERSECTION ID: INT_969 MUNICIPALITY: DESCRIPTION: 50 HY @ HEALEY RD
Accident ID Date & Time Initial Impact Type Apparent Driver 1 Action Apparent Driver 2 Action Initial Direction of Travel 1 Initial Direction of Travel 2
05000196 30-Jan-05 10:15 AM Rear end Driving properly Driving properly North North05000499 20-Apr-05 4:15 PM Rear end Failed to yield right-of-way Driving properly South South05000655 13-Jun-05 8:30 AM Rear end Other Driving properly South South05000774 13-Jul-05 3:10 PM Turning movement Disobeyed traffic control Improper turn South North06000090 23-Jan-06 8:58 AM Rear end Following too close Driving properly South South60000304 03-Mar-06 11:35 AM Rear end Other Driving properly North North06000322 09-Mar-06 1:00 PM Rear end Following too close Driving properly South South63000057 19-Mar-06 5:05 PM Turning movement Disobeyed traffic control Driving properly North East60001294 04-Dec-06 5:30 PM Rear end Following too close Driving properly South South06001294 04-Dec-06 5:30 PM Rear end Following too close Driving properly South South07000334S 04-Feb-07 1:00 PM Rear end Driving properly Other South Other07000772S 13-Jun-07 8:30 AM Rear end Driving properly Driving properly North North07000886 07-Aug-07 2:20 PM Turning movement Failed to yield right-of-way Driving properly East West07001364 23-Nov-07 7:15 PM Turning movement Driving properly Failed to yield right-of-way South East07001365 28-Nov-07 8:33 AM Rear end Driving properly Driving properly South South07001540 20-Dec-07 2:04 PM Turning movement Failed to yield right-of-way Driving properly South North09000038 06-Jan-08 6:00 PM Rear end Following too close Driving properly North North09000012 07-Jan-08 12:30 PM Rear end Following too close Driving properly North North08080234 12-Feb-08 8:40 AM Rear end Following too close Driving properly South South08000315 20-Feb-08 4:50 AM Turning movement Failed to yield right-of-way Driving properly East South08000264 23-Feb-08 10:40 PM Rear end Other Driving properly South South08020352 21-Jun-08 5:15 PM Turning movement Disobeyed traffic control Driving properly North West08020364 24-Jun-08 9:10 AM SMV - Other Improper turn Other East Other08020447 12-Jul-08 10:01 PM Rear end Improper passing Driving properly South South08020852 16-Oct-08 11:25 AM Rear end Driving properly Other South South08020883 15-Nov-08 12:45 PM Rear end Following too close Driving properly South South08020895 17-Nov-08 8:00 PM Angle (t-bone) Lost control Other South Other08020947 26-Nov-08 7:40 AM Rear end Driving properly Other South South09000339 25-Feb-09 11:35 AM Rear end Exceeding speed limit Driving properly South South09000390 14-Mar-09 2:45 PM Rear end Following too close Driving properly North North09000461 11-Apr-09 10:40 AM Rear end Lost control Driving properly South South
Driving properly Other North09000869 26-Jul-09 3:30 PM Rear end OtherNorth North
LOCATION TOTAL COLLISIONS:
10000041 24-Dec-09 11:00 AM Rear end Failed to yield right-of-way
Note: The collision database is a live working document as such numbers reported may change. However at the time of reporting the numbers are deemed to be accurate.
3/18/2011
Failed to yield right-of-way
Environment Condition 1 Light Road 1 Surface Condition Classification of Accident
Other P.D. onlyClear Daylight Wet P.D. onlyOther Daylight
Dry Non-fatal injuryClear Daylight Dry Non-fatal injuryClear Daylight
Dry Non-fatal injuryClear Daylight Dry P.D. onlyClear Daylight
Dry P.D. onlyClear Daylight Dry P.D. onlyClear Daylight
Dry P.D. onlyClear Dark Dry P.D. onlyClear Dark
Dry P.D. onlyClear Daylight Dry P.D. onlyClear Daylight
Dry P.D. onlySnow Dark Loose snow P.D. onlyClear Daylight
Ice P.D. onlyClear Daylight Dry P.D. onlyClear Daylight
Dry P.D. onlyClear Daylight Wet Non-fatal injuryClear Dusk, artificial
Wet P.D. onlyClear Dawn Dry P.D. onlyClear Daylight
Dry Non-fatal injuryClear Daylight Dry P.D. onlyClear Dark
Dry P.D. onlyClear Dark Dry Non-fatal injuryClear Daylight
Dry P.D. onlyRain Daylight Wet P.D. onlyClear Daylight
Ice P.D. onlyClear Daylight Wet P.D. onlySnow Dark
Dry P.D. onlyClear Daylight Dry P.D. onlyClear Daylight
Dry P.D. onlyRain Daylight Wet P.D. onlyClear Daylight
Clear Daylight Dry P.D. only