bolton key centre analysis 1 this powerpoint presentation has been created to accompany gmtu report...
TRANSCRIPT
1Bolton Key Centre Analysis
• This PowerPoint presentation has been created to accompany GMTU Report 974 – GMATS Bolton Key Centre report
• Whereas report 974 presents detailed tabulations, this presentation has been designed to provide a summary of the main aspects of the data
GMATS Surveys 2002
Report 974P - Bolton Key Centre
2Bolton Key Centre Analysis
• The presentation has been designed so that it can be used independently of GMTU Report 974 for those who want an overview of the traffic movements around Bolton but do not wish to see the detailed tabulations
• GMTU Reports 974 & 974P are part of a series of reports presenting the data from the 2002 GMATS surveys
GMATS Surveys 2002
Report 947P – Bolton Key Centre
3Bolton Key Centre Analysis
• Travellers leaving Bolton Key Centre by car & bus were asked about their journeys as they crossed a cordon around the centre
• Rail passengers boarding at Bolton station were also interviewed
• This presentation gives an overview of the findings from those surveys
• It considers first people who had visited the Centre, then those travelling through
GMATS Surveys 2002Bolton Key Centre
4Bolton Key Centre Analysis
5Bolton Key Centre Analysis
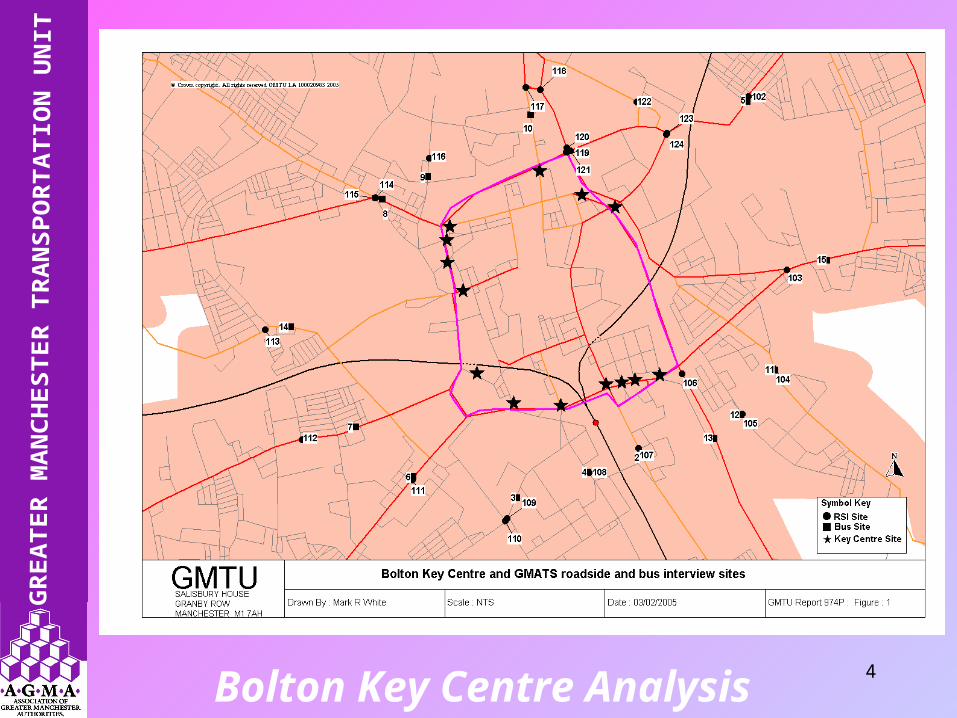
• Note that the GMATS survey points lie outside the ring road. The reason for this was to maximise the usefulness of the data, particularly in developing traffic models
Bolton Key Centre Definition
6Bolton Key Centre Analysis
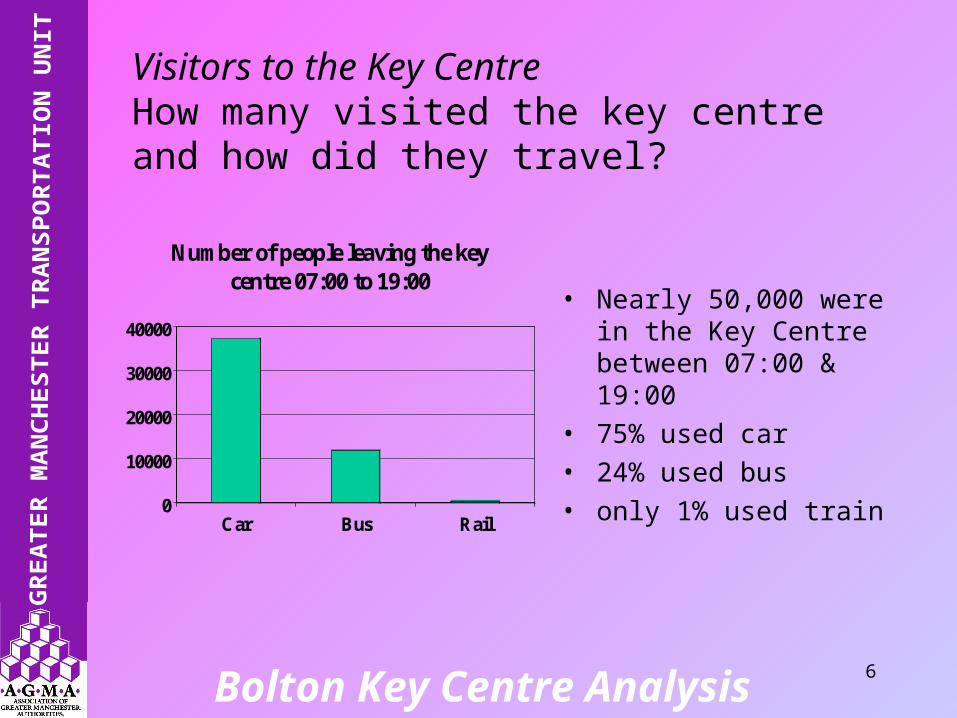
• Nearly 50,000 were in the Key Centre between 07:00 & 19:00
• 75% used car• 24% used bus • only 1% used train
0
10000
20000
30000
40000
Car Bus Rail
Number of people leaving the key centre 07:00 to 19:00
Visitors to the Key CentreHow many visited the key centre and how did they travel?
7Bolton Key Centre Analysis
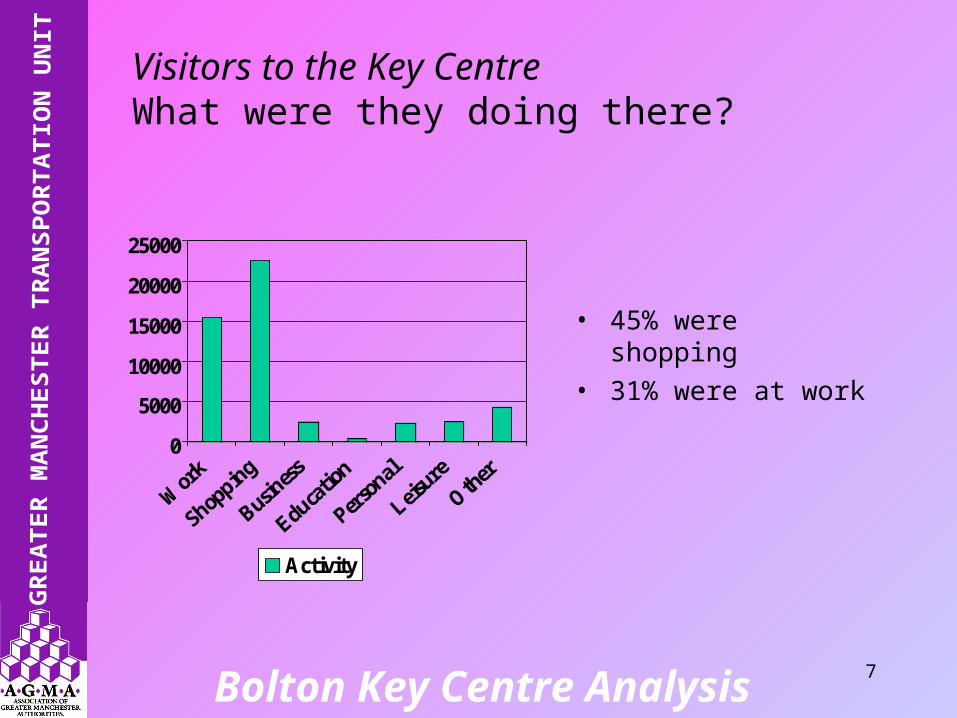
• 45% were shopping• 31% were at work
0
5000
10000
15000
20000
25000
Activity
Visitors to the Key CentreWhat were they doing there?
8Bolton Key Centre Analysis
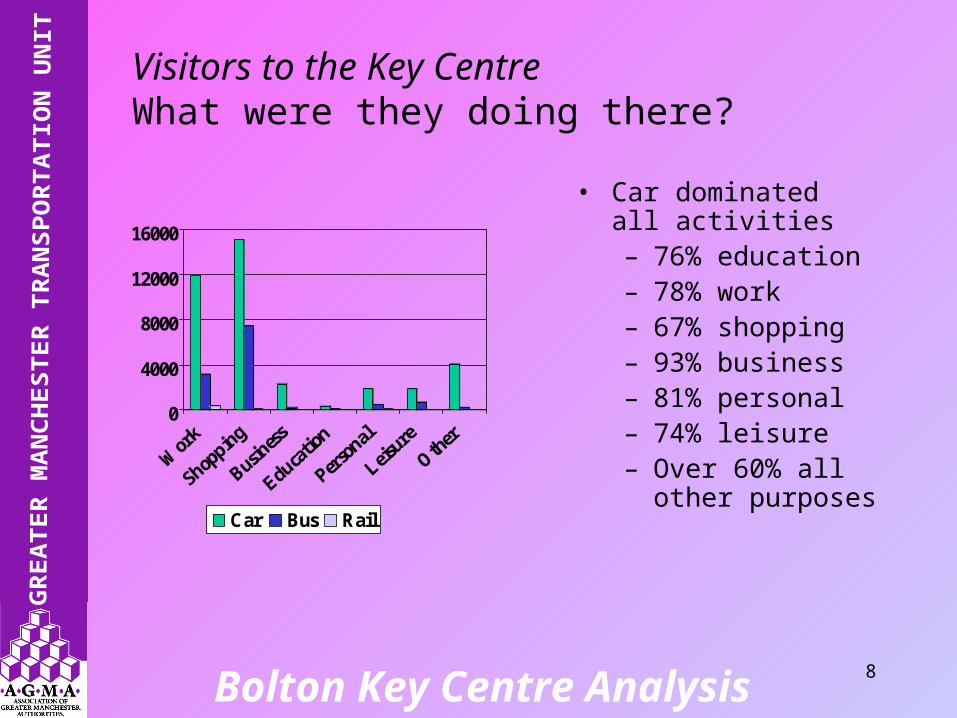
• Car dominated all activities– 76% education– 78% work– 67% shopping– 93% business– 81% personal– 74% leisure– Over 60% all other
purposes
0
4000
8000
12000
16000
Car Bus Rail
Visitors to the Key CentreWhat were they doing there?
9Bolton Key Centre Analysis
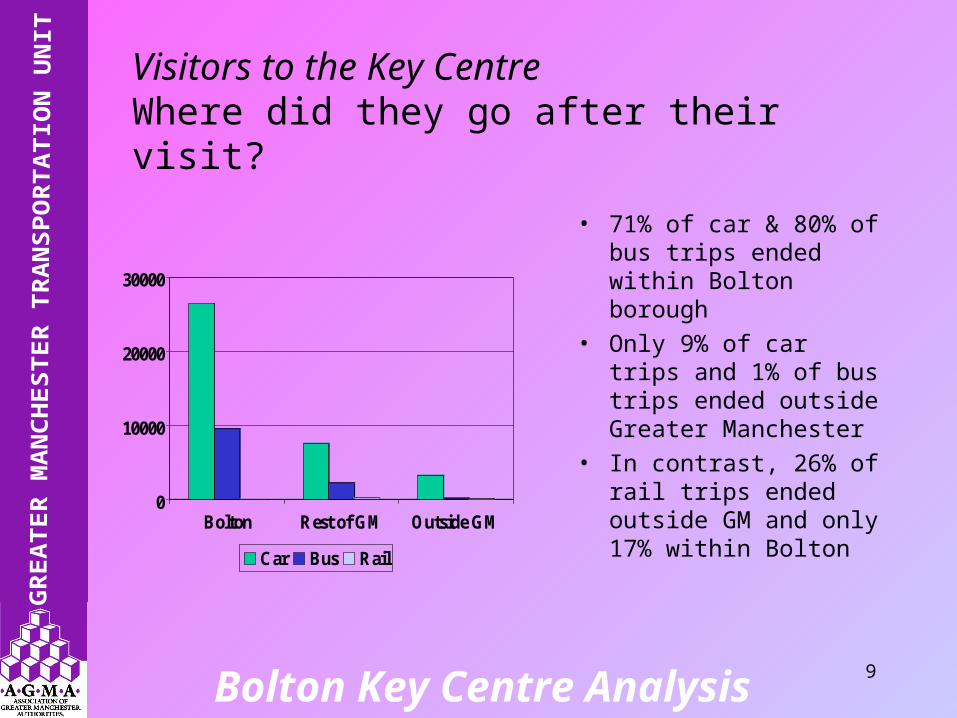
• 71% of car & 80% of bus trips ended within Bolton borough
• Only 9% of car trips and 1% of bus trips ended outside Greater Manchester
• In contrast, 26% of rail trips ended outside GM and only 17% within Bolton
0
10000
20000
30000
Bolton Rest of GM Outside GM
Car Bus Rail
Visitors to the Key CentreWhere did they go after their visit?
10Bolton Key Centre Analysis
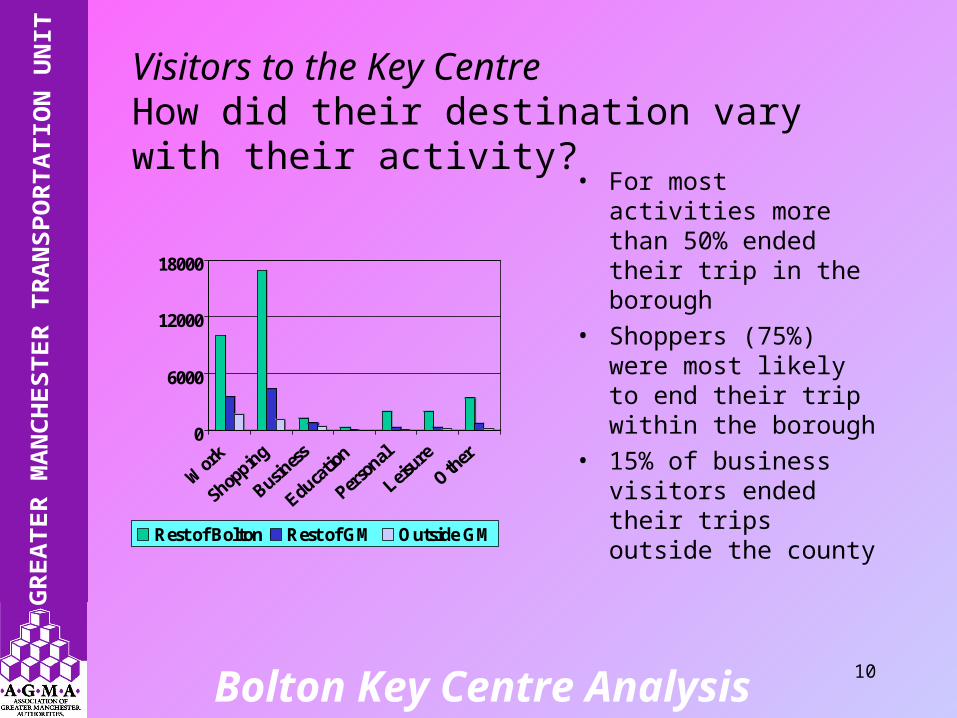
• For most activities more than 50% ended their trip in the borough
• Shoppers (75%) were most likely to end their trip within the borough
• 15% of business visitors ended their trips outside the county
0
6000
12000
18000
Rest of Bolton Rest of GM Outside GM
Visitors to the Key CentreHow did their destination vary with their activity?
11Bolton Key Centre Analysis
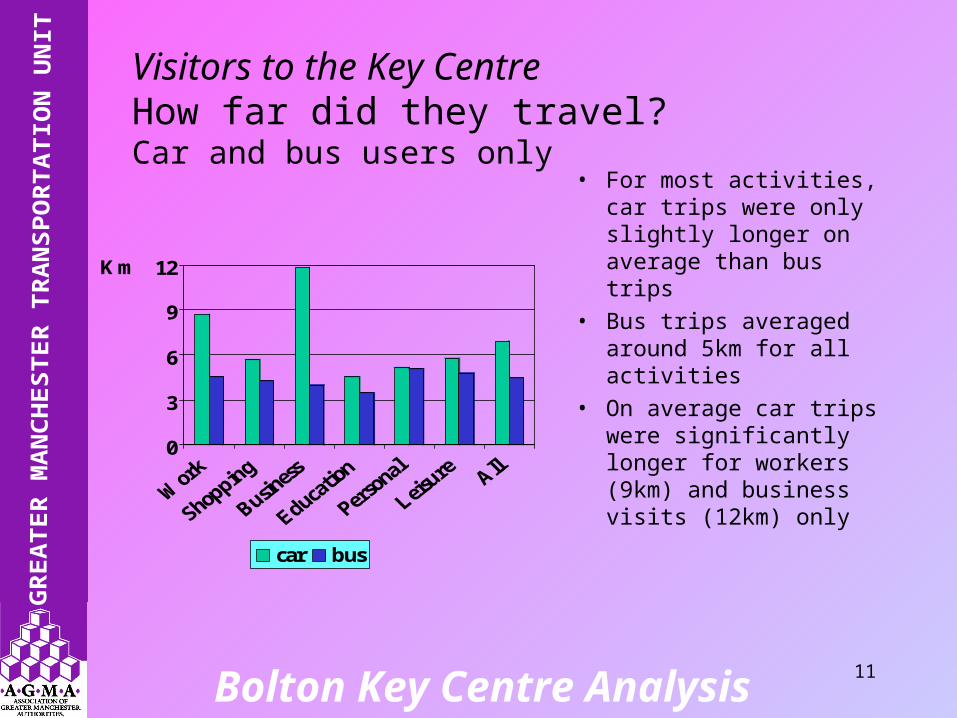
• For most activities, car trips were only slightly longer on average than bus trips
• Bus trips averaged around 5km for all activities
• On average car trips were significantly longer for workers (9km) and business visits (12km) only
0
3
6
9
12Km
car bus
Visitors to the Key CentreHow far did they travel?Car and bus users only
12Bolton Key Centre Analysis
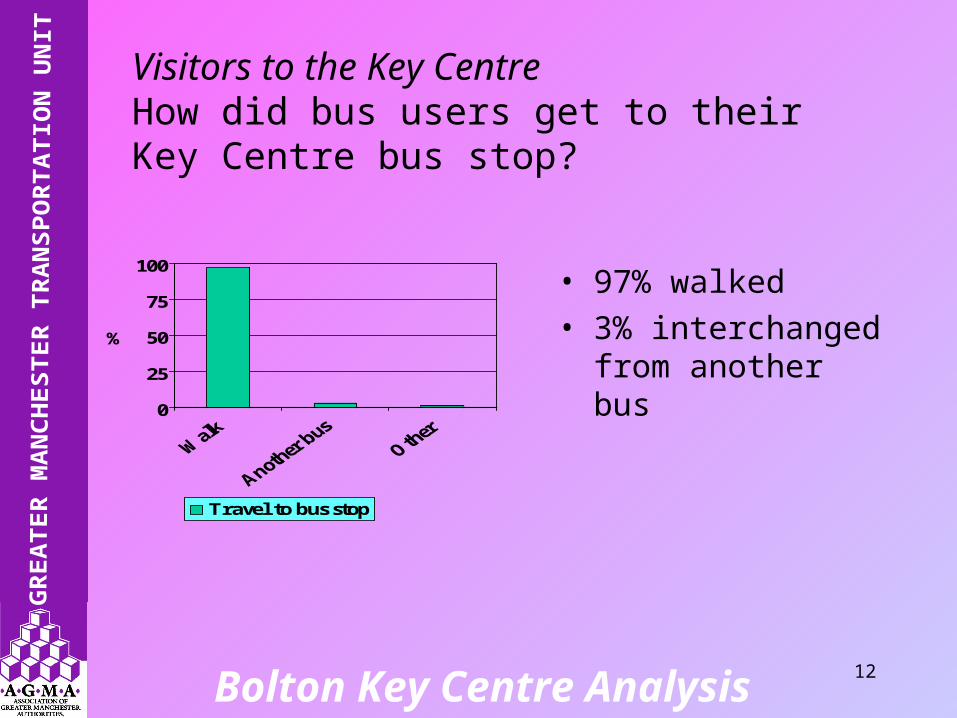
• 97% walked• 3% interchanged
from another bus0
25
50
75
100
%
Travel to bus stop
Visitors to the Key CentreHow did bus users get to their Key Centre bus stop?
13Bolton Key Centre Analysis
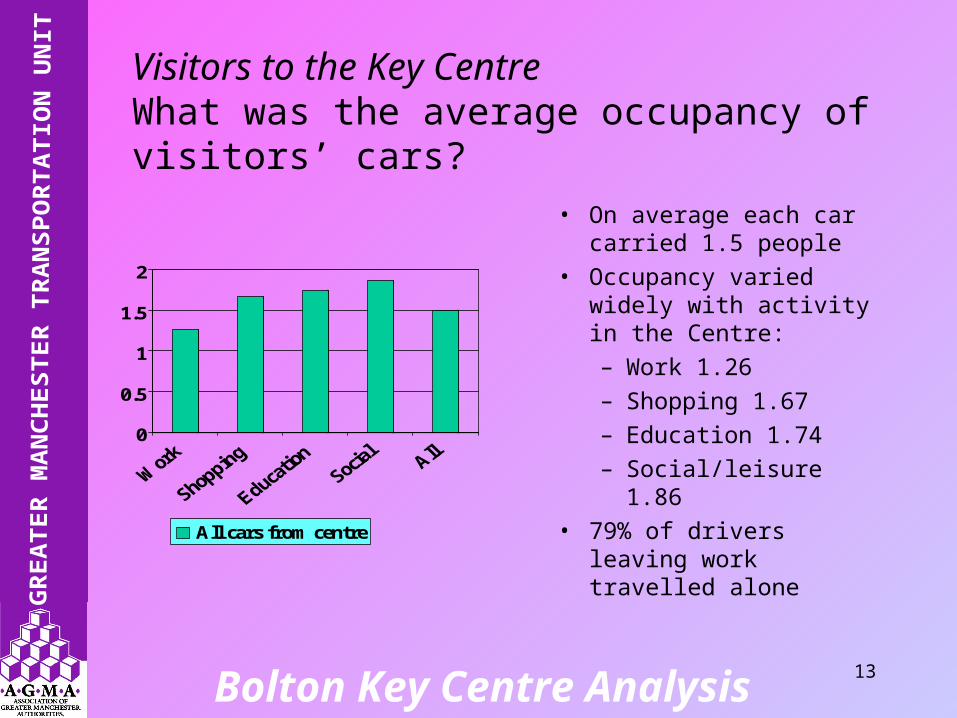
• On average each car carried 1.5 people
• Occupancy varied widely with activity in the Centre:– Work 1.26– Shopping 1.67– Education 1.74– Social/leisure 1.86
• 79% of drivers leaving work travelled alone
0
0.5
1
1.5
2
All cars from centre
Visitors to the Key CentreWhat was the average occupancy of visitors’ cars?

14Bolton Key Centre Analysis
• For all activities in the centre more people parked off-street than on-street
• Only 17% parked on-street
• 86% of shoppers and workers parked off-street
0
2000
4000
6000
8000
on-street off-street
Visitors to the Key CentreWhere did they park?
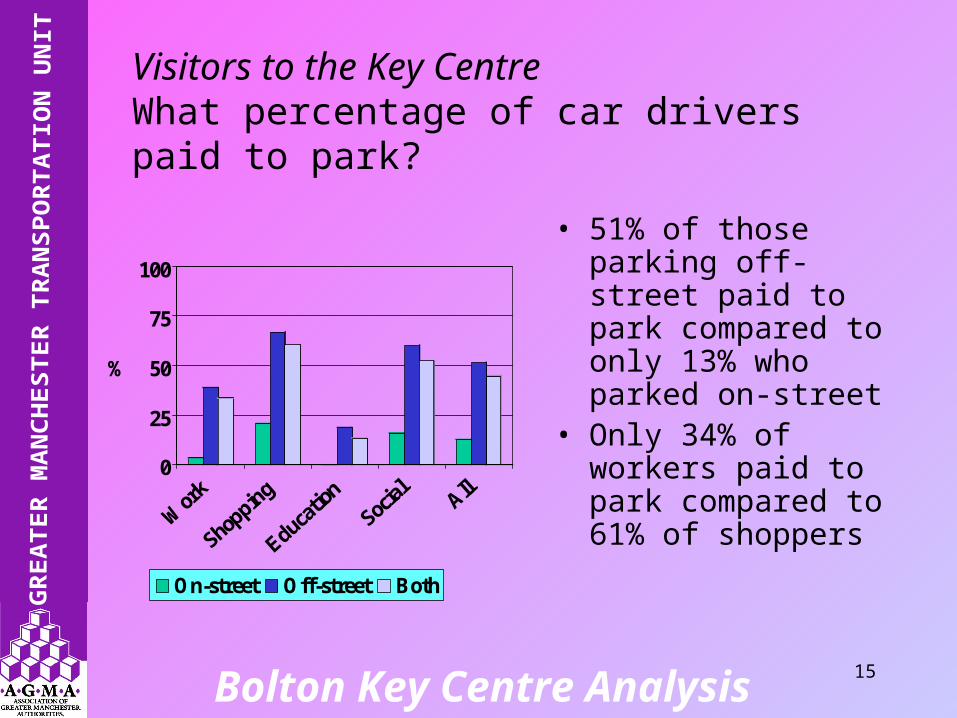
15Bolton Key Centre Analysis
• 51% of those parking off-street paid to park compared to only 13% who parked on-street
• Only 34% of workers paid to park compared to 61% of shoppers
0
25
50
75
100
%
On-street Off-street Both
Visitors to the Key CentreWhat percentage of car drivers paid to park?
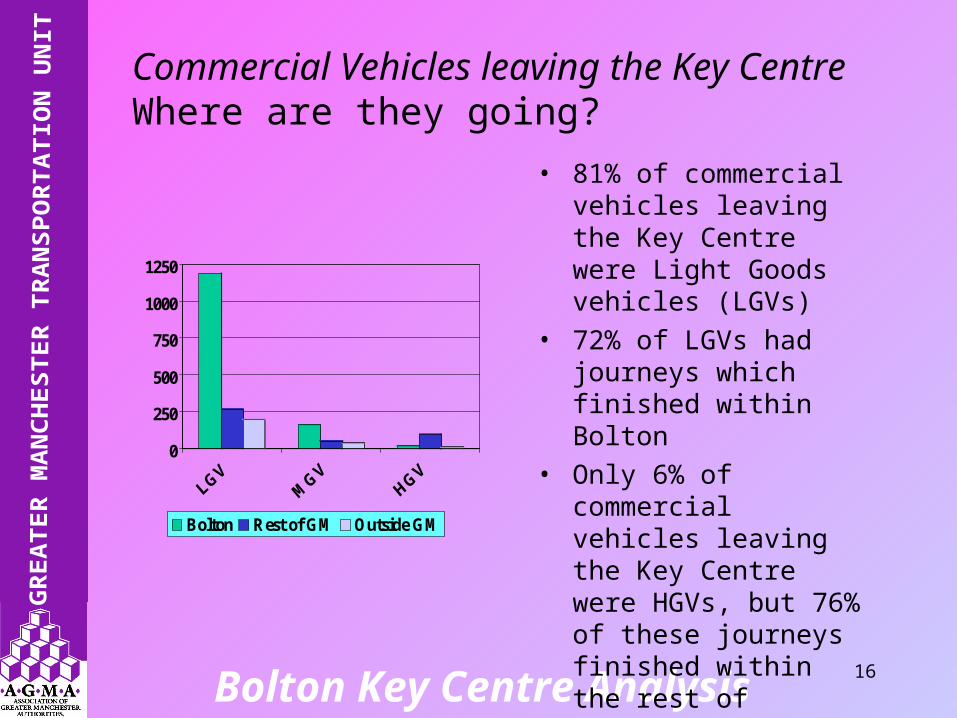
16Bolton Key Centre Analysis
• 81% of commercial vehicles leaving the Key Centre were Light Goods vehicles (LGVs)
• 72% of LGVs had journeys which finished within Bolton
• Only 6% of commercial vehicles leaving the Key Centre were HGVs, but 76% of these journeys finished within the rest of Greater Manchester
0
250
500
750
1000
1250
Bolton Rest of GM Outside GM
Commercial Vehicles leaving the Key CentreWhere are they going?
17Bolton Key Centre Analysis
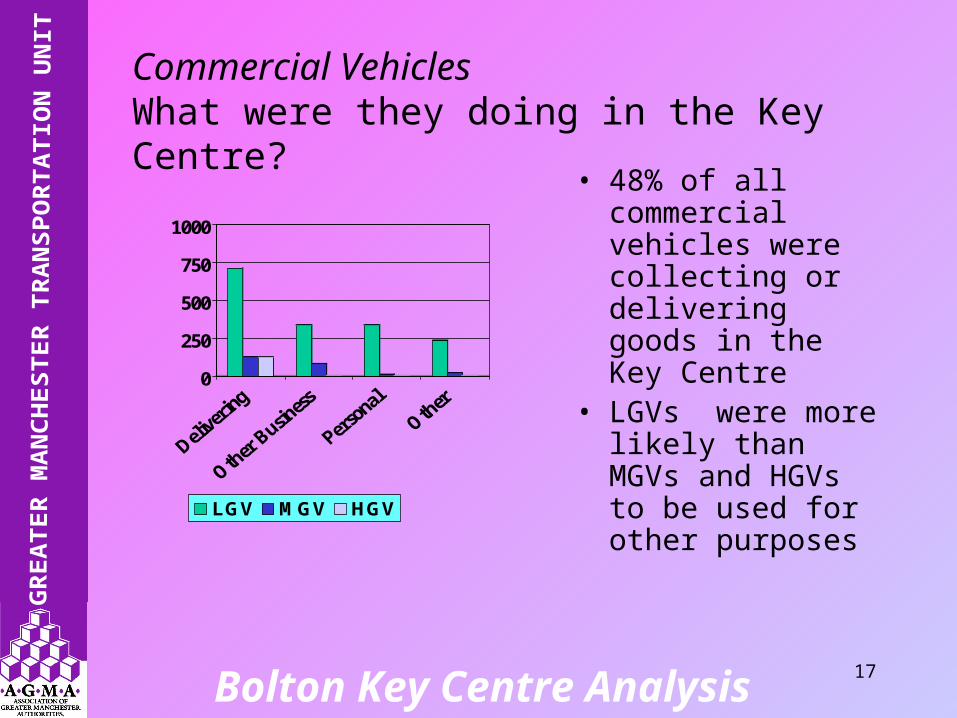
• 48% of all commercial vehicles were collecting or delivering goods in the Key Centre
• LGVs were more likely than MGVs and HGVs to be used for other purposes
0
250
500
750
1000
LGV MGV HGV
Commercial VehiclesWhat were they doing in the Key Centre?
18Bolton Key Centre Analysis
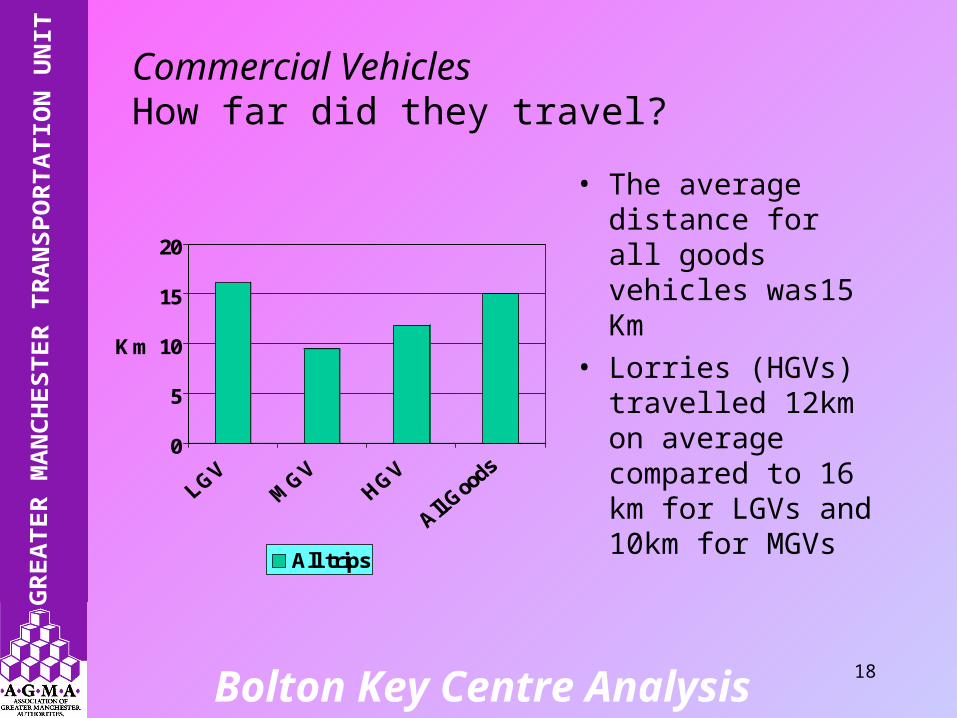
• The average distance for all goods vehicles was15 Km
• Lorries (HGVs) travelled 12km on average compared to 16 km for LGVs and 10km for MGVs
0
5
10
15
20
Km
All trips
Commercial VehiclesHow far did they travel?
19Bolton Key Centre Analysis
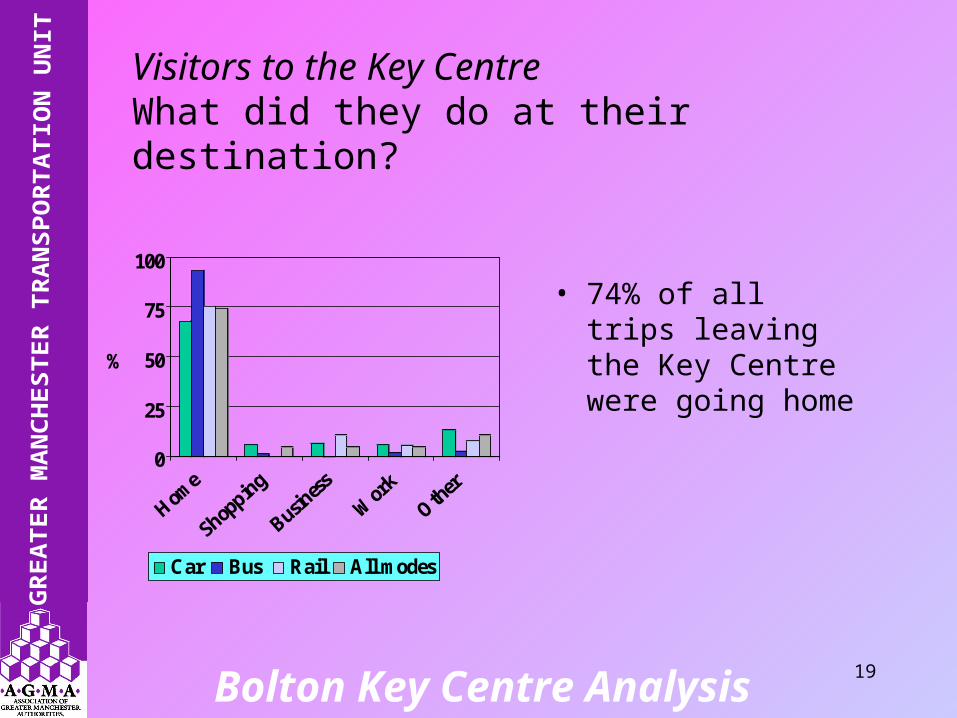
• 74% of all trips leaving the Key Centre were going home
0
25
50
75
100
%
Car Bus Rail All modes
Visitors to the Key CentreWhat did they do at their destination?
20Bolton Key Centre Analysis
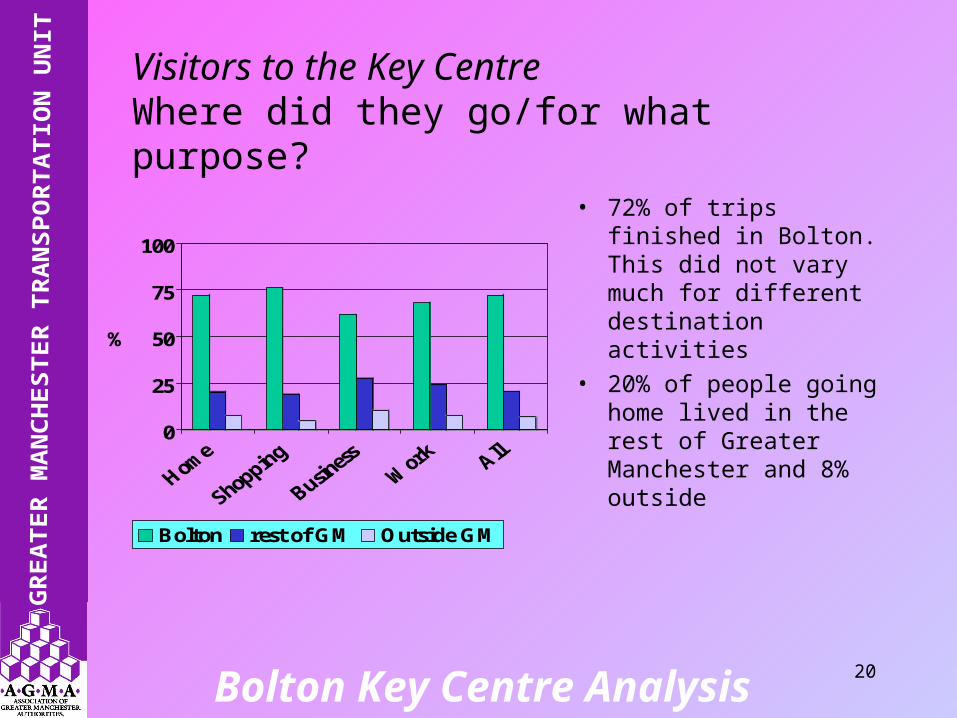
• 72% of trips finished in Bolton. This did not vary much for different destination activities
• 20% of people going home lived in the rest of Greater Manchester and 8% outside0
25
50
75
100
%
Bolton rest of GM Outside GM
Visitors to the Key CentreWhere did they go/for what purpose?
21Bolton Key Centre Analysis
• All the previous slides have referred to trips starting in the Key centre. These next slides look at all trips crossing the survey cordon
• In the case of bus trips, all trips crossing the survey cordon are included
• In the case of rail, only those trips which either start at Bolton Station or require an interchange at Bolton Station are included i.e. passengers on trains such as the Preston to Manchester route were not surveyed unless they changed trains or started at Bolton
All trips passing through the survey cordon
22Bolton Key Centre Analysis
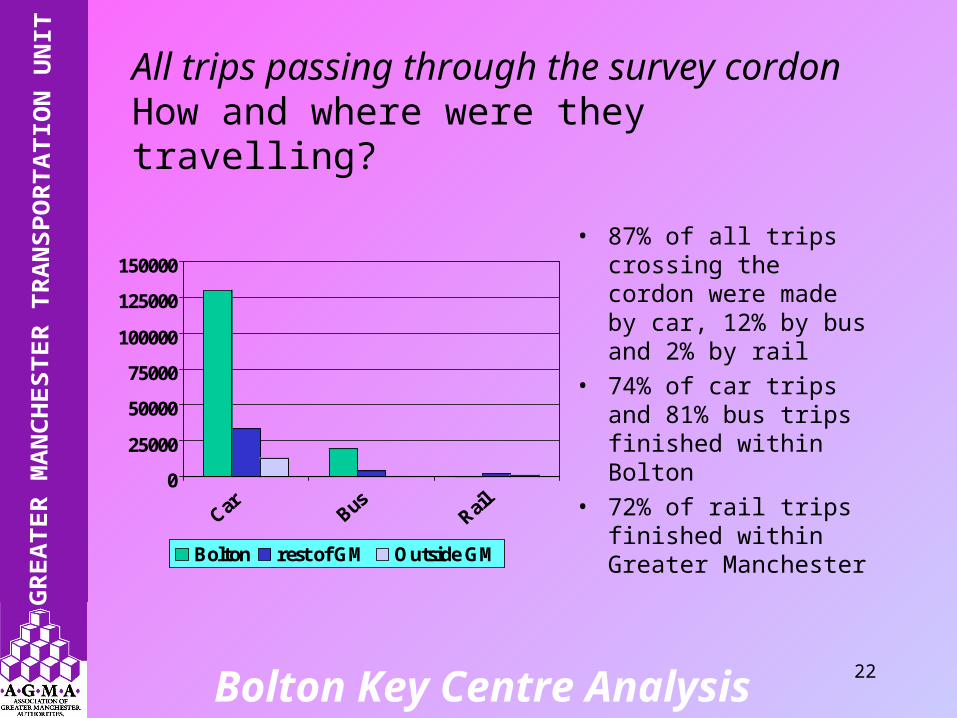
• 87% of all trips crossing the cordon were made by car, 12% by bus and 2% by rail
• 74% of car trips and 81% bus trips finished within Bolton
• 72% of rail trips finished within Greater Manchester
0
25000
50000
75000
100000
125000
150000
Bolton rest of GM Outside GM
All trips passing through the survey cordonHow and where were they travelling?
23Bolton Key Centre Analysis
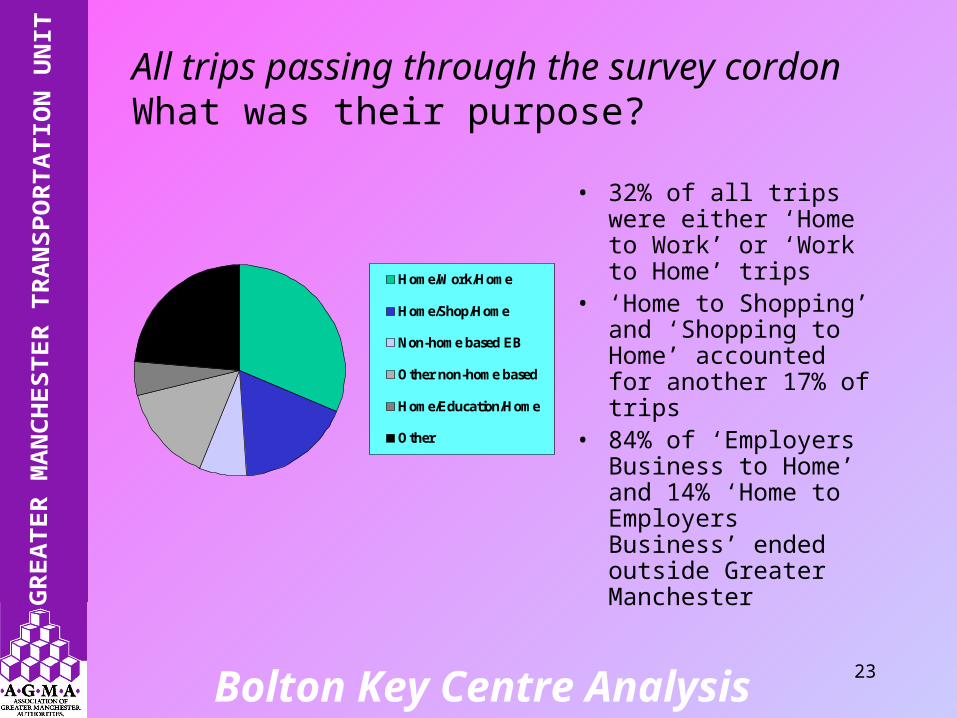
• 32% of all trips were either ‘Home to Work’ or ‘Work to Home’ trips
• ‘Home to Shopping’ and ‘Shopping to Home’ accounted for another 17% of trips
• 84% of ‘Employers Business to Home’ and 14% ‘Home to Employers Business’ ended outside Greater Manchester
Home/Work/Home
Home/Shop/Home
Non-home based EB
Other non-home based
Home/Education/Home
Other
All trips passing through the survey cordonWhat was their purpose?
24Bolton Key Centre Analysis
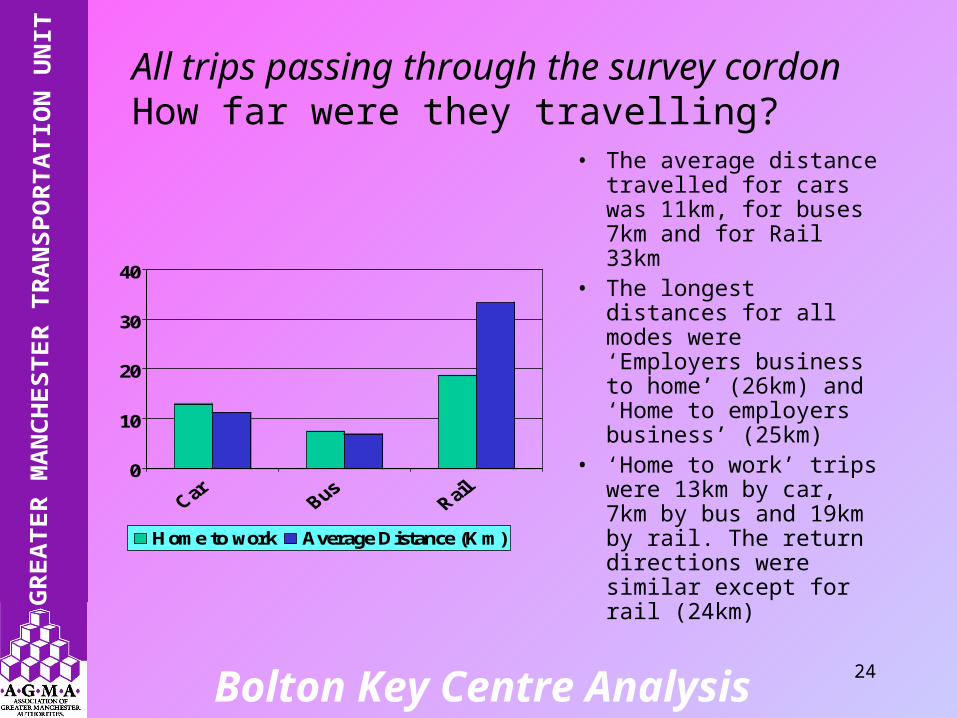
• The average distance travelled for cars was 11km, for buses 7km and for Rail 33km
• The longest distances for all modes were ‘Employers business to home’ (26km) and ‘Home to employers business’ (25km)
• ‘Home to work’ trips were 13km by car, 7km by bus and 19km by rail. The return directions were similar except for rail (24km)
0
10
20
30
40
Home to work Average Distance (Km)
All trips passing through the survey cordonHow far were they travelling?
25Bolton Key Centre Analysis
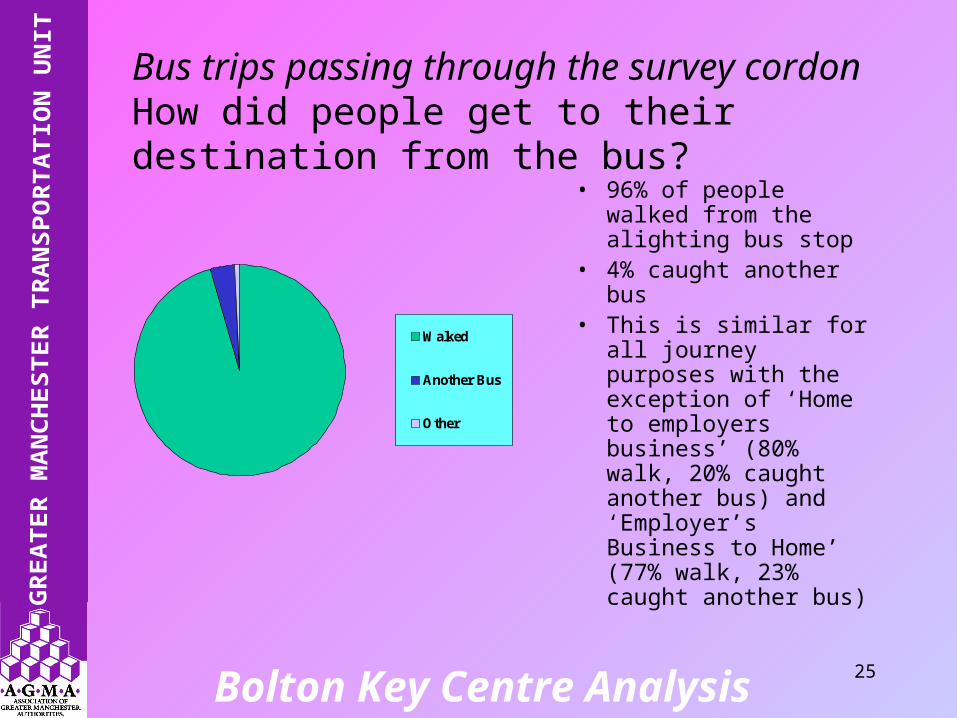
• 96% of people walked from the alighting bus stop
• 4% caught another bus
• This is similar for all journey purposes with the exception of ‘Home to employers business’ (80% walk, 20% caught another bus) and ‘Employer’s Business to Home’ (77% walk, 23% caught another bus)
Walked
Another Bus
Other
Bus trips passing through the survey cordonHow did people get to their destination from the bus?
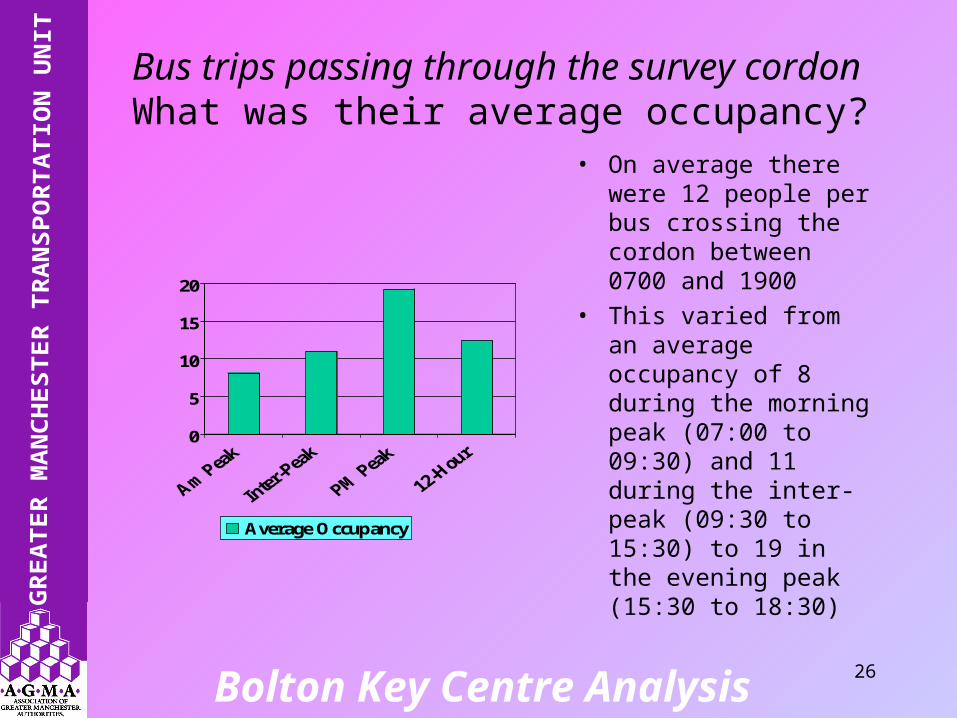
26Bolton Key Centre Analysis
• On average there were 12 people per bus crossing the cordon between 0700 and 1900
• This varied from an average occupancy of 8 during the morning peak (07:00 to 09:30) and 11 during the inter-peak (09:30 to 15:30) to 19 in the evening peak (15:30 to 18:30)
0
5
10
15
20
Average Occupancy
Bus trips passing through the survey cordonWhat was their average occupancy?

27Bolton Key Centre Analysis
• 68% walked from their alighting station
• 11% caught a bus• 6% caught a tram• Other modes were
Car (driver) (5%), taxi (4%), car - picked up (3%), another train (3%) and cycle (1%)
Walked
Another train
Taxi
Car (driver)
Car (picked up)
Bus
Cycle
Tram
Other
Rail trips passing through the survey cordonHow did people get to their destination from the train?
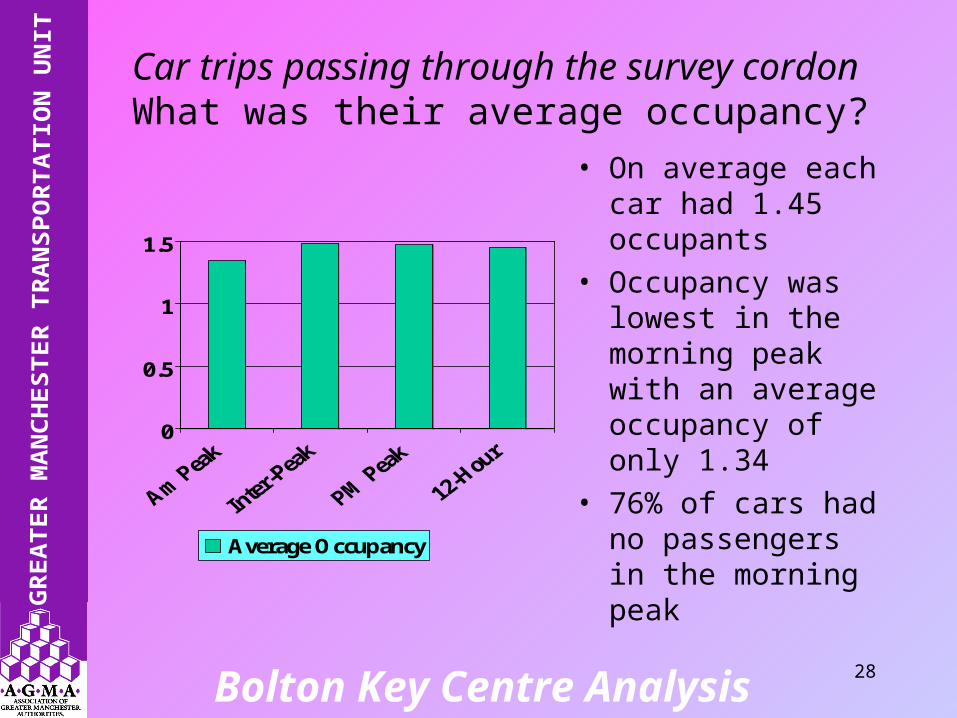
28Bolton Key Centre Analysis
• On average each car had 1.45 occupants
• Occupancy was lowest in the morning peak with an average occupancy of only 1.34
• 76% of cars had no passengers in the morning peak
0
0.5
1
1.5
Average Occupancy
Car trips passing through the survey cordonWhat was their average occupancy?
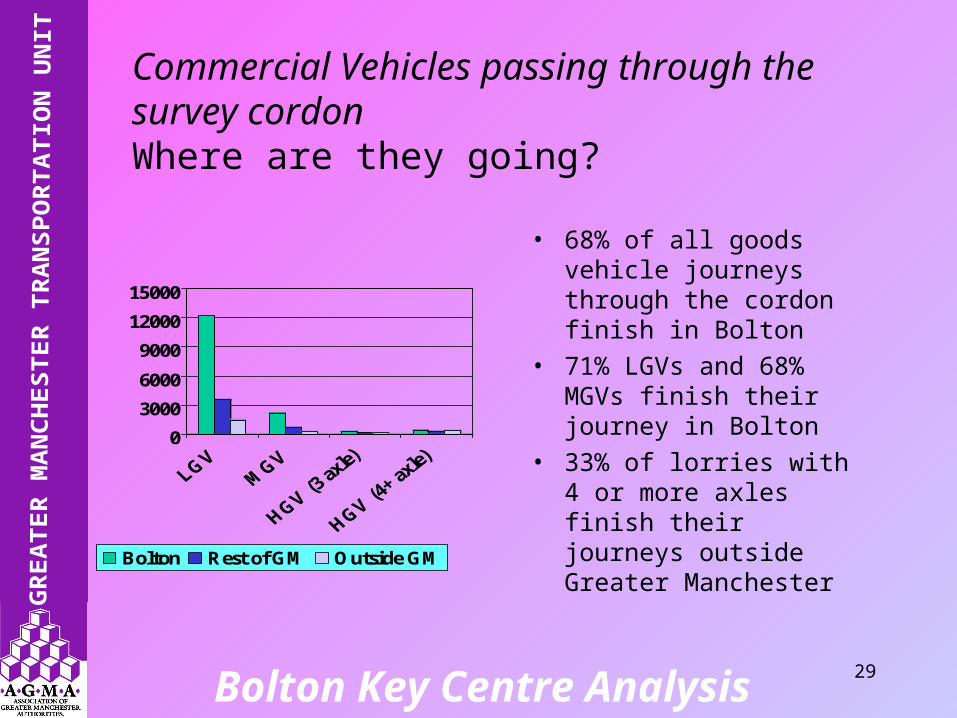
29Bolton Key Centre Analysis
• 68% of all goods vehicle journeys through the cordon finish in Bolton
• 71% LGVs and 68% MGVs finish their journey in Bolton
• 33% of lorries with 4 or more axles finish their journeys outside Greater Manchester
0
3000
6000
9000
12000
15000
Bolton Rest of GM Outside GM
Commercial Vehicles passing through the survey cordonWhere are they going?
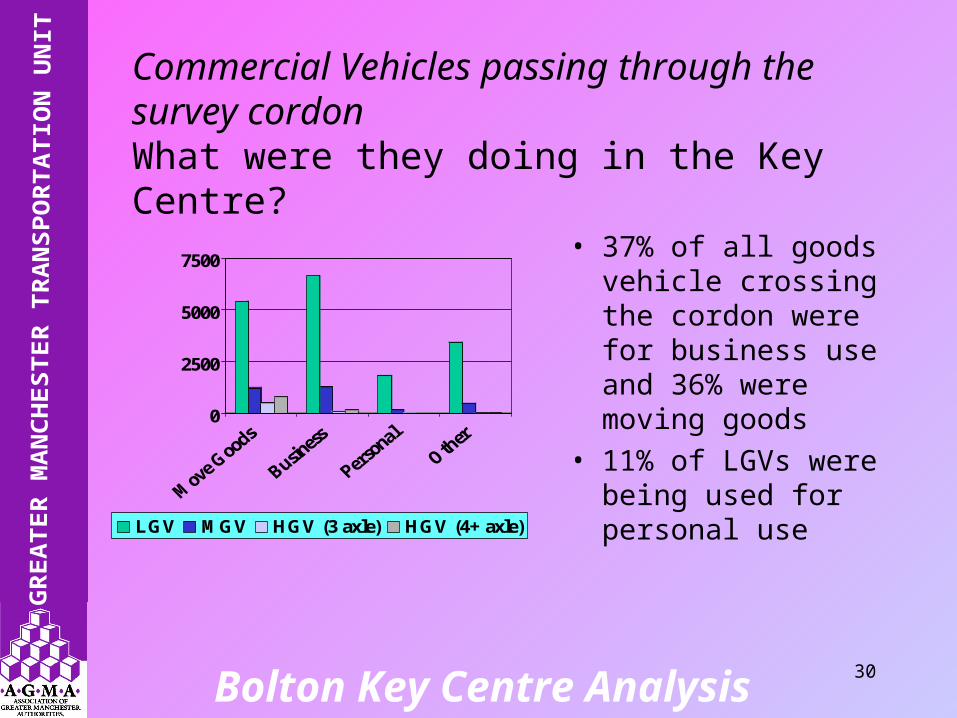
30Bolton Key Centre Analysis
• 37% of all goods vehicle crossing the cordon were for business use and 36% were moving goods
• 11% of LGVs were being used for personal use
0
2500
5000
7500
LGV MGV HGV (3 axle) HGV (4+ axle)
Commercial Vehicles passing through the survey cordonWhat were they doing in the Key Centre?
31Bolton Key Centre Analysis
• For further information on the Bolton Key Centre surveys or any other GMATS surveys please contact:
John Wharf 0161 455 2052
Peter Bearon 0161 455 2062
GMATS Surveys 2002