bonded-particle simulation of tunnel sealing experiment · in the experiment, a tunnel was...
TRANSCRIPT
ABSTRACT: Tunnel sealing experiment (TSX) was conducted between 1997 and 2004 in the Canadian URL located in Manitoba. In the experiment, a tunnel was excavated parallel to the maximum principal stress direction, filled with sand and sealed with bulkheads at both ends. It was then pressurized and heated by injecting hot water. The rock mass response was monitored with seismic methods. The main interest in the numerical simulation was the damage formed during the heating phase. The large-scale PFC2D models replicated a central plane- strain section of the TSX chamber. The models captured the first-order phenomena observed in-situ displaying the difference in the damage in the roof and floor regions, respectively. This difference was due to the filling material confinement of about 100 kPa on the tunnel floor, which occurred in the course of the heated experiment.
1 INTRODUCTION
The study of changes in the physical properties of rocks as a function of thermal cracking is a subject of widespread interest since it applies to human-induced applications such as the optimization of geothermal recovery, safe design of nuclear waste depositories, and also applies to natural processes such as volcanism and metamorphism. It is important to see how the perturbation of the environmental stress state caused by human activities may alter the rock structure, thus leading to changes in mechanical or transport properties of the host rock. Such alterations may have undesirable consequences on the integrity of the rock mass.
The presented work was part of a research project conducted at the University of Toronto to validate bonded-particle models for thermo-mechanical problems. Validation was performed with the help of case studies in which the simulation responses were compared to the laboratory- and field-scale experimental data. The full study is presented in Wanne (2009). This paper presents the results and analysis of the field-scale simulations of the Tunnel Sealing Experiment (TSX).
Particle Flow Code in 2 Dimensions (PFC2D) was chosen for the research because of its several benefits. The basic mechanical code has been available for the past ten years, and is being used mainly in research field. There is a diverse selection of published research using the code. The thermal option is a more recent addition to the code and lacked extensive verification, validation and applications. There are some other codes, such as Y2D (Munjiza. 2004) and Fracod (Bäckström et al. 2008), which are capable of exhibiting cracking but currently they lack the thermal routines, and furthermore do not have a wide user base. The research concentrated on thermal problems related to brittle hard rock.
Bonded-particle simulation of Tunnel Sealing Experiment
T.S. Wanne1, 2
1Lassonde Institute, University of Toronto, Ontario, Canada
2Nuclear Waste Management Organization, Toronto, Ontario, Canada
ROCKENG09: Proceedings of the 3rd CANUS Rock Mechanics Symposium, Toronto, May 2009 (Ed: M.Diederichs and G. Grasselli)
PAPER 4170 1
2 BONDED- PARTICLE MODELING USING PFC2D
PFC2D is based on the original work by Cundall & Strack (1979). The code is classified as a discrete element method and it does not require pre-defined or initially imposed conditions for presenting damage during simulation. The code provides a natural heterogeneity of numerical specimens due to the random particle-packing scheme. Because of the explicit time marching calculation method, the code exhibits dynamic material behavior where seismic waves propagate at a velocity dependent on the material properties. Data from acoustic emission (AE) and micro seismic (MS) monitoring, non-destructive testing methods, can be readily compared with the synthetic seismicity in a PFC2D model.
2.1 Mechanical model
The PFC2D approach simulates the movement and interaction of circular particles following the distinct element method introduced by Cundall (1971). The mechanical behavior of the system is described by the movement of each particle and the force and moment acting at each contact. Newton’s second law is used to determine the translational and rotational motion of each particle, while the force–displacement law is used to update the contact forces arising from the relative motion at each contact. The dynamic behavior is represented numerically by a time stepping routine in which the velocities and accelerations are assumed constant within each time step.
Solid rock is represented by an assembly of particles that are joined together by breakable parallel bonds, hence the name bonded-particle model A parallel bond approximates the mechanical behavior of a brittle elastic cement joining the two bonded particles. The bonds can transmit both forces and moments between particles. If the maximum bond stress exceeds the set bond strength, tensile or shear, then the bond breaks and it is removed from the model. The damage, thus, occurs by bond breakages, and the studied material transforms from solid to granular. The detailed description of the PFC2D model for rock is given in Potyondy & Cundall (2004).
Based on earlier studies, the PFC2D modeling method has some known deficiencies that were summarized for example by Potyondy & Cundall (2004). One of the key issues is the inability to match both compressive (UCS) and tensile strengths in a single PFC2D material. The macroscopic strength can be matched with either UCS or Brazilian tensile strength, but not both simultaneously. The ratio of the UCS to tensile strength is about five for a PFC2D material. The ratio value for a brittle hard rock is closer to 20. In addition, the correspondence between particle size and the material’s mechanical properties plays a major role in PFC modeling. It is an intrinsic part of the material characterization and cannot be regarded as a free parameter that only controls model resolution. PFC2D has been used to simulate, for example, hydraulic fracturing (Al-Busaidi. 2004), seismic velocities (Hazzard & Young. 2004), failure around a circular opening (Fakhimi et al. 2002), and crack initiation and interaction in hard rock (Diederichs et al. 2004, Diederichs. 2003).
2.2 Thermal model
Thermal algorithms in PFC2D allow the simulation of the heat conduction and the development of thermally induced displacement and forces. In these algorithms, thermal material is presented as a network of heat reservoirs (particles) and thermal pipes (contacts between particles). Heat flow occurs via conduction in the pipes connecting the reservoirs. This approach allows the evolution of the heat network during the modeling. Temperature changes in a model produce thermal strains via thermal expansion. This is accounted for by changing particle radii and modifying bond forces. A detailed description is provided in (Itasca Consulting Group, Inc. 2004b).
ROCKENG09: Proceedings of the 3rd CANUS Rock Mechanics Symposium, Toronto, May 2009 (Ed: M.Diederichs and G. Grasselli)
PAPER 4170 2
2.3 Synthetic seismicity
PFC2D uses an explicit time-marching calculation scheme to simulate the material behavior. This allows dynamic simulations to be performed, in which seismic waves propagate across the material at a speed that depends on material properties (such as stiffness of a particle contact). During the simulations, each bond breakage is assumed to be a microcrack. When a bond breaks, the stored strain energy is released as kinetic energy in the form of a seismic wave. Microcracks that occur close together, both in space and time, are considered a single seismic event. The seismic monitoring technique is based on the work of Hazzard & Young (2002). Pressure (P) wave velocities in a particle assembly can be measured by propagating displacement waves through the material and monitoring particle movements at a certain distance from the source. The wave velocity is calculated by determining the time difference of the peaks of the source and received waveforms. The wave velocity is related to the stiffness of the system. The stiffness of a PFC2D material decreases when cracks form and this can be detected by measuring the velocity changes. Details on the numerical seismic monitoring technique are given in Young, Hazzard & Pettitt (2000), Hazzard & Young (2004), Hazzard & Young (2004), and Hazzard (1998).
3 TUNNEL SEALING EXPERIMENT
Goal of the used nuclear fuel management is the disposal of the fuel canisters to a centralized containment in a geological repository in a suitable rock formation that would provide an adequate level of safety. One of the aspects for in-situ experiments has been the thermal effects on the surrounding rock mass.
Heated failure test (HFT) by Atomic Energy of Canada Limited investigated the effects of thermal loading on the excavation damage development (Read et al. 1997). AE monitoring provided means of identifying the damage development in the test area. Numerical modeling was used to interpret the borehole breakouts, which were mainly due to increased tangential stresses. In Sweden SKB conducted the Äspö pillar stability experiment (APSE) which studied the development of the progressive failure in a highly stressed pillar (Andersson. 2007). Pre-experiment studies predicted significant stress magnitudes in the pillar (Andersson et al. 2003). The experiment was monitored with an AE system (Haycox, Pettitt & Young. 2005). Borehole breakouts developed close to the pillar’s center, where the tangential stresses were the highest.
Between 1997 and 2004, the tunnel sealing experiment (TSX) was conducted in the same underground facility as the earlier mine-by heated failure test (HFT). In the experiment, a tunnel with an elliptical cross-section was excavated parallel to the maximum principal stress direction. The tunnel was filled with sand and sealed with bulkheads at both ends. The tunnel was then pressurized to 4 MPa, and heated by injecting 85°C water in the center of the chamber. The rock mass response was monitored with an AE/MS instrumentation method (Haycox, Collins & Pettitt. 2004). Major portions of the seismic events were located in the roof region, migrating over time from the center outwards towards the tunnel’s ends. The lesser amount of seismic events recorded at the tunnel floor was thought to be due to the confinement provided by the sand filling.
The main objective of the TSX was to study issues related to the full-scale bulkhead seals of underground repositories for radioactive waste. The experiment included two tunnel bulkheads; one composed of clay blocks, and the other constructed using concrete. The tunnel was 13 meters long, 4.375 meters across, and 3.75 meters high, with an elliptical cross-section. The experiment consisted of the following phases.
1 - Excavation of the tunnel by the drill and blast method, 2 - Drilling and rock cutting of the seal regions 3 - Building of the clay seal, 4 - Filling the chamber with sand, 5 - Building of the concrete seal, 6 - Pressurizing of the chamber, 7 - Heating of the chamber by injecting hot water in the chamber’s center, 8 - Cooling and depressurization of the chamber.
ROCKENG09: Proceedings of the 3rd CANUS Rock Mechanics Symposium, Toronto, May 2009 (Ed: M.Diederichs and G. Grasselli)
PAPER 4170 3

Over the period of seven years, the experiment was monitored with AE/MS systems, covering all the experimental phases (Haycox, Collins & Pettitt. 2004). Seismic activity around the tunnel indicated that time-dependent microcracking occurred for years following the excavation. Heated water was injected through boreholes to the center of the chamber. The amount of confinement by the sand filling arrested the cracking process, but the heating caused the cracking to start again. A clear relationship was observed between the increase of the temperature and the increase in the microseismic events. Seismic activity was the highest during the excavation phase, and 95% of the events occurred within 1.4 meters from the chamber walls. During the heating phase, the events did not exceed beyond the initial excavation disturbance zone. It was interpreted that there was an increase in crack densities in the areas of previous damage. The MS observations clearly indicated that during the heating phase, there was less activity in the floor region than in the roof. This was thought to be due to the confinement provided by the sand filling, Figure 1.
During the heating phase, seismic velocities were measured around the clay bulkhead, as documented by (Collins et al. 2003). Some of the raypaths also covered regions in the rock mass along the sidewall and below the chamber. No velocity data was recorded in the roof region. In general, a change in a seismic velocity can be attributed, for example, to an increase in microcracking, changes in stress state or saturation. Increasing microcracking would lead to a reduced velocity value. Increased fluid saturation of cracks and a stress increase would lead to a P wave velocity increase, depending on the stress orientation in relation to the crack orientation. The velocity results from the experiment showed an increase in the measured velocity values during the heating. The greatest increase took place at the sidewalls. It was suggested that the thermal stresses were closing the existing microcracks in the walls, unlike in the floor region, where the cracks were mostly closed prior to the heating, by the pressure from the filling material.
The TSX tunnel was oriented parallel to the maximum principal stress direction. The intermediate stress was oriented horizontally, and the minimum stress sub-vertically. The average magnitudes of the stresses were 60, 45, and 11 MPa. In the two-dimensional PFC2D analysis the stress magnitudes 45 and 11 MPa were applied. Based on the analytical calculation examples in (Hoek. 1980), the tunnel perimeter stresses were approximated; at the roof and the floor regions the maximum compressive stress was about 80 MPa the value at walls was about 10 MPa. Based purely on the elastic stress analysis, one would not expect any significant damage around the elliptical TSX chamber, as there are no tensile stress regions, and the maximum compressive stress value does not considerably exceed the crack initiation stress level of the LdB granite (Read et al. 1997). MS monitoring during the experiment showed that part of the seismic activity occurred not immediately after the excavation but in the years following it. This was explained as a corrosion mechanism, in which the rock strength reduces over time, via hydro-chemical processes or under a constant load (a process also called stress corrosion).
Figure 1. Microseismic events in the Tunnel Sealing Experiment during the heating of the chamber from 25 September 2002 to 17 September 2003. Top and side views show the events clustering mainly to the roof region (after Haycox, Collins &Pettitt. 2004).
616 Events
ROCKENG09: Proceedings of the 3rd CANUS Rock Mechanics Symposium, Toronto, May 2009 (Ed: M.Diederichs and G. Grasselli)
PAPER 4170 4

4 SIMULATION OF TSX
4.1 Numerical specimens
PFC2D specimens were created based on the material genesis procedure by Potyondy & Cundall (2004). The specimens were of a rectangular shape, with a width of 28 meters and a height of 21 meters. Four surrounding walls bounded the specimen. The average particle diameter was 180 mm. The number of PFC2D particles in a specimen was about 19000. The material properties for the PFC2D models were based on Read et al. (1997) and Martin (1993). The main rock type in the TSX tunnel, located in the Canadian URL, was granite with a grain size of about 5–8 mm. The in-situ strength of the rock was approximated to be about 70-80% of the unconfined compression strength (UCS). In some cases, the in-situ strength was approximated to be as low as 50% of the UCS. The crack initiation stress level is described as σ1-σ3=70 MPa. The values for Young’s modulus and Poisson’s ratio are 65 GPa and 0.25, respectively. The density of the rock is 2650 kg/m
3. The thermal conductivity, k, is 3.5 W/m°C, and the specific heat, c, is
1015 J/kg°C. The linear thermal expansion coefficient of LdB granite, αt, varies to some extent. Based on the coupled thermo-mechanical laboratory scale simulations (Wanne 2009) a uniform value of 10.0x10
-6 °C
-1 was chosen for the TSX modeling in order to reduce the possible
combinations of the different modeling cases. The PFC2D material properties are listed in Table 1. In addition to using the base material strength in the simulations, two additional material strength cases were implemented; a case in which the material strength was 1.5 times that of the base material strength and a case 2 times the strength. The simulation cases are listed in Table 2.
4.2 Simulation procedure
Stress boundary condition was applied using a numerical servo-control mechanism. It maintained the desired stress value at the model walls by controlling the wall velocities, and thus the forces acting on the boundary particles. The approach is described in (Itasca Consulting Group, Inc. 2004a). The excavation was performed by removing the bonds between the particles located in the chamber area. The particles themselves remained. The filling material was thus modeled by loose PFC2D particles. During a PFC2D specimen generation, particle packing is optimized by minimizing the space between the particles, and by ensuring that all particles are in contact with neighboring ones. To simulate more realistically the filling material, the size of the filling particles was thus reduced by 0.5%. The particles settled under the force of gravity, and a small gap formed between the filling and the chamber roof.
The main interest in the TSX simulation was the heating phase. Of all the TSX in-situ experimental phases, the following were included in the modeling sequences: (1) excavation of the chamber, (4) filling and (7) heating of the chamber. In order to simplify the simulations, pressurization of the chamber by fluid was omitted in the modeling sequences. The two-dimensional PFC2D model was a representation of a section at the middle of the TSX chamber. A PFC2D model for TSX is shown in Figure 2.
The numerical specimens were cycled to equilibrium, a process during which any microcracking was recorded. The state of equilibrium represented the TSX chamber after the excavation and filling stages. Heating was simulated by raising the temperature of the particles in the chamber to a target value of 85°C. Since the filling material had settled under the gravity and created a small gap between the roof and the filling, the roof region was initially not directly heated because the heat could only conduct between those particles that were in direct contact. Therefore, another heating mechanism, in which the chamber perimeter particles were regarded as part of the heating range, was created. This mechanism was employed in the simulation cases F and later. The temperature of the particles at the outer boundary of the specimen was fixed to an ambient value of 10°C. Thermal simulation stage simulated 12 weeks of heating. This duration was chosen in order to optimize computation time. In the in-situ experiment, the actual heating stage lasted one year. The computational runtime per a simulation case was about 30 hours (using a PC with a processing speed of 3.0 GHz). Variations of the above steps are listed in Table 2.
ROCKENG09: Proceedings of the 3rd CANUS Rock Mechanics Symposium, Toronto, May 2009 (Ed: M.Diederichs and G. Grasselli)
PAPER 4170 5
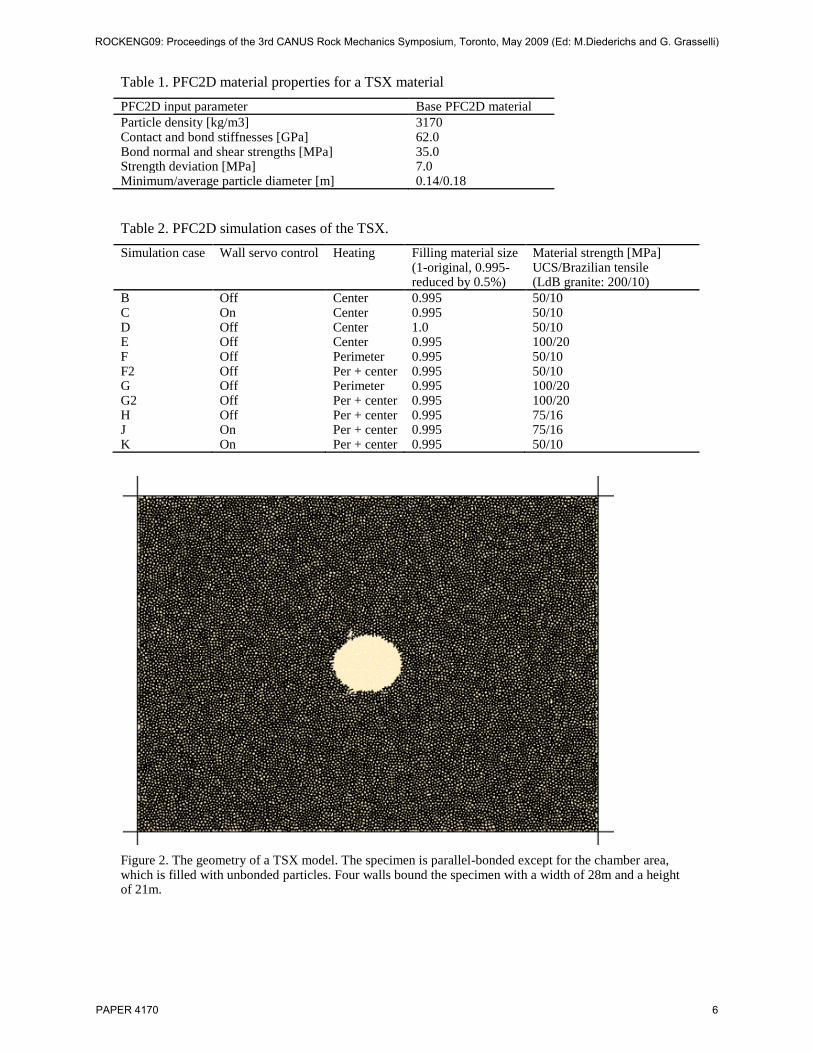
Table 1. PFC2D material properties for a TSX material
PFC2D input parameter Base PFC2D material
Particle density [kg/m3] 3170 Contact and bond stiffnesses [GPa] 62.0 Bond normal and shear strengths [MPa] 35.0 Strength deviation [MPa] 7.0 Minimum/average particle diameter [m] 0.14/0.18
Table 2. PFC2D simulation cases of the TSX.
Simulation case Wall servo control Heating Filling material size (1-original, 0.995-reduced by 0.5%)
Material strength [MPa] UCS/Brazilian tensile (LdB granite: 200/10)
B Off Center 0.995 50/10 C On Center 0.995 50/10 D Off Center 1.0 50/10 E Off Center 0.995 100/20 F Off Perimeter 0.995 50/10 F2 Off Per + center 0.995 50/10 G Off Perimeter 0.995 100/20 G2 Off Per + center 0.995 100/20 H Off Per + center 0.995 75/16 J On Per + center 0.995 75/16 K On Per + center 0.995 50/10
Figure 2. The geometry of a TSX model. The specimen is parallel-bonded except for the chamber area, which is filled with unbonded particles. Four walls bound the specimen with a width of 28m and a height of 21m.
ROCKENG09: Proceedings of the 3rd CANUS Rock Mechanics Symposium, Toronto, May 2009 (Ed: M.Diederichs and G. Grasselli)
PAPER 4170 6

5 RESULTS AND ANALYSIS
5.1 Simulation response
In the TSX simulations, the heating and the potential effect of the filling material on the damage development in the floor region were the main concerns. The filling material was simulated by unbonded particles under gravitational loading. The weight of the free particles provided a confinement of about 100 kPa on the floor region, which was about the same as the value estimated in the in-situ experiment.
The models showed damage around the opening, which was concentrated at the roof and floor. As the simulation continued, the effect of the filling material became evident, as the cracking in the roof area during the heating phase was predominant, when compared to that in the floor area. The damage extended about 1–2 meters from the tunnel perimeter outwards. In the roof area, the microcracking formed a notch-like shape. The apex of the notch reached about 1.5 meters from the tunnel wall, Figure 3. The simulation Case C already captured some of these features, which were hypothetically expected based on the stress orientation and the confinement by the filling material. Case C was similar to Case B, with the difference that the wall servo was continuously engaged. The stresses, therefore, stayed at their initial value throughout the simulation. The differences between Cases B and C are due mainly to the servo-controlled walls maintaining the stress boundary conditions. Even with the slight differences between the cases, the large-scale damage formation is similar, and is represented by a notch-like shape in the roof, as well as suppressed damage at the floor.
For two different reasons, the subsequent cases D and E produced hardly any damage at all. Case D was similar to Case B, except that the filling particle radii were not reduced during the simulation. Initial particle packing was rather tight, and because of the radii expansion of the filling material, which was induced by the temperature change, expansion occurred symmetrically, thus providing symmetrical confinement against the chamber walls. The amount of confinement seemed to be high enough to suppress any possible damage. In Case E, the PFC2D material was twice as strong as the material in the aforementioned cases. Otherwise, this case was, again, similar to Case B. Towards the end of the heating phase, only three microcracks had formed in the stronger material.
For Cases F and onwards, a different heating mechanism was employed. This mechanism was developed in reaction to the creation of the small gap between the chamber’s roof and filling (as mentioned previously), which prevented the direct heating of the roof region. Case F2 was again similar to Case B. The simulation also yielded different data than the previous cases. In this case, the damage was more extensive, and appeared in a roughly symmetrical fashion after the excavation. During the heating phase, the damage was concentrated in the roof region, although there also was activity below the floor. The material in Case G2 was twice as strong as that in Case F2; except for the heating scheme, it was similar to Case E. In this case, the occurring cracking was scarce during both the excavation and the heating phase, and was located in close proximity to the tunnel perimeter.
Case H was similar to cases G2 and F2, except that the material strength was set to 1.5 times the material strength of the ‘base’ case B. The overall behavior of Case H was similar to the previous cases, and accordingly, more damage was observed in the roof region than at the floor. As expected, the range of the damage’s amount and extent was between the two end cases. The damage did not extend beyond 1.0 meter from the tunnel wall, nor was there a clear notch type formation visible. Case J, the behavior is practically the same as Case H.
Case K revisits Case F2 with the full wall servo control engaged. The other comparable case is Case C, with the only difference being the heating mechanism. The behavior is similar to those cases. There is a clear notch type formation at the roof, as well as suppressed damage at the floor. It seems, however, that in Case K the difference between the roof and floor damage is not that well defined.
Comparison between the simulation cases shows that the varying material strength is the main contributing factor determining the extent of the damage. Another, less important factor is the heating mechanism. All cases show the effect of the confinement at the floor level by a restrained damage below the tunnel.
ROCKENG09: Proceedings of the 3rd CANUS Rock Mechanics Symposium, Toronto, May 2009 (Ed: M.Diederichs and G. Grasselli)
PAPER 4170 7
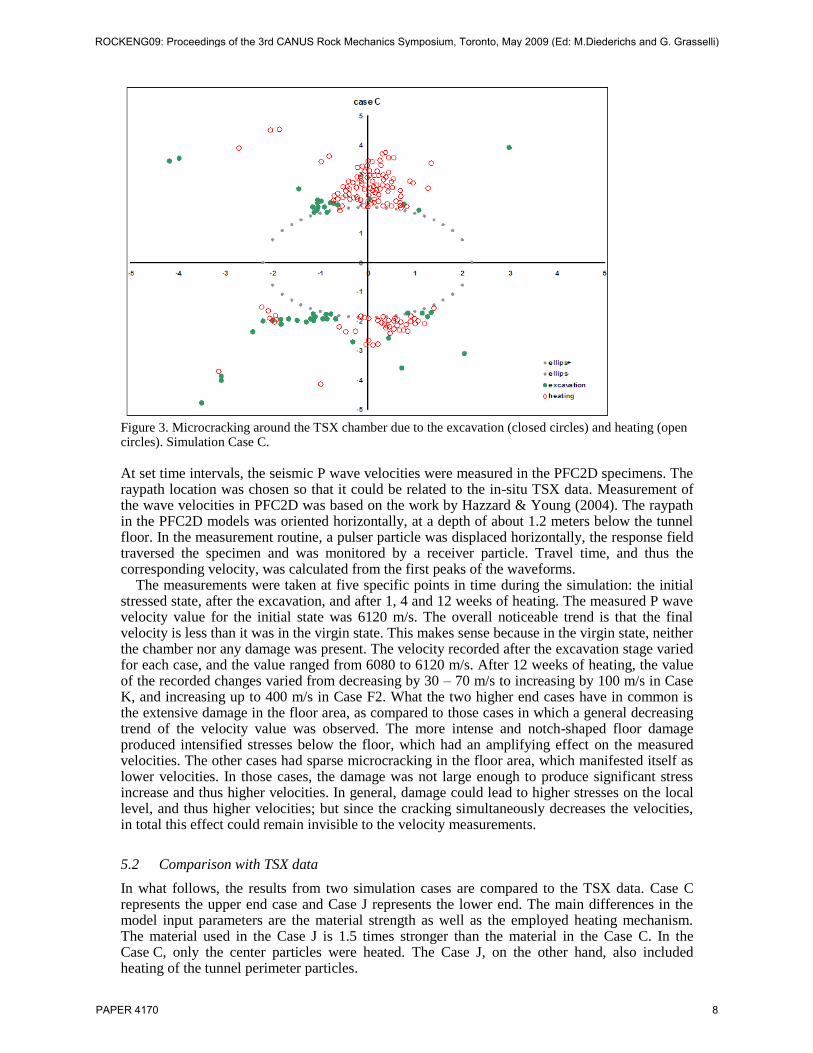
Figure 3. Microcracking around the TSX chamber due to the excavation (closed circles) and heating (open circles). Simulation Case C.
At set time intervals, the seismic P wave velocities were measured in the PFC2D specimens. The raypath location was chosen so that it could be related to the in-situ TSX data. Measurement of the wave velocities in PFC2D was based on the work by Hazzard & Young (2004). The raypath in the PFC2D models was oriented horizontally, at a depth of about 1.2 meters below the tunnel floor. In the measurement routine, a pulser particle was displaced horizontally, the response field traversed the specimen and was monitored by a receiver particle. Travel time, and thus the corresponding velocity, was calculated from the first peaks of the waveforms.
The measurements were taken at five specific points in time during the simulation: the initial stressed state, after the excavation, and after 1, 4 and 12 weeks of heating. The measured P wave velocity value for the initial state was 6120 m/s. The overall noticeable trend is that the final velocity is less than it was in the virgin state. This makes sense because in the virgin state, neither the chamber nor any damage was present. The velocity recorded after the excavation stage varied for each case, and the value ranged from 6080 to 6120 m/s. After 12 weeks of heating, the value of the recorded changes varied from decreasing by 30 – 70 m/s to increasing by 100 m/s in Case K, and increasing up to 400 m/s in Case F2. What the two higher end cases have in common is the extensive damage in the floor area, as compared to those cases in which a general decreasing trend of the velocity value was observed. The more intense and notch-shaped floor damage produced intensified stresses below the floor, which had an amplifying effect on the measured velocities. The other cases had sparse microcracking in the floor area, which manifested itself as lower velocities. In those cases, the damage was not large enough to produce significant stress increase and thus higher velocities. In general, damage could lead to higher stresses on the local level, and thus higher velocities; but since the cracking simultaneously decreases the velocities, in total this effect could remain invisible to the velocity measurements.
5.2 Comparison with TSX data
In what follows, the results from two simulation cases are compared to the TSX data. Case C represents the upper end case and Case J represents the lower end. The main differences in the model input parameters are the material strength as well as the employed heating mechanism. The material used in the Case J is 1.5 times stronger than the material in the Case C. In the Case C, only the center particles were heated. The Case J, on the other hand, also included heating of the tunnel perimeter particles.
ROCKENG09: Proceedings of the 3rd CANUS Rock Mechanics Symposium, Toronto, May 2009 (Ed: M.Diederichs and G. Grasselli)
PAPER 4170 8

The damage was divided into two time-slices; damage that occurred after the excavation but before the heating, and damage directly related to the heating. After the excavation stage, only a few cracks are apparent in the stronger material used in Case J. The simulation results exhibit an obvious increase of the damage during the heating phase. In Case C, a clear notch-type damage formation was observed at the roof level, Figure 4. The TSX data exhibits subtler notch formation, but it is clear that the damage is concentrated in the roof region. For Case J, the visual difference between the roof and floor damage is less evident; the numerical data, however, makes it apparent that there is more damage in the roof region than there is in the floor region. The damage at the floor is sparse, as opposed to the roof region, where the cracking is concentrated near the chamber’s center axis. The roof damage is similar to that of the TSX experiment, Figure 5.
Figure 4. Damage around the TSX chamber after the excavation phase (top) and after the heating phase (bottom). TSX in-situ MS data (left), and the PFC2D microcracks of the simulation Case C (right).
MS Events after Excavation, before Heating -4
-3
-2
-1
0
1
2
3
4
-4 -3 -2 -1 0 1 2 3 4 roteast
depth
-4
-3
-2
-1
0
1
2
3
4
-4 -2 0 2 4
case C after excavation before heating
MS Events after Heating -4
-3
-2
-1
0
1
2
3
4
-4 -3 -2 -1 0 1 2 3 4 roteast
depth
-4
-3
-2
-1
0
1
2
3
4
-4 -2 0 2 4
case C after heating
ROCKENG09: Proceedings of the 3rd CANUS Rock Mechanics Symposium, Toronto, May 2009 (Ed: M.Diederichs and G. Grasselli)
PAPER 4170 9
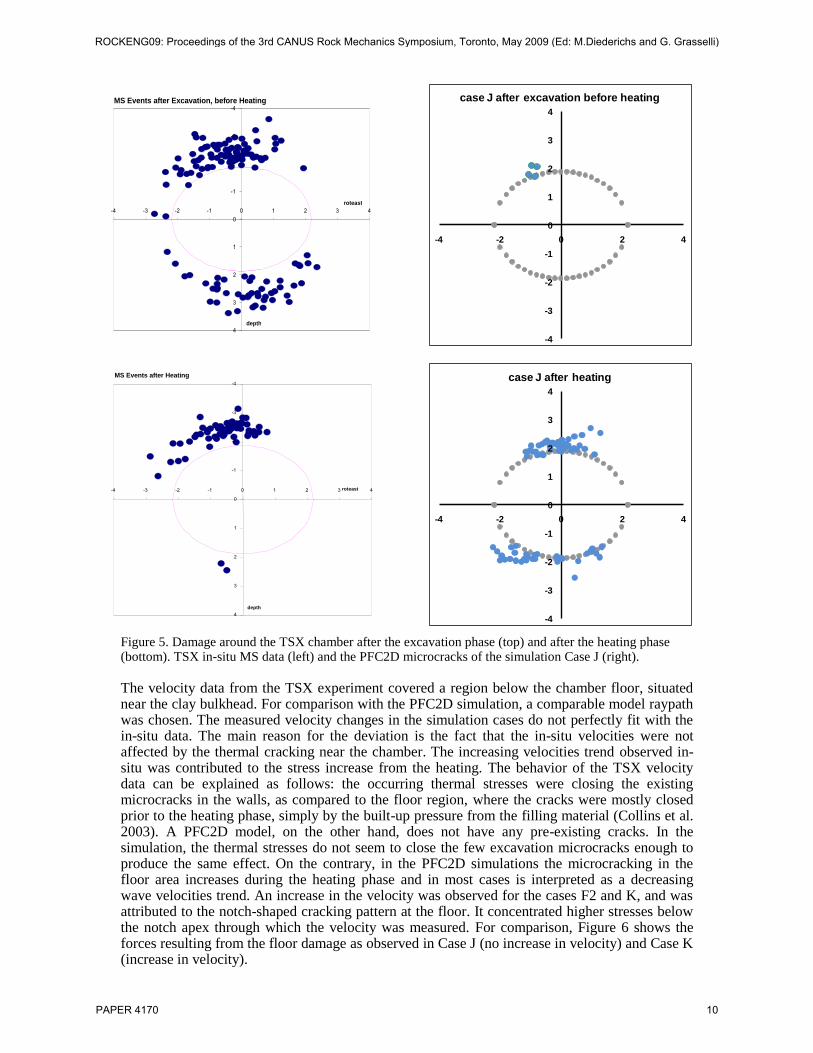
Figure 5. Damage around the TSX chamber after the excavation phase (top) and after the heating phase (bottom). TSX in-situ MS data (left) and the PFC2D microcracks of the simulation Case J (right).
The velocity data from the TSX experiment covered a region below the chamber floor, situated near the clay bulkhead. For comparison with the PFC2D simulation, a comparable model raypath was chosen. The measured velocity changes in the simulation cases do not perfectly fit with the in-situ data. The main reason for the deviation is the fact that the in-situ velocities were not affected by the thermal cracking near the chamber. The increasing velocities trend observed in-situ was contributed to the stress increase from the heating. The behavior of the TSX velocity data can be explained as follows: the occurring thermal stresses were closing the existing microcracks in the walls, as compared to the floor region, where the cracks were mostly closed prior to the heating phase, simply by the built-up pressure from the filling material (Collins et al. 2003). A PFC2D model, on the other hand, does not have any pre-existing cracks. In the simulation, the thermal stresses do not seem to close the few excavation microcracks enough to produce the same effect. On the contrary, in the PFC2D simulations the microcracking in the floor area increases during the heating phase and in most cases is interpreted as a decreasing wave velocities trend. An increase in the velocity was observed for the cases F2 and K, and was attributed to the notch-shaped cracking pattern at the floor. It concentrated higher stresses below the notch apex through which the velocity was measured. For comparison, Figure 6 shows the forces resulting from the floor damage as observed in Case J (no increase in velocity) and Case K (increase in velocity).
MS Events after Excavation, before Heating -4
-3
-2
-1
0
1
2
3
4
-4 -3 -2 -1 0 1 2 3 4 roteast
depth
-4
-3
-2
-1
0
1
2
3
4
-4 -2 0 2 4
case J after excavation before heating
MS Events after Heating -4
-3
-2
-1
0
1
2
3
4
-4 -3 -2 -1 0 1 2 3 4 roteast
depth
-4
-3
-2
-1
0
1
2
3
4
-4 -2 0 2 4
case J after heating
ROCKENG09: Proceedings of the 3rd CANUS Rock Mechanics Symposium, Toronto, May 2009 (Ed: M.Diederichs and G. Grasselli)
PAPER 4170 10

Figure 6. Damage and forces below the floor for PFC2D Cases J (top) and K (bottom) after 12 weeks of heating. The lines (magnitude scales with line width) depict the contact and bond forces between the particles. Note the force concentration in the Case K.
6 CONCLUSION
The TSX modeling study used the field data from a multi-staged in-situ experiment. The experimental geometry allowed a 2D modeling to be performed on the large-scale tunnel. Seismic data from the experiment was readily available for comparison. The PFC2D models combined bonded-particles to represent the hard rock and loose particles to represent the sand filling. The simulations took account the in-situ stresses, gravity and the heating of the chamber. The conducted parameter studies showed the sensitivity of the particle packing to the formed microcracking. The large tunnel scale models captured the first order phenomena observed in-situ, i.e. the difference in the damage occurring in the roof and floor regions. In the experiment, the tunnel opening was filled with sand, while loose PFC2D particles were used in the models. The free particles applied a pressure of about 100 kPa on the floor, which was enough to suppress significant amounts of damage in that region during the heating of the tunnel. Simulation cases with intense and notch-shaped floor damage produced intensified stresses below the floor, which had a direct impact on the measured velocities. In some cases, the sparse microcracking in the floor area manifested itself as lower velocities. The damage was not concentrated enough to produce a significant stress increase, and thus did not result in higher measured velocities. In general, damage could lead to higher local stresses (which would result in higher velocities). However, the cracking simultaneously decreases the velocities, so that the total effect could remain invisible in the velocity measurements.
ROCKENG09: Proceedings of the 3rd CANUS Rock Mechanics Symposium, Toronto, May 2009 (Ed: M.Diederichs and G. Grasselli)
PAPER 4170 11

7 REFERENCES
Al-busaidi, A. 2004. Distinct element modelling of hydraulically-induced fracture and associated seismicity. Thesis Ph.D. University of Liverpool. Liverpool. UK.
Andersson, J.C., Rinne, M., Staub, I., Wanne, T., Stephansson, O., Hudson, J.A. & Jing, L. 2003. The on-going pillar stability experiment at the Äspö Hard Rock Laboratory, Sweden. Proceedings of GeoProc 2003 - the International conference on coupled T-H-M-C processes in Geo-systems: Fundamentals, Modelling, Experiments & Applications. October 13-15, 2003.
Andersson, J.C. 2007. Rock Mass Response to Coupled Mechanical Thermal Loading: Äspö Pillar Stability Experiment, Sweden. PhD thesis. KTH. Civil and Architectural Engineering. Stockholm. Sweden.
Bäckström, A., Antikainen, J., Backers, T., Feng, X., Jing, L., Kobayashi, A., Koyama, T., Pan, P., Rinne, M., Shen, B. & Hudson, J.A. 2008. Numerical modelling of uniaxial compressive failure of granite with and without saline porewater. Int. J. Rock Mech. Min. Sci. Vol. 45. No. 7. pp. 1126-1142.
Collins, D.S., Haycox, J., Pettitt, W.S. & Young, R.P. 2003. AE and ultrasonic monitoring around the clay bulkhead during the heating phase of the tunnel sealing experiment. Ontario Power Generation. Report 06819-REP-01200-xxxxx-R00.
Cundall, P.A. & Strack, O.D.L. 1979. Discrete numerical model for granular assemblies. Geotechnique. 29. pp. 47-65.
Cundall, PA. 1971. A computer model for simulating progressive large-scale movements in blocky rock systems. In Proceedings of the Symposium of International Society of Rock Mechanics. Vol. 1. Nancy. France.
Diederichs, M. S., Kaiser, P. K. & Eberhardt, E. 2004. Damage initiation and propagation in hard rock during tunnelling and the influence of near-face stress rotation. Int J Rock Mech Min Sci. Vol 41(5). pp.785-812.
Diederichs, M. S. 2003. Manuel Rocha Medal Recipient Rock Fracture and Collapse Under Low Confinement Conditions. Rock Mech Rock Eng. Vol 36(5). Pp. 785-812.
Fakhimi, A., Carvalho, F., Ishida, T. & Labuz, J.F. 2002. Simulation of failure around a circular opening in rock. Int. J. Rock Mech. Min. Sci. 39. pp. 507-515.
Haycox, J., Collins, D.S. & Pettitt, W.S. 2004. Microseismic results during the heating phase of the tunnel sealing experiment. ASC. Report #ASC001TOR to Lassonde Institute, University of Toronto. Toronto. Canada.
Haycox, J., Pettitt, W. & Young, R.P. 2005. Äspö Pillar Stability Experiment. Acoustic emission and ultrasonic monitoring. SKB. Report R-05-09. Sweden.
Hazzard, J.F. & Young, R.P. 2002. Moment tensors and micromechanical models. Tectonophysics. 356. Pp. 181-197.
Hazzard, J.F. & Young, R.P. 2004. Numerical investigation of induced cracking and seismic velocity changes in brittle rock. Geophys. Res. Lett. 31. 01604-1.
Hazzard, J.F. 1998. Numerical modelling of acoustic emissions and dynamic rock behavior. Thesis Ph.D. pp. 274. Keele University. UK.
Hoek, E. 1980. Underground excavations in rock. Institution of Mining and Metallurgy. London. UK. Itasca Consulting Group, Inc. 2004a. PFC2D. FISH in PFC2D volume. Vol. 3.1. Itasca Consulting Group.
Minneapolis. USA. Itasca Consulting Group, Inc. 2004b. PFC2D. Optional Features volume. Thermal Option. Vol. 3.1. Itasca
Consulting Group. Minneapolis. USA. Martin, C.D. 1993. The strength of massive Lac du Bonnet granite around underground openings. pp. 278.
PhD thesis. University of Manitoba. Winnipeg.Canada. Munjiza, A. 2004. The Combined Finite-Discrete Element Method. Queen Mary. University of London.
London. UK. Potyondy, D.O. & Cundall, P.A. 2004. A bonded-particle model for rock. Int.J.Rock Mech.Min.Sci. 41.
Pp. 1329-1364. Read, R.S., Martino, J.B., Dzik, E.J., Oliver, S., Falls, S. & Young, R.P. 1997. Analysis and Interpretation
of AECL's Heated Failure Tests. Atomic Energy of Canada Ltd. Report 06819-rep-01200-0070-r00. Wanne, T.S. 2009. Bonded-particle modeling of thermally induced damage in rock. Thesis Ph.D.
University of Toronto. Toronto. Canada. Young, R.P., Hazzard, J.F. & Pettitt, W.S. 2000. Seismic and micromechanical studies of rock fracture.
Geophys.Res.Lett. 27. Pp. 1767-1770.
ROCKENG09: Proceedings of the 3rd CANUS Rock Mechanics Symposium, Toronto, May 2009 (Ed: M.Diederichs and G. Grasselli)
PAPER 4170 12