bone protein ‘‘extractomics’’: comparing of...
TRANSCRIPT
Submitted 21 June 2016Accepted 20 September 2016Published 27 October 2016
Corresponding authorElena R. Schroeter,[email protected]
Academic editorLennart Martens
Additional Information andDeclarations can be found onpage 27
DOI 10.7717/peerj.2603
Copyright2016 Schroeter et al.
Distributed underCreative Commons CC-BY 4.0
OPEN ACCESS
Bone protein ‘‘extractomics’’: comparingthe efficiency of bone protein extractionsof Gallus gallus in tandem massspectrometry, with an eye towardspaleoproteomicsElena R. Schroeter1, Caroline J. DeHart2, Mary H. Schweitzer1, Paul M. Thomas2
and Neil L. Kelleher2
1Department of Biological Sciences, North Carolina State University, Raleigh, NC, United States2Proteomics Center of Excellence and Departments of Chemistry, Molecular Biosciences, and the FeinbergSchool of Medicine, Northwestern University, Evanston, IL, United States
ABSTRACTProteomic studies of bone require specialized extraction protocols to demineralizeand solubilize proteins from within the bone matrix. Although various protocolsexist for bone protein recovery, little is known about how discrete steps in eachprotocol affect the subset of the bone proteome recovered by mass spectrometry(MS) analyses. Characterizing these different ‘‘extractomes’’ will provide critical datafor development of novel and more efficient protein extraction methodologies forfossils. Here, we analyze 22 unique sub-extractions of chicken bone and directlycompare individual extraction components for their total protein yield and diversityand coverage of bone proteins identified by MS. We extracted proteins using differentcombinations and ratios of demineralizing reagents, protein-solubilizing reagents, andpost-extraction buffer removal methods, then evaluated tryptic digests from 20 µgaliquots of each fraction by tandem MS/MS on a 12T FT-ICR mass spectrometer. Wecompared total numbers of peptide spectral matches, peptides, and proteins identifiedfrom each fraction, the redundancy of protein identifications between discrete stepsof extraction methods, and the sequence coverage obtained for select, abundantproteins. Although both alpha chains of collagen I (the most abundant protein inbone) were found in all fractions, other collagenous and non-collagenous proteins(e.g., apolipoprotein, osteonectin, hemoglobin) were differentially identified.We foundthat when a standardized amount of extracted proteins was analyzed, extraction stepsthat yielded the most protein (by weight) from bone were often not the ones thatproduced the greatest diversity of bone proteins, or the highest degree of proteincoverage. Generally, the highest degrees of diversity and coverage were obtained fromdemineralization fractions, and the proteins found in the subsequent solubilizationfractions were highly redundant with those in the previous fraction. Based on thesedata, we identify future directions and parameters to consider (e.g., proteins targeted,amount of sample required) when applying discrete parts of these protocols to fossils.
Subjects Bioinformatics, Molecular Biology, PaleontologyKeywords Bone matrix proteins, Bone protein extraction protocols, Methods comparison,Paleoproteomics, Mass spectrometry, Proteomics
How to cite this article Schroeter et al. (2016), Bone protein ‘‘extractomics’’: comparing the efficiency of bone protein extractions of Gal-lus gallus in tandem mass spectrometry, with an eye towards paleoproteomics. PeerJ 4:e2603; DOI 10.7717/peerj.2603

INTRODUCTIONMolecular sequence data provide critical information for studies of evolutionary history,phylogenetic relationships, disease states, and other aspects of the biology of extant organ-isms. Additionally, molecular sequences recovered from fossils have the potential to shedlight on the origin of evolutionary novelties (e.g., feathers), resolve evolutionary relation-ships (e.g., Buckley, 2015; Welker et al., 2015), and identify indeterminate or fragmentaryfossil elements to the taxon that produced them (Buckley et al., 2010). However, until re-cently,molecular data were thought to be inaccessible from fossil remains, particularly thoseolder than one million years (Schweitzer, Schroeter & Goshe, 2014 and references therein).Proteomic analyses of archeological and paleontological bone tissues are fraught with manychallenges that hinder the widespread application of these techniques to fossils. Primaryamong these challenges is the inherent uncertainty surrounding the nature of the fossilsthemselves, which have undergone processes that are impossible to directly measure orobserve, but which profoundly affect the chemistry of organic matter remaining withinthem. These include, but are not limited to, uncertainty in the rates at which proteins maydegrade over geologic time, and the role that any given environmental factor plays in proteinpreservation and/or degradation (Hedges, 2002; Nielsen-Marsh et al., 2000; Nielsen-Marsh& Hedges, 2000), uncertainty regarding diagenetic modifications that might alter thechemical structure of ancientmolecules (e.g., AGEs) (Cleland, Schroeter & Schweitzer, 2015;Nielsen-Marsh et al., 2005; Van Klinken & Hedges, 1995), and finally, uncertainty over whatfluctuations in the biological, thermal, and hydrological conditions a fossil may have beensubjected to over thousands to millions of years, and how these may affect their molecularcomposition (Schroeter & Cleland, 2016; Smith et al., 2003). However, although molecularstudies on fossil remains will always be laden with unknown (and unknowable) variablesthat must be studied indirectly, the nascent field of molecular paleontology is also affectedby unexplored gaps in our knowledge which must be addressed and resolved for the fieldto continue to progress.
One such gap is the incomplete understanding of how different protein extractionprotocols ultimately affect the results produced in proteomic studies of fossil bone.Bone is a composite tissue comprising an organic matrix (approximately 90% collagen Iand 10% other, non-collagenous proteins (NCPs) biomineralized with hydroxyapatite(Ca5(PO4)3OH) (Weiner & Wagner, 1998; Young, 2003; Zylberberg, 2004). Biomineraliza-tion confers stability and stiffness to bone tissue (Gautieri et al., 2011; Wang et al., 2012;Weiner & Wagner, 1998), and is hypothesized to confer resistance to enzymatic digestionof the proteinaceous component (Collins et al., 2002; Trueman & Martill, 2002) that mayallow it to persist over geologic time (Schweitzer, Schroeter & Goshe, 2014).However, this in-timatemineral association also requires the use of specialized extraction protocols to recoverproteins from the bone matrix (Cleland, Voegele & Schweitzer, 2012). A variety of reagentshave been employed to remove bone mineral and increase access to remaining organicfractions, such as hydrochloric acid (HCl) (Buckley, 2013;Buckley, 2015;Buckley et al., 2009;Buckley et al., 2010; Buckley, Larkin & Collins, 2011; Buckley & Wadsworth, 2014; Cleland,Schroeter & Schweitzer, 2015; Cleland, Voegele & Schweitzer, 2012; Ostrom et al., 2000;
Schroeter et al. (2016), PeerJ, DOI 10.7717/peerj.2603 2/32

Wadsworth & Buckley, 2014; Welker et al., 2015), sodium ethylenediaminetetraacetic acid(EDTA) (Buckley et al., 2008; Cappellini et al., 2012; Cleland, Voegele & Schweitzer, 2012;Humpula et al., 2007; Nielsen-Marsh et al., 2002; Nielsen-Marsh et al., 2005; Ostrom et al.,2006; Schweitzer et al., 2007; Schweitzer et al., 2009), and ammonium EDTA (Ostrom et al.,2000). Reagents used to solubilize bone proteins for subsequent mass spectrometry (MS)and immunological applications are equally diverse, and have included (among others)ammonium bicarbonate (ABC) (Buckley et al., 2009; Buckley et al., 2010; Buckley, Larkin &Collins, 2011; Cappellini et al., 2012; Cleland, Schroeter & Schweitzer, 2015; Cleland, Voegele& Schweitzer, 2012), and guanidine hydrochloride (GuHCl) (Buckley, 2015; Buckley &Wadsworth, 2014; Cleland, Voegele & Schweitzer, 2012; Schweitzer et al., 2007; Schweitzer etal., 2009;Wadsworth & Buckley, 2014). However, these methods have not been consistentlyemployed across fossil studies, which may hamper direct comparisons of preserved proteincontent between fossil specimens, as these reagents have been shown to vary in efficacywhen used to extract bone proteins for enzyme-linked immunosorbent assay (ELISA) andsodium dodecyl sulfate polyacrylamide gel electrophoresis (SDS-PAGE) (Cleland, Voegele& Schweitzer, 2012). One might expect these reagents to produce similar disparities in MSanalyses, but little is known about how discrete steps in the respective protocols affectabsolute protein yield, or which subset of the bone proteome is preferentially recoveredby each method. Indeed, MS analyses of other tissues (e.g., insect tissue (Cilia et al., 2009),mouse cartilage (Wilson & Bateman, 2008)) have shown that different reagents solubilizedistinct subsets of the tissue’s proteome (i.e., an ‘‘extractome’’), suggesting that the choiceof extraction reagent alone can greatly affect the regions of the proteome identified byMS. Therefore, the resulting protein identifications may not reflect the entirety of what isactually present in a sample.
Here, we begin to address this last issue through an in-depth comparison of extractomesidentified from discrete steps of protein extractions from chicken bone. Little is knownabout how variations in protocol affectMS results for fresh bone, let alone fossil bone. Thus,it is first necessary to test the efficiencies of extraction methodologies on extant tissues toestablish any disparity between protocols themselves, absent the chemical influences ofdiagenesis that can alter a fossil proteome in a highly variable manner between individualfossils. Establishing this baseline provides critical data for future development of novel andmore efficient protocols for extant bone and insight into discrete protocol steps that maybe promising for further testing for their utility in paleoproteomic investigations.
To compare the efficiency of separate parts of extraction methods in depth, we appliedseven protocols that use a variety of reagents to demineralize bone mineral and solubilizeremainingmatrix proteins (Table 1) to fresh chicken bone. Although the literature describesa plethora of bone protein extraction procedures, the methods we selected reflect similarprotocols that have previously been used or suggested for fossil bone (e.g., Buckley et al.,2009; Buckley et al., 2010; Buckley & Wadsworth, 2014; Cleland, Voegele & Schweitzer, 2012;Schweitzer et al., 2007; Schweitzer et al., 2009; Wadsworth & Buckley, 2014). At each step,the collected supernatants (containing extracted proteins) were divided and subjectedto two different methods to remove reagent buffers and concentrate extracted products.The experimental design, graphically represented in Fig. 1, resulted in 22 unique fractions
Schroeter et al. (2016), PeerJ, DOI 10.7717/peerj.2603 3/32

Table 1 Extraction protocols.Demineralization and solubilization reagents, as well as applied volumes, incubation times and temperatures, andany wash stages, are provided in standardized format for easy comparison. At the bottom of each treatment description is the identifying code forthe precipitated and dialyzed portions of each fraction produced that is used throughout the manuscript. This code combines the reagent volume,any pretreatment before reagent incubation, reagent, and buffer removal method into a shortened form (e.g., 20-H/ABC-D).
Method Demineralizing agent(mL solution/g of bone)
Solubilizing agent(mL solution/g of bone)
Special steps
Method 1 HCl-GuHCl (Cleland,Voegele & Schweitzer, 2012;Wadsworth & Buckley, 2014)
0.6 M HCl5 mL/g for 1 day @ RT5-HCl-D & 5-HCl-P
4 M GuHCl in 0.05 M Tris5 mL/g for 1 day @ 65 ◦C5-H/GuHCl-D & 5-H/GuHCl-P
Method 2 HCl-SDS(Craig & Collins, 2002)
0.6 M HCl5 mL/g for 1 day @ RT5-HCl-D & 5-HCl-P
2% SDS10 mL/g for 2 days @ RT10 mL/g for 2 days @ RT20-H/SDS-D & 20-H/SDS-P
Wash pellet with H2Oafter HCl
Method 3 HCl-Urea(Rabilloud, 1998)
0.6 M HCl5 mL/g for 1 day @ RT5-HCl-D & 5-HCl-P
8 M Urea, 2 M Thiourea,1% CHAPS, 0.05 DTT10 mL/g for 2 days @ RT10 mL/g for 2 days @ RT20-H/Urea-D & 20-H/Urea-P
Wash pellet with H2Oafter HCl
Method 4 HCl-ABC (Buckley et al.,2009; Buckley et al., 2010)
0.6 M HCl20 mL/g for 1 day @ RT20-HCl-D & 20-HCl-P
0.05 M (NH4)HCO3
20 mL/g for 1 day @ 65 ◦C20-H/ABC-D & 20-H/ABC-SV
Wash pellet with H2Oafter HCl
Method 5 EDTA-GuHCl(Schweitzer et al., 2009)
0.5 M EDTA4 mL/g for 1 day @ RT2 mL/g for 5 days @ RT6-EDTA-D
6 M GuHCl in 0.1 M Tris2 mL/g for 1 day @ 65 ◦C2 mL/g for 1 day @ 65 ◦C4 mL/g for 2 days @ 65 ◦C8-E/GuHCl-D & 8-E/GuHCl-P
Method 6 EDTA-ABC- GuHCl 0.5 M EDTA20 mL/g for 5 days @ 4 ◦C20-EDTA-D
0.05 M (NH4)HCO3
20 mL/g for 1 day @ 65 ◦C20-E/ABC-SV4 M GuHCl in 0.05 M Tris20 mL/g for 1 day @ 65 ◦C20-E/A/GuHCl-D
Method 7 EDTA- Acetic Acid(Liu et al., 2012; Singh et al., 2011)
0.1 NaOH20 mL/g for 4 h @ RT0.5 M EDTA (1)20 mL/g for 3 days @ 4 ◦C20-N/EDTA1-D0.5 M EDTA (2)20 mL/g for 3 days @ 4 ◦C20-N/EDTA2-D
10% Butyl Alcohol20 mL/g for 1 day @ 4 ◦C0.5 M Acetic Acid15 mL/g for 3 days @ 4 ◦C15-E/Acetic-D0.5 M Acetic Acid/w Pepsin20 mL/g for 2 days @ 4 ◦C20-E/A/Pepsin-D
NaOH and butyl alcoholwere discarded. MultipleH2O washes of pellet.
representing varied demineralizing reagents, pretreatment of pellet prior to demineral-ization, volume and/or number of serial incubations of the same demineralizing reagent,solubilization reagents used in tandemwith different demineralizing reagents, and buffer re-moval methods (e.g., precipitation, dialysis and lyophilization, or drying by speed vacuum).Each fraction was evaluated separately by bicinchoninic acid (BCA) protein assay, tandemMS/MS, and ELISA, allowing us to quantify differences in the amount of bulk bone proteinextracted, the diversity of unique proteins identified, and the percent of peptide sequencerecovered for select proteins (relative to the primary FASTA sequences listed in UniProt).
Schroeter et al. (2016), PeerJ, DOI 10.7717/peerj.2603 4/32
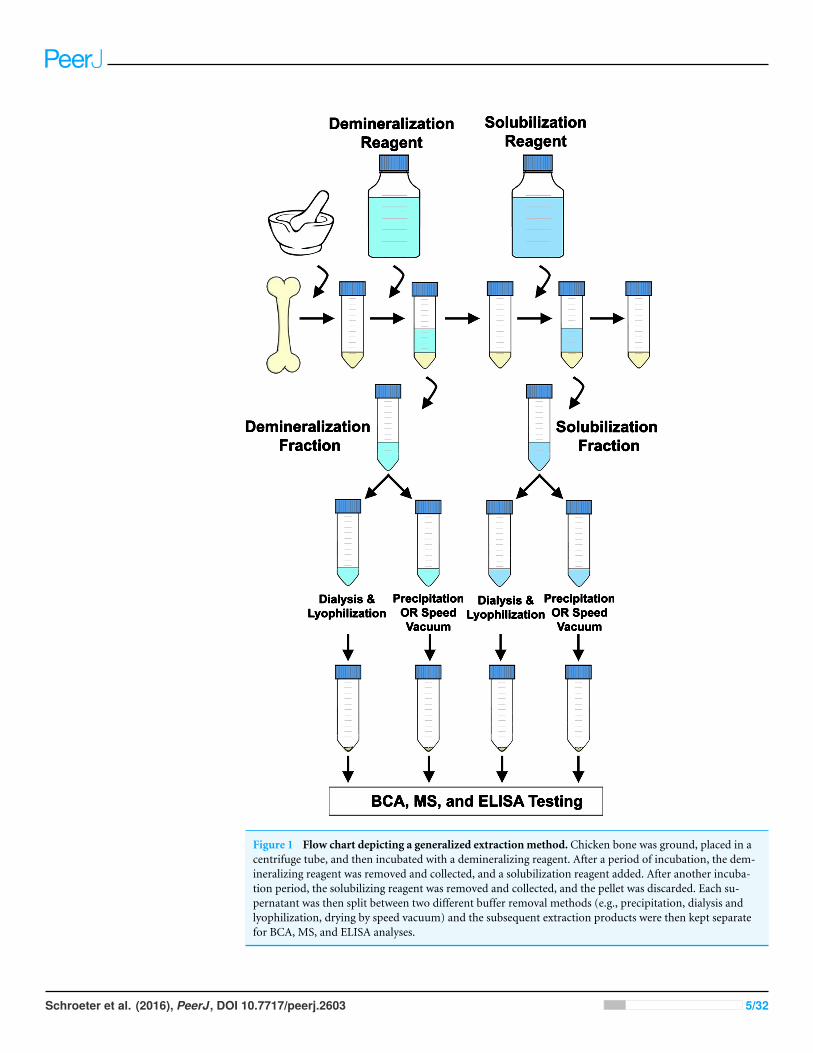
Figure 1 Flow chart depicting a generalized extraction method. Chicken bone was ground, placed in acentrifuge tube, and then incubated with a demineralizing reagent. After a period of incubation, the dem-ineralizing reagent was removed and collected, and a solubilization reagent added. After another incuba-tion period, the solubilizing reagent was removed and collected, and the pellet was discarded. Each su-pernatant was then split between two different buffer removal methods (e.g., precipitation, dialysis andlyophilization, drying by speed vacuum) and the subsequent extraction products were then kept separatefor BCA, MS, and ELISA analyses.
Schroeter et al. (2016), PeerJ, DOI 10.7717/peerj.2603 5/32

MATERIALS AND METHODSSample preparationTwo samples were evaluated using each extractionmethod; one containing ground, defattedchicken bone, and one ‘‘blank’’ sample, consisting of extraction buffers (but no bonesamples) to serve as a negative control. Chicken tibiotarsi were defleshed, then degreasedwhole in 10% Shout (Johnson Co.) with stirring for 1–2 days to remove lipids and bloodfrom the medullary cavity and periosteal surfaces. Bones were then sectioned into large (∼1cm)pieces anddegreased for an additional day. Concentrated Shout contains small amounts(0.001% –1%) of the enzyme subtilisin, which has been shown to have collagen-cleavingproperties (Ran et al., 2013); however we applied a diluted form the detergent (0.0001–0.1%enzyme), and only to whole bone pieces prior to grinding or homogenization. Thus, wethink it is unlikely that the trace amounts of enzyme significantly affected the proteomeof the tissue deeper in the cortex. After triple washing in 18.2 M� water to remove anyremaining detergent from the bone surfaces, pieces were frozen with liquid nitrogen for20 s and then ground with a mortar and pestle to the consistency of coarse sand. Bonepowders from all bones were homogenized before aliquotting to ensure uniform samplesof tissue for all extractions.
Protein extractionsThe basic steps and parameters of each protein extraction protocol are summarized inTable 1, and details of each method are provided below. For all protocols, ‘‘samples werecentrifuged’’ refers to centrifugation at 7,200 rcf for 20 min at 4 ◦C unless otherwise stated.Volumes of reagents applied are given as ‘‘mL/g,’’ referring to the mL of reagent appliedper gram of bone.
Method 1 (HCl–GuHCl)Protocol modified from Cleland, Voegele & Schweitzer (2012) and Wadsworth & Buckley(2014). Bone powder (2 g) was demineralized in 0.6 M hydrochloric acid (HCl) (5 mL/g)and incubated at room temperature (RT) overnight with rocking. Samples were pelletedby centrifugation, and supernatants were collected. Pellets were resuspended in 5 mL/g 4M guanidine hydrochloride in 50 mM Tris (pH 7.4), followed by incubation at 65 ◦C ona heating block overnight. After incubation, samples were centrifuged again, supernatantscollected, and pellets discarded.
Method 2 (HCl–SDS)Protocol modified from Craig & Collins (2002). Bone powder (2 g) was demineralizedby incubation in 0.6 M HCl (5 mL/g) at RT overnight with rocking, centrifuged, andsupernatants collected. Remaining pellets were neutralized by washing three times with 5mL of 18.2 M� water, then resuspended in 10 mL/g of 2% sodium dodecyl sulfate (SDS)and incubated at RT with rocking for 2 days. Samples were centrifuged and supernatantswere collected. The solubilization step was then repeated. SDS supernatants were combinedand pellets were discarded.
Schroeter et al. (2016), PeerJ, DOI 10.7717/peerj.2603 6/32

Method 3 (HCl–Urea)Protocol modified from Rabilloud (1998). Bone powder (2 g) was demineralized in 0.6 MHCl (5 mL/g) and incubated at RT overnight with rocking. Samples were centrifuged andsupernatants were collected. Pellets were neutralized by washing 3 times with 5 mL of 18.2M�water, and wash water was discarded. Pellets were resuspended in 10 mL/g of 8M urea,2M thiourea, 1%CHAPS, and 0.05MDTT (hereafter, ‘‘Urea’’). After incubating at RTwithgentle agitation for two days, samples were centrifuged, supernatants collected, and the sol-ubilization step was repeated. Resulting supernatants were combined and pellets discarded.
Method 4 (HCl–ABC)Protocol modified from Buckley et al. (2009) and Buckley et al. (2010). Bone powder (2 g)was demineralized in 0.6MHCl (20mL/g) and incubated at RT overnight as above. Sampleswere centrifuged and supernatants collected. Pellets were neutralized by washing six timeswith 20–40 mL 18.2 M� water until pH reached 6, and wash water was discarded. Pelletswere resuspended in 20 mL/g of 50 mM ammonium bicarbonate (ABC) and incubated at65 ◦C overnight in a heating block. Samples were centrifuged, supernatants collected, andpellets discarded.
Method 5 (EDTA–GuHCl)Protocol modified from Schweitzer et al. (2009). Bone powder (2 g) was demineralized in0.5 M ethylenediaminetetraacetic acid (pH 8.0) (EDTA) (4 mL/g) and incubated at RTovernight with rocking. Samples were centrifuged at 6,000 rcf for 15 min and supernatantswere collected. Pellets were resuspended in an additional 2 mL/g 0.5 M EDTA, incubatedat RT for 5 days with rocking, and then centrifuged. EDTA supernatants were collectedand pooled with the previous EDTA fraction. Pellets were resuspended in 2 mL/g of 6 Mguanidine hydrochloride in 0.1 M Tris (pH 7.4) and incubated at 65 ◦C on a heating blockovernight. Samples were centrifuged and supernatants were collected. The solubilizationstep was repeated twice more (again with 2 mL/g for 1 day, then with 4 mL/g for 2 days),and all three GuHCl supernatants were combined (total final volume 8 mL/g). Pellets werethen discarded.
Method 6 (EDTA–ABC–GuHCl)For this extraction, only 1 g of bone samplewas prepared, because subsequent fractionswerenot split between post-processing methods (see below). Bone powder (1 g) was demineral-ized in 0.5 M EDTA (pH 8.0) (20 mL/g) incubated at 4 ◦C for 5 days with rocking. Sampleswere centrifuged and supernatants were collected. Pellets were resuspended in 20 mL/g of50 mM ABC, incubated at 65 ◦C overnight, then centrifuged and supernatants collected.Pellets were resuspended in 20 mL/g of 4 M GuHCl in 50 mM Tris (pH 7.4) and incubatedat 65 ◦C overnight. Samples were centrifuged, the final supernatants were collected, andpellets were discarded.
Method 7 (EDTA–Acetic acid)Collagen purification protocol modified from Liu et al. (2012) and Singh et al. (2011). Thisnarrowly targeted protocol is used to purify collagen I for inoculation; it was included tocompare its efficacy for collagen I coverage against more generalized extraction methods.
Schroeter et al. (2016), PeerJ, DOI 10.7717/peerj.2603 7/32

To remove NCPs, bone powder (2 g) was incubated in 0.1 M sodium hydroxide (NaOH)(20 mL/g) at 4 ◦C for 4 h with rocking. Samples were centrifuged and supernatantswere discarded. Pellets were washed six times with 20 mL of 18.2 M� water, until washwater reached a neutral pH, and wash water was discarded. To demineralize, 20 mL/g of0.5 M EDTA (pH 8.0) was added to each pellet and incubated at 4 ◦C with rocking forthree days. Samples were centrifuged and supernatants collected. The demineralizationstep was repeated, and subsequent supernatants were kept separate for analysis. Pelletswere washed with 20 mL 18.2 M� water 5 times, then incubated in 20 mL/g 10% butylalcohol overnight at 4 ◦C to remove any fats remaining after Shout pretreatment ofthe periosteal and medullary bone surfaces (see above). Samples were centrifuged andsupernatants discarded. Pellets were washed as above, then incubated in 15 mL/g 0.5 Macetic acid at 4 ◦C for three days to solubilize liberated collagen. Samples were centrifugedand supernatants collected. Pellets were resuspended in 20 mL/g 0.5 M acetic acid with500 µg/mL pepsin A for two days at 4 ◦C. Samples were centrifuged, supernatants werecollected, and remaining pellets were discarded.
Acetic acid fractions were filtered through densely packed fiberglass (Pyrex) in a 10mL syringe. The acetic acid fraction without pepsin was neutralized with NaOH, thensupernatants were brought to a 0.9 M NaCl concentration and incubated overnight at RT.Samples were centrifuged at 7,200 rcf for 40 min. Resulting supernatants were transferredto new tubes, and pellets were stored at 4 ◦C. NaCl was added to the supernatants to afinal concentration of 2.6 M and samples were incubated overnight at RT. Samples wereagain centrifuged at 7,200 rcf for 40 min and supernatants were discarded. Pellets (0.9 Mand 2.6 M) were combined and resuspended in 20 mL 0.5 M acetic acid, then salted to 2.0M and again incubated overnight at RT. Samples were centrifuged as above, supernatantsdiscarded, and pellets resuspended in 20 mL 0.5 M acetic acid. Acetic acid fractions withpepsin were prepared without neutralizing the pellet. Supernatants were brought to 2.0M NaCl and incubated overnight at RT. Samples were centrifuged as above, supernatantsdiscarded, and the pellets resuspended in 20 mL 0.5 M acetic acid. The 2.0 M salt-out stepwas repeated, and the final pellets were resuspended in 20 mL 0.5 M acetic acid.
Buffer and salt removal and concentration of proteinsAfter extractions were performed and supernatants collected, different post-extractiondesalting and buffer removal methods were employed to test the efficacy of each for re-moving buffers, bone minerals, residual salts, detergents, and other non-protein extractionproducts that can interfere with downstream analyses (e.g., pellet weight calculation,protein quantification assays, ionization in MS) (Visser, Lingeman & Irth, 2005) whileretaining protein. All extraction supernatants collected were centrifuged to pellet anydebris, then divided equally into two fractions, each placed into pre-weighed tubes andstored at 4 ◦C. For all fractions of all protocols, half of the extraction supernatant wasdialyzed and lyophilized to dryness, and half was precipitated, except as noted below. Atthe end of each method, post-weighing sample tubes allowed for calculation of pellet mass.
Schroeter et al. (2016), PeerJ, DOI 10.7717/peerj.2603 8/32

PrecipitationTo HCl fractions, 1 mL of 100% trichloroacetic acid (Rajalingam et al., 2009) was addedper 4 mL of HCl, followed by overnight incubation at 4 ◦C, centrifugation, and discardingof supernatants. Remaining pellets were washed twice with 5 mL of 100% cold acetone.To GuHCl and SDS fractions, 5 mL of 100% ethanol was added per 1 mL of supernatant,followed by overnight incubation at−20 ◦C. Samples were centrifuged, supernatants werediscarded, and remaining pellets were washed twice with 90% ethanol. To Urea fractions,5 mL of 100% cold acetone was added per 1 mL of Urea and samples were incubatedovernight at −20 ◦C. Samples were centrifuged and supernatants were discarded.Remaining pellets were washed twice with 5 mL 100% cold acetone. All tubes wereinverted and pellets were allowed to dry at RT.
Note: EDTA, ABC, and acetic acid fractions were not subject to precipitation; all EDTAfractions were dialyzed, ABC fractions were split between drying by speed vacuum anddialysis/lyophilization (see below), and acetic acid fractions specific treatment (see below).
DialysisEDTA, HCl, SDS, ABC, Urea, GuHCl, and Acetic Acid supernatants were placed into 3,500MWCO SnakeSkin R© dialysis tubing (Thermo Scientific) and dialyzed against 4 L of 18.2M� water (acetic acid fractions were dialyzed against 0.1 M acetic acid) for 4 days at 4◦C, exchanging dialysis water two times daily. After the final exchange, dialyzed sampleswere aliquoted into pre-weighed centrifugation tubes, frozen at −80 ◦C, and lyophilizedto completion for 2–5 days.
Drying by speed vacuumHalf of the ABC fractions collected were transferred directly into pre-weighed tubes anddried to completion using a speed vacuum (instead of precipitation). Because speedvacuuming is a technique that has been used for removal of ABC in previous boneprotein extraction experiments (e.g., Cleland, Voegele & Schweitzer, 2012), analysis of thistreatment is vital. Therefore, to accommodate the experimental design (which requireseach extraction supernatant to be split in half), we substituted speed vacuuming as one ofthe two buffer removal methods for ABC samples alongside dialysis and lyophilization,and excluded precipitation.
Subsequent to all buffer removal methods, final pelleted extraction products wereweighed. Weighed aliquots of each pellet were then solubilized in 1.5 mL 50 mM ABC sothat precise quantities of extraction products could be easily and consistently measuredfor future assays. Prior to each assay, sample aliquots were dried by speed vacuum beforesolubilization in assay buffer.
For clarity, individual fractions are hereafter referred to by a unique identifier codethat includes the volume of reagent applied per gram of bone (e.g., 5 mL/g, 20 mL/g), thereagent applied (e.g., HCl, EDTA), and the buffer removal method used (e.g., precipitation,dialysis). For example, 5 mL/g HCl fractions that were precipitated are ‘‘5-HCl-P,’’ anddialyzed 20 mL/g ABC fractions, collected after demineralization with EDTA, are ‘‘20-E/ABC-D.’’ These codes are listed in Table 1.
Schroeter et al. (2016), PeerJ, DOI 10.7717/peerj.2603 9/32

Bicinchoninic acid (BCA) protein assayTo determine total protein content in the final, post-lyophilization or precipitation pellet, aPierce BCA Protein Assay Kit (Thermo Scientific) was used according to themanufacturer’sspecifications (Thermo-Scientific, 2002). Aliquots (25 µg) of lyophilized, precipitated, ordried (by speed vacuum) extract from each fraction (see above) were resolubilized in 25 µLphosphate buffered saline solution (PBS) and plated (in duplicate) on a 96 well microtiterplate. 200µL of working reagent (50 parts BCA kit reagent A to 1 part reagent B) were addedto all wells, and plates were incubated at 37 ◦C for 30 min. Absorbance was measured ona Multiskan Spectrum 1500 microplate reader (Thermo Scientific) at a wavelength of 562nm using SkanIt 2.2 software. Sample protein content was determined against a standardabsorbance curve calculated from a serial dilution of bovine serum albumin (BSA) in PBSto the following concentrations (25 µL plated per well): 2 mg/mL, 1.5 mg/mL, 1 mg/mL,750 µg/mL, 500 µg/mL, 250 µg/mL, 125 µg/mL, 25 µg/mL, and 0 µg/mL (PBS only).Assays were repeated 4–7 times for each sample and total protein content per 25 µg ofpellet was assessed as the average of these multiple trials. Overall protein recovery and pelletpurity were calculated based on these results and the total weight of the recovered pellet foreach fraction. Extract products from ‘‘buffer only’’ samples were also tested to confirm thatinterference from left-over reagents did not cause spuriously high results in bone samples.
Protein digestion and mass spectrometryDuplicate aliquots of 20 µg protein were prepared from the following fractions: allfractions of Methods 1 and 4–6, the solubilization fractions of Methods 2 and 3 (dialysisonly of 3), and the demineralization fractions of Method 7. Methods that had fractionsidentical to some already tested (HCl from 2 and 3), extreme amounts of non-proteinprecipitation in the blank controls (precipitated ‘‘Urea’’ from 3), or solubilization fractionswith extremely low amounts of total protein yield (acetic acids from 7) were excluded.Samples were reduced in 20 µL of 8 M urea (previously deionized with BioRad AG 501-X8resin according to the manufacturer’s protocol) and 2 µL of 100 mM DTT diluted in 100mM ABC (final concentration ∼9.1 mM DTT) for 20 min at RT, then alkylated with 3µL of 300 mM iodoacetamide diluted in 100 mM ABC (final concentration ∼32.14 mMiodoacetamide) for 30 min at RT in the dark. Proteins were digested overnight with 200 ngof Trypsin Gold (mass spectrometry grade; Promega, activated for 15 min at 30 ◦C priorto application) diluted with 135 µL of 100 mM ABC and 1 µL of 1 M DTT. Digestionwas terminated with 2 µL of 100% formic acid (FA) and resulting peptides were desaltedand concentrated with C18 ZipTips (Millipore) as follows: Tips were activated with 90%acetonitrile (ACN), 0.2% FA, and equilibrated with 0.2% FA. Peptides were bound to tips,then washed with 0.2% FA and eluted into 30 µL of 70% ACN, 0.2% FA. Samples weredried by speed vacuum to remove acetonitrile, then stored at −80 ◦C until analysis.
Samples were resuspended in 27 µL of ‘‘Buffer A’’ (95% Optima grade water (FisherScientific), 5% Optima grade ACN (Fisher Scientific), 0.2% FA), centrifuged at 21,000× gfor 10 min at 4 ◦C, and transferred to autosampler vials (RSATM AQTM; MicroSolv) withcaps containing PFTE septa (Fisher Scientific). A Dionex Ultimate 3000 UHPLC System(Thermo Scientific) injected 6 µL of each sample onto a self-packed C18 Aqua (3 µm
Schroeter et al. (2016), PeerJ, DOI 10.7717/peerj.2603 10/32

particle size, 125 Å pore size; Phenomenex) trap column (4 cm L, 150 µm ID). Peptideswere washed and desalted for 10 min at a rate of 2.5 µL/min, then transferred to and elutedfrom a self-packed C18 Aqua analytical column (20 cm L, 75 µm ID) and spray emitter (12cm L, 15 µm ID, New Objective, self-packed with 2 mm C18 Aqua resin) at 300 nL/minwith the following gradient: 5% B at 0 min, 5% B at 12 min, 40% B at 45 min, 85% B at 47min, 85% B at 49 min, 5% B at 51 min., and 5% B at 60 min. (A: 95% Optima grade water(Fisher Scientific), 5% Optima grade ACN (Fisher Scientific), 0.2% FA; B: 95% Optimagrade ACN, 5% Optima grade water, 0.2% FA). Eluted peptides were then introducedinto a custom 12T LTQ Velos FT-ICR mass spectrometer (Thermo Scientific) for analysisby tandem MS/MS. Full-scan FT MS1 spectra were obtained with a 400–1800 m/z scanrange at a resolving power of 85.7k. The top 8 most abundant peaks per MS1 scan werethen selected for fragmentation by collision-induced dissociation (CID). MS2 scans wereperformed in the ICR cell (FT/FT) in centroid mode with an isolation window of 4 m/z , anormalized collision energy of 35%, an activation q of 0.25, and a duration of 15.0 ms at aresolving power of 42.9k. Dynamic exclusion was enabled with the following parameters:repeat count of 2, repeat duration of 45 s, exclusion duration of 30 s, and an exclusion listsize of 500. Total instrument acquisition time was 50 min for each sample run.
Data analysisSpectra were searched in PEAKS (version 7.5; Bioinformatics Solutions Inc.) using a pre-cursor mass tolerance of 10 ppm and a fragment ion mass tolerance of 0.2 Da. Two missedcleavages were allowed, as well as nonspecific cleavage at one end of the peptide. The fol-lowing post translational modifications were allowed: fixed—carbamidomethylation [C];variable—oxidation [M], oxidation or hydroxylation [RYFPNKD], [G]@C terminal, pyro-glu from Q, and deamidation [NQ]. Spectra were searched against the UniProt_chickendatabase, and PEAKS PTM and SPIDER were enabled to account for unspecified post-translational modifications (PTMs) or mutations, respectively. Results were filtered using≤ 1% FDR for peptide spectral matches (PSMs), and either a protein score of−log10p≥ 20,or ≤ 1% FDR (whichever was more stringent) plus at least 1 unique peptide for proteins.Effective FDR values and associated expect score cut-offs for each file searched, as well asthe number of MS and MS/MS scans performed, is provided in Table S1. Search resultswere analyzed by hand: peptides corresponding to common lab contaminants (e.g., keratin)were eliminated from consideration, and duplicate matches of one spectrum to multipleprotein accession IDs were reduced. Additionally, proteins identified by only 1 peptide in1 injection were eliminated (23 proteins), and only those found in multiple injections, oras multiple peptides from a single injection, were used for comparison. Finally, data fromduplicate trials of the same fractions were combined to account for variation between trials.
Enzyme-linked immunosorbent assay (ELISA)After total pellet protein concentration was calculated (see methods), aliquots of proteinextract from each pellet were solubilized with PBS into 10 µg/mL solutions. 100 µL aliquotsof sample solutions (1 µg of extracted bone protein) or 100 µL of PBS were added to thewells of an immulon U-bottom 96-well microtiter plate (Thermo Scientific) and allowedto incubate for 1–4 h at RT. After removal of antigen, to prevent non-specific binding
Schroeter et al. (2016), PeerJ, DOI 10.7717/peerj.2603 11/32

of antibodies directly to the plate, wells were blocked with 200 µL of 5% BSA diluted inPBS with Tween20 and thimerosal (hereafter ‘‘5% BSA’’) and the plate was incubatedeither 1–3 h at RT or overnight at 4 ◦C. A portion of wells from each sample was thenincubated with 100 µL of the following treatments, diluted in 5% BSA: polyclonal chickenspecific anti-collagen I (US Biological, C7510-13B) diluted 1:1000, polyclonal anti-alligatorhemoglobin (Bio-Synthesis, Inc., host # BYSN 6941, lot # AB1421-3) diluted to 1:700or 1:850, or 5% BSA only. We applied antibodies raised against alligator hemoglobin(HB), rather than commercially available polyclonal antibodies raised against chicken HB,because: (1) they were readily available in the time allotted for the experiment; (2) previoustests on antibodies against chicken HB were found to demonstrate non-specific binding tomultiple proteins (M Schweitzer, 2006, unpublished data); (3) chicken and alligators areboth archosaurian taxa (Brochu, 2001), therefore, substantial overlap in their hemoglobinepitopes is predicted.
Plates were incubated 1–3 h at RT or overnight at 4 ◦C, then washed 20 times in ELISAwash buffer (10% PBS diluted 18.2 M� water with Tween20). Wells received 100 µLof secondary antibody (alkaline phosphatase conjugated goat anti-rabbit IgG (H + L))diluted 1:2000 in PBS and were incubated 1–2 h at RT, then washed an additional 20times with ELISA wash buffer. 100 µL of substrate (diethanolamine substrate buffer +p-Nitrophenylphosphate, Pierce PNPP Kit) was added to each well, and absorbance at 405nmwas measured with a microplate reader (Multiskan Spectrum 1500; Thermo Scientific).Data were acquired using SkanIt 2.2 software. Measurements were taken at time = 0, 10,20, 30, 40, 60, 90, 120, 150, 180, 210, 240, and 270 min.
RESULTSBCA protein assayThe purity of the final pellet extracted from each method after precipitation, dialysisand lyophilization, or speed vacuuming, and thus the total recovered protein for eachsub-extraction, was determined by BCA assay. Graphs of the final pellet weight comparedto the calculated total protein recovered are shown in Figs. S1A and S1B. In every instance,dry pellet weight did not reflect actual extracted protein yield; total pellet weights were up to15 times greater than the weights of their calculated protein content. The maximum purityof any pellet in this study (i.e., percent of total pellet weight that was protein) was 44.8%in 20-H/Urea-D, followed by 43.8% in 20-H/ABC-SV. Significantly, all extractions andpost-extraction buffer removal methods conducted here produced a pellet that comprisedmore than 50% non-protein solids by weight.
The total protein yields per gram of bone analyzed for each demineralization andsolubilization fraction were calculated from the BCA results and are shown in Figs. S2Aand S2B, respectively. Demineralization fractions (Fig. S2A) recovered 0.51–6.3 mg proteinper gram of bone analyzed. The highest recovery was observed from 20-N/EDTA-D (6.30mg/g), followed by 20-HCl (whether precipitated or dialyzed) (4.59–4.74mg/g), 20-EDTA-D (4.30 mg/g), 8-EDTA-D (2.77 mg/g), 5-HCl (whether precipitated or dialyzed, 0.74–1.03mg/g), and finally, a second serial incubation of 20-N/EDTA2-D (0.51 mg/g).
Schroeter et al. (2016), PeerJ, DOI 10.7717/peerj.2603 12/32

Solubilization fractions (Fig. S2B) recovered between 0–58.39 mg of protein per gramof bone analyzed; the highest recovery values in the solubilization fractions exceededthat of the demineralization fractions by an order of magnitude. 20-ABC-SV recoveredthe most protein regardless of demineralizing agent (51.59–58.39 mg/g), followed by20-H/ABC-D and GuHCl regardless of demineralizing agent, buffer removal method, ormolar concentration (22.77–28.17 mg/g). Additionally, 20-E/A/GuHCl-D recovered 13.76mg/g protein after an ABC solubilization step (Method 6). This was similar to 20-H/Ureaextractions, which recovered 11.78–13.5 mg/g of protein regardless of buffer removalmethod, although an anomalously high amount of non-protein precipitant interferencein the blank, buffer-only samples was observed (see below). 20-H/SDS-D recovered 8.08mg/g, and 20-H/SDS-P less than a quarter that amount (1.52 mg/g). Acetic acid yields werebelow the limits of detection for this assay.
Mass spectrometryFor full consideration of their utility to bone proteomic research, mass spectrometrydata obtained from all fractions were analyzed in three different contexts: (1) quantity ofpeptide-spectral matches (PSMs)/peptides recovered; (2) diversity of identified proteinsand the redundancy of protein identifications between fractions within a method; and(3) the depth of sequence coverage (i.e., percent of recovered sequence length vs. totalsequence length for select proteins).
PSMs/peptidesThe highest number of PSMs (450–550) were recovered primarily from demineralizationfractions (Fig. 2A), specifically 20-HCl-D, 20-HCl-P, 5-HCl-P and both 20-N/EDTA-Dfractions. The one solubilization fraction that was in this range was 20-H/SDS-P, whichrecovered 468 PSMs. 20-H/ABC recovered∼350 PSMs whether dialyzed or dried by speedvacuum. All other fractions recovered less than 250 PSMs; the poorest overall recovery wasobserved in 20-EDTA-D and 20-H/SDS-D fractions (<50 PSMs).
When only unique peptides are analyzed (i.e., when PSM duplicates and PTM variationare reduced) (Fig. 2B), demineralization fractions recovered the highest numbers ofpeptides (∼150–250), including 20-HCl fractions, 5-HCl-P, and both 20-N/EDTA-Dfractions, with 5-HCl-P recovering the greatest number overall (238 peptides). The onlysolubilization fraction that recovered a total number of peptides within this range was20-H/SDS-P, with 178 peptides. 5-HCl-D, 6-EDTA-D, 5-H/GuHCl-D, 20-H/Urea-D and20-ABC (all variants) recovered 50–150 peptides. All remaining fractions recovered lessthan 50 unique peptides across two combined proteomic analyses.
Protein diversity and redundancyA total of 55 unique proteins (identified from at least two unique peptides) were recoveredacross all fractions (Table 2). Of the 55 proteins identified in this study, 14 had accessionnumbers that corresponded to ‘‘uncharacterized’’ proteins. However, these proteins allcontained substantial overlap with bone proteins from other avians when searched againstSwissProt using UniProt’s basic local alignment search tool (BLAST) (Liu et al., 2012). Forease of discussion, these ‘‘uncharacterized’’ proteins will be referred to by their matches in
Schroeter et al. (2016), PeerJ, DOI 10.7717/peerj.2603 13/32

B
C
A
Figure 2 Graphs of the total number of (A) peptide spectral matches (PSMs), (B) unique peptides(PTM variations eliminated), and (C) proteins identified within each fraction evaluated by massspectrometry. (A) The greatest number of PSMs were recovered mainly from demineralization fractions,specifically 20-HCl fractions, 5-HCl-P, and 20-N/EDTA-D fractions, which all recovered 550–450 PSMs.(continued on next page. . . )
Schroeter et al. (2016), PeerJ, DOI 10.7717/peerj.2603 14/32

Figure 2 (. . .continued)The only solubilization fraction to recover PSMs within this range was 20-H/SDS-P. The next highest val-ues were achieved by 20-H/ABC, whether dialyzed or dried by speed vacuum. This pattern was generallythe same for total number of peptides (B), though 5-HCl-P had a greater diversity of unique peptides thanhigher volume (20-HCl) fractions, which had a greater number of PSMs. This relative pattern was againrepeated in the numbers of unique proteins identified (C), which show that HCl, NaOH treated EDTA,and precipitated SDS recovered broader portions of the bone proteome than other extraction steps.
BLAST, marked with brackets to differentiate them from the fully characterized proteinsthat were also recovered (e.g., [kininogen], [Pigment epithelium derived factor (PEDF)]).A full list of proteins identified with their corresponding accession numbers, proteindescriptions, and BLAST matches is provided in Table S2.
The greatest number of proteins was identified in 20-HCl-P, which recovered 37 proteins(Fig. 2C). Demineralization fractions accounted for the top five recoveries ranging from25–37 proteins, including both 20-HCl-P and 20-HCl-D, 5-HCl-P, and both 20-N/EDTA1-D and 20-N/EDTA2-D. 20-H/SDS-P recovered 24 proteins, and was the only solubilizationfraction in which more than 15 proteins were identified. All other fractions recovered fewerthan 15 proteins.
To investigate whether demineralization fractions were recovering a set of proteinsdistinct from those obtained in the subsequent solubilization fractions, we constructedVenn diagrams from the lists of proteins identified by each method (Fig. 3). In five of themethods, more than 60.0% of the proteins found in the solubilization fractions were re-dundant with proteins previously identified in the demineralization fractions (60.0–92.9%,Table S3). Method 6, which included only one demineralization fraction (20-EDTA-D)but two serial solubilization fractions (20-E/ABC-SV and 20-E/A/GuHCl-D), showed45.5% redundancy when the two solubilization fractions were combined (5/11 proteins).Because of their minute yield, solubilization fractions for Method 7 were not tested byMS, and therefore we cannot assess their redundancy. However, the two serial incubationsof demineralizing agent in Method 7 (20-N/EDTA1-D and 20-N/EDTA2-D) were veryredundant; of the proteins recovered by each (25 in the first, 26 in the second), 23 were thesame (92.0% and 88.5% redundancy, respectively).
Sequence coverageTo compare sequence coverage of the most abundant proteins, we ranked the proteins withthe highest coverage in any fraction, then generated a heat map (Table 3) of the top 28 (i.e.,top half) that compares their coverage in all fractions. Of these 28 proteins, demineralizedfractions possessed the highest (or equal to highest) coverage for 23 proteins. 20-HCl-Pgave the best (or equal to best) coverage for 9 proteins (12K serum protein, 45.7%; cystatin,39.6%; decorin, 31.1%; [dentin matrix protein 1], 18.9%; gremlin-1, 16.8%; histone 2A,30.2%; lumican, 17.5%; matrix Gla, 54.5%; osteocalcin, 29.9%) and 20-HCl-D forfive proteins (12K serum protein, 45.7%; [alpha-2-HS-glycoprotein], 59.6%; cystatin,39.6%; [dentin matrix protein 1], 18.9%; osteocalcin, 29.9%). Lower volume, 5-HCl-P obtained the best or equal coverage of eight proteins (12K serum protein,45.6%; [EXFAB], 39.3%; gallinacin-7, 61.2%; histone 2B, 20.6%; lysozyme C, 34.7%;
Schroeter et al. (2016), PeerJ, DOI 10.7717/peerj.2603 15/32

Table 2 Breakdown of proteins identified in each fraction, and the number of peptides recovered for each (including variations in PTMs).Demineralization and solubilization fractions are divided by the centerline. Proteins for which 5+ peptides were recovered in any fractionare bolded. Of these proteins, fractions that resulted in the most peptide identifications are marked in dark purple, and fractions with peptideidentifications within one standard deviation of the highest value are marked in light purple. The highest diversity in identified proteins wasobserved predominantly in the demineralization fractions (left), which also resulted in the greatest numbers of peptides from most proteins. Onenotable exception was collagen I, alpha 2; various solubilization fractions (e.g., ABC, GuHCl) resulted in more peptide identifications for collagen I,alpha 2 than found in any demineralization fraction.
Schroeter et al. (2016), PeerJ, DOI 10.7717/peerj.2603 16/32

5-HCl-P
5-HCl-D
5-H/GuHCl-D
5-H/GuHCl-P
1
12 0
1
6 4 0
1 3
1 4 0
0 0
0
Method 1HCl–GuHCl
A
5-HCl-P
5-HCl-D
20-H/SDS-D
20-H/SDS-P
1
9 0
6
4 0 0
0 2
0 2 8
0 5
1
Method 2HCl–SDS
B
1
4
167
1 3
4
5-HCl-D 5-HCl-P
20-H/Urea-D
Method 3HCl–Urea
C
20-HCl-P
20-HCl-D
20-H/ABC-D
20-H/ABC-SV
4
4 1
1
19 1 2
2 0
0 8 2
1 1
0
Method 4HCl–ABC
D
9
1
11
1 2
4
6-EDTA-D 8-E/GuHCl-P
8-E/GuHCl-P
Method 5EDTA–GuHCl
E
4
1
42
0 1
3
20-EDTA-D 20-E/ABC-SV
20-E/A/GuHCl-D
Method 6EDTA–ABC–GuHCl
F
2 32320-N/EDTA1-D
20-N/EDTA2-D
Method 7(NaOH) EDTA 1–2
G
Combined RecoveryHCl, EDTA, & SDS
H
16
6
65
4 2
12
20-HCl-P 20-N/EDTA-D
20-H/SDS-P
Figure 3 Venn diagrams depicting overlap (i.e., redundancy) of identified proteins between separatefractions. (A) Method 1, (B) Method 2, (C) Method 3, (D) Method 4, (E) Method 5, (F) Method 6, (G)demineralization fractions of Method 7, and (H) a hypothetical method that combines three fractions tomaximize recovery. In methods 1–5 (A–E), there was a large amount of overlap between the demineraliza-tion and solubilization fractions, and most of the unique proteins were found in the demineralization frac-tions,(continued on next page. . . )
Schroeter et al. (2016), PeerJ, DOI 10.7717/peerj.2603 17/32

Figure 3 (. . .continued)rendering the solubilization fractions largely redundant. In Method 6 (F), there were slightly moreunique proteins in the two solubilization fractions (combined) than in the one demineralization fraction.In Method 7, there was substantial redundancy in the two sequential demineralization incubations,indicating that additional demineralization did not recover substantially new portions of the proteome.Combining three fractions (i.e., 20-HCl-P, 20-N/EDTA-D, and 20-H/SDS-P) into a hypotheticalextraction (H) accounted for 51 of the 55 proteins identified across all fractions in this study, with thelargest contribution of unique proteins coming from HCl.
myeloid protein, 37.1%; ribonuclease homolog, 18.0%; tetranectin, 38.8%). Highvolume 20-N/EDTA1-D gave the best/equal coverage for one protein in the firstincubation (osteonectin (F1P291), 69.8%) and five additional proteins in the second,20-N/EDTA2-D (apolipoprotein, 70.8%; [PEDF], 34.4%; serum albumin (P19121),51.2%; secreted phosphoprotein 24 (SPP-24), 25.0%; vitronectin, 24.1%). Solubilizationfractions obtained the best/equal coverage for only six proteins—20-H/SDS-P for(collagen I alpha 1, 23.8%; hemoglobin beta, 36.1%; histone 4, 17.5%; lumican,17.5%) and 20-H/ABC-SV for (collagen I alpha 2, 43.7%; transthyretin, 37.3%). Themost abundant proteins in bone, collagen I alpha 1 and 2, showed a generally similar rangeof coverage across the board (9.2–23.8% and 23.0–43.7%, respectively), with the exceptionof EDTA fractions, which obtained coverage ranges of 4.7%–20.3% for collagen I alpha 1and 6.8–13.5% for alpha 2.
ELISAELISA testing was performed to independently confirm select patterns observed in massspectrometry results. ELISA assays plated with extracts from demineralization fractions asthe antigen (Method 6 not included) with polyclonal anti-chicken collagen antibodies (Fig.S3A) yielded absorbance values as follows: 5-HCl fractions showed the highest absorbancevalues (0.78–0.84), which were similar (p= 0.1754) regardless of whether demineralizationor precipitation was used as a buffer removal method. 20-HCl-D showed an absorbancevalue similar to that of 5-HCl fractions (0.74, p= 0.1342, 0.2346), but 20-HCl-P wassignificantly lower (0.58, p< 0.05). All EDTA fractions (20-N/EDTA1-D, 20-N/EDTA2-D,and 6-EDTA-D) showed the lowest absorbance values (0.46, 0.46, and 0.50 respectively),and were significantly lower than the values obtained for 5-HCl fractions and 20-HCl-D(p< 0.05 in all instances). A table of p-values for t -test results between all tested fractionsis available in Table S4A.
To confirm the comparative efficiency of SDS for hemoglobin extraction, we tested avariety of extracts in ELISA with anti-alligator hemoglobin antibodies. ELISA performedon demineralization (Fig. S3B) and solubilization (Fig. S3C) fractions (Method 6 notincluded) with polyclonal antibodies raised against affinity purified alligator hemoglobinyielded absorbance values as follows: In the demineralization fractions (tested at anantibody concentration of 1:850), very low (but positive, as defined by absorbance at leasttwice above background levels (sensu Appiah et al., 2012; Ostlund et al., 2001; Tabatabai &Deyoe, 1984) absorbance values were obtained for HCl fractions 20-HCl-D, 20-HCl-P, and5-HCl-P (0.02–0.09) and EDTA fractions 6-EDTA-D, 20-N/EDTA1-D, and 20-N/EDTA2-D (0.12–0.09). In the solubilization fractions (tested at an antibody concentration of
Schroeter et al. (2016), PeerJ, DOI 10.7717/peerj.2603 18/32

Table 3 Heat map of the degree of peptide coverage obtained in all fractions for top 28 (top half) proteins with the highest coverage in any frac-tion.Demineralization and solubilization fractions are divided by the centerline. Of the 28 proteins listed, the greatest (or equal to greatest) degreeof peptide coverage for 23 of them was detected in demineralization fractions. Notable exceptions to this trend include collagen I alpha 1 and alpha2; best coverage for these abundant bone proteins was obtained in 20-H/SDS-P and 20-H/ABC-SV, respectively. A color legend for the heat map isprovided at the bottom of the table.
1:700), 20-H/Urea-D had very low, but positive absorbance (0.02). SDS fractions obtainedthe highest absorbance values, which were significantly greater (p< 0.05) than all otherextracts tested; additionally, 20-H/SDS-D absorbance values (0.75) were three times thatof 20-H/SDS-P (0.26). A table of p-values for t -test results between all tested fractions isavailable in Table S4B.
DISCUSSIONComparison of chicken extractsThe data generated by this study reveal a number of patterns that influence proteomicstudies of bone. First, the dry weight of the pellet remaining after extraction and bufferremoval did not accurately reflect its calculated protein content, in most cases by a verywide margin, and is therefore a poor indicator of actual protein yield (Fig. S1). In fact,pellet weight did not accurately predict relative protein content when comparing variousextractions, in that larger pellets did not necessarily correspond to a larger protein yield.
Schroeter et al. (2016), PeerJ, DOI 10.7717/peerj.2603 19/32

For example, 5-H/GuHCl-P had a pellet weight of 151.1 mg and a protein content of28.15 mg, whereas 8-E/GuHCl-P produced a far larger pellet (357.3 mg) but less protein(23.48 mg) (Fig. S1B). In all cases, less than half the pellet mass could be ascribed toproteins, indicating that none of the buffer removal methods we employed completelyremoved salts, detergents, and other non-protein solids from the sample. The inaccuracyand inconsistency of the relationship between pellet weight and protein content suggestthat pellet weight should not be used as a proxy for assessing the yield of a bone proteinextraction or for preparing subsequent samples for further proteomic analyses.
The most important pattern shown by this data is that, although solubilization fractions(e.g., ABC, GuHCl) overall recovered farmore bulk protein than demineralization fractions(e.g., HCl, EDTA) (Fig. S2), demineralization fractions contained a greater diversity ofproteins in each µg of recovered protein extract (Table S2). This translates to the recoveryof more NCPs, and in many cases better peptide coverage of those NCPs. Indeed, in allbut one instance, the greatest proteomic diversity in each method resulted from whicheverreagent was applied to the pellet first (the exception is Method 6, in which 20-E/ABC-SVextracted 10 proteins compared to the nine extracted in the preceding 20-EDTA-D).
This is critical knowledge when designing studies to elucidate the bone proteome. Al-though the large disparity in protein yield between the two fractionswould seem tomake theloss from discarding the demineralizing reagents negligible, our proteomic data shows thatthese demineralization fractions contain an extractome with a much greater wealth ofproteomic diversity per µg. Additionally, as mass spectrometry does not require largeamounts of protein (but rather analyzes protein concentrations on the order of µg tong), the relatively low total mass of protein extracted by demineralizing agents should notpreclude proteomic analysis by tandem MS/MS in many cases. Although a greater mass ofprotein extracted by solubilization reagents may be necessary for downstream applications(e.g., gel electrophoresis), or for maximum recovery from degraded, low-protein samples,we strongly recommend that, when conducting proteomic analyses of bone (fossil orextant) the demineralization and wash products be retained and investigated, rather thandiscarded.
Beyond that overarching point, we also observed some general trends in the extractomerecovered by each discrete step of the extraction protocols. Among demineralizationfractions, larger volumes of reagent (relative to bone mass) generally resulted in a higherbulk protein yield and greater numbers of peptides, protein diversity, and sequence coverageidentified by downstream MS analyses, with some exceptions and caveats. Increasing therelative volume of either HCl or EDTA from 5 mL/g to 20 mL/g led to double or triple thebulk protein yield (Fig. S2), and HCl or EDTA showed similar protein recovery at similarvolumes. Notably, a brief incubation of the pellet in NaOHprior to application of EDTA ledto a slightly higher protein yield for this reagent (e.g., 20-N/EDTA1-D vs. 20-EDTA-D), butthe reason for this is unclear. Although increasing reagent volume increased protein yield,additional incubations in fresh reagent did not generate a substantial amount of additionalbulk protein during demineralization (Method 7, 20-N/EDTA1-D vs. 20-N/EDTA2-D).For HCl fractions, dialysis versus precipitationmade virtually no difference for total proteinyield (Methods 1–4).
Schroeter et al. (2016), PeerJ, DOI 10.7717/peerj.2603 20/32

MSanalyses showed that 20-HCl (Method 4) incubations resulted in the highest degree ofdiversity in recovered proteins, with precipitated fractions resulting in a degree of recoveredprotein diversity only slightly higher than dialysis. Furthermore, only the two 20-HClfractions recovered [alpha-2 antiplasmin], coagulation factor IX, osteonectin (P36377),and osteopontin (Table 2). When compared with other protocols, 20 mL/g HCl resultedin the greatest percentage of peptide coverage for 10 proteins (12K serum protein, [alpha-2-HS-glycoprotein] cystatin, decorin, [dentin matrix protein 1], gremlin-1, histone 2A,lumican, matrix Gla, and osteocalcin) and resulted in ∼20% and ∼30% peptide coveragefor collagen I alpha 1 and alpha 2, respectively (Table 3). 5-HCl-P incubations (Methods1–3) performed similarly to larger-volumeHCl fractions in protein diversity (p> 0.05) andcoverage. 5-HCl-P was the only fraction to recover [heterochromatin associated protein],and resulted in the best peptide coverage for 8 other proteins, including 12K serum protein,[EXFAB], gallinacin-7, histone 2B, lysozymeC,myeloid protein, ribonuclease homolog, andtetranectin. Conversely, 5-HCl-D fractions resulted in similar peptide counts and percentcoverage for collagen I alpha 1 and alpha 2 (∼20% and ∼30%, respectively) as otherHCl fractions, but a much lower number and percent coverage for identified NCPs (Table3). Although 20-HCl treatments only performed marginally better than precipitated5-HCl-P, the larger total protein yield of the 20-HCl fractions (∼4.5 mg/g vs. ∼1 mg/g)lead us to recommend larger volumes for extraction over smaller volumes for modernsamples (there are additional concerns for fossil samples; see below). Finally, it should alsobe noted that osteocalcin, a small, acidic NCP intimately associated with bone mineral(Buckley et al., 2008; Ostrom et al., 2006; Ostrom et al., 2000), was consistently found inHCl fractions, but only in HCl fractions (Table 2). This may be the result of osteocalcindecarboxylation in an acidic reagent.
Proteins identified within EDTA fractions were, on average, less diverse than thoseidentified within HCl fractions, but were in some ways complementary to the regions ofthe proteome retrieved by HCl. We tested 4 different fractions of EDTA: two combinedserial incubations of EDTA (6-EDTA-D, Method 5), 20-EDTA-D (Method 6), and twoseparated serial incubations of 20 mL/g EDTA, prior to which the bone powder had beenbriefly incubated in 0.1 M NaOH (20-N/EDTA1-D and 20-N/EDTA2-D, Method 7). The20-N/EDTA-D incubations out-performed both non-NaOH prepped EDTA fractionsfor total PSMs and peptides identified, overall protein diversity, and sequence coverage.Notably, the second serial incubation was slightly richer than the first, resulting in oneadditional protein (gremlin-1) and slightly greater or equal peptide coverage than theinitial incubations for 12 of the 16 proteins they shared for which coverage was tracked,despite having a substantially lower overall protein yield as measured by BCA (∼6.5mg/g in 20-N/EDTA1-D vs. ∼0.5 mg/g in 20-N/EDTA2-D, Fig. S2A). Taken together,20-N/EDTA-D incubations had the second highest degree of identified protein diversityof all reagents tested, after 20-HCl and 5-HCL-P fractions. Although EDTA fractions didnot identify any proteins that were not also identified in other treatments, 20-N/EDTA-Dfractions resulted in the highest percentage of peptide coverage for multiple key NCPs,including apolipoprotein, serum albumin (P19121), osteonectin (F1P291), [PEDF],secreted phosphoprotein 24, and vitronectin. However, although this method recovered
Schroeter et al. (2016), PeerJ, DOI 10.7717/peerj.2603 21/32

abundant NCPs, 20-N/EDTA-D extractions recovered only marginal amounts of collagen Irelative to other treatments, with 7.2–16.2% peptide coverage of alpha 1 and only 7.2–8.8%of alpha 2 (HCl fractions recovered∼20% and∼30% peptide coverage, respectively). Thissuggests that EDTA recovers less collagen than HCl overall, but contains a greater propor-tion of NCPs per µg of extracted protein than HCl extraction products. To test this hy-pothesis, we performed ELISA on 1 µg aliquots of extracted protein from demineralizationfractions using antibodies raised against purified collagen. The results (Fig. S3A) areconsistent with this interpretation; absorbance values, which are a proxy for antibody-antigen interactions (Paulie, Perlmann & Perlmann, 2005), are highest in HCl fractions,and lowest in 20-N/EDTA-D fractions, suggesting that less collagen I is present per µgEDTA-extracted bone proteins, leaving the presence of other NCPs that comprise bonetissue to account for the difference.
Conversely, 20-EDTA-D fractions, not pre-treated with NaOH, did comparativelypoorly, resulting in some of the lowest numbers of PSMs, peptides, proteins, and percentcoverage of all fractions. Unlike HCl, lower volumes of EDTA without NaOH pretreatmentdid better than their higher-volume counterpart (15 proteins identified from 6-EDTA-D vs.9 proteins identified from 20-EDTA-D). This discrepancy could be caused by the difficultyof removing EDTA from solution (e.g., Pereira-Mouries et al., 2002); thus, fractions withlarger volumes of reagent may retain more EDTA after dialysis and lyophilization, causinggreater interference during ionization and poorer MS results. However, both high andlow volumes of EDTA were much less efficient than either of the two serial incubationsof 20-N/EDTA-D. The reason for increased recovery in EDTA fractions pretreated withNaOH is unclear, andmust be evaluatedmore in depth. The purpose of this step in previouspublished protocols has been to remove NCPs from the bone (Liu et al., 2012) and it ispossible that, as opposed to completely removing the NCPs prior to demineralization,brief incubation in NaOH made them more accessible for removal by EDTA, given that20-N/EDTA-D fractions resulted in greater sequence coverage and more peptides ofnumerous NCPs and less coverage/fewer peptides of collagen I than all other fractions(Table 3). Since NaOH is used to buffer EDTA from an acidic to an alkaline pH (e.g.,pH 8), it is possible that slightly more basic conditions are optimal for NCP extractionfrom bone by EDTA. This hypothesis, however, remains to be fully tested. In any case,our data suggest that a brief incubation in NaOH increases the potential recovery of NCPswith EDTA demineralization, resulting in even greater peptide coverage of some proteinsthan HCl or any subsequent solubilization step, and should be considered as a possiblecomponent ofmethods where EDTAwill be used for demineralization or initial extractions.
Solubilization fractions generally extracted a larger yield of bulk protein (per gram ofbone analyzed) than demineralization fractions (Fig. S2), but resulted in a lower degreeof diversity in identified proteins from every 20 µg protein sample analyzed by MS (Fig.2 and Table 2). Furthermore, the proteins that were identified from the solubilizationfractions were mostly redundant with those recovered in the previous demineralizationstep (Fig. 3 and Table S3). There were two solubilization fractions that deviated from thistrend: 20-H/SDS-P (Method 2) and 20-H/ABC-SV (Method 4). For SDS, the precipitatedfraction displayed the most protein diversity of any solubilization fraction (24 proteins
Schroeter et al. (2016), PeerJ, DOI 10.7717/peerj.2603 22/32
identified), despite the fact that, except for acetic acid, it had the lowest overall proteinyield (∼1.5 mg/g). Additionally, 20-H/SDS-P obtained the greatest or equal coverage forfour proteins (collagen I alpha 1, hemoglobin beta, histone 4, lumican) and resulted in agreater or approximately equal degree of sequence coverage than HCl fractions for fouradditional proteins, after HCl had already been applied to the bone powder (Table 3).When compared solely to other solubilization fractions, 20-H/SDS-P obtained the greatestsequence coverage of 10 of the 16 proteins that were identified in these fractions for whichcoverage was tracked. The most significant unique feature of SDS in this study is thatit seemed to preferentially extract hemoglobin compared to other fractions. Althoughvarious fractions of HCl, Urea, and ABC contained, at most, one peptide of hemoglobinalpha-A or beta, precipitated SDS contained two peptides of hemoglobin alpha-A andseven peptides of hemoglobin beta (Table 2). To support comparative efficiency of SDS forhemoglobin extraction, we performed ELISA on protein extracts from different reagentsusing anti-alligator hemoglobin antibodies (see above). The low, but positive signal fromHCl and 20-H/Urea-D extracts are consistent with the isolated hemoglobin peptides foundin those extractions (Fig. S3B), and the corresponding spike of MS hemoglobin data inSDS is also seen in ELISA (Fig. S3C). Interestingly, the most absorbance observed in ELISAis from dialyzed SDS, which showed three times more absorbance than precipitated SDSwhen incubated with the same antibodies under the same conditions. This is peculiar,because although 20-H/SDS-D extracted much more bulk protein than 20-H/SDS-P, thedialyzed fractions did very poorly in MS, generating some of the lowest peptide, protein,and coverage results (Fig. 2B–2C and Table 3). We suspect that, rather than a lack ofprotein diversity in the sample, the poor MS results of 20-H/SDS-D were caused byinterference from remaining SDS detergent during ionization. As an anionic detergent,SDS is difficult to remove through dialysis (Naglak, Hettwer & Wang, 1990), and even traceamounts can cause signal suppression in MS by forming adducts with peptides, increasingsample conductivity, and other factors (Fridriksson, Baird & McLafferty, 1999; Shieh, Lee& Shiea, 2005). Therefore, although dialysis of SDS may retain more bulk protein thanprecipitation, potentially with greater richness of hemoglobin peptides than any otherstudied sub-extraction, our data show that precipitation is a comparatively better SDSremoval method for downstream MS applications.
20-H/ABC-SV (Method 4) resulted in the best peptide coverage for collagen I alpha 2(43.7%) and transthyretin. Although it did not rank in the top five treatments for resultingpeptide counts or identified protein diversity, when compared solely to other solubilizationfractions, it resulted in the best coverage of certain key bone and serum proteins including[alpha-2-HS-glycoprotein], and osteonectin (F1P291). Dialyzed and speed vacuumed20-H/ABC resulted in variable identifications of low-abundance proteins, but generallyproduced the same degree of protein diversity (15 proteins identified) and similar peptidecounts/sequence coverage for the major constituent proteins (e.g., collagen I,apolipoprotein, serum albumin) (Tables 2 and 3). Thus, the greatest advantages conferredby speed vacuuming ABC over other treatments are: (1) more bulk protein available fordownstream applications, and (2) time saved, as it can be performed quickly over the courseof hours instead of days. It should be noted that although ABC performed fairly well after
Schroeter et al. (2016), PeerJ, DOI 10.7717/peerj.2603 23/32

demineralization of the bone powder with HCl (Method 4), identical incubations of ABCafter demineralization with EDTA (20-E/ABC-SV, Method 7), resulted in the identificationof comparatively fewer peptides and lower protein diversity (Tables 2 and 3), suggestingthat HCl is a more optimal demineralizing treatment for bone prior to ABC than EDTA.
In general, GuHCl fractions obtained fairly consistent results, regardless of reagent usedfor pre-demineralization (e.g., HCl, Method 1 or EDTA, Method 5). Among solubilizationfractions, whether precipitated or dialyzed, demineralized with HCl or EDTA, 4 M or 6M concentration, GuHCl extracted less than or equal bulk protein as 20-H/ABC-D andmore than SDS fractions (Fig. 2B), while in MS analyses, fewer peptides and proteins wereidentified in GuHCl fractions than in ABC or precipitated SDS fractions. Within GuHClfractions, 5-H/GuHCl-D produced the richest MS data, identifying 5+ proteins comparedto other GuHCl fractions and obtaining the best (or equal coverage) for 9 of the 10 proteinsidentified in GuHCl for which coverage was tracked (Table S3). 20-E/A/GuHCl-D obtainedadditional bulk protein from bone after the pellet had previously been incubated in EDTAand ABC (Method 6), but the specific proteins obtained were nearly all found in previousfractions of the method (Fig. 3F). Thus, while serial incubations of GuHCl after ABC mayobtain additional extracted protein for downstream analyses that require large volumes ofprotein (e.g., gel electrophoresis), it does not appear to expand access to other regions ofthe bone proteome that were not previously obtained in other fractions.
20-H/Urea-D extracted less bulk protein than all other fractions save SDS, but resultedin fewer peptides and a lower degree of identified protein diversity in MS analysesthan SDS, and was roughly on par with 5-H/GuHCl-D in terms of identified proteindiversity and peptide coverage. This method identified only one protein (Histone-lysineN-methyltransferase) that was unavailable in other extractions (Table 2). The most notablething about the Urea extractions is that samples which did not contain protein (i.e., blankbuffer controls) generated large amounts of non-protein solids during precipitation, heavilyskewing control data (Fig. S1B).We tested this anomalymultiple times, and found that highlevels of non-proteinmaterial only precipitated when the supernatant was void of protein—spiking bovine serum albumin into the buffer supernatant prevented this reaction uponaddition of acetone. This phenomenon precludes precipitation of Urea as a viable bufferremoval method for any bone protein study that requires the inclusion of negative controls.
Acetic acid, with and without pepsin, extracted such a low amount of total protein frombone powder that these fractions were not tested in MS analyses (Fig. S2B). Acetic acidhas been used as a solubilization agent in protocols designed to extract purified collagen Ifrom skin and bones, to the exclusion of other NCPs, for inoculation to produce collagenI specific antibodies (Liu et al., 2012; Singh et al., 2011). The small amount of overall boneprotein recovered from these fractions may be the result of hydrolyzed collagen being lostthrough the 20K MWCO dialysis membrane along with the smaller NCPs. These resultssuggest that significant amounts of bone must be processed for a proteomic study thatrequires multiple assays, and that this method would be particularly ill-suited for studiesin which available bone material is limited.
When considered as a whole, these extractome data allow us to make recommendationsfor how discrete steps in methods may be combined to maximize the breadth and coverage
Schroeter et al. (2016), PeerJ, DOI 10.7717/peerj.2603 24/32
of the bone proteome identified by MS analyses. By combining the two demineralizationfractions that recovered the most diverse set of peptides (20-HCl-P and 20-N/EDTA-D)with the solubilization fraction producing a similar diversity (20-H/SDS-P)—only three ofthe 19 fractions that were analyzed by tandem MS/MS—we can account for 51 of the 55proteins identified across all fractions, or 92.7%of the total protein diversity identified in theentire study (Fig. 3H). Furthermore, these three fractions include those with the highest (ornearly highest) coverage of all proteins for which coverage data was tracked, thus optimizingthis model for degree of identified protein coverage as well as diversity. To combine thesesub-extractions into one protocol, Method 2 (Table 1) need only be slightly modified byincreasing the initial demineralization volume to boneweight ratio to 20mL/g, precipitatingboth fractions as described, and performing a tandem extraction of additional bonematerialin which the sample is treated with 0.1 M NaOH prior to application of 20 mL/g EDTA.
Implications for paleoproteomics and future directionsBecause the extant chicken bones used for these analyses were not subject to thediagenetic factors that can cause chemical alterations in fossil proteins (e.g., deamidation,carboxymethylation of lysine, loss of hydroxylations to proline (Cleland et al., 2016;Cleland,Schroeter & Schweitzer, 2015; Hill et al., 2015)), it is unclear whether the disparity of effi-ciencies between protocols observed here would be similar if conducted on a fossil sample.Indeed, given the chemical differences in depositional environments experienced by fossilsfrom different localities, it is possible that similar comparison analyses of 10 differentfossil specimens would yield 10 different results. Regardless, the current data conductedon chicken bone may have implications for paleoproteomic studies that can be exploredin future fossil analyses.
First, the demineralization fractions (e.g.,HCLor EDTA), shownhere to have higher pro-teomic diversity per µg in MS, are commonly discarded in paleoproteomics experiments,presumably because their low-yields are considered negligible (e.g., Buckley & Wadsworth,2014; Cappellini et al., 2012; Wadsworth & Buckley, 2014). This may be counterproductivein studies targeting NCPs of extinct taxa. Collagen I is the most abundant protein inbone tissue, but it contains minimal informative sequence variation between species;therefore, improving access to NCPs in the bone proteomes of extinct taxamay significantlyincrease our access to phylogenetically relevant data (Cleland, Voegele & Schweitzer,2012; Schweitzer, Schroeter & Goshe, 2014; Wadsworth & Buckley, 2014). However, studiestargeting NCPs in ancient bone that discard, or simply do not analyze, the demineralizationfraction and subsequent water ‘‘washes’’ may be discarding the NCPs they seek. For exam-ple, a recent study byWadsworth & Buckley (2014) investigated proteome degradation in ar-chaeological bone up to onemillion years old by performing tandemMS/MS on protein ex-tracts solubilized by GuHCl after bone mineral was demineralized in HCl. Our data suggestthat additional analyses of the HCl products in similar studies may provide an even widerwindow into the proteome of these specimens than could be accessed by GuHCl alone,potentially allowing access to more NCPs in older fossils.
Additionally, the observed preferential extraction of hemoglobin from bone by SDSwarrants testing this reagent for its possible utility in targeting hemoglobin extraction from
Schroeter et al. (2016), PeerJ, DOI 10.7717/peerj.2603 25/32

fossils. Hemoglobin is a serum protein that can potentially shed light on the evolution ofendothermy (Schweitzer & Marshall, 2001) and organismal response to climate change(Campbell et al., 2010), in addition to carrying greater phylogenetic and paleobiologicalsignal than other, more conserved proteins (e.g., Weber, 1995). Although the breakdownproducts of hemoglobin have been identified in dinosaurs (Schweitzer et al., 1997),peptide sequences from dinosaur fossils have remained elusive. When combined withmore advanced techniques for anionic detergent removal from the supernatant (e.g.,precipitation kits specifically designed for SDS), SDS may be superior to previous methodsfor hemoglobin extraction.
However, there are some caveats in applying the results of these experiments on extantbone to paleoproteomic studies. For example, while large-volume fractions of reagents (e.g.,20 mL/g) did better in MS analyses than their lower volume counterparts, the comparativedilution of peptides in these sample volumesmay cause greater peptide loss fromadsorbanceon the sides of pipette tips, sample tubes, dialysis tubing, etc. (Chambers, 2013) which maybe a serious problem when studying ancient specimens in which preserved protein isalready scarce. The tandem extractions using both HCl and EDTA we recommend formodern bone require processing twice as much bone powder as any single protocol, whichmay be a concern in studies where sample material is extremely limited. In addition, thetotal weight of the extraction products of these three reagents (HCl, EDTA, SDS) combinedwas five times less than bulk protein extracted per gram of bone from only one extractionof speed-vacuumed ABC. Thus, although MS only requires micrograms worth of protein,paleoproteomic studies should consider pairing a diversity-rich, low-yield demineralizationfraction (e.g., 20-HCl-P) with a higher-yield solubilization fraction (e.g., 20-H/ABC-SV)and analyzing both fractions, or processing large amounts of sample material as feasible. Ineither case, for studies specifically seeking NCPs in low protein samples (e.g., osteonectinin fossils) it is imperative that any demineralization fractions be analyzed rather thandiscarded, regardless of comparatively minute amounts of extract. Conversely, extractionprotocols that do not include a separate demineralization stage (e.g., Cleland & Vashishth,2015;Hill et al., 2015) may be particularly well suited for the recovery of NCPs from fossils,and should be further explored.
CONCLUSIONSBased on our data, we make the following conclusions and recommendations for futureproteomic studies of bone:
• Dry pellet weight is an inaccurate predictor of protein yield; we recommend against theuse of pellet weight as a proxy for protein yield in bone protein studies, whether forassessing efficiency of extractions or preparing subsequent samples for further assays(e.g., ELISA) or proteomic analyses (MS).• Demineralization fractions of extraction protocols produce low total protein yield, butare richer in protein diversity and coverage per µg. These should be analyzed in MSstudies, not discarded, particularly in studies that are examining the bone proteomebroadly. Whether the sub-extraction was a demineralization step or a solubilization
Schroeter et al. (2016), PeerJ, DOI 10.7717/peerj.2603 26/32

step was the single most important factor affecting diversity and coverage of the NCPsidentified in this study.• As fractions that yielded the most bulk protein overall did not also yield the broadestextractome, bone protein studies should factor this disparity into their experimentaldesign when accounting for their specific target proteins, the sample quantityrequirements of their downstream assays, and their desired level of proteome coverage.• The greatest degree of bone proteome coverage was achieved by combining 3 low-yieldfractions in two tandem extractions. While our data show that this combined methodworks well for modern bone, its application to specimens with a diminished proteomeor limited sample material may not be ideal.• For samples in which analysis of a separate demineralization fraction is not feasible,alternative methods that do not fractionate demineralization, or do not demineralize(e.g., Cleland & Vashishth, 2015; Hill et al., 2015), should be considered to avoid loss ofidentified protein diversity.
ACKNOWLEDGEMENTSWe thank W Zheng and T Bridges for sample preparation, T Cleland for technical advice,and the Neil Kelleher Lab Group and H Thomas for logistical support.
ADDITIONAL INFORMATION AND DECLARATIONS
FundingThis work was funded under an NSF INSPIRE grant to M.H.S and E.R.S. The funders hadno role in study design, data collection and analysis, decision to publish, or preparation ofthe manuscript.
Grant DisclosuresThe following grant information was disclosed by the authors:NSF INSPIRE.
Competing InterestsThe authors declare there are no competing interests.
Author Contributions• Elena R. Schroeter conceived and designed the experiments, performed the experiments,analyzed the data, wrote the paper, prepared figures and/or tables, reviewed drafts of thepaper.• Caroline J. DeHart performed the experiments, reviewed drafts of the paper.• Mary H. Schweitzer conceived and designed the experiments, contributedreagents/materials/analysis tools, reviewed drafts of the paper.• Paul M. Thomas and Neil L. Kelleher contributed reagents/materials/analysis tools,reviewed drafts of the paper.
Schroeter et al. (2016), PeerJ, DOI 10.7717/peerj.2603 27/32

Data AvailabilityThe following information was supplied regarding data availability:
Schroeter E. 2016. Bone proteome extractomics raw data. Figshare: https://dx.doi.org/10.6084/m9.figshare.c.3269222.v1.
Supplemental InformationSupplemental information for this article can be found online at http://dx.doi.org/10.7717/peerj.2603#supplemental-information.
REFERENCESAppiah AS, Amoatey HM, Klu GYP, Afful NT, Azu E, Owusu GK. 2012. Spread of
African cassava mosaic virus from cassava (Manihot esculenta Crantz) to physic nut(Jatropha curcas L.) in Ghana. Journal of Phytology 4:31–37.
Brochu CA. 2001. Progress and future directions in archosaur phylogenetics. Journal ofPaleontology 75:1185–1201 DOI 10.1017/S0022336000017236.
Buckley M. 2013. A molecular phylogeny of Plesiorycteropus reassigns the extinct mam-malian order ‘Bibymalagasia’. PLoS ONE 8:e59614DOI 10.1371/journal.pone.0059614.
Buckley M. 2015. Ancient collagen reveals evolutionary history of the endemicSouth American ‘ungulates’. Proceedings of the Royal Society B: Biological Sciences282(1806):20142671 DOI 10.1098/rspb.2014.2671.
Buckley M, Anderung C, Penkman K, Raney BJ, Gotherstrom A, Thomas-Oates J,Collins MJ. 2008. Comparing the survival of osteocalcin and mtDNA in archaeolog-ical bone from four European sites. Journal of Archaeological Science 35:1756–1764DOI 10.1016/j.jas.2007.11.022.
Buckley M, Collins M, Thomas-Oates J, Wilson JC. 2009. Species identification by anal-ysis of bone collagen using matrix-assisted laser desorption/ionisation time-of-flightmass spectrometry. Rapid Communications in Mass Spectrometry 23:3843–3854DOI 10.1002/rcm.4316.
Buckley M, Kansa SW, Howard S, Campbell S, Thomas-Oates J, Collins MJ. 2010.Distinguishing between archaeological sheep and goat bones using a single collagenpeptide. Journal of Archaeological Science 37:13–20 DOI 10.1016/j.jas.2009.08.020.
Buckley M, Larkin N, Collins M. 2011.Mammoth and Mastodon collagen se-quences; survival and utility. Geochimica et Cosmochimica Acta 75:2007–2016DOI 10.1016/j.gca.2011.01.022.
Buckley M,Wadsworth C. 2014. Proteome degradation in ancient bone: diagenesis andphylogenetic potential. Palaeogeography, Palaeoclimatology, Palaeoecology 416:69–79DOI 10.1016/j.palaeo.2014.06.026.
Campbell KL, Roberts JEE,Watson LN, Stetefeld J, Sloan AM, Signore AV, Howatt JW,Tame JRH, Rohland N, Shen T-J, Austin JJ, Hofreiter M, Ho C,Weber RE, CooperA. 2010. Substitutions in woolly mammoth hemoglobin confer biochemical proper-ties adaptive for cold tolerance. Nature Genetics 42:536–542 DOI 10.1038/ng.574.
Schroeter et al. (2016), PeerJ, DOI 10.7717/peerj.2603 28/32

Cappellini E, Jensen LJ, Szklarczyk D, Ginolhac A, Da Fonseca RAR, StaffordTW, Holen SR, Collins MJ, Orlando L,Willerslev E, Gilbert MTP, Olsen JV.2012. Proteomic analysis of a pleistocene mammoth femur reveals more thanone hundred ancient bone proteins. Journal of Proteome Research 11:917–926DOI 10.1021/pr200721u.
Chambers EE. 2013. Quantitative analysis of therapeutic and endogenous peptides usingLC/MS/MSmethods. In: Chen G, ed. Characterization of protein therapeutics usingmass spectrometry. New York: Springer, 59–94.
Cilia M, Fish T, Yang X, Mclaughlin M, Thannhauser TW, Gray S. 2009. A comparisonof protein extraction methods suitable for gel-based proteomic studies of aphidproteins. Journal of Biomolecular Techniques 20:201–215.
Cleland TP, Schroeter ER, Feranec RS, Vashishth D. 2016. Peptide sequences fromthe first Castoroides ohioensis skull and the utility of old museum collections forpalaeoproteomics. Proceedings of the Royal Society B: Biological Sciences 283(1832):20160593 DOI 10.1098/rspb.2016.0593.
Cleland TP, Schroeter ER, Schweitzer MH. 2015. Biologically and diagenetically derivedpeptide modifications in Moa collagens. Proceedings of the Royal Society B: BiologicalSciences 282(1808):20150015 DOI 10.1098/rspb.2015.0015.
Cleland TP, Vashishth D. 2015. Bone protein extraction without demineralization usingprinciples from hydroxyapatite chromatography. Analytical Biochemistry 472:62–66DOI 10.1016/j.ab.2014.12.006.
Cleland TP, Voegele K, Schweitzer MH. 2012. Empirical evaluation of bone extractionprotocols. PLoS ONE 7:e31443 DOI 10.1371/journal.pone.0031443.
Collins MJ, Nielsen-Marsh CM, Hiller J, Smith CI, Roberts JP. 2002. The survival of or-ganic matter in bone: a review. Archaeometry 44:383–394DOI 10.1111/1475-4754.t01-1-00071.
Craig OE, Collins MJ. 2002. The removal of protein from mineral surfaces: implicationsfor residue analysis of archaeological materials. Journal of Archaeological Science29:1077–1082 DOI 10.1006/jasc.2001.0757.
Fridriksson EK, Baird B, McLafferty FW. 1999. Electrospray mass spectra from proteinelectroeluted from sodium dodecylsulfate polyacrylamide gel electrophoresis gels.Journal of the American Society of Mass Spectrometry 10:453–455DOI 10.1016/S1044-0305(99)00012-4.
Gautieri A, Vesentini S, Redeallik A, Buehler MJ. 2011.Hierarchical structure andnanomechanics of collagen microfibrils from the atomistic scale up. Nano Letters11:757–766 DOI 10.1021/nl103943u.
Hedges REM. 2002. Bone diagenesis: an overview of processes. Archaeometry44:319–328 DOI 10.1111/1475-4754.00064.
Hill RC,Wither MJ, Nemkov T, Barrett A, D’Alessandro A, DzieciatkowskaM, HansenKC. 2015. Preserved proteins from extinct bison Latifrons identified by tandem massspectrometry; hydroxylysine glycosides are a common feature of ancient collagen.Molecular and Cellular Proteomics 14:1946–1958 DOI 10.1074/mcp.M114.047787.
Schroeter et al. (2016), PeerJ, DOI 10.7717/peerj.2603 29/32

Humpula JF, Ostrom PH, Gandhi H, Strahler JR,Walker AK, Stafford Jr TW, Smith JJ,Voorhies MR, Corner R. George, Andrews PC. 2007. Investigation of the protein os-teocalcin of Camelops hesternus: sequence, structure and phylogenetic implications.Geochimica et Cosmochimica Acta 71:5956–5967 DOI 10.1016/j.gca.2007.09.003.
Liu D, Liang L, Regenstein JM, Zhou P. 2012. Extraction and characterization ofpepsin-solublized collagen from fins, scales, skins, bones and swim bladdersof bighead carp (Hypophthalmichthys nobilis). Food Chemistry 133:1441–1448DOI 10.1016/j.foodchem.2012.02.032.
Naglak TJ, Hettwer DJ, Wang HY. 1990. Chemical permeabilization of cells forintracellular product release. In: Asenjo JA, ed. Separation processes in biotechnology.Reading: University of Reading, 177.
Nielsen-Marsh CM, Gernaey AM, Turner-Walker G, Hedges REM, Pike AWG, CollinsM. 2000. The chemical degradation of bone. In: Cox M, Mays S, eds. Humanosteology: in archaeology and forensic science. London: Greenwich Medical Media,439–454.
Nielsen-Marsh CM, Hedges REM. 2000. Patterns of diagenesis in bone I: the effects ofsite environments. Journal of Archaeological Science 27:1139–1150DOI 10.1006/jasc.1999.0537.
Nielsen-Marsh CM, Ostrom PH, Gandhi H, Shapiro B, Cooper A, Hauschka PV,Collins MJ. 2002. Sequence preservation of osteocalcin protein and mitochondrialDNA in bison bones older than 55 ka. Geology 30:1099–1102DOI 10.1130/0091-7613(2002)030<1099:SPOOPA>2.0.CO;2.
Nielsen-Marsh CM, Richards MP, Hauschka PV, Thomas-Oates J, Trinkaus E, PettittPB, Karavanic I, Poinar H, Collins MJ. 2005. Osteocalcin protein sequences ofNeanderthals and modern primates. Proceedings of the National Academy of Sciencesof the United States of America 102:4409–4413 DOI 10.1073/pnas.0500450102.
Ostlund EN, Crom RL, Pedersen DD, Johnson DJ, WilliamsWO, Schmitt BJ. 2001.Equine west nile encephalitis, United States. Emerging Infections Diseases 7:665–669DOI 10.3201/eid0704.017412.
Ostrom PH, Gandhi H, Strahler JR,Walker AK, Andrews PC, Leykam J, Stafford TW,Kelly RL,Walker DN, Buckley M, Humpula J. 2006. Unraveling the sequenceand structure of the protein osteocalcin from a 42 ka fossil horse. Geochimica etCosmochimica Acta 70:2034–2044 DOI 10.1016/j.gca.2006.01.004.
Ostrom PH, Schall M, Gandhi H, Shen T-L, Hauschka PV, Strahler JR, Gage DA.2000. New strategies for characterizing ancient proteins using matrix-assistedlaser desorption ionization mass spectrometry. Geochimica et Cosmochimica Acta64:1043–1050 DOI 10.1016/S0016-7037(99)00381-6.
Paulie S, Perlmann H, Perlmann P. 2005. Enzyme-linked immunosorbent assay. In:Encyclopedia of Life Sciences (eLS). Hoboken: John Wiley and Sons, Ltd., 1–13.
Pereira-Mouries L, AlmeidaM-J, Riberio C, Peduzzi J, BarthélemyM,Milet C, Lopez E.2002. Soluble silk-like organic matrix in nacreous layer of bivalve Pinctada maxima.European Journal of Biochemistry 269:4994–5003DOI 10.1046/j.1432-1033.2002.03203.x.
Schroeter et al. (2016), PeerJ, DOI 10.7717/peerj.2603 30/32

Rabilloud T. 1998. Use of thiourea to increase the solubility of membrane proteins intwo-dimensional electrophoresis. Electrophoresis 19:758–760DOI 10.1002/elps.1150190526.
RajalingamD, Loftis C, Xu JJ, Kumar TKS. 2009. Trichloroacetic acid-induced proteinprecipitation involves the reversible association of a stable partially structuredintermediate. Protein Science 18:980–993 DOI 10.1002/pro.108.
Ran L-Y, Su H-N, Zhao G-Y, Gao X, ZhouM-Y,Wang P, Zhao H-L, Xie B-B, ZhangX-Y, Chen X-L, Zhou B-C, Zhang Y-Z. 2013. Structural and mechanistic insightsinto collagen degradation by a bacterial collagenolytic serine protease in the subtilisinfamily.Molecular Microbiology 90:997–1010 DOI 10.1111/mmi.12412.
Schroeter ER, Cleland TP. 2016. Glutamine deamidation: an indicator of antiquity, orpreservational quality? Journal of Proteome Research 30:251–255DOI 10.1002/rcm.7445.
Schweitzer MH,Marshall CL. 2001. A molecular model for the evolution of endothermyin the theropod-bird lineage. Journal of Experimental Zoology 291:317–338DOI 10.1002/jez.1132.
Schweitzer MH,Marshall M, Carron K, Bohle DS, Busse SC, Arnold EV, BarnardD, Horner JR, Starkey JR. 1997.Heme compounds in dinosaur trabecular bone.Proceedings of the National Academy of Sciences of the United States of America94:6291–6296 DOI 10.1073/pnas.94.12.6291.
Schweitzer MH, Schroeter ER, GosheMB. 2014. Protein molecular data from ancient(>1 million years old) fossil material: pitfalls, possibilities and grand challenges.Analytical Chemistry 86:6731–6740 DOI 10.1021/ac500803w.
Schweitzer MH, Suo Z, Avci R, Asara JM, AllenMA, Arce FT, Horner JR. 2007. Analysesof soft tissue from Tyrannosaurus rex suggest the presence of protein. Science316:277–280 DOI 10.1126/science.1138709.
Schweitzer MH, ZhengW, Organ CL, Avci R, Suo Z, Freimark LM, Lebleu VS,DuncanMB, HeidenM. G. Vander, Neveu JM, LaneWS, Cottrell JS, HornerJR, Cantley LC, Kalluri R, Asara JM. 2009. Biomolecular characterization andprotein sequences of the campanian hadrosaur B. canadensis. Science 324:626–631DOI 10.1126/science.1165069.
Shieh I-F, Lee C-Y, Shiea J. 2005. Eliminating the interferences from TRISbuffer andSDS in protein analysis by fused-droplet electrospray ionization mass spectrometry.Journal of Proteome Research 4:606–612 DOI 10.1021/pr049765m.
Singh P, Benjakul S, Maqsood S, Kishimura H. 2011. Isolation and characterization ofcollagen extracted from the skin of striped catfish (Pangasianodon hypophthalmus).Food Chemistry 124:97–105 DOI 10.1016/j.foodchem.2010.05.111.
Smith CI, Chamberlain AT, Riley MS, Stringer C, Collins MJ. 2003. The thermal historyof human fossils and the likelihood of successful DNA amplification. Journal ofHuman Evolution 45:203–217 DOI 10.1016/S0047-2484(03)00106-4.
Tabatabai LB, Deyoe BL. 1984. Specific enzyme-linked immunosorbent assay fordetection of bovine antibody to Brucella abortus. Journal of Clinical Microbiology20:209–213.
Schroeter et al. (2016), PeerJ, DOI 10.7717/peerj.2603 31/32

Thermo-Scientific. 2002. Instructions: pierce(TM) BCA protein assay kit; product #23225; #23227. Rockford: Pierce Biotechnology.
Trueman CNG,Martill DM. 2002. The long-term survival of bone: the role of bioero-sion. Archaeometry 44:371–382 DOI 10.1111/1475-4754.t01-1-00070.
Van Klinken GJ, Hedges REM. 1995. Experiments on collagen-humic interactions: speedof humic uptake, and effects of diverse chemical treatments. Journal of ArchaeologicalScience 22:263–270 DOI 10.1006/jasc.1995.0028.
Visser NFC, Lingeman H, Irth H. 2005. Sample preparation for peptides and proteins inbiological matrices prior to liquid chromatography and capillary zone electrophore-sis. Analytical and Bioanalytical Chemistry 382:535–558DOI 10.1007/s00216-005-3120-9.
Wadsworth C, Buckley M. 2014. Proteome degradation in fossils: investigating thelongevity of protein survival in ancient bone. Rapid Communications in MassSpectrometry 28:605–615 DOI 10.1002/rcm.6821.
Wang Y, Azaïs T, RobinM, Vallée A, Catania C, Legriel P, Pehau-Arnaudet GR,Babonneau F, Giraud-Guille M-M, Nassif N. 2012. The predominant role ofcollagen in the nucleation, growth, structure and orientation of bone apatite. NatureMaterials 11:724–733 DOI 10.1038/nmat3362.
Weber RE. 1995. Hemoglobin adaptations to hypoxia and altitude—the phlyogeneticperspective. In: Sutton JR, Houston CS, Coates G, eds. Hypoxia and the Brain.Burlington: Queen City Printers Inc.
Weiner S, Wagner HD. 1998. The material bone: structure-mechanical functionrelations. Annual Review of Materials Science 28:271–298DOI 10.1146/annurev.matsci.28.1.271.
Welker F, Collins MJ, Thomas JA,Wadsley M, Brace S, Cappellini E, Turvey ST,RegueroM, Gelfo JN, Kramarz A, Burger J, Thomas-Oates J, Ashford DA,Ashton PD, Rowsell K, Porter DM, Kessler B, Fischer R, Baessmann C, KasparS, Olsen JV, Kiley P, Elliott JA, Kelstrup CD, Mullin V, Hofreiter M,WillerslevE, Hublin J-J, Orlando L, Barnes I, Macphee RDE. 2015. Ancient proteins resolvethe evolutionary history of Darwin’s South American ungulates. Nature 522:81–84DOI 10.1038/nature14249.
Wilson R, Bateman JF. 2008. A robust method for proteomic characterization of mousecartilage using solubility-based sequential fractionation and two-dimensional gelelectrophoresis.Matrix Biology 27:709–712 DOI 10.1016/j.matbio.2008.07.007.
YoungMF. 2003. Bone matrix proteins: their function, regultion, and relationship toosteoporosis. Osteoporosis International 14:S35–S42.
Zylberberg L. 2004. New data on bone matrix and its proteins. Comptes Rendus Palevol3:591–604 DOI 10.1016/j.crpv.2004.07.012.
Schroeter et al. (2016), PeerJ, DOI 10.7717/peerj.2603 32/32