book of short papers - iris.unica.it filekeynotes statistical models for complex extremes antony...
TRANSCRIPT

CLADAG2017
Book of Short Papers
Editors: Francesca Greselin, Francesco Mola and Mariangela Zenga

©2017, Universitas Studiorum S.r.l. Casa Editrice via Sottoriva, 9 - 46100 Mantova (MN) P. IVA 02346110204
E-book (PDF version) published in September 2017 ISBN 978-88-99459-71-0
This book is the collection of the Abstract / Short Papers submitted by the authors of the International Conference of The CLAssification and Data Analysis Group (CLADAG) of the Italian Statistical Society
(SIS), held in Milan (Italy), University of Milano-Bicocca, September 13-15, 2017. Euro 9,00

Keynotes
Statistical models for complex extremes
Antony Davison,
Institute of Mathematics,
Ecole Polytechnique Federale de Lausanne, Switzerland
Classified Mixed Model Prediction
J. Sunil Rao,
Division of Biostatistics,
Department of Public Health Sciences, University of Miami, Florida
An URV approach to cluster ordinal data
Roberto Rocci,
Dipartimento di Economia e Finanza,
Università degli studi di Tor Vergata, Rome, Italy
Invited sessions
Clustering and Dimensionality Reduction
Mixture models for simultaneous classification and reduction
of three-way data
Roberto Rocci, Maurizio Vichi, Monia Ranalli
High-dimensional Clustering via Random Projections
Laura Anderlucci, Francesca Fortunato, Angela Montanari
Clustering and Structural Equation Modeling
Mario Fordellone, Maurizio Vichi
Hidden Markov Models for Longitudinal Data
Package LMest for Latent Markov Analysis of longitudinal categorical data
Francesco Bartolucci, Silvia Pandolfi, Fulvia Pennoni
Dynamic sequential analysis of careers
Fulvia Pennoni, Raffaella Piccarreta
Multivariate hidden Markov regression models with random
covariates
Antonio Punzo, Salvatore Ingrassia, Antonello Maruotti

Analysis of partially ordered data in socio-economics
Comparing three methodological approaches for synthesizing
complex phenomena
Katia Iglesias, Christian Suter, Tugce Beycan, B.P. Vani
New posetic tools for the evaluation of financial literacy
Marco Fattore, Mariangela Zenga
Poset theory and policy making: three case studies
Enrico di Bella
Classification models in Economics and Business
Poland on Global Consumer Markets – Multilevel
Segmentation of Countries on the basis of Market Potential Index
Adam Sagan, Eugene Kąciak
Hidden Variable Models for Market Basket Data
Harald Hruschka
Sensitivity Analysis in Corporate Bankruptcy Prediction
Barbara Pawełek, Jozef Pociecha

Advances in Functional data analysis
Growth processes in forensic entomology: a functional data perspective
Davide Pigoli, John Aston, Frédéric Ferraty
Density based classification methods for functional data
Enea Bongiorno, Aldo Goia
Permutation methods for multi-aspect local inference on functional data
Alessia Pini, Lorenzo Spreafico, Simone Vantini, Alessandro
Vietti
New results in Robust estimation
A proposal for robust functional clustering based on
trimming and constraints
Luis Angel García-Escudero, Diego Rivera-García, Joaquín
Ortega and Agustin Mayo-Iscar
Trimming in probabilistic clustering
Gunter Ritter
Covariance matrices of robust estimators in regression
Silvia Salini, Fabrizio Laurini, Marco Riani, Andrea Cerioli

Innovative applications of multidimensional scaling
Preference judgments of curvature and angularity
in architectural façades
Giuseppe Bove, Nicole Ruta, Stefano Mastandrea
Changes in couples’ breadwinning patterns and
wife’s economic role in Japan
Miki Nakai
Individual differences in brand switching
Akinori Okada, Hiroyuki Tsurumi
Advances in Robust methods
Weighted likelihood estimation of multivariate location and
scatter
Luca Greco, Claudio Agostinelli
Efficient robust methods for multivariate data via monitoring
Antony C. Atkinson
A new robust estimator of multilevel models based on the forward search approach
Aldo Corbellini, Luigi Grossi, Fabrizio Laurini

Big Data - Big Knowledge
Flexible Inference for FMRI Data
Aldo Solari
Opinion Mining and City Branding
Federico Neri, Roberto Grandi - Integris
From predictive to reactive approach: how not to be biased
from the past in volatile contexts
Federico Stefanato, Marco Cagna - Waterdata
Big data and Design of experiments
Passive and active observation: experimental design issues in big data
Henry Wynn
Optimal design of experiments in the presence of covariate information
Peter Goos
Is it possible a design of experiment with puzzling dynamic data?
Giacomo Aletti

Robust Clustering
Robust clustering tools based on optimal transportation
Eustasio del Barrio
Advances in robust clustering for regression structures
Domenico Perrotta, Francesca Torti, Andrea Cerioli, Marco
Riani
Robustness aspects of DD-classifiers for directional data
Giuseppe Pandolfo
Classification and Visualization
Explorative visualization techniques for imbalanced classification tasks
Adalbert Wilhelm
Calibrated cluster validity for comparing the quality of clusterings
Christian Hennig
Visual Tools for Interactive Clustering of UE State Members via Metabolic Patterns
Massimo Aria, Carmela Iorio, Roberta Siciliano, Michele
Staiano

Designing clinical trials
The rise of early phase clinical trials
Nancy Flournoy
Adaptive dose-finding designs to identify multiple doses that
achieve multiple response targets
Adrian Mander
A new design strategy for hypothesis testing under response adaptive randomization
Maroussa Zagoraiou, Alessandro Baldi Antognini, Alessandro
Vagheggin
Advances in Credit Risk modelling
Incorporating heterogeneity and macroeconomic variables
into multi-state delinquency models for credit cards
Viani Djeundje, Jonathan Crook
Scoring models for P2P lending platforms: an evaluation of
predictive performance
Paolo Giudici, Branka Hadij-Misheva
Advances in risk measurement in a distressed banks scenario
Mauro Bernardi, Roy Cerqueti, Arsen Palestini

Heterogeneity and new statistical models
Fitting Cluster-Weighted Models in R
Angelo Mazza, Antonio Punzo, Salvatore Ingrassia
Outcome evaluation in healthcare: The Multilevel Logistic Cluster Weighted Model
Paolo Berta, Fulvia Pennoni, Veronica Vinciotti
Mixture model under overlapping clusters: an application to network data
Saverio Ranciati, Veronica Vinciotti, Ernst Wit
A world of data
Active and passive measurement: a paradigm change
Giorgio Licastro - GFK Eurisko
Data Science approach and challenges in private sectors
Rocco Michele Lancellotti - Data Reply
Analytics Data LAB: The power of Big Data Investigation and Advanced Analytics to maximize the Data Capital
Roberto Falcinelli - Oracle
Advances in Biostatistics
Regression models for the restricted residual mean time for right-censored and left-truncated data
Giuliana Cortese, Thomas Scheike
Estimating mediation effects in epigenomic studies
Vera Djordjilovic
Statistical challenges in single-cell RNA sequencing
Davide Risso, Fanny Perraudeau, Svetlana Gribkova,
Sandrine Dudoit, Jean-Philippe Vert
Advances in Ordinal and Preference data
Zero inflated CUB models for the evaluation of leisure time
activities
Maria Iannario, Rosaria Simone
Constrained consensus bucket order
Antonio D’Ambrosio, Carmela Iorio, Roberta Siciliano
Ensemble methods for Ranking data
Antonella Plaia, Mariangela Sciandra, Roberta Murò

Inequality indices and their decomposition
Contributions from macro-regions and from income components to the Zenga Index I(Y): an application to data from Poland and Italy
Michele Zenga, Alina Jedrzejczak, Igor Valli
Joint decomposition by subpopulations and sources of the
point and synthetic Bonferroni inequality measures
Michele Zenga, Igor Valli
Transfers between sources and units in Zenga’s inequality
index decomposition
Alberto Arcagni
Advances in Classification and Clustering of complex Data
Combined methods in multi-label classification algorithms Luca Frigau, Claudio Conversano, Francesco Mola
Validation of Experiments Involving Image Segmentation of
Botanic Seeds
Jaromir Antoch, Claudio Conversano, Luca Frigau, Francesco
Mola
Time Series Clustering for Portfolio Selection
Carmela Iorio, Antonio D'Ambrosio

Preferences in freshly graduates recruiting
Academic disciplines as perceived by entrepreneurs
Luigi Fabbris, Manuela Scioni
University and tourism. Graduates’ profiles for the tourism sector
Antonio Giusti, Laura Grassini, Manuela Scioni
The effect of the firm size in the selection of recruitment for new graduate
Franca Crippa, Paolo Mariani, Andrea Marletta, Mariangela
Zenga
Network Analysis with applications on biological, financial and social networks
Co-authorship Network in Statistics: methodological issues and empirical results
Susanna Zaccarin, Maria Prosperina Vitale, Domenico De
Stefano
Network inference in genomics
Ernst Wit
Spatial modeling of brain connectivity data
Daniele Durante, Emanuele Aliverti

Contributed sessions Classification of Multiway and Functional Data
A generalized Mahalanobis distance for the classification of functional data
Andrea Ghiglietti, Francesca Ieva, Anna Maria Paganoni
Classification methods for multivariate functional data with applications to biomedical signals
Andrea Martino, Andrea Ghiglietti, Anna M. Paganoni
A new Biclustering method for functional data: theory and applications
Jacopo Di Iorio, Simone Vantini
A leap into functional Hilbert spaces with Harold Hotelling
Alessia Pini, Aymeric Stamm, Simone Vantini
Sampling Designs and Stochastic models
Statistical matching under informative probability sampling
Daniela Marella, Danny Pfeffermann
Goodness-of-fit test for discrete distributions under complex
sampling design
Pier Luigi Conti
Structural learning for complex survey data
Daniela Marella, Paola Vicard
The size distribution of Italian firms: an empirical analysis
Anna Maria Fiori, Anna Motta

Robust statistical methods
New proposal for clustering based on trimming and restrictions
Luis Angel Garcìa Escudero, Francesca Greselin, Agustin
Mayo Iscar
Wine authenticity assessed via trimming
Andrea Cappozzo, Francesca Greselin
Robust and sparse clustering for high-dimensional data
Sarka Brodinova, Peter Filzmoser, Thomas Ortner, Maia
Zaharieva, Christian Breiteneder
M-quantile regression for multivariate longitudinal data
Marco Alfo', Maria Francesca Marino, Maria Giovanna Ranalli,
Nicola Salvati, Nikos Tzavidis
New proposals in Clustering methods
Reduced K-means Principal Component Multinomial Regression for studying the relationships between spectrometry and soil texture
Pietro Amenta, Antonio Lucadamo, Antonio Pasquale Leone
Comparing clusterings by copula information based distance
Marta Nai Ruscone
Fuzzy methods for the analysis of psychometric data
Isabella Morlini
Inverse clustering: the paradigm, its meaning, and illustrative examples
Jan W. Owsinski, Jaroslaw Stanczak, Karol Opara, Slawomir
Zadrozny

Big data mining and classification
The importance of the minorities’ viewpoints: Rare Event Sampling Technique on Sentiment analysis supervised algorithm
Marika Arena, Anna Calissano, Simone Vantini
A generalized K-means algorithm for multivariate big data with correlated components
Giacomo Aletti, Alessandra Micheletti
Big data process analysis: from data mining to process mining
Massimiliano Giacalone, Carlo Cusatelli, Roberto Casadei,
Angelo Romano, Vito Santarcangelo
Semiparametric estimation of large conditional variance-covariance and correlation matrices with an application to financial data
Claudio Morana
Advances in model-based clustering
Probabilistic Distance Algorithm generalization to Student’s t mixtures
Christopher Rainey, Cristina Tortora, Francesco Palumbo
Model-based Clustering of Data with Measurement Errors
Michael Fop, Thomas Brendan Murphy, Lorraine Hanlon
Gaussian Mixture Modeling Under Measurement Uncertainty
Volodymyr Melnykov, Shuchismita Sarkar, Rong Zhengi
A dynamic model-based approach to detect the trend of Statistics from 1970 to 2015
Laura Anderlucci, Angela Montanari, Cinzia Viroli

Bayesian methods and networks
Non parametric Bayesian Networks for measurement error detection
Daniela Marella, Paola Vicard, Vincenzina Vitale
Sparse Naïve Bayes Classification
Rafael Blanquero, Emilio Carrizosa, Pepa Ramírez-Cobo, M.
Remedios Sillero-Denamiel
A Constraint-based Algorithm for Nonparanormal Data
Flaminia Musella, Paola Vicard, Vincenzina Vitale
Interventional data and Markov equivalence classes of DAGs
Federico Castelletti, Guido Consonni
Categorical data analysis
Study of context-specific independencies through Chain
Stratified Graph Models for categorical variables
Federica Nicolussi, Manuela Cazzaro
Redundancy Analysis Models with Categorical Endogenous
Variables: A New Estimation Technique
Gianmarco Vaccà
Mixture of copulae based approach for defining the subjects distance in cluster analysis
Andrea Bonanomi, Marta Nai Ruscone, Silvia Angela Osmetti
Dissimilarity profile analysis for assessing the quality of imputation in cardiovascular risk studies
Nadia Solaro

Data Analysis
Measuring vulnerability: a Structural Equation Modelling approach
Ambra Altimari, Simona Balzano, Gennaro Zezza
On the turning point detection in financial time series
Riccardo Bramante, Silvia Facchinetti
Optimization of the Listwise Deletion Method
Graziano Vernizzi, Miki Nakai
Discretization of measures: an IRT approach
Silvia Golia
Mixture and Latent Class Models for Clustering
Analysis of university teaching quality merging student ratings with professor characteristics and opinions
Francesca Bassi, Leonardo Grilli, Omar Paccagnella, Carla
Rampichini, Roberta Varriale
Clustering technique for grouped survival data with a nonparametric frailty term
Francesca Gasperoni, Francesca Ieva, Anna Maria Paganoni,
Chris Jackson, Linda Sharples
A latent trajectory model for migrants’ remittances: an
application to the German Socio-Economic Panel data
Silvia Bacci, Francesco Bartolucci, Giulia Bettin, Claudia Pigini
Stepwise latent Markov modelling with covariates in
presence of direct effects
Roberto Di Mari, Zsuzsa Bakk

Network analysis
Non-parametric inference for network-valued data Ilenia Lovato, Alessia Pini, Aymeric Stamm, Simone Vantini
Applying network analysis to online news big data
Giovanni Giuffrida, Simona Gozzo and Francesco Mazzeo
Rinaldi, Venera Tomaselli
Interval Regression Analysis for the Representation of the Core-Periphery Structure on Large Networks
Carlo Drago
A Latent Space Model for Multidimensional Networks
Silvia D'Angelo, Thomas Brendan Murphy and Marco Alfò
Advances in LMs, GLMs and PCA
Bootstrap prediction intervals in linear models
Davide Passaretti, Domenico Vistocco
Bayesian Variable Selection in Linear Regression Models with non-normal Errors
Saverio Ranciati, Giuliano Galimberti and Gabriele Soffritti
Principal Component Analysis: the Gini Approach
Stéphane Mussard, Téa Laurent Jérome Akeywidi Ouraga
On Proportional Odds Modelling and Marginal Effects of
Sardinian Hotels data
Giulia Contu, Claudio Conversano, Thomas W. Yee

Advances in Classification
Using PAM and DTW for time series classification
Ilaria Lucrezia Amerise
On Support Vector Machines under multiple-cost scenario
Sandra Benítez-Peña, Rafael Blanquero, Emilio Carrizosa,
Pepa Ramírez-Cobo
Macroeconomic forecasting: a non-standard optimisation
approach to the calibration of dynamic factor models
Fabio Della Marra
Classification of Textual Data
Measuring popularity from Twitter
Farideh Tavazoee, Claudio Conversano, Francesco Mola
A Gamification Approach to Text Classification in R
Giorgio Maria Di Nunzio
From unstructured data and word vectorization to meaning: Text mining in Insurance
Mattia Borrelli, Diego Zappa
Gamlss for Big Data: ROC curve prediction using Twitter data
Paolo Mariani, Andrea Marletta, Mariangela Sciandra

Evaluation in Education
Nonparametric mixed-effects model for unsupervised
classification in the Italian education system
Chiara Masci, Francesca Ieva, Anna Maria Paganoni,
Tommaso Agasisti
Multivariate mixed models for assessing equity and efficacy in education. An analysis over time using EU15 PISA data
Isabella Sulis, Francesca Giambona, Mariano Porcu
A zero-inflated beta regression model for predicting first-year performance in university career
Matilde Bini, Lucio Masserini
Students’ satisfaction in higher education: how to identify courses with low-quality teaching
Marco Guerra, Francesca Bassi, José G. Dias
Statistical models for complex data
Spatial Survival Models for Analysis of Exocytotic Events on Human beta-cells Recorded by TIRF Imaging
Thi Huong Phan, Giuliana Cortese
Testing different structures of spatial dynamic panel data models
Francesco Giordano, Massimo Pacella, Maria Lucia Parrella
Identification of earthquake clusters through a new space-
time-magnitude metric
Renata Rotondi, Antonella Peresan, Stefania Gentili, Elisa
Varin
A circular density strip plot
Davide Buttarazzi, Giovanni Camillo Porzio

Mixture Models
A special Dirichlet mixture model for multivariate bounded responses
Agnese Maria Di Brisco, Sonia Migliorati
Cluster-Weighted Beta Regression
Marco Alfò, Luciano Nieddu, Cecilia Vitiello
A Special Dirichlet Mixture Model in a Bayesian Perspective
Roberto Ascari, Sonia Migliorati, Andrea Ongaro
Advances in data Analysis
Assessing Heterogeneity in a Matching Estimation of Endogenous Treatment Effect
Maria Gabriella Campolo, Antonino Di Pino, Edoardo Otranto
Template matching for hospital comparison: an application to birth event data in Italy
Massimo Cannas, Paolo Berta, Francesco Mola
On variability analysis of evolutionary algorithm-based estimation
Manuel Rizzo

Poster session
Accounting for Model Uncertainty in Individualized Designs for Discrete Choice Experiments
Eleonora Saggini, Laura Deldossi, Guido Consonni
Financial-literacy: Socio-demographic variables versus
environment
Doriana Cuccinelli, Paolo Trivellato, Mariangela Zenga
Joint models for survival and bivariate longitudinal data: a likelihood formulation
Marcella Mazzoleni, Mariangela Zenga
A Spatial and model-based approach to identify the effect of
cultural capital on high school dropout. The Italian case.
Stefano Barberis, Enrico Ripamonti
M-quantile Regression in small area estimation: estimation and testing
Annamaria Bianchi, Enrico Fabrizi, Nicola Salvati, Nikos
Tzavisis

MULTIVARIATE MIXED MODELS FOR ASSESSINGEQUITY AND EFFICACY IN EDUCATION. AN ANALYSIS
OVER TIME USING EU15 PISA DATA
Isabella Sulis 1, Francesca Giambona 1 and Mariano Porcu 1
1 Department of Social Sciences and Institutions, University of Cagliari, (e-mail:[email protected], [email protected], [email protected])
ABSTRACT: This work investigates upon the determinants of students’ literacy inmathematics and reading by analysing data collected in EU15 countries in three dif-ferent waves (2006, 2009, 2012) by the Program for International Student Assessmentran by OECD. The main aim of our analysis is: (i) to assess the associations betweenstudents’ skills in mathematics and reading and their socio-economics and culturalbackground and to investigate how these associations vary across countries and waves;(ii) to suggest value-added measures of performance at the different levels of analysisin the time span considered; (iii) to advance a system of indicators at country levelwhich allows to investigate the performance of different countries in terms of efficacyand equity in the tree waves. A 4-level multilevel regression model with a bivariatelatent structure and random slopes at country level and school level has been adopted.Implications in terms of trends of efficacy and equity in comparisons across countriesare discussed.
KEYWORDS: “multilevel models”, “value-added measures”, “pseudo-panel”, “PISA”.
1 Introduction
Since the year 2000, the OECD carries out its Program for International Stu-dent Assessment (PISA). It is administered every three years to provide com-parisons of students’ achievement among the participating countries. Thiswork investigates upon the determinants of students’ literacy in mathematicsand reading by analysing data collected in EU15 countries in three differentwaves (2006, 2009, 2012) of the PISA survey. To keep minimal the assessmentburden on each student and to avoid that the scaling of achievement wouldbe influenced by the ‘booklet effect’ each student is asked to handle only apart of the assessment following a systematic booklet assembly and rotationprocedure; for that reason PISA data provides five Plausible Values (PVs) ofachievement both for math and reading for each student. The PVs represent the

likely distribution of a student’s proficiency and are provided to take into ac-count the uncertainty associated with the estimates (Monseur & Adams, 2009;OECD, 2013). Four levels of analysis are detectable in the data structure: atlevel-1 students’ PVs (5 for math and 5 for reading); at level-2 students, atlevel-3 schools (school-wave combination), and at level-4 countries (country-wave combination). A 4-levels Multilevel Regression model with a bivariatelatent structure and random slopes at country level and school level has beenadopted (Goldstein, 2011; Sulis & Porcu, 2015) to single out the factors whichseem to account for variability in students’ achievement as well as to advancea system of indicators which allows to investigate the performance of differentcountries in terms of efficacy and equity in the three waves.
2 Data description
The PISA survey data collected in the EU15 countries for 2006, 2009 and2012 waves are considered. Data refer to 1,869,065 students (111,857 in 2006,129,726 in 2009, 132,211 in 2012), tested in 14,212 schools [school-wavecombination] (4168 in 2006, 4863 in 2009, 5181 in 2012) in the 15 countries inthree waves of PISA survey. For each wave the metrical indicators of students’performance in mathematics and reading have been considered, namely stu-dents’ performance scores in maths (MATH) and reading (READ). For each stu-dent we consider 5 PVs for maths and reading. Moreover each wave containsinformation on the following covariates: gender (SEX: 0 = female, 1 = male);non native (NONATIVE: 0 = native, 1 = non native); the country in which thesurvey has been administrated (COUNTRIES: AUT = Austria, BEL = Belgium,DNK = Denmark, FIN = Finland, FRA = France, DEU = Germany, GRC =Greece, IRL = Ireland, ITA = Italy, LUX = Luxembourg, NLD = Netherlands,PRT = Portugal, ESP = Spain, SWE = Sweden, GBR = United Kingdom); theindex of economic social and cultural status of the family (ESCS); the indexof family possession of cultural resources (CULTPOSS); the index of familypossession of educational resources (HEDRES); the index of home possessions(HOMEPOSS). In order to depict differences across countries in the test results,Figure 1 plots the average scores at school level (y j) in math and reading for thewaves 2003, 2006, 2009, 2012 for the EU15 countries (OECD, 2009; OECD,2012; OECD, 2013). The analysis highlights that the main differences acrosscountries are in divergences in the variability between schools, with a polari-sation between countries such as Italy, France, Netherlands, Austria, Germanyand Belgium that are characterised by a high between school variability in theresults and countries such as Ireland, Sweden, Finland and Denmark which

2003
020
040
060
080
0
AUT BEL DEU DNK ESP FIN FRA GBR GRC IRL ITA LUX NLD PRT SWE
math read
2006
020
040
060
080
0
AUT BEL DEU DNK ESP FIN FRA GBR GRC IRL ITA LUX NLD PRT SWE
mat read
2009
020
040
060
080
0
AUT BEL DEU DNK ESP FIN FRA GBR GRC IRL ITA LUX NLD PRT SWE
math read
2012
020
040
060
080
0
AUT BEL DEU DNK ESP FIN FRA GBR GRC IRL ITA LUX NLD PRT SWE
math read
Figure 1. Average score at school level y j by country and wave
are characterised by a low between school variability. This first result wouldsuggest the presence of relevant differences in efficacy across the schools ofthe former group of countries.
3 Modeling approach
We denote with y(pi jc)(t) the plausible value p (level-1 unit) of the score inmaths or reading of student i (level-2) in school j (level-3) and country c (level-4) at time t. To jointly model the effect of predictors on both reading and mathsa 4-level ML bivariate model has been specified with random slopes at schooland country level (Leckie & Charlton, 2013; Sulis & Porcu, 2015; Grilli et al.,2016):
y(d)(pi jc)(t)
= α(d)+ x′(d)i jc β
(d)+θ(d)0(c)(t)
+η(d)0( jc)(t)
+ζ(d)0(i jc)(t)
+ ε(d)(pi jc)(t)
(1)
where, d indicates which test the score refers to (math or reading) and t standsfor the wave. The variability in y(pi jc) is split in four components: θθθ(c)t ∼N(000,ΘΘΘ) the between-country variability at level-4; ηηη( jc)t ∼N(000,ΣΣΣ) the between-school within-country variability at Level-3; ζζζ(i jc)t ∼ N(000,ΦΦΦ) the between-student within-school variability at level-2 and the εεε(pi jc)t ∼N(000,ΩΩΩ) the between-plausible value within-student variability (level-1). In a second step, randomslopes are introduced at level-3 and level-4 to allow the slope of ESCS to varyacross schools and countries in each wave, adding to the predictors of equation1 the two terms (Leckie & Charlton, 2013): xi jcθ
(d)1(c)(t)
+ xi jcη(d)1( jc)(t)
. The pos-
terior estimates at country level of the random intercepts –θ(d)0(c)(t)
– and slopes
of ESCS –θ(d)1(c)(t)
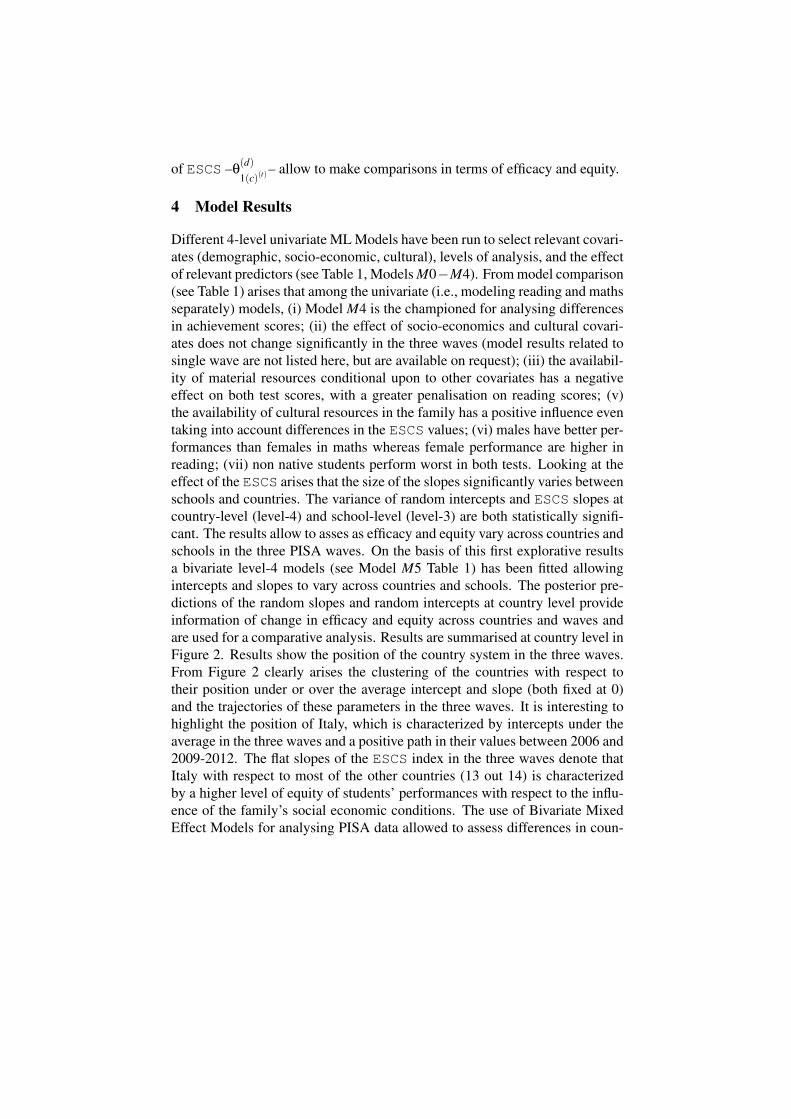
– allow to make comparisons in terms of efficacy and equity.
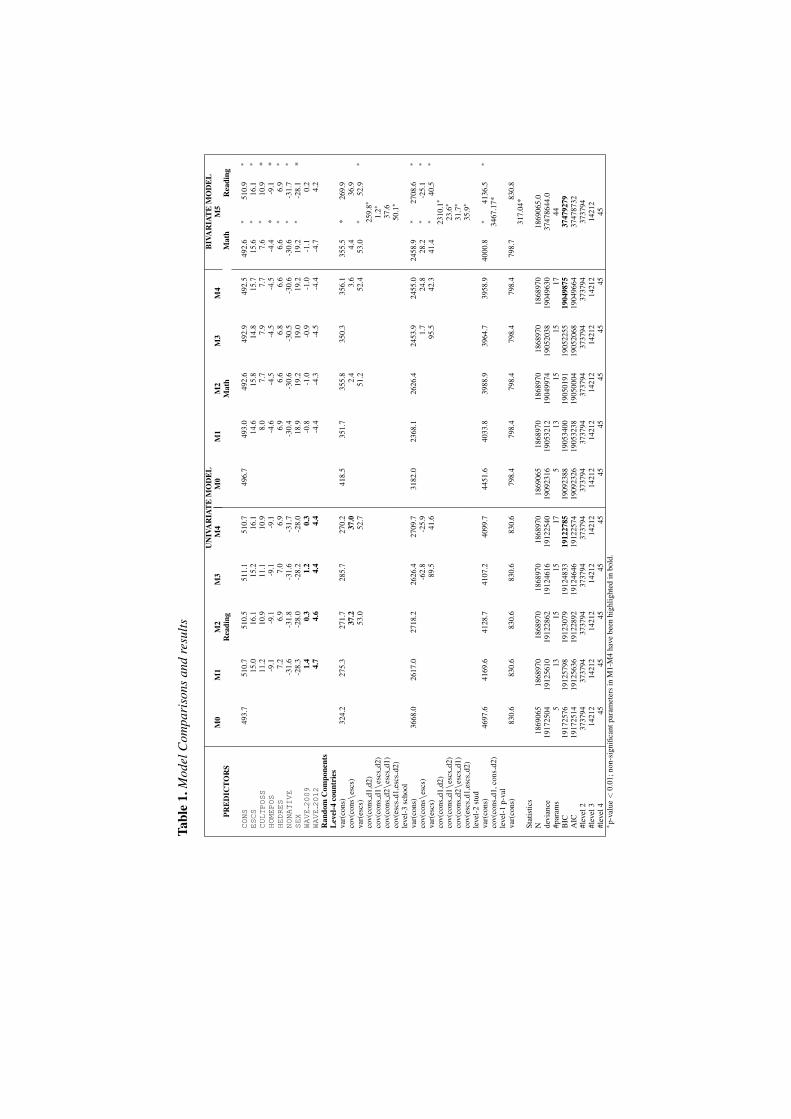
4 Model Results
Different 4-level univariate ML Models have been run to select relevant covari-ates (demographic, socio-economic, cultural), levels of analysis, and the effectof relevant predictors (see Table 1, Models M0−M4). From model comparison(see Table 1) arises that among the univariate (i.e., modeling reading and mathsseparately) models, (i) Model M4 is the championed for analysing differencesin achievement scores; (ii) the effect of socio-economics and cultural covari-ates does not change significantly in the three waves (model results related tosingle wave are not listed here, but are available on request); (iii) the availabil-ity of material resources conditional upon to other covariates has a negativeeffect on both test scores, with a greater penalisation on reading scores; (v)the availability of cultural resources in the family has a positive influence eventaking into account differences in the ESCS values; (vi) males have better per-formances than females in maths whereas female performance are higher inreading; (vii) non native students perform worst in both tests. Looking at theeffect of the ESCS arises that the size of the slopes significantly varies betweenschools and countries. The variance of random intercepts and ESCS slopes atcountry-level (level-4) and school-level (level-3) are both statistically signifi-cant. The results allow to asses as efficacy and equity vary across countries andschools in the three PISA waves. On the basis of this first explorative resultsa bivariate level-4 models (see Model M5 Table 1) has been fitted allowingintercepts and slopes to vary across countries and schools. The posterior pre-dictions of the random slopes and random intercepts at country level provideinformation of change in efficacy and equity across countries and waves andare used for a comparative analysis. Results are summarised at country level inFigure 2. Results show the position of the country system in the three waves.From Figure 2 clearly arises the clustering of the countries with respect totheir position under or over the average intercept and slope (both fixed at 0)and the trajectories of these parameters in the three waves. It is interesting tohighlight the position of Italy, which is characterized by intercepts under theaverage in the three waves and a positive path in their values between 2006 and2009-2012. The flat slopes of the ESCS index in the three waves denote thatItaly with respect to most of the other countries (13 out 14) is characterizedby a higher level of equity of students’ performances with respect to the influ-ence of the family’s social economic conditions. The use of Bivariate MixedEffect Models for analysing PISA data allowed to assess differences in coun-

IRL2006
IRL2009
IRL2012
ITA2006
ITA2009ITA2012
AUT2006AUT2009
AUT2012LUX2006
LUX2009
LUX2012
NLD2006
NLD2009
NLD2012
PRT2006
PRT2009
PRT2012
SWE2006
SWE2009
SWE2012
BEL2006BEL2009
BEL2012
DEU2006 DEU2009
DEU2012
DNK2006
DNK2009DNK2012
ESP2006
ESP2009
ESP2012
FIN2006
FIN2009
FIN2012
FRA2006
FRA2009
FRA2012
GBR2006
GBR2009
GBR2012
GRC2006GRC2009
GRC2012
-15
-10
-50
510
ES
CS
SLO
PE
-40 -20 0 20 40INTERCEPT
MATHEMATICS
IRL2006
IRL2009
IRL2012
ITA2006
ITA2009
ITA2012
AUT2006
AUT2009AUT2012
LUX2006
LUX2009
LUX2012
NLD2006NLD2009
NLD2012
PRT2006
PRT2009
PRT2012
SWE2006
SWE2009
SWE2012
BEL2006BEL2009
BEL2012
DEU2006
DEU2009
DEU2012
DNK2006
DNK2009
DNK2012
ESP2006
ESP2009
ESP2012 FIN2006
FIN2009
FIN2012
FRA2006
FRA2009
FRA2012
GBR2006GBR2009
GBR2012
GRC2006
GRC2009
GRC2012
-10
-50
510
15E
SC
S S
LOP
E
-40 -20 0 20 40INTERCEPT
READING
Figure 2. Country Intercept θ0(c) and ESCS Slope θ1(c)
tries’ performance in mathematics and reading in terms of efficacy and equity.The works is in still in progress. Further researchers aim to better shape theanalysis of countries trajectories of performance with respect the two criteria.
References
GOLDSTEIN, H. 2011. Multilevel Statistical Models - 4th ed. Wiley series inprobability and statistics. Wiley & Sons.
GRILLI, L., PENNONI, F., RAMPICHINI, C., & ROMEO, I. 2016. ExploitingTIMSS and PIRLS combined data: multivariate multilevel modelling ofstudent achievement. The Annals of Applied Statistics, 10(4), 2405–2426.
LECKIE, G., & CHARLTON, C. 2013. runmlwin - A Program to Run theMLwiN Multilevel Modelling Software from within Stata. Journal ofStatistical Software, forthcoming.
MONSEUR, C., & ADAMS, R. 2009. Plausible values: how to deal with theirlimitations. Journal of Applied Measurement, 10(3), 320–334.
OECD. 2009. PISA 2006 Technical Report. Paris: OECD Publishing.OECD. 2012. Equity and Quality in Education: Supporting Disadvantaged
Students and Schools. Paris: OECD Publishing.OECD. 2013. PISA 2012 Technical Report. Paris: OECD Publishing.PONT, B., KUCZERA, M., & FIELD, S. 2007. Education and Training Policy
No More Failures Ten Steps to Equity in Education: Ten Steps to Equityin Education. Education and training policy. OECD Publishing.
SULIS, I., & PORCU, M. 2015. The Use of Assessment Data for SchoolImprovement Purposes. Social Indicators Research, 122(2), 607–634.
Tabl
e1.
Mod
elC
ompa
riso
nsan
dre
sults
UN
IVA
RIA
TE
MO
DE
LB
IVA
RIA
TE
MO
DE
LM
0M
1M
2M
3M
4M
0M
1M
2M
3M
4M
5PR
ED
ICTO
RS
Rea
ding
Mat
hM
ath
Rea
ding
CONS
493.
751
0.7
510.
551
1.1
510.
749
6.7
493.
049
2.6
492.
949
2.5
492.
6∗
510.
9∗
ESCS
15.0
16.1
15.2
16.1
14.6
15.8
14.8
15.7
15.6
∗16
.1∗
CULTPOSS
11.2
10.9
11.1
10.9
8.0
7.7
7.9
7.7
7.6
∗10
.9*
HOMEPOS
-9.1
-9.1
-9.1
-9.1
-4.6
-4.5
-4.5
-4.5
-4.4
*-9
.1*
HEDRES
7.2
6.9
7.0
6.9
6.9
6.6
6.8
6.6
6.6
∗6.
9∗
NONATIVE
-31.
6-3
1.8
-31.
6-3
1.7
-30.
4-3
0.6
-30.
5-3
0.6
-30.
6∗
-31.
7∗
SEX
-28.
3-2
8.0
-28.
2-2
8.0
18.9
19.2
19.0
19.2
19.2
∗-2
8.1
*WAVE2009
1.4
0.3
1.2
0.3
-0.8
-1.0
-0.9
-1.0
-1.1
0.2
WAVE2012
4.7
4.6
4.4
4.4
-4.4
-4.3
-4.5
-4.4
-4.7
4.2
Ran
dom
Com
pone
nts
Lev
el-4
coun
trie
sva
r(co
ns)
324.
227
5.3
271.
728
5.7
270.
241
8.5
351.
735
5.8
350.
335
6.1
355.
5*
269.
9co
v(co
ns\e
scs)
37.2
37.0
2.4
3.6
4.4
36.9
var(
escs
)53
.052
.751
.252
.453
.0∗
52.9
∗
cov(
cons
d1,d
2)25
9.8∗
cov(
cons
d1\e
scs
d2)
1.2∗
cov(
cons
d2\e
scs
d1)
37.6
cov(
escs
d1,e
scs
d2)
50.1∗
leve
l-3
scho
olva
r(co
ns)
3668
.026
17.0
2718
.226
26.4
2709
.731
82.0
2368
.126
26.4
2453
.924
55.0
2458
.9∗
2708
.6∗
cov(
cons\e
scs)
-62.
8-2
5.9
1.7
24.8
28.2
∗-2
5.1
∗
var(
escs
)89
.541
.695
.542
.341
.4∗
40.5
∗
cov(
cons
d1,d
2)23
10.1∗
cov(
cons
d1\e
scs
d2)
23.6∗
cov(
cons
d2\e
scs
d1)
31.7∗
cov(
escs
d1,e
scs
d2)
35.9∗
leve
l-2
stud
var(
cons
)46
97.6
4169
.641
28.7
4107
.240
99.7
4451
.640
33.8
3988
.939
64.7
3958
.940
00.8
∗41
36.5
∗
cov(
cons
d1,c
ons
d2)
3467
.17*
leve
l-1
p-va
lva
r(co
ns)
830.
683
0.6
830.
683
0.6
830.
679
8.4
798.
479
8.4
798.
479
8.4
798.
783
0.8
317.
04*
Stat
istic
sN
1869
065
1868
970
1868
970
1868
970
1868
970
1869
065
1868
970
1868
970
1868
970
1868
970
1869
065.
0de
vian
ce19
1725
0419
1256
1019
1228
6219
1246
1619
1225
4019
0923
1619
0532
1219
0499
7419
0520
3819
0496
3037
4786
44.0
#par
ams
513
1515
175
1315
1517
44B
IC19
1725
7619
1257
9819
1230
7919
1248
3319
1227
8519
0923
8819
0534
0019
0501
9119
0522
5519
0498
7537
4792
79A
IC19
1725
1419
1256
3619
1228
9219
1246
4619
1225
7419
0923
2619
0532
3819
0500
0419
0520
6819
0496
6437
4787
32#l
evel
237
3794
3737
9437
3794
3737
9437
3794
3737
9437
3794
3737
9437
3794
3737
9437
3794
#lev
el3
1421
214
212
1421
214
212
1421
214
212
1421
214
212
1421
214
212
1421
2#l
evel
445
4545
4545
4545
4545
4545
∗ p-v
alue
<0.
01;n
on-s
igni
fican
tpar
amet
ers
inM
1-M
4ha
vebe
enhi
ghlig
hted
inbo
ld.