boosting business value by reducing covid-19 transmission
TRANSCRIPT

Seth G. BenzellAvinash Collis
Christos Nicolaides
BoostingBusiness Value byReducingCOVID-19Transmission RiskNew research measuring the value-risk proposition ofdifferent business openings offers insights and strategies forhow to minimize pandemic transmission risk.
• Reprint #62143 • https://mitsmr.com/3jA7XsQ

Boosting Business Value byReducing COVID-19Transmission RiskSeth G. Benzell, Avinash Collis, and Christos Nicolaides
New research measuring the value-risk proposition of different business
openings offers insights and strategies for how to minimize pandemic
transmission risk.
Starting business meetings with a handshake, laughing withfriends in a bustling restaurant, or squeezing onto a crowdedcommuter train: Before the coronavirus pandemic, thesewere the completely unremarkable events of everyday life.But in the absence of an effective vaccine or test-and-tracesystem, these activities now carry deadly risks. Naturally,individuals, businesses, and governments have takendramatic actions to reduce the number of social interactionsto prevent the spread of COVID-19 and a deepening of thepandemic.
Reducing social contact to slow the spread of the virus hashad a major impact on the U.S. economy, but not allbusinesses have been equally affected. Some companies
provide better trade-offs. Those offering more social andeconomic importance per social interaction that posespotential risks face less government regulation and a smallerreduction in visits from fearful customers. Governments,businesses, and individuals should seek to maximize thebang for their buck from social interactions. Andorganizations that can boost their value-risk trade-offs areeven in a position to benefit from the crisis.
In our recent research paper, “Rationing Social ContactDuring the COVID-19 Pandemic,” published in theProceedings of the National Academy of Sciences, wemeasured the value-risk proposition offered by 26 differentlocation types throughout the U.S. 1 Locations we
considered are generally for-profit (such as different types ofretailers, entertainment venues, and service providers), butwe also looked into the trade-offs offered by some nonprofitorganizations.
Regarding benefits, we measured the economic importanceof a location in terms of its receipts, employee counts, andpayroll. We also included consumer importance as measuredthrough a nationally representative survey. Such surveyshave been used in the past to measure the value of free digitalgoods. 2 In this survey, respondents could choose between
a pair of locations and decide which one they would prefer
MIMITT SLOSLOAN MANAAN MANAGEMENT REVIEWGEMENT REVIEW
Copyright © Massachusetts Institute of Technology, 2020. All rights reserved. • Reprint #62143 • https://mitsmr.com/3jA7XsQ

to remain open.
To measure the cumulative risk of a location type, we lookedat a combination of nine factors drawn from smart-deviceGPS mobility patterns. A location is considered moredangerous if it is visited frequently and by large numbersof people, and if those visits result in crowding at certaintimes of day. We considered these factors for the generalpopulation but also focused on individuals age 65 and over,a population at higher risk of developing a serious case ofCOVID-19. Another factor we incorporated was thedistance people traveled to given locations from their homes.This last component captures the amount of social mixingat a specific location by people originating from differentlocations, while the other measures capture the intensity andamount of social interaction. Each of these social mixingmeasurements was evaluated for each location type.
The figure “Cumulative Danger and Importance of 26 U.S.Location Types” summarizes our findings. The locations thatoffer the best aggregate risk-reward ratio include banks,grocery stores, department stores, and general goods stores.These locations all offer very high social importance, withbanks and grocery stores rating higher because they offercritical services to customers and serve as employers.
The locations that we find offer the worst trade-offs includegyms, liquor stores, sporting goods stores, and cafes. Theseare generally small, highly trafficked, and highly crowdedlocations. They are also of lower social importance. Whilewe visit these locations often, they contribute relatively littleto GDP, employment, and welfare in terms of the dailynecessities they offer consumers and the number ofemployees served.
These risk-reward trade-offs have profound implications forbusinesses. From February to March 2020 (the latter beingthe first month of wide-scale actions to enforce socialdistancing in the U.S.), visits to all locations in the 26categories we evaluated declined 24.9%. According to ouranalysis, this decline was concentrated in locations offeringworse risk-reward trade-offs. While banks experienced onlya 2% decline in visits during this period, gyms experienced a33% decline.
Even outliers are usually driven by consumers’ desire for
safety. Hardware stores, despite offering a mediocre risk-reward ratio, actually saw a 19% increase in visits fromFebruary to March. We speculate that this was due toconsumers stocking up on personal protective equipment,such as masks, and high-demand supplies. Visits to grocerystores also increased by 15%, likely due to consumersseeking to substitute one grocery store visit for multiple riskyrestaurant visits.
How to Boost Your Value
Proposition
Given the data findings and the continued risks to publichealth, it’s clear that boosting organizations’ risk-to-valueproposition is both a financial and moral imperative.Companies that establish reputations for having saferlocations will be rewarded by risk-averse clients. Leadersshould keep in mind that the effectiveness of potentialinterventions will vary depending on the business’s type oflocation.
Implementing Sanitation andDistancing Best PracticesOne critical first step every company must take, regardless ofindustry or location, is implementing basic health and safetybest practices by disinfecting surfaces, putting protectivebarriers in place for staff members and clients, and requiringmask use. Mask wearing is especially important forindustries that involve close-proximity personal services,such as hair salons. By looking at the share of workers byoccupation in an industry and combining this data withO*Net occupational characteristic scores, we can estimatehow much an industry relies on physical proximity.Industries with low scores can more easily allow employeesto practice social distancing or work from home, whereasmasks will be essential for industries with high scores. Inour analysis, we found that dental offices and salons andbarbershops are the only two location types with a highshare of workers requiring extended close proximity.Amusement parks, gyms, and restaurants of all types alsohave high shares of workers requiring some degree of
MIMITT SLOSLOAN MANAAN MANAGEMENT REVIEWGEMENT REVIEW
Copyright © Massachusetts Institute of Technology, 2020. All rights reserved. • Reprint #62143 • https://mitsmr.com/3jA7XsQ

proximity to do their jobs.
Scheduling VisitsCompanies and business owners can also take steps to lowerrisk in their physical locations by modifying their businesshours and admitting customers on a staggered schedule thatcreates lower density. Keep in mind that strategies aimed atlowering risk can have their own drawbacks. For instance,having customers wait outside a store while it is at its(reduced) maximum capacity means a higher chance offrustrated customers and still allows the opportunity forcustomers to infect one another. Much better alternativesinclude special hours for vulnerable populations, time-restricted coupons, surge pricing, and increasedenforcement of scheduled rather than walk-in visits. 3
Time-restricted coupons and discounts also have the benefitof doing less to dissuade spontaneous and impulsive visitscompared with strict scheduling.
Offering Premium Lower-Density ServicesDuring the pandemic, companies that have provided tieredservices may need to pause or disband options previouslyavailable to customers that are now less safe. A tutor orpersonal trainer who has offered both individual and grouptraining might decide to focus on premium one-on-oneservices, for example. A larger-scale example comes fromUber and Lyft canceling their discount ride-sharing optionsthat pool multiple riders in one vehicle. Businessescontinuing to offer services that push large numbers ofclients together are likely to face both lower demand andmore resistance from their employees and governments.
The figure “Potential for Reducing Crowding by SchedulingAttendance” looks at how different business types canbenefit by better using spare capacity. On the x-axis is theimportance-risk trade-off favorability of a location. On thefar left are gyms, which offer the worst trade-off; on thefar right are banks, which offer the best trade-off. The y-axis plots location types by the average variance of theircrowdedness. A location with high variance in crowding is
very crowded at some points but nearly empty at others,such as the typical cafe or liquor store. Locations in thiscategory have more to gain from new strategies for customervisits.
The good news is that locations that offer the worst trade-offs due to COVID-19 have the best opportunities toimprove their safety through customer timing andscheduling changes — such as clothing stores, dentists,liquor and tobacco stores, and restaurants of all types. This isdemonstrated by the strong negative trend line. For dentistsand restaurants in particular, where visits are commonlyscheduled in advance, reductions in transmission risk mightbe easily achieved with little disruption to processes orincreases in costs.
Know Your Brand
Within a location type, there can be large variation in thepotential gains from rescheduling visitors. In the figurebelow, the top and bottom panels show the cumulativedanger due to proximity and the potential for dangerreduction through scheduling visits for the 30 toprestaurants brands in the U.S. As before, the marker sizesindicate the total monthly visitors in February 2020.Unsurprisingly, for each of these location types, the numberof visits to a chain (marker size) is positively related to thecumulative danger of the chain (position on the x-axis).
What else does this figure show us? Consider, for example, apair of restaurant chains: The Cheesecake Factory and RubyTuesday. Both chains have approximately the same numberof normal visits monthly: about 1.7 million. However, theyvary dramatically in terms of their current safety and thesafety they might gain through rescheduling. TheCheesecake Factory’s guests are concentrated in shortperiods, with the highest visit-weighted average crowdingvariance at open locations compared with any restaurantbrand. This leads it to have a much higher danger index thanRuby Tuesday, despite having the same number of visits.In order to better deliver value to customers during theCOVID-19 crisis, The Cheesecake Factory should take stepsto reduce the crowding of its restaurants during peak hours.
Generally, restaurant chains strongly associated with a single
MIMITT SLOSLOAN MANAAN MANAGEMENT REVIEWGEMENT REVIEW
Copyright © Massachusetts Institute of Technology, 2020. All rights reserved. • Reprint #62143 • https://mitsmr.com/3jA7XsQ

meal or event type tend to have higher variance incrowdedness over time. For example, IHOP (breakfast),Texas Roadhouse (dinner), and Buffalo Wild Wings(sporting events) all have above-average variance incrowdedness. These chains have the most to gain byredistributing their visitors throughout the day. However,due to the strong association of their brands with theseevents, they may face additional challenges in doing so. Thetakeaway from this is that businesses face an importanttrade-off in creating an identity that is tightly associatedwith a particular event or time of day. This association mayprevent them from fully utilizing capacity in off-peak hours.
Within grocery and department stores, there is alsosignificant variation in the amount that stores can gainthrough redistributing visits across time. Within grocerystores, ShopRite and Kroger have much higher variance incrowding than Winn-Dixie, Whole Foods Market, Aldi, andPublix. Within department stores, Target and Sears havehigher crowding variance than J.C. Penney and Safeway.Kohl’s is doing a particularly good job at keeping its storesevenly attended and therefore has a very small cumulativedanger score for its number of visitors.
How can businesses best protect their customers from thecoronavirus while still delivering or even increasing thevalue they offer? How businesses answer that question isa critical success factor moving forward. Companies needto meet government regulations but also attract and winback customers and clients based on their proactive risk-prevention measures. Not every business will find this easy,but boosting quality never is. The only alternative is a dismalone — businesses undertaking coronavirus safety “theater,”and cynical clients and governments looking the other way,while hundreds of thousands more die.
But there is a silver lining to this challenge. It is exactlythe type of problem that market forces are good at solving.In the past, competitive pressures have forced companies to
economize on resources. Today, they must economize onsocial proximity as well. As long as clients, workers, andgovernments demand this of their economies, the invisiblehand of competition will deliver it.
About The Authors
Seth G. Benzell is an assistant professor at the ArgyrosSchool of Business and Economics at Chapman University inOrange, California. Avinash Collis is an assistant professor atthe McCombs School of Business at the University of Texasat Austin. Christos Nicolaides is a Marie S. Curie Fellowand a lecturer at the School of Economics and Managementat the University of Cyprus. All three authors are DigitalFellows of the MIT Initiative on the Digital Economy.Benzell and Collis are also Digital Fellows of Stanford’sDigital Economy Lab.
Acknowledgments
We would like to thank the MIT Initiative on the DigitalEconomy for funding this research, and SafeGraph forproviding the data used in this research.
References
1.1. S.G. Benzell, A. Collis, and C. Nicolaides, “Rationing Social ContactDuring the COVID-19 Pandemic: Transmission Risk and Social Benefitsof U.S. Locations,” Proceedings of the National Academy of Sciences of theUnited States 117, no. 26 (June 30, 2020): 14636-14641.
2.2. E. Brynjolfsson and A. Collis, “How Should We Measure the DigitalEconomy?” Harvard Business Review 97, no. 6 (November-December2019): 140-148.
3.3. J.C. Castillo, D. Knoepfle, and G. Weyl, “Surge Pricing Solves the WildGoose Chase,” in “EC ’17: Proceedings of the 2017 ACM Conference onEconomics and Computation” (Cambridge, Massachusetts: ACM, 2017).
MIMITT SLOSLOAN MANAAN MANAGEMENT REVIEWGEMENT REVIEW
Copyright © Massachusetts Institute of Technology, 2020. All rights reserved. • Reprint #62143 • https://mitsmr.com/3jA7XsQ
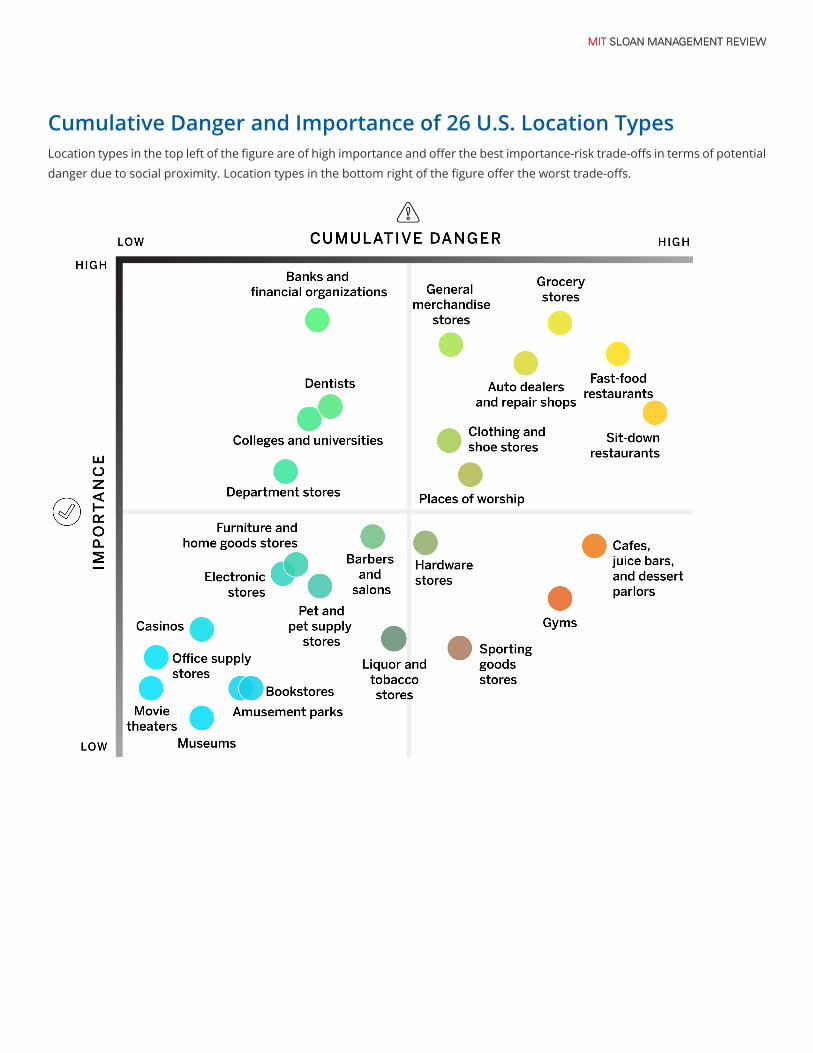
Cumulative Danger and Importance of 26 U.S. Location TypesLocation types in the top left of the figure are of high importance and offer the best importance-risk trade-offs in terms of potential
danger due to social proximity. Location types in the bottom right of the figure offer the worst trade-offs.
MIMITT SLOSLOAN MANAAN MANAGEMENT REVIEWGEMENT REVIEW
Copyright © Massachusetts Institute of Technology, 2020. All rights reserved. • Reprint #62143 • https://mitsmr.com/3jA7XsQ

Potential for Reducing Crowding by Scheduling AttendanceThis chart shows the importance-risk trade-offs and potential for danger reduction through scheduling visits for 26 U.S. location
types. Importance-risk trade-off corresponds to the ratio of a location type’s social and economic importance to its potential to
contribute to COVID-19 transmission. The potential benefit from rescheduling visits across time is measured as the visit-weighted
average variance of crowdedness for locations in that category. The size of a node indicates the number of visitors to the location
type in February 2020.
MIMITT SLOSLOAN MANAAN MANAGEMENT REVIEWGEMENT REVIEW
Copyright © Massachusetts Institute of Technology, 2020. All rights reserved. • Reprint #62143 • https://mitsmr.com/3jA7XsQ

Cumulative Danger Due to Proximity IndexThis chart shows cumulative danger due to proximity and potential for danger reduction through rescheduling visits for restaurant
chains. The potential benefit from rescheduling visits across time is measured as the visit-weighted average variance of
crowdedness for locations in that category. The size of a node indicates the number of visitors to the location type in February
2020.
MIMITT SLOSLOAN MANAAN MANAGEMENT REVIEWGEMENT REVIEW
Copyright © Massachusetts Institute of Technology, 2020. All rights reserved. • Reprint #62143 • https://mitsmr.com/3jA7XsQ