boosting energy efficiency through smart grids
TRANSCRIPT
!"#"$%&&'()$*+%(,-."/0%1,-*(2--------!"#"&*+$,-3*4%1*/%15-
6.789:;7!<-=9>37-;!6=7-=7->9.?8@-
.*+%(*#-7(/"1A6()B"1,)/5-C%(,%1+'&-D%1-!"#"$%&&'()$*+%(,--
Printed in SwitzerlandGeneva, 2012
Photo credits: Shutterstock®
About ITU-T and Climate Change: itu.int/ITU-T/climatechange/E-mail: [email protected]
August 2012
Boosting energy efficiency through Smart Grids
An energy-aware survey on ICT device power supplies
Boosting energy efficiency through Smart Grids
Information and Communication Technologies (ICTs) and climate change adaptation and mitigation: the case of Ghana
Review of mobile handset eco-rating schemes
Guidance on green ICT procurement
Greening ICT supply chains – Survey on conflict minerals due diligence initiatives
Toolkit on environmental sustainability for the ICT sector
Acknowledgements
This report was researched and written by Franco Davoli, Matteo Repetto (University of Genoa, Italy) Carlo Tornelli, Gianluigi Proserpio (RSE, Milan, Italy) and Flavio Cucchietti (Telecom Italia).
The authors would like to thank Cristina Bueti, Hiroshi Ota and Erica Campilongo (ITU) who gave up their time to assist with this research, and to coordinate all comments received.
Special thanks are due to the members of the Energy Efficiency Working Group of the Global e-Sustainability Initiative (GeSI) for their helpful review of a prior draft.
Additional information and materials relating to this Report can be found at: www.itu.int/itu-t/climatechange.
If you would like to provide any additional information, please contact Cristina Bueti at [email protected].
Legal Notice
This publication may be updated from time to time.
Third-party sources are quoted as appropriate. The International Telecommunication Union (ITU) is not responsible for the content of external sources including external websites referenced in this publication. Neither ITU nor any person acting on its behalf is responsible for the use that might be made of information contained in this publication.
Disclaimer
The views expressed in this publication are those of the authors and do not necessarily reflect the views of the International Telecommunication Union (ITU) or contributory organizations. ITU does not accept responsibility for the accuracy or completeness of the contents and shall not be liable for any loss or damage that may be occasioned, directly or indirectly, through the use of, or reliance on, the contents of this publication.
Mention of and references to specific countries, companies, products, initiatives or guidelines do not in any way imply that they are endorsed or recommended by ITU, the authors, or any other organization that the authors are affiliated with, in preference to others of a similar nature that are not mentioned.
Requests to reproduce extracts of this publication may be submitted to: [email protected]
© ITU 2012
All rights reserved. No part of this publication may be reproduced, by any means whatsoever, without the prior written permission of ITU.
Boosting energy efficiency through Smart Grids i
Table of contents
Page
Executive summary ................................................................................................................................... 1
1 Introduction ...................................................................................................................................... 2
2 Climate change and GHG emissions ................................................................................................... 3
2.1 Responsibility of the electrical system in GHG emissions ..................................................................5 2.1.1 Generation of electrical energy ..................................................................................................6 2.1.2 Generation of electrical energy by renewables ..........................................................................8
2.2 ICT to mitigate climate change ...........................................................................................................9
3 Smart Grid to mitigate climate change ............................................................................................. 11
3.1 Towards “smart” energy grids ......................................................................................................... 11
3.2 Main issues in Smart Grid implementation ..................................................................................... 13 3.2.1 Bulk generation ........................................................................................................................ 14 3.2.2 Transmission ............................................................................................................................ 14 3.2.3 Distribution .............................................................................................................................. 15 3.2.4 Customer ................................................................................................................................. 16 3.2.5 Operations ............................................................................................................................... 17 3.2.6 Market ..................................................................................................................................... 18 3.2.7 Service provider ....................................................................................................................... 19
3.3 Policies ............................................................................................................................................. 19
4 Communication architectures for Smart Grids .................................................................................. 21
4.1 Legacy communication infrastructures in electrical grids ............................................................... 22
4.2 ICT challenges and issues for Smart Grids ....................................................................................... 22
4.3 Layout of the communication system ............................................................................................. 24 4.3.1 Distributed services and applications ...................................................................................... 25 4.3.2 Data models and information exchange .................................................................................. 25 4.3.3 Networking .............................................................................................................................. 26 4.3.4 Communication media and technologies ................................................................................ 28
4.4 Current networking infrastructures and the Smart Grid ................................................................. 28
4.5 Using ICT energy storages for the power grid ................................................................................. 29 4.5.1 The problem ............................................................................................................................ 29 4.5.2 The primary control of frequency ............................................................................................ 30 4.5.3 Secondary regulation ............................................................................................................... 30 4.5.4 Some considerations ............................................................................................................... 30 4.5.5 Opportunity for Telecom operator’s energy storages ............................................................. 32
ii Boosting energy efficiency through Smart Grids
Page
5 Energy footprint of ICT ..................................................................................................................... 32
5.1 Energy footprint of public telecommunication networks ................................................................ 34
5.2 Energy footprint of ICT devices at home ......................................................................................... 36
5.3 Energy footprint of ICT in Smart Grids ............................................................................................. 39 5.3.1 ICT for management of electrical grids .................................................................................... 39 5.3.2 ICT for energy management systems at home ........................................................................ 44
5.4 The path towards a “green” ICT ....................................................................................................... 52
6 Service support capabilities, resilience, security and power consumption ........................................ 55
6.1 LV distribution, home networks and measurement data collection ............................................... 56
6.2 Higher-level networking infrastructure ........................................................................................... 57
7 Smart Grids in different economies .................................................................................................. 57
7.1 A picture for emerging and developing countries ........................................................................... 57
7.2 The effort for electrification of developing countries ..................................................................... 59
7.3 Deployment of Smart Grids in developing countries ...................................................................... 60
7.4 Policy considerations ....................................................................................................................... 63 7.4.1 Supporting telecommunication networks ............................................................................... 64
8 A different perspective, or the impact of the Smart Grid on ICT ....................................................... 65
9 Key issues, challenges and opportunities ......................................................................................... 66
10 Conclusions ..................................................................................................................................... 67
Bibliography ............................................................................................................................................ 69
Boosting energy efficiency through Smart Grids 1
Boosting energy efficiency through Smart Grids
Executive summary
Climate changes are largely ascribed to greenhouse gas emissions. They mostly come from the widespread use of fossil resources (mainly carbon and oil) for the production of energy, especially in the form of electricity. Despite the general agreement on these facts and the limited availability of such resources, continuous and sustainable supply of electricity is vital to support modern economies worldwide and thus its demand is continuously increasing. To ward off the risk of the failure of the whole ecosystem, energy policies are looking into two main directions: massive integration of renewable resources and improvement of the electric system. The ultimate purpose is the implementation of a “smart” energy grid with much more intelligence than the existing one, which is needed to balance the unpredictable generation from non-constant sources (sun, wind) with the continuous variable load. A further aspect of non-negligible relevance is that smart grids represent a unique opportunity to enable effective electrification of major parts of the so-called “third world”, where the availability of electrical services is not the norm (e.g. sub-Saharan countries, etc.). The implementation of the smart grid will heavily rely on information and communication technologies (ICTs).
This report discusses the role of ICT in the smart grid with a view of energy efficiency, with the ultimate goal of hindering climate changes. This is done by starting from the consideration that ICT equipment consumes energy too, and this extra energy consumption could be quite significant. This leads to the conclusion that any ICT architectural choice and any implementation should focus first on its own efficiency. From the energy efficiency perspective, the deployment of additional communication infrastructures for smart grids should carefully consider the trade-off between the gain in terms of energy saving and the cost of the operating devices. It should also avoid the risk to pose an unnecessary energy burden to end-customers, as they are expected to be bearing most of it. This report also underlines that the risk of having an ICT infrastructure with a negative energy efficiency balance often comes from the “scale” factor: this means small and low-power devices (a few watts) may have a huge energy footprint when they are massively deployed (electrical grids have billions of customers).
This report also gives a brief understanding about the possible path toward a “green” ICT, which is the implementation of power-aware and conscious devices for communication and information management. Indeed, any roadmap toward the deployment of ICT devices and networks in support of the smart grid should take into account (and leverage on) the existence of different networking solutions from the telecommunication perspective, each with different characteristics in terms of their own capabilities, coverage extension, numerousness, services’ suitability, and energy footprint. There is clearly no single communication platform that could efficiently fit all the different constraints and implementations of Smart Grids (SGs). The broad choice among the technologies and networks available will enable the most efficient, early, and economically viable implementation of SGs.
This report is part of ITU-T’s activities on ICT and Climate Change and has been commissioned by ITU in support of “International Year for Sustainable Energy for All”.
2 Boosting energy efficiency through Smart Grids
1 Introduction
For some time now, we have been witnessing the presence of significant climate change trends all over the planet, which create non-negligible perturbations in the delicate equilibrium of the ecosystem, causing heavy economic and social costs. Even though some tend to attribute these phenomena to transients on the scale of geological era, by recalling the huge cyclic climatic variations that took place over the past millions of years, it cannot be denied that industrial and agricultural activities over the last decades had some influence on the process, given the unprecedented amount of greenhouse gases that have been injected into the atmosphere, and the dramatic impact of such activities on the orographic and hydro-geological status of the environment. It is nowadays a common concern to devise effective countermeasures to contrast these disruptive trends, before the onset of an unsustainable (and, possibly, irreversible) situation.
One of the main causes of pollution worldwide lies in the massive utilization of fossil resources in energy production, both for personal and industrial uses. The limited availability of such resources, on one hand, and their strong impact on the ecosystem, on the other, are among the main factors calling for an economy based on the use of “clean” and renewable energy, capable of offering sufficient guarantees of sustainability in the long term.
In this respect, each scientific and technological sector is involved in this process. Undoubtedly, energy production by means of renewable sources and the adoption of environment-friendly materials are among the foremost aspects, which capture the attention of the public. Nonetheless, success in these areas heavily depends on other ancillary sectors, which should provide a basic support. Among them, information and communication technologies (ICTs) certainly have a major role to play.
ICTs are the basis of autonomic and intelligent systems, capable to optimize the usage of available resources in modern economy. Their application is pervasive, but the transportation and energy sectors are those where their impact might reveal most significant. In the second case, in particular, the deployment of ubiquitous intelligent systems and networks that form the data collection and processing infrastructure of the so-called Smart Grid can effectively improve the efficiency of current energy production, management, distribution and consumption and integrate a growing number of renewable sources.
However, the widespread use of ICT in other sectors and in the energy one in particular must take into account the problems and costs – also in terms of energy consumption – connected with its introduction. The energy requirements of ICT supporting systems must be evaluated, and they must obviously not overcome the energy saving they allow to obtain, and should not even reduce their reach beyond what is strictly needed. Such requirements can be synthesized primarily in the total energy to produce and operate the necessary devices and infrastructures. Moreover, the cost of the disposal of exhausted, obsolete and faulty components should be evaluated, in terms of energy and environmental impact.
This report is part of ITU-T’s activities on ICT and Climate Change and has been commissioned by ITU in support of “International Year for Sustainable Energy for All”.
This report focuses on the analysis of the contribution that the ICT sector applied to Smart Grids can bring to mitigation of climate changes, through its application within more rational and efficient energy systems, with a particular emphasis on the requirements of the networking infrastructures, architectures, and power consumption. On the other hand, it will also highlight the mutual benefit that the advent of the Smart Grid may have on ICT, by fostering ICT energy efficiency and by allowing a much more flexible, economical and efficient energy provision for ICT equipment.
Boosting energy efficiency through Smart Grids 3
2 Climate change and greenhouse gas (GHG) emissions
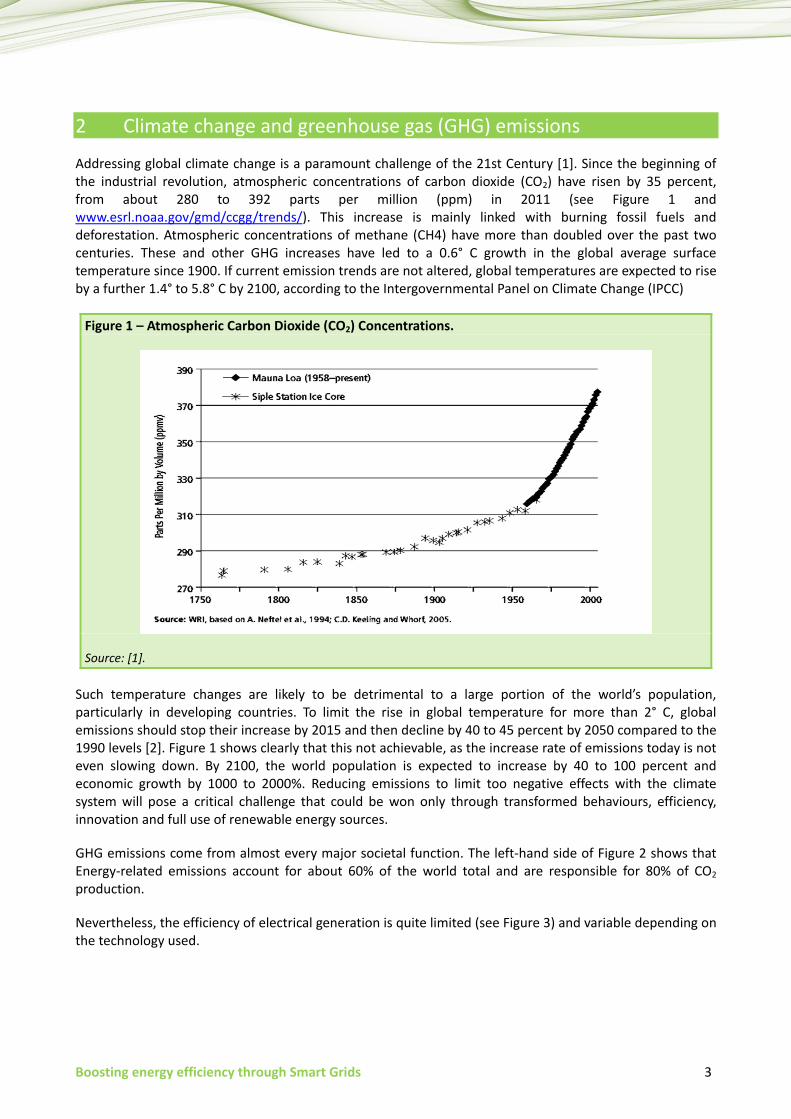
Addressing global climate change is a paramount challenge of the 21st Century [1]. Since the beginning of the industrial revolution, atmospheric concentrations of carbon dioxide (CO2) have risen by 35 percent, from about 280 to 392 parts per million (ppm) in 2011 (see Figure 1 and www.esrl.noaa.gov/gmd/ccgg/trends/). This increase is mainly linked with burning fossil fuels and deforestation. Atmospheric concentrations of methane (CH4) have more than doubled over the past two centuries. These and other GHG increases have led to a 0.6° C growth in the global average surface temperature since 1900. If current emission trends are not altered, global temperatures are expected to rise by a further 1.4° to 5.8° C by 2100, according to the Intergovernmental Panel on Climate Change (IPCC)
Figure 1 – Atmospheric Carbon Dioxide (CO2) Concentrations.
Source: [1].
Such temperature changes are likely to be detrimental to a large portion of the world’s population, particularly in developing countries. To limit the rise in global temperature for more than 2° C, global emissions should stop their increase by 2015 and then decline by 40 to 45 percent by 2050 compared to the 1990 levels [2]. Figure 1 shows clearly that this not achievable, as the increase rate of emissions today is not even slowing down. By 2100, the world population is expected to increase by 40 to 100 percent and economic growth by 1000 to 2000%. Reducing emissions to limit too negative effects with the climate system will pose a critical challenge that could be won only through transformed behaviours, efficiency, innovation and full use of renewable energy sources.
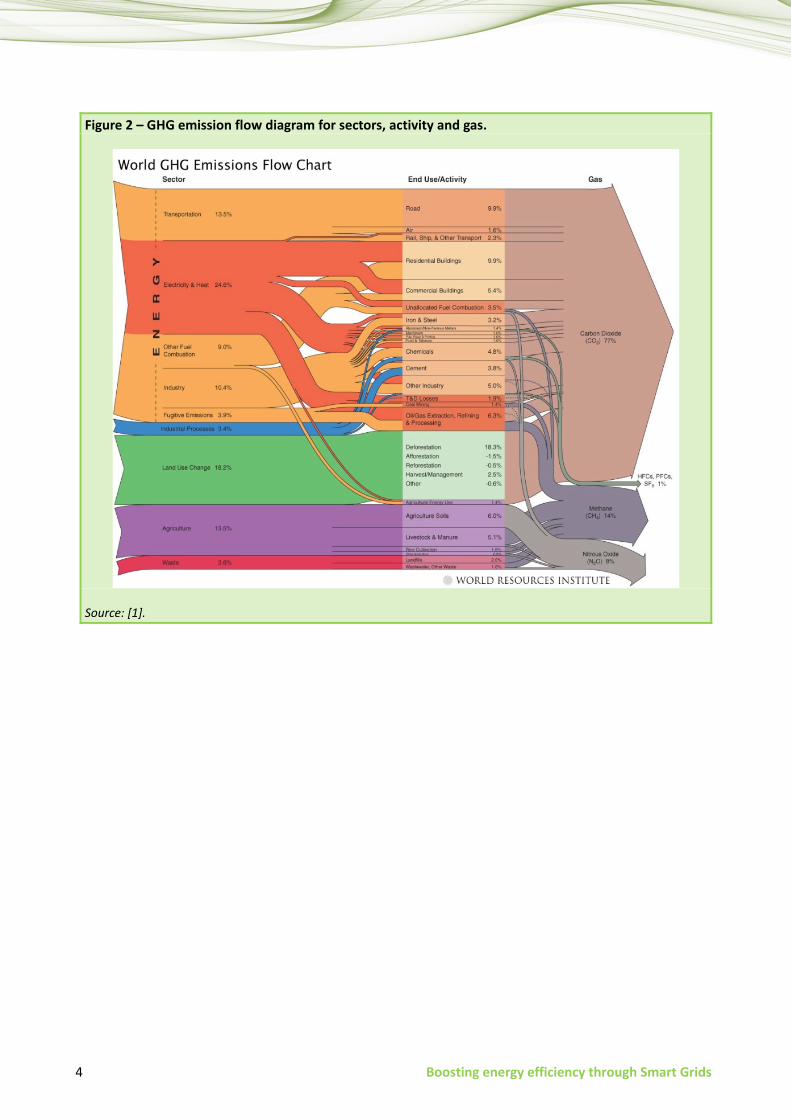
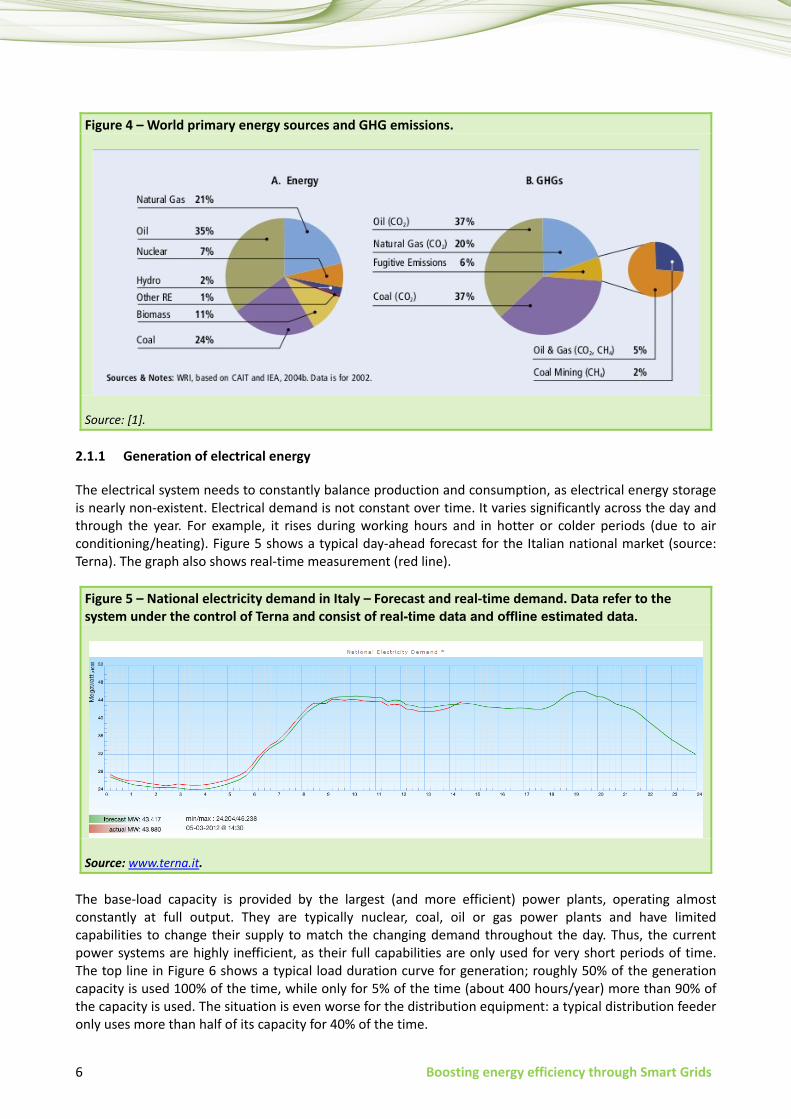
GHG emissions come from almost every major societal function. The left-hand side of Figure 2 shows that Energy-related emissions account for about 60% of the world total and are responsible for 80% of CO2
production.
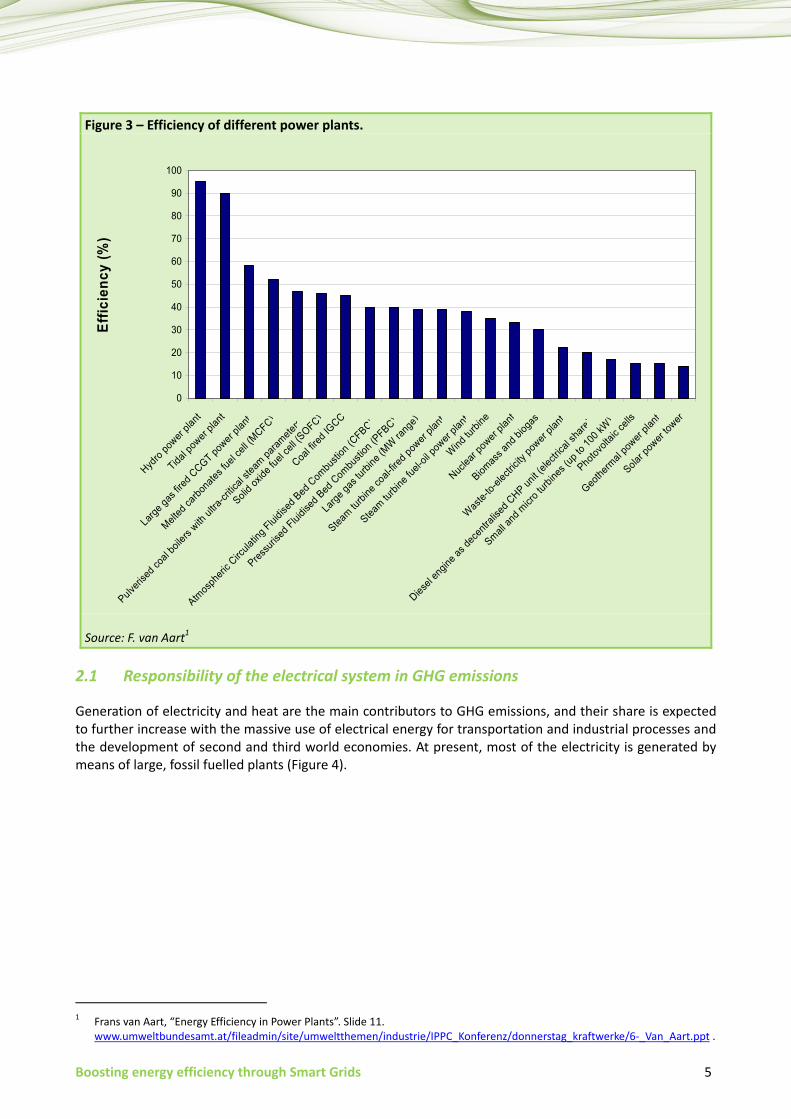
Nevertheless, the efficiency of electrical generation is quite limited (see Figure 3) and variable depending on the technology used.
4 Boosting energy efficiency through Smart Grids
Figure 2 – GHG emission flow diagram for sectors, activity and gas.
Source: [1].
Boosting energy efficiency through Smart Grids 5
Figure 3 – Efficiency of different power plants.
Source: F. van Aart1
2.1 Responsibility of the electrical system in GHG emissions
Generation of electricity and heat are the main contributors to GHG emissions, and their share is expected to further increase with the massive use of electrical energy for transportation and industrial processes and the development of second and third world economies. At present, most of the electricity is generated by means of large, fossil fuelled plants (Figure 4).
1 Frans van Aart, “Energy Efficiency in Power Plants”. Slide 11.
www.umweltbundesamt.at/fileadmin/site/umweltthemen/industrie/IPPC_Konferenz/donnerstag_kraftwerke/6-_Van_Aart.ppt .
0
10
20
30
40
50
60
70
80
90
100
Hydro
pow
er p
lant
Tidal p
ower
plan
t
Larg
e gas
fired
CCGT po
wer plan
t
Melt
ed ca
rbon
ates
fuel
cell (
MCFC)
Pulveris
ed co
al boil
ers w
ith u
ltra-
critic
al ste
am p
aram
eters
Solid o
xide
fuel
cell (
SOFC)
Coal fi
red
IGCC
Atmos
pher
ic Circ
ulatin
g Flui
dised
Bed
Com
busti
on (C
FBC)
Press
urise
d Flui
dised
Bed
Com
busti
on (P
FBC)
Larg
e ga
s tur
bine
(MW
rang
e)
Steam
turb
ine co
al-fir
ed p
ower
plan
t
Steam
turb
ine fu
el-oil
pow
er p
lant
Wind
turb
ine
Nuclea
r pow
er plan
t
Biomas
s and
biog
as
Was
te-to
-elec
tricit
y pow
er p
lant
Diesel e
ngine
as d
ecen
tralis
ed C
HP unit (
electr
ical s
hare
)
Small
and
micr
o tu
rbine
s (up
to 1
00 kW
)
Photovo
ltaic
cells
Geoth
erm
al po
wer p
lant
Solar p
ower
tower
Effic
ienc
y (%
)
6 Boosting energy efficiency through Smart Grids
Figure 4 – World primary energy sources and GHG emissions.
Source: [1].
2.1.1 Generation of electrical energy
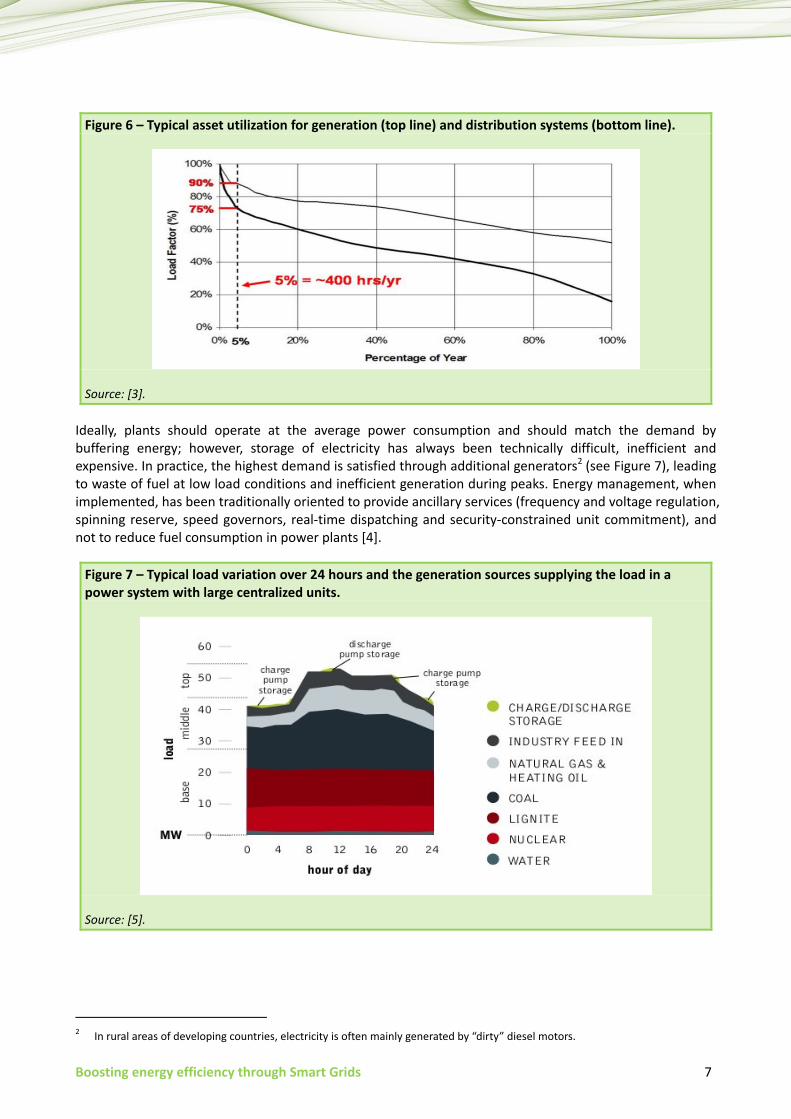
The electrical system needs to constantly balance production and consumption, as electrical energy storage is nearly non-existent. Electrical demand is not constant over time. It varies significantly across the day and through the year. For example, it rises during working hours and in hotter or colder periods (due to air conditioning/heating). Figure 5 shows a typical day-ahead forecast for the Italian national market (source: Terna). The graph also shows real-time measurement (red line).
Figure 5 – National electricity demand in Italy – Forecast and real-time demand. Data refer to the system under the control of Terna and consist of real-time data and offline estimated data.
Source: www.terna.it.
The base-load capacity is provided by the largest (and more efficient) power plants, operating almost constantly at full output. They are typically nuclear, coal, oil or gas power plants and have limited capabilities to change their supply to match the changing demand throughout the day. Thus, the current power systems are highly inefficient, as their full capabilities are only used for very short periods of time. The top line in Figure 6 shows a typical load duration curve for generation; roughly 50% of the generation capacity is used 100% of the time, while only for 5% of the time (about 400 hours/year) more than 90% of the capacity is used. The situation is even worse for the distribution equipment: a typical distribution feeder only uses more than half of its capacity for 40% of the time.
Boosting energy efficiency through Smart Grids 7
Figure 6 – Typical asset utilization for generation (top line) and distribution systems (bottom line).
Source: [3].
Ideally, plants should operate at the average power consumption and should match the demand by buffering energy; however, storage of electricity has always been technically difficult, inefficient and expensive. In practice, the highest demand is satisfied through additional generators2 (see Figure 7), leading to waste of fuel at low load conditions and inefficient generation during peaks. Energy management, when implemented, has been traditionally oriented to provide ancillary services (frequency and voltage regulation, spinning reserve, speed governors, real-time dispatching and security-constrained unit commitment), and not to reduce fuel consumption in power plants [4].
Figure 7 – Typical load variation over 24 hours and the generation sources supplying the load in a power system with large centralized units.
Source: [5].
2 In rural areas of developing countries, electricity is often mainly generated by “dirty” diesel motors.
8 Boosting energy efficiency through Smart Grids
Current power grids have not been designed with efficiency as their primary goal and with the aim to reduce GHG emissions. Moreover, they are already working close to their capacity limit, whilst reduction of oil use will increase the demand for electricity.
2.1.2 Generation of electrical energy by renewables
As previously stated, reaching the challenging environmental goals will rely heavily on the transition from centralized, conventional fuel plants to smaller, distributed generators able to harvest energy from clean energy sources like wind, solar, hydro and biomass [5].
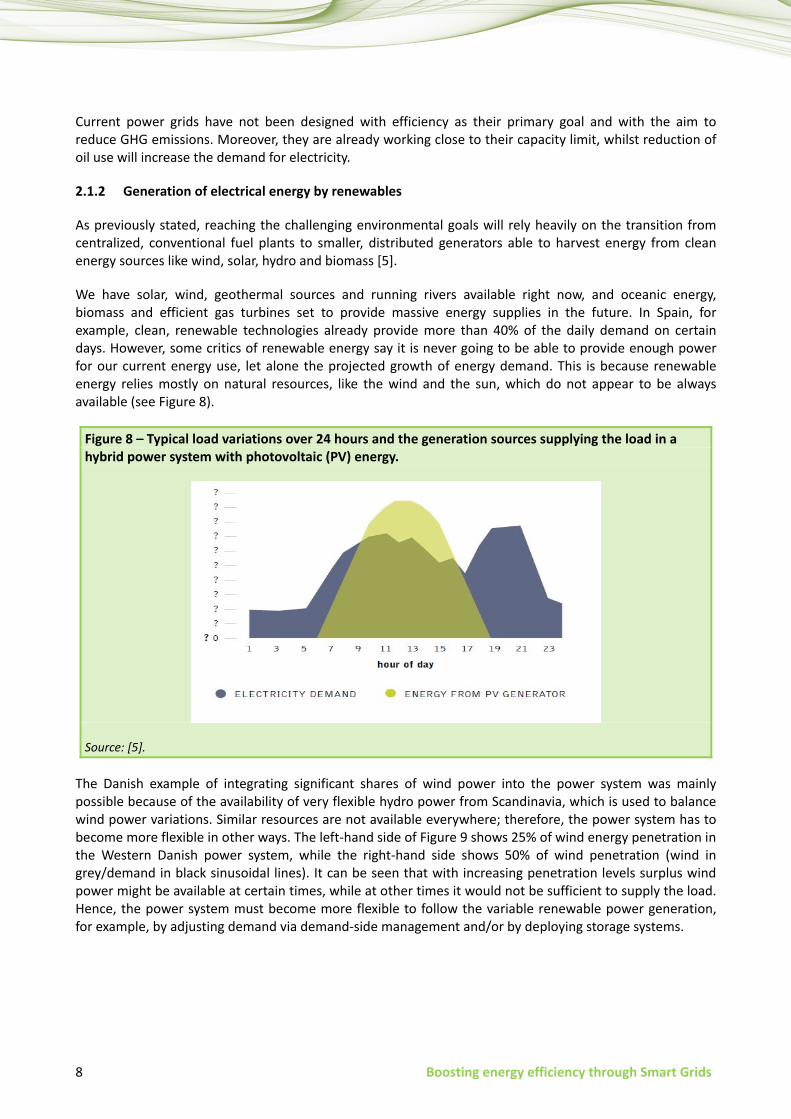
We have solar, wind, geothermal sources and running rivers available right now, and oceanic energy, biomass and efficient gas turbines set to provide massive energy supplies in the future. In Spain, for example, clean, renewable technologies already provide more than 40% of the daily demand on certain days. However, some critics of renewable energy say it is never going to be able to provide enough power for our current energy use, let alone the projected growth of energy demand. This is because renewable energy relies mostly on natural resources, like the wind and the sun, which do not appear to be always available (see Figure 8).
Figure 8 – Typical load variations over 24 hours and the generation sources supplying the load in a hybrid power system with photovoltaic (PV) energy.
Source: [5].
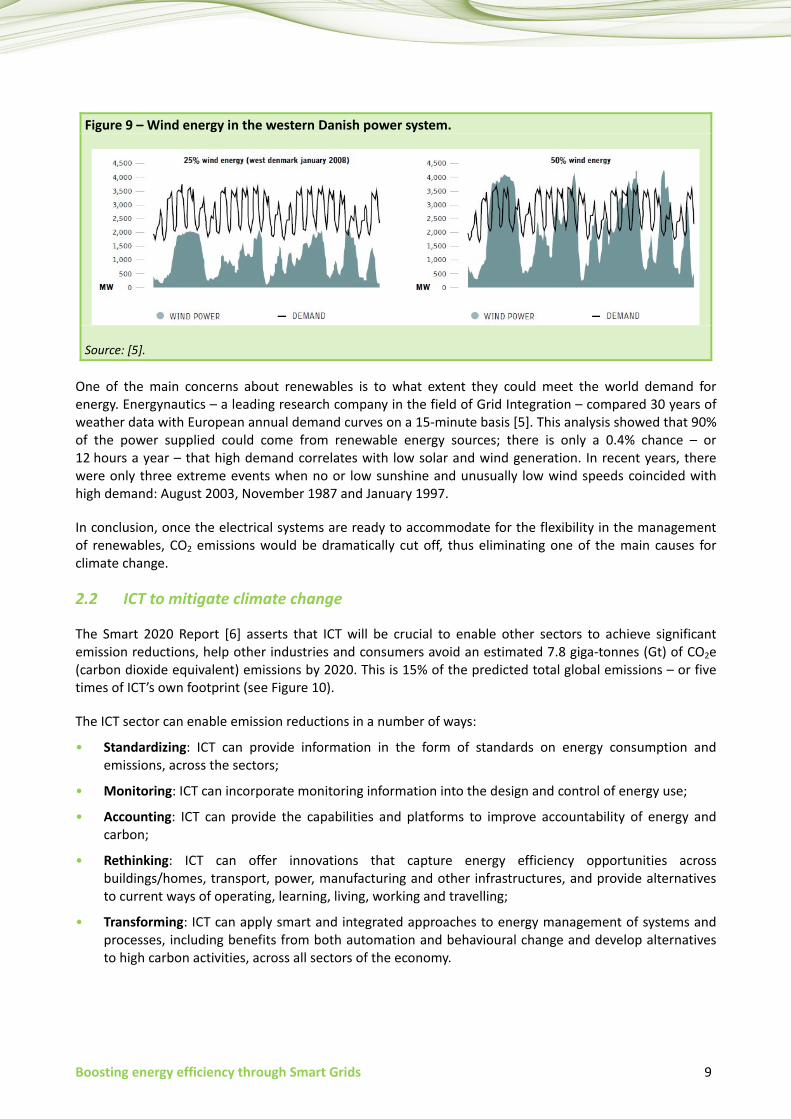
The Danish example of integrating significant shares of wind power into the power system was mainly possible because of the availability of very flexible hydro power from Scandinavia, which is used to balance wind power variations. Similar resources are not available everywhere; therefore, the power system has to become more flexible in other ways. The left-hand side of Figure 9 shows 25% of wind energy penetration in the Western Danish power system, while the right-hand side shows 50% of wind penetration (wind in grey/demand in black sinusoidal lines). It can be seen that with increasing penetration levels surplus wind power might be available at certain times, while at other times it would not be sufficient to supply the load. Hence, the power system must become more flexible to follow the variable renewable power generation, for example, by adjusting demand via demand-side management and/or by deploying storage systems.
Boosting energy efficiency through Smart Grids 9
Figure 9 – Wind energy in the western Danish power system.
Source: [5].
One of the main concerns about renewables is to what extent they could meet the world demand for energy. Energynautics – a leading research company in the field of Grid Integration – compared 30 years of weather data with European annual demand curves on a 15-minute basis [5]. This analysis showed that 90% of the power supplied could come from renewable energy sources; there is only a 0.4% chance – or 12 hours a year – that high demand correlates with low solar and wind generation. In recent years, there were only three extreme events when no or low sunshine and unusually low wind speeds coincided with high demand: August 2003, November 1987 and January 1997.
In conclusion, once the electrical systems are ready to accommodate for the flexibility in the management of renewables, CO2 emissions would be dramatically cut off, thus eliminating one of the main causes for climate change.
2.2 ICT to mitigate climate change
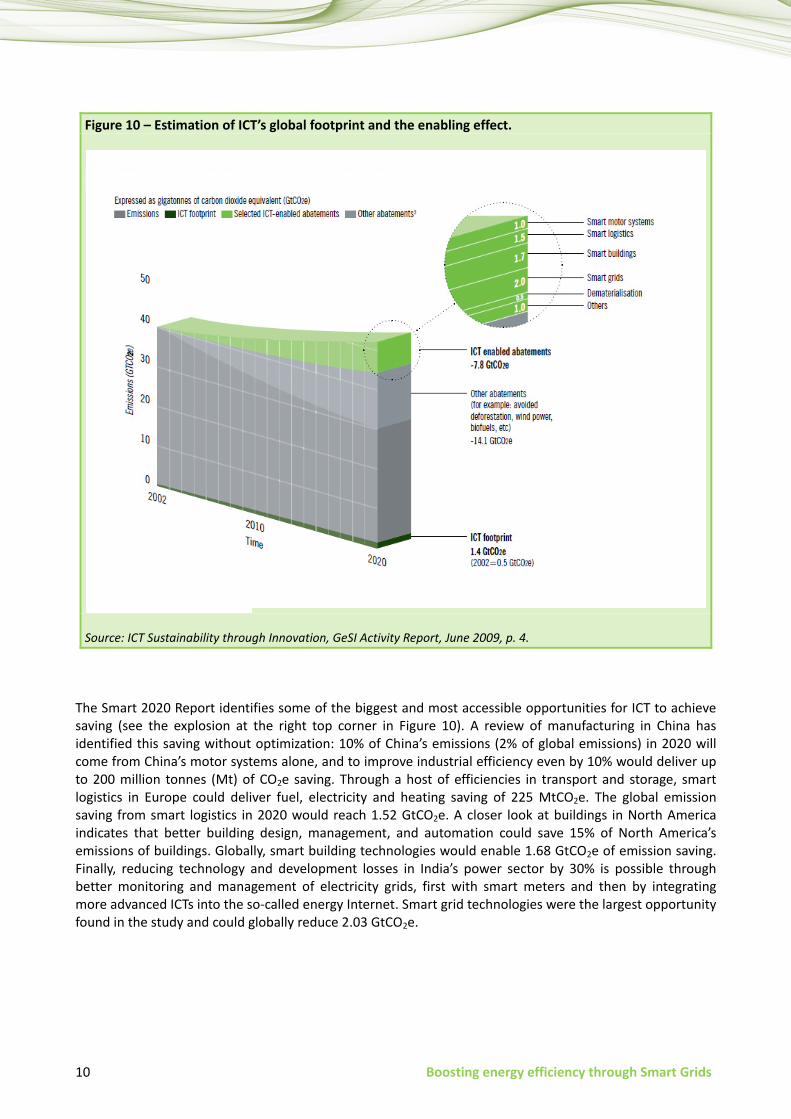
The Smart 2020 Report [6] asserts that ICT will be crucial to enable other sectors to achieve significant emission reductions, help other industries and consumers avoid an estimated 7.8 giga-tonnes (Gt) of CO2e (carbon dioxide equivalent) emissions by 2020. This is 15% of the predicted total global emissions – or five times of ICT’s own footprint (see Figure 10).
The ICT sector can enable emission reductions in a number of ways:
• Standardizing: ICT can provide information in the form of standards on energy consumption and emissions, across the sectors;
• Monitoring: ICT can incorporate monitoring information into the design and control of energy use;
• Accounting: ICT can provide the capabilities and platforms to improve accountability of energy and carbon;
• Rethinking: ICT can offer innovations that capture energy efficiency opportunities across buildings/homes, transport, power, manufacturing and other infrastructures, and provide alternatives to current ways of operating, learning, living, working and travelling;
• Transforming: ICT can apply smart and integrated approaches to energy management of systems and processes, including benefits from both automation and behavioural change and develop alternatives to high carbon activities, across all sectors of the economy.
10 Boosting energy efficiency through Smart Grids
Figure 10 – Estimation of ICT’s global footprint and the enabling effect.
Source: ICT Sustainability through Innovation, GeSI Activity Report, June 2009, p. 4.
The Smart 2020 Report identifies some of the biggest and most accessible opportunities for ICT to achieve saving (see the explosion at the right top corner in Figure 10). A review of manufacturing in China has identified this saving without optimization: 10% of China’s emissions (2% of global emissions) in 2020 will come from China’s motor systems alone, and to improve industrial efficiency even by 10% would deliver up to 200 million tonnes (Mt) of CO2e saving. Through a host of efficiencies in transport and storage, smart logistics in Europe could deliver fuel, electricity and heating saving of 225 MtCO2e. The global emission saving from smart logistics in 2020 would reach 1.52 GtCO2e. A closer look at buildings in North America indicates that better building design, management, and automation could save 15% of North America’s emissions of buildings. Globally, smart building technologies would enable 1.68 GtCO2e of emission saving. Finally, reducing technology and development losses in India’s power sector by 30% is possible through better monitoring and management of electricity grids, first with smart meters and then by integrating more advanced ICTs into the so-called energy Internet. Smart grid technologies were the largest opportunity found in the study and could globally reduce 2.03 GtCO2e.
Fonte: www.gesi.org
Boosting energy efficiency through Smart Grids 11
3 Smart Grid to mitigate climate change
3.1 Towards “smart” energy grids
The purpose of an electrical power system is to deliver energy in a reliable way from the production points to the consumers. The traditional electrical system architecture is characterized by a unidirectional flow of energy from few production sites to many users.
Production is carried out by large power plants that generate electrical energy from various sources such as coal, oil, nuclear and large renewables. They are usually located away from urban areas to avoid environmental impact on the cities, and are in convenient places for technical reasons (e.g. fuel supplying, availability of natural resources, plant cooling).
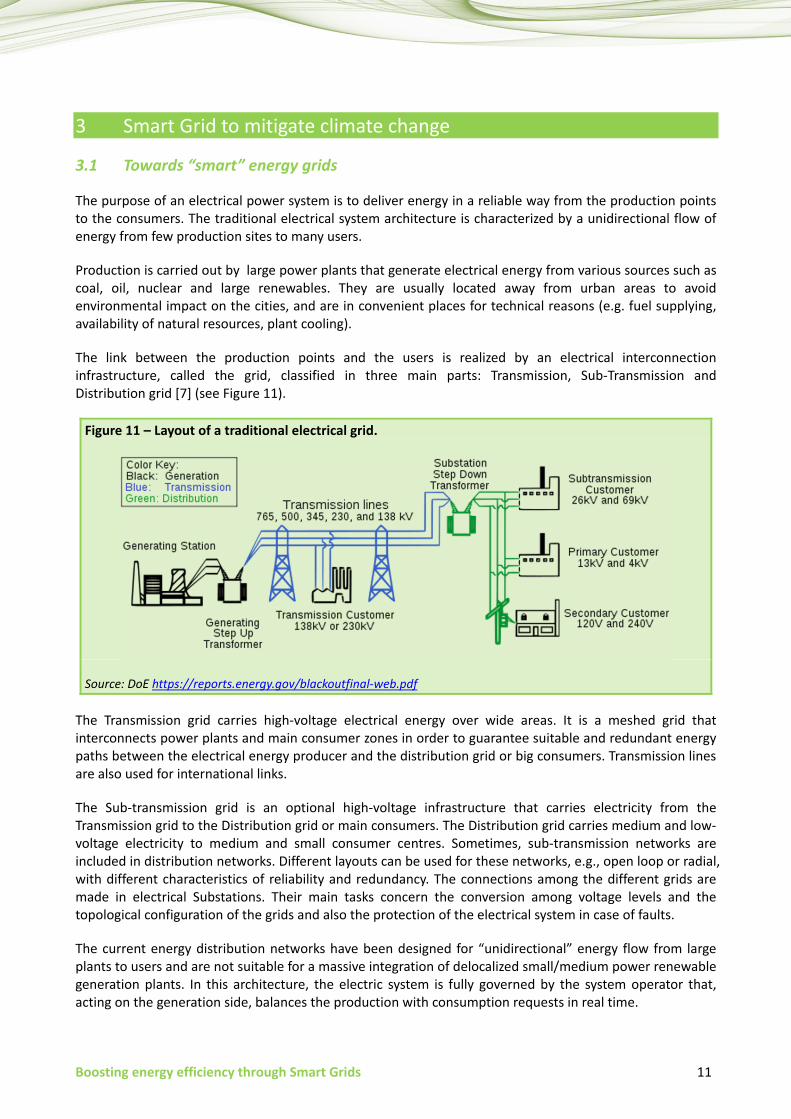
The link between the production points and the users is realized by an electrical interconnection infrastructure, called the grid, classified in three main parts: Transmission, Sub-Transmission and Distribution grid [7] (see Figure 11).
Figure 11 – Layout of a traditional electrical grid.
Source: DoE https://reports.energy.gov/blackoutfinal-web.pdf
The Transmission grid carries high-voltage electrical energy over wide areas. It is a meshed grid that interconnects power plants and main consumer zones in order to guarantee suitable and redundant energy paths between the electrical energy producer and the distribution grid or big consumers. Transmission lines are also used for international links.
The Sub-transmission grid is an optional high-voltage infrastructure that carries electricity from the Transmission grid to the Distribution grid or main consumers. The Distribution grid carries medium and low-voltage electricity to medium and small consumer centres. Sometimes, sub-transmission networks are included in distribution networks. Different layouts can be used for these networks, e.g., open loop or radial, with different characteristics of reliability and redundancy. The connections among the different grids are made in electrical Substations. Their main tasks concern the conversion among voltage levels and the topological configuration of the grids and also the protection of the electrical system in case of faults.
The current energy distribution networks have been designed for “unidirectional” energy flow from large plants to users and are not suitable for a massive integration of delocalized small/medium power renewable generation plants. In this architecture, the electric system is fully governed by the system operator that, acting on the generation side, balances the production with consumption requests in real time.
12 Boosting energy efficiency through Smart Grids
In the future, the goal of reduction of GHGs emissions will be to ensure the production of more clean energy using renewable resources such as wind, solar, hydro and biomass. Among them, the wind and solar are variable sources that are only partially predictable, while the hydro and biomass energies are controllable sources. Moreover, electric renewable production comprises, on one side, big power plants geographically located in a delimited area and normally connected to the transmission grid (e.g., offshore wind farms, concentrated solar power plants) and, on the other side, small/medium power generators geographically distributed in a large area and connected to distribution grids (e.g. photovoltaic roof or Combined Heat and Power (CHP)).
Intermittent and only partially predictable availability of some renewable sources (wind, sun) makes difficult to balance energy production and consumption in real time, as required for grid stability. As a consequence of this new generation model, electrical grids are expected to radically change their behaviour, becoming “smarter”.
A Smart Grid is an electricity grid that allows the massive integration of unpredictable and intermittent renewable sources, and distributes power highly efficiently. It is an electricity network that uses distributed energy resources and advanced communication and control technologies to deliver electricity more cost-effectively, with lower greenhouse intensity and with active involvement of the customers.
Typically, smaller forms of electricity generation are combined with energy management to balance out the load of all the users on the system. Small generators include wind turbines, solar panels, micro turbines, fuel cells and co-generation (combined heat and power). These types of energy sources can be closer to the users, in comparison to the large centralized source a long way away, and can improve the efficiency of the electric system by reducing grid losses. Smart grids are a way to get massive amounts of renewable energy with no greenhouse emissions into the system, and to allow the progressive decommissioning of older, centralized power sources with high production of GHGs.
In order to maintain the grid stability in the presence of great amounts of variable production from renewable sources, a large effort is required to control other generators and/or the energy demand (loads) by actively involving the users to modify their consumption according to the current production. The actual electrical grid control method, with production that follows the “user demand”, is expected to change towards a more flexible scheme, in which the “user demand” can be influenced or partially controlled depending on renewable production availability. This evolution will change the whole electricity supply chain, from generation, transmission and distribution to the customer side. The current system will progressively see an increasing number of “prosumers”, namely, users that are both producers and consumers. The variable and unpredictable power production from renewable energy sources in different hours and seasons will require flexible dynamic loads and large storage capacity to keep an optimal balance between availability and demand of electric energy.
Advanced types of control and management technologies for the electrical grid can also contribute to a more efficient operational running of the overall system. These technologies include devices such as smart electricity meters that show real-time use of energy and that can respond to remote communication, enabling dynamic electricity pricing related to real production and distribution costs.
To provide high quality energy in this context of increased variability and complexity of the electric system requires a suitable control infrastructure based on more pervasive ICT solutions on the whole electrical supply chain.
Boosting energy efficiency through Smart Grids 13
3.2 Main issues in Smart Grid implementation
The strong variability imposed on the future electrical system by the high penetration of renewable energy sources entails the implementation of new extended monitoring and control functions of the system.
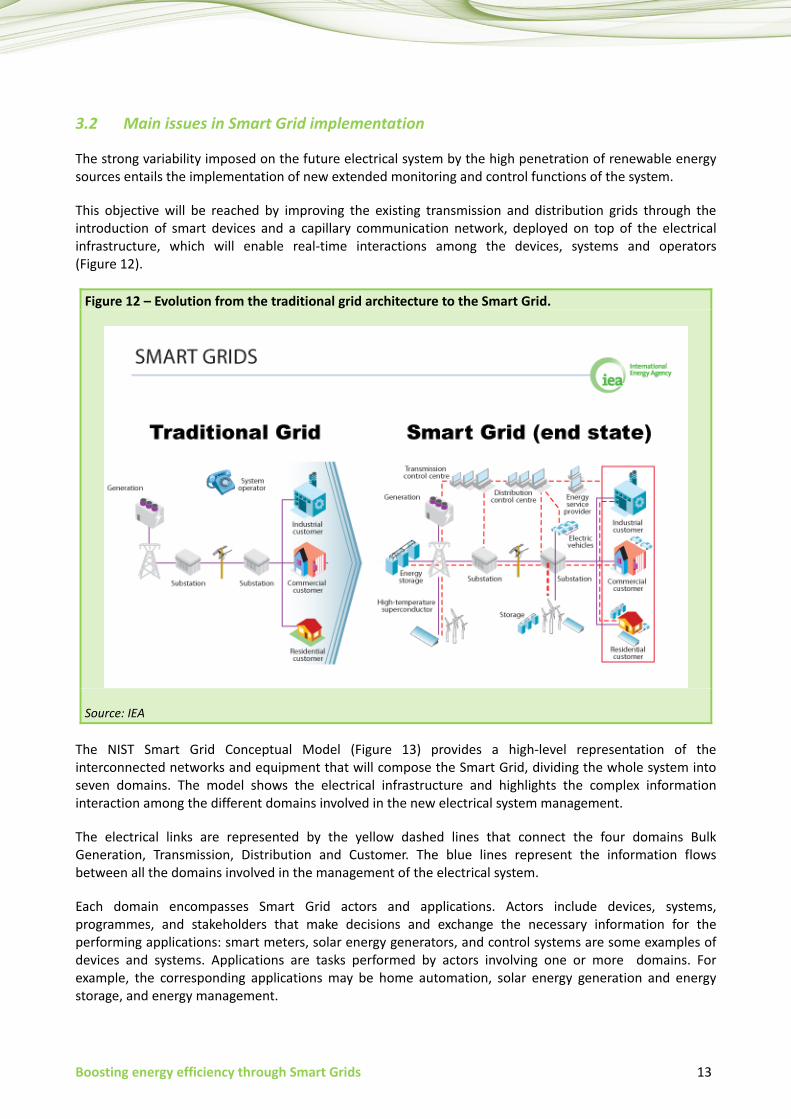
This objective will be reached by improving the existing transmission and distribution grids through the introduction of smart devices and a capillary communication network, deployed on top of the electrical infrastructure, which will enable real-time interactions among the devices, systems and operators (Figure 12).
Figure 12 – Evolution from the traditional grid architecture to the Smart Grid.
Source: IEA
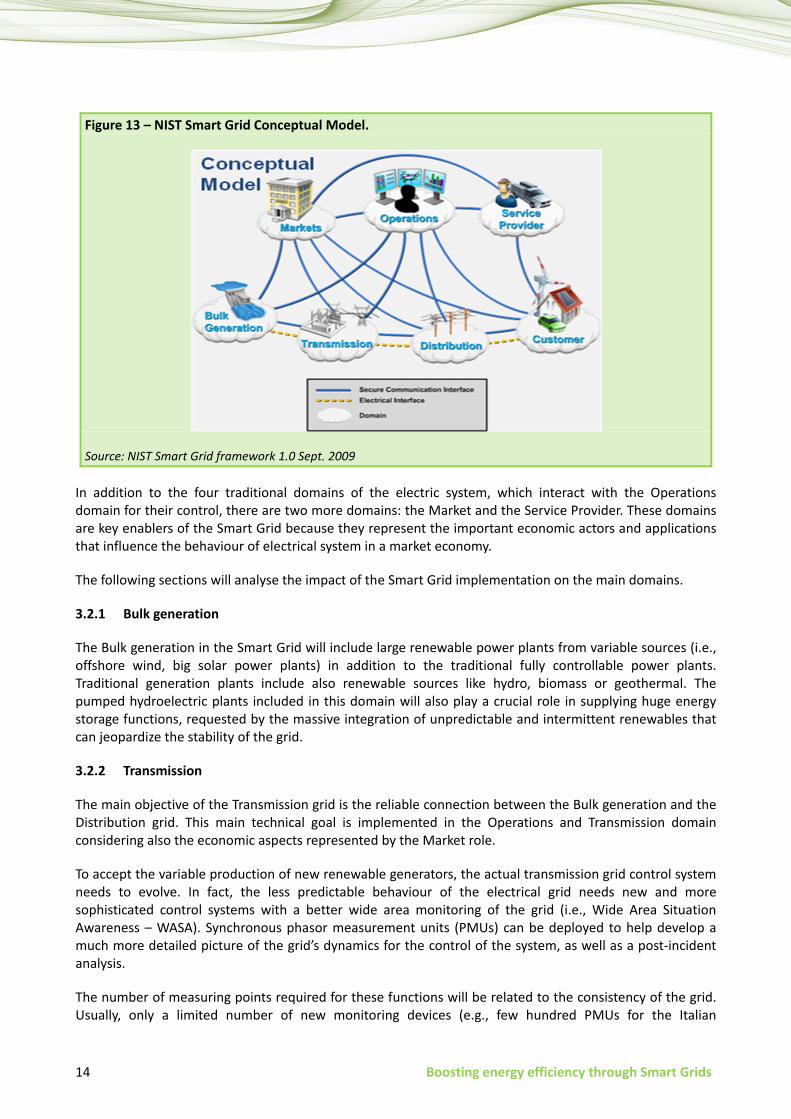
The NIST Smart Grid Conceptual Model (Figure 13) provides a high-level representation of the interconnected networks and equipment that will compose the Smart Grid, dividing the whole system into seven domains. The model shows the electrical infrastructure and highlights the complex information interaction among the different domains involved in the new electrical system management.
The electrical links are represented by the yellow dashed lines that connect the four domains Bulk Generation, Transmission, Distribution and Customer. The blue lines represent the information flows between all the domains involved in the management of the electrical system.
Each domain encompasses Smart Grid actors and applications. Actors include devices, systems, programmes, and stakeholders that make decisions and exchange the necessary information for the performing applications: smart meters, solar energy generators, and control systems are some examples of devices and systems. Applications are tasks performed by actors involving one or more domains. For example, the corresponding applications may be home automation, solar energy generation and energy storage, and energy management.
14 Boosting energy efficiency through Smart Grids
Figure 13 – NIST Smart Grid Conceptual Model.
Source: NIST Smart Grid framework 1.0 Sept. 2009
In addition to the four traditional domains of the electric system, which interact with the Operations domain for their control, there are two more domains: the Market and the Service Provider. These domains are key enablers of the Smart Grid because they represent the important economic actors and applications that influence the behaviour of electrical system in a market economy.
The following sections will analyse the impact of the Smart Grid implementation on the main domains.
3.2.1 Bulk generation
The Bulk generation in the Smart Grid will include large renewable power plants from variable sources (i.e., offshore wind, big solar power plants) in addition to the traditional fully controllable power plants. Traditional generation plants include also renewable sources like hydro, biomass or geothermal. The pumped hydroelectric plants included in this domain will also play a crucial role in supplying huge energy storage functions, requested by the massive integration of unpredictable and intermittent renewables that can jeopardize the stability of the grid.
3.2.2 Transmission
The main objective of the Transmission grid is the reliable connection between the Bulk generation and the Distribution grid. This main technical goal is implemented in the Operations and Transmission domain considering also the economic aspects represented by the Market role.
To accept the variable production of new renewable generators, the actual transmission grid control system needs to evolve. In fact, the less predictable behaviour of the electrical grid needs new and more sophisticated control systems with a better wide area monitoring of the grid (i.e., Wide Area Situation Awareness – WASA). Synchronous phasor measurement units (PMUs) can be deployed to help develop a much more detailed picture of the grid’s dynamics for the control of the system, as well as a post-incident analysis.
The number of measuring points required for these functions will be related to the consistency of the grid. Usually, only a limited number of new monitoring devices (e.g., few hundred PMUs for the Italian
Boosting energy efficiency through Smart Grids 15
transmission grid operator) are requested, with stricter communication network requirement in terms of bandwidth and latency.
Neighbourhood national transmission grids are also usually interconnected in a bigger grid allowing an inter-area power exchange and improving stability of the overall system.
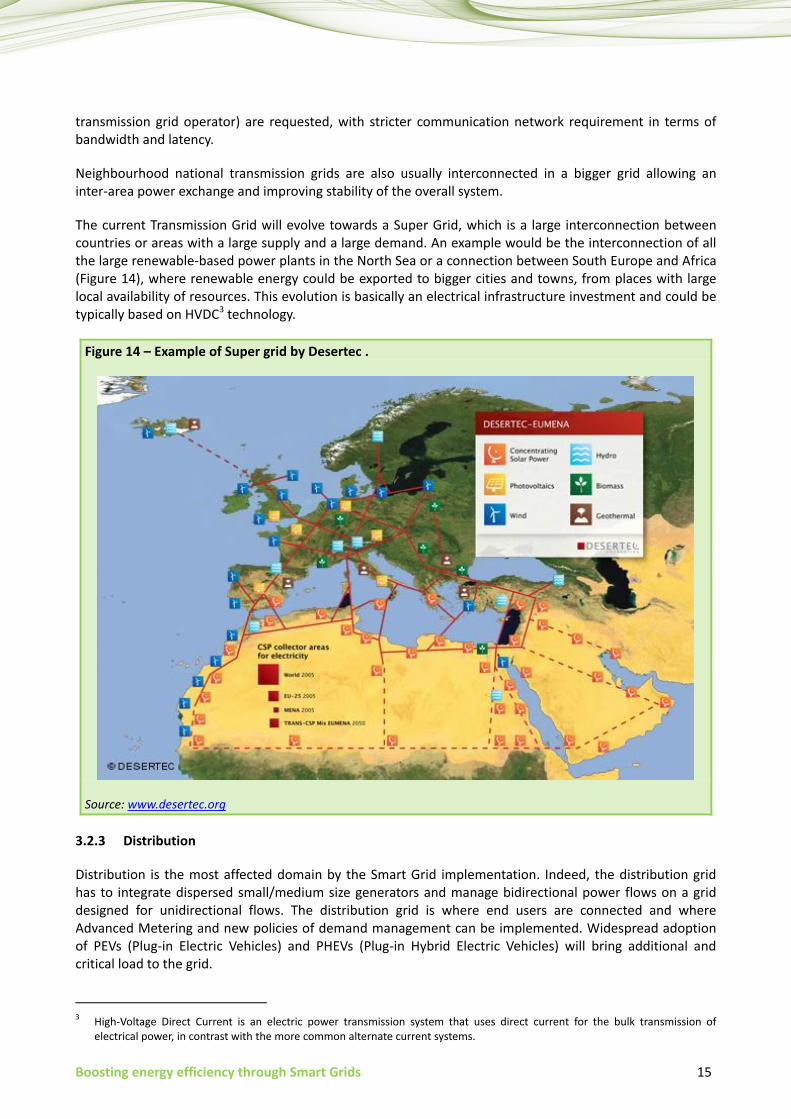
The current Transmission Grid will evolve towards a Super Grid, which is a large interconnection between countries or areas with a large supply and a large demand. An example would be the interconnection of all the large renewable-based power plants in the North Sea or a connection between South Europe and Africa (Figure 14), where renewable energy could be exported to bigger cities and towns, from places with large local availability of resources. This evolution is basically an electrical infrastructure investment and could be typically based on HVDC3 technology.
Figure 14 – Example of Super grid by Desertec .
Source: www.desertec.org
3.2.3 Distribution
Distribution is the most affected domain by the Smart Grid implementation. Indeed, the distribution grid has to integrate dispersed small/medium size generators and manage bidirectional power flows on a grid designed for unidirectional flows. The distribution grid is where end users are connected and where Advanced Metering and new policies of demand management can be implemented. Widespread adoption of PEVs (Plug-in Electric Vehicles) and PHEVs (Plug-in Hybrid Electric Vehicles) will bring additional and critical load to the grid.
3 High-Voltage Direct Current is an electric power transmission system that uses direct current for the bulk transmission of
electrical power, in contrast with the more common alternate current systems.
16 Boosting energy efficiency through Smart Grids
The availability of distributed generators gives a real chance to have local production where electric power is needed. This approach can reduce the bulk of energy transferred by long transmission lines and bring more efficiency, due to less power losses. This can also increase the local reliability of the power systems and provide better efficiency by using local renewable resources (wind, water, sun, biomasses).
The integration on the distribution grid of a great number of partially predictable variable sources and of new types of loads poses grid operation issues that require new control and protection schemes. One of the possibilities to balance generation and load in real time is to involve consumers, by asking them to modify their normal consumption patterns in response to a utility's need.
Moreover, a group of electrical sources and loads can be organized in a semi-autonomous system called micro-grid. It is usually connected and synchronized to the main electrical grid, and if the latter fails it can be isolated and it can keep on operating. The main challenge with micro-grids and local generation is energy accuracy and quality, which means voltage stability and frequency synchronization with the main grid. Micro-grids contribute to a hierarchical organization of the distribution systems that can help the balance between generation and load in real time.
The massive integration of unpredictable and intermittent renewable sources will be facilitated by the installation of huge distributed and widespread storage capacity. Energy storage involves the conversion of electricity into some other form of energy (batteries, hydrogen, etc.). Until now, few installations are present in the distribution systems, in bulk power plants and at large utilities that need uninterruptible power supply (e.g., telecoms).
Finally, it is worth noting the relevance that plug-in electric vehicles (PEVs) are expected to have on energy storage. Due to their large capacity for energy storage, they will have a high potential for power injection into the same grid. In the first deployment phase of electric mobility, PEVs and PHEVs will be managed only as flexible loads due to actual vehicle technical constraints. Large-scale integration of electrical vehicles will require intelligence programmes to manage charging/discharging operations to meet the dynamic network load; this includes turning off or reducing the charge rate (perhaps according to the current level of charge) and even getting back power during critical grid events. Obviously, owners of vehicles should be willing to grant energy operators these possibilities; again, economic incentives and real-time prices are feasible ways to get customers involved in the energy deal.
The interaction between utilities and customers for demand/response, dynamic pricing, electric storage, PEV management and other services in smart grids (e.g., voltage, frequency control) will require a further evolution, yielding to the deployment of customer interface infrastructure. This infrastructure will build a two-way communication channel towards customers to collect data and to carry information; this will allow (near) real-time response to network conditions through dynamic pricing and load shedding.
The management of the distributed generation/storage/consumer should be realized by a widespread control infrastructure. All new functions related to Distributed Energy Resources (DER) management require an extension of today’s automation and control systems in the Distribution grids, from the actual control infrastructure, often limited to the higher-level part of the grid (Primary Substation), to a more widespread coverage that includes all the medium and low voltage level networks.
To have an idea of the number of grid nodes involved in that system evolution, consider, as an example, that for the Italian distribution grid it would imply installing protection and control devices in about 400,000 MV/LV substations, having already installed over 30 million Automated Meters.
3.2.4 Customer
The Smart Grid paradigm, which involves the customers’ participation in energy trading and their active behaviour in producing and using electric power, requires new grid management schemes including load
Boosting energy efficiency through Smart Grids 17
management programmes (Demand/Response) developed to influence the electricity usage patterns of customers. Usually, these policies foster the use of energy during off-peak hours, such as night-time and weekends.
Demand/Response (DR) is a complex of activities designed to change the amount and/or timing of customers’ use of electricity in response to supply conditions. The main background for DR is that the operation of many appliances is actually not affected by small delays: this is especially true for air conditioning, refrigerators, washing machines, dish-washers.
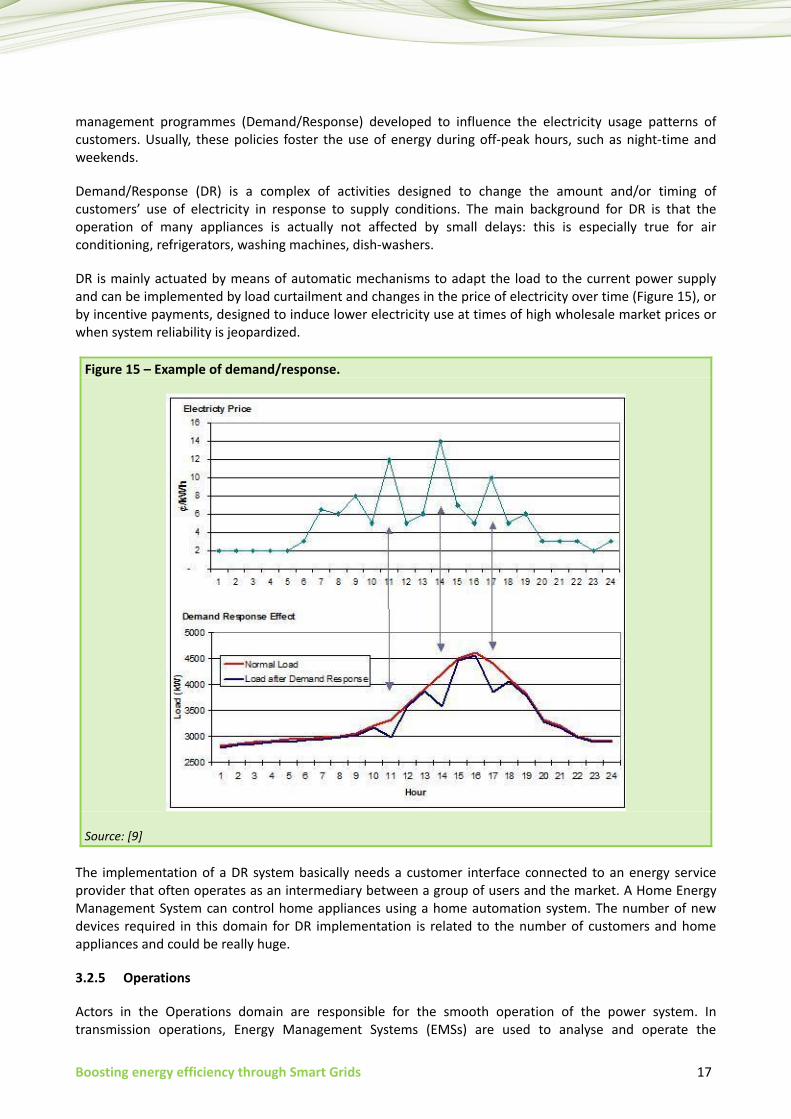
DR is mainly actuated by means of automatic mechanisms to adapt the load to the current power supply and can be implemented by load curtailment and changes in the price of electricity over time (Figure 15), or by incentive payments, designed to induce lower electricity use at times of high wholesale market prices or when system reliability is jeopardized.
Figure 15 – Example of demand/response.
Source: [9]
The implementation of a DR system basically needs a customer interface connected to an energy service provider that often operates as an intermediary between a group of users and the market. A Home Energy Management System can control home appliances using a home automation system. The number of new devices required in this domain for DR implementation is related to the number of customers and home appliances and could be really huge.
3.2.5 Operations
Actors in the Operations domain are responsible for the smooth operation of the power system. In transmission operations, Energy Management Systems (EMSs) are used to analyse and operate the
18 Boosting energy efficiency through Smart Grids
transmission power system reliably and efficiently; in distribution operations, similar Distribution Management Systems (DMSs) are used for analysing and operating the distribution system.
Grid management mainly involves the collection and analysis of large amounts of information from heterogeneous sources in real time: demand/response schemes, distributed energy resources (loads and generators), energy storage systems, plug-in electrical vehicles, automatic/advanced metering infrastructures (AMIs).
Such information must be filtered, aggregated and fitted into suitable models for a successive analysis that aims at detecting abnormal, critical and dangerous situations, as well as deviation from regular operations, which the grid is required to deal with. The outcomes of this process are also made available to the energy management system and to aggregators at a higher layer of abstraction [10], [11]. Specific actions include emergency coordination, load shedding schemes, and service restoration.
3.2.6 Market
Deregulation and energy market liberalization, distributed generation, integration of renewables are key factors of the radical change undertaken in the energy system. They will bring new system operators (bulk power producers, micro-producers, and transmission and distribution operators) that will give rise to a new market structure, mainly based on energy trading and supply of ancillary services. The boundaries of the Markets domain include the edge of the Operations domain where control happens, the domains supplying assets (e.g., Generation, Transmission, etc.), the Customer domain and Service Providers.
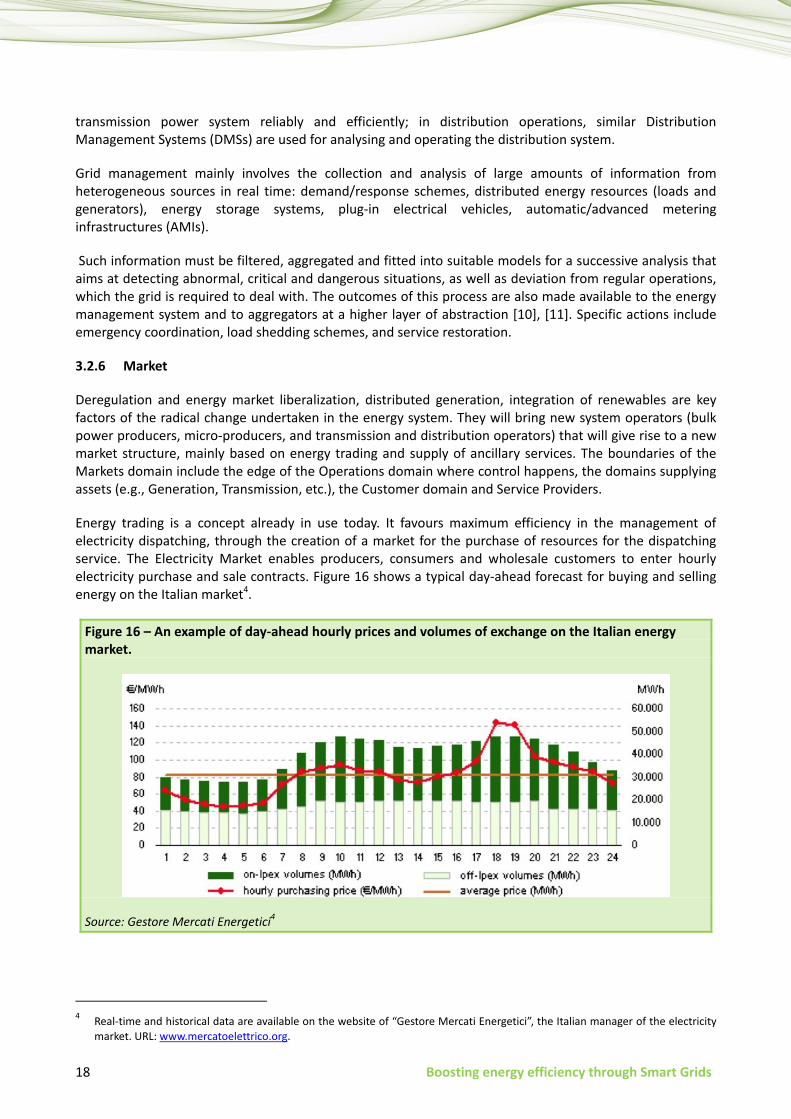
Energy trading is a concept already in use today. It favours maximum efficiency in the management of electricity dispatching, through the creation of a market for the purchase of resources for the dispatching service. The Electricity Market enables producers, consumers and wholesale customers to enter hourly electricity purchase and sale contracts. Figure 16 shows a typical day-ahead forecast for buying and selling energy on the Italian market4.
Figure 16 – An example of day-ahead hourly prices and volumes of exchange on the Italian energy market.
Source: Gestore Mercati Energetici4
4 Real-time and historical data are available on the website of “Gestore Mercati Energetici”, the Italian manager of the electricity
market. URL: www.mercatoelettrico.org.
Boosting energy efficiency through Smart Grids 19
3.2.7 Service provider
Service Providers are organizations that perform services to support the business processes of power system producers, distributors, and customers. These business processes range from traditional utility services, such as billing and customer account management, to enhanced customer services, such as management of energy use and home energy generation.
The Service Provider domain shares interfaces with the Markets, Operations, and Customer domains. Communications with the Operations domain are critical for system control and situational awareness; communications with the Markets and Customer domains are critical for enabling economic growth through the development of “smart” services. For example, the Service Provider domain may provide the interface enabling the customer to interact with the market(s).
3.3 Policies
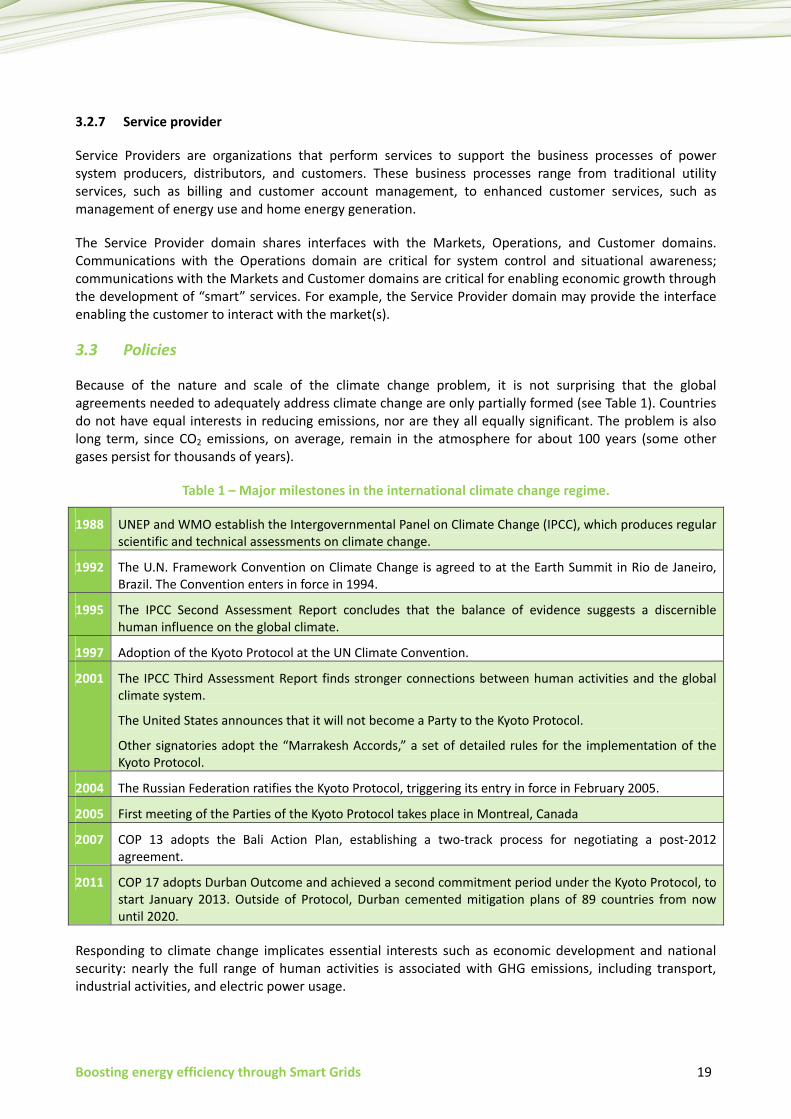
Because of the nature and scale of the climate change problem, it is not surprising that the global agreements needed to adequately address climate change are only partially formed (see Table 1). Countries do not have equal interests in reducing emissions, nor are they all equally significant. The problem is also long term, since CO2 emissions, on average, remain in the atmosphere for about 100 years (some other gases persist for thousands of years).
Table 1 – Major milestones in the international climate change regime.
1988 UNEP and WMO establish the Intergovernmental Panel on Climate Change (IPCC), which produces regular scientific and technical assessments on climate change.
1992 The U.N. Framework Convention on Climate Change is agreed to at the Earth Summit in Rio de Janeiro, Brazil. The Convention enters in force in 1994.
1995 The IPCC Second Assessment Report concludes that the balance of evidence suggests a discernible human influence on the global climate.
1997 Adoption of the Kyoto Protocol at the UN Climate Convention.
2001 The IPCC Third Assessment Report finds stronger connections between human activities and the global climate system.
The United States announces that it will not become a Party to the Kyoto Protocol.
Other signatories adopt the “Marrakesh Accords,” a set of detailed rules for the implementation of the Kyoto Protocol.
2004 The Russian Federation ratifies the Kyoto Protocol, triggering its entry in force in February 2005.
2005 First meeting of the Parties of the Kyoto Protocol takes place in Montreal, Canada
2007 COP 13 adopts the Bali Action Plan, establishing a two-track process for negotiating a post-2012 agreement.
2011 COP 17 adopts Durban Outcome and achieved a second commitment period under the Kyoto Protocol, to start January 2013. Outside of Protocol, Durban cemented mitigation plans of 89 countries from now until 2020.
Responding to climate change implicates essential interests such as economic development and national security: nearly the full range of human activities is associated with GHG emissions, including transport, industrial activities, and electric power usage.
20 Boosting energy efficiency through Smart Grids
In this perspective, most industrialized countries are mainly underpinning their GHG reduction on the pillars of energy independence from fossil fuels.
For example, the Major Economies Forum on Energy and Climate (MEF) [12] was launched in March 2009 to facilitate a dialogue among major developed and developing economies and to promote a global partner-ship for low-carbon and climate-friendly technologies. A Technology Action Plan5 with recommendations for the implementation of Smart Grids was presented at the United Nations Framework Convention on Climate Change Conference held in Copenhagen in December 2009.
The Clean Energy Ministerial (CEM) [13] initiative started in 2010 and unites 23 participating governments in efforts to increase energy efficiency, expand clean energy supplies, and enhance clean energy access. Energy ministerial meetings help advance international collaboration to accelerate the adoption of clean energy technologies. Moreover, eleven clean energy initiatives were launched to expand the deployment of clean energy technologies and policies that will help reduce emissions, drive economic growth, and improve energy access. Among them, the International Smart Grid Action Network (ISGAN) promotes global partnership on Smart Grids. ISGAN activities focus, first and foremost, on those aspects of the smart grid where governments have regulatory authority, expertise, convening power, or other leverage. To this end, ISGAN Participants work together in five principal areas: i) policy, standards and regulation; ii) finance and business models; iii) technology and systems development; iv) user and consumer engagement; v) workforce skills and knowledge.
Europe is jointly planning its energy policy in an integrated approach to combat climate changes, to pursue security and independence of carbon resources, and to strengthen its competitiveness, see [7] and [14]. Since 2006, the European Commission has been developing a European Strategic Energy Technology Plan (SET-Plan) [15], together with industries and the research community. It consists of a “roadmap” towards low-carbon technologies to be achieved through different steps in 2020, 2030 and 2050 [16]. Currently, it identifies eight main areas with strong potential: wind, solar, electricity grids, bioenergy, carbon capture and storage, sustainable nuclear, fuel cell and hydrogen, and smart cities [17].
Key issues of this strategy are energy efficiency, renewable sources and new energy technologies. The first initiative in 2007 was the definition of the “20-20-20” targets to be met by 2020: at least 20% reduction of GHG emission below the 1990s levels, 20% of energy from renewables, 20% reduction of primary energy needs compared with the projected levels. This strategy complies with the three pillars of the European energy policy: security of supply, sustainability and market efficiency.
The European Commission undertook several initiatives towards this purpose. In 2008, it proposed the climate and energy package [18], a binding legislation to share the effort among associated countries according to their economic possibilities. In 2009, new architectures and infrastructures for energy grid management and communication were required by the directive about renewable energy [19]. Concurrently, the EC published the Third Energy Package, a further step in the process of liberalization of the electricity and gas markets. Within this package, the Electricity and the Gas Directives [20] and [21] demand the member states to deploy smart meters in their networks, with the aim of covering at least 80% of households by 2020. Afterward, the importance of distributed energy generation and smart metering was highlighted again in the directive of energy performance of buildings [22].
In the USA, Obama’s administration outlined a vision to double the use of clean energy by 2035 and to put one million electric vehicles on the road by 2015, in order to secure future energy of America [23]. The Energy Independence and Security Act of 2007 (EISA) required policies and initiatives to modernize the national transmission and distribution systems.
5 Prepared by Italy and South Korea in consultation with MEF Partners
[www.majoreconomiesforum.org/images/stories/documents/MEF%20Smart%20Grids%20TAP%2011Dec2009.pdf].
Boosting energy efficiency through Smart Grids 21
The most important Asian countries are undertaking different initiatives to reduce GHG emissions and to make their energy systems more efficient. In Japan, the main objectives are to promote the use of renewable sources, to build an infrastructure for electrical vehicles and to create new services in smart grids. In China, the stimulus plan of 2008 has been making large investments in improving the capacity and reliability of electricity networks; integration of renewables and energy efficiency are expected as secondary effects. The budget allocated by China’s government for smart grids is surpassing that of the United States. In South Korea, the focus is on monitoring energy use and increasing production from green sources.
4 Communication architectures for Smart Grids
The design of communication architectures for smart grids starts by breaking the whole complex system into simpler and isolated entities, and by describing their internal system and interfaces, in order to have a clear understanding of the main actors in the system, their objectives and the relationships among them. Such a description may take different forms, depending on the main perspective it is addressed to: abstract high-level conceptual models, processes and data flows, communication, information management and security, and services [24].
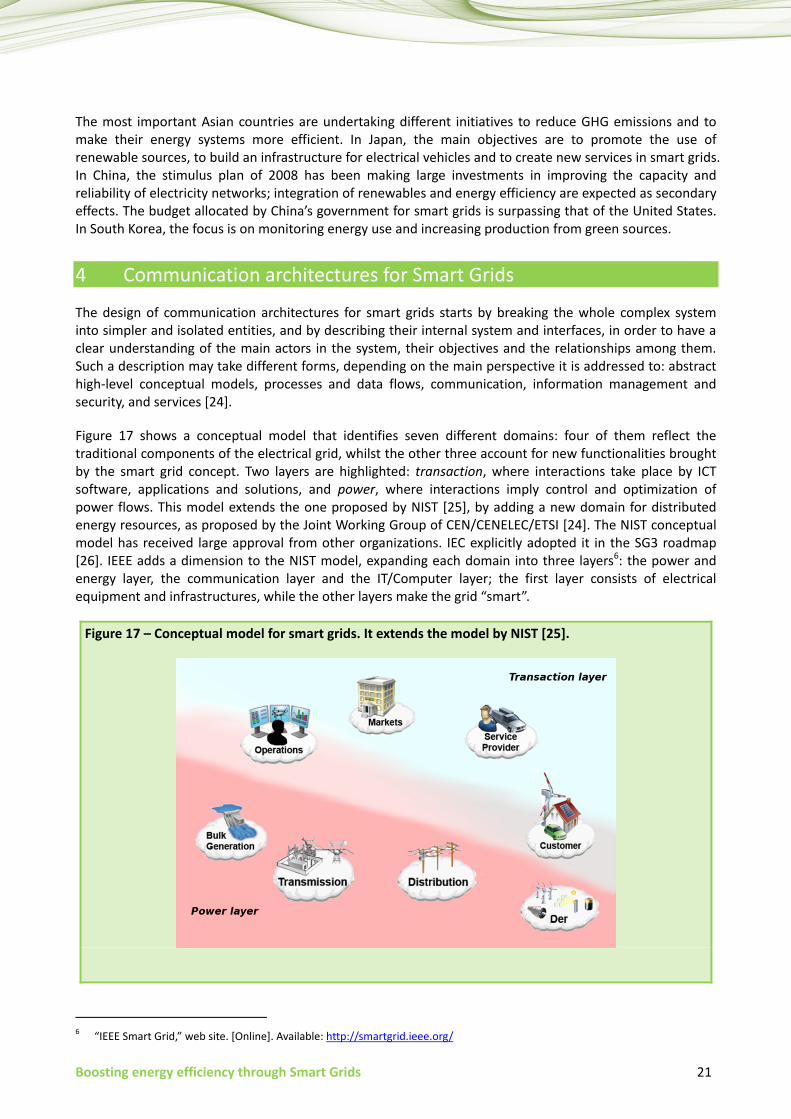
Figure 17 shows a conceptual model that identifies seven different domains: four of them reflect the traditional components of the electrical grid, whilst the other three account for new functionalities brought by the smart grid concept. Two layers are highlighted: transaction, where interactions take place by ICT software, applications and solutions, and power, where interactions imply control and optimization of power flows. This model extends the one proposed by NIST [25], by adding a new domain for distributed energy resources, as proposed by the Joint Working Group of CEN/CENELEC/ETSI [24]. The NIST conceptual model has received large approval from other organizations. IEC explicitly adopted it in the SG3 roadmap [26]. IEEE adds a dimension to the NIST model, expanding each domain into three layers6: the power and energy layer, the communication layer and the IT/Computer layer; the first layer consists of electrical equipment and infrastructures, while the other layers make the grid “smart”.
Figure 17 – Conceptual model for smart grids. It extends the model by NIST [25].
6 “IEEE Smart Grid,” web site. [Online]. Available: http://smartgrid.ieee.org/
22 Boosting energy efficiency through Smart Grids
From an infrastructure perspective, the most critical domains will be those where more devices are present, namely, Distribution, Customer and DER. Here, quite a few pieces of communication equipment are expected to interconnect millions of devices in substations, houses and local generation sites; this will produce a huge amount of critical information for grid operation to be collected, exchanged and managed in a trustworthy way, requiring bidirectional flows among different layers. Network-centric architectures (e.g., Service-Oriented Architectures (SOA) [27]) and resource aggregation and virtualization (e.g., virtual power plants [28], cell-based virtual utilities [29] and micro-grids [30]) are among the possible solutions proposed to achieve flexibility and scalability in the grid control and monitoring infrastructure. Communication will likely be built upon standard communication technologies based on wired and wireless local area networks in local domains (home, factory, plant, and substation) and wide area networks to provide global connectivity.
4.1 Legacy communication infrastructures in electrical grids
The operation of an electrical grid is a complex task driven by different needs: balancing the production and consumption of energy, maintaining the stability of frequency and voltage, protecting the electrical equipment against overcurrent and short circuits, assuring system reliability, restoring from disturbances (shunt faults, equipment failure with subsequent isolation, switching surges and lightning strikes, mechanical damages), and so on. Current electrical grids show quite a hierarchical structure. The energy is mainly flowing from the (few) generation sites, through the electrical transport and distribution infrastructure, to the users. Legacy communication architectures for electricity grids are thus hierarchical architectures that reflect the classical structure of the power grid: measurements and data flow up from bottom (equipment and metering infrastructures) to higher levels (management centres), while control information is transmitted in the opposite direction. However, communication infrastructures have mainly been deployed in the higher segment of electrical networks, typically involving generation plants, HV transport and HV/MV substations. Such segments have often been served through the use of ad hoc networks (mainly radio relays).
However, future grids are expected to integrate a virtually unlimited number of sensors and meters in the distribution segments, DER sites and homes to support demand/ response, distributed generation and energy-aware applications; this will produce a huge amount of critical information for grid operation to be collected, exchanged and managed in a trustworthy way, requiring bidirectional flows among different layers. The first initiatives in such directions are the deployment of automated meter reading systems at the customers’ sites, under the boost of lowering management costs and the push from government institutions. In Europe, ENEL, Europe's second listed utility by installed capacity, pioneered the deployment of such devices with its Telegestore system7, which was almost completed in 2011. The meter provides a bidirectional communication channel over power-line technologies with a data concentrator located at the boundary between the LV and MV networks; public wireless networks (GSM/GPRS, satellite) are used to convey data towards the central system.
4.2 ICT challenges and issues for Smart Grids
The large heterogeneity in services and applications building the smart grid gives rise to different network requirements in terms of quality of service (priority, delay, and bandwidth), reliability and resilience, performance and trustworthiness. The successful implementation of smart grids requires stopping the current piecemeal creation of the grid’s communication infrastructure and starting the design of a holistic architecture, which could account for different requirements:
• Information should be easily available to any legitimate participant at any location;
7 The Telegestore Automatic Meter Management System AMM, ready for SMART GRIDS. URL:
www.aneel.gov.br/Arquivos/PDF/ENEL-Fabio_Borghese.pdf.
Boosting energy efficiency through Smart Grids 23
• Delivery should account for different levels of quality of service, according to the specific application; most important parameters are bandwidth, delay, reliability;
• Information is protected against illegitimate use, and participants can trust each other and the data exchanged. Commands/activations are vital to guarantee safety, interworking and service stability. They will have to be particularly protected.
The large number of matters and issues in the smart grid ecosystem poses several challenges for the ICT world. This has already been largely investigated with reference to the overall functions of the system. A brief summary is provided below of the considerations about those aspects mainly focusing on the Distribution, DER and Customer domains, which exhibit most scalability constraints.
As already mentioned, the main challenge with distributed generation is power accuracy and quality, which means voltage and frequency stability. The introduction of widespread metering poses severe challenges about data collection, processing and management, as the amount of data available for grid control and management is continuously increasing. This will be a major issue for the MV/LV part of the grid, as the number of customers and devices in the distribution systems is several orders of magnitude greater than that of primary substations, power plants and control centres.
The expected size of the system will force an organization into smaller clusters, local domains and micro-grids. The large bulk of data that may be available inside local systems (substations, power plants, control centres, homes) can be effectively managed by high-speed LANs, which tie all the measurements and local applications together. More problems arise when such large amounts of data and information need to be collected, exchanged, processed and shared over wide geographical areas. The deployment of high-speed fibre may not be enough economically viable; furthermore, this is not likely to happen systematically in the Distribution, DER and Customer domains, especially for remote sites. Here, ADSL, SHDSL and wideband wireless technologies should be taken into account as alternative paths with respect to the current power line communication technology, which could not be suitable for delay- and bandwidth-sensitive applications. Moreover, data aggregation and fusion [31] will be necessary to manage such bulk of information, based on hierarchical (logical) architectures [32]. However, data aggregation may be a critical issue due to the presence of low-power and low-capability devices in the grid; in addition, most peripheral aggregation devices are expected to have limited capabilities too [33].
Even with large communication channels, the huge amount of aggregate information could be critical because of the limited switching capacity of network routers. Thus, networking architectures too should be ready to deal with large amounts of data: star configurations should be replaced with meshed network configurations, and routing should avoid creating bottlenecks and increasing latency for time-critical applications. Such architectures should assure delivery in a timely manner with adequate bandwidth and reliability, properties generally known as quality of service (QoS) requirements.
Distributed applications will allow local processing of information, thus further limiting the need to exchange delay-sensitive data over a wide communication infrastructure. Indeed, the computational capability in each substation is now such that some of these data can be pre-processed a lot more quickly than what is done today. The same could be done in the distribution segment, but that would further increase the ICT infrastructure required.
The large mass of heterogeneous electrical equipment, the huge amount of information available and the de-localization of computing capability would also require suitable data abstraction and new communication paradigms. The IEC-CIM standard (Common Information Model) could be used as a general-purpose description tool for both node-breaker and bus-branch representations (two kinds of connectivity models that are widely used for the representation of power network data) [34]. It allows a common, flexible and extensible modelling abstraction for data, device and grid representation. Multicast delivery and publish-subscribe mechanisms will be necessary to allow effective and scalable access to information
24 Boosting energy efficiency through Smart Grids
for the whole system. Multicast is the ability to send a single packet to multiple destinations while minimizing its duplications. Publication and subscription of data moves them from the sources to the destinations as soon as they are available, thus removing the need for inefficient polling/pull technologies [35] and [36]. Further paradigms may be useful in such context, as Content-Centric Networking, which allows accessing data based on their description rather than their location.
The strategic role of power systems makes security a key issue in the design of ICT infrastructures, as there are several vulnerable elements: devices, protocols and networks [37]. Current SCADA (Supervisory Control And Data Acquisition) systems only implement raw security policies, mainly addressed to allow authorized operators to view and control all equipment, while excluding all others from access. Furthermore, it is known that such systems often have security gaps that might be exploited to cause disruption of the electricity service or even cause damage to grid equipment. Modern smart grids should have fine-grained security policies that account for data confidentiality and integrity, identification and authentication of data, customers and devices, flexible protection level for specific flows and subscriptions [35], key management [38], [39], prevention of traffic analysis [40], intrusion detection systems [41], protection against data injection attacks [42] and privacy [43], [44]. Most issues concerning security arise from limited computing capabilities of small devices [45] and energy efficiency of the multitude of low-power measurement sensors [46], [47], [48].
4.3 Layout of the communication system
The evolution towards a modern communication system for smart grid operation is currently following two separate paths. On one hand, the enhancement of the current infrastructures for data transfer requires more bandwidth, high-performance and resilient links, reliable routing mechanisms, control centres and security. On the other hand, high-level information management is boosting the interest for distributed data abstraction, storage, access and control, usually by the deployment of middleware behind the underlying networking issues.
Designing communication facilities in smart grids involves dealing with several aspects:
• software infrastructures to build distributed services and applications;
• syntax and semantics of information exchange;
• transport of information and networking;
• communication media and technologies.
Thorough investigations of available technologies and standards have already been carried out by ITU-T as well as several working groups [24], [49] and [26], these works provide a large census together with some discussions about possible involvement in smart grids, interoperability and missing features. The most suitable standards must be chosen with proper evaluation criteria; guidelines for this process have already been supplied [25].
The International Telecommunication Union (ITU), the UN specialized agency responsible for ICTs, established an ITU-T Focus Group on Smart Grid (FG Smart) in February 2010 which successfully concluded in December 2011 with the development of five deliverables:
• Use Cases for Smart Grid;
• Requirements of communication for Smart Grid;
• Smart Grid Architecture;
• Smart Grid Overview;
• Terminology.
Boosting energy efficiency through Smart Grids 25
The ITU’s Telecommunication Standardization Advisory Group (TSAG) at its meeting of January 2012 established the Joint Coordination Activity on Smart Grid and Home Networking (JCA-SG&HN).
This JCA on Smart Grid and Home Networking (www.itu.int/en/ITU-T/jca/SGHN/Pages/default.aspx) will be responsible for the stimulation and coordination of all network aspects of Smart Grid and related communication (e.g., Smart Meters, Home Energy Management, and data concentrators) standardization activities across the ITU (e.g., relevant ITU-T Study Groups, ITU-R and ITU-D) and relevant bodies (e.g., SDOs, forums, regional/national organizations, and academia) in this standardization area. This JCA will also be responsible for the stimulation and coordination of Home Networking standardization activities across the ITU and relevant bodies.
4.3.1 Distributed services and applications
Modern computer science paradigms enable to build applications by exploiting functions across the network. The Remote Procedure Call (RPC) was initially used to allow applications call remote functions through standard APIs (Application Programming Interfaces), concealing all networking issues. Afterwards, the interest in developing inter-platform and language-agnostic software frameworks has led to the concept of Service-Oriented Architecture (SOA), where applications and new services are built by composing basic services deployed anywhere in the network. SOAs provide a more dynamic, flexible, scalable and effective way to create distributed applications with respect to RPCs. SOAs require describing services with suitable languages (e.g., WSDL), formatting data in a structured way (e.g., XML) and transferring them with some protocol (e.g., SOAP).
Frameworks which implement service-oriented architectures include REST, Web Services, CORBA and DCOM. Smart grids will be populated by a large number of different actors, thus yielding heterogeneous platforms and technologies. SOAs will likely play a strategic role to deploy uniform, extensible and interoperable services; model-driven architectures may be useful as well in smart grid systems. The topic has numerous points in common with Remote Instrumentation Services (RIS), an environment where suitable abstractions have been developed to make scientific instrumentation become part of the SOA (see, e.g., [50] and [51]).
4.3.2 Data models and information exchange
Data abstraction is needed to represent measures, events and controls of the electrical systems. Data and services are often represented in the System Configuration Language (SCL), specified by IEC 61850, which enables devices in substations to exchange configuration files and to have complete interoperability. SCL allows the description of device capabilities, system specification, substation configuration, device configuration and system exchange. A complementary data model is the Common Information Model (CIM), adopted by IEC 61970 and IEC 61968, completely developed based on UML. SCL is mostly used within substations, whilst CIM is largely used in information exchanges among systems (for example, energy management system, planning, energy markets and metering). The IEC 61850 abstract data models can be mapped to a number of protocols: MMS (Manufacturing Message Specification, ISO/IEC 9506), GOOSE (Generic Object Oriented Substation Event, IEC 61850), GSSE (Generic Substation State Event, IEC 61850) and (soon) Web Services; MMS includes a complete networking protocol stack, while GSSE/GOOSE messages are directly exchanged in Ethernet frames with publish/subscribe paradigms and priority mechanisms, supporting applications which require less than 4 ms latency.
Many standards are already available for exchanging information in smart grids: standards for reliable data acquisition and control over TCP/IP networks between SCADA masters and substations (IEC 60870-5), Distribution Management System (IEC 61968), substation automation (IEC 60870, IEC 61850), distributed energy resources (IEC 61850-7-420), head-end (IEC 61968-9) and cross-domain interaction (IEC 61970, IEC 61968, IEC 61850, ETSI TS 102690). However, other sectors currently lack any standard framework: for example, home automation and electric mobility.
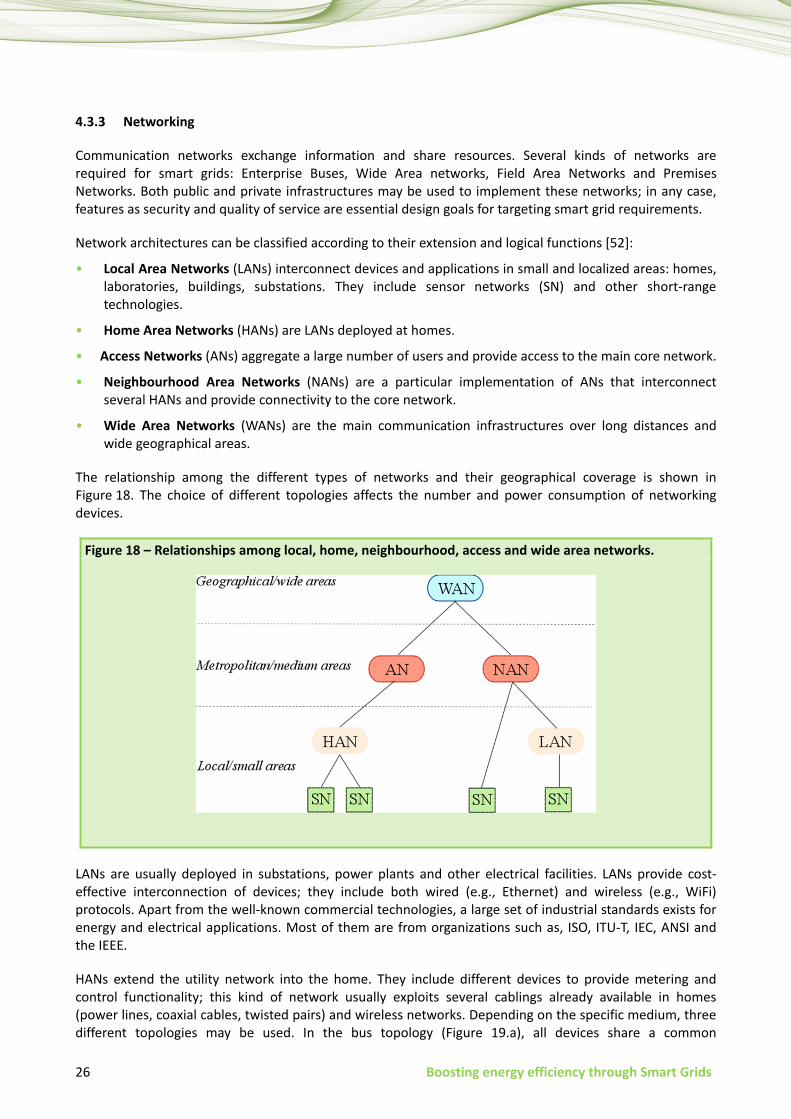
26 Boosting energy efficiency through Smart Grids
4.3.3 Networking
Communication networks exchange information and share resources. Several kinds of networks are required for smart grids: Enterprise Buses, Wide Area networks, Field Area Networks and Premises Networks. Both public and private infrastructures may be used to implement these networks; in any case, features as security and quality of service are essential design goals for targeting smart grid requirements.
Network architectures can be classified according to their extension and logical functions [52]:
• Local Area Networks (LANs) interconnect devices and applications in small and localized areas: homes, laboratories, buildings, substations. They include sensor networks (SN) and other short-range technologies.
• Home Area Networks (HANs) are LANs deployed at homes.
• Access Networks (ANs) aggregate a large number of users and provide access to the main core network.
• Neighbourhood Area Networks (NANs) are a particular implementation of ANs that interconnect several HANs and provide connectivity to the core network.
• Wide Area Networks (WANs) are the main communication infrastructures over long distances and wide geographical areas.
The relationship among the different types of networks and their geographical coverage is shown in Figure 18. The choice of different topologies affects the number and power consumption of networking devices.
Figure 18 – Relationships among local, home, neighbourhood, access and wide area networks.
LANs are usually deployed in substations, power plants and other electrical facilities. LANs provide cost-effective interconnection of devices; they include both wired (e.g., Ethernet) and wireless (e.g., WiFi) protocols. Apart from the well-known commercial technologies, a large set of industrial standards exists for energy and electrical applications. Most of them are from organizations such as, ISO, ITU-T, IEC, ANSI and the IEEE.
HANs extend the utility network into the home. They include different devices to provide metering and control functionality; this kind of network usually exploits several cablings already available in homes (power lines, coaxial cables, twisted pairs) and wireless networks. Depending on the specific medium, three different topologies may be used. In the bus topology (Figure 19.a), all devices share a common
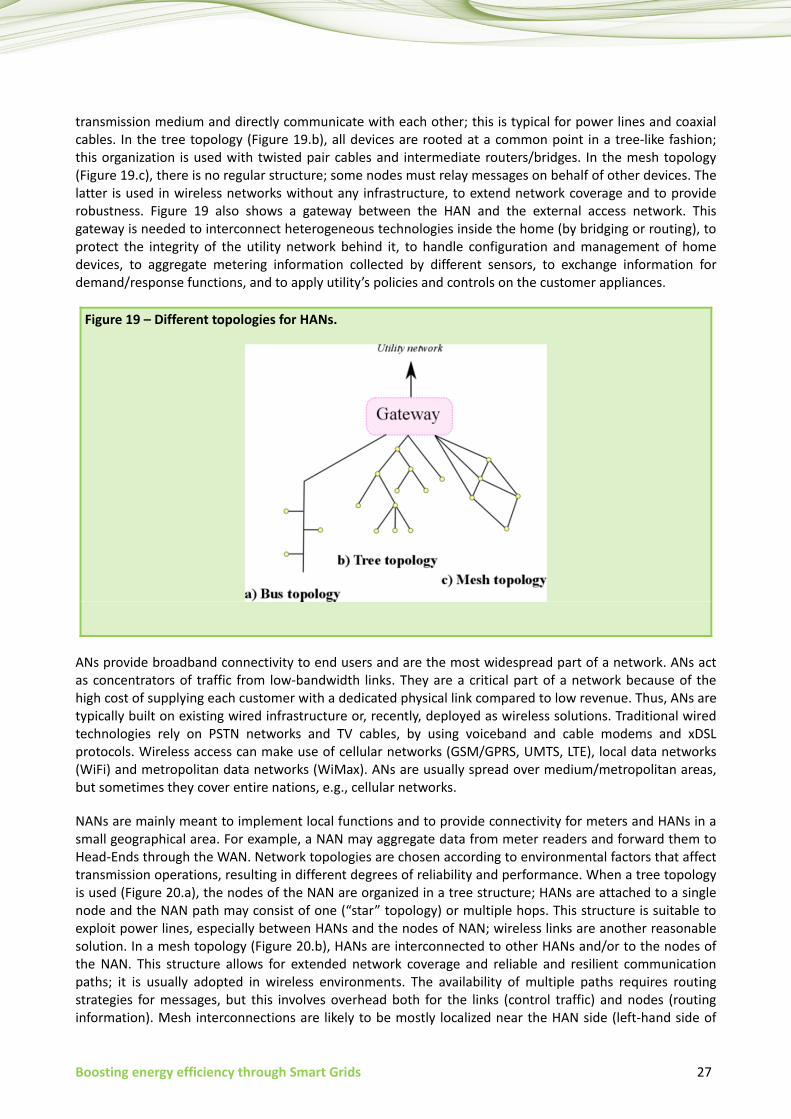
Boosting energy efficiency through Smart Grids 27
transmission medium and directly communicate with each other; this is typical for power lines and coaxial cables. In the tree topology (Figure 19.b), all devices are rooted at a common point in a tree-like fashion; this organization is used with twisted pair cables and intermediate routers/bridges. In the mesh topology (Figure 19.c), there is no regular structure; some nodes must relay messages on behalf of other devices. The latter is used in wireless networks without any infrastructure, to extend network coverage and to provide robustness. Figure 19 also shows a gateway between the HAN and the external access network. This gateway is needed to interconnect heterogeneous technologies inside the home (by bridging or routing), to protect the integrity of the utility network behind it, to handle configuration and management of home devices, to aggregate metering information collected by different sensors, to exchange information for demand/response functions, and to apply utility’s policies and controls on the customer appliances.
Figure 19 – Different topologies for HANs.
ANs provide broadband connectivity to end users and are the most widespread part of a network. ANs act as concentrators of traffic from low-bandwidth links. They are a critical part of a network because of the high cost of supplying each customer with a dedicated physical link compared to low revenue. Thus, ANs are typically built on existing wired infrastructure or, recently, deployed as wireless solutions. Traditional wired technologies rely on PSTN networks and TV cables, by using voiceband and cable modems and xDSL protocols. Wireless access can make use of cellular networks (GSM/GPRS, UMTS, LTE), local data networks (WiFi) and metropolitan data networks (WiMax). ANs are usually spread over medium/metropolitan areas, but sometimes they cover entire nations, e.g., cellular networks.
NANs are mainly meant to implement local functions and to provide connectivity for meters and HANs in a small geographical area. For example, a NAN may aggregate data from meter readers and forward them to Head-Ends through the WAN. Network topologies are chosen according to environmental factors that affect transmission operations, resulting in different degrees of reliability and performance. When a tree topology is used (Figure 20.a), the nodes of the NAN are organized in a tree structure; HANs are attached to a single node and the NAN path may consist of one (“star” topology) or multiple hops. This structure is suitable to exploit power lines, especially between HANs and the nodes of NAN; wireless links are another reasonable solution. In a mesh topology (Figure 20.b), HANs are interconnected to other HANs and/or to the nodes of the NAN. This structure allows for extended network coverage and reliable and resilient communication paths; it is usually adopted in wireless environments. The availability of multiple paths requires routing strategies for messages, but this involves overhead both for the links (control traffic) and nodes (routing information). Mesh interconnections are likely to be mostly localized near the HAN side (left-hand side of
28 Boosting energy efficiency through Smart Grids
Figure 20.b), while the internal paths may be organized in a hierarchical fashion (right-hand side of Figure 20.b).
Figure 20 – Different topologies for NANs.
WANs are in charge of the interconnection of remote systems over long distances. WANs represent the “core” infrastructure, which provides rough transport services to a large bulk of data at big aggregation points, i.e., access networks, large networks and NANs.
4.3.4 Communication media and technologies
Smart grids include such a number of scenarios and application fields that a large set of heterogeneous transmission technologies will get involved. Wireless links and power-line communications represent a sound and economical alternative where no wired communication infrastructure is available. Power plants and electrical substations are often located in rural or suburban areas, whereas monitoring of many household devices might require too much network equipment and a large widespread wiring, if accomplished by wire-line technologies only. It is worth noting here that the push forward triggered by smart grid deployment to ubiquitous monitoring may well include, e.g., even small countries or mountainous locations that, though constituting small consumers, may have the potential of becoming generators of alternative energies (solar, wind or hydro). In this respect, smart grids may be a strong factor to improve global broadband coverage and foster a solution to help bridging the digital divide.
The selection of suitable standards will take into account several considerations: electromagnetic compatibility, communication paradigms, addressing schemes, quality of service, security, reliability, resilience, network extension, existing infrastructures, investments, and so on. Examples of technologies falling in the interest of smart grids are ITU-T G.hnem-series (G.9955 [53], G.9956 [54]) Recommendations (Narrowband PLC), ITU-T G.hn-series (G.9960-9964 [55], [56], [57], [58], 9972 [59]) Recommendations (Broadband Home Networking), ITU-T G.992.x-series/ITU-T G.993.x-series (xDSL), IEEE 802.3/Ethernet (also in the energy-efficient version 802.3az [60]), IEEE 802.11 (WiFi), IEEE 802.16 (WiMax), IEEE 802.15.4 and ZigBee (sensor networks), IEEE 1901, GSM/GPRS, UMTS, LTE and most of IEC standards for electricity grids.
4.4 Current networking infrastructures and the Smart Grid
One may wonder about the possibility of using current communication infrastructures for smart grid communication. This would be a cost-effective and ready-to-use solution to allow a quick and smooth transition from the communication systems already deployed in electrical grids.
Currently, the management and control of energy grids rely on independent networks for different functions; the TCP/IP protocol family is usually adopted for enterprise data, business networks, and SCADA
Boosting energy efficiency through Smart Grids 29
systems. The TCP/IP stack can play a major role in communication networks for smart grids, due to its widespread adoption worldwide and to its standard, well-tested and simple communication interface. It is the main component of the current Internet infrastructure.
The Internet is a multi-protocol multi-technology general purpose wide area network with worldwide coverage and universal consensus; by now, its protocols and architecture are mature and well tested, and many applications and services are already available on top of it. However, it may not be suitable to meet any requirement for the large set of applications in smart grids. As a matter of fact, the core transport infrastructure and protocols of the Internet are almost the same as twenty years ago and just provide a basic delivery service, which does not meet all expectations of smart grid applications.
The availability of multiple transmission technologies within the Internet is conducive to an early and cost-effective deployment of smart grids, because the wide variety of requirements and constraints could not be accomplished through a single architecture. However, if too many options are available, interoperability issues or excessive complexity may arise; harmonization and convergence towards a reduced set of alternatives is therefore necessary to avoid redundant solutions and poor interoperability. To select suitable networking technologies and protocols among the many listed by standardization bodies and government agencies by now, it would be necessary to define homogeneous criteria. Until now, comparison has mainly been based on communication requirements and usually does not take into account energy efficiency and power consumption. Then, the choice of the various communication paths (wireless: 3G, LTE, WiMAX, etc.; wired: optical fibre, xDSL, etc.) should consider several aspects as path/system redundancies, self-healing functionalities, QoS, real-time constraints, protection against security threats (unauthorized access, eavesdropping, hijacking, alteration).
Several features and capabilities are needed for power grid communication in addition to the low-level data delivery capabilities of IP [36]. Current networking infrastructures should be taken as the basis to develop and integrate new protocols and technologies, by carefully considering modern paradigms as virtualization and overlay, which can be used to build new services and features on top of the physical infrastructure. New functionalities and capabilities are expected in next-generation networked devices to cope with quality of service, security and multicast delivery. Furthermore, middleware is likely to be widely developed to implement abstractions such as distributed objects, distributed tuples, and distributed procedures across a network. Again, it is not clear how this evolution will impact energy consumption.
Finally, ICT is requested to improve the resistance of the grid to perturbations, failures and natural disasters; this is a remarkable aspect, as such events also affect the power supply of the ICT infrastructure. A key element in this respect is the presence of storage devices (batteries) and backup generators to guarantee continuous operation of the minimal infrastructure required to recover from failure even in case of blackout. Investments in such devices have usually concerned large data and switching centres and exchanges, but they are critical in smaller remote installations (such as wireless cellular base stations), thus limiting the resilience of wireless infrastructures to a few hours or even less.
4.5 Using ICT energy storages for the power grid
We briefly examine the possible use of existing ICT storages for the provision of services to the power grid.
4.5.1 The problem
The deployment of electrical generation from non-programmable, renewable sources (photovoltaic, wind) is growing worldwide and in many countries is already representing a large percentage of the total energy fed into the network. This growth induces an equivalent decrease of the power generated by traditional power plants (gas, coal, nuclear …). The traditional plants are capable of providing the electrical network with reserve energy to enable adjustment of the network energy balance (spinning reserve). In times of
30 Boosting energy efficiency through Smart Grids
high production from renewable sources there is therefore a reduction in the ability of adjustment of the electrical system that may compromise its stability. This reserve of active power may in part be offset by energy storage devices installed on the grid.
It is worth considering that, to guarantee quality and continuity of their service even in case of black out, the ICT service providers own and operate huge energy storage systems (mainly batteries) and high amounts of diesel generators.
Some ICT service providers are already taking part in national implementations of ancillary services to the grid such as the “minute reserve market” in Germany and the “interruptibility service” in Italy.
The question that arises is the following: can the services to the network - for example, those of primary and secondary reserve –be extensively provided by existing accumulations such as, for example, those used in the telecommunications sites?
4.5.2 The primary control of frequency
The primary regulation is necessary to control the frequency of the network and is provided through a reserve of active power that can be fed into the grid (or taken from it) to automatically compensate for imbalances between generation and load involving a change in frequency compared to the nominal value (50 or 60 Hz). Primary regulation occurs within a few seconds and its effect terminates as soon as it gives way to secondary regulation to update the operating point of controllable generators that provide this service.
The primary frequency control service is typically mandatory for the traditional power plants. In Italy, for example, it is mandatory for all production units of 10 MW or more (excluding non-programmable renewable sources) and requires them to be capable to adjust their actual output power within a minimum range of 1.5%. The production unit must be capable of delivering at least half of the variation of power required within 15 seconds from the beginning of the frequency change and completely within 30 seconds; the new power generated must be stably maintained for at least 15 minutes (in the absence of further variations in the frequency).
Limiting ourselves to the case of production of energy from photovoltaic systems, it may be estimated that 1000 MW of PV generation can produce an effective power of the order of 600 MW, requiring the consequent reduction of power generated by rotating machines for the same amount. In this situation 9 MW of primary reserve may be lost, thus significantly compromising the adjustment capabilities of the network.
4.5.3 Secondary regulation
Secondary control is used to restore the value of the frequency and the reserve margins of primary control.
The generators that provide the secondary regulation service have to guarantee a reserve margin of at least ± 10 MW/ ± 6% of maximum power for the thermoelectric units, or ± 15% for hydroelectric units. The adjustment must be delivered within a maximum of 200 s and for a minimum duration of 2 hours. The secondary control service is paid through the dispatching service market.
4.5.4 Some considerations
1) By itself, the primary reserve is an active power that can be given to or taken from the network. A service of primary reserve can be achieved with a storage system connected to the network able to discharge, by delivering on to the network, or to recharge from the network. This service could be offered by existing storage systems, currently serving privileged loads, after properly verifying their
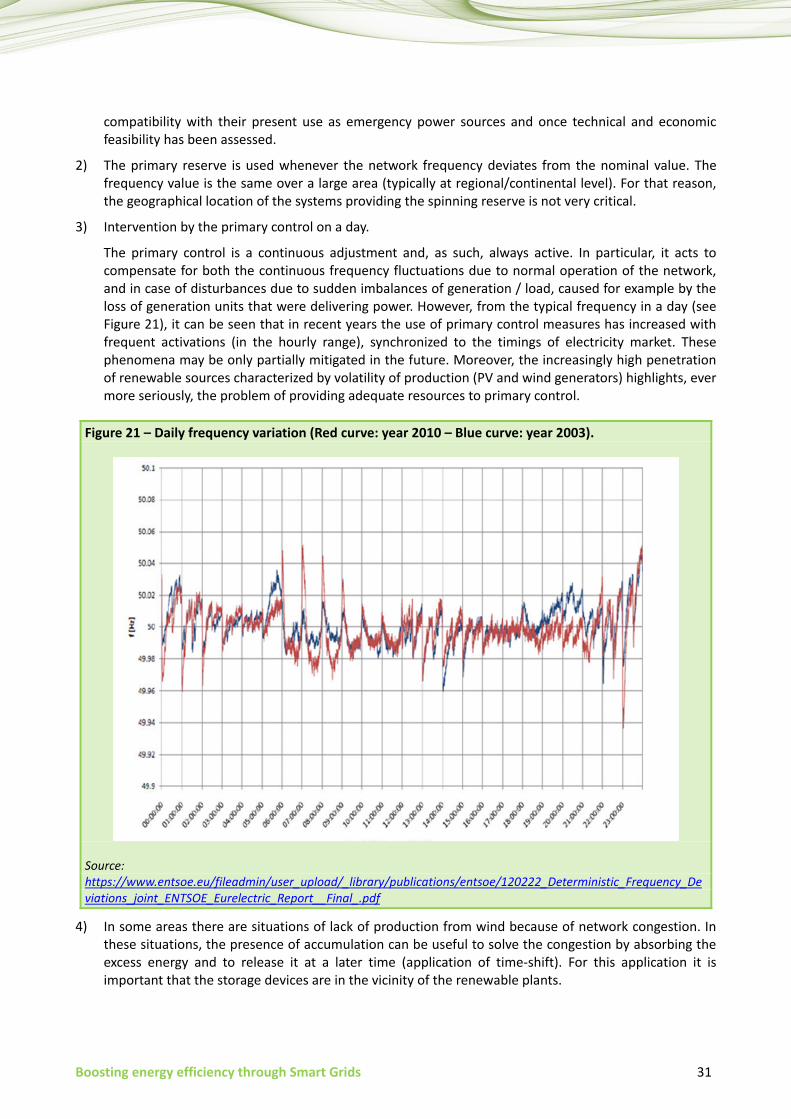
Boosting energy efficiency through Smart Grids 31
compatibility with their present use as emergency power sources and once technical and economic feasibility has been assessed.
2) The primary reserve is used whenever the network frequency deviates from the nominal value. The frequency value is the same over a large area (typically at regional/continental level). For that reason, the geographical location of the systems providing the spinning reserve is not very critical.
3) Intervention by the primary control on a day.
The primary control is a continuous adjustment and, as such, always active. In particular, it acts to compensate for both the continuous frequency fluctuations due to normal operation of the network, and in case of disturbances due to sudden imbalances of generation / load, caused for example by the loss of generation units that were delivering power. However, from the typical frequency in a day (see Figure 21), it can be seen that in recent years the use of primary control measures has increased with frequent activations (in the hourly range), synchronized to the timings of electricity market. These phenomena may be only partially mitigated in the future. Moreover, the increasingly high penetration of renewable sources characterized by volatility of production (PV and wind generators) highlights, ever more seriously, the problem of providing adequate resources to primary control.
Figure 21 – Daily frequency variation (Red curve: year 2010 – Blue curve: year 2003).
Source: https://www.entsoe.eu/fileadmin/user_upload/_library/publications/entsoe/120222_Deterministic_Frequency_Deviations_joint_ENTSOE_Eurelectric_Report__Final_.pdf
4) In some areas there are situations of lack of production from wind because of network congestion. In these situations, the presence of accumulation can be useful to solve the congestion by absorbing the excess energy and to release it at a later time (application of time-shift). For this application it is important that the storage devices are in the vicinity of the renewable plants.
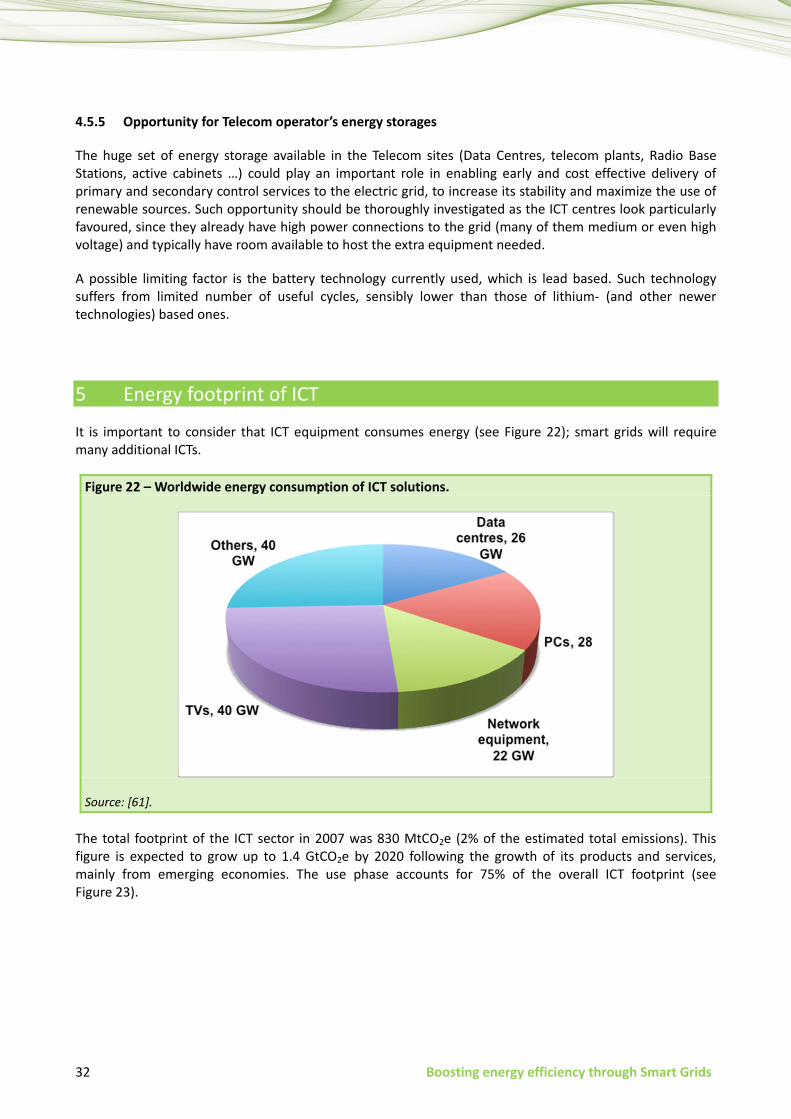
32 Boosting energy efficiency through Smart Grids
4.5.5 Opportunity for Telecom operator’s energy storages
The huge set of energy storage available in the Telecom sites (Data Centres, telecom plants, Radio Base Stations, active cabinets …) could play an important role in enabling early and cost effective delivery of primary and secondary control services to the electric grid, to increase its stability and maximize the use of renewable sources. Such opportunity should be thoroughly investigated as the ICT centres look particularly favoured, since they already have high power connections to the grid (many of them medium or even high voltage) and typically have room available to host the extra equipment needed.
A possible limiting factor is the battery technology currently used, which is lead based. Such technology suffers from limited number of useful cycles, sensibly lower than those of lithium- (and other newer technologies) based ones.
5 Energy footprint of ICT
It is important to consider that ICT equipment consumes energy (see Figure 22); smart grids will require many additional ICTs.
Figure 22 – Worldwide energy consumption of ICT solutions.
Source: [61].
The total footprint of the ICT sector in 2007 was 830 MtCO2e (2% of the estimated total emissions). This figure is expected to grow up to 1.4 GtCO2e by 2020 following the growth of its products and services, mainly from emerging economies. The use phase accounts for 75% of the overall ICT footprint (see Figure 23).
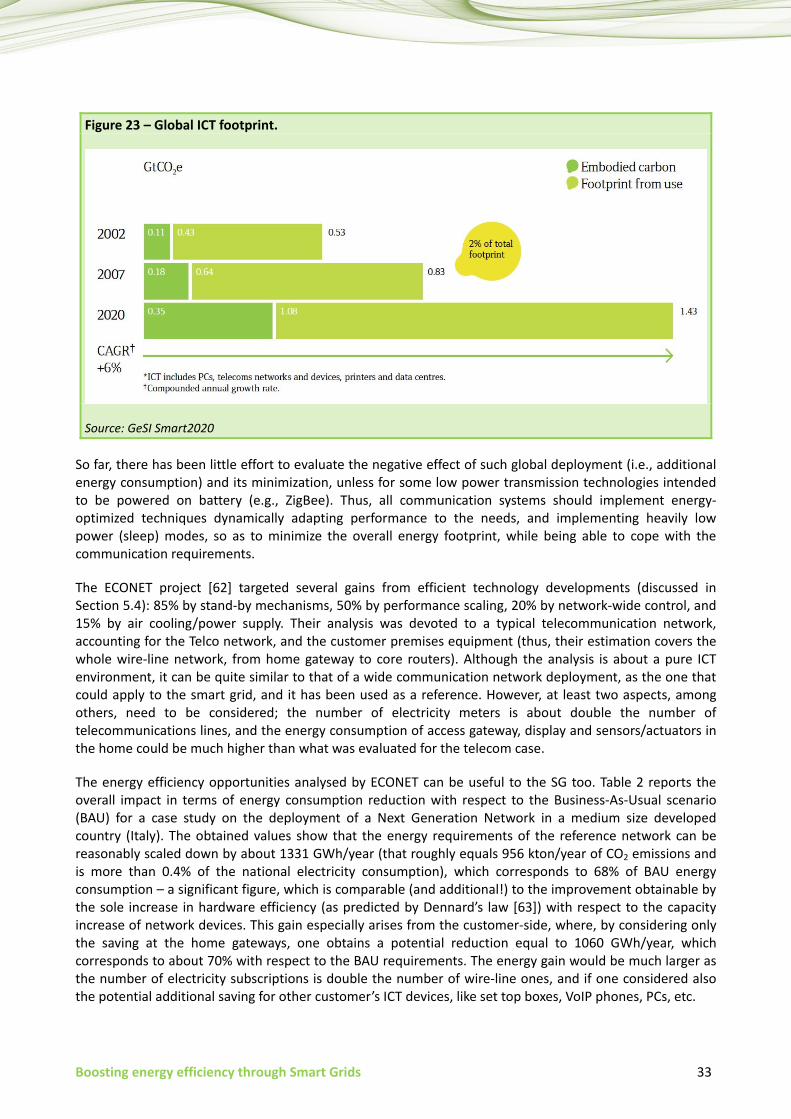
Boosting energy efficiency through Smart Grids 33
Figure 23 – Global ICT footprint.
Source: GeSI Smart2020
So far, there has been little effort to evaluate the negative effect of such global deployment (i.e., additional energy consumption) and its minimization, unless for some low power transmission technologies intended to be powered on battery (e.g., ZigBee). Thus, all communication systems should implement energy-optimized techniques dynamically adapting performance to the needs, and implementing heavily low power (sleep) modes, so as to minimize the overall energy footprint, while being able to cope with the communication requirements.
The ECONET project [62] targeted several gains from efficient technology developments (discussed in Section 5.4): 85% by stand-by mechanisms, 50% by performance scaling, 20% by network-wide control, and 15% by air cooling/power supply. Their analysis was devoted to a typical telecommunication network, accounting for the Telco network, and the customer premises equipment (thus, their estimation covers the whole wire-line network, from home gateway to core routers). Although the analysis is about a pure ICT environment, it can be quite similar to that of a wide communication network deployment, as the one that could apply to the smart grid, and it has been used as a reference. However, at least two aspects, among others, need to be considered; the number of electricity meters is about double the number of telecommunications lines, and the energy consumption of access gateway, display and sensors/actuators in the home could be much higher than what was evaluated for the telecom case.
The energy efficiency opportunities analysed by ECONET can be useful to the SG too. Table 2 reports the overall impact in terms of energy consumption reduction with respect to the Business-As-Usual scenario (BAU) for a case study on the deployment of a Next Generation Network in a medium size developed country (Italy). The obtained values show that the energy requirements of the reference network can be reasonably scaled down by about 1331 GWh/year (that roughly equals 956 kton/year of CO2 emissions and is more than 0.4% of the national electricity consumption), which corresponds to 68% of BAU energy consumption – a significant figure, which is comparable (and additional!) to the improvement obtainable by the sole increase in hardware efficiency (as predicted by Dennard’s law [63]) with respect to the capacity increase of network devices. This gain especially arises from the customer-side, where, by considering only the saving at the home gateways, one obtains a potential reduction equal to 1060 GWh/year, which corresponds to about 70% with respect to the BAU requirements. The energy gain would be much larger as the number of electricity subscriptions is double the number of wire-line ones, and if one considered also the potential additional saving for other customer’s ICT devices, like set top boxes, VoIP phones, PCs, etc.
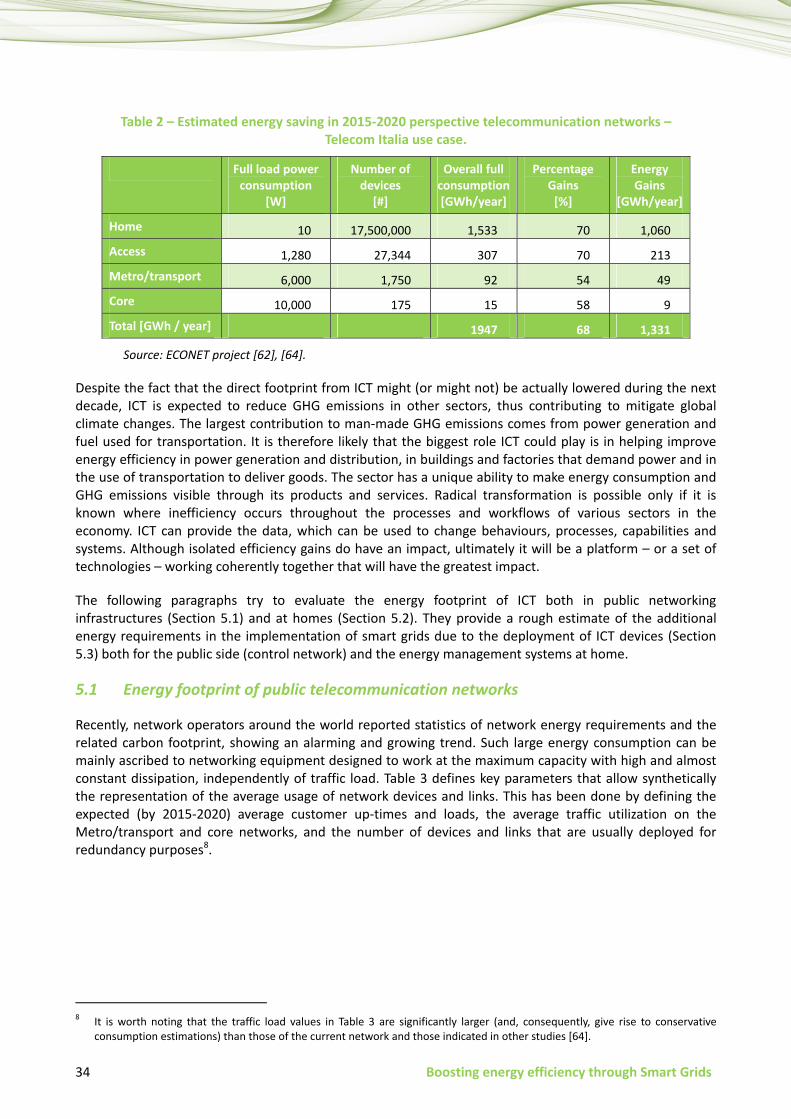
34 Boosting energy efficiency through Smart Grids
Table 2 – Estimated energy saving in 2015-2020 perspective telecommunication networks – Telecom Italia use case.
Full load power consumption
[W]
Number of devices
[#]
Overall full consumption[GWh/year]
Percentage Gains
[%]
Energy Gains
[GWh/year]
Home 10 17,500,000 1,533 70 1,060 Access 1,280 27,344 307 70 213 Metro/transport 6,000 1,750 92 54 49 Core 10,000 175 15 58 9 Total [GWh / year] 1947 68 1,331
Source: ECONET project [62], [64].
Despite the fact that the direct footprint from ICT might (or might not) be actually lowered during the next decade, ICT is expected to reduce GHG emissions in other sectors, thus contributing to mitigate global climate changes. The largest contribution to man-made GHG emissions comes from power generation and fuel used for transportation. It is therefore likely that the biggest role ICT could play is in helping improve energy efficiency in power generation and distribution, in buildings and factories that demand power and in the use of transportation to deliver goods. The sector has a unique ability to make energy consumption and GHG emissions visible through its products and services. Radical transformation is possible only if it is known where inefficiency occurs throughout the processes and workflows of various sectors in the economy. ICT can provide the data, which can be used to change behaviours, processes, capabilities and systems. Although isolated efficiency gains do have an impact, ultimately it will be a platform – or a set of technologies – working coherently together that will have the greatest impact.
The following paragraphs try to evaluate the energy footprint of ICT both in public networking infrastructures (Section 5.1) and at homes (Section 5.2). They provide a rough estimate of the additional energy requirements in the implementation of smart grids due to the deployment of ICT devices (Section 5.3) both for the public side (control network) and the energy management systems at home.
5.1 Energy footprint of public telecommunication networks
Recently, network operators around the world reported statistics of network energy requirements and the related carbon footprint, showing an alarming and growing trend. Such large energy consumption can be mainly ascribed to networking equipment designed to work at the maximum capacity with high and almost constant dissipation, independently of traffic load. Table 3 defines key parameters that allow synthetically the representation of the average usage of network devices and links. This has been done by defining the expected (by 2015-2020) average customer up-times and loads, the average traffic utilization on the Metro/transport and core networks, and the number of devices and links that are usually deployed for redundancy purposes8.
8 It is worth noting that the traffic load values in Table 3 are significantly larger (and, consequently, give rise to conservative
consumption estimations) than those of the current network and those indicated in other studies [64].
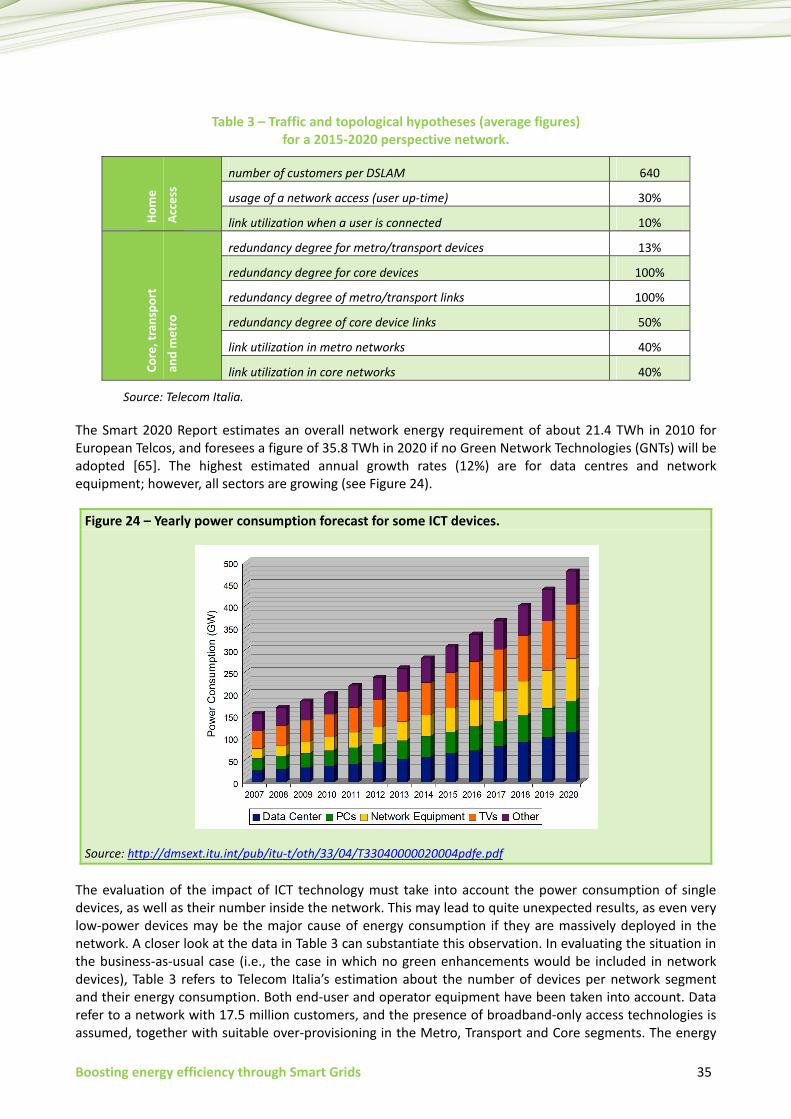
Boosting energy efficiency through Smart Grids 35
Table 3 – Traffic and topological hypotheses (average figures) for a 2015-2020 perspective network.
Hom
e Ac
cess
number of customers per DSLAM 640
usage of a network access (user up-time) 30%
link utilization when a user is connected 10%
Core
, tra
nspo
rt
and
met
ro
redundancy degree for metro/transport devices 13%
redundancy degree for core devices 100%
redundancy degree of metro/transport links 100%
redundancy degree of core device links 50%
link utilization in metro networks 40%
link utilization in core networks 40%
Source: Telecom Italia.
The Smart 2020 Report estimates an overall network energy requirement of about 21.4 TWh in 2010 for European Telcos, and foresees a figure of 35.8 TWh in 2020 if no Green Network Technologies (GNTs) will be adopted [65]. The highest estimated annual growth rates (12%) are for data centres and network equipment; however, all sectors are growing (see Figure 24).
Figure 24 – Yearly power consumption forecast for some ICT devices.
Source: http://dmsext.itu.int/pub/itu-t/oth/33/04/T33040000020004pdfe.pdf
The evaluation of the impact of ICT technology must take into account the power consumption of single devices, as well as their number inside the network. This may lead to quite unexpected results, as even very low-power devices may be the major cause of energy consumption if they are massively deployed in the network. A closer look at the data in Table 3 can substantiate this observation. In evaluating the situation in the business-as-usual case (i.e., the case in which no green enhancements would be included in network devices), Table 3 refers to Telecom Italia’s estimation about the number of devices per network segment and their energy consumption. Both end-user and operator equipment have been taken into account. Data refer to a network with 17.5 million customers, and the presence of broadband-only access technologies is assumed, together with suitable over-provisioning in the Metro, Transport and Core segments. The energy
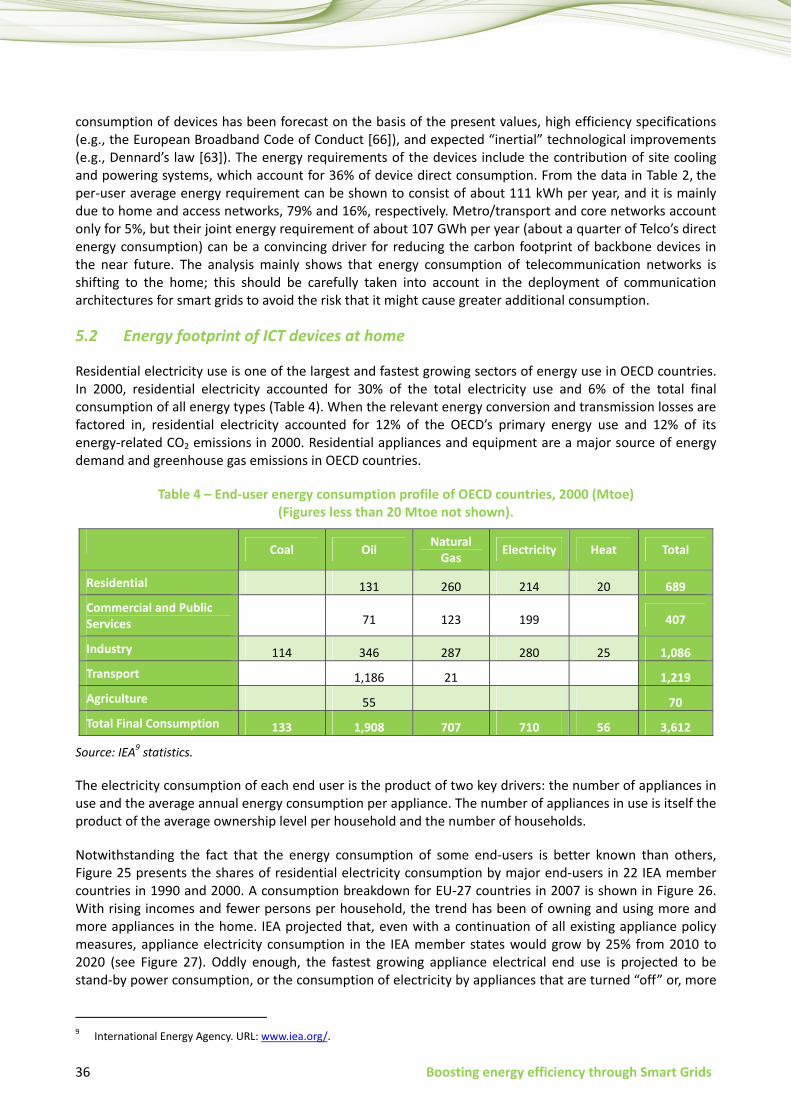
36 Boosting energy efficiency through Smart Grids
consumption of devices has been forecast on the basis of the present values, high efficiency specifications (e.g., the European Broadband Code of Conduct [66]), and expected “inertial” technological improvements (e.g., Dennard’s law [63]). The energy requirements of the devices include the contribution of site cooling and powering systems, which account for 36% of device direct consumption. From the data in Table 2, the per-user average energy requirement can be shown to consist of about 111 kWh per year, and it is mainly due to home and access networks, 79% and 16%, respectively. Metro/transport and core networks account only for 5%, but their joint energy requirement of about 107 GWh per year (about a quarter of Telco’s direct energy consumption) can be a convincing driver for reducing the carbon footprint of backbone devices in the near future. The analysis mainly shows that energy consumption of telecommunication networks is shifting to the home; this should be carefully taken into account in the deployment of communication architectures for smart grids to avoid the risk that it might cause greater additional consumption.
5.2 Energy footprint of ICT devices at home
Residential electricity use is one of the largest and fastest growing sectors of energy use in OECD countries. In 2000, residential electricity accounted for 30% of the total electricity use and 6% of the total final consumption of all energy types (Table 4). When the relevant energy conversion and transmission losses are factored in, residential electricity accounted for 12% of the OECD’s primary energy use and 12% of its energy-related CO2 emissions in 2000. Residential appliances and equipment are a major source of energy demand and greenhouse gas emissions in OECD countries.
Table 4 – End-user energy consumption profile of OECD countries, 2000 (Mtoe) (Figures less than 20 Mtoe not shown).
Coal Oil Natural Gas Electricity Heat Total
Residential 131 260 214 20 689 Commercial and Public Services 71 123 199 407
Industry 114 346 287 280 25 1,086 Transport 1,186 21 1,219 Agriculture 55 70 Total Final Consumption 133 1,908 707 710 56 3,612
Source: IEA9 statistics.
The electricity consumption of each end user is the product of two key drivers: the number of appliances in use and the average annual energy consumption per appliance. The number of appliances in use is itself the product of the average ownership level per household and the number of households.
Notwithstanding the fact that the energy consumption of some end-users is better known than others, Figure 25 presents the shares of residential electricity consumption by major end-users in 22 IEA member countries in 1990 and 2000. A consumption breakdown for EU-27 countries in 2007 is shown in Figure 26. With rising incomes and fewer persons per household, the trend has been of owning and using more and more appliances in the home. IEA projected that, even with a continuation of all existing appliance policy measures, appliance electricity consumption in the IEA member states would grow by 25% from 2010 to 2020 (see Figure 27). Oddly enough, the fastest growing appliance electrical end use is projected to be stand-by power consumption, or the consumption of electricity by appliances that are turned “off” or, more
9 International Energy Agency. URL: www.iea.org/.
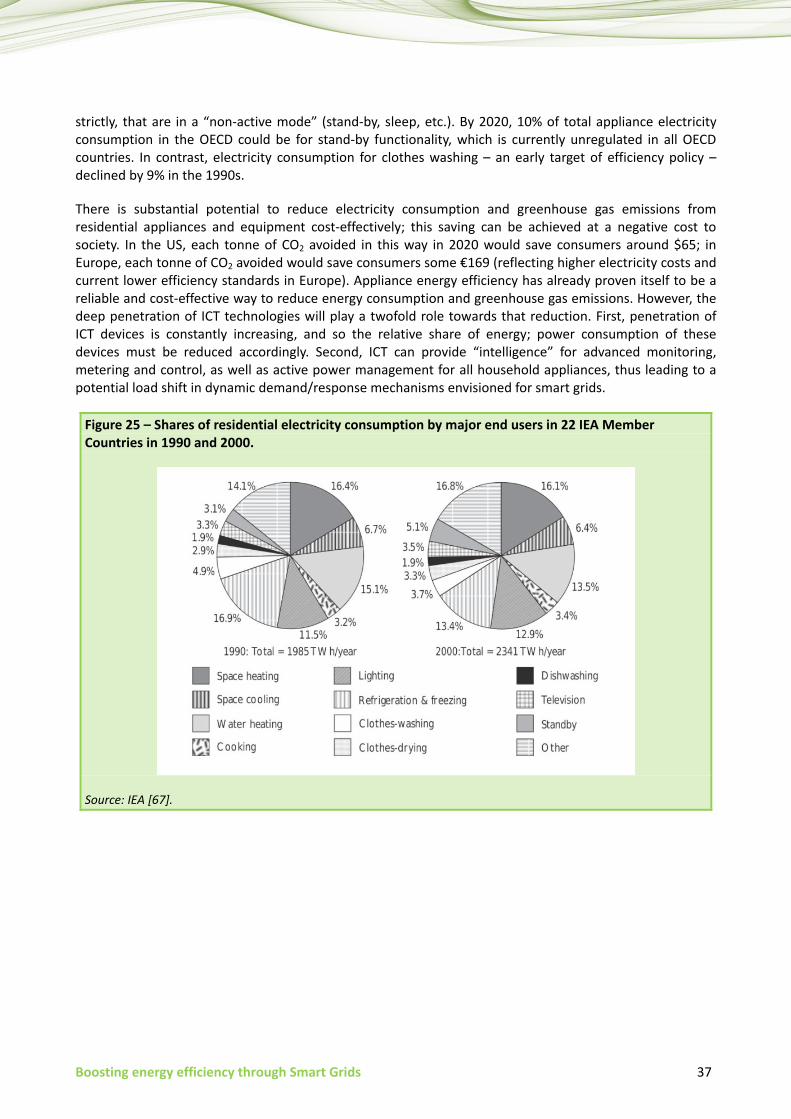
Boosting energy efficiency through Smart Grids 37
strictly, that are in a “non-active mode” (stand-by, sleep, etc.). By 2020, 10% of total appliance electricity consumption in the OECD could be for stand-by functionality, which is currently unregulated in all OECD countries. In contrast, electricity consumption for clothes washing – an early target of efficiency policy – declined by 9% in the 1990s.
There is substantial potential to reduce electricity consumption and greenhouse gas emissions from residential appliances and equipment cost-effectively; this saving can be achieved at a negative cost to society. In the US, each tonne of CO2 avoided in this way in 2020 would save consumers around $65; in Europe, each tonne of CO2 avoided would save consumers some €169 (reflecting higher electricity costs and current lower efficiency standards in Europe). Appliance energy efficiency has already proven itself to be a reliable and cost-effective way to reduce energy consumption and greenhouse gas emissions. However, the deep penetration of ICT technologies will play a twofold role towards that reduction. First, penetration of ICT devices is constantly increasing, and so the relative share of energy; power consumption of these devices must be reduced accordingly. Second, ICT can provide “intelligence” for advanced monitoring, metering and control, as well as active power management for all household appliances, thus leading to a potential load shift in dynamic demand/response mechanisms envisioned for smart grids.
Figure 25 – Shares of residential electricity consumption by major end users in 22 IEA Member Countries in 1990 and 2000.
Source: IEA [67].
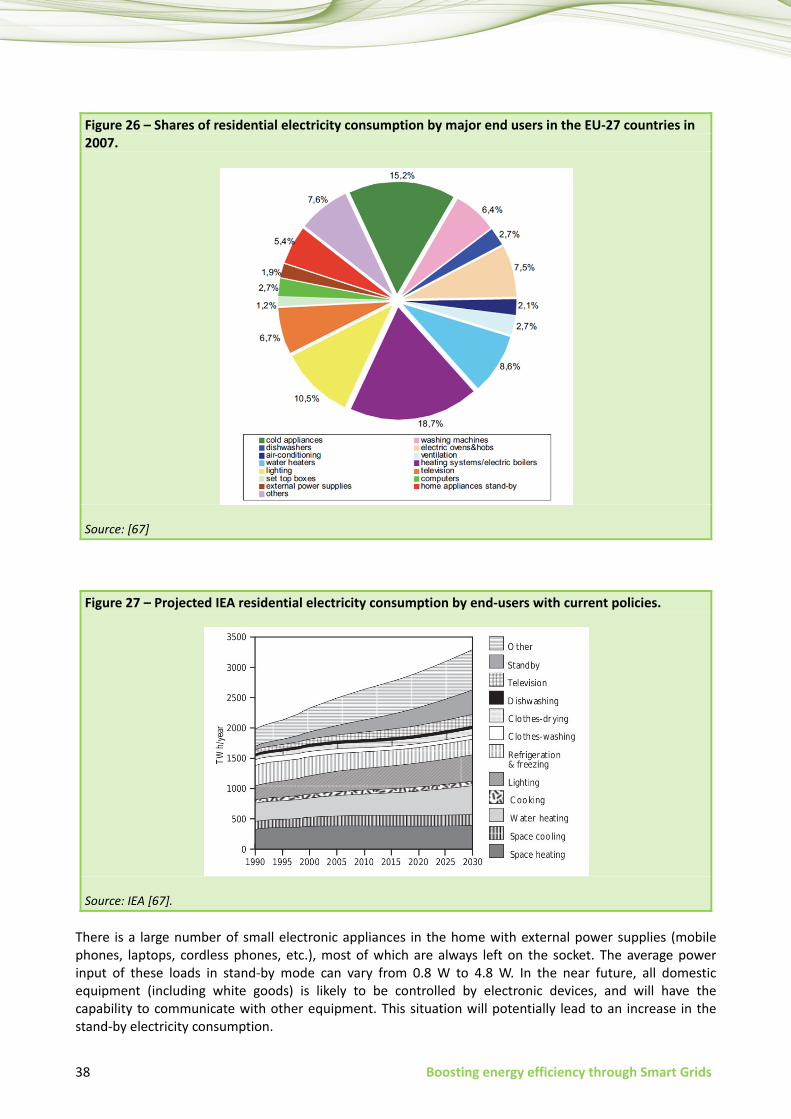
38 Boosting energy efficiency through Smart Grids
Figure 26 – Shares of residential electricity consumption by major end users in the EU-27 countries in 2007.
Source: [67]
Figure 27 – Projected IEA residential electricity consumption by end-users with current policies.
Source: IEA [67].
There is a large number of small electronic appliances in the home with external power supplies (mobile phones, laptops, cordless phones, etc.), most of which are always left on the socket. The average power input of these loads in stand-by mode can vary from 0.8 W to 4.8 W. In the near future, all domestic equipment (including white goods) is likely to be controlled by electronic devices, and will have the capability to communicate with other equipment. This situation will potentially lead to an increase in the stand-by electricity consumption.
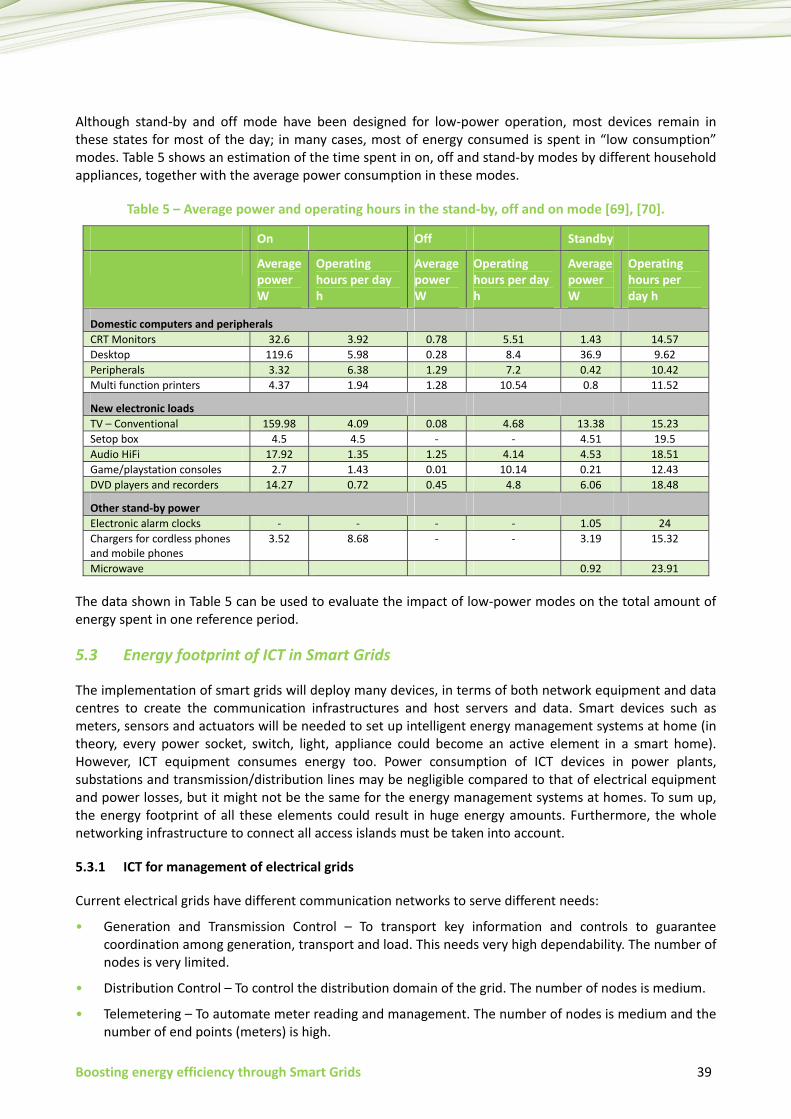
Boosting energy efficiency through Smart Grids 39
Although stand-by and off mode have been designed for low-power operation, most devices remain in these states for most of the day; in many cases, most of energy consumed is spent in “low consumption” modes. Table 5 shows an estimation of the time spent in on, off and stand-by modes by different household appliances, together with the average power consumption in these modes.
Table 5 – Average power and operating hours in the stand-by, off and on mode [69], [70].
On Off Standby
Average power W
Operating hours per day h
Average power W
Operating hours per day h
Average power W
Operating hours per day h
Domestic computers and peripherals CRT Monitors 32.6 3.92 0.78 5.51 1.43 14.57 Desktop 119.6 5.98 0.28 8.4 36.9 9.62 Peripherals 3.32 6.38 1.29 7.2 0.42 10.42 Multi function printers 4.37 1.94 1.28 10.54 0.8 11.52
New electronic loads TV – Conventional 159.98 4.09 0.08 4.68 13.38 15.23 Setop box 4.5 4.5 - - 4.51 19.5 Audio HiFi 17.92 1.35 1.25 4.14 4.53 18.51 Game/playstation consoles 2.7 1.43 0.01 10.14 0.21 12.43 DVD players and recorders 14.27 0.72 0.45 4.8 6.06 18.48
Other stand-by power Electronic alarm clocks - - - - 1.05 24 Chargers for cordless phones and mobile phones
3.52 8.68 - - 3.19 15.32
Microwave 0.92 23.91
The data shown in Table 5 can be used to evaluate the impact of low-power modes on the total amount of energy spent in one reference period.
5.3 Energy footprint of ICT in Smart Grids
The implementation of smart grids will deploy many devices, in terms of both network equipment and data centres to create the communication infrastructures and host servers and data. Smart devices such as meters, sensors and actuators will be needed to set up intelligent energy management systems at home (in theory, every power socket, switch, light, appliance could become an active element in a smart home). However, ICT equipment consumes energy too. Power consumption of ICT devices in power plants, substations and transmission/distribution lines may be negligible compared to that of electrical equipment and power losses, but it might not be the same for the energy management systems at homes. To sum up, the energy footprint of all these elements could result in huge energy amounts. Furthermore, the whole networking infrastructure to connect all access islands must be taken into account.
5.3.1 ICT for management of electrical grids
Current electrical grids have different communication networks to serve different needs:
• Generation and Transmission Control – To transport key information and controls to guarantee coordination among generation, transport and load. This needs very high dependability. The number of nodes is very limited.
• Distribution Control – To control the distribution domain of the grid. The number of nodes is medium.
• Telemetering – To automate meter reading and management. The number of nodes is medium and the number of end points (meters) is high.

40 Boosting energy efficiency through Smart Grids
• Data Centres – To store data and host servers/services.
As an example, this report will refer to a case study on a typical mid-size developed country (Italy). Information is based on IEA, the national Electrical Grid operator (TERNA), and Telecom Italia public documents. Telecom Italia has been chosen both as a reference networking infrastructure and because it released detailed information on the energy footprint of its network segments.
Italy’s main numbers are: 60 million inhabitants, 301,000 sq. km of territory, about 8,000 municipalities. There are more than 30 million subscriptions to the electrical service and nearly 20 million to the fixed telecommunications services. The electrical energy consumption was 317 TWh per year [71]. Power is mostly generated by about one hundred major power plants and a multitude (about 4000) of smaller traditional power plants (thermal, hydro, etc.). It flows through the HV transmission lines, connected in a meshed network by HV substations (hundreds) to the HV/MV transformer substations (about 3,000) and then to the MV/LV substations (more than 400,000). More than 30,000,000 intelligent meters have been installed at customers’ premises.
It is interesting to note that Italy represents about 10% of Europe’s population and electrical energy consumption. It seems then reasonable to consider that the same ratio could be used to extend the national level estimates reported in this section to the European level.
5.3.1.1 Energy footprint of current networking infrastructures
The legacy communications network for the control of electricity grids can be compared to the backhauling network of the mobile communications network, as both are in a similar range of nodes, are sparsely placed and rely on point-to-point/multipoint radio links and on fixed network connections. Their energy footprint can be estimated to be similar. Backhauling is known to be about 5-10% of the footprint of mobile communication networks (150 GWh per year for the 14,000 radio base stations of TIM10). It is worth considering that present local area networks and sensors/actuators within power plants and the other nodes can have an energy footprint much greater than that of the communications network. Currently no detailed data is available to verify its actual amount.
Most MV/LV substations are connected through GPRS networks to transmit data about local alarms and power quality information. The use of public networks helps minimizing the energy footprint that could be estimated at about 10 GWh per year.
The telemetering network allows remote meter reading and management: user activation/deactivation, change of profile and power allowed. Data concentrators are placed at the MV/LV substations, as communication with meters makes use of power-line technologies. Its energy footprint can be estimated to be some tens of GWh/year at the nodes and 500 GWh/year at the meters.
The amount of data transmitted to data centres and stored there is relatively limited as, even considering telemetering and actuations, it is in the order of few gigabytes/day. Its energy footprint is then considered negligible.
5.3.1.2 Energy footprint of future networking infrastructures
Technical, economical and evolutionary constraints lead to the earlier development of telecommunication networks optimized to serve the needs of new control networks for the electric grid. They will show an increased need in terms of the overall bit rate and computing capabilities within the control centres (data centres). They will have to interact with a rising number of nodes as the amount of distributed generating
10 Telecom Italia Mobile (TIM) is one of the main Italian operators for mobile communications.
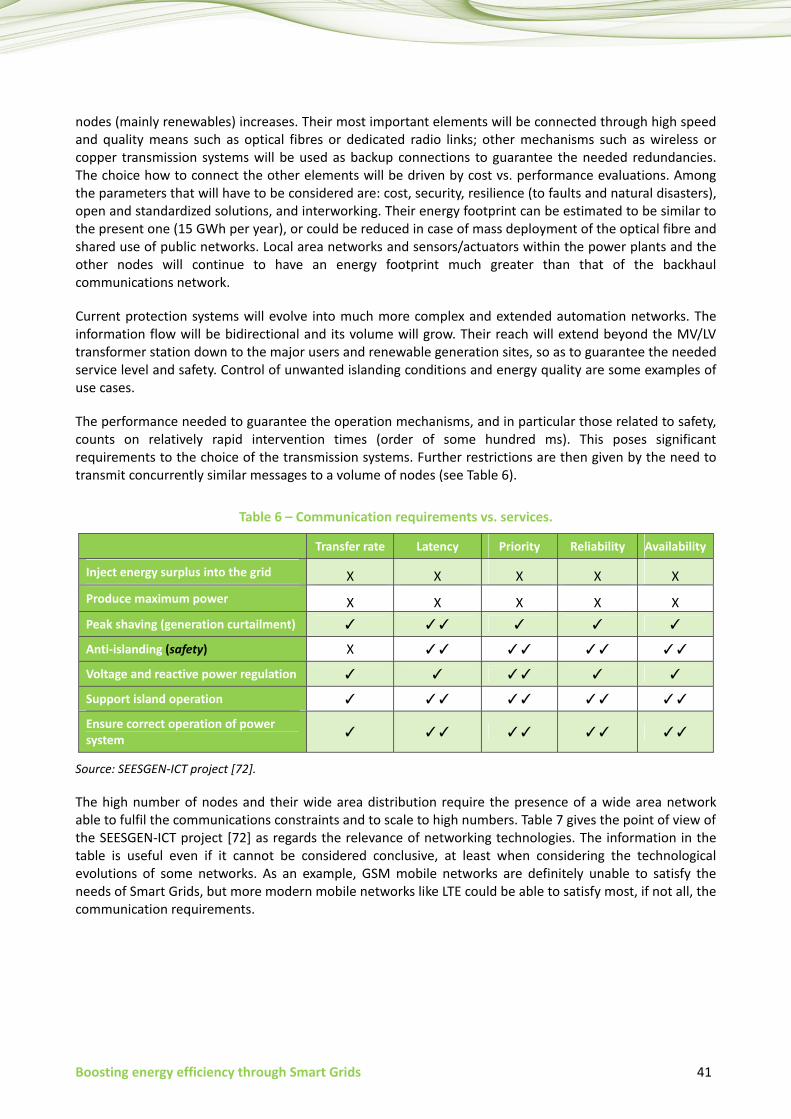
Boosting energy efficiency through Smart Grids 41
nodes (mainly renewables) increases. Their most important elements will be connected through high speed and quality means such as optical fibres or dedicated radio links; other mechanisms such as wireless or copper transmission systems will be used as backup connections to guarantee the needed redundancies. The choice how to connect the other elements will be driven by cost vs. performance evaluations. Among the parameters that will have to be considered are: cost, security, resilience (to faults and natural disasters), open and standardized solutions, and interworking. Their energy footprint can be estimated to be similar to the present one (15 GWh per year), or could be reduced in case of mass deployment of the optical fibre and shared use of public networks. Local area networks and sensors/actuators within the power plants and the other nodes will continue to have an energy footprint much greater than that of the backhaul communications network.
Current protection systems will evolve into much more complex and extended automation networks. The information flow will be bidirectional and its volume will grow. Their reach will extend beyond the MV/LV transformer station down to the major users and renewable generation sites, so as to guarantee the needed service level and safety. Control of unwanted islanding conditions and energy quality are some examples of use cases.
The performance needed to guarantee the operation mechanisms, and in particular those related to safety, counts on relatively rapid intervention times (order of some hundred ms). This poses significant requirements to the choice of the transmission systems. Further restrictions are then given by the need to transmit concurrently similar messages to a volume of nodes (see Table 6).
Table 6 – Communication requirements vs. services.
Transfer rate Latency Priority Reliability Availability
Inject energy surplus into the grid X X X X X Produce maximum power X X X X X Peak shaving (generation curtailment) ✓ ✓✓ ✓ ✓ ✓
Anti-islanding (safety) X ✓✓ ✓✓ ✓✓ ✓✓
Voltage and reactive power regulation ✓ ✓ ✓✓ ✓ ✓
Support island operation ✓ ✓✓ ✓✓ ✓✓ ✓✓
Ensure correct operation of power system ✓ ✓✓ ✓✓ ✓✓ ✓✓
Source: SEESGEN-ICT project [72].
The high number of nodes and their wide area distribution require the presence of a wide area network able to fulfil the communications constraints and to scale to high numbers. Table 7 gives the point of view of the SEESGEN-ICT project [72] as regards the relevance of networking technologies. The information in the table is useful even if it cannot be considered conclusive, at least when considering the technological evolutions of some networks. As an example, GSM mobile networks are definitely unable to satisfy the needs of Smart Grids, but more modern mobile networks like LTE could be able to satisfy most, if not all, the communication requirements.
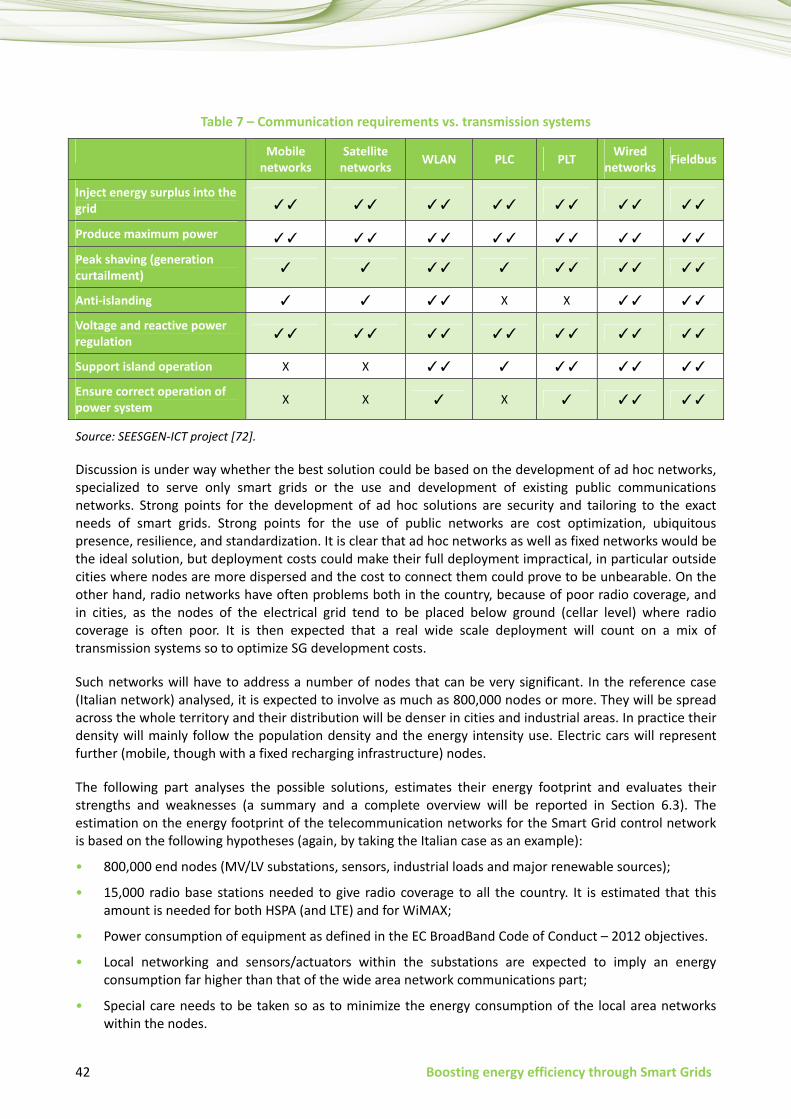
42 Boosting energy efficiency through Smart Grids
Table 7 – Communication requirements vs. transmission systems
Mobile networks
Satellite networks WLAN PLC PLT Wired
networks Fieldbus
Inject energy surplus into the grid ✓✓ ✓✓ ✓✓ ✓✓ ✓✓ ✓✓ ✓✓
Produce maximum power ✓✓ ✓✓ ✓✓ ✓✓ ✓✓ ✓✓ ✓✓ Peak shaving (generation curtailment) ✓ ✓ ✓✓ ✓ ✓✓ ✓✓ ✓✓
Anti-islanding ✓ ✓ ✓✓ X X ✓✓ ✓✓
Voltage and reactive power regulation ✓✓ ✓✓ ✓✓ ✓✓ ✓✓ ✓✓ ✓✓
Support island operation X X ✓✓ ✓ ✓✓ ✓✓ ✓✓
Ensure correct operation of power system X X ✓ X ✓ ✓✓ ✓✓
Source: SEESGEN-ICT project [72].
Discussion is under way whether the best solution could be based on the development of ad hoc networks, specialized to serve only smart grids or the use and development of existing public communications networks. Strong points for the development of ad hoc solutions are security and tailoring to the exact needs of smart grids. Strong points for the use of public networks are cost optimization, ubiquitous presence, resilience, and standardization. It is clear that ad hoc networks as well as fixed networks would be the ideal solution, but deployment costs could make their full deployment impractical, in particular outside cities where nodes are more dispersed and the cost to connect them could prove to be unbearable. On the other hand, radio networks have often problems both in the country, because of poor radio coverage, and in cities, as the nodes of the electrical grid tend to be placed below ground (cellar level) where radio coverage is often poor. It is then expected that a real wide scale deployment will count on a mix of transmission systems so to optimize SG development costs.
Such networks will have to address a number of nodes that can be very significant. In the reference case (Italian network) analysed, it is expected to involve as much as 800,000 nodes or more. They will be spread across the whole territory and their distribution will be denser in cities and industrial areas. In practice their density will mainly follow the population density and the energy intensity use. Electric cars will represent further (mobile, though with a fixed recharging infrastructure) nodes.
The following part analyses the possible solutions, estimates their energy footprint and evaluates their strengths and weaknesses (a summary and a complete overview will be reported in Section 6.3). The estimation on the energy footprint of the telecommunication networks for the Smart Grid control network is based on the following hypotheses (again, by taking the Italian case as an example):
• 800,000 end nodes (MV/LV substations, sensors, industrial loads and major renewable sources);
• 15,000 radio base stations needed to give radio coverage to all the country. It is estimated that this amount is needed for both HSPA (and LTE) and for WiMAX;
• Power consumption of equipment as defined in the EC BroadBand Code of Conduct – 2012 objectives.
• Local networking and sensors/actuators within the substations are expected to imply an energy consumption far higher than that of the wide area network communications part;
• Special care needs to be taken so as to minimize the energy consumption of the local area networks within the nodes.

Boosting energy efficiency through Smart Grids 43
Table 8 below shows an evaluation of the energy footprint of the control network under different scenarios. Five cases have been considered, with the equipment always working in full energy consumption mode.
• Case A refers to the creation of a fully new broadband wire-line network. Even if such a network could deliver the best performance and imply very limited energy consumption, its cost is expected to be critical; in particular, the infrastructural cost to connect sparsely populated areas.
• Case A1 plans to upgrade the existing wire-line broadband networks. Its features would relatively satisfy the needs of Smart Grids, and its feasibility would be less challenging than that of a fully new broadband network, but the costs in sparsely populated areas would still remain high.
• Case B considers the creation of a fully new broadband 3G (HSPA)/4G (LTE)/WiMAX wireless network. Such a network could satisfy the requirements of SG, but at the cost of an unacceptably dense deployment, particularly in cities. Typical deployments would face problems to get the radio signal reaching underground nodes, as many MV/LV substations and meters are installed underground or at cellar level in the cities. Its cost would be high and the opposition from communities to the installation of so many new radio base stations might become critical. Energy consumption would be high.
• Case B1 plans to upgrade the existing wireless broadband networks. Its feasibility would be less challenging than that of a fully new wireless network, but many of the weak points of case B would remain.
• Case Z builds upon all the existing wire-line and wireless networks. Only a limited amount of new equipment and radio base stations would have to be added and the overall energy footprint would be low enough. Transmission performance would be optimized and the cost of such deployment could be minimized. Quality and performance would be benefited by the competition among service providers.
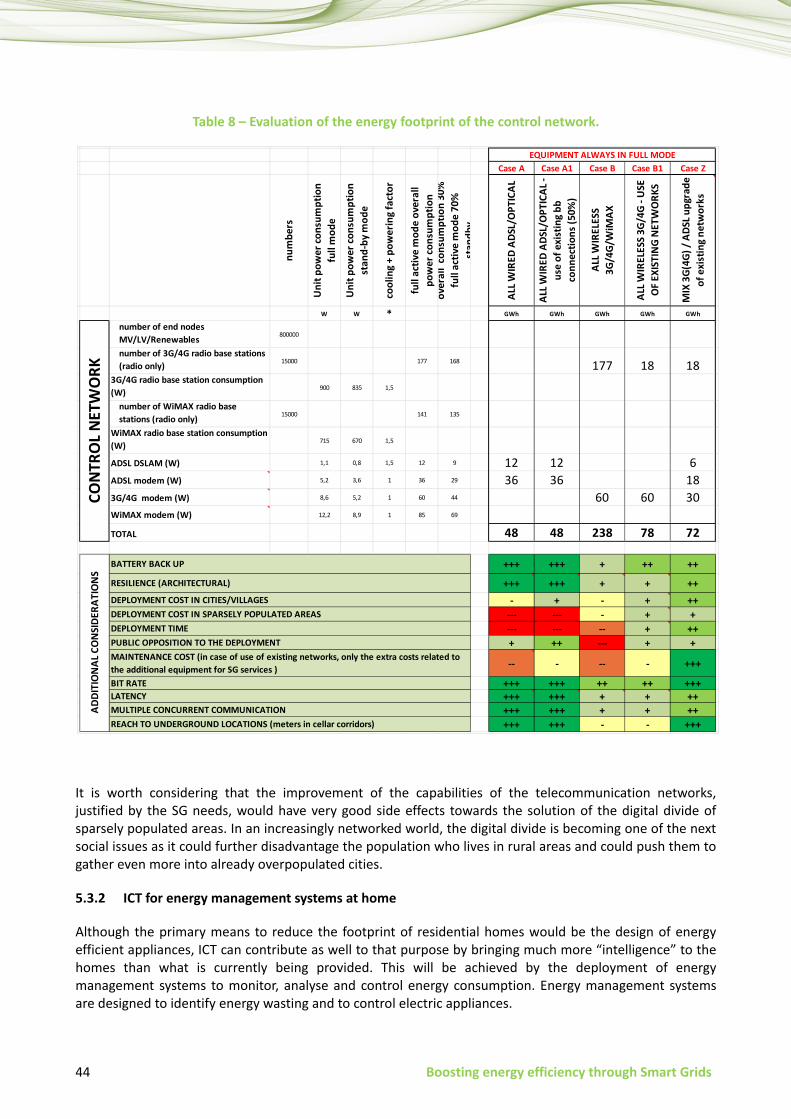
44 Boosting energy efficiency through Smart Grids
Table 8 – Evaluation of the energy footprint of the control network.
It is worth considering that the improvement of the capabilities of the telecommunication networks, justified by the SG needs, would have very good side effects towards the solution of the digital divide of sparsely populated areas. In an increasingly networked world, the digital divide is becoming one of the next social issues as it could further disadvantage the population who lives in rural areas and could push them to gather even more into already overpopulated cities.
5.3.2 ICT for energy management systems at home
Although the primary means to reduce the footprint of residential homes would be the design of energy efficient appliances, ICT can contribute as well to that purpose by bringing much more “intelligence” to the homes than what is currently being provided. This will be achieved by the deployment of energy management systems to monitor, analyse and control energy consumption. Energy management systems are designed to identify energy wasting and to control electric appliances.
Case A Case A1 Case B Case B1 Case Z
num
bers
Uni
t pow
er co
nsum
ptio
n fu
ll m
ode
Uni
t pow
er co
nsum
ptio
n st
and-
by m
ode
cool
ing
+ po
wer
ing
fact
or
full
activ
e m
ode
over
all
pow
er co
nsum
ptio
nov
eral
l co
nsum
ptio
n 30
%
full
activ
e m
ode
70%
st
andb
y
ALL W
IRED
ADS
L/O
PTIC
AL
ALL W
IRED
ADS
L/O
PTIC
AL -
use
of e
xist
ing
bb
conn
ectio
ns (5
0%)
ALL W
IREL
ESS
3G/4
G/W
iMAX
ALL W
IREL
ESS
3G/4
G - U
SE
OF
EXIS
TIN
G N
ETW
ORK
S
MIX
3G(
4G) /
ADS
L upg
rade
of
exi
stin
g ne
twor
ks
8760 W W * GWh GWh GWh GWh GWh
number of end nodes MV/LV/Renewables 800000
number of 3G/4G radio base stations (radio only) 15000 177 168 177 18 18
3G/4G radio base station consumption (W) 900 835 1,5
number of WiMAX radio base stations (radio only) 15000 141 135
WiMAX radio base station consumption (W) 715 670 1,5
ADSL DSLAM (W) 1,1 0,8 1,5 12 9 12 12 6ADSL modem (W) 5,2 3,6 1 36 29 36 36 183G/4G modem (W) 8,6 5,2 1 60 44 60 60 30WiMAX modem (W) 12,2 8,9 1 85 69
TOTAL 48 48 238 78 72
+++ +++ + ++ ++
+++ +++ + + ++- + - + ++
--- --- - + +--- --- -- + +++ ++ --- + +
-- - -- - +++
+++ +++ ++ ++ ++++++ +++ + + +++++ +++ + + +++++ +++ - - +++
CON
TRO
L N
ETW
ORK
BATTERY BACK UP
RESILIENCE (ARCHITECTURAL)
DEPLOYMENT COST IN CITIES/VILLAGESDEPLOYMENT COST IN SPARSELY POPULATED AREAS
PUBLIC OPPOSITION TO THE DEPLOYMENT
BIT RATE LATENCYMULTIPLE CONCURRENT COMMUNICATIONREACH TO UNDERGROUND LOCATIONS (meters in cellar corridors)
EQUIPMENT ALWAYS IN FULL MODE
ADDI
TIO
NAL
CO
NSI
DERA
TIO
NS
MAINTENANCE COST (in case of use of existing networks, only the extra costs related to the additional equipment for SG services )
DEPLOYMENT TIME
Boosting energy efficiency through Smart Grids 45
The carbon footprint of household appliances can be reduced by suitable demand/response mechanisms. The basic issue in energy control is the monitoring of the various energy consumption elements and devices, as well as the scheduling of their operation in order to minimize peaks, balance loads, and ultimately achieve predictable large-scale energy-consumption profiles. This will result in a much more balanced energy-consumption profile, and in considerable energy conservation gains, at local (flat, home, office or single-building) level, as well as for larger geographical regions (large buildings, squares and neighbourhoods).
Every device with a stand-by function uses a small amount of energy, even if it is switched ‘off’. All of that unnoticed energy use adds up considerably. Electronic equipment is also often left ‘on’ while not being used. Up to 30% of in-house electricity consumption is wasted in this manner.
Office buildings use 40% of their energy outside office hours. During working hours as well, an average 30% of energy is not used efficiently, for example, due to lights being left ‘on’ in areas where no one is present or due to climate control keeping empty rooms at the perfect temperature.
Energy management systems are mostly based on accurate and dynamic scheduling resources as local generation, load of appliances, storage facilities, real-time pricing [73], [74] and [75]. This approach heavily relies on accurate metering, flexible computation and forecasting and reliable communication within the whole energy system. A typical energy management system is made of remote sensors to measure the electrical consumption and environmental parameters, gateways to interconnect several local networking technologies with outside control centres and utilities, computation units, sockets controlling the appliances and user displays. However, this usually comes at the expense of deploying additional devices that consume power; thus, the natural question that arises is: will the energy saving be sufficient to compensate the additional consumption for ICT devices? Despite the trivial concern, currently this matter is almost always ignored.
5.3.2.1 Communication technologies for energy management systems
There are a number of components in energy management systems that need communication facilities in local and metropolitan areas11.
Wi-Fi dominates the wireless home networking, but it is relatively costly to implement, and requires too much power to permit battery operation in low-cost remote control applications. Bluetooth is used in some high-end remote controls and PC peripherals, but suffers from the same drawbacks as Wi-Fi; it is relatively costly and has a too short battery life. Z-Wave is a proprietary wireless communications protocol designed for home automation, specifically to remotely control applications in residential and light commercial environments. The technology uses a low-power RF radio embedded or retrofitted into home electronic devices and systems, such as lighting, home access control, entertainment systems and household appliances. In contrast to other wireless networking technologies such as Bluetooth and wireless LAN, Z-Wave and ZigBee feature lower power consumption and lower data rates.
Power-line networking has proven to be a reliable communication technology for high bandwidth distribution of entertainment-grade HD video, gaming, Internet access and other applications in homes. This same proven technology, at lower rate and bandwidth, will allow home area networks to communicate to smart electricity meters and give consumers the ability to monitor and manage their electricity usage as never before. Further interface technologies could be made available to enable optimal communication between the meter and the user. Several initiatives are active in this field: ITU-T G.hn [55], [56], ITU-T
11 See, for example, www.plugwise.com.
46 Boosting energy efficiency through Smart Grids
G.hnem (ITU-T G.9955 [53] and G.9956 [54]), IEEE 1901 [76], Multimedia over Coax Alliance12 (MoCA) and Universal Powerline Association (UPA). In particular, G.hnem (ITU-T G.9955 and G.9956) defines a family of three next generation narrowband powerline communications (NB-PLC) standards.
G.9955 and G.9956 contain the physical layer (PHY) and the data link layer (DLL) specifications, respectively, for NB-PLC transceivers based on OFDM (orthogonal frequency-division multiplexing) for communications via alternating current and direct current electric power lines over frequencies below 500 kHz. The Recommendations support indoor and outdoor communications over low voltage lines, medium voltage lines, through transformer low-voltage to medium-voltage and through transformer medium-voltage to low-voltage power lines in both urban and in long distance rural communications. The Recommendations address grid to utility meter applications, advanced metering infrastructure (AMI), and other Smart Grid applications such as charging of electric vehicle, home automation, and home area networking (HAN) communications scenarios.
They include three separate and self-contained specifications:
• G.hnem: a new NB-PLC technology developed by ITU-T in cooperation with members of the G3-PLC and PRIME Alliances.
• G3-PLC: an established and field-proven NB-PLC technology contributed by members of the G3-PLC Alliance.
• PRIME: an established and field-proven NB-PLC technology contributed by members of the PRIME Alliance.
The standards incorporate electromagnetic compatibility (EMC) and mitigation techniques defined in collaboration with ITU’s Radiocommunication Sector (ITU-R) that ensure a high degree of compatibility with and protection of radiocommunication services from PLC emissions.
Access networks to connect home units with the neighbourhood and utilities include ADSL lines, WiMax and 3/4G technologies (UMTS, HSDPA and LTE).
5.3.2.2 Energy consumption of ICT systems for energy management
Low power consumption is essential for battery-powered systems to maximize the lifetime of batteries (and sometimes devices). Typical WLAN devices use a transmit power of 100 mW, i.e., 20 dBm, which results in high power consumption (see Table 9).
The transmit power of short-range wireless devices such as ZigBee is typically 100 times lower. Operating only at roughly 1 mW, i.e., 0 dBm, extends the battery life significantly, although the coverage may be too small for many applications. Table 10 shows typical power requirements for ZigBee nodes that vary from a few microwatts in sleep modes up to several hundred milliwatts while transmitting data; most of the power requirements are indeed due to radio operations. These values do not consider additional sensing boards; however, they usually account for a few mW.
12 www.mocalliance.org/.
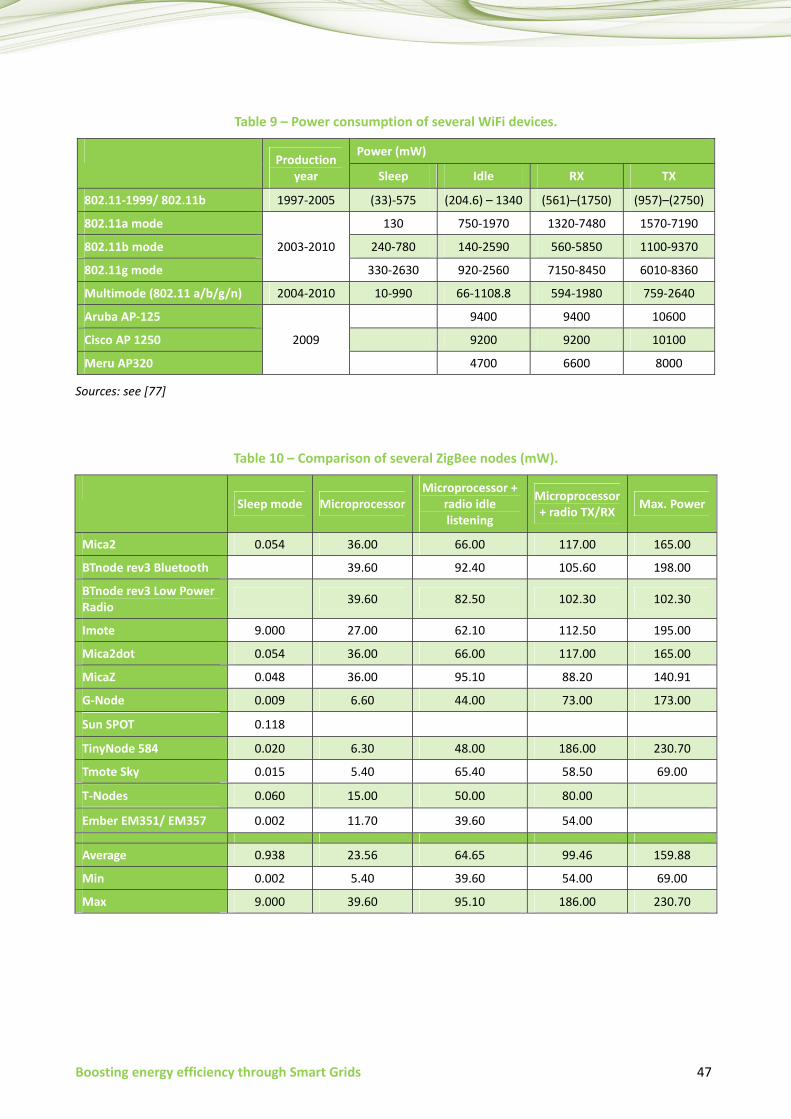
Boosting energy efficiency through Smart Grids 47
Table 9 – Power consumption of several WiFi devices.
Production year
Power (mW)
Sleep Idle RX TX
802.11-1999/ 802.11b 1997-2005 (33)-575 (204.6) – 1340 (561)–(1750) (957)–(2750)
802.11a mode 130 750-1970 1320-7480 1570-7190
802.11b mode 2003-2010 240-780 140-2590 560-5850 1100-9370
802.11g mode 330-2630 920-2560 7150-8450 6010-8360
Multimode (802.11 a/b/g/n) 2004-2010 10-990 66-1108.8 594-1980 759-2640
Aruba AP-125 9400 9400 10600
Cisco AP 1250 2009 9200 9200 10100
Meru AP320 4700 6600 8000
Sources: see [77]
Table 10 – Comparison of several ZigBee nodes (mW).
Sleep mode Microprocessor
Microprocessor + radio idle listening
Microprocessor + radio TX/RX Max. Power
Mica2 0.054 36.00 66.00 117.00 165.00
BTnode rev3 Bluetooth 39.60 92.40 105.60 198.00
BTnode rev3 Low Power Radio 39.60 82.50 102.30 102.30
Imote 9.000 27.00 62.10 112.50 195.00
Mica2dot 0.054 36.00 66.00 117.00 165.00
MicaZ 0.048 36.00 95.10 88.20 140.91
G-Node 0.009 6.60 44.00 73.00 173.00
Sun SPOT 0.118
TinyNode 584 0.020 6.30 48.00 186.00 230.70
Tmote Sky 0.015 5.40 65.40 58.50 69.00
T-Nodes 0.060 15.00 50.00 80.00
Ember EM351/ EM357 0.002 11.70 39.60 54.00
Average 0.938 23.56 64.65 99.46 159.88
Min 0.002 5.40 39.60 54.00 69.00
Max 9.000 39.60 95.10 186.00 230.70

48 Boosting energy efficiency through Smart Grids
Z-wave devices feature much lower power consumption. For Z-wave devices, there is not as much information available. Data is available for one chipset only (Table 11). Considering some partial information available on the Internet, energy consumption of these devices can be assumed ranging from some hundred microwatts in sleep mode to few hundred milliwatts during communications.
Given the presence of multiple communication technologies, gateways and interface converters (i.e., bridges) will be necessary. There are several devices on the market to bridge between one of the above technologies and Ethernet; power consumption is usually of few Watt.
Table 11 – Power consumption for Z-wave devices (mW).
Sleep Standard mode (MCU) Receiving Transmitting
(5 db) Transmitting
(0 dB)
Zensys ZW0201 0.054 9.36 41.4 43.2 64.8
Energy management systems also need computing units. These are typically implemented on desktop computers or embedded devices. To this purpose, one can consider plug computers as a good assessment of power requirements for such kinds of applications. Table 12 shows typical values as 15-20 W, but very low power devices are also available (5 W).
Table 12 – Power consumption for some plug computers.
Device Power (W)
D2plug 19
GuruPlug Server 20
DreamPlug 15
Nimbus 5
Stratus 18
Evaluating the power consumption of power-line and broadband access communication devices is not easy. Vendors of such devices are mostly interested in promoting the benefits of saving energy, but normally do not deliver information about consumption of their products. To give a simple understanding of the order of magnitude for a large set of communication devices, we can consider the requirements of the Code of Conduct [66]. Expectations are that broadband equipment will contribute considerably to the electricity consumption of households in the European Union in the near future13. The Code of Conduct covers equipment for broadband services both on the customer side as listed in Figure 28 and on the network side (see Figure 29).
13 Depending on the penetration level, the specifications of the equipment and the requirements of the service provider, a total
European consumption of up to 50 TWh per year can be estimated for the year 2015. The Code of Conduct dictates general principles and actions to limit the (maximum) electricity consumption to 25 TWh per year; this is equivalent to 5.5 Million tons of oil equivalent (TOE) and to total saving of about € 7.5 Billion per year.
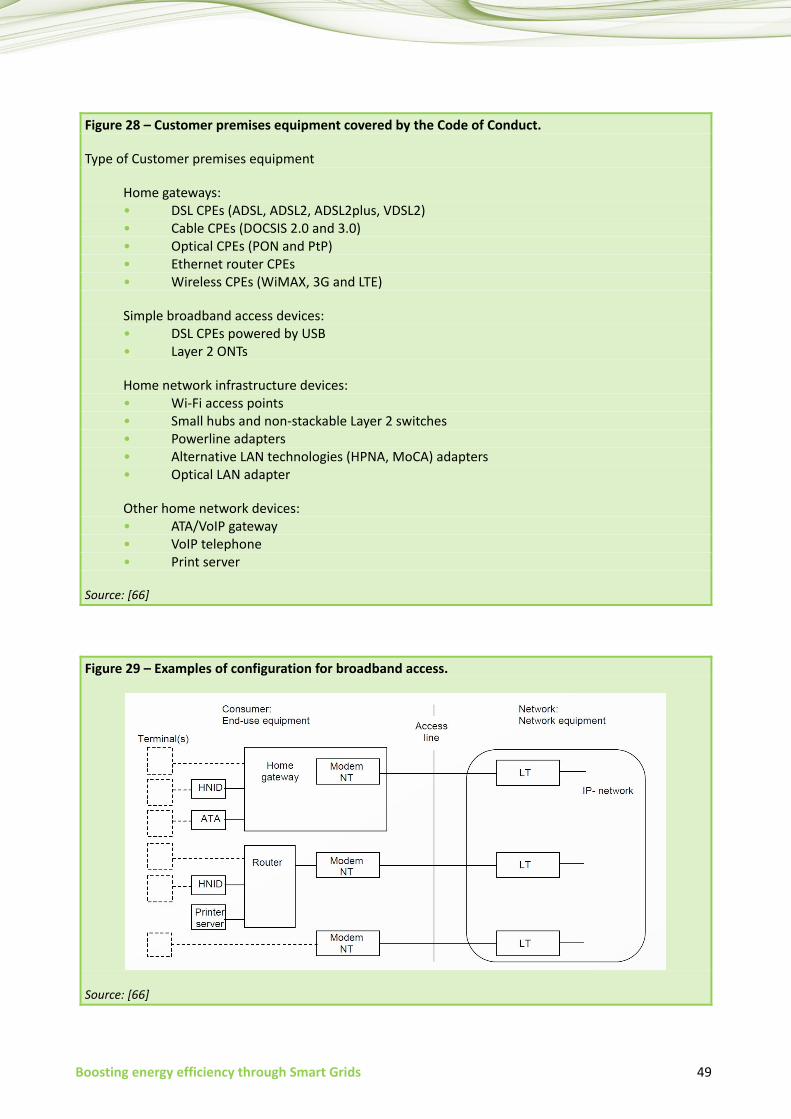
Boosting energy efficiency through Smart Grids 49
Figure 28 – Customer premises equipment covered by the Code of Conduct.
Type of Customer premises equipment
Home gateways: • DSL CPEs (ADSL, ADSL2, ADSL2plus, VDSL2) • Cable CPEs (DOCSIS 2.0 and 3.0) • Optical CPEs (PON and PtP) • Ethernet router CPEs • Wireless CPEs (WiMAX, 3G and LTE)
Simple broadband access devices: • DSL CPEs powered by USB • Layer 2 ONTs
Home network infrastructure devices: • Wi-Fi access points • Small hubs and non-stackable Layer 2 switches • Powerline adapters • Alternative LAN technologies (HPNA, MoCA) adapters • Optical LAN adapter
Other home network devices: • ATA/VoIP gateway • VoIP telephone • Print server
Source: [66]
Figure 29 – Examples of configuration for broadband access.
Source: [66]
50 Boosting energy efficiency through Smart Grids
The code requires the devices to implement three power states (active, stand-by, and off) and dictates both maximum power consumption for stand-by and active states and the transition times between them. Specific values are given for different technologies; typical values for the whole device may range from 5 W up to 20 W, largely depending on the number and types (wired, wireless, power line) of interfaces available. The Code contains both short-term targets, having two-year validity and used as a reference by all companies participating in the CoC, and longer-term targets (two years further). The longer-term targets are useful as an indication for developers. The BB CoC has proven successful in raising the level of urgency towards the optimization of the efficiency of broadband equipment and implementation of low-power/power-aware modes; it is normally reviewed every two years. This document could have a very significant effect on ICT for Smart Grids, as the latter will be substantially based on broadband techniques already covered by the CoC or other technologies that are proposed to be introduced in its next revision.
5.3.2.3 An example of potential energy impact of ICT technologies
For a rough estimation of the impact of an energy management system, one can consider the following assumptions (the energy consumption of the devices as per the EC BroadBand CoC 2012 targets) and a target of 33,000,000 meters (homes and small enterprises):
• Cases A and A1 – As analysed for Control networks, a full deployment of only wire-line solutions, although being appealing on the energy consumption side, looks unacceptably costly due to the huge infrastructural investments it would require.
• Case A2 –The broad use of cable broadband networks would add extra energy consumption and could require extra time for deployment completion.
• Cases B, B1 and B2 –The deployment of a wireless-only solution would be simpler than the wire-line case, but public opposition from the population (to many additional Radio Base Stations (RBSs)) and poor coverage of underground/cellar nodes might become an insurmountable obstacle. Energy consumption of wireless modems would be rather high.
• Case C – Problems of deployment time, cost and poor resilience discourage applying such a solution.
• Case Z – The reuse and extension of existing wire-line and wireless networks looks to be winning, as it would allow early availability of a truly broadband solution able to serve all needs of SGs.
Further considerations for home equipment:
• Particular care has to be devoted to the energy efficiency of all ICTs in homes, as they will dominate the overall energy footprint of the SG due to their numerousness.
• The choice on the best communications technique to network all home appliances should carefully take into account the energy footprint of each solution, as some might require much higher (and avoidable) power than others. The information available shows that wireless low-power technologies (e.g., ZigBee) require much less power than power-line techniques. As seen in the table, the use of the power-line techniques instead of the low-power wireless ones could more than double the overall consumption of all ICTs for Smart Grids.
• The displaying device could draw as much as 25% of the SG consumption. It will be important to choose a displaying technology able to conjugate good user experience and low power consumption.
In this scenario, an overall additional consumption per household could range between 13 and 35 W, which corresponds to a 4 to 12% energy consumption increase for each customer14.
14 Italian typical households: 2500 kWh per year.
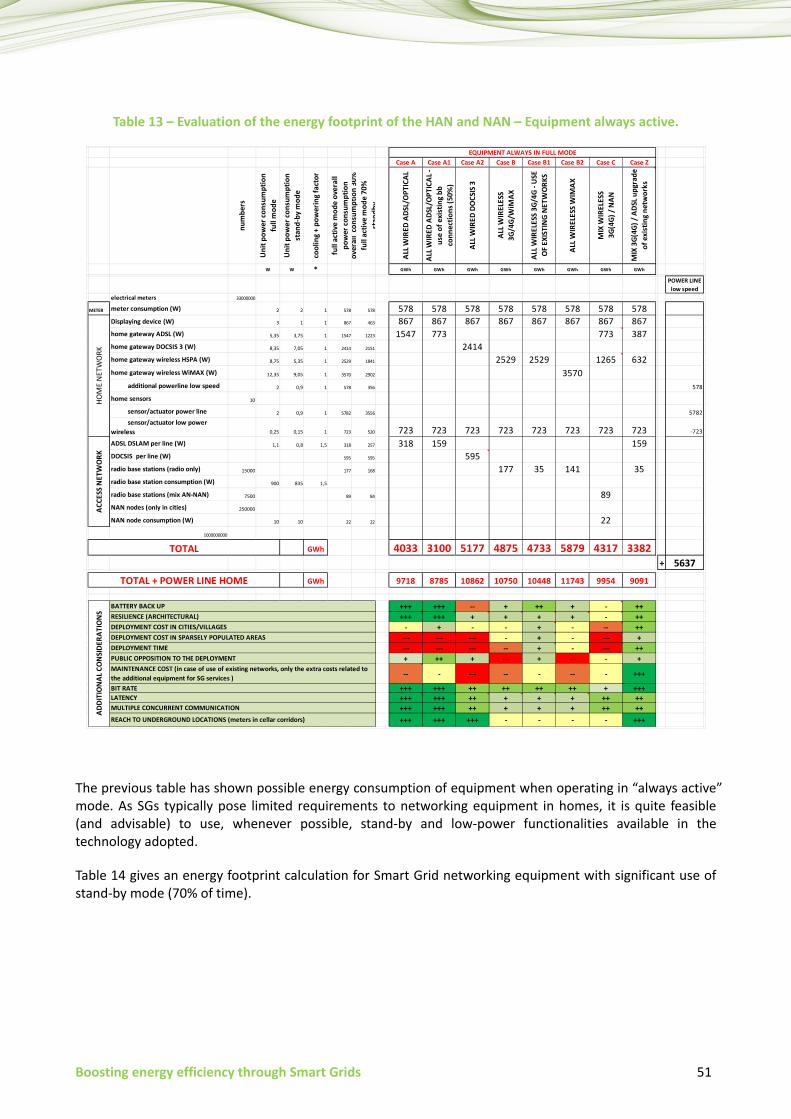
Boosting energy efficiency through Smart Grids 51
Table 13 – Evaluation of the energy footprint of the HAN and NAN – Equipment always active.
The previous table has shown possible energy consumption of equipment when operating in “always active” mode. As SGs typically pose limited requirements to networking equipment in homes, it is quite feasible (and advisable) to use, whenever possible, stand-by and low-power functionalities available in the technology adopted.
Table 14 gives an energy footprint calculation for Smart Grid networking equipment with significant use of stand-by mode (70% of time).
Case A Case A1 Case A2 Case B Case B1 Case B2 Case C Case Z
num
bers
Uni
t pow
er co
nsum
ptio
n fu
ll m
ode
Uni
t pow
er co
nsum
ptio
n st
and-
by m
ode
cool
ing
+ po
wer
ing
fact
or
full
activ
e m
ode
over
all
pow
er co
nsum
ptio
nov
eral
l co
nsum
ptio
n 30
%
full
activ
e m
ode
70%
st
andb
y
ALL W
IRED
ADS
L/O
PTIC
AL
ALL W
IRED
ADS
L/O
PTIC
AL -
use
of e
xist
ing
bb
conn
ectio
ns (5
0%)
ALL W
IRED
DO
CSIS
3
ALL W
IREL
ESS
3G/4
G/W
iMAX
ALL W
IREL
ESS
3G/4
G - U
SE
OF
EXIS
TIN
G N
ETW
ORK
S
ALL W
IREL
ESS
WIM
AX
MIX
WIR
ELES
S 3G
(4G)
/ N
AN
MIX
3G(
4G) /
ADS
L upg
rade
of
exi
stin
g ne
twor
ks
8760 W W * GWh GWh GWh GWh GWh GWh GWh GWh
POWER LINE low speed
electrical meters 33000000
METER meter consumption (W) 2 2 1 578 578 578 578 578 578 578 578 578 578Displaying device (W) 3 1 1 867 463 867 867 867 867 867 867 867 867home gateway ADSL (W) 5,35 3,75 1 1547 1223 1547 773 773 387home gateway DOCSIS 3 (W) 8,35 7,05 1 2414 2151 2414home gateway wireless HSPA (W) 8,75 5,35 1 2529 1841 2529 2529 1265 632home gateway wireless WiMAX (W) 12,35 9,05 1 3570 2902 3570 additional powerline low speed 2 0,9 1 578 356 578
home sensors 10
sensor/actuator power line 2 0,9 1 5782 3556 5782 sensor/actuator low power wireless 0,25 0,15 1 723 520 723 723 723 723 723 723 723 723 -723
ADSL DSLAM per line (W) 1,1 0,8 1,5 318 257 318 159 159DOCSIS per line (W) 595 595 595radio base stations (radio only) 15000 177 168 177 35 141 35radio base station consumption (W) 900 835 1,5
radio base stations (mix AN-NAN) 7500 89 84 89NAN nodes (only in cities) 250000
NAN node consumption (W) 10 10 22 22 221000000000
GWh 4033 3100 5177 4875 4733 5879 4317 3382+ 5637
GWh 9718 8785 10862 10750 10448 11743 9954 9091
+++ +++ -- + ++ + - +++++ +++ + + + + - ++
- + - - + - -- ++--- --- --- - + - --- +--- --- --- -- + - --- +++ ++ + --- + --- - +
-- - --- -- - -- - +++
+++ +++ ++ ++ ++ ++ + ++++++ +++ ++ + + + ++ +++++ +++ ++ + + + ++ +++++ +++ +++ - - - - +++
TOTAL + POWER LINE HOME
EQUIPMENT ALWAYS IN FULL MODE
TOTAL
HOM
E N
ETW
ORK
ACCE
SS N
ETW
ORK
ADDI
TIO
NAL
CO
NSI
DERA
TIO
NS
BATTERY BACK UPRESILIENCE (ARCHITECTURAL)DEPLOYMENT COST IN CITIES/VILLAGESDEPLOYMENT COST IN SPARSELY POPULATED AREASDEPLOYMENT TIMEPUBLIC OPPOSITION TO THE DEPLOYMENTMAINTENANCE COST (in case of use of existing networks, only the extra costs related to the additional equipment for SG services )BIT RATE LATENCYMULTIPLE CONCURRENT COMMUNICATION
REACH TO UNDERGROUND LOCATIONS (meters in cellar corridors)
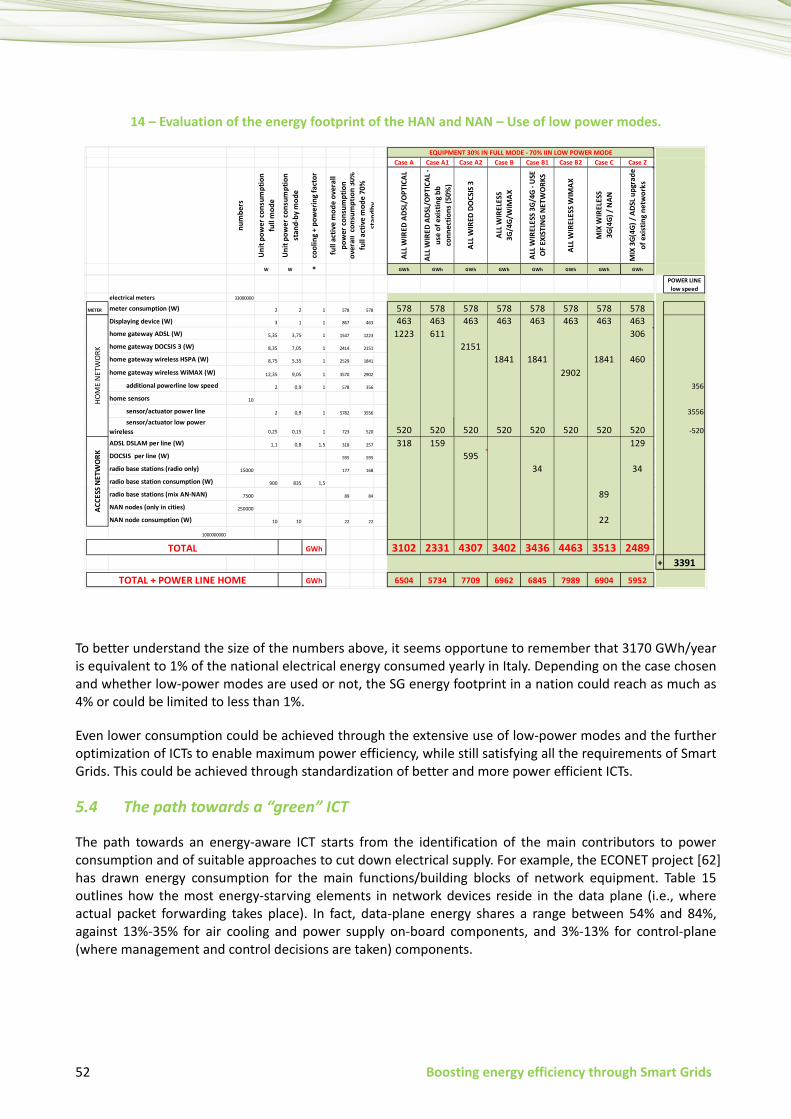
52 Boosting energy efficiency through Smart Grids
14 – Evaluation of the energy footprint of the HAN and NAN – Use of low power modes.
To better understand the size of the numbers above, it seems opportune to remember that 3170 GWh/year is equivalent to 1% of the national electrical energy consumed yearly in Italy. Depending on the case chosen and whether low-power modes are used or not, the SG energy footprint in a nation could reach as much as 4% or could be limited to less than 1%.
Even lower consumption could be achieved through the extensive use of low-power modes and the further optimization of ICTs to enable maximum power efficiency, while still satisfying all the requirements of Smart Grids. This could be achieved through standardization of better and more power efficient ICTs.
5.4 The path towards a “green” ICT
The path towards an energy-aware ICT starts from the identification of the main contributors to power consumption and of suitable approaches to cut down electrical supply. For example, the ECONET project [62] has drawn energy consumption for the main functions/building blocks of network equipment. Table 15 outlines how the most energy-starving elements in network devices reside in the data plane (i.e., where actual packet forwarding takes place). In fact, data-plane energy shares a range between 54% and 84%, against 13%-35% for air cooling and power supply on-board components, and 3%-13% for control-plane (where management and control decisions are taken) components.
Case A Case A1 Case A2 Case B Case B1 Case B2 Case C Case Z
num
bers
Uni
t pow
er co
nsum
ptio
n fu
ll m
ode
Uni
t pow
er co
nsum
ptio
n st
and-
by m
ode
cool
ing
+ po
wer
ing
fact
or
full
activ
e m
ode
over
all
pow
er co
nsum
ptio
nov
era l
l co
nsum
ptio
n 30
%
full
activ
e m
ode
70%
st
andb
y
ALL W
IRED
ADS
L/O
PTIC
AL
ALL W
IRED
ADS
L/O
PTIC
AL -
use
of e
xist
ing
bb
conn
ectio
ns (5
0%)
ALL W
IRED
DO
CSIS
3
ALL W
IREL
ESS
3G/4
G/W
iMAX
ALL W
IREL
ESS
3G/4
G - U
SE
OF
EXIS
TIN
G N
ETW
ORK
S
ALL W
IREL
ESS
WIM
AX
MIX
WIR
ELES
S 3G
(4G)
/ N
AN
MIX
3G(
4G) /
ADS
L upg
rade
of
exi
stin
g ne
twor
ks
8760 W W * GWh GWh GWh GWh GWh GWh GWh GWh
POWER LINE low speed
electrical meters 33000000
METER meter consumption (W) 2 2 1 578 578 578 578 578 578 578 578 578 578Displaying device (W) 3 1 1 867 463 463 463 463 463 463 463 463 463home gateway ADSL (W) 5,35 3,75 1 1547 1223 1223 611 306home gateway DOCSIS 3 (W) 8,35 7,05 1 2414 2151 2151home gateway wireless HSPA (W) 8,75 5,35 1 2529 1841 1841 1841 1841 460home gateway wireless WiMAX (W) 12,35 9,05 1 3570 2902 2902 additional powerline low speed 2 0,9 1 578 356 356home sensors 10
sensor/actuator power line 2 0,9 1 5782 3556 3556 sensor/actuator low power wireless 0,25 0,15 1 723 520 520 520 520 520 520 520 520 520 -520ADSL DSLAM per line (W) 1,1 0,8 1,5 318 257 318 159 129DOCSIS per line (W) 595 595 595radio base stations (radio only) 15000 177 168 34 34radio base station consumption (W) 900 835 1,5
radio base stations (mix AN-NAN) 7500 89 84 89NAN nodes (only in cities) 250000
NAN node consumption (W) 10 10 22 22 221000000000
GWh 3102 2331 4307 3402 3436 4463 3513 2489+ 3391
GWh 6504 5734 7709 6962 6845 7989 6904 5952
EQUIPMENT 30% IN FULL MODE - 70% IIN LOW POWER MODE
TOTAL + POWER LINE HOME
TOTAL
HOM
E N
ETW
ORK
ACCE
SS N
ETW
ORK
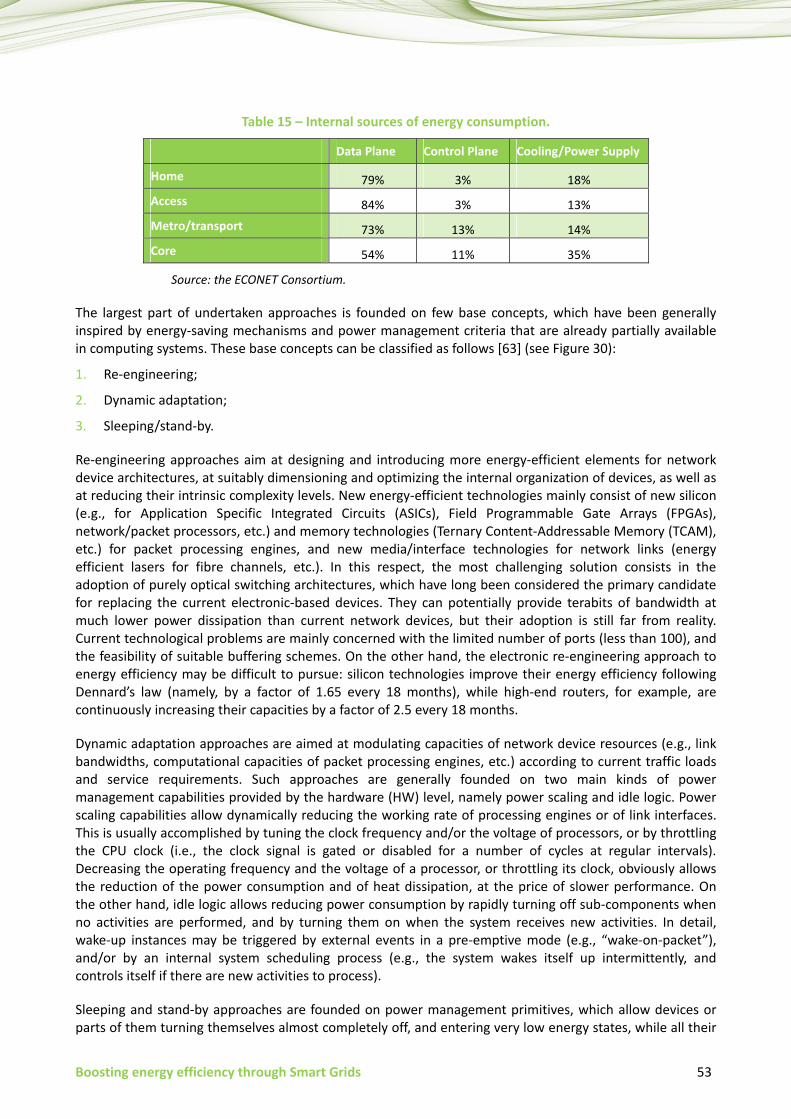
Boosting energy efficiency through Smart Grids 53
Table 15 – Internal sources of energy consumption.
Data Plane Control Plane Cooling/Power Supply
Home 79% 3% 18% Access 84% 3% 13% Metro/transport 73% 13% 14% Core 54% 11% 35%
Source: the ECONET Consortium.
The largest part of undertaken approaches is founded on few base concepts, which have been generally inspired by energy-saving mechanisms and power management criteria that are already partially available in computing systems. These base concepts can be classified as follows [63] (see Figure 30):
1. Re-engineering;
2. Dynamic adaptation;
3. Sleeping/stand-by.
Re-engineering approaches aim at designing and introducing more energy-efficient elements for network device architectures, at suitably dimensioning and optimizing the internal organization of devices, as well as at reducing their intrinsic complexity levels. New energy-efficient technologies mainly consist of new silicon (e.g., for Application Specific Integrated Circuits (ASICs), Field Programmable Gate Arrays (FPGAs), network/packet processors, etc.) and memory technologies (Ternary Content-Addressable Memory (TCAM), etc.) for packet processing engines, and new media/interface technologies for network links (energy efficient lasers for fibre channels, etc.). In this respect, the most challenging solution consists in the adoption of purely optical switching architectures, which have long been considered the primary candidate for replacing the current electronic-based devices. They can potentially provide terabits of bandwidth at much lower power dissipation than current network devices, but their adoption is still far from reality. Current technological problems are mainly concerned with the limited number of ports (less than 100), and the feasibility of suitable buffering schemes. On the other hand, the electronic re-engineering approach to energy efficiency may be difficult to pursue: silicon technologies improve their energy efficiency following Dennard’s law (namely, by a factor of 1.65 every 18 months), while high-end routers, for example, are continuously increasing their capacities by a factor of 2.5 every 18 months.
Dynamic adaptation approaches are aimed at modulating capacities of network device resources (e.g., link bandwidths, computational capacities of packet processing engines, etc.) according to current traffic loads and service requirements. Such approaches are generally founded on two main kinds of power management capabilities provided by the hardware (HW) level, namely power scaling and idle logic. Power scaling capabilities allow dynamically reducing the working rate of processing engines or of link interfaces. This is usually accomplished by tuning the clock frequency and/or the voltage of processors, or by throttling the CPU clock (i.e., the clock signal is gated or disabled for a number of cycles at regular intervals). Decreasing the operating frequency and the voltage of a processor, or throttling its clock, obviously allows the reduction of the power consumption and of heat dissipation, at the price of slower performance. On the other hand, idle logic allows reducing power consumption by rapidly turning off sub-components when no activities are performed, and by turning them on when the system receives new activities. In detail, wake-up instances may be triggered by external events in a pre-emptive mode (e.g., “wake-on-packet”), and/or by an internal system scheduling process (e.g., the system wakes itself up intermittently, and controls itself if there are new activities to process).
Sleeping and stand-by approaches are founded on power management primitives, which allow devices or parts of them turning themselves almost completely off, and entering very low energy states, while all their
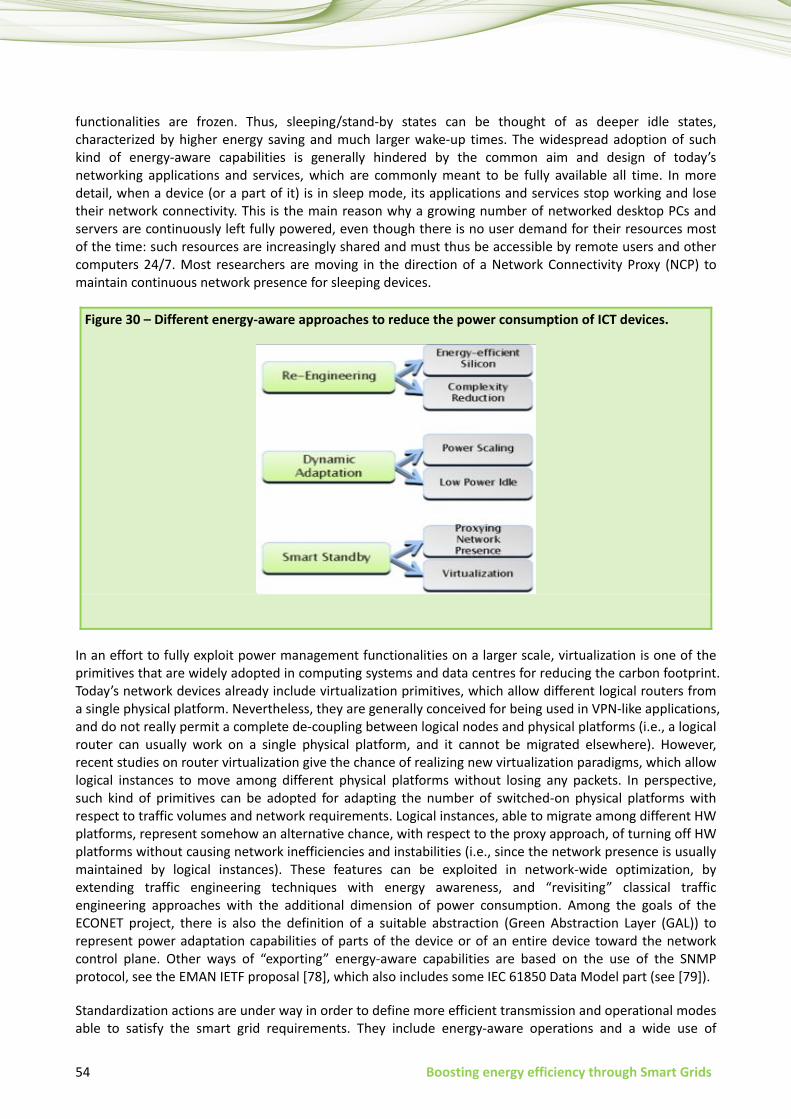
54 Boosting energy efficiency through Smart Grids
functionalities are frozen. Thus, sleeping/stand-by states can be thought of as deeper idle states, characterized by higher energy saving and much larger wake-up times. The widespread adoption of such kind of energy-aware capabilities is generally hindered by the common aim and design of today’s networking applications and services, which are commonly meant to be fully available all time. In more detail, when a device (or a part of it) is in sleep mode, its applications and services stop working and lose their network connectivity. This is the main reason why a growing number of networked desktop PCs and servers are continuously left fully powered, even though there is no user demand for their resources most of the time: such resources are increasingly shared and must thus be accessible by remote users and other computers 24/7. Most researchers are moving in the direction of a Network Connectivity Proxy (NCP) to maintain continuous network presence for sleeping devices.
Figure 30 – Different energy-aware approaches to reduce the power consumption of ICT devices.
In an effort to fully exploit power management functionalities on a larger scale, virtualization is one of the primitives that are widely adopted in computing systems and data centres for reducing the carbon footprint. Today’s network devices already include virtualization primitives, which allow different logical routers from a single physical platform. Nevertheless, they are generally conceived for being used in VPN-like applications, and do not really permit a complete de-coupling between logical nodes and physical platforms (i.e., a logical router can usually work on a single physical platform, and it cannot be migrated elsewhere). However, recent studies on router virtualization give the chance of realizing new virtualization paradigms, which allow logical instances to move among different physical platforms without losing any packets. In perspective, such kind of primitives can be adopted for adapting the number of switched-on physical platforms with respect to traffic volumes and network requirements. Logical instances, able to migrate among different HW platforms, represent somehow an alternative chance, with respect to the proxy approach, of turning off HW platforms without causing network inefficiencies and instabilities (i.e., since the network presence is usually maintained by logical instances). These features can be exploited in network-wide optimization, by extending traffic engineering techniques with energy awareness, and “revisiting” classical traffic engineering approaches with the additional dimension of power consumption. Among the goals of the ECONET project, there is also the definition of a suitable abstraction (Green Abstraction Layer (GAL)) to represent power adaptation capabilities of parts of the device or of an entire device toward the network control plane. Other ways of “exporting” energy-aware capabilities are based on the use of the SNMP protocol, see the EMAN IETF proposal [78], which also includes some IEC 61850 Data Model part (see [79]).
Standardization actions are under way in order to define more efficient transmission and operational modes able to satisfy the smart grid requirements. They include energy-aware operations and a wide use of
Boosting energy efficiency through Smart Grids 55
dynamic low power/stand-by modes. The choice of the architecture and equipment has to be accounted for based on the best balance between performance and energy footprint. It should be noted that ITU-T, through its different study groups (e.g. ITU-T SG13 on Future Networks or ITU-T SG15 on Transport and Access) develops many standards that aim to reduce energy consumption and improve energy efficiency.
6 Service support capabilities, resilience, security and power consumption
The previous analysis has shown that many key issues play an important role in defining the structure and the architectural elements of the telecommunication networks in support of the Smart Grid operations. In taking decisions regarding network deployment, a trade-off should be sought among (at least) the following aspects:
• Performance of information transfer (in terms of throughput, delay, and – in some cases – Quality of Service capabilities);
• Power consumption of the network elements;
• Network resilience and information security;
• Network topology to ensure maximum coverage at minimum cost;
• Deployment costs and constraints of different networking technologies.
If one considers the traditional situation of the electricity distribution network, with HV and MV substations and the LV distribution grid toward customers, the networking hierarchy previously depicted in Figure 18 roughly matches the hierarchy in the electrical system. However, the evolution of the electrical network toward the smart grid introduces a number of elements that impact on the information flow and, consequently, on the underlining ICT infrastructure:
1. As regards electrical generators, we have seen the presence of multiple sources popping up at the network boundaries (e.g., micro-grids, electric vehicles), as well as the increased role of intermittent sources (renewables);
2. In terms of economic information flows to take decisions in a dynamic market, the presence of multiple actors increases the exchange of “vertical” (demand-supply) and “horizontal” (inter-operator) communications;
3. The boost in the amount of metering devices and in “smart” appliances produces a significant amount of information in the reverse direction, from consumers to distributed control and decision-making points.
All this has an impact on the networking infrastructure, in terms of heterogeneity of the different network areas and components, topology, and network federation. Indeed, the differences in the relative densities and numerousness of nodes and devices in the various areas of the electrical network are even more pronounced than in the traditional infrastructure (as absolute densities of devices in some areas – e.g. user premises – are rapidly growing). Moreover, all electrical network areas should be now covered with a correspondingly dense and ubiquitous networking infrastructure to allow the above-mentioned information flows to the extent that is necessary to sustain current and future distributed control of demand and supply.
As already noted in Section 5.3.1, the best communication network deployment would be a combination of ad hoc and existing networks. This, however, should be carefully planned by taking into account considerations on deployment costs, cost of services to be provided by telecom operators, resilience and security, and, last but not least, on the amount of power consumed by the network elements to provide the
56 Boosting energy efficiency through Smart Grids
necessary level of information flow; this power subtracts from the overall gain in power consumed that can be obtained by increasing the efficiency of the electrical network.
In order to wrap up the previous considerations, we briefly examine the alternative choices in the various network segments. In general, however, it must be noted that in all network segments, the ICT technologies deployed in support of the smart grid should be by necessity “green” ones, i.e., they should adopt all available energy-saving techniques at the component, device, and network level, in terms of smart sleeping, dynamic adaptation and virtualization techniques. This includes, in particular, customer access and premises, where smart sleeping strategies can achieve significant improvements, owing to the numerousness of the devices involved.
Indeed, the most challenging aspects concern the management of the huge amount of devices and data stemming from the MV/LV segments and customer premises equipment. The focus of the following subsections is therefore on LV distribution, home/access networks, measurement data collection, and on the higher-level networking paradigms to ensure global connectivity.
6.1 LV distribution, home networks and measurement data collection
We have seen that the number of devices to be networked together, monitored, and somehow linked to the energy management (e.g., by means of incentives in terms of energy pricing, contribution to collect accurate consumption prediction, and so on) in the home is already significant and bound to grow over the next years. This increases the relevance of the customer settings in the overall complex ICT architecture in support of the smart grid. The home gateway to support broadband access needs to be equipped with a growing number of interfaces, and it plays a relevant role in making the telecommunication network energy aware, by the adoption of dynamic power management and smart sleeping techniques.
However, it is not yet clear how and to what extent the home gateway for broadband access should interact with the smart metering and control in support of the smart grid. In particular, the interaction with the already deployed metering devices and with power-line modems has to be assessed and clarified, and the respective levels of integration (or independence) should be defined more precisely. The roles and relative levels of interaction of existing xDSL connections to the home gateway, of energy-aware power-line modems, of wireless home networks and of cellular wireless access must be investigated and assessed also in the light of the new functionalities required for smart grid support.
Even though the ultimate decision on the exploitation of a technology or another may reside also on strictly non-technical considerations, the technical implications of alternatives must be well understood, especially in terms of their potential addition to the carbon footprint.
As regards MV/LV substations, existing wireless connections will not be sufficient to sustain the increased traffic load generated by metering, control and monitoring information flowing among the distributed control infrastructure of the smart grid. They should be upgraded with respect to:
• Availability of 3G (IMT-2000) (and, in perspective, 4G (IMT-Advanced)) cellular wireless services, by relying also on those offered by mobile network operators; ad hoc wireless mesh networks may be an option in some cases with respect to NAN coverage;
• Interworking with the high-speed fixed (fibre) network, again by considering a mixture of proprietary infrastructure by the electrical utilities, where available, and VPN services offered by network operators.
With respect to the first point above, care should be taken in always ensuring the highest possible availability of the telecommunication network in case of power failures. The telecommunication infrastructure will play an increasingly crucial role in the timely reconfiguration of the electrical grid during
Boosting energy efficiency through Smart Grids 57
recovery from such events, and it will allow reducing reconfiguration times to restore a regular operation of the smart grid. In this respect, it should be noted that the level of protection to wireless base stations by battery backup is usually less reliable than that for wire-line networks. Moreover, the deployment of wireless access might in some cases be hindered by the positioning of the electrical substations.
6.2 Higher-level networking infrastructure
Two relevant aspects that emerge from the overall picture of the networking scenario that would be fostered by the smart grid requirements are the increased peer-interactions (p2p-like, to some extent) among information bases and decision centres, which render the infrastructure less hierarchical than in the traditional situation, and the necessity of publish/subscribe (or “push”) – rather than polling/pull – mechanisms at the data collection level.
Even though data aggregation is certainly needed at homes and substations, the data volume to be exchanged among intra- and inter-operator network peer entities is likely to be substantial. Here again, a careful integration of existing private (of the electrical operators) networking facilities and of the transport services offered by telecoms should be planned, in order to optimize the cost-efficiency trade-off – where efficiency must be measured both in terms of performance and energy consumption of the data transfer.
The increased relevance of publish/subscribe services also leads to consider the importance of multicast services at the network level.
7 Smart Grids in different economies
While advanced countries have well-developed modern grids, many others have grids that do not operate consistently over a 24-hour period, and there are still countries which do not have an electricity infrastructure at all. Developing countries and emerging economies are often categorized by high growth in electricity demand, high commercial and technical losses in a context of rapid economic growth and development, dense urban populations and dispersed rural populations. Though these situations present (sometimes formidable) challenges, they should be regarded as opportunities to foster the growth of the electrical network by introducing smart grid infrastructures “from scratch”. The paradigms for this introduction, however, must be reconsidered – and sometimes deeply changed – with respect to the ones adopted in more economically developed countries, to adapt to the specific needs of developing countries, in order to be really effective.
7.1 A picture for emerging and developing countries
Electricity is a key driver for economic development and social wellness. However, there is a large gap about the availability of such kind of energy in different countries around the world. Figure 31 shows that the production of electrical energy in the last 40 years mainly comes from OECD countries15, although the share of China, Asia and Latin America is continuously increasing. Such disparity is also evident in the electrical infrastructures: industrialised nations in North America, Europe and Australia have large grids spanning all over their territory, whereas newly industrialized countries – especially China and India – have spot coverage, and in many developing countries just a very small part of the population has access to the electrical grid [5].
15 The Organisation for Economic Co-operation and Development (OECD) promotes policies that will improve the economic and
social well-being of people around the world. It includes most industrialized countries from Europe, America and Asia. The full list of members is available at: www.oecd.org/pages/0,3417,en_36734052_36761800_1_1_1_1_1,00.html.
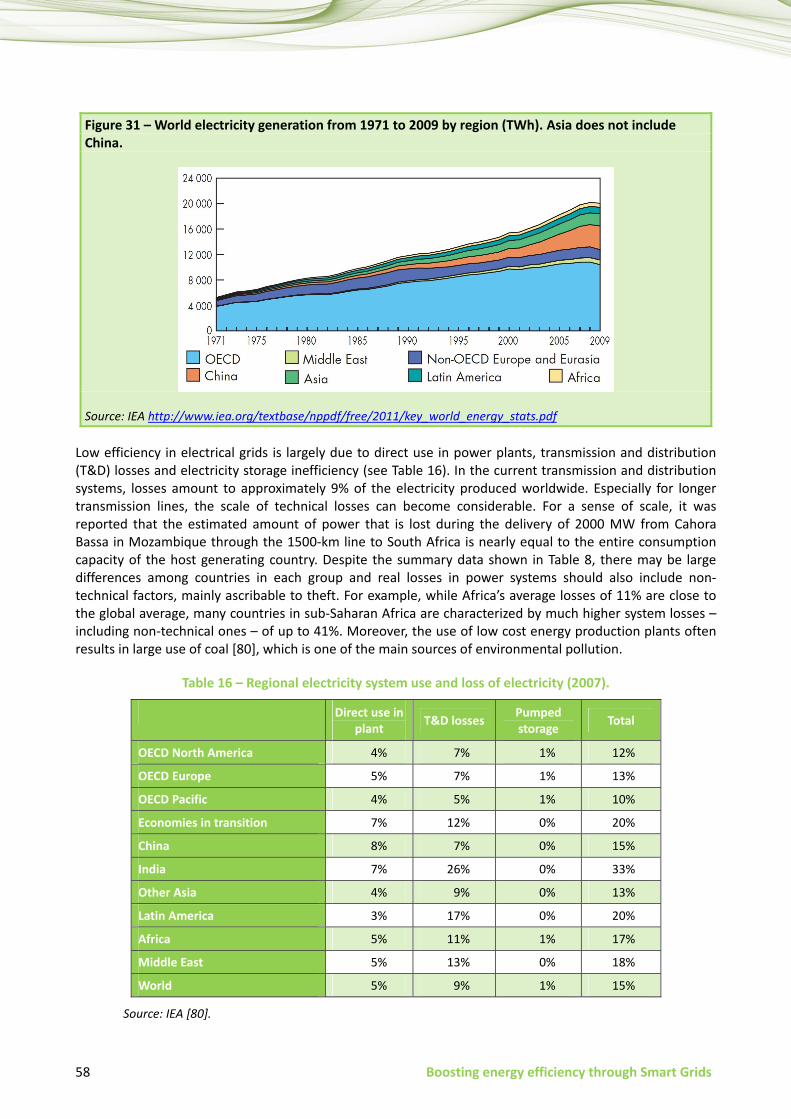
58 Boosting energy efficiency through Smart Grids
Figure 31 – World electricity generation from 1971 to 2009 by region (TWh). Asia does not include China.
Source: IEA http://www.iea.org/textbase/nppdf/free/2011/key_world_energy_stats.pdf
Low efficiency in electrical grids is largely due to direct use in power plants, transmission and distribution (T&D) losses and electricity storage inefficiency (see Table 16). In the current transmission and distribution systems, losses amount to approximately 9% of the electricity produced worldwide. Especially for longer transmission lines, the scale of technical losses can become considerable. For a sense of scale, it was reported that the estimated amount of power that is lost during the delivery of 2000 MW from Cahora Bassa in Mozambique through the 1500-km line to South Africa is nearly equal to the entire consumption capacity of the host generating country. Despite the summary data shown in Table 8, there may be large differences among countries in each group and real losses in power systems should also include non-technical factors, mainly ascribable to theft. For example, while Africa’s average losses of 11% are close to the global average, many countries in sub-Saharan Africa are characterized by much higher system losses – including non-technical ones – of up to 41%. Moreover, the use of low cost energy production plants often results in large use of coal [80], which is one of the main sources of environmental pollution.
Table 16 – Regional electricity system use and loss of electricity (2007).
Direct use in plant T&D losses Pumped
storage Total
OECD North America 4% 7% 1% 12%
OECD Europe 5% 7% 1% 13%
OECD Pacific 4% 5% 1% 10%
Economies in transition 7% 12% 0% 20%
China 8% 7% 0% 15%
India 7% 26% 0% 33%
Other Asia 4% 9% 0% 13%
Latin America 3% 17% 0% 20%
Africa 5% 11% 1% 17%
Middle East 5% 13% 0% 18%
World 5% 9% 1% 15%
Source: IEA [80].
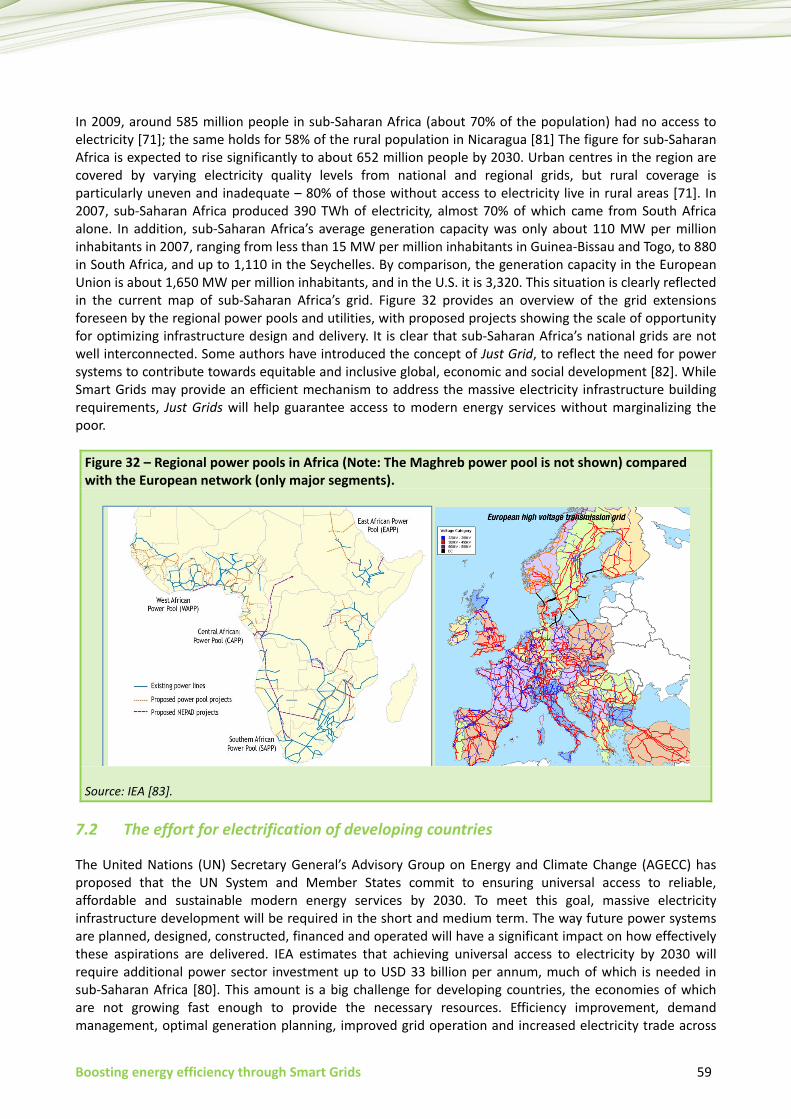
Boosting energy efficiency through Smart Grids 59
In 2009, around 585 million people in sub-Saharan Africa (about 70% of the population) had no access to electricity [71]; the same holds for 58% of the rural population in Nicaragua [81] The figure for sub-Saharan Africa is expected to rise significantly to about 652 million people by 2030. Urban centres in the region are covered by varying electricity quality levels from national and regional grids, but rural coverage is particularly uneven and inadequate – 80% of those without access to electricity live in rural areas [71]. In 2007, sub-Saharan Africa produced 390 TWh of electricity, almost 70% of which came from South Africa alone. In addition, sub-Saharan Africa’s average generation capacity was only about 110 MW per million inhabitants in 2007, ranging from less than 15 MW per million inhabitants in Guinea-Bissau and Togo, to 880 in South Africa, and up to 1,110 in the Seychelles. By comparison, the generation capacity in the European Union is about 1,650 MW per million inhabitants, and in the U.S. it is 3,320. This situation is clearly reflected in the current map of sub-Saharan Africa’s grid. Figure 32 provides an overview of the grid extensions foreseen by the regional power pools and utilities, with proposed projects showing the scale of opportunity for optimizing infrastructure design and delivery. It is clear that sub-Saharan Africa’s national grids are not well interconnected. Some authors have introduced the concept of Just Grid, to reflect the need for power systems to contribute towards equitable and inclusive global, economic and social development [82]. While Smart Grids may provide an efficient mechanism to address the massive electricity infrastructure building requirements, Just Grids will help guarantee access to modern energy services without marginalizing the poor.
Figure 32 – Regional power pools in Africa (Note: The Maghreb power pool is not shown) compared with the European network (only major segments).
Source: IEA [83].
7.2 The effort for electrification of developing countries
The United Nations (UN) Secretary General’s Advisory Group on Energy and Climate Change (AGECC) has proposed that the UN System and Member States commit to ensuring universal access to reliable, affordable and sustainable modern energy services by 2030. To meet this goal, massive electricity infrastructure development will be required in the short and medium term. The way future power systems are planned, designed, constructed, financed and operated will have a significant impact on how effectively these aspirations are delivered. IEA estimates that achieving universal access to electricity by 2030 will require additional power sector investment up to USD 33 billion per annum, much of which is needed in sub-Saharan Africa [80]. This amount is a big challenge for developing countries, the economies of which are not growing fast enough to provide the necessary resources. Efficiency improvement, demand management, optimal generation planning, improved grid operation and increased electricity trade across
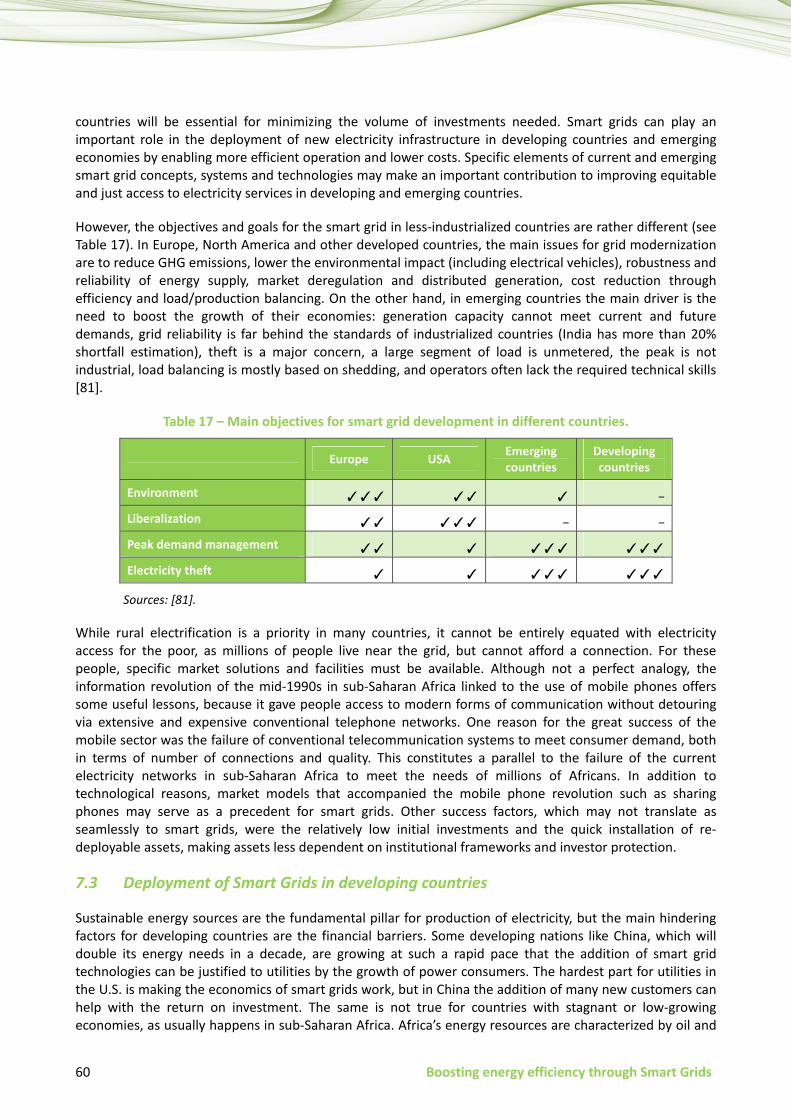
60 Boosting energy efficiency through Smart Grids
countries will be essential for minimizing the volume of investments needed. Smart grids can play an important role in the deployment of new electricity infrastructure in developing countries and emerging economies by enabling more efficient operation and lower costs. Specific elements of current and emerging smart grid concepts, systems and technologies may make an important contribution to improving equitable and just access to electricity services in developing and emerging countries.
However, the objectives and goals for the smart grid in less-industrialized countries are rather different (see Table 17). In Europe, North America and other developed countries, the main issues for grid modernization are to reduce GHG emissions, lower the environmental impact (including electrical vehicles), robustness and reliability of energy supply, market deregulation and distributed generation, cost reduction through efficiency and load/production balancing. On the other hand, in emerging countries the main driver is the need to boost the growth of their economies: generation capacity cannot meet current and future demands, grid reliability is far behind the standards of industrialized countries (India has more than 20% shortfall estimation), theft is a major concern, a large segment of load is unmetered, the peak is not industrial, load balancing is mostly based on shedding, and operators often lack the required technical skills [81].
Table 17 – Main objectives for smart grid development in different countries.
Europe USA Emerging countries
Developing countries
Environment ✓✓✓ ✓✓ ✓ −
Liberalization ✓✓ ✓✓✓ − −
Peak demand management ✓✓ ✓ ✓✓✓ ✓✓✓
Electricity theft ✓ ✓ ✓✓✓ ✓✓✓
Sources: [81].
While rural electrification is a priority in many countries, it cannot be entirely equated with electricity access for the poor, as millions of people live near the grid, but cannot afford a connection. For these people, specific market solutions and facilities must be available. Although not a perfect analogy, the information revolution of the mid-1990s in sub-Saharan Africa linked to the use of mobile phones offers some useful lessons, because it gave people access to modern forms of communication without detouring via extensive and expensive conventional telephone networks. One reason for the great success of the mobile sector was the failure of conventional telecommunication systems to meet consumer demand, both in terms of number of connections and quality. This constitutes a parallel to the failure of the current electricity networks in sub-Saharan Africa to meet the needs of millions of Africans. In addition to technological reasons, market models that accompanied the mobile phone revolution such as sharing phones may serve as a precedent for smart grids. Other success factors, which may not translate as seamlessly to smart grids, were the relatively low initial investments and the quick installation of re-deployable assets, making assets less dependent on institutional frameworks and investor protection.
7.3 Deployment of Smart Grids in developing countries
Sustainable energy sources are the fundamental pillar for production of electricity, but the main hindering factors for developing countries are the financial barriers. Some developing nations like China, which will double its energy needs in a decade, are growing at such a rapid pace that the addition of smart grid technologies can be justified to utilities by the growth of power consumers. The hardest part for utilities in the U.S. is making the economics of smart grids work, but in China the addition of many new customers can help with the return on investment. The same is not true for countries with stagnant or low-growing economies, as usually happens in sub-Saharan Africa. Africa’s energy resources are characterized by oil and

Boosting energy efficiency through Smart Grids 61
gas reserves (North and West), hydroelectric potential (Centre and East), and coal (South). Hydropower in sub-Saharan Africa currently accounts for 45% of sub-Saharan Africa’s electricity power generation, which represents only a fraction of the enormous commercially exploitable potential. In addition, sub-Saharan Africa has abundant solar potential. This has been recognized by the Desertec Foundation16, fostering the vision of a sustainable energy supply from the deserts all over the world. The exploitation of such resources would require huge investments on power plants and electrification of the territory, but low and long-term incomes, mostly subjected to the growing of the economy and wealth of the population. Such perspective inevitably discourages any effort in this direction. However, decentralized power, often based on renewable energy sources, is likely to be an important component of any significant expansion in electricity access, especially for rural and remote areas.
One of the main hindrances to the adoption of renewable generators is the larger investment cost with respect to fossil plants. Taking into account a small plant, a diesel generator requires much less initial investment than a photovoltaic installation, although it becomes more expensive in the long term (see Figure 33). However, in many developing countries, the initial investment is the main barrier and this may hinder the widespread use of renewables [5].
Mini and especially micro-grids with high shares of renewable energy are generally complex to implement, primarily because of fluctuating generation and a low-load factor. The task of maintaining adequate power quality becomes a challenge, for example, due to spikes associated with the starting current of motor loads or the need to provide some form of backup power. Smart components can help cushion such effects and better balance the overall system, through integrating new demand side management options. The costs of such systems may be further cut down through the implementation of (DC) micro-grids, especially when combined with photovoltaic generation. While losses can be reduced through saving layers of DC/AC power conversion, the more expensive protective devices required for fault management and control, such as coordinated power converters, add complexity and outweigh some of the potential saving. Local charging stations may contribute to balance supply and demand in micro-grids. They ensure a minimum level of access to electricity services to people that cannot afford the connection to the grid, for charging lanterns or batteries to power their radio or TV. Elaborating a successful business model for battery charging services at these stations may further contribute to increased power quality and reliability in mini-grids, by compensating power flow and voltage fluctuations17. Furthermore, charging prepaid consumption credits via mobile phones using scratch cards or comparable devices may help address the specific needs of the poor and reduce administrative costs related to meter readings and billing18.
Small “remote” systems – not connected to a centralized electricity infrastructure and initially employed as a cost-effective approach to rural electrification – could later be connected easily to a national or regional infrastructure. As a means to access electricity in sparsely populated areas, smart grids could enable a transition from simple, one-off approaches to electrification to community grids that can then connect to national and regional grids. Some authors even regard grand infrastructure plans to link up the African continent’s power grids as obsolete in the age of smart grids; some aspects of this view are mirrored also for the U.S. However, high capacity transmission corridors are still necessary to trade electricity among countries and to balance the intermittent generation from renewables in different areas. One of the main concerns with large grids is that a failure of a single component may cause a chain reaction in the whole system; a demand greater than supply may easily bring to a complete blackout.
16 www.desertec.org/. 17 This model would need to cover the logistics of battery ownership, management and charging. 18 Botswana and other countries were already using prepaid meters in the 1980s.
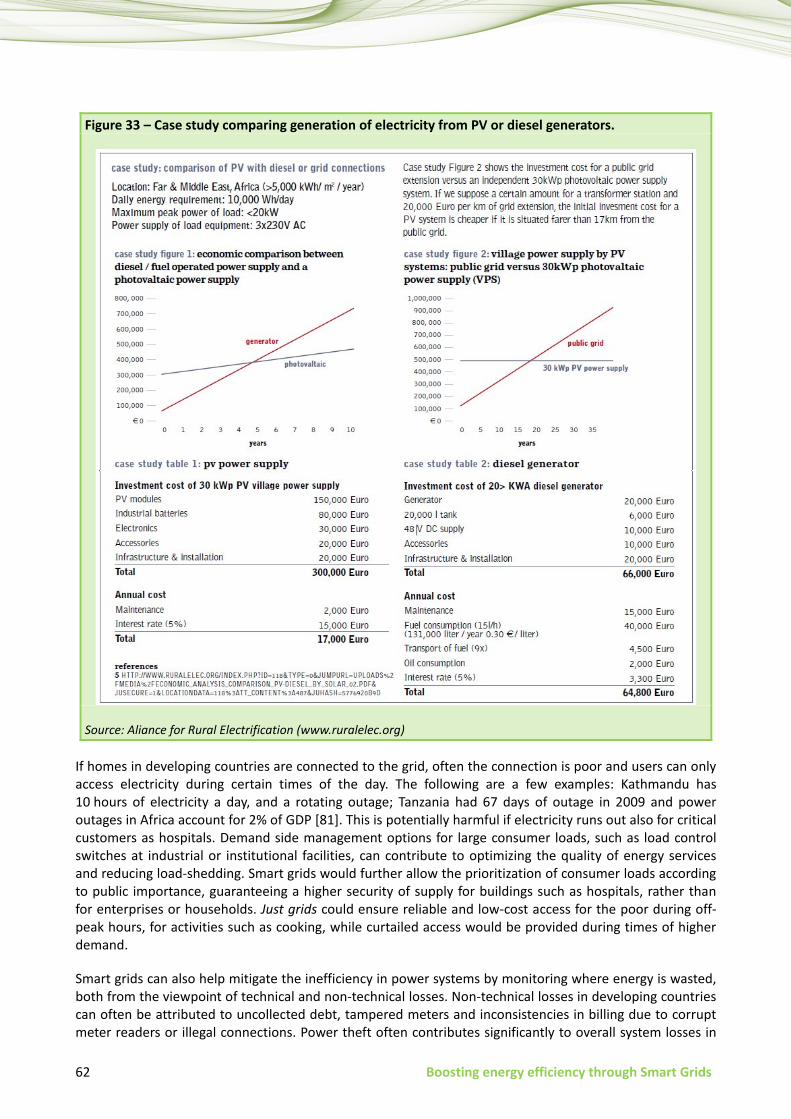
62 Boosting energy efficiency through Smart Grids
Figure 33 – Case study comparing generation of electricity from PV or diesel generators.
Source: Aliance for Rural Electrification (www.ruralelec.org)
If homes in developing countries are connected to the grid, often the connection is poor and users can only access electricity during certain times of the day. The following are a few examples: Kathmandu has 10 hours of electricity a day, and a rotating outage; Tanzania had 67 days of outage in 2009 and power outages in Africa account for 2% of GDP [81]. This is potentially harmful if electricity runs out also for critical customers as hospitals. Demand side management options for large consumer loads, such as load control switches at industrial or institutional facilities, can contribute to optimizing the quality of energy services and reducing load-shedding. Smart grids would further allow the prioritization of consumer loads according to public importance, guaranteeing a higher security of supply for buildings such as hospitals, rather than for enterprises or households. Just grids could ensure reliable and low-cost access for the poor during off-peak hours, for activities such as cooking, while curtailed access would be provided during times of higher demand.
Smart grids can also help mitigate the inefficiency in power systems by monitoring where energy is wasted, both from the viewpoint of technical and non-technical losses. Non-technical losses in developing countries can often be attributed to uncollected debt, tampered meters and inconsistencies in billing due to corrupt meter readers or illegal connections. Power theft often contributes significantly to overall system losses in

Boosting energy efficiency through Smart Grids 63
developing countries, reducing the economic performance of utilities. They account for power losses between 15-25% in India, 15% in South Africa, 20% in Nicaragua; the main implications are financial losses for utilities, network instability and higher costs for honest customers [81]. High-voltage distribution lines can help prevent illegal connections and improve power quality and reliability. A smart metering infrastructure can help reduce further theft. Additionally, meter-based tariffs incentivise an efficient use of electricity, which can result in considerable load reduction.
7.4 Policy considerations
Some of the well-known and emerging concepts, systems and technologies of smart grids may offer an important contribution to universal access to electricity in developing countries. However, given their specific needs, it is obvious that a smart grid approach for these regions cannot simply be a copy of practices in industrialized countries: the starting point, challenges and opportunities are also different. Indeed, the smart grid concept should be redefined to include the just grids meaning.
“Just access” can foster universal access to electricity in multiple ways. It encourages tapping-off electricity from larger grid extension projects – often driven by large consumers – to local under-served customers en-route; it can help cope with the fluctuating supply and demand in rural areas and increase supply quality by means of strategic load control and management; it shifts the focus on accessing key electricity services, rather than on providing access to electricity in general; it can expand service delivery under constrained resources by means of more efficient supply and use, and by creating incentives for utilities through more effective payment disciplines.
“Just billing and subsidies” creates flexible tariff structures and payment schemes to ensure affordable and sustainable access to electricity services. These can be achieved by lowering the prices of electricity services, which would be possible due to optimized utilization, electricity market segmentation according to reliability and quality requirements, minimization of losses allowed by smart appliances, and cost-effective integration of renewable energy. Moreover, smart billing for “basic” services (e.g., food refrigeration) and fostering productive uses of electricity can help even low-income customers cope with their payments.
There is clearly a vast array of smart grid elements available to support that enhanced concept. They are not all immediately relevant, however, and some are either not developed enough or too expensive to be usefully deployed in developing countries in the short to the medium term. Incorporating promising elements of future smart and just grids will require more than improved functionality, as has been observed with the adoption of other disruptive innovations.
The opportunity for smart and just grids to leapfrog traditional power systems may mean that they can offer even more exciting opportunities to developing countries than to industrialized countries. Avoiding technology lock-in will be crucial, as the economic lifetime of electric power equipment can be longer than 50 years. Thus, the faster the transition to the required enabling environment, the better.
The present regulation often rewards utilities for delivering network primary assets rather than improving performance through more sophisticated management and advanced network technologies. While the costs for massively upgrading existing grids to smart grids may not be justifiable, the business case when investing in new infrastructure is significantly better, offering significant potential opportunities for developing countries. The cost of smart grids may be lower than that of conventional grids, owing to savings in infrastructure costs – which can derive from an optimized network deployment, new job opportunities and industry development, increased energy efficiency, and better utilities’ revenues from carefully tailored billing and accountability.
The deployment of smart grids for developing countries will require proven technical solutions, harmonized regulatory and commercial frameworks, shared technical standards and protocols, and supportive ICT
64 Boosting energy efficiency through Smart Grids
systems. An important aspect is the development of proper technical skills to implement and manage the complex technologies involved and the enabling environments, and to fully demonstrate the benefits of smart and just grids.
Finally there is an inherent risk for developing and emerging economies to be used by industrialized countries to exploit natural resources (e.g., via super-grids), without envisaging any clear benefits for local development. An example is high voltage direct current (HVDC) lines to integrate renewable energy from North African countries into the European power system, which is the subject of current discussions on modern grid investments in Africa. It is unclear to what extent the underserved in Africa will profit from such initiatives. International organizations should monitor such smart grid projects and ensure they are really targeting equitable and inclusive global economic and social development.
7.4.1 Supporting telecommunication networks
Undoubtedly, smart and just grid deployment in developing countries should be accompanied, wherever possible, by a deployment of supporting telecommunication networks. On the other hand, whenever it would be unfeasible to achieve this with the same telecommunication infrastructure as in developed countries – as may happen in quite a few situations – what are the possible alternatives?
In such situations, it is envisioned a specific role mainly for a limited number of technologies:
• Cellular wireless networking has become in many cases the main telecom infrastructure in developing countries. It is therefore reasonable to exploit it to the maximum possible extent in the support of smart grid development. As it was already noted, in such countries, the failure of existing conventional telecommunication systems to meet consumer demand, both in terms of the number and quality of connections, has fostered the success of wireless mobile networks. Building on the already deployed wireless infrastructure, by adding the components and functionalities needed for smart grid support, may be more cost-effective and energy-efficient than setting up dedicated wire-line networking solutions, especially in rural areas.
• A specific role could be played here by satellite communications, which has already proved an effective solution for the diffusion of services based on broadcasting, such as television and distance learning applications. The availability of DVB-S2 RCS and of integrated communication and navigation services, together with relatively low-cost earth stations, allows envisioning bidirectional satellite communications where no other existing option could be viable. Both geostationary satellites and mobile medium and low earth orbit constellations can provide services for SCADA and sensor network connectivity, monitoring, and protection of critical infrastructures. Interworking between wireless mesh networks and satellite components is another interesting option.
• In more densely populated areas, the role of opportunistic networking should also be considered, even though it raises additional problems and concerns with respect to privacy and security. Ad hoc opportunistic networks may help gather sensor data “on the fly”; even though subject to disruption – and therefore requiring DTN (Delay Tolerant Networks) capabilities – they may be a valid complement to other systems.
Boosting energy efficiency through Smart Grids 65
8 A different perspective, or the impact of the Smart Grid on ICT
It is worth noting that there is a mutual two-way influence between the energy smart grid and the ICT sector in general:
• ICT is a necessary condition for the realization of smart grid functionalities.
• on the other hand, a. ICT deployment in support of smart grids forces to reconsider energy-awareness of ICT devices,
especially where large numbers of devices are involved (access network, inside home, AMI) [76], [53], [59].
b. an increased smartness on the part of the electrical grid allows greater flexibility in the energy aware resource allocation for the ICT sector; for example, in: o the choice of ”green” data centres (e.g., those utilizing renewable power sources [84]); o the introduction of faster dynamics in the energy price range (e.g., energy-price-aware
(routing) [85].
Thus, it can be stated that the Smart Grid has also a non-negligible potential impact on the energy efficiency and awareness of the ICT sector. As regards point a) mentioned above with respect to this influence, it would be indeed odd that part of the energy saved in production and distribution due to the unprecedented level of information and control made available by ICT application in the energy sector (ICT enabling the Smart Grid) would be wasted in energy-inefficient ICT equipment.
The two examples related to point b) are strictly connected with increased flexibility in energy provisioning and with the increased amount of real-time information available, respectively.
The awareness of where the energy is produced allows taking informed decisions as to where to perform computation-intensive tasks, which can be highly power-demanding. To quote a specific case, one of the most challenging e-Science developments of this decade, the Square Kilometre Array (SKA) [86] has committed itself to the use of green energy for two main reasons: i) the fact that the radio-telescope antennas that form the array will be located in secluded areas on the planet; ii) the impact that such a commitment will have at the social level with respect to the general acceptance of the realization of this extremely costly scientific enterprise. However, the enormous amount of computation required by the analysis of data generated by the astronomic observations of SKA should obviously follow the same commitment, even though it will be based on distributed computing systems over cloud computing facilities. The enhancements in smart grid deployment that should be available at the time the SKA would be in operation will allow the conscious choice of computational facilities to comply with such a commitment.
Dynamic energy pricing will also be fostered by the much more dynamic electrical energy market enabled by the Smart Grid. Here again, the impact on ICT would be significant, allowing the network to be aware of the most economic (in terms of energy) computing facilities at a certain instant that are compatible with given performance requirements and of the most economic network paths for the necessary data transfers to reach them.
66 Boosting energy efficiency through Smart Grids
9 Key issues, challenges and opportunities
Smart Grids development is definitely a priority, as it represents one of the important solutions against climate change and GHG emissions. This process will require huge deployment of ICT technologies to bring more interactivity and smartness into the legacy electrical grid. However, there are a number of issues, challenges and opportunities concerning this evolution.
Currently, there are several protocols, architectures and communication technologies that could match the requirements of SG as discussed in Chapter 4. They range from the use of the present solutions and infrastructures to the creation of ad hoc ones. However, there are a number of issues that are often under-estimated and that could hinder the effectiveness of the SG deployment and service.
Sections 4.3.1 and 4.3.2 discussed the need of distributed services and applications, data models and information exchange. Modern paradigms often rely on rich and flexible data description and transmission, but do not take sufficient consideration of the possible drawbacks of such an approach. Flexible and holistic data representation means large amounts of information to be acquired, transmitted, processed and stored. This may result into major transmission delays, network load and latency. Those elements could lead to unacceptable performance for time-critical applications (i.e., those related to grid control, safety and reliability), forcing the deployment of new and expensive infrastructures and delaying SG implementation.
The Access segment will be the most critical aspect of network infrastructure. SGs will need to connect all and each node/end customer, despite their location. Wire-line cabling offers higher performance (in terms of bandwidth, delay, security, etc.) but it might not be convenient in remote areas; on the other hand, wireless technologies provide cost-effective solutions to connect thousands of users, yet with worse performance and some limitations to reach underground installations (e.g. MV/LV substations and the electrical meters are often found underground and in cellars in high-rise buildings). The use of wireless transmission systems working on unlicensed band (e.g., WiFi) could be very critical, as it is not dependable, being much more prone to interference from other devices.
Survivability of the telecommunication network to blackouts is essential in order to enable automatic and prompt recovery from failures of the electrical grid, as the network carries both signalling and control to this purpose. Currently, such survivability is guaranteed through back-up batteries and diesel generators that, in wire-line central offices, are typically rated to survive a blackout of many hours (or even a day), while the back-up for radio base stations is normally limited by technical (space), economical (high number of sites and maintenance costs), and environmental factors (accessibility, temperature and permissions to install noisy equipment).
ICT will enable SG implementation, but its energy footprint has to be carefully taken into account while evaluating the overall system efficiency. This is most critical where the number of elements and installations is large, for home networks and MV/LV substations. These considerations should be taken into account when evaluating the opportunity whether to leverage on the existing ICT infrastructure or to deploy a new one. The former allows optimizing costs and speeding-up the deployment of SGs, whereas the latter allows considering also novel solutions tailored to the specific requirements, even if the huge investments needed to achieve carrier-grade services should be accounted for in the business case evaluation.
The design of the ICT infrastructure should be compliant with the SG principles of efficiency, for transmission systems, devices, protocols and architecture. As discussed in section 5.4, such a design should include several approaches, as hardware re-engineering, dynamic performance adaptation and sleeping/stand-by states. For example, the ECONET project [62] targeted several gains from the efficient technology developments: up to 85% by stand-by mechanisms, 50% by performance scaling, 20% by network-wide control and 15% by air cooling/power supply.
Boosting energy efficiency through Smart Grids 67
Any technical/architectural choice involving the customer should also be socially responsible, and avoid putting the customer under unnecessary energy burden. First evaluations (see 5.3.2) show that a minimal additional infrastructure at home could result into additional energy consumption as high as 7%.
Another social aspect that concerns developing countries is that the electricity supply may be often unreliable, discontinuous or simply not present, and only a limited part of the population has access to it. Smart Grids could represent a unique opportunity for their electrification through the creation of micro-grids, the large integration of renewable sources and the peculiar capability of the SG to conjugate dynamically the energy demand to the offer. This is of particular importance in areas where energy availability is an issue.
10 Conclusions
This report is part of ITU-T’s activities on ICT and Climate Change and has been commissioned by ITU in support of “International Year for Sustainable Energy for All”.
This report has addressed the role of ICT technologies in the perspective of climate change. In particular, two aspects have been discussed. First, the importance of ICT for building smart grids pursuing energy efficiency and sustainability in the mid/long term: the improvement of the current electrical system is a fundamental pillar to cut off greenhouse gas emissions. Second, the trade-off between energy saving achievable with ICT infrastructures and the energy consumption of such installations should be carefully optimized to avoid wasting part of the benefits.
The short review about the main functions and components in the smart grid has clearly pointed out the need for reliable, secure and timely communication and data exchange. This aspect poses great challenges in evolving from the current control and protection systems deployed in energy grids to new communication frameworks tailored to the requirements of smart grids. Despite the large number of studies concerning the identification of such requirements and the inventory of available standards and technologies, there is currently no definitive agreement about common reference architecture. Furthermore, all these activities have mainly considered data abstraction, representation and aggregation, communication paradigms, distributed services and applications, network topologies, performance requirements and link layer technologies; none of them seems to care about the power consumption of ICT devices.
The energy footprint of existing ICT devices is non-negligible, especially in homes, and it is expected to grow over the next years. The additional deployment of sensors, networking equipment, computing and rendering devices would just raise future energy requirements. At the scale of a nation, the huge number of such installations boosts very few additional watts in each home to amounts equivalent to the energy produced by several mid-size power plants (several TWh per year). The communication infrastructure for smart grids too is prone to a boost; a rough computation taking as reference a standard telecommunication infrastructure shows it could take hundreds of GWh per year. Several techniques are under study to lower the consumption of ICT devices, based on three main statements: silicon efficiency grows about half the rate of the capacity of new devices, power consumption does not linearly follow computational load, devices are often “on” just to maintain their presence in the network.
It is also worth considering that the huge set of energy storage available in the Telecom sites (Data Centres, telecom plants, Radio Base Stations, active cabinets, ...) could play an important role in enabling early and cost effective supply of ancillary services to the electric grid, to increase its stability and maximizing the use of renewable sources. This function of energy service provider could represent both a new business opportunity for Telecom Operators and a meaningful example of synergy between the electrical and the ICT worlds.

68 Boosting energy efficiency through Smart Grids
The main outcome of this report is quite evident: the design of the communication architecture for smart grids should find the optimal trade-off among performance, redundancy, reliability and energy efficiency. To this aim, standard directives are needed to provide design guidelines and power-saving requirements for next-generation ICT devices and installations. This task should be developed by ITU-T through its Joint Coordination Activity on Smart Grid and Home Networking in cooperation with the major standardization bodies in the ICT and electrical fields. The energy efficiency of ICT and the climate change aspects (contribution to GHG emission, electromagnetic effect, e-waste) suggest the strong involvement of ITU-T Study Group 5 in the development of the needed specifications for the deployment of effective and efficient smart grids.
Table 18 – ITU-T Study Group 5 “Environment and Climate Change”.
Within the ITU’s Telecommunication Standardization Sector, Study Group 5 (SG5) “Environment and Climate Change” is responsible for studying ICT environmental aspects of electromagnetic phenomena and climate change. • Q 17/5- Energy efficiency for ICT equipment and climate change standards harmonization • Q 18/5 – Methodology of environmental impact assessment of ICT • Q 19/5 – Power feeding systems • Q 21/5 – Environmental protection and recycling of ICT equipment/facilities • Q 22/5 – Setting up a low cost sustainable telecommunication infrastructure for rural communications in
developing countries • Q 23/5 – Using ICTs to enable countries to adapt to climate change
More information can be found at: www.itu.int/ITU-T/studygroups/com05/index.asp
Boosting energy efficiency through Smart Grids 69
Bibliography [1] K. A. Baumert, T. Herzog, J. Pershing, “Navigating the numbers: Greenhouse gas data and international
climate policy”, World Resources Institute, Report, December 2005, ISBN: 1-56973-599-9. [Online]. Available: http://pdf.wri.org/navigating_numbers.pdf.
[2] M.G. den Elzen, M. Meinshausen, 2005, Meeting the EU 2°C Climate Target: Global and Regional Emissions Implications, Bilthoven: The Netherlands Environmental Assessment Agency.
[3] E. M. Lightner, S. E. Widergren, “An orderly transition to a transformed electricity system”, IEEE Transactions on Smart Grid, vol. 1, no. 1, pp. 3-10, June 2010.
[4] R. Fioravanti, K. Vu, W. Stadlin, “Large-Scale Solutions. Storage, Renewables, and Wholesale Markets”, IEEE Power and Energy Magazine, July/August 2009, pp. 48-57.
[5] T. Ackermann, E. Tröster, R. Short, S. Teske, “Renewables 24/7 – Infrastructure needed to save the climate”, Report, Greenpeace International, European Renewable Energy Council (EREC), November 2009. [Online]. Available: www.greenpeace.org/international/Global/international/planet-2/report/2010/2/renewables-24-7.pdf.
[6] “SMART 2020: Enabling the low carbon economy in the information age”, A report by The Climate Group on behalf of the Global eSustainability Initiative (GeSI). [Online] Available: www.gesi.org/LinkClick.aspx?fileticket=tbp5WRTHUoY%3d&tabid=60.
[7] “A European strategy for sustainable, competitive and secure energy”, Green paper of the Commission of the European Communities, March 2003, COM (2006) 105 final. [Online]. Available: http://eur-lex.europa.eu/LexUriServ/LexUriServ.do?uri=COM:2006:0105:FIN:EN:PDF.
[8] www.desertec.org.
[9] P. Rowles, “Demand response and demand side management. What’s the difference?” web page, February 2010. [Online]. Available: www.energyadvantage.com/blog/2010/02/demand-response-demand-side-management-what's-difference/
[10] “The birth of a EUropean Distributed EnErgy Partnership that will help the large scale implementation of distributed energy resources in Europe (EU-DEEP)”, Research Project, 2004–2009, EC project reference: 503516. [Online]. Available: www.eudeep.com.
[11] “Flexible Electricity Networks to Integrate the ‘eXpected ‘energy evolution’ (fenix)”, Research Project, 2005–2009, EC project reference: 518272. [Online]. Available: www.fenix-project.org.
[12] www.majoreconomiesforum.org.
[13] www.cleanenergyministerial.org
[14] “Energy 2020 – A strategy for competitive, sustainable and secure energy”, Communication from the Commission to the European Parliament, the Council, the European Economic and Social Committee and the Committee of the Regions, November 2010, COM(2010) 639 final. [Online]. Available: www.energy.eu/directives/com-2010-0639.pdf.
[15] “Strategic Energy Technology Plan (SET Plan)”, web site. [Online]. Available: http://ec.europa.eu/energy/technology/set plan/set plan en.htm.
[16] “Towards a European strategic energy technology plan”, Communication from the Commission to the Council, the European Parliament, the European economic and social Committee and the Committee of the regions, January 2007, COM (2006) 847 final. [Online]. Available: http://eur-lex.europa.eu/LexUriServ/LexUriServ.do?uri=COM:2006:0847:FIN:EN:PDF.
[17] “The European Strategic Energy Technology Plan SET-Plan – Towards a low-carbon future”, Publications Office of the European Union, 2010. [Online]. Available: http://ec.europa.eu/energy/technology/set plan/doc/setplan brochure.pdf.
70 Boosting energy efficiency through Smart Grids
[18] “The EU climate and energy package”, web site, October 2010. [Online]. Available: http://ec.europa.eu/clima/policies/package/index en.htm.
[19] “Directive 2009/28/EC of the European parliament and the council”, Official Journal of the European Union, April 2009, article 16.
[20] “Directive 2009/72/EC of the European parliament and the council”, Official Journal of the European Union, July 2009, annex 1.
[21] “Directive 2009/73/EC of the European parliament and the council”, Official Journal of the European Union, July 2009, annex 1.
[22] “Directive 2010/31/EC of the European parliament and the council”, Official Journal of the European Union, June 2010, article 8.
[23] “Blueprint for a secure energy future”, White House document, March 2011. [Online]. Available: www.whitehouse.gov/sites/default/files/blueprint secure energy future.pdf.
[24] CEN, CENELEC and ETSI, “Final report of the CEN/CENELEC/ETSI Joint Working Group on standards for smart grids”, May 2011. [Online]. Available: ftp://ftp.cen.eu/CEN/Sectors/List/Energy/SmartGrids/SmartGridFinalReport.pdf.
[25] “NIST framework and roadmap for smart grid interoperability standards”, NIST Special Publication 1108, Office of the National Coordinator for Smart Grid Interoperability, January 2010, release 1.0. [Online]. Available: www.nist.gov/public_affairs/releases/upload/smartgrid_interoperability_final.pdf.
[26] “IEC smart grid standardization roadmap”, June 2010, edition 1.0. [Online]. Available: www.iec.ch/smartgrid/downloads/sg3 _roadmap.pdf.
[27] R. Gustavsson, B. Ståhl, “ICT support for control and coordination”, INTEGRAL project, Deliverable 3.1, September 2008. [Online]. Available: www.integral-eu.com/fileadmin/user upload/downloads/Deliverables/D3.1 final.pdf.
[28] A. van der Welle, C. Kolokathis, J. Jansen, C. Madina, A. Diaz, “Financial and socio-economic impacts of embracing the Fenix concept”, Fenix project, Deliverable 3.3, September 2009. [Online]. Available: http://fenix.iwes.fraunhofer.de/docs/documents/Project_Fenix_2009-12-08_FINANCIAL_AND_SOCIO-ECONOMIC_IMPACTS_OF_EMBRACING_THE_FENIX_CONCEPT_Jaap_Jansen_v1.pdf.
[29] R. Gustavsson, “Sustainable virtual utilities based on microgrids”, Journal of Systemics, Cybernetics and Informatics, vol. 6, no. 5, pp. 53-58, 2008.
[30] “Advanced architectures and control concepts for more microgrids” Project, 2009, Executive Summary Report – Final Results. [Online]. Available: www.microgrids.eu/documents/esr.pdf.
[31] A. Armenia, J. H. Chow, “A flexible data concentrator design leveraging existing software technologies”, IEEE Transactions on Smart Grid, vol. 1, no. 1, June 2010.
[32] A. Bose, “Smart transmission grid applications and their supporting infrastructure”, IEEE Transactions on Smart Grid, vol. 1, no. 1, June 2010.
[33] M. M. Fouda, Z. M. Fadlullah, N. Kato, R. Lu, X. Shen, “A lightweight message authentication scheme for smart grid communications”, IEEE Transactions on Smart Grid, vol. 2, no. 4, December 2011.
[34] Y. Pradeep, P. Seshuraju, S. A. Kaparde, R. H. Joshi, “CIM-based connectivity model for bus-branch topology extraction and exchange”, IEEE Transactions on Smart Grid, vol. 2, no. 2, pp. 244-253, June 2011.
[35] Y. Hu, M. Donnelly, T. Helmer, H. Tram, K. Martin, M. Govindarasu, R. Uluski, M. Cioni, “NASPInet Specification – An important step towards its implementation”, Proc. 43rd Hawaii International Conf. on System Sciences, 2010.
Boosting energy efficiency through Smart Grids 71
[36] C. H. Hauser, D. E. Bakken, A. Bose, “A failure to communicate”, IEEE Power and Energy Magazine, pp. 47-55, March/April 2005.
[37] D. Wei, Y. Lu, M. Jafari, P. M. Skare, K. Rohde, “Protecting smart grid automation systems against cyberattacks”, IEEE Transactions on Smart Grid, vol. 2, no. 4, pp. 782-795, December 2011.
[38] A. R. Metke, R. L. Ekl, “Security technology for smart grid networks”, IEEE Transactions on Smart Grid, vol. 1, no. 1, pp. 99-107, June 2010.
[39] D. Wu, C. Zhou, “Fault tolerant and scalable key management for smart grid”, IEEE Transactions on Smart Grid, vol. 2, no. 2, pp. 375-381, June 2011.
[40] B. Wikdar, J. H. Chow, “Defending synchrophasor data networks against traffic analysis attack”, IEEE Transactions on Smart Grid, vol. 2, no. 4, pp. 819-826, December 2011.
[41] C.-W. Ten, J. Hong, C.-C. Liu, “Anomaly detection for cybersecurity of substations”, IEEE Transactions on Smart Grid, Vol. 2, No. 4, December 2011, pp. 865-873.
[42] T. T. Kim, H. V. Poor, “Strategic protection against data injection attacks on power grids”, IEEE Transactions on Smart Grid, vol. 2, no. 2, pp. 326-333, June 2011.
[43] K. Kursawe, G. Danezis, M. Kolweiss, “Privacy-friendly aggregation for the smart grid”, Proc. 11th Privacy Enhancing Technologies symposium, Waterloo, ON – Canada, July 2011; also in Lecture Notes in Computer Science, vol. 6794, 2011, pp. 175-191, S. Fisher-Hübner and N. Hopper, Eds.
[44] Z. Yang, S. Yu, W. Lou, C. Liu, “P2: Privacy-preserving communication and precise reward architecture for V2G networks in smart grid”, IEEE Transactions on Smart Grid, vol. 2, no. 4, pp. 697-706, December 2011.
[45] K. Kursawe, “Some ideas on privacy preserving meter aggregation”, Tech. Rep. ICIS-R11002, Radboud University, Nijmegen, January 2011.
[46] M. Qiu, W. Gao, M. Chen, J.-W. Niu, L. Zhang, Energy efficient security algorithm for power grid wide area monitoring system”, IEEE Transactions on Smart Grid, Vol. 2, No. 4, December 2011, pp. 715-723.
[47] A. Bartoli, J. Hernández, M. Soriano, M. Dohler, A. Kountouris, D. Barthel, “Secure lossless aggregation over fading and shadowing channels for smart grid M2M networks”, IEEE Transactions on Smart Grid, Vol. 2, No. 4, December 2011, pp. 844-864.
[48] A. S. Wander, N. Gura, H. Eberle, V. Gupta, S. Shantz. “Energy analysis of public-key cryptography for wireless sensor networks”, IEEE Intl. Conference on Pervasive Computing and Communication, Santa Cruz, CA – USA, 8-12 March 2005, pp. 324-328.
[49] “Functionalities of smart grids and smart meters”, Report, EU Commission Task Force for Smart Grids, Expert Group 1, December 2010. [Online]. Available: http://ec.europa.eu/energy/gas electricity/ smartgrids/doc/expert group1.pdf
[50] A. Cheptsov, B. Koller, D. Adami, F. Davoli, S. Mueller, N. Meyer, P. Lazzari, S. Salon, J. Watzl, M. Schiffers, D. Kranzlmueller, "e-Infrastructure for Remote Instrumentation", Computer Standards & Interfaces, vol. 34, no. 6, pp. 476-484, Nov. 2012; doi: 10.1016/j.csi.2011.10.012.
[51] The RINGrid Consortium, Whitepaper on Remote Instrumentation, Computational Methods in Science and Technology, Vol. 15, No. 1, 2009, pp. 119-138 [online: www.man.poznan.pl/cmst/2009/_V_15_1/White_Paper.pdf].
[52] “Revised draft deliverable on smart grid architecture”, Working document, ITU – Focus Group on Smart Grids, April 2011, Smart-O-33Rev.4-2.
[53] Recommendation ITU-T G.9955: “Narrow-band OFDM power line communication transceivers – Physical layer specification”, approved in December 2011.
72 Boosting energy efficiency through Smart Grids
[54] Recommendation ITU-T G.9956: “Narrow-band OFDM power line communication transceivers – Data link layer specification”, approved in November 2011.
[55] Recommendation ITU-T G.9960 (June 2010), “Unified high-speed wire-line based home networking transceivers – System architecture and physical layer specification”, ITU-T G-series Recommendations, Transmission systems and media, digital systems and networks, International Telecommunication Union, Telecommunication sector (ITU-T).
[56] Recommendation ITU-T G.9961 (June 2010), “Unified high-speed wire-line based home networking transceivers – Data link layer specification”, ITU-T G-series Recommendations, Transmission systems and media, digital systems and networks, International Telecommunication Union, Telecommunication sector (ITU-T).
[57] Recommendation ITU-T G.9963 (December 2011), “Unified high-speed wireline-based home networking transceivers – Multiple input/multiple output specification”
[58] Recommendation ITU-T G.9964 (December 2011), “Unified high-speed wireline-based home networking transceivers – Power spectral density specification”
[59] Recommendation ITU-T G.9972 (June 2010), “Coexistence mechanism for wireline home networking transceivers”
[60] Institute of Electrical and Electronics Engineers (IEEE), IEEE 802.3az Energy Efficient Ethernet Task Force, http://grouper.ieee.org/groups/802/3/az/public/index.html.
[61] W. Vereecken, D. Colle, B. Vermeulen, M. Pickavet, B. Dhoedt, P. Demeester, “Estimating and mitigating the energy footprint of ICTs”, Presentation. [Online]. Available: www.itu.int/dms_pub/itu-t/oth/33/04/T33040000020004PDFE.pdf.
[62] The “low Energy COnsumption NETworks” (ECONET) project, IP project funded by the EC in ICT-Call 5 of the 7th Work-Programme, Grant agreement no. 258454, www.econet-project.eu/.
[63] R. Bolla, R. Bruschi, F. Davoli, F. Cucchietti, “Energy Efficiency in the Future Internet: A Survey of Existing Approaches and Trends in Energy-Aware Fixed Network Infrastructures”, IEEE Communication Surveys and Tutorials, Vol. 13, No. 2, Second Quarter 2011, pp. 223-244.
[64] R. Bolla, R. Bruschi, K. Christensen, F. Cucchietti, F. Davoli, S. Singh, “The potential impact of green technologies in next-generation wireline networks: Is there room for energy saving optimization?” IEEE Communications Magazine, Vol. 49, No. 8, pp. 80-86, Aug. 2011.
[65] Global e-Sustainibility Initiative (GeSI), “SMART 2020: Enabling the low carbon economy in the information age”, www.theclimategroup.org/assets/resources/publications/Smart2020Report.pdf.
[66] Code of Conduct on Energy Consumption of Broadband Equipment, European Commission, version 4, European Commission, D-G JRC, Ispra, Italy, February 2011.
[67] “Cool appliances energy efficiency policy profiles. Policy strategies for energy efficient homes”, International Energy Agency, 2003. DOI: 10.1787/19900694. [Online]. Available: www.iea.org/papers/2008/cd_energy_efficiency_policy/3-Appliances%20and%20equipment/3-cool_appliance2003.pdf
[68] P. Bertoldi, B. Atanasiu, “Electricity Consumption and Efficiency Trends in European Union – Status Report 2009”, JRC-IE, Ispra, Italy, 2009.
[69] A. de Almeida, P. Fonseca, B. Schlomann, N. Feilberg, C. Ferreira, “Residential Monitoring to Decrease Energy Use and Carbon Emissions in Europe”, In International Energy Efficiency in Domestic Appliances & Lighting Conference 2006.
[70] A. de Almeida, P. Fonseca, “Residential Monitoring to Decrease Energy Use and Carbon Emissions in Europe”, REMODECE project. URL: http://remodece.isr.uc.pt/.
Boosting energy efficiency through Smart Grids 73
[71] “Key world energy statistics”, International Energy Agency, 2011. [Online]. Available: www.iea.org/textbase/nppdf/free/2011/key_world_energy_stats.pdf.
[72] The “Supporting Energy Efficiency in Smart GEneration Networks through ICT” (SEESGEN-ICT) project. Thematic network funded by the EC under the CIP-ICT PSP-2-2008-2 Programme, EU Project No.: 238868, http://seesgen-ict.rse-web.it.
[73] M. Parvania, M. Fotuhi-Firuzabad, “Demand-response scheduling by stochastic SCUC”, IEEE Transactions on Smart Grid, Vol. 1, No. 1, June 2010.
[74] A. H. Mohsenian-Rad, A. Leon-Garcia, “Optimal residential load control with price prediction in real-time electricity pricing environment”,IEEE Trans. On Smart Grid, Vol. 1, No. 2, Sept. 2010.
[75] M. A. A. Pedrasa, T. D. Spooner, I. F. MacGill, “Coordinated scheduling of distributed energy resources to optimize smart energy services”, IEEE Trans. On Smart Grid, Vol. 1, No. 2, Sept. 2010.
[76] IEEE Std 1901-2010, IEEE Standard for Broadband over Power Line Networks: Medium Access Control and Physical Layer Specifications, IEEE Communications Society, New York, NY, Dec. 2010.
[77] W. Vereecken, Ed., “First yearly report on research activities related to WP1 Technical Domains, and on WP1-specific integration actions”, Towards Real Energy-efficient Network Design (TREND) Project, EU Grant number: 257740, September 2011.
[78] http://tools.ietf.org/wg/eman/draft-ietf-eman-framework/
[79] http://blog.iec61850.com/2012/03/ietf-energy-management-wg-eman-inspired.html.
[80] “Energy Technology Perspectives 2010 – Scenarios & Strategies to 2050”, International Energy Agency, 2010. [Online]. Available: www.iea.org/techno/etp/index.asp.
[81] “Smart grids for developing countries”, Mastère OSE Presentation, 2011. [Online]. Available: http://renovables.org.ni/www/attachments/article/87/Ponencia-Redes%20Inteligentes-22%20marzo%202011-UNI-l.pdf.
[82] M. Bazilian, M. Welsch, D. Divan, D. Elzinga, G. Strbac, M. Howells, L. Jones, A. Keane, Dolf. Gielen, V. S. K. Murthy Balijepalli, A. Brew-Hammond, K. Yumkella, “Smart and Just Grids: Opportunities for sub-Saharan Africa”, Imperial College London, February 2011. [Online]. Available: www.imperial.ac.uk/workspace/energyfutureslab/Public/Smart%20or%20Just%20Grid%20final_08Feb11.pdf.
[83] “World Energy Outlook 2008”, International Energy Agency, 2008. [Online]. Available: www.iea.org/textbase/nppdf/free/2008/weo2008.pdf.
[84] K. K. Nguyen, M. Cheriet, M. Lemay, B. St. Arnaud, V. Reijs, A. Mackarel, P. Minoves, A. Pastrama, W. Van Heddeghem, “Renewable Energy Provisioning for ICT Services in a Future Internet”, in J. Domingue et al. (Eds.): Future Internet Assembly, Lecture Notes in Computer Science 6656, pp. 419-429, 2011.
[85] A. Qureshi, R. Weber, H. Balakrishnan, J. Guttag, B. Maggs, “Cutting the Electric Bill for Internet-Scale Systems”, Proc. ACM SIGCOMM’09, Barcelona, Spain, Aug. 2009.
[86] P. E. Dewdney, P. J. Hall, R. T. Schilizzi, T. J. L. W. Lazio, “The Square Kilometre Array”, Proc. IEEE, Vol. 97, No. 8, pp. 1482-1496, Aug. 2009.


!"#"$%&&'()$*+%(,-."/0%1,-*(2--------!"#"&*+$,-3*4%1*/%15-
6.789:;7!<-=9>37-;!6=7-=7->9.?8@-
.*+%(*#-7(/"1A6()B"1,)/5-C%(,%1+'&-D%1-!"#"$%&&'()$*+%(,--
Printed in SwitzerlandGeneva, 2012
Photo credits: Shutterstock®
About ITU-T and Climate Change: itu.int/ITU-T/climatechange/E-mail: [email protected]
September 2012
Boosting energy efficiency through Smart Grids
An energy-aware survey on ICT device power supplies
Boosting energy efficiency through Smart Grids
Information and Communication Technologies (ICTs) and climate change adaptation and mitigation: the case of Ghana
Review of mobile handset eco-rating schemes
Guidance on green ICT procurement
Greening ICT supply chains – Survey on conflict minerals due diligence initiatives
Toolkit on environmental sustainability for the ICT sector