boosting system options for high efficiency fuel cell
TRANSCRIPT
1
Boosting System Options for High Efficiency Fuel Cell Electric Vehicles
A. Kerviel 1,2, A. Pesyridis 1 and D. Chalet 2
1 Department of Mechanical, Aerospace and Civil Engineering, Brunel University, London, UK
2 Ecole Centrale de Nantes, LHEEA lab. (ECN/CNRS), Nantes, FRANCE
Abstract:
Mass-produced, off-the-shelf automotive air compressors cannot be directly used for boosting
a fuel cell vehicle (FCV) application in the same way they are used in internal combustion
engines, since requirements are different: a high pressure ratio with a low mass flow rate
combined with a high efficiency requirement and compact size. From the established fuel cell
types, the most promising for application in passenger cars or light commercial vehicle
applications is the proton exchange membrane fuel cell (PEMFC), operating at around 80°C.
In this case, an electric assisted turbocharger (E-turbocharger) and electric supercharger (single
or two-stage) are more suitable than screw and scroll compressors. In order to determine which
type of these boosting options is the most suitable for fuel cell vehicle (FCV) application and
to assess their individual merits, a co-simulation between GT-SUITE and
MATLAB/SIMULINK of FCV powertrains is realised to compare vehicles performances on
the Worldwide Harmonised Light Vehicle Test Procedure (WLTP) driving cycle. Results show
that the vehicle equipped with an E-turbocharger has higher performances than vehicle
equipped with a two-stage compressor in the aspects of electric system efficiency (+1.6%) and
driving range (+3.7%) but, for the same maximal output power, the vehicle’s stack is 12.5%
heavier and larger. Then, thanks to the turbine, the E-turbocharger leads to higher performances
than the single stage compressor for the same stack size.
Key words: Boosting option, E-turbocharger, Fuel cell vehicle, PEMFC

2
Nomenclature
Coeffpressure Pressure loss coefficient
DmA,in Inlet air mass flow
DmA,out Outlet air mass flow
Dmeject Ejected air mass flow
DmH,in Inlet hydrogen mass flow
DmH,out Outlet hydrogen mass flow
DmO,in Inlet oxygen mass flow
DmO,out Outlet oxygen mass flow
ENerst Nerst potential
F Faraday constant
I Current
i Current density
iL Limiting current density
N Number of cells
P Stack output power
PA,in Inlet air pressure
PA,out Outlet air pressure
Pcomp Compressor required power
PH,in Inlet hydrogen pressure
PH2 Average hydrogen pressure
PO2 Average oxygen pressure
Psat Water saturation pressure
R Gas constant
Reff Stack electric efficiency
Reff,system System efficiency
Ri Internal cell resistance
T Operating temperature
Vact Activation losses
Vcell Cell voltage
Vconc Mass transfer losses
Vohm Ohmic losses
1-Introduction
An Intergovernmental Panel on Climate Change (IPCC) study [1] from 2014 showed that 14%
of global greenhouse gas emissions are due to transportation. Since 65% of greenhouse gas
emissions are CO2, it has become crucial to decrease their global warming impact. Taking well-
to-wheel emissions into consideration, electric vehicles reach 180 g CO2 eq/km (because of a
global 68% oil, gas and coal electricity production) whereas fuel cell vehicles (FCVs) reach
127 g CO2 eq/km [2][3]. Even if current regulations only take into account tank-to-wheel
emissions, which are null for both of these types of vehicle, some car manufacturers such as
Toyota (Mirai), Honda (Clarity Fuel Cell) or Daimler Group (GLC F-cell) are investing in fuel
cell technology to prepare an uncertain future. To become a viable solution for transportation,
fuel cell vehicles must deal with power density challenge. For instance, the Hyundai Tucson
Fuel Cell edition is 300 kg heavier than the gasoline version for the same output power. To
decrease the weight of the fuel cell vehicle means less fuel consumption and so higher driving
range.
There is a large potential for increasing power density by using boosting system for the air
supply. A higher pressure of the air means a higher output power and efficiency. A recent paper
from Honda underlines that increase the pressure ratio from 1.0 to 1.7 provided 10% more
output power [4]. As a consequence, it is possible to reduce the number of cells and so the
weight of the fuel cell stack for the same output power. Given that the requirements differ from

3
internal combustion engine (ICE), the choice of compressor type must be adapted to fuel cell
vehicle application.
In order to determine which type of compressor to use, a literature review has been done to
identify which types of fuel cell are relevant to transportation application. Then, fuel cell vehicle
powertrain models have been developed, using a co-simulation between GT-SUITE and
MATLAB/SIMULINK. Finally, simulations have been made on driving cycle to analyse the
impact of the air supply system on vehicle performances.
2-Types of fuel cell
Fuel cells can be used in a large range of applications, including cars, trucks and power-stations.
Then, fuel cell has a higher efficiency than ICE since it is a classical electrochemical cell which
is not limited by the efficiency of Carnot cycle as thermal machines are.
They are firstly classified according to the type of electrolyte they employ. It determines the
type of catalysis necessary, the operating temperature and reactions into the cell such as steam
reforming. Finally, fuel cells are classified in function of the temperature at which the stack
operates.
As seen in table 1, high operating temperature fuel cell does not require expensive catalysis
such as platinum and allows steam reforming (internal transformation of light fuels into
hydrogen). The major issue with this type of cell is that quick-starts are not allowed which
makes transportation application almost impossible. To solve this problem, electric resistances
can be used but it is a huge waste of energy. For instance, 4 Wh are necessary for a 200 W
SOFCs stack to warm-up from 20°C to 700°C in 5 minutes [7]. Nissan managed to build the
first SOFCs vehicle in 2016, using a 5 kW stack as an extender for the 24 kWh battery [8].
Low operating temperature fuel cells allow quick start but not steam reforming which limits
usable fuel type. Thanks to high power density with a low operating temperature condition, a
lower environmental impact than PAFCs and a non-sensitivity to CO2 present in the air,
PEMFC is the most suitable fuel cell type for a transportation application. It includes personal
and mass transit vehicle. As an example, Toyota sells the Sora which is a fuel cell bus using
two 114 kW PEMFCs stack from the personal fuel cell Toyota vehicle named Mirai [9].
4
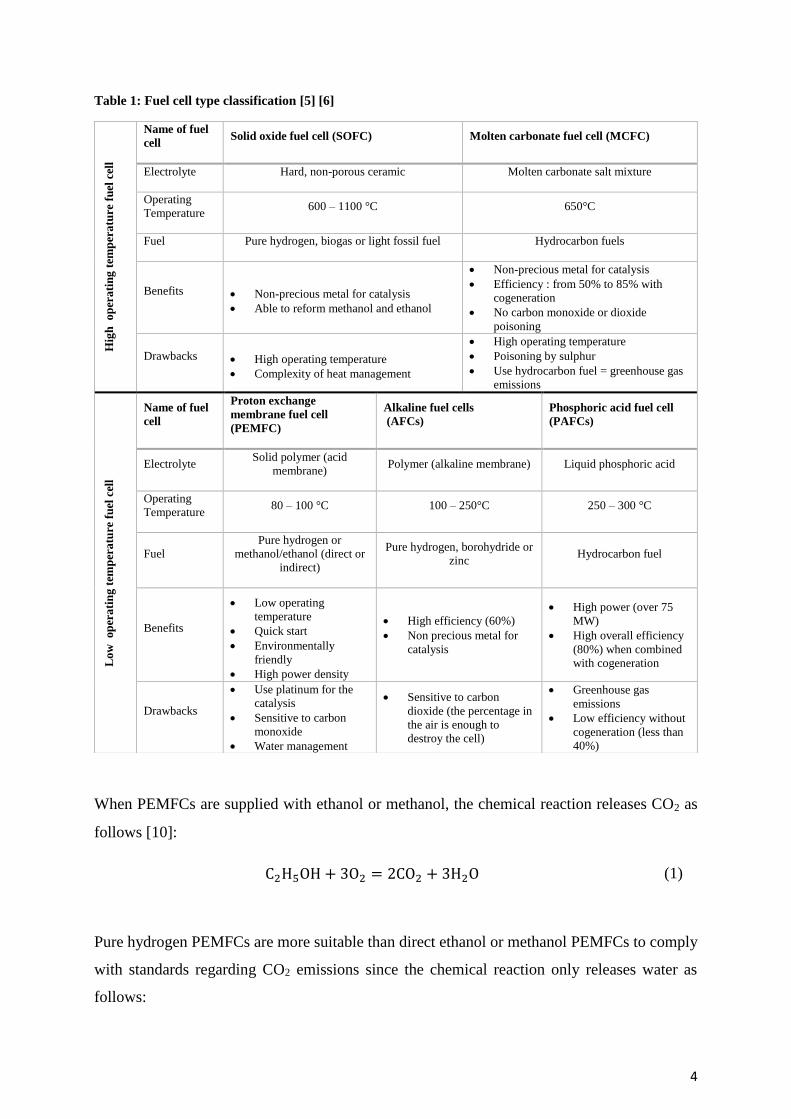
Table 1: Fuel cell type classification [5] [6]
When PEMFCs are supplied with ethanol or methanol, the chemical reaction releases CO2 as
follows [10]:
C2H5OH + 3O2 = 2CO2 + 3H2O (1)
Pure hydrogen PEMFCs are more suitable than direct ethanol or methanol PEMFCs to comply
with standards regarding CO2 emissions since the chemical reaction only releases water as
follows:
Hig
h o
per
ati
ng
tem
per
atu
re f
uel
cel
l
Name of fuel
cell Solid oxide fuel cell (SOFC) Molten carbonate fuel cell (MCFC)
Electrolyte Hard, non-porous ceramic Molten carbonate salt mixture
Operating
Temperature 600 – 1100 °C 650°C
Fuel Pure hydrogen, biogas or light fossil fuel Hydrocarbon fuels
Benefits Non-precious metal for catalysis
Able to reform methanol and ethanol
Non-precious metal for catalysis
Efficiency : from 50% to 85% with
cogeneration
No carbon monoxide or dioxide
poisoning
Drawbacks High operating temperature
Complexity of heat management
High operating temperature
Poisoning by sulphur
Use hydrocarbon fuel = greenhouse gas
emissions
Lo
w
op
era
tin
g t
emp
era
ture
fu
el c
ell
Name of fuel
cell
Proton exchange
membrane fuel cell
(PEMFC)
Alkaline fuel cells
(AFCs)
Phosphoric acid fuel cell
(PAFCs)
Electrolyte Solid polymer (acid
membrane) Polymer (alkaline membrane) Liquid phosphoric acid
Operating
Temperature 80 – 100 °C 100 – 250°C 250 – 300 °C
Fuel
Pure hydrogen or
methanol/ethanol (direct or
indirect)
Pure hydrogen, borohydride or
zinc Hydrocarbon fuel
Benefits
Low operating
temperature
Quick start
Environmentally
friendly
High power density
High efficiency (60%)
Non precious metal for
catalysis
High power (over 75
MW)
High overall efficiency
(80%) when combined
with cogeneration
Drawbacks
Use platinum for the
catalysis
Sensitive to carbon
monoxide
Water management
Sensitive to carbon
dioxide (the percentage in
the air is enough to
destroy the cell)
Greenhouse gas
emissions
Low efficiency without
cogeneration (less than
40%)

5
1
2O2 + H2 = H2O (2)
3- Boosting systems for Fuel Cells
As ICEs use air compressors to increase the power density and the efficiency of the engine, a
boosting system can be used with a fuel cell stack to increase performances. However, the
requirements are not the same. First, it needs a high pressure with a low air mass flow rate.
Second, because of the battery, the stack, the control power unit and the hydrogen storage tanks,
the size of the boosting system is significant in a transportation application. In most ICE
applications, a turbocharger is used to recover the energy from high temperature burning gas.
Even if an expander is used, the operating temperature of the PEMFC (80°C) is too low to
recover enough power to drive the compressor. It implies that the air supply system uses power
from the stack. As a consequence, a high efficiency is there an important requirement.
Table 2: comparison of centrifugal, roots, screw and scroll compressor [11] [12] [13] [14] [15]
*: very bad
**: bad
***: good
****: very good
*****: excellent
Type of
compressors
Centrifugal
Roots
Screw
Scroll
Compactness
Weight
Temperature rise
Pulsations, noise
Compression
Cost
Durability
Average rating 3.7/5 3.0/5 2.7/5 2.6/5
6
As seen in table 2, centrifugal and roots compressors are the most suitable for a fuel cell
application. Smaller and cheaper than screw and scroll compressors, they help to reduce the
weight and the cost of PEMFCs vehicle which is already increased by the use of platinum.
Daimler, General Motor and SAIC changed their boosting option to centrifugal compressor (E-
turbocharger) [11]. The Honda FCX Clarity used a screw compressor but the new Honda Clarity
Fuel Cell is now equipped with a two-stage centrifugal compressor which has a 50% smaller
sound absorber than the FCX screw compressor [4]. Toyota remains the only FCV manufacturer
to use a root compressor (6 lobes). This type of compressor has lower efficiency and pressure
ratio but higher power density than centrifugal one. However, the pulsation noise implies the
use of bigger sound absorber. As a result, centrifugal compressors have been adopted by FCV
manufacturers as the most suitable compressor type for fuel cell application.
Two-stage compressor and E-turbochargers are currently use for FCV application. The Honda
Clarity Fuel Cell two-stage compressor reaches a 4:1 pressure ratio [4]. An estimated value of
2.8:1 pressure ratio is given by a recent paper for E-turbocharger [16]. This paper also proposed
a mixed architecture with a two-stage compressor and a turbine-generator to reduce the energy
consumption of the boosting system.
4- Models of fuel cell vehicle powertrain
Polarization curve model has been used to model the operation of a mono-cell pure hydrogen
PEMFC with MATLAB/SIMULINK. The model, proposed by Pukrushpan [17], used in the
MATLAB/SIMULINK environment is described by the following equations:
Vcell = Enerst − Vact − Vconc − Vohm (3)
Enerst = 1.229 − 0.85 ∗ 10−3(T − 298.15) +RT
2Flog (PH2 ∗ PO2
0.5) (4)
Vact = v0 + va[1 − exp(−c1 ∗ i)] (5)

7
V0 = 0.279 − 0.85 ∗ 10−3(T − 298.15) +RT
2Flog [ (PH,in − Psat) ∗ 0.1173 ∗
(PA,in − Psat)0.5
]
(6)
Va = [−1.618 ∗ 10−5 ∗ T + 1.168 ∗ 10−2] [PO2
0.1173+ Psat]
2
+ [1.8 ∗ 10−4 ∗ T −
0.166] [PO2
0.1173+ Psat] +[−5.8 ∗ 10−4 ∗ T + 0.5736]
(7)
Vconc = i ∗ (c2 ∗i
iL)
c3
(8)
c2 = [8.66 ∗ 10−5 ∗ T − 0.068) [PO2
0.1173+ Psat] − (1.6 ∗ 10−4 ∗ T + 0.54) (9)
Vohm = Ri ∗ i (10)
Where Vcell is the output tension of the mono-cell. Enerst is the Nerst potential. Vact, Vconc and
Vohm are respectively the activation, mass transfer and ohmic losses. C1 and C3 are given by a
recent paper concerning air supply system control [18] as C1 = 10 and C3 = 2.
The total output power of the N-cells stack is calculated as:
P = N ∗ Vcell ∗ I (11)
The electrochemical reaction is considered as stoichiometric. The system is supposed to run
with an excess of air. The current is calculated from the hydrogen mass flow rate and the excess
of air is included in the calculation of oxygen partial pressure. As a result, PO2 and PH2 from
previous equations are calculated by taking the average between the inlet and outlet stack
pressure as follows:
PO2 = 0.5 ∗ (PA,in ∗ 0.21) ∗ (1 +DmO,out
DmO,in) (12)
PH2 = 0.5 ∗ PH,in ∗ (1 +DmH,out
DmH,in) (13)
8
Where DmO,in and DmH,in are the inlet mass flow rates and DmO,out and DmH,out are the outlet
mass flow rates of oxygen and hydrogen, respectively. PA,in and PH,in are the inlet pressures of
air and hydrogen.
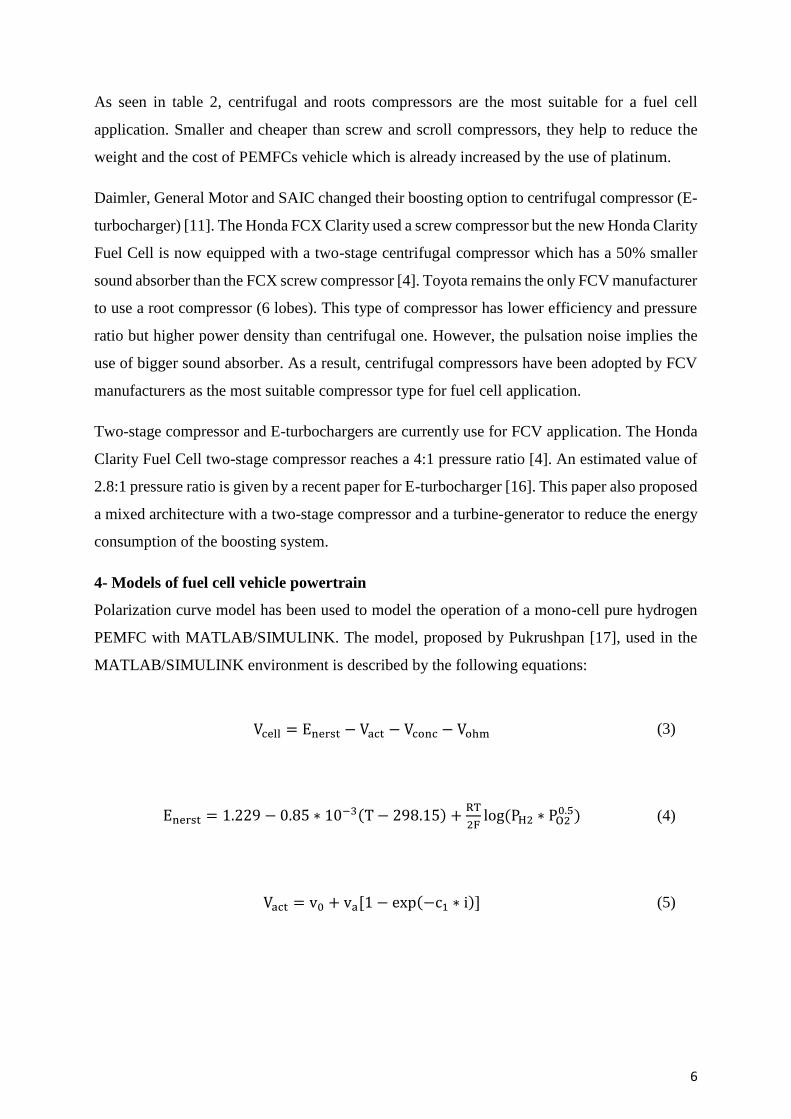
As seen in Fig. 1, the MATLAB/SIMULINK model runs as a black box in GT-SUITE
environment. The “PEMFC_model” refers to the MATLAB function using the model
described. The inputs are the inlet mass flow rates (DmA,in , DmH,in), the inlet pressures (PA,in ,
PH,in) and the required power by air supply system (Pcomp). The outputs include the outlet mass
flow rates (DmA,out , DmH,out), the outlet air pressure (PA,out), the output produced power, the
current and the electric efficiencies (P , I , Reff , Reff,system). There are different ways of
calculating the electric efficiency. In this paper, it is the electric stack efficiency and the electric
system efficiency which are considered and calculated as follow [4] [19] [20]:
Reff =P
1.481 ∗ N ∗ I (12)
Fig.1: MATLAB/SIMULINK diagram using a Matlab function (PEMFCs_model) and a GT-SUITE
master block

9
Reff,system =P − Pcomp
1.481 ∗ N ∗ I (13)
Where N is the number of cells and 1.481 is the theoretical voltage at the terminals of
a hydrogen fuel cell.
Fig. 2: GT-SUITE diagram of a PEMFCs stack model equipped with a two-stage electric compressor
As seen in Fig. 2, the GT-SUITE model takes into consideration the air consumed through the
stack. Dmeject is the part of air consumed during the electrochemical reaction. It is used to
model the decrease of air mass flow rate through the stack due to the oxygen consumption.
Coeffpressure, which is calculated with an equation from GT-SUITE, is used to take into
consideration the pressure loss through the stack due to oxygen consumption. The GT-SUITE
equation is a simplified model of pressure loss. So, a gain has been added to consider the
compressible character of the air.

10
5- Results
The automatic control of different parameters (backpressure, hydrogen mass flow, compressor
speed and so on) allows to proceed to a simulation of the Worldwide Harmonised Light Vehicle
Test Procedure (WLTP) driving cycle. As seen in Fig. 3, this 23.3 kilometres driving cycle
includes realistic urban and extra-urban driving conditions with credible acceleration and
deceleration times.
To compare air supply systems, two different PEMFC stacks have been considered. Both of
them have a 350 cm2 active area and reach a 78 kW maximum output power. The first one is a
360 cells stack equipped with the E-turbocharger or a single stage compressor. The second one
is a 315 cells stack equipped with the two-stage compressor. As a result, vehicles equipped with
the 315 cells stack weights 1850 kg whereas 360 cells stack vehicles have a 5 kg excess weight
[24].
Fig. 3: Vehicle speed through the WLTP driving cycle
The stack provides the entire power to propel the car and to drive the air supply system. In each
case, the air supply system has been optimized to reach the highest system electric efficiency
and so the highest driving range with a 5.6 kg of hydrogen storage tank [25]. Both of stacks
operate with a constant 3 bars pressure for the hydrogen supply system and operate at 80°C.
0
20
40
60
80
100
120
0 200 400 600 800 1000 1200 1400 1600 1800
Veh
icle
sp
eed
(km
/h)
Time (s)
WLTP driving cycle

11
Table 3: partial results of WLTP driving cycle simulation
Configuration number 1 2 3
Number of cells 360 315
Air supply system E-turbocharger
Single stage
compressor Two-stage compressor
Pressure range (bar) [1.1 – 2.3] [1.1 – 2.2] [1.1 – 2.7]
Average system electric efficiency (%) 32.1 28.8 30.5
Average stack electric efficiency (%) 61.7 61.6 61.2
Average compressor/ turbine efficiency
(%) 76.8 / 51.6 77.9 / – 60.2 / –
Driving range (km) for 5.6 kg of
hydrogen 706 682 681
The same compressor has been used for configuration 1 and 2. Only the rotation power map
has been adapted for each configuration. The single stage compressor uses a backpressure
whereas the E-turbocharger has a turbine at the stack outlet. As seen in table 3, the E-
turbocharger system reaches a higher system electric efficiency average and so a 3.5 % higher
driving range. Thanks to the turbine, the average power to provide to the E-turbocharger is 46%
lower than the required average power for the single stage compressor (mainly attributable to
low speed period). During the maximum acceleration phase, the turbine reaches to recover 2.4
kW and so 20% of power required relative difference.
By reducing the number of cells, the mass transfer losses increase since it is harder for reactants
to reach the catalysis area. As seen in Fig. 4, the stack electric efficiency decreases. The two-
stage compressor has been designed to reach 4.0 bar. During the WLTP driving cycle, the two-
stage compressor average pressure is 4.9% higher than the E-turbocharger one which could
have compensated the increase of mass transfer losses. However, the two-stage compressor
average power required is 43% higher than the power required by the E-turbocharger. This
leads to a 1.6% absolute change lower system electric efficiency average and a 3.5% lower
driving range than the E-turbocharger configuration.

12
Fig. 4: impact of the number of cells on the stack electric efficiency (operating at 2 bar)
Conclusion
Simulations have shown that a vehicle equipped with E-turbocharger have higher stack
performances (relative variation from 5.2% to 11.5% regarding the electric system efficiency
average) and driving range (increasing from 3.5% to 3.7% regarding the driving range) than
the others. This result aligns with the current FCV manufacturers’ trend to use E-turbocharger.
However, the compactness gain obtained by using a two-stage compressor cannot be ignored.
If the driving range is targeted, the E-turbocharger is the most suitable choice. However, for a
low centre of gravity and a better handling, the two-stage compressor is a better choice than an
E-turbocharger. To confirm this result, it could be interesting to check the validity of the fuel
cell model used and to compare the difference in weight between an E-turbocharger and a two-
stage compressor in order to obtain more accurate driving range forecast.
0.3
0.35
0.4
0.45
0.5
0.55
0.6
0.65
0.7
0 10 20 30 40 50 60 70 80
Elec
tric
sys
tem
eff
icie
ncy
Output power (kW)
360 cells
315 cells

13
References:
1. Edenhofer, O., R. Pichs-Madruga, Y. Sokona, E. Farahani et al. Climate change 2014:
mitigation of climate change. Contribution to the Fifth Assessment Report of the
Intergovernmental Panel on Climate Change Cambridge University Press, 2014
2. The Union of Concerned Scientists. How clean are hydrogen fuel cell electric
vehicles? , September 2014
3. Mahmoudzadeh Andwari, A., Pesiridis, A., Rajoo, S., Martinez-Botas, R. and
Esfahanian, V., “A Review of Battery Electric Vehicle Technology and Readiness
Levels”, Renewable and Sustainable Energy Reviews, Volume 78, October 2017,
Pages 414–430. https://doi.org/10.1016/j.rser.2017.03.138
4. Tsuyoshi Maruo, Masashi Toida, Tomohiro Ogawa, Yuji Ishikawa, Hiroyuki Imanishi
et al. Development of motorized turbo compressor for Clarity Fuel Cell, SAE
international, March 2017, 2017-01-1187
5. Office of Energy Efficiency and Renewable Energy. Types of fuel cells [accessed: 25
April 2018]
https://www.energy.gov/eere/fuelcells/types-fuel-cells
6. Fuelcell.co.uk, 2010 [accessed: 23 April 2018]
http://www.fuelcell.co.uk/proton-exchange-membrane-fuel-cells/
7. Ulf Bossel. Rapid startup SOFC modules, Fuel Cells 2012 Science & Technology – A
Grove Fuel Cell Event, Energy Procedia, Volume 28, 2012, Pages 48 – 56.
https://doi.org/10.1016/j.egypro.2012.08.039
8. Nissan GB. Nissan unveils world’s first solid-oxide fuel cell vehicle, Nissan
newsroom, August 2016 [accessed: 15 May 2018]
https://newsroom.nissan-europe.com/uk/en-gb/media/pressreleases/148584/nissan-
unveils-worlds-first-solid-oxide-fuel-cell-vehicle1
9. Steve Barrett, Toyota begins sales of Sora fuel cell bus, Fuel Cells Bulletin, Volume
2018, April 2018 [accessed: 5 June 2018]

14
10. S.P.S. Badwal, S. Giddey, A. Kulkarni, J. Goel, S. Basu. Direct ethanol fuel cells for
transport and stationary applications – a comprehensive review, Applied Energy 145,
2015, Pages 80–103. https://doi.org/10.1016/j.apenergy.2015.02.002
11. Yu, W., Sichuan, X., and Ni, H., "Air Compressors for Fuel Cell Vehicles: An
Systematic Review", SAE Int. J. Alt. Power. 4(1):2015, doi:10.4271/2015-01-1172
12. Walters, M., Wick, M., Pischinger, S., Ogrzewalla, J. et al., “Fuel Cell System
Development: A Strong Influence on FCEV Performance,” SAE Technical Paper
2018-01-1305, 2018, doi:10.4271/2018-01-1305
13. Hasegawa, T., Imanishi, H., Nada, M., and Ikogi, Y., "Development of the Fuel Cell
System in the Mirai FCV", SAE Technical Paper 2016-01-1185, 2016,
doi:10.4271/2016-01-1185
14. Martinez-Botas, R., Pesiridis, A. and Yang, M., “Overview of Boosting Options for
Future Downsized Engines”, Science China Technological Sciences Journal, Vol. 54,
No.2, February 2011, doi: 10.1007/s11431-010-4272-1.
15. Feneley, A., Pesiridis, A. and Mahmoudzadeh Andwari, A “Variable Geometry
Turbocharger Technologies for Exhaust Energy Recovery and Boosting - A Review”,
Renewable and Sustainable Energy Reviews, Volume 71, Pages 959 – 975, 2017.
http://dx.doi.org/10.1016/j.rser.2016.12.125
16. T Fischer, OW Willers, JR Seume. Preliminary design of a partial admission turbine
for waste heat recovery in fuel cells, 13th International Conference on Turbochargers
and Turbocharging Conference Proceedings, London, UK, May 2018, ISBN: 978-0-
9956263-3-1
17. Pukrushpan J.T, Stefanopoulou A.G, Peng H. Control of fuel cell power systems:
principles, modeling, analysis and feedback design, Springer Science & Business
Media: Berlin, Germany, 2004, ISBN: 1-85233-816-4
18. Alan Cruz Rojas, Guadalupe Lopez Lopez, J. F. Gomez-Aguilar, Victor M. Alvarado,
Cinda Luz Sandoval Torres. Control of the air supply subsystem in a PEMFC with
balance of plant simulation, MDPI, January 2017, doi:10.3390/su9010073
19. Alexander Kabza Fuel cell formulary, November 2016 [accessed: 21 May 2018]

15
20. Denis Candusso. Hybridation du groupe électrogène à pile à combustible pour
l’alimentation d’un véhicule électrique. Energie électrique. Institut National
Polytechnique de Grenoble - INPG, 2002, tel-00805698
21. Aeristech Electric superchargers (eSuperchargers), 2015 [accessed: 19 April 2018]
http://www.aeristech.co.uk/electric-supercharger/
22. Benedikt Ernst, Jasper Kammeyer, Joerg R. Seume. Improved map scaling methods
for small turbocharger compressors, Proceedings of ASME Turbo Expo, 2011,
GT2011-45345
23. Clay Bell, Daniel Zimmerle, Thomas Bradley, Daniel Olsen, Peter Young. Scalable
turbocharger performance maps for dynamic state-based engine models, International
Journal of Engine Research, 2016, Vol. 17(7) 705–712,
doi:10.1177/1468087415609855
24. Itoga, M., Hamada, S., Mizuno, S., Nishiumi, H. et al., "Development of Fuel Cell
Stack for New FCV", SAE Technical Paper 2016-01-0529, 2016, doi:10.4271/2016-
01-0529.
25. Johnson, K., Veenstra, M., Gotthold, D., Simmons, K. et al., "Advancements and
Opportunities for On-Board 700 Bar Compressed Hydrogen Tanks in the Progression
Towards the Commercialization of Fuel Cell Vehicles", SAE Int. J. Alt. Power.
6(2):2017, doi:10.4271/2017-01-1183.