bootstraps, permutation tests, and...
TRANSCRIPT

Bootstraps, permutation tests, and cross-validation
Joe Felsenstein
Department of Genome Sciences
Bootstraps, permutation tests, and cross-validation – p.1/20
A resampling method
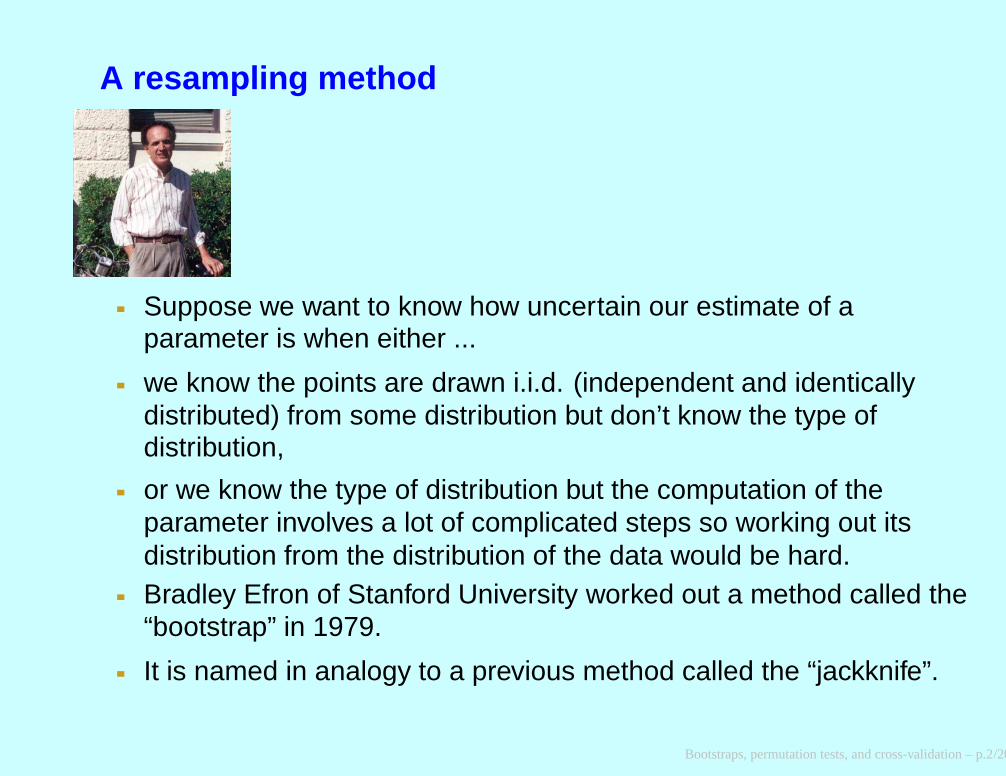
Suppose we want to know how uncertain our estimate of aparameter is when either ...
Bootstraps, permutation tests, and cross-validation – p.2/20
A resampling method
Suppose we want to know how uncertain our estimate of aparameter is when either ...
we know the points are drawn i.i.d. (independent and identicallydistributed) from some distribution but don’t know the type ofdistribution,
or we know the type of distribution but the computation of theparameter involves a lot of complicated steps so working out itsdistribution from the distribution of the data would be hard.
Bootstraps, permutation tests, and cross-validation – p.2/20
A resampling method
Suppose we want to know how uncertain our estimate of aparameter is when either ...
we know the points are drawn i.i.d. (independent and identicallydistributed) from some distribution but don’t know the type ofdistribution,
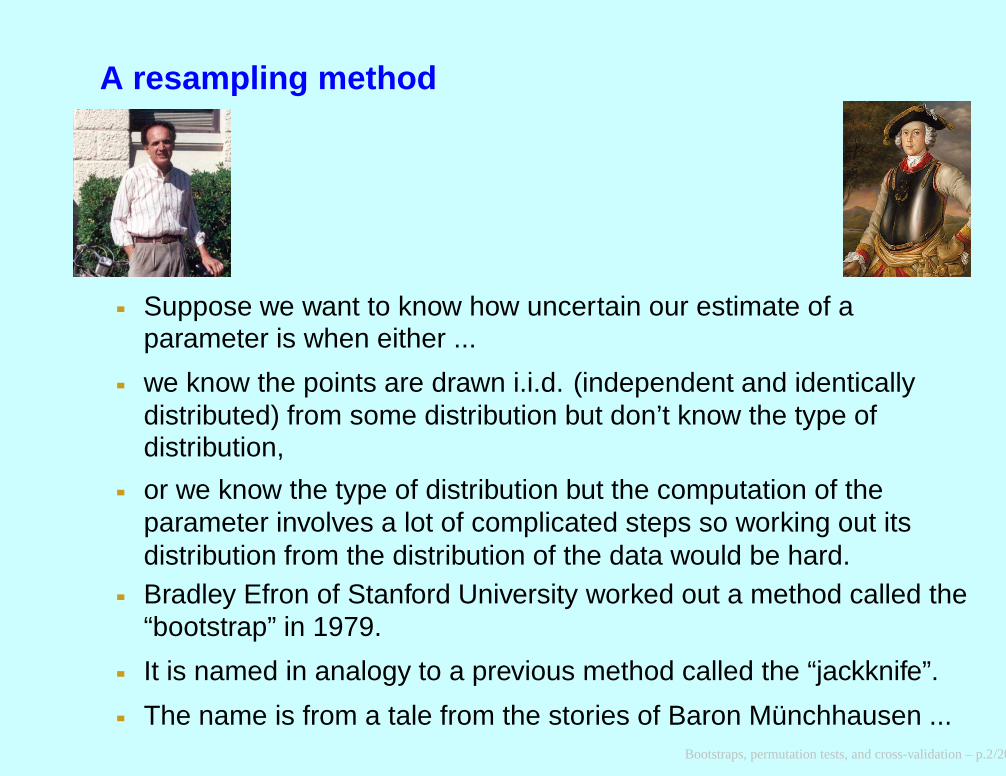
or we know the type of distribution but the computation of theparameter involves a lot of complicated steps so working out itsdistribution from the distribution of the data would be hard.Bradley Efron of Stanford University worked out a method called the“bootstrap” in 1979.
Bootstraps, permutation tests, and cross-validation – p.2/20
A resampling method
Suppose we want to know how uncertain our estimate of aparameter is when either ...
we know the points are drawn i.i.d. (independent and identicallydistributed) from some distribution but don’t know the type ofdistribution,
or we know the type of distribution but the computation of theparameter involves a lot of complicated steps so working out itsdistribution from the distribution of the data would be hard.Bradley Efron of Stanford University worked out a method called the“bootstrap” in 1979.
It is named in analogy to a previous method called the “jackknife”.
The name is from a tale from the stories of Baron Münchhausen ...Bootstraps, permutation tests, and cross-validation – p.2/20
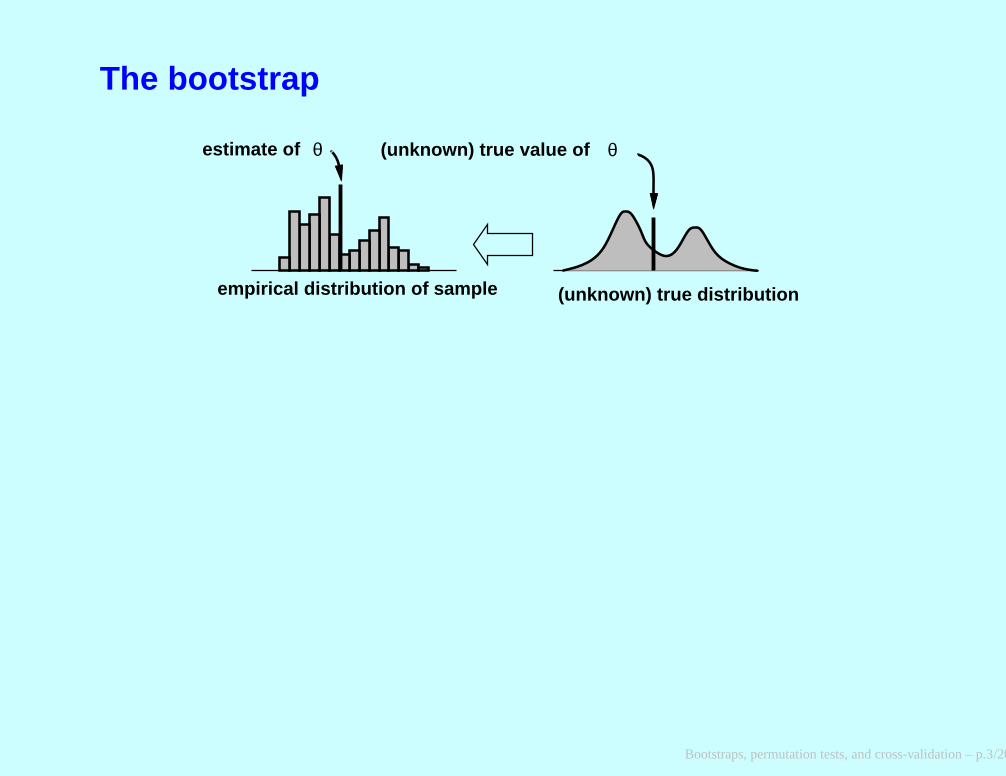
The bootstrap
θ(unknown) true value of
(unknown) true distributionempirical distribution of sample
estimate of θ
Bootstraps, permutation tests, and cross-validation – p.3/20

The bootstrap
(unknown) true value of
(unknown) true distributionempirical distribution of sample
estimate of
Bootstrap replicate
θθ
Bootstraps, permutation tests, and cross-validation – p.4/20
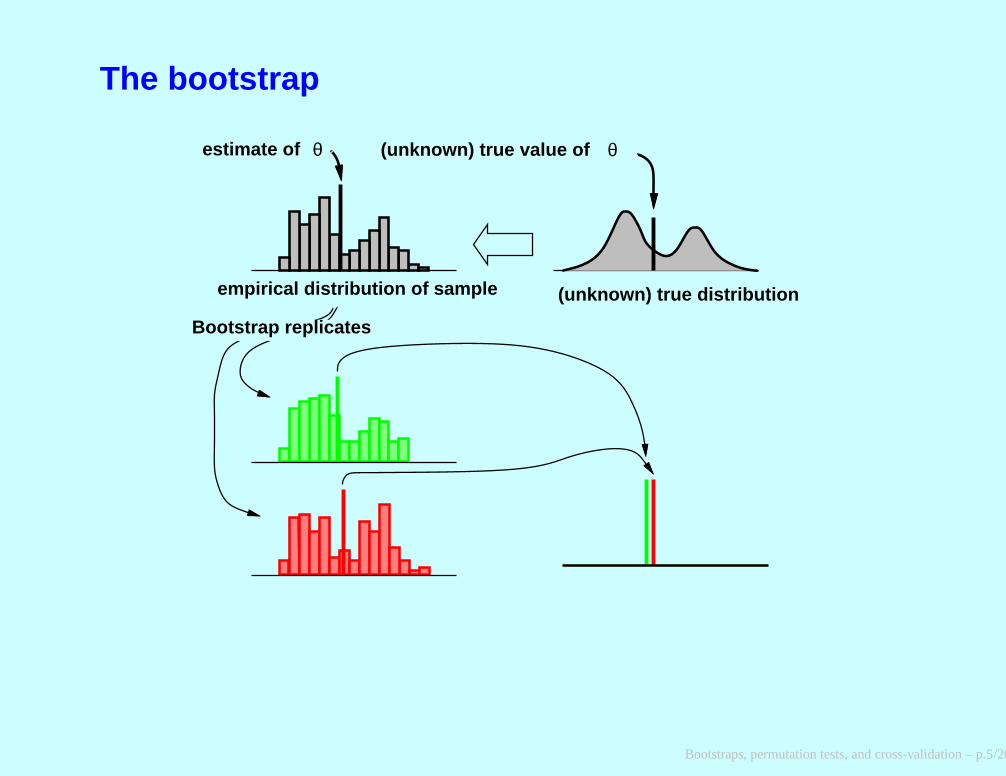
The bootstrap
Bootstrap replicates
(unknown) true value of
(unknown) true distributionempirical distribution of sample
estimate of θθ
Bootstraps, permutation tests, and cross-validation – p.5/20
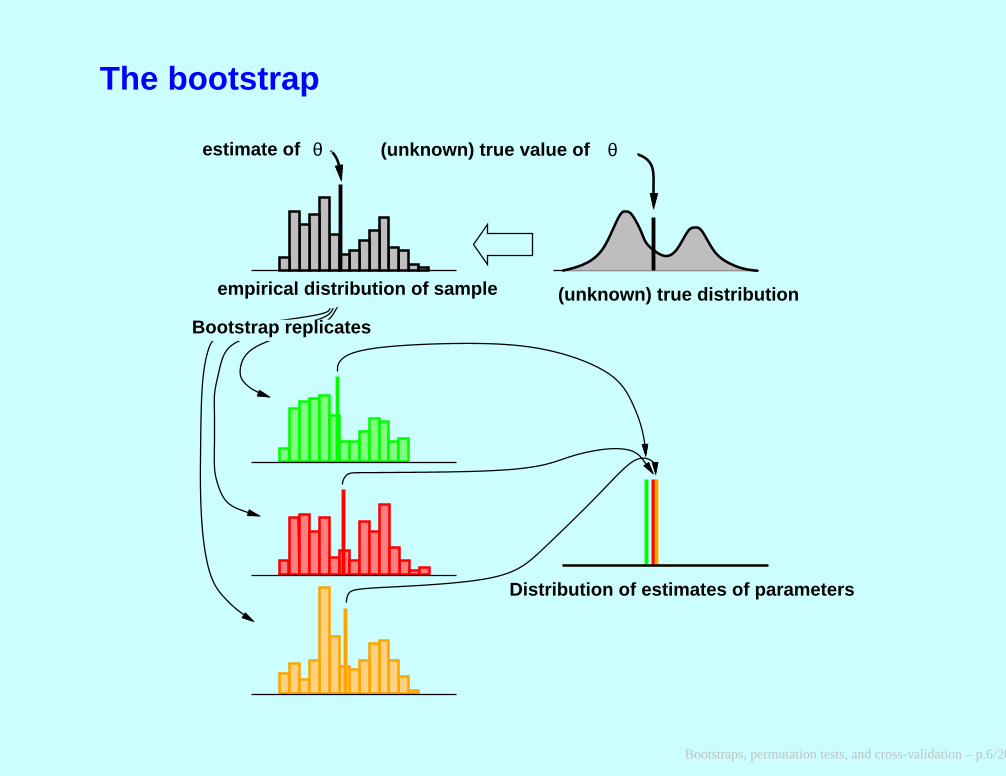
The bootstrap
Bootstrap replicates
(unknown) true value of
(unknown) true distributionempirical distribution of sample
estimate of
Distribution of estimates of parameters
θθ
Bootstraps, permutation tests, and cross-validation – p.6/20
Bootstrap sampling
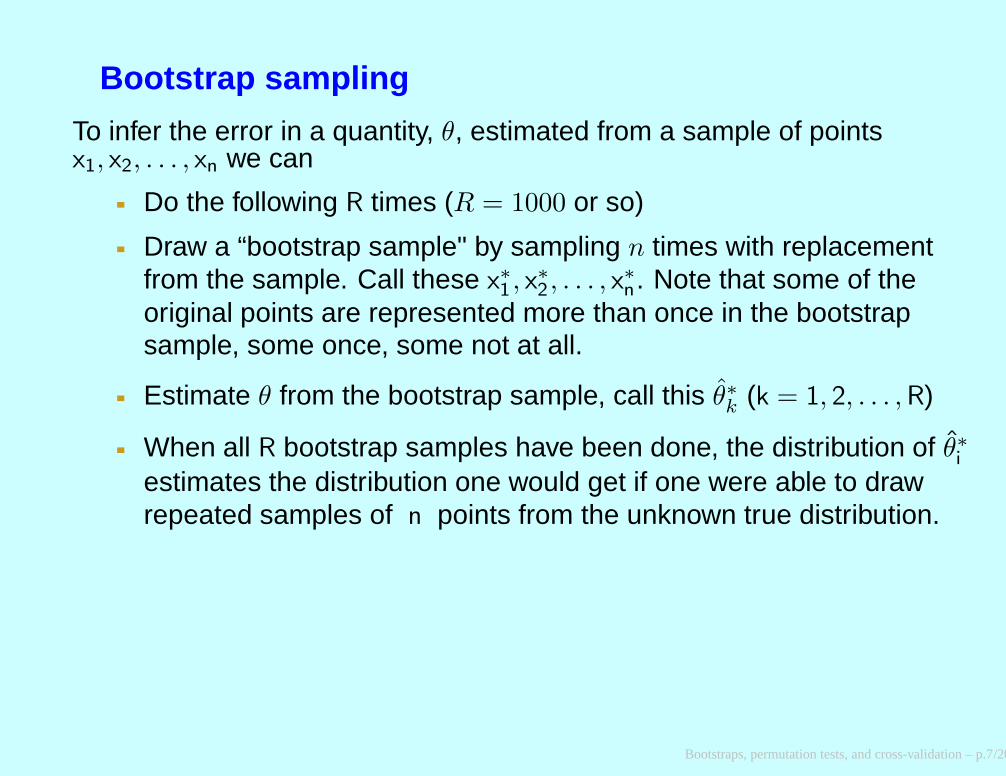
To infer the error in a quantity, θ, estimated from a sample of pointsx1, x2, . . . , xn we can
Do the following R times (R = 1000 or so)
Bootstraps, permutation tests, and cross-validation – p.7/20
Bootstrap sampling
To infer the error in a quantity, θ, estimated from a sample of pointsx1, x2, . . . , xn we can
Do the following R times (R = 1000 or so)
Draw a “bootstrap sample" by sampling n times with replacementfrom the sample. Call these x
∗
1, x∗
2, . . . , x∗
n. Note that some of the
original points are represented more than once in the bootstrapsample, some once, some not at all.
Estimate θ from the bootstrap sample, call this θ̂∗k
(k = 1, 2, . . . , R)
When all R bootstrap samples have been done, the distribution of θ̂∗i
estimates the distribution one would get if one were able to drawrepeated samples of n points from the unknown true distribution.
Bootstraps, permutation tests, and cross-validation – p.7/20

Doing the bootstrap in R
To do bootstrapping in R we can use the sample function withreplace=TRUE:
For example, to get a good idea of the distribution of means for thedistribution from which vector a was drawn:
n <- 150 ; a data set of 150 points
reps <- 200 ; how many bootstrap replicates
a <- runif(n) ; in this example, 150 uniformly-
; distributed numbers
b <- sample(a,reps*n,replace=TRUE) ; draw reps sets of these n numbers
d <- matrix(b, n, reps) ; make into an n x reps matrix
e <- apply(d,2,mean) ; compute the means of each column
; (so we have a vector of reps means)
Note – we’ve used the mean as the statistic of interest, but it could beanything, the standard deviation, the median, whatever.
Bootstraps, permutation tests, and cross-validation – p.8/20
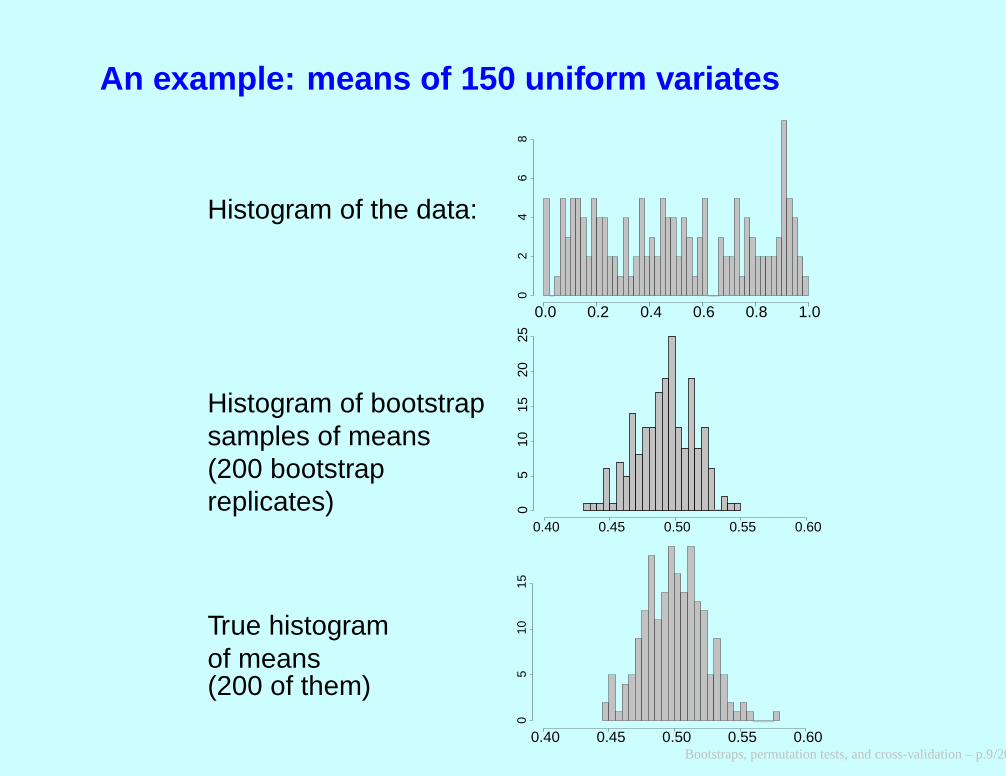
An example: means of 150 uniform variates
Histogram of the data:
0.0 0.2 0.4 0.6 0.8 1.0
02
46
8
Histogram of bootstrapsamples of means(200 bootstrapreplicates)
0.40 0.45 0.50 0.55 0.600
510
1520
25
True histogramof means(200 of them)
0.40 0.45 0.50 0.55 0.60
05
1015
Bootstraps, permutation tests, and cross-validation – p.9/20
Bootstrap intervals and tests
You can make confidence intervals on quantities such as the mean bytaking the upper and lower 2.5% points of the bootstrap distribution of thequantity.
You can do tests by seeing whether null hypothesis values of theparameter fall in that confidence limit.
Bootstraps, permutation tests, and cross-validation – p.10/20
Permutation testsGiven a set of data points in two samples, under the null hypothesis any ofthe m + n points could have been in any of the samples.
So all permutations of the points, shuffling them among samples, areequally likely (under the null hypothesis).
Does our sample show more difference than expected, among all theseshuffles?
Here’s how we test:
Compute the difference of means (or some other reasonablestatistic) between the two groups.
Make a large number of random shufflings of the points.
For each, compute this statistic.
See whether, out of (say) 9,999 shuffles, when the true value isadded in, it is in the top 5% (the top 500) of these 10,000.
Note that this test does not assume normality, just that the points aredrawn from the same (unknown) distribution, independently.
Bootstraps, permutation tests, and cross-validation – p.11/20

Permutation tests
There are many variations on permutation tests:
If the test is a paired test, to see whether the mean difference iszero, shuffle within each pair (i.e. flip each pair the other way withprobability 50%)
If it is a regression, and if the Y points are randomly associated withthe X points under the null hypothesis, so that the true slope is zero,we can shuffle Y s, associating them with the Xs at random. Eachtime, we compute the slope.
If it is a regression and we don’t have a slope of zero for our nullhypothesis, we can take the residuals for the Y values and shufflethose, to investigate the variance of the slope. As the Y values arenot all drawn from the same distribution, you can’t boostrap-samplethem, but you might be able to bootstrap-sample the residuals.
Bootstraps, permutation tests, and cross-validation – p.12/20
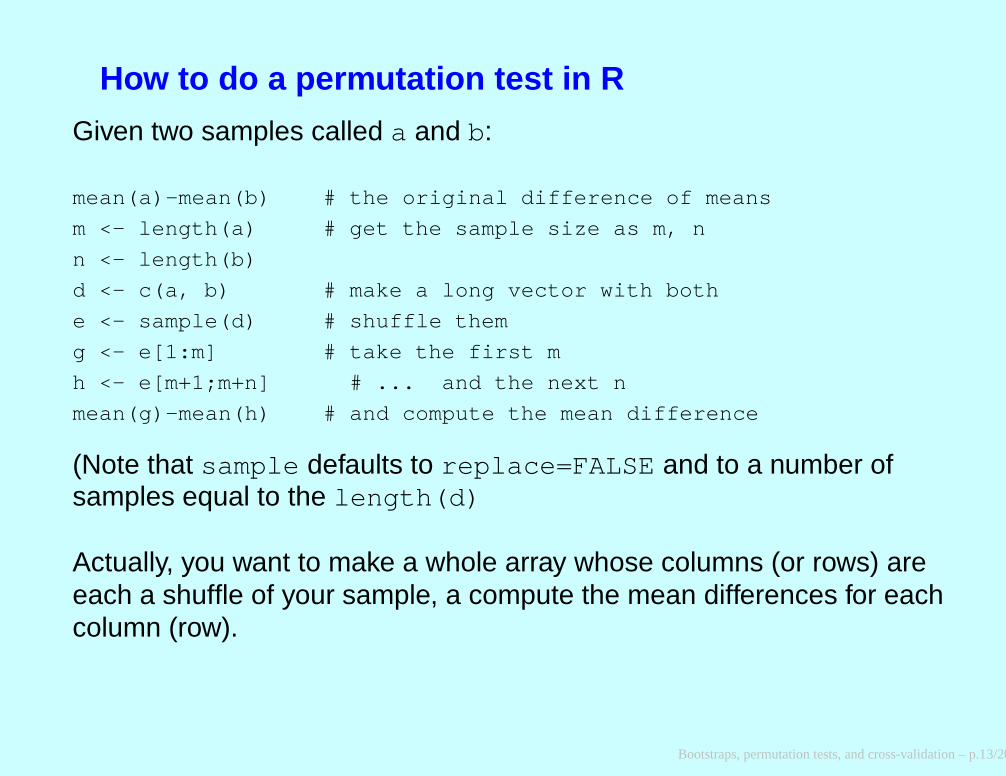
How to do a permutation test in R
Given two samples called a and b:
mean(a)-mean(b) # the original difference of means
m <- length(a) # get the sample size as m, n
n <- length(b)
d <- c(a, b) # make a long vector with both
e <- sample(d) # shuffle them
g <- e[1:m] # take the first m
h <- e[m+1;m+n] # ... and the next n
mean(g)-mean(h) # and compute the mean difference
(Note that sample defaults to replace=FALSE and to a number ofsamples equal to the length(d)
Actually, you want to make a whole array whose columns (or rows) areeach a shuffle of your sample, a compute the mean differences for eachcolumn (row).
Bootstraps, permutation tests, and cross-validation – p.13/20
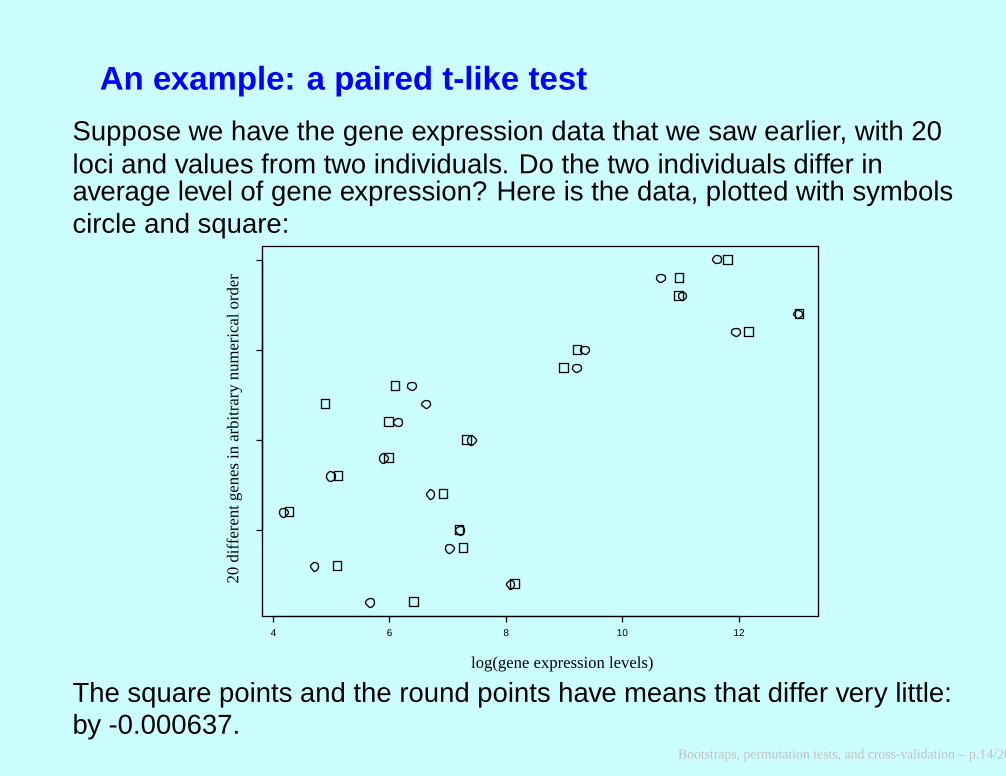
An example: a paired t-like test
Suppose we have the gene expression data that we saw earlier, with 20loci and values from two individuals. Do the two individuals differ inaverage level of gene expression? Here is the data, plotted with symbolscircle and square:
4 6 8 10 12
log(gene expression levels)
20 d
iffer
ent g
enes
in a
rbitr
ary
num
eric
al o
rder
The square points and the round points have means that differ very little:by -0.000637.
Bootstraps, permutation tests, and cross-validation – p.14/20
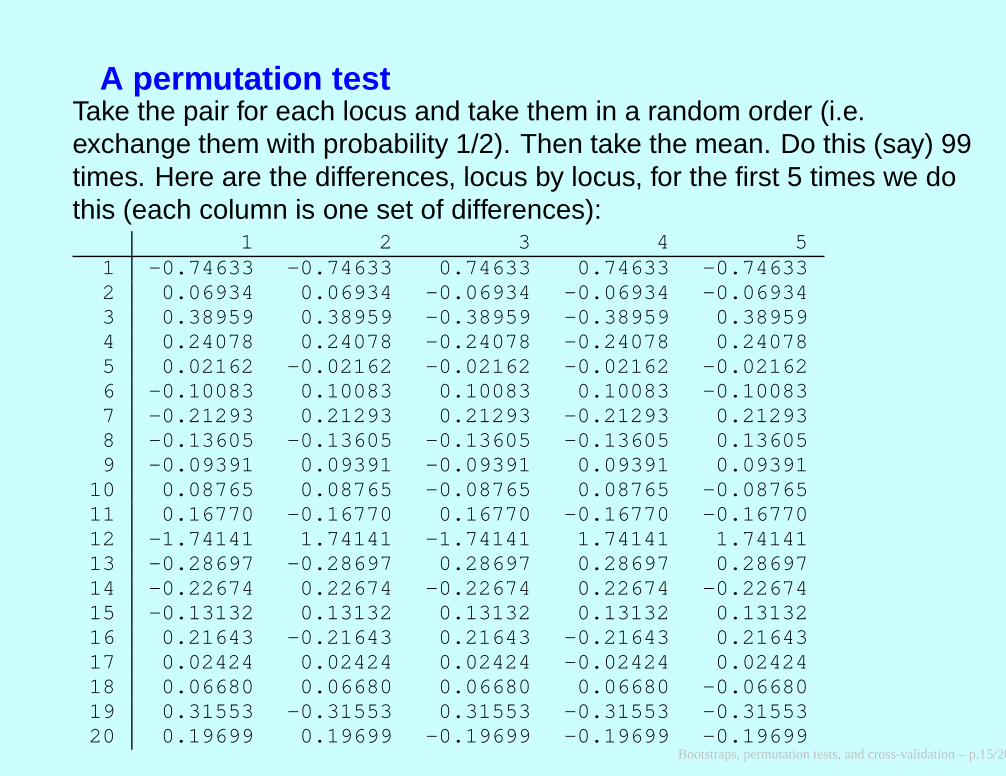
A permutation testTake the pair for each locus and take them in a random order (i.e.exchange them with probability 1/2). Then take the mean. Do this (say) 99times. Here are the differences, locus by locus, for the first 5 times we dothis (each column is one set of differences):
1 2 3 4 51 -0.74633 -0.74633 0.74633 0.74633 -0.746332 0.06934 0.06934 -0.06934 -0.06934 -0.069343 0.38959 0.38959 -0.38959 -0.38959 0.389594 0.24078 0.24078 -0.24078 -0.24078 0.240785 0.02162 -0.02162 -0.02162 -0.02162 -0.021626 -0.10083 0.10083 0.10083 0.10083 -0.100837 -0.21293 0.21293 0.21293 -0.21293 0.212938 -0.13605 -0.13605 -0.13605 -0.13605 0.136059 -0.09391 0.09391 -0.09391 0.09391 0.0939110 0.08765 0.08765 -0.08765 0.08765 -0.0876511 0.16770 -0.16770 0.16770 -0.16770 -0.1677012 -1.74141 1.74141 -1.74141 1.74141 1.7414113 -0.28697 -0.28697 0.28697 0.28697 0.2869714 -0.22674 0.22674 -0.22674 0.22674 -0.2267415 -0.13132 0.13132 0.13132 0.13132 0.1313216 0.21643 -0.21643 0.21643 -0.21643 0.2164317 0.02424 0.02424 0.02424 -0.02424 0.0242418 0.06680 0.06680 0.06680 0.06680 -0.0668019 0.31553 -0.31553 0.31553 -0.31553 -0.3155320 0.19699 0.19699 -0.19699 -0.19699 -0.19699
Bootstraps, permutation tests, and cross-validation – p.15/20

The permutation test results
Here is the histogram of mean of differences that we get from 99 randomflippings of the pairs:
−0.2 −0.1 0.0 0.1 0.2
02
46
810
mean of differences
actual mean ofdifferences
Bootstraps, permutation tests, and cross-validation – p.16/20
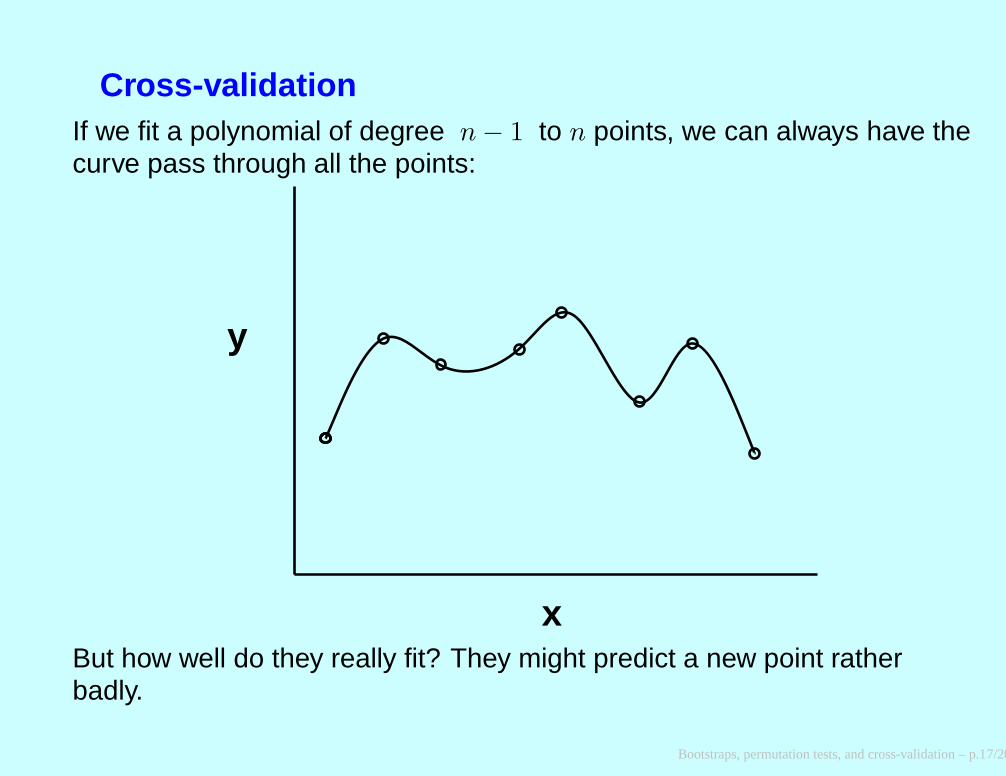
Cross-validationIf we fit a polynomial of degree n − 1 to n points, we can always have thecurve pass through all the points:
x
y
But how well do they really fit? They might predict a new point ratherbadly.
Bootstraps, permutation tests, and cross-validation – p.17/20

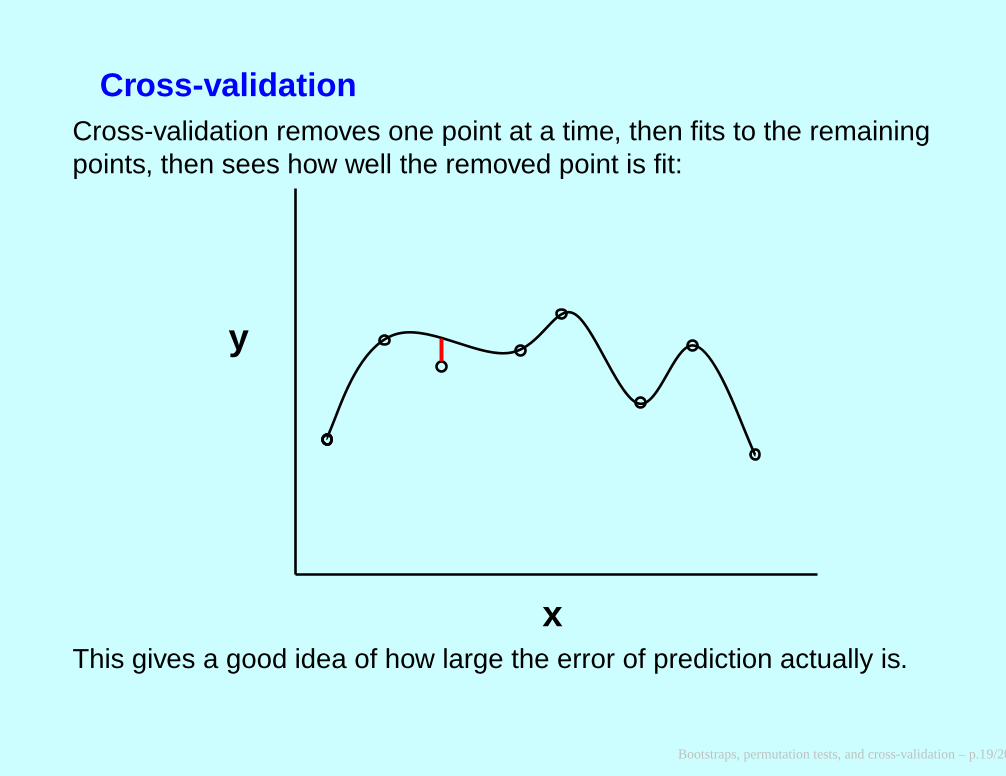
Cross-validationCross-validation removes one point at a time, then fits to the remainingpoints, then sees how well the removed point is fit:
x
y
This gives a good idea of how large the error of prediction actually is.
Bootstraps, permutation tests, and cross-validation – p.18/20
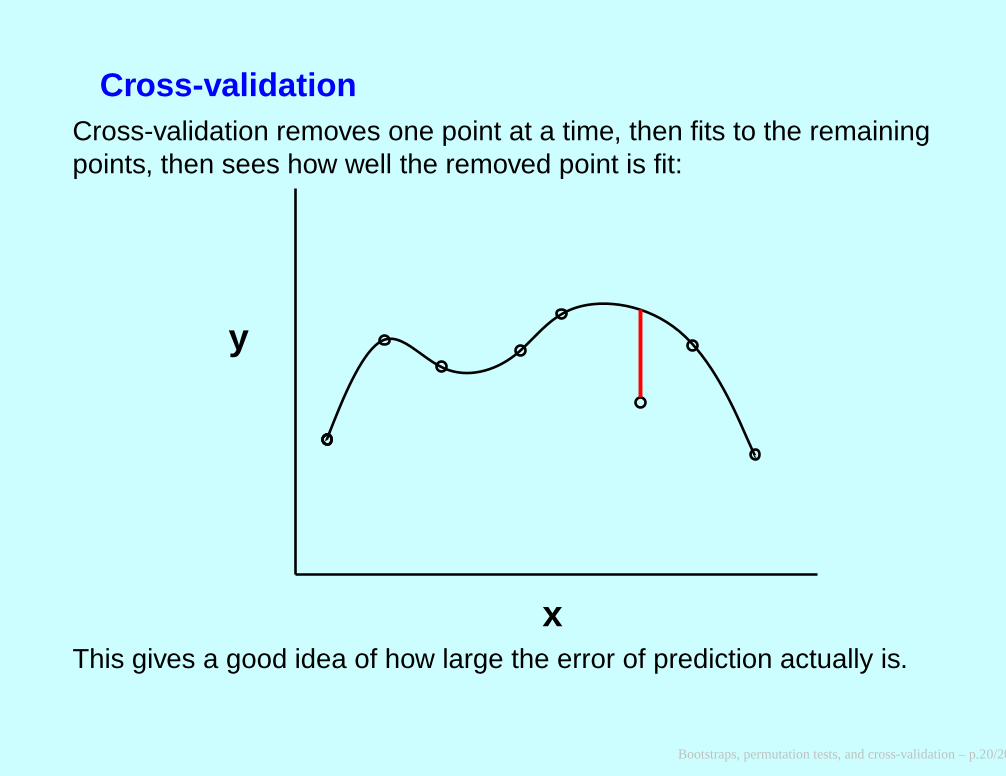
Cross-validationCross-validation removes one point at a time, then fits to the remainingpoints, then sees how well the removed point is fit:
x
y
This gives a good idea of how large the error of prediction actually is.
Bootstraps, permutation tests, and cross-validation – p.19/20
Cross-validationCross-validation removes one point at a time, then fits to the remainingpoints, then sees how well the removed point is fit:
x
y
This gives a good idea of how large the error of prediction actually is.
Bootstraps, permutation tests, and cross-validation – p.20/20