bora handbook rev 00 - preventorpreventor.no/u/bora-handbook-rev-00.pdf · 2014-06-26 · bora...
TRANSCRIPT

operasjonell risikoanalyse
BORA
Barriere- &
Operational Risk Analysis – Total Analysis of Physical and Non-physical Barriers
BORA Handbook
Rev 00
29.06.2007

(blank page)

operasjonell risikoanalyse
BORA
Barriere- &
Report No: 200254-08 Classification: Open
P O Box 519, N-4341 Bryne, Norway Tel: +47 5148 7880, Fax: +47 5148 7881
E-mail: [email protected] Web: http://www.preventor.no
Title of report: Operational risk analysis Total analysis of physical and non-physical barriers BORA Handbook Rev 00
Date: 29.06.2007
Number of pages/appendices:
Author(s): Jorunn Seljelid, Safetec, Stein Haugen, Safetec, Snorre Sklet, Sintef, Jan Erik Vinnem, Preventor/UiS
Signature:
Client(s)/Sponsor(s): NFR/HSE/OLF
Clients ref: T-P Johnsen/R Miles/K Sandve
The objective of this report is to present a generic risk model for quantification of frequencies of leaks from process equipment. The model takes into account the causes of leaks in much more detail than traditional approaches do, and takes into account not just technical causes but also models human and organisational factors. This gives more platform specific leak frequencies. The handbook provides a detailed description of the model, the generic data available and suggests methods for collecting other data. In total, the report is therefore intended to enable the user to perform a study in accordance with the BORA methodology. The report also contains examples of how the method can be used both in qualitative and quantitative analysis.
Index terms, English: Norsk:
Operational risk analysis
Operasjonell risikoanalyse
Organisational factors Organisatoriske forhold
Human factors Menneskelige faktorer
Leak frequency Lekkasjefrekvens

BORA project Operational risk analysis – Total analysis of physical and non-physical barriers BORA Handbook –Rev. 00
J:\prosjekt\P200254 NFR beslutnst\Barrieranalyse\BORA Handbook Rev 00.doc
Preface The approach presented in the report results from developments, discussions and evaluations that have been developed in the period 2004-2006, within the BORA project group, and in contact with members of the BORA Steering Committee, user representatives as well as international experts. Two case studies have been conducted in 2004 and 2005. We wish to thank those from ConocoPhillips Norge and Statoil who have contributed to the case studies. The work has been completed at the end of 2006, but the completion of the BORA handbook has extended into 2007.

BORA project Operational risk analysis – Total analysis of physical and non-physical barriers BORA Handbook –Rev. 00
J:\prosjekt\P200254 NFR beslutnst\Barrieranalyse\BORA Handbook Rev 00.doc
Table of contents
1. INTRODUCTION TO THE HANDBOOK ................................................................................................................................... 1
1.1 THE BORA PROJECT.............................................................................................................................................................................................. 1 1.2 OBJECTIVES OF THIS REPORT ................................................................................................................................................................................. 1 1.3 OVERVIEW OVER REPORT ...................................................................................................................................................................................... 1 1.4 TERMINOLOGY ....................................................................................................................................................................................................... 1 1.5 ABBREVIATIONS..................................................................................................................................................................................................... 2
2. METHODOLOGY OVERVIEW – QUALITATIVE DESCRIPTION....................................................................................... 3 2.1 MAIN ELEMENTS IN THE RISK MODEL .................................................................................................................................................................. 3 2.2 MAIN STEPS IN A BORA ANALYSIS....................................................................................................................................................................... 4
3. DETAILED DESCRIPTION OF STEPS....................................................................................................................................... 6 3.1 IDENTIFICATION OF INITIATING EVENTS ............................................................................................................................................................... 6 3.2 ASSIGNMENT OF GENERIC INITIATING EVENT FREQUENCIES............................................................................................................................... 7 3.3 DEVELOPMENT OF BARRIER BLOCK DIAGRAMS................................................................................................................................................... 9 3.4 DEVELOPMENT OF FAULT TREES......................................................................................................................................................................... 10 3.5 ASSIGNMENT OF GENERIC INPUT DATA .............................................................................................................................................................. 10 3.6 CALCULATION OF LEAK FREQUENCY BASED ON GENERIC INPUT DATA............................................................................................................ 12 3.7 IDENTIFICATION OF RISK INFLUENCING FACTORS FOR IES AND BASIC EVENTS ................................................................................................ 12 3.8 ASSIGNMENT OF WEIGHTS AND SCORES OF RISK INFLUENCING FACTORS ......................................................................................................... 14 3.9 COLLECTION OF DATA FOR RISK INFLUENCING FACTORS (RIFS)....................................................................................................................... 14 3.10 CALCULATION OF PLATFORM SPECIFIC LEAK FREQUENCY................................................................................................................................ 17
4. APPLICATION IN QUALITATIVE RISK ANALYSIS............................................................................................................ 20 4.1 USE OF QUALITATIVE BORA ANALYSIS............................................................................................................................................................. 20 4.2 IDENTIFICATION OF RISK REDUCING MEASURES................................................................................................................................................ 21
5. APPLICATION IN QUANTITATIVE RISK ANALYSIS......................................................................................................... 22 5.1 IDENTIFICATION OF INITIATING EVENTS.............................................................................................................................................................. 22 5.2 ASSIGNMENT OF GENERIC IE FREQUENCIES ........................................................................................................................................................ 22 5.3 DEVELOPMENT OF BARRIER BLOCK DIAGRAMS .................................................................................................................................................. 22 5.4 DEVELOPMENT OF FAULT TREES ......................................................................................................................................................................... 23 5.5 ASSIGNMENT OF GENERIC INPUT DATA ............................................................................................................................................................... 25 5.6 CALCULATION OF LEAK FREQUENCY BASED ON GENERIC INPUT DATA .............................................................................................................. 26 5.7 IDENTIFICATION OF RIFS FOR IES AND BASIC EVENTS ....................................................................................................................................... 26 5.8 ASSIGNMENT OF WEIGHTS AND SCORES OF RIFS ................................................................................................................................................ 26 5.9 CALCULATION OF PLATFORM SPECIFIC LEAK FREQUENCY ................................................................................................................................. 31 5.10 SENSITIVITY ANALYSIS / EVALUATION OF RISK REDUCING MEASURES............................................................................................................ 31 5.11 EXAMPLE STUDY – CONCLUDING REMARKS........................................................................................................................................................ 32
6. REFERENCES............................................................................................................................................................................... 33 APPENDIX A: BARRIER BLOCK DIAGRAMS APPENDIX B: FAULT TREES

BORA project Operational risk analysis – Total analysis of physical and non-physical barriers BORA Handbook –Rev. 00
J:\prosjekt\P200254 NFR beslutnst\Barrieranalyse\BORA Handbook Rev 00.doc
Overview of tables
TABLE 1 OVERVIEW OVER INITIATING EVENTS ...................................................................................................................................... 6 TABLE 2 OVERVIEW OVER INITIATING EVENTS ...................................................................................................................................... 7 TABLE 3 RECOMMENDED HUMAN ERROR PROBABILITY ASSIGNMENTS TO BE USED FOR INITIATING EVENTS ......................................... 8 TABLE 4 SUGGESTED HUMAN ERROR PROBABILITY ASSIGNMENTS TO BE USED FOR MODELING OF BARRIER FAULT TREES ................. 11 TABLE 5 DESCRIPTION OF RISK INFLUENCING FACTORS (RIFS)............................................................................................................. 13 TABLE 6 EXAMPLE OF THE WEIGHTING PROCESS. ................................................................................................................................. 14 TABLE 7 GENERIC SCHEME FOR SCORING OF RIFS................................................................................................................................ 14 TABLE 8 QI FOR SELECTED COMBINATIONS OF PLOW AND PHIGH.............................................................................................................. 18 TABLE 9 GENERIC INPUT DATA FOR THE INITIATING EVENT. ................................................................................................................. 22 TABLE 10 GENERIC INPUT DATA FOR THE BASIC EVENT IN THE FAULT TREES. ......................................................................................... 25 TABLE 11 RESULTS FROM CALCULATION OF THE LEAK FREQUENCY BY USE OF GENERIC INPUT DATA. ..................................................... 26 TABLE 12 STATUS AND WEIGHTS FOR THE INITIATING EVENT. ................................................................................................................ 27 TABLE 13 STATUS AND WEIGHTS FOR “SELF CONTROL OF WORK”........................................................................................................... 28 TABLE 14 STATUS AND WEIGHTS FOR “3RD PARTY CONTROL OF WORK”. ................................................................................................. 29 TABLE 15 STATUS AND WEIGHTS FOR “LEAK TEST”................................................................................................................................ 30 TABLE 16 RESULTS OF CALCULATIONS BY USE OF REVISED INPUT DATA. ................................................................................................ 31
Overview of figures FIGURE 1 ILLUSTRATION OF THE GENERIC RISK MODEL............................................................................................................................ 3 FIGURE 2 OVERVIEW OVER MAIN STEPS IN THE BORA ANALYSIS METHOD .............................................................................................. 4 FIGURE 3 ILLUSTRATION OF A BARRIER BLOCK DIAGRAM. ....................................................................................................................... 9 FIGURE 4 BARRIER BLOCK DIAGRAM. ................................................................................................................................................... 19 FIGURE 5 BARRIER BLOCK DIAGRAM FOR THE SCENARIO “RELEASE DUE TO INCORRECT FITTING OF FLANGES OR BOLTS DURING
MAINTENANCE”..................................................................................................................................................................... 23 FIGURE 6 FAULT TREE FOR THE TOP EVENT ”FAILURE TO DETECT ERROR BY SELF CONTROL”. ................................................................ 24 FIGURE 7 FAULT TREE FOR THE TOP EVENT ”FAILURE TO DETECT ERROR BY 3RD PARTY CONTROL OF WORK”. ....................................... 24 FIGURE 8 FAULT TREE FOR THE TOP EVENT ”FAILURE TO DETECT LATENT ERROR BY USE OF LEAK TEST”. .............................................. 25 FIGURE 9 RISK INFLUENCE DIAGRAM FOR BASIC EVENT ”A2 ACTIVITY SPECIFIED BUT NOT PERFORMED”............................................... 26

BORA project Operational risk analysis – Total analysis of physical and non-physical barriers BORA Handbook –Rev. 00
1
J:\prosjekt\P200254 NFR beslutnst\Barrieranalyse\BORA Handbook Rev 00.doc
1. Introduction to the Handbook 1.1 The BORA project The BORA project is a research project conducted in the period 2003-2006 where the purpose of the main project was to carry out a demonstration project with modeling and analysis of barriers on offshore production installations, including human, technical and organisational barrier elements. Barriers both before and after unplanned events were to be included, i.e. barriers to prevent events from occurring and barriers intended to eliminate/contain the consequences of an unplanned event. The analysis takes quantitative form as far as possible, with the limitations imposed by available models and data. The analysis is performed in such a way that it will enable the identification of failures and failure combinations which entail risk. In turn, this can be used to identify the necessary measures for controlling risk and to observe the effect of modifications and configurative changes, as well as to reveal the effect on barriers during the performance of special operational activities. The analysis will contribute to giving the petroleum industry the overview and understanding of barriers which the Management Regulations in Norway require it to have.
1.2 Objectives of this report The objective of the report is to present a generic risk model for quantification of frequencies of leaks from process equipment. The model takes into account the causes of leaks in much more detail than traditional approaches do, and takes into account not just technical causes but also models human and organisational factors. This gives more platform specific leak frequencies. The handbook provides a detailed description of the model, the generic data available and suggests methods for collecting other data. In total, the report is therefore intended to enable the user to perform a study in accordance with the BORA methodology. Further details of the methodology, the development and the background can be found in the BORA Generalisation report (Ref. 1).
1.3 Overview over report This report is divided into two main parts, each comprising two sections
• Methodology description – this is covered in Section 2 and 3. Section 2 provides an overview of the main steps while Section 3 provides more details on each individual step.
• Examples of use – Section 4 and 5 provides examples of use of the BORA methodology, for qualitative
and quantitative analysis respectively.
1.4 Terminology For reference, the barrier terminology developed by “Together for Safety” (Ref.2) is included: Barrier function: Function in order to prevent the realization of a threat, or to reduce damage
potential. Barrier system: Set of MTO related actions that will provide the planned barrier function. Barrier element: Part of a barrier system Performance influencing factor: Factor which may influence the performance of a barrier function or barrier
system.

BORA project Operational risk analysis – Total analysis of physical and non-physical barriers BORA Handbook –Rev. 00
2
J:\prosjekt\P200254 NFR beslutnst\Barrieranalyse\BORA Handbook Rev 00.doc
1.5 Abbreviations ANSI American National Standards Institute BBD Barrier Block Diagram BORA Barrier and Operational Risk Analysis CCR Central Control Room CM Corrective Maintenance FTA Fault Tree Analysis HAZID Hazard Identification HEP Human Error Probability HES Health, Environment, Safety HMI Human-Machine Interface IE Initiating Event MTO Man, Technology and Organisation OLF The Norwegian Oil Industry Association (Operatørenes Landsforening) P&ID Piping and Instrument Diagram PM Preventive Maintenance PSD Process Shutdown QRA Quantitative Risk Analysis RIF Risk Influencing Factor RNNS Risk Level on the Norwegian Continental Shelf, project with annual updating, see
http://www.ptil.no/English/Helse+miljo+og+sikkerhet/Risikonivaa+paa+sokkelen/ SAP Information system THERP Technique for Human Error Rate Prediction TTS (TST) Technical Safety Condition WP Work Permit

BORA project Operational risk analysis – Total analysis of physical and non-physical barriers BORA Handbook –Rev. 00
3
J:\prosjekt\P200254 NFR beslutnst\Barrieranalyse\BORA Handbook Rev 00.doc
2. Methodology Overview – Qualitative Description 2.1 Main Elements in the Risk Model The overall elements of the generic risk model are illustrated in the figure below. Figure 1 Illustration of the generic risk model
In principle, the risk model can be seen as comprising a set of event trees, with the following elements:
- A set of Initiating Events, which correspond to the Initiating Events in the event trees. An example of an Initiating Event is “Valve in wrong position after maintenance”. This is an event that may cause a leak, if certain barriers fail.
- A set of Barrier Block Diagrams modeling the barrier systems in place to prevent the initiating events from causing a leak. The Barrier Block Diagrams can be converted to event trees.
- The end events in the event trees are of two types: “No Leak” or “Leak”. The “Leak” end events correspond to the Initiating Events in the process event trees normally used in QRAs. The BORA methodology can thus be seen as an extension of the event trees used in QRAs, modeling causal factors in more detail.
- The probability of failure of the barrier systems is modeled with fault trees. - A key feature is the introduction of Risk Influencing Factors. These are factors that influence the
performance or probability of failure/occurrence of the various input data in the model. The focus in the following description is on how to perform a study using the risk model briefly described above. More details of the risk model as such and the development of the risk model can be found in the BORA Generalisation Handbook (Ref. 1).
Leak
No leak
No leak
No leak
Barrier sys 3
Barrier sys 2
Barrier sys 1
Initiating Event A3
Initiating Event A4
Initiating Event A5
etc
Initiating Event A1
Initiating Event A2
RIF 1 RIF 2 RIF 3
w1
w2
w3
s1 s2 s3
Documentation not used Error in documentation Documentation not used correctly
Failure to detect degradation
RIF 1 RIF 2 RIF 3
w1
w2
w3
s1 s2 s3
BORA project Operational risk analysis – Total analysis of physical and non-physical barriers BORA Handbook –Rev. 00
4
J:\prosjekt\P200254 NFR beslutnst\Barrieranalyse\BORA Handbook Rev 00.doc
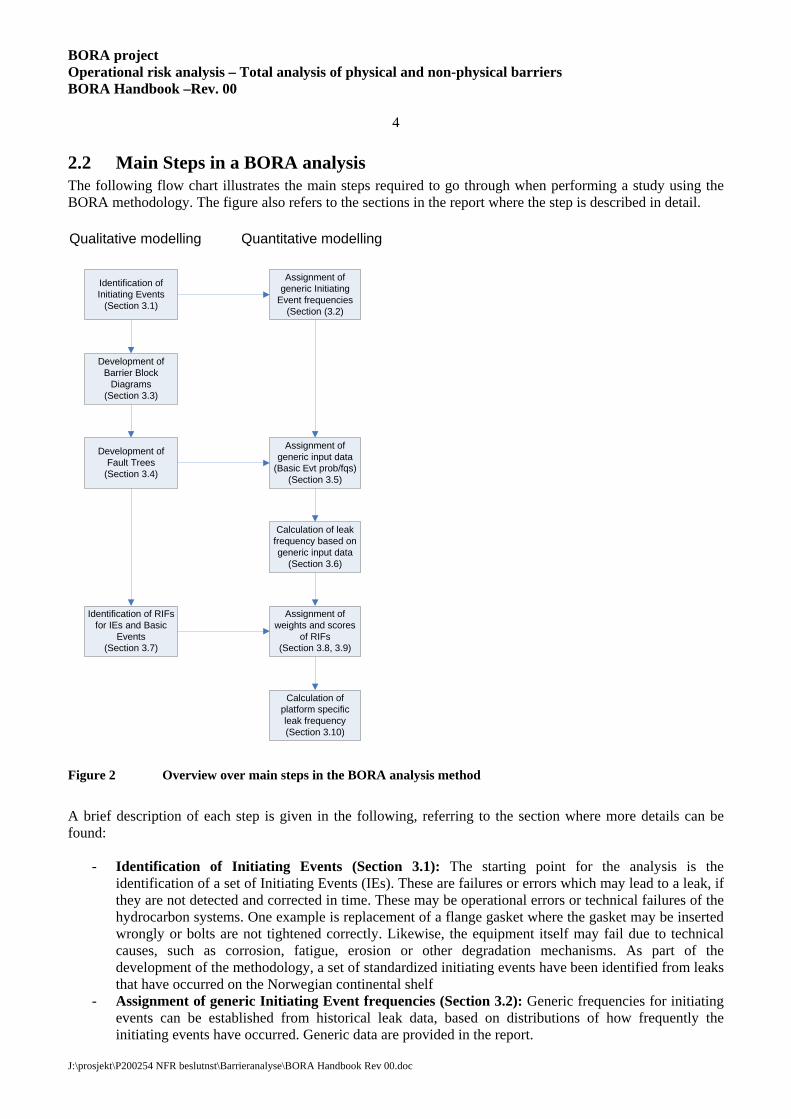
2.2 Main Steps in a BORA analysis The following flow chart illustrates the main steps required to go through when performing a study using the BORA methodology. The figure also refers to the sections in the report where the step is described in detail.
Identification of Initiating Events
(Section 3.1)
Development of Barrier Block
Diagrams(Section 3.3)
Development of Fault Trees
(Section 3.4)
Identification of RIFs for IEs and Basic
Events(Section 3.7)
Assignment of generic Initiating
Event frequencies(Section (3.2)
Assignment of generic input data
(Basic Evt prob/fqs)(Section 3.5)
Assignment of weights and scores
of RIFs(Section 3.8, 3.9)
Calculation of platform specific leak frequency(Section 3.10)
Qualitative modelling Quantitative modelling
Calculation of leak frequency based on generic input data
(Section 3.6)
Figure 2 Overview over main steps in the BORA analysis method
A brief description of each step is given in the following, referring to the section where more details can be found:
- Identification of Initiating Events (Section 3.1): The starting point for the analysis is the identification of a set of Initiating Events (IEs). These are failures or errors which may lead to a leak, if they are not detected and corrected in time. These may be operational errors or technical failures of the hydrocarbon systems. One example is replacement of a flange gasket where the gasket may be inserted wrongly or bolts are not tightened correctly. Likewise, the equipment itself may fail due to technical causes, such as corrosion, fatigue, erosion or other degradation mechanisms. As part of the development of the methodology, a set of standardized initiating events have been identified from leaks that have occurred on the Norwegian continental shelf
- Assignment of generic Initiating Event frequencies (Section 3.2): Generic frequencies for initiating events can be established from historical leak data, based on distributions of how frequently the initiating events have occurred. Generic data are provided in the report.

BORA project Operational risk analysis – Total analysis of physical and non-physical barriers BORA Handbook –Rev. 00
5
J:\prosjekt\P200254 NFR beslutnst\Barrieranalyse\BORA Handbook Rev 00.doc
- Development of Barrier Block Diagrams (Section 3.3): There are typically one or more barrier systems in place to prevent the Initiating Events from causing a leak. These barrier systems are modeled using “Barrier Block Diagrams” (BBD). In practice, these can be converted to Event Trees. If the barrier systems function as intended, the situation will be detected and can be corrected and no leak will occur. The barrier systems can be technical, human and/or organizational systems. Standard BBDs are developed and presented in the report.
- Development of Fault Trees (Section 3.4): The probability of a barrier system failing is modeled using Fault Tree Analysis (FTA). Standard fault trees are provided for the operational barriers that have been identified.
- Assignment of generic input data (Basic event probabilities/frequencies) (Section 3.5): In order to quantify the probability of failure of the barrier systems, input data to the fault trees need to be established. Generic input data are provided in the report and these can be assigned to the relevant basic events in the fault trees.
- Calculation of leak frequency based on generic input data (Section 3.6): Using generic input to the fault trees, generic failure probabilities/frequencies for the barrier systems can be calculated and this allows calculation of generic leak frequencies for the installation.
- Identification of RIFs fo Initiating Events and Basic Events (Section 3.7): The probabilities of the Initiating events and the basic events in the fault trees occurring are dependent on a number of “Risk Influencing Factors” or RIFs. The RIFs are factors like the competence of the personnel performing the work, quality of procedures for performing work, maintenance of equipment etc. The next step involves the identification of the relevant RIFs that will influence the individual input factors in the model. A generic list of possible RIFs is included in the report.
- Assignment of weights and scores of RIFs (Section 3.8 and 3.9): The RIFs are characterized by a “Weight” and a “Score”. The Weight tells us how much the RIF influences the probability (a high weight implies a strong influence, a low weight implies a weak influence) and the Score tells us the status of the RIF for the installation that is being considered. As an example, the probability of making an error when replacing a flange gasket may be dependent on the competence of the mechanic doing the work and the time pressure when the work is being performed. If the competence is high, the probability will be low while if the work situation is stressful the probability may increase. For the RIFs that have been identified, a RIF weight and score is assigned for each of the input values that the RIF influences.
- Calculation of platform specific leak frequency (Section 3.10): The final step is the calculation of platform specific leak frequencies, taking into account the platform specific RIFs.

BORA project Operational risk analysis – Total analysis of physical and non-physical barriers BORA Handbook –Rev. 00
6
J:\prosjekt\P200254 NFR beslutnst\Barrieranalyse\BORA Handbook Rev 00.doc
3. Detailed description of steps 3.1 Identification of Initiating Events The errors or failures that may develop into a leak are termed Initiating Events (IE). The IEs are based on review of investigation reports from actual leaks that have occurred on the Norwegian Continental Shelf. The causes of the leaks have been identified and structured. Further, the IEs have been grouped according to how they are mitigated against, i.e. what barriers are in place to prevent an IE from developing into a leak. Six groups of IEs have been defined and these are further broken down into specific Initiating Events. The complete set is shown in the table below. Table 1 Overview over Initiating Events
Initiating Event Type Initiating Events
A. Technical degradation of system
1. Degradation of valve sealing 2. Degradation of flange gasket 3. Loss of bolt tensioning 4. Fatigue 5. Internal corrosion 6. External corrosion 7. Erosion 8. Other causes
B. Human intervention introduction latent error
1. Incorrect blinding/isolation 2. Incorrect fitting of flanges or bolts during maintenance 3. Valve(s) in incorrect position after maintenance 4. Erroneous choice or installations of sealing device 5. Maloperation of valve(s) during manual operation* 6. Maloperation of temporary hoses.
C. Human intervention causing immediate release
1. Break-down of isolation system during maintenance. 2. Maloperation of valve(s) during manual operation* 3. Work on wrong equipment, not known to be pressurised
D. Process disturbance 1. Overpressure 2. Overflow / overfilling
E. Inherent design errors 1. Design related failures
F. External events 1. Impact from falling object 2. Impact from bumping/collision
* This may lead to either introduction of a latent error or an immediate release
BORA project Operational risk analysis – Total analysis of physical and non-physical barriers BORA Handbook –Rev. 00
7
J:\prosjekt\P200254 NFR beslutnst\Barrieranalyse\BORA Handbook Rev 00.doc
3.2 Assignment of Generic Initiating Event Frequencies Two alternatives are proposed for calculating generic frequencies of initiating events:
- The first alternative uses frequencies established from generic leak data and equipment counts combined with the probability distribution for the Initiating Events. This is probably the best approach when using the BORA methodology in an overall QRA. This will however not give the Initiating Event frequency directly, but the frequency of leaks due to a specific Initiating Events. However, this can also be used to take into account the effect of the barriers for the specific installation being considered.
- The second alternative uses the activity level as a starting point (e.g. no of times hydrocarbon equipment is opened for maintenance/repair/inspection). This is combined with human error probabilities to establish frequencies for the Initiating Events directly. This approach is likely to be best suited for studies of specific problem areas or limited studies that do not cover a whole installation.
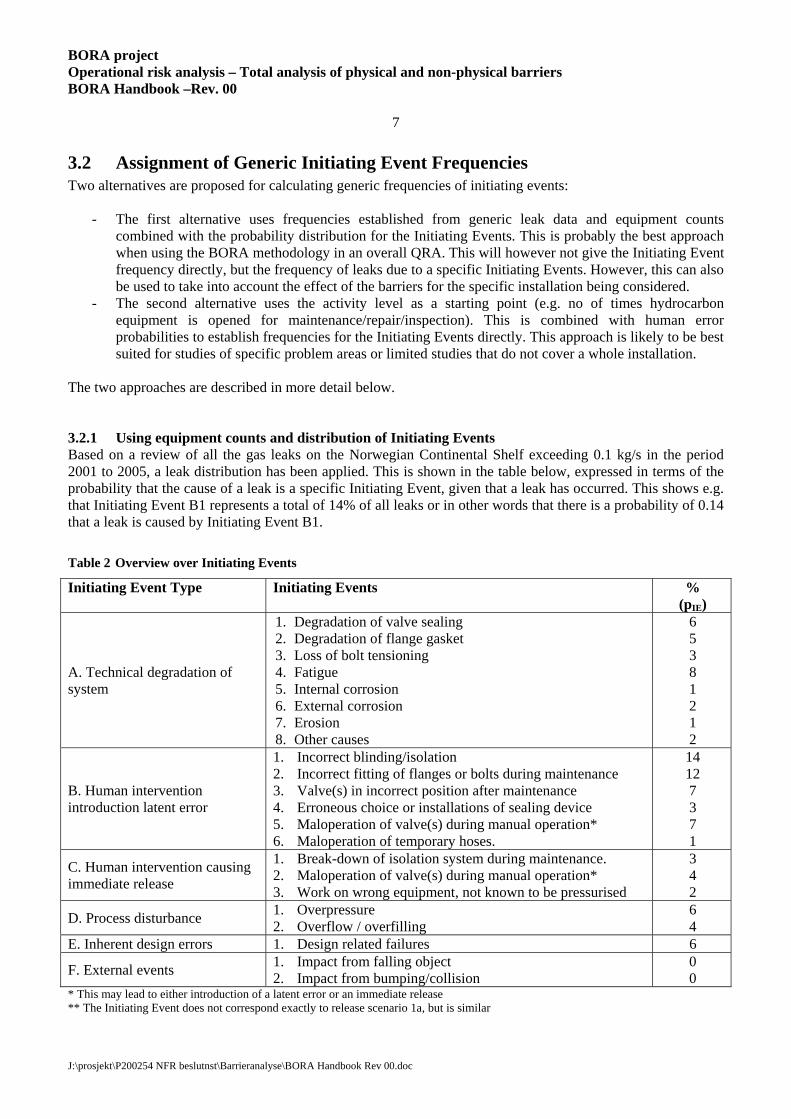
The two approaches are described in more detail below. 3.2.1 Using equipment counts and distribution of Initiating Events Based on a review of all the gas leaks on the Norwegian Continental Shelf exceeding 0.1 kg/s in the period 2001 to 2005, a leak distribution has been applied. This is shown in the table below, expressed in terms of the probability that the cause of a leak is a specific Initiating Event, given that a leak has occurred. This shows e.g. that Initiating Event B1 represents a total of 14% of all leaks or in other words that there is a probability of 0.14 that a leak is caused by Initiating Event B1. Table 2 Overview over Initiating Events
Initiating Event Type Initiating Events % (pIE)
A. Technical degradation of system
1. Degradation of valve sealing 2. Degradation of flange gasket 3. Loss of bolt tensioning 4. Fatigue 5. Internal corrosion 6. External corrosion 7. Erosion 8. Other causes
6 5 3 8 1 2 1 2
B. Human intervention introduction latent error
1. Incorrect blinding/isolation 2. Incorrect fitting of flanges or bolts during maintenance 3. Valve(s) in incorrect position after maintenance 4. Erroneous choice or installations of sealing device 5. Maloperation of valve(s) during manual operation* 6. Maloperation of temporary hoses.
14 12 7 3 7 1
C. Human intervention causing immediate release
1. Break-down of isolation system during maintenance. 2. Maloperation of valve(s) during manual operation* 3. Work on wrong equipment, not known to be pressurised
3 4 2
D. Process disturbance 1. Overpressure 2. Overflow / overfilling
6 4
E. Inherent design errors 1. Design related failures 6
F. External events 1. Impact from falling object 2. Impact from bumping/collision
0 0
* This may lead to either introduction of a latent error or an immediate release ** The Initiating Event does not correspond exactly to release scenario 1a, but is similar

BORA project Operational risk analysis – Total analysis of physical and non-physical barriers BORA Handbook –Rev. 00
8
J:\prosjekt\P200254 NFR beslutnst\Barrieranalyse\BORA Handbook Rev 00.doc
From this table and from equipment counts, the frequency of leaks caused by a certain initiating event can be found by multiplying the total leak frequency for a segment by the percentages in the table shown above. (1) Note that this is the leak frequency due to a specific Initiating Event, not the Initiating Event frequency. 3.2.2 Using activity data and human error probabilities Alternatively, human error probabilities expressing the probability of operational errors being made can also be used. Necessary input in addition to the error probabilities would then be the number of times the operations is performed. By multiplying these values, the frequencies of Initiating Events can be found. Recommended HEPs are shown in the following table. Table 3 Recommended Human Error Probability Assignments to be used for Initiating Events
Recommended HEP Assignment Initiating Event Group Specific Initiating Event Lower
Assignment Upper
Assignment Average
B.1 Incorrect blinding/isolation 1 ⋅ 10-2 1 ⋅ 10-1 5 ⋅ 10-2 B.2 Incorrect fitting of flanges or bolts 1 ⋅ 10-3 1 ⋅ 10-2 5 ⋅ 10-3
B.3 Valve(s) in incorrect position after maintenance 1 ⋅ 10-2 1 ⋅ 10-1 5 ⋅ 10-2
B.4 Erroneous choice/installation of sealing device 5 ⋅ 10-3 5 ⋅ 10-2 3 ⋅ 10-2
B.5 Maloperation of valve(s) during manual operation 1 ⋅ 10-2 1 ⋅ 10-1 5 ⋅ 10-2
B. Human intervention introducing latent error
B.6 Maloperation of temporary hoses 1 ⋅ 10-2 1 ⋅ 10-1 5 ⋅ 10-2
C. Human intervention causing immediate release
C.2 Maloperation of valve(s) during manual operation: 1 ⋅ 10-2 1 ⋅ 10-1 5 ⋅ 10-2
, ,i iGL IE GL Total IEf f p= ⋅

BORA project Operational risk analysis – Total analysis of physical and non-physical barriers BORA Handbook –Rev. 00
9
J:\prosjekt\P200254 NFR beslutnst\Barrieranalyse\BORA Handbook Rev 00.doc
3.3 Development of Barrier Block Diagrams The event sequence following on from the initiating event is visualized in a barrier block diagram as illustrated in Figure 1. A barrier block diagram consists of an initiating event, arrows that show the event sequence, barrier functions realized by barrier systems, and possible outcomes. An arrow straight on indicates that a barrier system functions (i.e., fulfill its function), whereas an arrow downwards indicates failure to fulfill the barrier function. In our case, the undesirable event is release of hydrocarbons (loss of containment).
Initiating event(Deviation from
normal situation)
Undesirable event
”Safe state”Barrier functionrealized by a
barrier system Functions
Fails
Figure 3 Illustration of a barrier block diagram.
One main purpose of a barrier block diagram is to illustrate available barrier functions intended to prevent a deviation (i.e. an initiating event) from escalating into a release, and how these functions are realized by barrier systems. Standardized Barrier Block Diagrams for the Initiating Events are presented in Appendix A. These are developed based on what may be considered the most commonly used barriers in operations on the Norwegian continental shelf. Before applying these, it is however necessary to verify that the barriers modeled actually are in place for the installation being considered. No BBDs have been prepared for the following types of Initiating Events:
- C. Human intervention causing immediate release: This is a special type of deviation which involves human intervention but where the operation directly causes a release. One example could be an operator that opens a wrong valve on a pressurized system causing a release. This means that there are no barriers to prevent the release after the Initiating Event has occurred.
- E. Inherent design errors: Characteristic for these errors is that they are made during the design process and that barriers to detect and correct these errors need to be established during the design phase and not in the operational phase. The best way of protecting against this is a robust design, with ample safety margins and a “defense-in-depth” strategy.
- F. External events: These are not process related as such and in order to prevent release due to these causes, one needs to look at other types of operations than those related to the process system.
For further details, refer to Appendix A.

BORA project Operational risk analysis – Total analysis of physical and non-physical barriers BORA Handbook –Rev. 00
10
J:\prosjekt\P200254 NFR beslutnst\Barrieranalyse\BORA Handbook Rev 00.doc
3.4 Development of Fault Trees Modeling of the performance of the barriers is done using fault trees. Fault trees have been developed for the operational barrier systems included in the BBDs. Technical barrier systems (such as e.g. PSD) have not been modeled. This implies that the following fault trees are included:
- Failure to prevent degradation beyond acceptable limit by Preventive Maintenance - Failure to detect leak by area based leak search - Failure to detect degradation beyond acceptable limit by Condition Monitoring - Failure to detect degradation beyond acceptable limit by Inspection - Failure to detect latent error by self control - Failure to detect latent error by 3rd party control - Failure to detect latent error by leak test - Failure to detect latent error by verification of depressurized system
The fault trees have been developed with the purpose of being applicable generically, but it is underlined that it may be necessary to review these to ensure that they are suitable for the specific situation being anaysed. The fault trees are included in Appendix B.
3.5 Assignment of Generic Input Data The fault trees related to barriers include elements of human error, and a data set has been prepared to assign the probability of human error. The recommended probability figures are related to the human error descriptions given in the fault trees. Suggested HEP values are presented in Table 4 for failures which are related to initiating events belonging to the groups A and B.

BORA project Operational risk analysis – Total analysis of physical and non-physical barriers BORA Handbook –Rev. 00
11
J:\prosjekt\P200254 NFR beslutnst\Barrieranalyse\BORA Handbook Rev 00.doc
Table 4 Suggested Human Error Probability Assignments to be used for Modeling of Barrier Fault Trees
Initiating Event Human Error Description Recommended HEP Assignment
Lower Assignment
Upper Assignment
Average
A. Technical degradation of system
Failure to prevent degradation due to errors in manuals, procedures, datasheets etc.
3 ⋅ 10-4 2 ⋅ 10-2 3 ⋅ 10-3
Failure to prevent degradation – manuals, procedures, datasheets etc. not used
1 ⋅ 10-3 1 ⋅ 10-2 5 ⋅ 10-3
Failure to prevent degradation – manuals, procedures, datasheets etc. not used correctly
1 ⋅ 10-2 1 ⋅ 10-1 5 ⋅ 10-2
Failure to detect error due to error in manuals, procedures, plans
3 ⋅ 10-4 2 ⋅ 10-2 3 ⋅ 10-3
Failure to detect error – manuals, procedures, datasheets etc. not used
1 ⋅ 10-3 1 ⋅ 10-2 5 ⋅ 10-3
Failure to detect error – manuals, procedures, datasheets etc. not used correctly
1 ⋅ 10-2 1 ⋅ 10-1 5 ⋅ 10-2
Failure to detect leak manually 5 ⋅ 10-3 5 ⋅ 10-2 3 ⋅ 10-2 B. Human intervention introducing latent error
Failure to detect error due to error in checklists
6 ⋅ 10-4 1 ⋅ 10-2 3 ⋅ 10-3
Failure to detect error – checklists not used
1 ⋅ 10-3 1 ⋅ 10-2 5 ⋅ 10-3
Failure to detect error – checklists not used correctly
2 ⋅ 10-2 2 ⋅ 10-1 1 ⋅ 10-1
Failure to detect error due to error in procedures
3 ⋅ 10-4 2 ⋅ 10-2 3 ⋅ 10-3
Failure to detect error – procedures not used
1 ⋅ 10-3 1 ⋅ 10-2 5 ⋅ 10-3
Failure to detect error – procedures not used correctly
1 ⋅ 10-2 1 ⋅ 10-1 5 ⋅ 10-2
The values shown in the above table are based on a number of sources:
Swain and Guttman [3] Reason [4] Blackman and Gertman [5] Kirwan I [6] Kirwan II [7]
The values in the table represent a “best estimate” from the various sources consulted, but should primarily be seen as giving an indication of the order of magnitude of the various values. Further information can be found in the BORA Generalisation Report (Ref. 1) Other probabilities required as input to the fault trees will have to be based on platform specific information. This includes probabilities of technical failure, probabilities related to implementation of programs and procedures, work practice etc.
BORA project Operational risk analysis – Total analysis of physical and non-physical barriers BORA Handbook –Rev. 00
12
J:\prosjekt\P200254 NFR beslutnst\Barrieranalyse\BORA Handbook Rev 00.doc
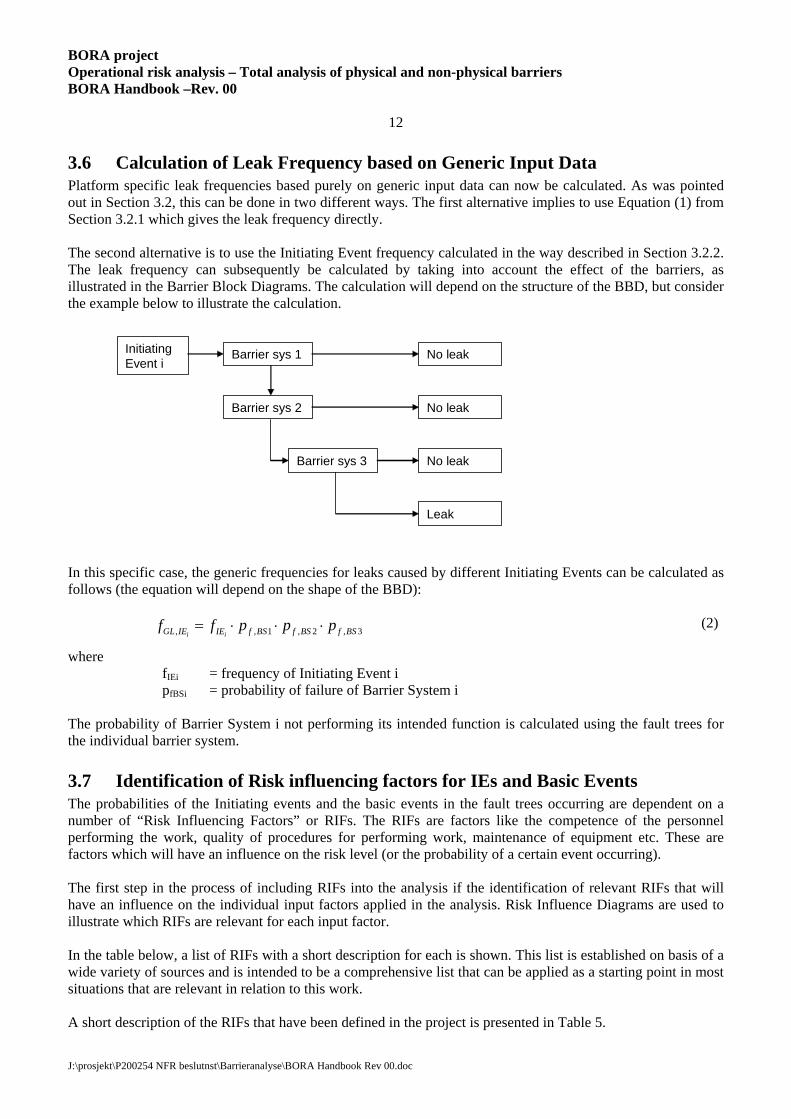
3.6 Calculation of Leak Frequency based on Generic Input Data Platform specific leak frequencies based purely on generic input data can now be calculated. As was pointed out in Section 3.2, this can be done in two different ways. The first alternative implies to use Equation (1) from Section 3.2.1 which gives the leak frequency directly. The second alternative is to use the Initiating Event frequency calculated in the way described in Section 3.2.2. The leak frequency can subsequently be calculated by taking into account the effect of the barriers, as illustrated in the Barrier Block Diagrams. The calculation will depend on the structure of the BBD, but consider the example below to illustrate the calculation. In this specific case, the generic frequencies for leaks caused by different Initiating Events can be calculated as follows (the equation will depend on the shape of the BBD): (2) where fIEi = frequency of Initiating Event i
pfBSi = probability of failure of Barrier System i The probability of Barrier System i not performing its intended function is calculated using the fault trees for the individual barrier system.
3.7 Identification of Risk influencing factors for IEs and Basic Events The probabilities of the Initiating events and the basic events in the fault trees occurring are dependent on a number of “Risk Influencing Factors” or RIFs. The RIFs are factors like the competence of the personnel performing the work, quality of procedures for performing work, maintenance of equipment etc. These are factors which will have an influence on the risk level (or the probability of a certain event occurring). The first step in the process of including RIFs into the analysis if the identification of relevant RIFs that will have an influence on the individual input factors applied in the analysis. Risk Influence Diagrams are used to illustrate which RIFs are relevant for each input factor. In the table below, a list of RIFs with a short description for each is shown. This list is established on basis of a wide variety of sources and is intended to be a comprehensive list that can be applied as a starting point in most situations that are relevant in relation to this work. A short description of the RIFs that have been defined in the project is presented in Table 5.
Leak
No leak
No leak
No leak
Barrier sys 3
Barrier sys 2
Barrier sys 1Initiating Event i
, , 1 , 2 , 3i iGL IE IE f BS f BS f BSf f p p p= ⋅ ⋅ ⋅

BORA project Operational risk analysis – Total analysis of physical and non-physical barriers BORA Handbook –Rev. 00
13
J:\prosjekt\P200254 NFR beslutnst\Barrieranalyse\BORA Handbook Rev 00.doc
Table 5 Description of risk influencing factors (RIFs).
RIF group RIF Covering aspects related to Competence Competence, experience, system knowledge and training of personnel Working load/stress General working load on persons (the sum of all tasks and activities) Work environment Physical working environment like noise, light, vibration, use of chemical substances, etc.
Personnel
Fatigue Fatigue of the person, e.g., due to night shift and extensive use of overtime Methodology Methodology used to carry out a specific task. Task supervision Supervision of specific tasks by a supervisor (e.g., by operations manager or mechanical
supervisor Task complexity Complexity of a specific task Time pressure Time pressure in the planning, execution and finishing of a specific task Tools Availability and operability of necessary tools in order to perform a task.
Task
Spares Availability of the spares needed to perform the task. Equipment design Design of equipment and systems such as flange type (ANSI or compact), valve type, etc. Material properties Properties of the selected material with respect to corrosion, erosion. fatigue, gasket
material properties, etc. Process complexity General complexity of the process plant as a whole HMI (Human Machine Interface)
Human-machine interface such as ergonomic factors, labeling of equipment, position feedback from valves, alarms, etc.
Maintainability/ accessibility
Maintainability of equipment and systems like accessibility to valves and flanges, space to use necessary tools, etc.
System feedback How errors and failures are instantaneously detected, due to alarm, failure to start, etc.
Technical system
Technical condition Condition of the technical system Procedures Quality and availability of permanent procedures and job/task descriptions Work permit System for work permits, like application, review, approval, follow-up, and control Disposable work descriptions
Quality and availability of disposable work descriptions like Safe Job analysis (SJA) and isolation plans
Administrative control
Documentation Quality, availability, and updating of drawings, P&IDs, etc. Programs Extent and quality of programs for preventive maintenance (PM), condition monitoring
(CM), inspection, 3rd party control of work, use of self control/checklists, etc. One important aspect is whether PM, CM, etc., is specified
Work practice Common practice during accomplishment of work activities. Factors like whether procedures and checklists are used and followed, whether shortcuts are accepted, focus on time before quality, etc.
Supervision Supervision on the platform like follow- up of activities, follow-up of plans, deadlines, etc.Communication Communication between different actors like area platform manager, supervisors, area
technicians, maintenance contractors, CCR technicians, etc. Tidiness and cleaning
General cleaning and tidiness in different areas on the platform
Support systems Quality of data support systems like SAP, etc Acceptance criteria Definitions of specific acceptance criteria related to for instance condition monitoring,
inspection, etc. Simultaneous activities
Amount of simultaneous activities, either planned (like maintenances and modifications) and unplanned (like shutdown)
Organisational factors
Management of changes
Changes and modifications
The intention is that this list of RIFs is considered for each input parameter (Initiating Events, Basic Events in fault tree) and that only the most important RIFs for each parameter is selected. Typically, of the order 3-5 RIFs are selected for each parameter. There will often be many more RIFs that may have an effect, but by selecting the 3-5 most important ones, good coverage is achieved in most cases. A recommended method for selecting the most important RIFs is described in Section 3.9.1.

BORA project Operational risk analysis – Total analysis of physical and non-physical barriers BORA Handbook –Rev. 00
14
J:\prosjekt\P200254 NFR beslutnst\Barrieranalyse\BORA Handbook Rev 00.doc
3.8 Assignment of weights and scores of Risk Influencing Factors Weighting of the RIFs is an assessment of the effect (or importance) the RIFs has on the frequency or probability of occurrence of the basic events. The weights of the RIFs correspond to the relative difference in the frequency or probability of occurrence of an event if the status of the RIF is changed from A (best standard) to F (worst practice). A five point scale (from high importance to low importance) is applied. Quantitatively, the RIFs are given relative weights on the scale 10 – 8 – 6 – 4 – 2. Finally, the weights are normalized as the sum of the weights for the RIFs influencing a basic event should be equal to 1. An example of the weighting process (qualitative assessment) and the normalized weights are shown in Table 6. Table 6 Example of the weighting process.
B1 Release due to incorrect blinding/isolation B2 3rd party control of work E2 3rd party control of work specified but not performed
Importance (weight) Normalized weight RIF Description High (10)
(8)
(6)
(4)
Low (2)
Time pressure X 0.09 Work practice X 0.45 Supervision X 0.27 Communication X 0.18 WEIGHT 10 0 6 4 2 TOTAL WEIGHT 22 1.00
Scoring of the risk influencing factors implies to assign a score to each identified RIF in the risk influence diagrams. Each RIF is given a score from A to F, where score A corresponds to the best standard in the industry, score C corresponds to industry average, and score F corresponds to worst practice in the industry (see Table 7). Table 7 Generic scheme for scoring of RIFs.
Score Explanation A Status corresponds to the best standard in industry B Status corresponds to a level better than industry average C Status corresponds to the industry average D Status corresponds to a level slightly worse than industry average E Status corresponds to a level considerably worse than industry average F Status corresponds to the worst practice in industry
3.9 Collection of data for Risk Influencing Factors (RIFs) 3.9.1 Data sources for scoring of RIFs Information for scoring of RIFs can potentially be available from several sources:
- Collecting data specifically through work meetings is potentially the best option, also for scoring of RIFs (Ref Section 3.9.2).
- Use of RNNS questionnaire data – As part of the RNNS project, questionnaire surveys are performed biannually and these questionnaires also contain some questions that are relevant to give indications of the status of some of the RIFs. By looking at the specific answers from the installation being looked at (which the operator will have access to) and comparing this with the North Sea average (available in

BORA project Operational risk analysis – Total analysis of physical and non-physical barriers BORA Handbook –Rev. 00
15
J:\prosjekt\P200254 NFR beslutnst\Barrieranalyse\BORA Handbook Rev 00.doc
the RNNS reports), it is possible to form a judgment of the “state” (i.e. the score) of a particular RIF for the particular installation. This could potentially be a good source of information, but unfortunately relatively few of the questions are applicable so there are some limitations on the usefulness of this source.
- Use of TTS/TST data – Several operators have instigated various systems for review/audit of their safety systems. In some cases, this will also contain some information about organisational and human related factors, which in turn can be used to judge the score of some of the RIFs. This can also be valuable information source, but it is limited by the fact that focus in these systems tend to be on technical systems and not so much on the human and organisational issues.
- Use of results from MTO investigations – This is also a potential source of information. If any particular underlying causes (organisational or human) are frequently occurring, this may be an indication that the state of this particular factor is poor. This can often be related to a RIF and will thus give an indication of the score of that RIF. However, this is often more qualitative information that should mainly be used to support or adjust estimates of scores based on the previously mentioned data sources.
Based on experience from case studies, it is our conclusion that the best single source of information would be data collection in work meetings, but that this should be supplemented with additional information from the other sources as well. 3.9.2 Work Meetings collecting Expert Judgment A key element in the collection of data for Risk Influencing Factors is suggested to be use of work meetings involving operating personnel from the plant being considered. This has several advantages:
- It involves the foremost “experts” about the situation at the plant, i.e. those who work there - It ensures involvement by the workforce in the establishment of the analysis - It has turned out to be a very efficient way of obtaining the information
The overall approach that can be applied can be briefly described as follows:
- The analyst selects the Initiating Events and the Basic Events that he/she wants to obtain data for. In most cases, it is sufficient to collect data on only a selection of the Initiating Events, partly because some of the Initiating Events contribute very little (Ref. Table 2) and because there are similarities between the Barrier Block Diagrams so that when data has been collected for one, this can be applied to several. Typically, it could be required to collect data on of the order 15-25 Initiating Events and Basic Events although it is underlined that this should be considered from case to case.
- Next, the analyst does a first evaluation of which Risk Influencing Factors are relevant to include for each of the Initiating Events and Basic Events. The complete list of RIFs from Table 5 should then be considered and those that are evaluated to be the most important ones are selected for analysis. If the analyst is in doubt, it is probably better to include some additional RIFs rather than omitting someone that could be important.
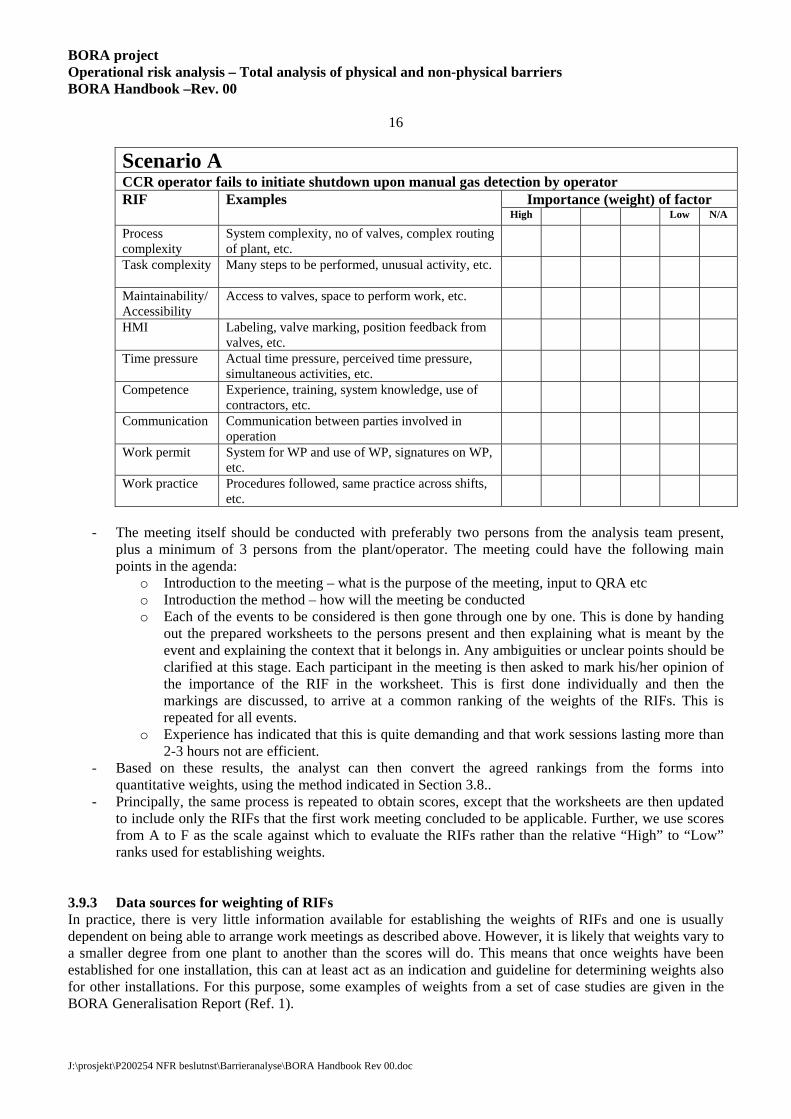
- Based on this, worksheets are prepared, with one worksheet for each Initiating Event and each Basic Event that is to be analyzed. An example of such a worksheet is shown below. In this work sheet, 9 RIFs have been identified as potential candidates for analysis. At the right side of the table, there is room to mark the relative weight (importance) of each RIF or alternatively mark it as not applicable if that is the conclusion.
BORA project Operational risk analysis – Total analysis of physical and non-physical barriers BORA Handbook –Rev. 00
16
J:\prosjekt\P200254 NFR beslutnst\Barrieranalyse\BORA Handbook Rev 00.doc
Scenario A CCR operator fails to initiate shutdown upon manual gas detection by operator
Importance (weight) of factor RIF Examples High Low N/A
Process complexity
System complexity, no of valves, complex routing of plant, etc.
Task complexity
Many steps to be performed, unusual activity, etc.
Maintainability/Accessibility
Access to valves, space to perform work, etc.
HMI Labeling, valve marking, position feedback from valves, etc.
Time pressure Actual time pressure, perceived time pressure, simultaneous activities, etc.
Competence Experience, training, system knowledge, use of contractors, etc.
Communication Communication between parties involved in operation
Work permit System for WP and use of WP, signatures on WP, etc.
Work practice Procedures followed, same practice across shifts, etc.
- The meeting itself should be conducted with preferably two persons from the analysis team present,
plus a minimum of 3 persons from the plant/operator. The meeting could have the following main points in the agenda:
o Introduction to the meeting – what is the purpose of the meeting, input to QRA etc o Introduction the method – how will the meeting be conducted o Each of the events to be considered is then gone through one by one. This is done by handing
out the prepared worksheets to the persons present and then explaining what is meant by the event and explaining the context that it belongs in. Any ambiguities or unclear points should be clarified at this stage. Each participant in the meeting is then asked to mark his/her opinion of the importance of the RIF in the worksheet. This is first done individually and then the markings are discussed, to arrive at a common ranking of the weights of the RIFs. This is repeated for all events.
o Experience has indicated that this is quite demanding and that work sessions lasting more than 2-3 hours not are efficient.
- Based on these results, the analyst can then convert the agreed rankings from the forms into quantitative weights, using the method indicated in Section 3.8..
- Principally, the same process is repeated to obtain scores, except that the worksheets are then updated to include only the RIFs that the first work meeting concluded to be applicable. Further, we use scores from A to F as the scale against which to evaluate the RIFs rather than the relative “High” to “Low” ranks used for establishing weights.
3.9.3 Data sources for weighting of RIFs In practice, there is very little information available for establishing the weights of RIFs and one is usually dependent on being able to arrange work meetings as described above. However, it is likely that weights vary to a smaller degree from one plant to another than the scores will do. This means that once weights have been established for one installation, this can at least act as an indication and guideline for determining weights also for other installations. For this purpose, some examples of weights from a set of case studies are given in the BORA Generalisation Report (Ref. 1).

BORA project Operational risk analysis – Total analysis of physical and non-physical barriers BORA Handbook –Rev. 00
17
J:\prosjekt\P200254 NFR beslutnst\Barrieranalyse\BORA Handbook Rev 00.doc
3.10 Calculation of Platform Specific Leak Frequency 3.10.1 Platform Specific input data to Basic Events The industry average probabilities/frequencies used in the quantitative analysis are adjusted in order to assign platform specific values allowing for platform specific conditions of the RIFs. The industry average probabilities/frequencies are revised based on the risk influence diagrams through an assessment of the weights and score of the RIFs. The following principles are used for adjustment of the industry average data: Prev(A) is the “installation specific” probability (or frequency) of occurrence of event A. The probability Prev(A) is determined by the following procedure; (3) where (4) Pave(A) denotes the industry average probability of occurrence of event A, wi denotes the weight (importance) of RIF no. i for event A, Qi is a measure of the status of RIF no. i, and n is the number of RIFs. Here, (5) Values for wi’s are given from the weighting process. To determine the Qi’s we need to associate a number to each of the status scores A - F. The Qi’s are determined by the following way:
• Determine Plow(A) as the lower limit for Prev(A) by expert judgment.
• Determine Phigh(A) as the upper limit for Prev(A) by expert judgment.
• Then put for i =1, 2, … n;
(6) where s denotes the score or status of RIF no i. To assign values to Qi for s = B, we assume a linear relationship between Qi (A) and Qi (C), and use sA = 1, sB = 2, sC = 3, sD = 4, sE = 5, and sF = 6. Then, (7)
/( ) 1
/
low ave
i
high ave
P P if s AQ s if s C
P P if s F
⎧ =⎪= =⎨⎪ =⎩
1
n
i i ii
k w Q=
= ⋅∑
11
n
ii
w=
=∑
( ) (1 )( )
lowB A
low avei
ave C A
Ps sP PQ BP s s
− ⋅ −= +
−
( ) ( )rev ave iP A P A k= ⋅

BORA project Operational risk analysis – Total analysis of physical and non-physical barriers BORA Handbook –Rev. 00
18
J:\prosjekt\P200254 NFR beslutnst\Barrieranalyse\BORA Handbook Rev 00.doc
To assign values to Qi for s = D and E, we assume a linear relationship between Qi (C) and Qi (F). Then, (8) Qi (E) is calculated as Qi (D) by use of sE instead of sD in equation (8). Table 8 shows some values of Qi depending of the ratio between Plow(A) and Pave(A), and Phigh(A) and Pave(A).
• Case 1: Plow(A)/Pave(A) = 0,5 and Phigh(A)/Pave(A) = 2 • Case 2: Plow(A)/Pave(A) = 0,33 and Phigh(A)/Pave(A) = 3 • Case 3: Plow(A)/Pave(A) = 0,2 and Phigh(A)/Pave(A) = 5 • Case 4: Plow(A)/Pave(A) = 0,1 and Phigh(A)/Pave(A) = 10
Table 8 Qi for selected combinations of Plow and Phigh.
Case 1 (0.5-2)
Case 2 (0.33-3)
Case 3 (0.2-5)
Case 4 (0.1-10)
A 0.5 0.33 0.2 0.1 B 0.75 0.67 0.6 0.55 C 1 1 1 1 D 1.33 1.67 2.33 4 E 1.67 2.33 3.67 7 F 2 3 5 10
3.10.2 Platform Specific Leak Frequency Calculation of a platform and operations specific leak frequency can be done as follows in practical terms:
- First, the total generic leak frequency, fGL,Total, for the platform is calculated. This is done in the way described in Section 3.6.
- The adjusted frequencies and probabilities, taking into account the effect of the RIFs, can be calculated as shown in Equation (3). Similarly, revised probabilities of occurrence of the Basic Events in the Fault Trees are also calculated and this is used to calculate a revised probability of failure of each barrier system, pfBSi’. This calculation will depend on the structure of the Fault Tree. By dividing this value with the value calculated using generic Basic Event probabilities, pfBSi, an adjustment factor kfBSi can also be calculated.
- With updated input data available, it is then possible to calculate updated leak frequencies, using fIE’ and pfBSi’ as input. The calculation will depend on the structure of the BBD.
( ) ( 1)( ) 1
highD C
avei
F C
Ps s
PQ Ds s
− ⋅ −= +
−
BORA project Operational risk analysis – Total analysis of physical and non-physical barriers BORA Handbook –Rev. 00
19
J:\prosjekt\P200254 NFR beslutnst\Barrieranalyse\BORA Handbook Rev 00.doc
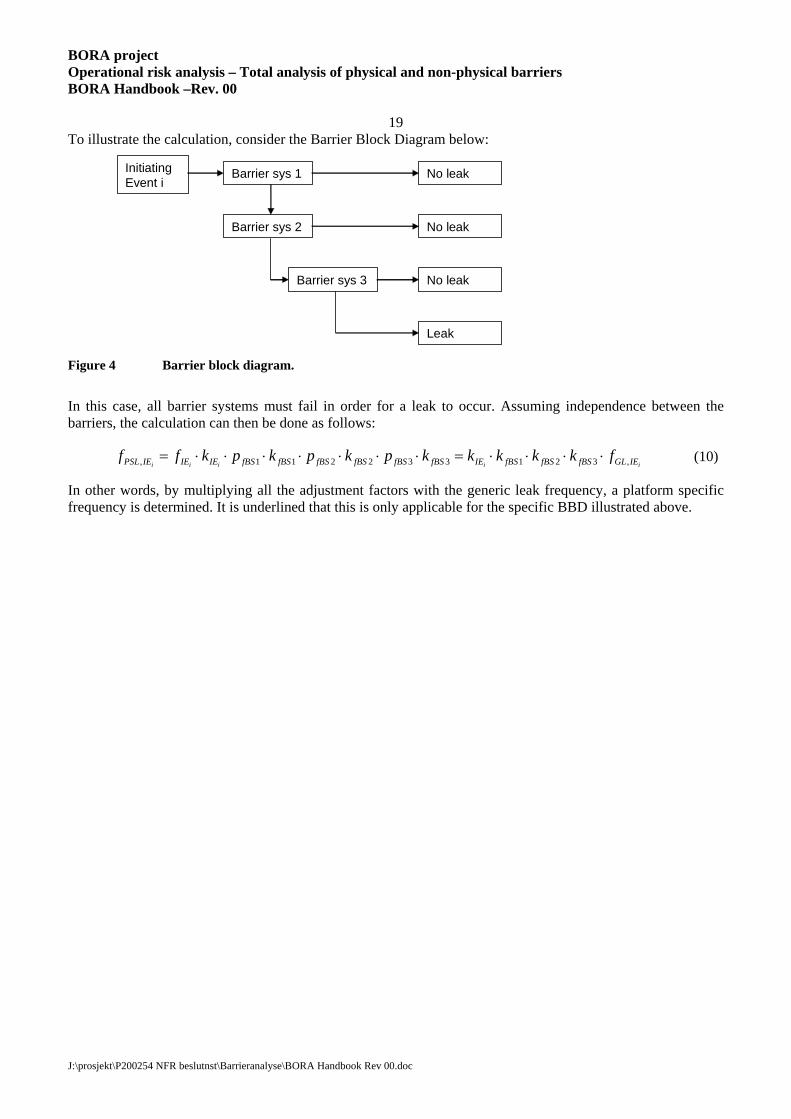
To illustrate the calculation, consider the Barrier Block Diagram below: Figure 4 Barrier block diagram.
In this case, all barrier systems must fail in order for a leak to occur. Assuming independence between the barriers, the calculation can then be done as follows: (10) In other words, by multiplying all the adjustment factors with the generic leak frequency, a platform specific frequency is determined. It is underlined that this is only applicable for the specific BBD illustrated above.
Leak
No leak
No leak
No leak
Barrier sys 3
Barrier sys 2
Barrier sys 1Initiating Event i
, 1 1 2 2 3 3 1 2 3 ,i i i i iPSL IE IE IE fBS fBS fBS fBS fBS fBS IE fBS fBS fBS GL IEf f k p k p k p k k k k k f= ⋅ ⋅ ⋅ ⋅ ⋅ ⋅ ⋅ = ⋅ ⋅ ⋅ ⋅

BORA project Operational risk analysis – Total analysis of physical and non-physical barriers BORA Handbook –Rev. 00
20
J:\prosjekt\P200254 NFR beslutnst\Barrieranalyse\BORA Handbook Rev 00.doc
4. Application in Qualitative Risk Analysis One of the important applications of the BORA approach is in qualitative risk analysis, which does not require knowledge about statistical analysis, nor use of statistical input data. This chapter discusses the use of the BORA approach for qualitative risk analysis.
4.1 Use of Qualitative BORA Analysis Qualitative BORA analysis can be used in order to identify ways to reduce operational risk during interventions into hydrocarbon process systems, in order to reduce the likelihood of having leaks which may lead to fires or explosions. The following are some proposed situations where BORA analysis may be used without calculating leak probabilities/frequencies: • HAZID sessions • Pre job review before critical interventions • HES meetings • Campaigns • Leak investigations HAZID sessions are often used in order to identify risk in the planning phase of complex interventions, such as maintenance, inspections, modifications, and thereby to identify how the potential hazards may be eliminated or reduced. This is usually done onshore, during the work package planning and review. Pre job review before critical interventions is sometimes carried out offshore, involving the relevant mainte-nance and/or process personnel, as a work preparation and review exercise, where the main purposes are to identify what may go wrong and how to prevent it. Such reviews may also serve to raise the awareness of potential hazards of the personnel involved. Most of the installations conduct regular HES meetings with the different trade groups, as a general manage-ment tool in order to increase motivation and awareness. For the relevant groups, such as mechanics, process operators, instrument technicians, etc. the BORA analysis may be used as a vehicle in order to discuss how interventions in the process systems may be carried out in the future with reduced risk of hydrocarbon leaks. The offshore organisations are regularly using campaigns in order to focus special attention on improvement of HES in various ways. BORA analysis may be used in such activities in order to increase the awareness of potential hazards of the personnel involved. If we look at accident statistics for hydrocarbon leaks in the Norwegian sector in the period 2001-05, the majority of the leaks above 0.1 kg/s are caused by operational errors, whereby operational barriers fail, see for instance Figure 27 in the BORA Generalisation report (Ref 1). The GaLeRe project in OLF has formulated ambitions goals for the Norwegian sector, that the average number of leaks in the period 2006-08 shall be 50 % of the average number of leaks in the period 2003-05, this value being 21 leaks per year. The objective is to have no more than 10 leaks per year in average in 2006-08. There will have to be a significant reduction in the number of leaks due to failure of operational barriers, in order to meet this objective. Leak reduction campaigns may be one of the efforts which may be carried out in order to contribute to a significant reduction of the number of leaks. Significant hydrocarbon leaks are usually investigated, either as an installation internal investigation or as a higher level investigation with personnel from onshore units. It may be useful to include Barrier Block
BORA project Operational risk analysis – Total analysis of physical and non-physical barriers BORA Handbook –Rev. 00
21
J:\prosjekt\P200254 NFR beslutnst\Barrieranalyse\BORA Handbook Rev 00.doc
Diagrams from the BORA approach, in order to be very specific about which barriers that failed and the causes of such failures. The investigations are often carried out as so-called MTO-investigations. The BORA diagrams should not be used as an alternative to the MTO-diagrams, but rather as additional analysis of barrier functions.
4.2 Identification of Risk Reducing Measures The main objective of risk analysis is in general to identify how hazards may be eliminated in order to reduce risks. Identification of risk reducing measures is therefore also the main purpose of qualitative BORA analysis, irrespective of which of the user situations listed above that is relevant. The use of the BORA approach in these alternative conditions will be essentially the same: • Use of the BORA barrier block diagrams in order to identify barrier functions. • Consider how barrier functions in the barrier block diagrams may fail and thus cause leaks. • Use of the BORA barrier block diagrams in order to identify how barrier failures may be prevented. For these purposes, the easiest use of the BORA approach is to follow the barrier block diagrams (see example in Figure 3 and more details in Appendix A) and the fault trees developed in the project, see Appendix B. A more advanced use would imply that dedicated barrier block diagrams and/or fault trees which are specific to the actual installation are developed. This will probably be dependent on involvement of specialist personnel for assistance in the preparation of specific diagrams.

BORA project Operational risk analysis – Total analysis of physical and non-physical barriers BORA Handbook –Rev. 00
22
J:\prosjekt\P200254 NFR beslutnst\Barrieranalyse\BORA Handbook Rev 00.doc
5. Application in Quantitative Risk Analysis This section describes a practical example of use of the BORA method for quantitative analysis. The background for the example is that an oil and gas producing platform has problems with hydrocarbon releases from flanges in the process system and want to calculate the release frequency due to releases from incorrect fitted flanges and to analyse the effect on the release frequency of some risk reducing measures.
5.1 Identification of initiating events The initiating event B2) “Incorrect fitting of flanges or bolts during maintenance” from Table 2 is selected for detailed analysis.
5.2 Assignment of generic IE frequencies The frequency of the initiating event “Incorrect fitting of flanges or bolts during maintenance” is a function of:
• The activity level on the actual platform, i.e., the total number of flange installations per year, and • The probability of human error per activity (from generic databases)
Operational experience from the platform indicates that the total number of flange installations per year on the platform is 2500. As shown in Table 9, the average probability of incorrect fitting of flanges or bolts during maintenance is equal to 5 ⋅ 10-3. Table 9 Generic input data for the initiating event.
Event Source Pave Phigh Plow Incorrect fitting of flanges or bolts during maintenance Table 3 5 ⋅ 10-3 1 ⋅ 10-2 1 ⋅ 10-3 The leak frequency due to incorrect fitting of flanges or bolts during maintenance is calculated to 0,064 releases per year.
5.3 Development of barrier block diagrams Three existing barriers may prevent release due to incorrect fitting of flanges or bolts during maintenance:
1. Self control of work 2. 3rd party control of work 3. Leak test (prior to start-up of normal production)
The barrier block diagram for this case is shown in Figure 5.

BORA project Operational risk analysis – Total analysis of physical and non-physical barriers BORA Handbook –Rev. 00
23
J:\prosjekt\P200254 NFR beslutnst\Barrieranalyse\BORA Handbook Rev 00.doc
Figure 5 Barrier block diagram for the scenario “Release due to incorrect fitting of flanges or bolts during maintenance”.
5.4 Development of fault trees Fault trees are used to analyse the probability of failure of the safety barriers illustrated in Figure 5. The following top events are analysed:
A. Failure to detect error by self control of work (see Figure 6) B. Failure to detect error by 3rd party control of work (see Figure 7) C. Failure to detect latent error by leak test (see Figure 8).
Incorrect fitting of flanges or bolts during maintenance Self control
3rd party control
Initiating event
Detect latent error
End eventBarrier functions
Error detected
Release
Error detected
Error detectedVerify correct system status by leak test
A
C
B

BORA project Operational risk analysis – Total analysis of physical and non-physical barriers BORA Handbook –Rev. 00
24
J:\prosjekt\P200254 NFR beslutnst\Barrieranalyse\BORA Handbook Rev 00.doc
Figure 6 Fault tree for the top event ”Failure to detect error by self control”.
Figure 7 Fault tree for the top event ”Failure to detect error by 3rd party control of work”.
Failure to detect error by self control
A3 A4 A5
Functionality
Insufficient level of self control/use of
checklists
Activity specified but not performed
Failure to detect error due to error in
checklists
Failure to detect error – checklists not used
Failure to detect error – checklists not used
correctly
A1 A2
Human error when preparing or uding
documentation
A
BORA project Operational risk analysis – Total analysis of physical and non-physical barriers BORA Handbook –Rev. 00
25
J:\prosjekt\P200254 NFR beslutnst\Barrieranalyse\BORA Handbook Rev 00.doc
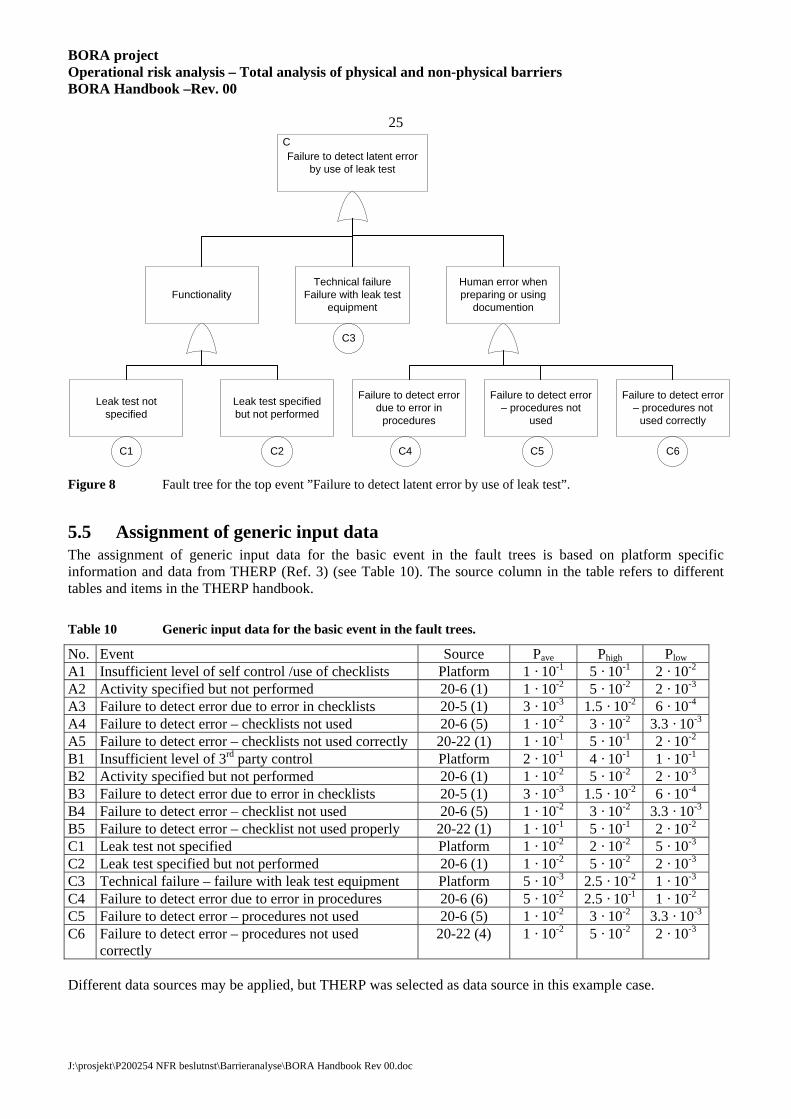
Figure 8 Fault tree for the top event ”Failure to detect latent error by use of leak test”.
5.5 Assignment of generic input data The assignment of generic input data for the basic event in the fault trees is based on platform specific information and data from THERP (Ref. 3) (see Table 10). The source column in the table refers to different tables and items in the THERP handbook. Table 10 Generic input data for the basic event in the fault trees.
No. Event Source Pave Phigh Plow A1 Insufficient level of self control /use of checklists Platform 1 · 10-1 5 · 10-1 2 · 10-2 A2 Activity specified but not performed 20-6 (1) 1 · 10-2 5 · 10-2 2 · 10-3 A3 Failure to detect error due to error in checklists 20-5 (1) 3 · 10-3 1.5 · 10-2 6 · 10-4 A4 Failure to detect error – checklists not used 20-6 (5) 1 · 10-2 3 · 10-2 3.3 · 10-3
A5 Failure to detect error – checklists not used correctly 20-22 (1) 1 · 10-1 5 · 10-1 2 · 10-2 B1 Insufficient level of 3rd party control Platform 2 · 10-1 4 · 10-1 1 · 10-1 B2 Activity specified but not performed 20-6 (1) 1 · 10-2 5 · 10-2 2 · 10-3 B3 Failure to detect error due to error in checklists 20-5 (1) 3 · 10-3 1.5 · 10-2 6 · 10-4 B4 Failure to detect error – checklist not used 20-6 (5) 1 · 10-2 3 · 10-2 3.3 · 10-3
B5 Failure to detect error – checklist not used properly 20-22 (1) 1 · 10-1 5 · 10-1 2 · 10-2 C1 Leak test not specified Platform 1 · 10-2 2 · 10-2 5 · 10-3 C2 Leak test specified but not performed 20-6 (1) 1 · 10-2 5 · 10-2 2 · 10-3 C3 Technical failure – failure with leak test equipment Platform 5 · 10-3 2.5 · 10-2 1 · 10-3 C4 Failure to detect error due to error in procedures 20-6 (6) 5 · 10-2 2.5 · 10-1 1 · 10-2 C5 Failure to detect error – procedures not used 20-6 (5) 1 · 10-2 3 · 10-2 3.3 · 10-3
C6 Failure to detect error – procedures not used correctly
20-22 (4) 1 · 10-2 5 · 10-2 2 · 10-3
Different data sources may be applied, but THERP was selected as data source in this example case.
Failure to detect latent error by use of leak test
C4 C5 C6
Functionality
Leak test not specified
Leak test specified but not performed
Failure to detect error due to error in
procedures
Failure to detect error – procedures not
used
Failure to detect error – procedures not
used correctly
C1 C2
Technical failureFailure with leak test
equipment
C3
Human error when preparing or using
documention
C

BORA project Operational risk analysis – Total analysis of physical and non-physical barriers BORA Handbook –Rev. 00
26
J:\prosjekt\P200254 NFR beslutnst\Barrieranalyse\BORA Handbook Rev 00.doc
5.6 Calculation of leak frequency based on generic input data The leak frequency based on generic input data may be calculated by use of equation (2). The results of the calculations are summarized in Table 11. Table 11 Results from calculation of the leak frequency by use of generic input data.
Event Result F (initiating event) per year 12.5 P (failure of barrier A) 0.21 P (failure of barrier B) 0.30 P (failure of barrier C) 0.08 Leak frequence per year 0.064
The leak frequency based on generic input data due to incorrect fitting of flanges or bolts during maintenance is calculated to 0.064 per year by use of data from Table 10.
5.7 Identification of RIFs for IEs and Basic events Risk influence diagrams have been developed for the initiating events and all the basic events in the fault trees. An illustration of a risk influence diagram for basic event “A2 Activity specified but not performed” is shown in Figure 9. The risk influencing diagrams for the other basic events are not illustrated, but the risk influencing factors for the other basic events is shown in Table 13, Table 14 and Table 15.
Figure 9 Risk influence diagram for basic event ”A2 Activity specified but not performed”.
5.8 Assignment of weights and scores of RIFs Scoring of the risk influencing factors implies to assign a score to each identified RIF in the risk influence diagrams. Each RIF is given a score from A to F, where score A corresponds to the best standard in the industry, score C corresponds to industry average, and score F corresponds to worst practice in the industry (see Table 7). The scores for the example case are shown in Table 12, Table 13, Table 14 and Table 15. The maximum number of risk influencing factors for each event was limited to 6 in this example study. Different approaches for how to carry out the scoring process are presented in section 3.9. Weighting of the RIFs is an assessment of the effect (or importance) the RIFs has on the frequency or probability of occurrence of the basic events. The weights of the RIFs correspond to the relative difference in

BORA project Operational risk analysis – Total analysis of physical and non-physical barriers BORA Handbook –Rev. 00
27
J:\prosjekt\P200254 NFR beslutnst\Barrieranalyse\BORA Handbook Rev 00.doc
the frequency or probability of occurrence of an event if the status of the RIF is changed from A (best standard) to F (worst practice). The weighting of the RIFs in this example was done by the project group in work shops. A five point scale (from high importance to low importance) was applied. Quantitatively, the RIFs were given relative weights on the scale 10 – 8 – 6 – 4 – 2. Finally, the weights were normalized as the sum of the weights for the RIFs influencing a basic event should be equal to 1 (see Equation 5). The results of the weighting process (qualitative assessment) and the normalized weights are shown in Table 12, Table 13, Table 14 and Table 15. Table 12 Status and weights for the initiating event.
Release due to incorrect fitting of flanges Incorrect fitting of flanges or bolts during maintenance RIF Status / score Importance
(weight) Normalized
weight Competence D 10 0.25 Methodology C 6 0.15 Time pressure E 6 0.15 Maintainability/accessibility C 6 0.15 Disposable work descriptions D 6 0.15 Work practice E 6 0.15

BORA project Operational risk analysis – Total analysis of physical and non-physical barriers BORA Handbook –Rev. 00
28
J:\prosjekt\P200254 NFR beslutnst\Barrieranalyse\BORA Handbook Rev 00.doc
Table 13 Status and weights for “self control of work”.
Release due to incorrect fitting of flanges Failure to detect error by self control of work RIF Status / score Importance
(weight) Normalized
weight A1 Insufficient level of self control Programs C 10 0.63 Methodology C 6 0.38 A2 Activity specified but not performed Competence D 2 0.05 Working load/stress C 6 0.16 Task supervision C 4 0.11 Time pressure E 10 0.26 Work practice E 10 0.26 Communication C 6 0.16 A3 Failure to detect error due to error in checklists Procedures C 4 0.12 Work permit D 6 0.18 Disposable work descriptions D 10 0.29 Documentation C 8 0.24 Supervision C 2 0.06 Communication C 4 0.12 A4 Failure to detect error – checklists not used Competence C 2 0.06 Working load/stress C 6 0.19 Time pressure E 6 0.19 Procedures C 4 0.13 Work practice E 10 0.31 Communication C 4 0.13 A5 Failure to detect error – checklists not used correctly Competence C 10 0.38 Fatigue C 2 0.08 Time pressure E 4 0.15 Maintainability/accessibility C 6 0.23 Work practice E 2 0.08 Communication C 2 0.08

BORA project Operational risk analysis – Total analysis of physical and non-physical barriers BORA Handbook –Rev. 00
29
J:\prosjekt\P200254 NFR beslutnst\Barrieranalyse\BORA Handbook Rev 00.doc
Table 14 Status and weights for “3rd party control of work”.
Release due to incorrect fitting of flanges Failure to detect error by 3rd party control of work RIF Status / score Importance
(weight) Normalized
weight B1 Insufficient level of 3rd party control Programs for 3rd party control C 10 0.63 Methodology C 6 0.38 B2 Activity specified but not performed Competence D 2 0.07 Working load/stress C 4 0.13 Task supervision C 4 0.13 Time pressure E 8 0.27 Work practice E 10 0.33 Communication C 2 0.07 B3 Failure to detect error due to error in checklists Procedures C 4 0.11 Work permit D 6 0.16 Disposable work descriptions D 10 0.26 Documentation C 8 0.21 Supervision C 2 0.05 Communication C 8 0.21 B4 Failure to detect error – checklists not used Competence C 2 0.06 Working load/stress C 4 0.12 Time pressure E 8 0.24 Procedures C 4 0.12 Work practice E 10 0.29 Communication C 6 0.18 B5 Failure to detect error – checklists not used correctly Competence C 10 0.28 Fatigue C 4 0.11 Time pressure E 6 0.17 Maintainability/accessibility C 6 0.17 Work practice E 4 0.11 Communication C 6 0.17

BORA project Operational risk analysis – Total analysis of physical and non-physical barriers BORA Handbook –Rev. 00
30
J:\prosjekt\P200254 NFR beslutnst\Barrieranalyse\BORA Handbook Rev 00.doc
Table 15 Status and weights for “leak test”.
Release due to incorrect fitting of flanges Failure to detect latent error by use of leak test RIF Status / score Importance
(weight) Normalized
weight C1 Leak test not specified Program for leak test E 10 1.0 C2 Leak test specified but not performed Competence D 2 0.06 Working load/stress C 6 0.17 Task supervision C 6 0.17 Time pressure E 6 0.17 Work practice E 10 0.28 Communication C 6 0.17 C3 Technical failure – Failure with leak test equipment Tools B 6 0.19 Equipment design C 4 0.13 Material properties D 2 0.06 Maintainability/accessibility C 2 0.06 Technical condition C 10 0.31 Programs E 8 0.25 C4 Failure to detect error due to error in procedures Procedures C 4 0.13 Work permit D 4 0.13 Disposable work descriptions D 4 0.13 Documentation C 10 0.31 Supervision C 4 0.13 Communication C 6 0.19 C5 Failure to detect error – procedures not used Competence C 2 0.06 Working load/stress C 4 0.13 Time pressure E 6 0.19 Procedures C 4 0.13 Work practice E 10 0.31 Communication C 6 0.19 C6 Failure to detect error – procedures not used correctly Competence C 10 0.29 Fatigue C 2 0.06 Time pressure E 8 0.24 Maintainability/accessibility C 6 0.18 Work practice E 2 0.06 Communication C 6 0.18

BORA project Operational risk analysis – Total analysis of physical and non-physical barriers BORA Handbook –Rev. 00
31
J:\prosjekt\P200254 NFR beslutnst\Barrieranalyse\BORA Handbook Rev 00.doc
5.9 Calculation of platform specific leak frequency The platform specific leak frequency is calculated in two steps by use of the formulas in section 3.10. 1. Adjustment of the probability of occurrence of the basic events (3) where (4) Pave(A) denotes the industry average probability of occurrence of event A, wi denotes the weight (importance) of RIF no. i for event A, Qi is a measure of the status of RIF no. i, and n is the number of RIFs. Here, (5) 2. Calculation of revised platform specific leak frequency by use of the revised input data for the basic events
as input to the event tree and fault tree analyses. Table 16 Results of calculations by use of revised input data.
Event Result F (Initiating event) per year 16.7 P (failure of barrier A) 0.28 P (failure of barrier B) 0.37 P (failure of barrier C) 0.12 Leak frequency per year 0.21
The leak frequency due to incorrect fitting of flanges or bolts during maintenance increased from 0.064 per year by use of generic input data to 0.21 per year by use of data taking platform specific condition of risk influencing factors. The increase in percentages is 228 %
5.10 Sensitivity Analysis / Evaluation of Risk Reducing Measures Two risk reducing measures are suggested in order to reduce the leak frequency due to incorrect fitting of flanges or bolts during maintenance:
A. Reduce the time pressure B. Reduce the time pressure and improve the work practice
The time pressure is reduced such that the score of the RIF time pressure is changed from E to C. The sensitivity analysis shows that this improvement reduces the leak frequency down to 0.14 leaks per year. This is a reduction of 33 %. The second risk reducing measure is to reduce both the time pressure and improving the work practice at the same time. The scores of both RIFs are changed from E to C. The sensitivity analysis shows that this risk reduction option reduces the leak frequency down to 0.095 leaks per year. This is a reduction of 55 %.
1
n
i i ii
k w Q=
= ⋅∑
11
n
ii
w=
=∑
( ) ( )rev ave iP A P A k= ⋅

BORA project Operational risk analysis – Total analysis of physical and non-physical barriers BORA Handbook –Rev. 00
32
J:\prosjekt\P200254 NFR beslutnst\Barrieranalyse\BORA Handbook Rev 00.doc
5.11 Example study – concluding remarks A practical example how to use the BORA method is described in this chapter. The example illustrates the qualitative as well as the quantitative application of the BORA method. The qualitative parts of the analyses are the barrier block diagrams, the qualitative part of the fault trees and the risk influence diagrams and show which factors influence the leak frequency. The quantitative part of the BORA method may be used to analyse how much the different factors influence the release frequency. Further, the example case has shown how the BORA method may be used to calculate the effect of risk reducing measures.

BORA project Operational risk analysis – Total analysis of physical and non-physical barriers BORA Handbook –Rev. 00
33
J:\prosjekt\P200254 NFR beslutnst\Barrieranalyse\BORA Handbook Rev 00.doc
6. References 1 Haugen et al: BORA Generalisation report, Preventor report no 200254-07, 31.1.2007 2 Together for Safety: “Definition of barriers” 3 Swain, AD and Guttmann HE: Handbook of Human Reliability Analysis with Emphasis on Nuclear
Power Plant Applications, U.S. Nuclear regulatory commission report NUREG/CR-1278, SAND80-020, August 1983
4 Reason, J: Managing the Risks of Organizational Accidents, Ashgate Publishing Company, Burlington,
1997. 5 Blackman, HS and Gertman, DI: Human Reliability and Safety Analysis Data Handbook, John Wiley &
Sons, 1994. 6 Kirwan, B: A Guide to Practical Human Reliability Assessment, Taylor & Francis Ltd., 1994. 7 Kirwan, B: Human Factors & Human Reliability in Offshore Systems, Course arranged at SINTEF,
Trondheim, May 11-13 1998.

(blank page)

operasjonell risikoanalyse
BORA
Barriere- &
Operational Risk Analysis – Total Analysis of Physical and Non-physical Barriers
BORA Handbook
Appendix A Barrier Block Diagrams
29.06.2007

(blank page)

BORA project Operational risk analysis – Total analysis of physical and non-physical barriers BORA Handbook – Appendix A – Rev 00
1
J:\prosjekt\P200254 NFR beslutnst\Barrieranalyse\BORA Handbook Appendix A Barrier Block Diagrams Rev 00.doc
1. Barrier Block Diagrams The event sequence following on from the initiating event is visualized in a barrier block diagram as illustrated in Figure 1. A barrier block diagram consists of an initiating event, arrows that show the event sequence, barrier functions realized by barrier systems, and possible outcomes. An arrow straight on indicates that a barrier system functions (i.e., fulfill its function), whereas an arrow downwards indicates failure to fulfill the barrier function. In our case, the undesirable event is release of hydrocarbons (loss of containment).
Initiating event(Deviation from
normal situation)
Undesirable event
”Safe state”Barrier functionrealized by a
barrier system Functions
Fails
Figure 1 Illustration of a barrier block diagram.
One main purpose of a barrier block diagram is to illustrate available barrier functions intended to prevent a deviation (i.e. an initiating event) from escalating into a release, and how these functions are realized by barrier systems. In this section, the Barrier Block Diagrams for the Initiating Events are presented. Each BBD is accompanied by a table with some information about the Initiating Events. No BBDs have been prepared for the following types of Initiating Events:
- C. Human intervention causing immediate release: This is a special type of deviation which involves human intervention but where the operation directly causes a release. One example could be an operator that opens a wrong valve on a system causing a release. This means that there are no barriers to prevent the release after the Initiating Event has occurred.
- E. Inherent design errors: Characteristic for these are that they are not known and that it is not meaningful or possible to introduce barriers specifically to protect against these types of deviations. The best way of protecting against this is a robust design, with ample safety margins and a “defense-in-depth” strategy.
- F. External events: These are not process related as such and in order to prevent release due to these causes, one needs to look at other types of operations than those related to the process system as such.

BORA project Operational risk analysis – Total analysis of physical and non-physical barriers BORA Handbook – Appendix A – Rev 00
2
J:\prosjekt\P200254 NFR beslutnst\Barrieranalyse\BORA Handbook Appendix A Barrier Block Diagrams Rev 00.doc
Initiating event A. Technical degradation of system identified during PM General description Characterized as a (slow) degradation of the system until a release eventually occurs. To prevent a release, the deteriorating components must be replaced in time. Specific Events:
• A1 Degradation of valve sealing • A2 Degradation of flange gasket • A3 Loss of bolt tensioning
Operational mode when failure is introduced During normal production (slow degradation) Operational mode at time of release During normal production or during process disturbances ( resulting in e.g. increased pressures) Assumptions
• All leaks > 0.1 kg/s are reported to the PSA. The leaks have therefore split into two categories in the block diagrams, leaks < 0.1 kg/s and leaks > 0.1 kg/s.
• Area based leak search is not considered to be a barrier system for leaks exceeding 0.1 kg/s. These are assumed detected by the automatic gas detection system or by personnel in the area.
Degradation beyond acceptable limit
PM
Area based leak search
Initiating event
Prevent degradation beyond acceptable limit Detect release <0.1 kg/s
End eventBarrier functions
Degradation prevented
Release
Leak detected
Release > 0,1 kg/s
Release < 0,1 kg/s
- Valve sealing- Flange gasket - Loss of bolt tensioning

BORA project Operational risk analysis – Total analysis of physical and non-physical barriers BORA Handbook – Appendix A – Rev 00
3
J:\prosjekt\P200254 NFR beslutnst\Barrieranalyse\BORA Handbook Appendix A Barrier Block Diagrams Rev 00.doc
Initiating event A. Technical degradation of system identified during inspection and/or condition monitoring General description Characterized as a (slow) degradation of the system until a release eventually occurs. To prevent a release, it is necessary to detect the degradation in time. Example of degradation mechanisms
• A.4 Fatigue/crack • A.5 Internal corrosion • A.6 External corrosion • A.7 Erosion
Operational mode when failure is introduced During normal production (slow degradation) Operational mode at time of release During normal production or during process disturbances ( resulting in e.g. increased pressures) Assumptions
• All leaks > 0.1 kg/s are reported to the PSA. The leaks have therefore split into two categories in the block diagrams, leaks < 0.1 kg/s and leaks > 0.1 kg/s.
• Area based leak search is not considered to be a barrier system for leaks exceeding 0.1 kg/s. These are assumed detected by the automatic gas detection system or by personnel in the area.
Degradation beyond acceptable limit Condition Monitoring
Area based leak search
Initiating event
Detect degradation beyond acceptable limit Detect release < 0.1 kg/s
End eventBarrier functions
Degradation detected
Release
Leak detected
- Fatigue- Internal corrosion- External corrosion- Erosion
Release > 0,1 kg/s
Release < 0,1 kg/s
Inspection Degradation detected

BORA project Operational risk analysis – Total analysis of physical and non-physical barriers BORA Handbook – Appendix A – Rev 00
4
J:\prosjekt\P200254 NFR beslutnst\Barrieranalyse\BORA Handbook Appendix A Barrier Block Diagrams Rev 00.doc
Initiating event B. Human intervention introducing latent error General description Characterized by a person performing some operation on the system and this introduces an error that at later will cause a release if not detected. To avoid a release, means to detect the errors in time are necessary. Example of latent error
• B.1 Incorrect blinding/isolation • B.2 Incorrect fitting of flanges or bolts • B.3 Valve(s) in incorrect position after maintenance • B.4 Erroneous choice/installation of sealing device • B.5 Maloperation of valve(s) during manual operation • B.6 Maloperation of temporary hoses
Operational mode when failure is introduced During maintenance or normal production Operational mode at time of release During start-up after maintenance or later during normal production Assumptions
Latent error introduced during manual intervention Self control
3rd party control
Initiating event
Detect latent error
End eventBarrier functions
”Error detected
Release
Error detected- Incorrect blinding/ isolation- Incorrect fitting of flanges/ bolts during maintenance- Valve(s) in incorrect position after maintenance- Erroneous choice/ installation of sealing device- Maloperation of valve(s) during maual operation- Maloperation of temporary hoses
Error detectedVerify correct system status

BORA project Operational risk analysis – Total analysis of physical and non-physical barriers BORA Handbook – Appendix A – Rev 00
5
J:\prosjekt\P200254 NFR beslutnst\Barrieranalyse\BORA Handbook Appendix A Barrier Block Diagrams Rev 00.doc
Initiating event D. Process disturbance General description All deviations which are “internal” to the process system, whether caused by the production flow (e.g. a well behaving erratically) or by a process operator error (e.g. opening or closing wrong valves). In these cases, it is the operation of the process system itself that causes the release. Example of process disturbance
• D.1 Overpressure • D.2 Overflow/overfilling
Operational mode when failure is introduced During start-up, shutdown or normal production Operational mode at time of release During start-up, shutdown or normal production Assumptions
Process upsets/ operational errors
Primary protection (e.g. PSD....)
Secondary protection (e.g. PSV, HIPPS, ....)
Initiating event
Prevent overpressure/
overfillingPrevent release
End eventBarrier functions
Situation under control
Release
Situation under control
- Overpressure- Overfilling
Situation under controlDesign margins

(blank page)
operasjonell risikoanalyse
BORA
Barriere- &
Operational Risk Analysis – Total Analysis of Physical and Non-physical Barriers
BORA Handbook
Appendix B Fault Trees
29.06. 2007

(blank page)

BORA project Operational risk analysis – Total analysis of physical and non-physical barriers BORA Handbook – Appendix B – Rev 00
J:\prosjekt\P200254 NFR beslutnst\Barrieranalyse\BORA Handbook Appendix B Fault Trees Rev 00.doc
Overview of figures
FIGURE 4 FAULT TREE FOR THE BARRIER SYSTEM ”PM”.......................................................................................................................... 1 FIGURE 5 FAULT TREE FOR THE BARRIER SYSTEM ”AREA BASED LEAK SEARCH”...................................................................................... 2 FIGURE 6 FAULT TREE FOR THE BARRIER SYSTEM ”CONDITION MONITORING” ......................................................................................... 3 FIGURE 7 FAULT TREE FOR THE BARRIER SYSTEM ”INSPECTION” ............................................................................................................. 4 FIGURE 8 FAULT TREE FOR THE BARRIER SYSTEM ”SELF CONTROL”......................................................................................................... 5 FIGURE 9 FAULT TREE FOR THE BARRIER SYSTEM “3RD PARTY CONTROL” ............................................................................................... 6 FIGURE 10 FAULT TREE FOR THE BARRIER SYSTEM “VERIFICATION OF SYSTEM STATUS – BY USE OF LEAK TEST” ........................................ 7 FIGURE 11 FAULT TREE FOR THE BARRIER SYSTEM “VERIFICATION OF SYSTEM STATUS – DEPRESSURIZED SYSTEM” ................................... 8

BORA project Operational risk analysis – Total analysis of physical and non-physical barriers BORA Handbook – Appendix B – Rev 00
J:\prosjekt\P200254 NFR beslutnst\Barrieranalyse\BORA Handbook Appendix B Fault Trees Rev 00.doc
(blank page)
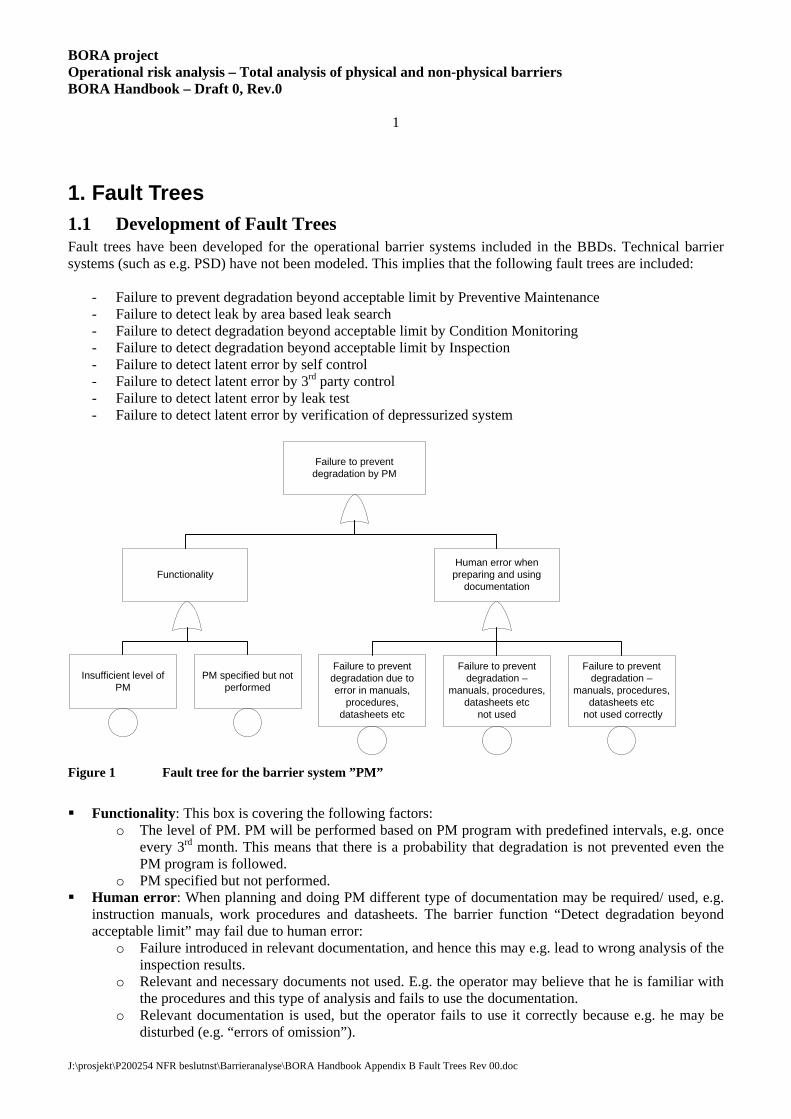
BORA project Operational risk analysis – Total analysis of physical and non-physical barriers BORA Handbook – Draft 0, Rev.0
1
J:\prosjekt\P200254 NFR beslutnst\Barrieranalyse\BORA Handbook Appendix B Fault Trees Rev 00.doc
1. Fault Trees 1.1 Development of Fault Trees Fault trees have been developed for the operational barrier systems included in the BBDs. Technical barrier systems (such as e.g. PSD) have not been modeled. This implies that the following fault trees are included:
- Failure to prevent degradation beyond acceptable limit by Preventive Maintenance - Failure to detect leak by area based leak search - Failure to detect degradation beyond acceptable limit by Condition Monitoring - Failure to detect degradation beyond acceptable limit by Inspection - Failure to detect latent error by self control - Failure to detect latent error by 3rd party control - Failure to detect latent error by leak test - Failure to detect latent error by verification of depressurized system
Failure to prevent degradation by PM
Functionality
Insufficient level of PM
PM specified but not performed
Failure to prevent degradation due to error in manuals,
procedures, datasheets etc
Failure to prevent degradation –
manuals, procedures, datasheets etc
not used
Failure to prevent degradation –
manuals, procedures, datasheets etc
not used correctly
Human error when preparing and using
documentation
Figure 1 Fault tree for the barrier system ”PM”
Functionality: This box is covering the following factors:
o The level of PM. PM will be performed based on PM program with predefined intervals, e.g. once every 3rd month. This means that there is a probability that degradation is not prevented even the PM program is followed.
o PM specified but not performed. Human error: When planning and doing PM different type of documentation may be required/ used, e.g.
instruction manuals, work procedures and datasheets. The barrier function “Detect degradation beyond acceptable limit” may fail due to human error:
o Failure introduced in relevant documentation, and hence this may e.g. lead to wrong analysis of the inspection results.
o Relevant and necessary documents not used. E.g. the operator may believe that he is familiar with the procedures and this type of analysis and fails to use the documentation.
o Relevant documentation is used, but the operator fails to use it correctly because e.g. he may be disturbed (e.g. “errors of omission”).
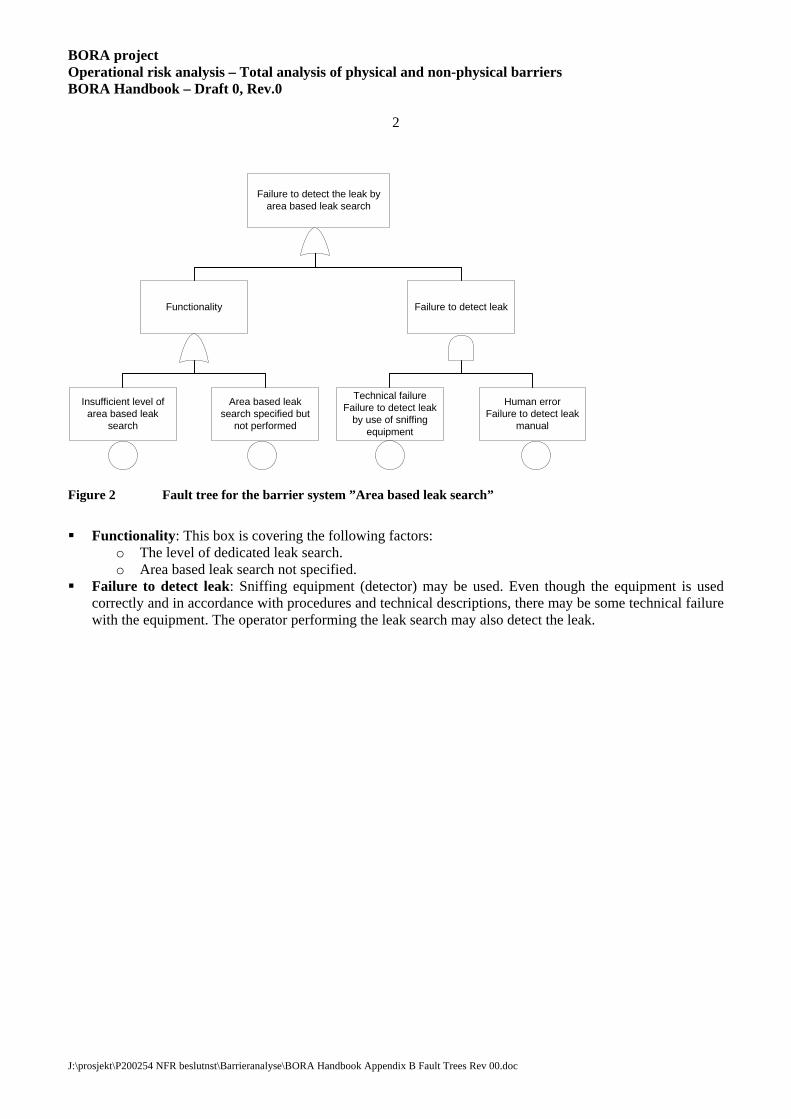
BORA project Operational risk analysis – Total analysis of physical and non-physical barriers BORA Handbook – Draft 0, Rev.0
2
J:\prosjekt\P200254 NFR beslutnst\Barrieranalyse\BORA Handbook Appendix B Fault Trees Rev 00.doc
Failure to detect the leak by area based leak search
Functionality
Insufficient level of area based leak
search
Area based leak search specified but
not performed
Technical failure Failure to detect leak
by use of sniffing equipment
Human errorFailure to detect leak
manual
Failure to detect leak
Figure 2 Fault tree for the barrier system ”Area based leak search”
Functionality: This box is covering the following factors:
o The level of dedicated leak search. o Area based leak search not specified.
Failure to detect leak: Sniffing equipment (detector) may be used. Even though the equipment is used correctly and in accordance with procedures and technical descriptions, there may be some technical failure with the equipment. The operator performing the leak search may also detect the leak.

BORA project Operational risk analysis – Total analysis of physical and non-physical barriers BORA Handbook – Draft 0, Rev.0
3
J:\prosjekt\P200254 NFR beslutnst\Barrieranalyse\BORA Handbook Appendix B Fault Trees Rev 00.doc
Failure to detect degradation beyond acceptable limit
Functionality
Insufficient level of CM
Condition monitoring specified but not
performed
Failure to detect error due to error in
manuals/ procedures/plans
Failure to detect error – manuals/
procedures/plans not used
Failure to detect error – manuals/
procedures/plans not used correctly
Technical failureFailure on CM equipment (corrosion coupon, MIC
sampling)
Human error when preparing and using
documentation
Limitation in applied method
Figure 3 Fault tree for the barrier system ”Condition monitoring”
Functionality: This box is covering the following factors:
o The level of CM. The CM programs will cover only a few points in a process system. This means that there is a probability that degradation is undetected, even when using CM.
o Choice of CM method. The probability of detection of corrosion is dependent on the choice of method.
o CM specified but not performed. Technical failure: Different types of CM tools may be used, e.g. corrosion coupons, MIC sampling, sand
monitoring equipment etc. Even if the tools are used correctly and in accordance with procedures and technical descriptions, there may be some technical failure with the tools.
Human error: When planning and doing condition monitoring, different types of documentation may be required/used, e.g. instruction manuals, work procedures and inspection plans. The barrier function “Detect degradation beyond acceptable limit” may fail due to human error:
o Failure introduced in relevant documentation, and hence this may e.g. lead to wrong interpretation of the CM results.
o Relevant and necessary documents not used. E.g. the operator may believe that he is familiar with the procedures and this type of analysis and fails to use the documentation.
o Relevant documentation is used, but the operator fails to use it correctly because e.g. he may be disturbed (e.g. “errors of omission”).
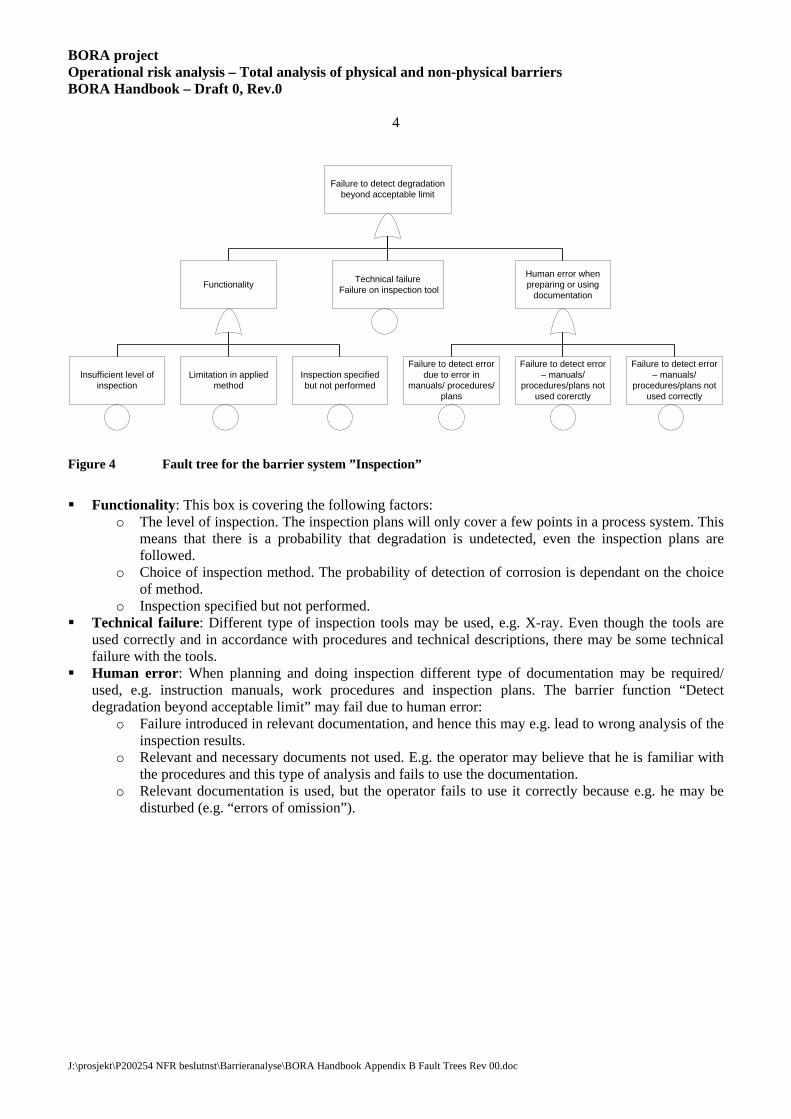
BORA project Operational risk analysis – Total analysis of physical and non-physical barriers BORA Handbook – Draft 0, Rev.0
4
J:\prosjekt\P200254 NFR beslutnst\Barrieranalyse\BORA Handbook Appendix B Fault Trees Rev 00.doc
Failure to detect degradation beyond acceptable limit
Failure to detect error due to error in
manuals/ procedures/plans
Failure to detect error – manuals/
procedures/plans not used corerctly
Failure to detect error – manuals/
procedures/plans not used correctly
Technical failure Failure on inspection tool
Human error when preparing or using
documentationFunctionality
Insufficient level of inspection
Inspection specified but not performed
Limitation in applied method
Figure 4 Fault tree for the barrier system ”Inspection”
Functionality: This box is covering the following factors:
o The level of inspection. The inspection plans will only cover a few points in a process system. This means that there is a probability that degradation is undetected, even the inspection plans are followed.
o Choice of inspection method. The probability of detection of corrosion is dependant on the choice of method.
o Inspection specified but not performed. Technical failure: Different type of inspection tools may be used, e.g. X-ray. Even though the tools are
used correctly and in accordance with procedures and technical descriptions, there may be some technical failure with the tools.
Human error: When planning and doing inspection different type of documentation may be required/ used, e.g. instruction manuals, work procedures and inspection plans. The barrier function “Detect degradation beyond acceptable limit” may fail due to human error:
o Failure introduced in relevant documentation, and hence this may e.g. lead to wrong analysis of the inspection results.
o Relevant and necessary documents not used. E.g. the operator may believe that he is familiar with the procedures and this type of analysis and fails to use the documentation.
o Relevant documentation is used, but the operator fails to use it correctly because e.g. he may be disturbed (e.g. “errors of omission”).

BORA project Operational risk analysis – Total analysis of physical and non-physical barriers BORA Handbook – Draft 0, Rev.0
5
J:\prosjekt\P200254 NFR beslutnst\Barrieranalyse\BORA Handbook Appendix B Fault Trees Rev 00.doc
Failure to detect error by self control
Functionality
Insufficient level of self control/use of
checklists
Activity specified but not performed
Failure to detect error due to error in
checklists
Failure to detect error – checklists not used
Failure to detect error – checklists not used
correctly
Human error when preparing or uding
documentation
Figure 5 Fault tree for the barrier system ”Self control”
Functionality: This box is covering the following factors:
o The level of self control/ use of checklists. Self control will be performed based on procedures or work practice, dependant on the activity. This means that there is a probability that latent errors are not identified.
o Self check/ use of checklists specified but not performed. Human error: When planning and doing the activity different type of documentation may be required/
used, e.g. checklists. The barrier function “Detect latent error” may fail due to human error: o Failure introduced in relevant documentation, and hence this may e.g. lead to wrong analysis of the
inspection results. o Relevant and necessary documents not used. E.g. the operator may believe that he is familiar with
the procedures and this type of analysis and fails to use the documentation. o Relevant documentation is used, but the operator fails to use it correctly because e.g. he may be
disturbed (e.g. “errors of omission”).
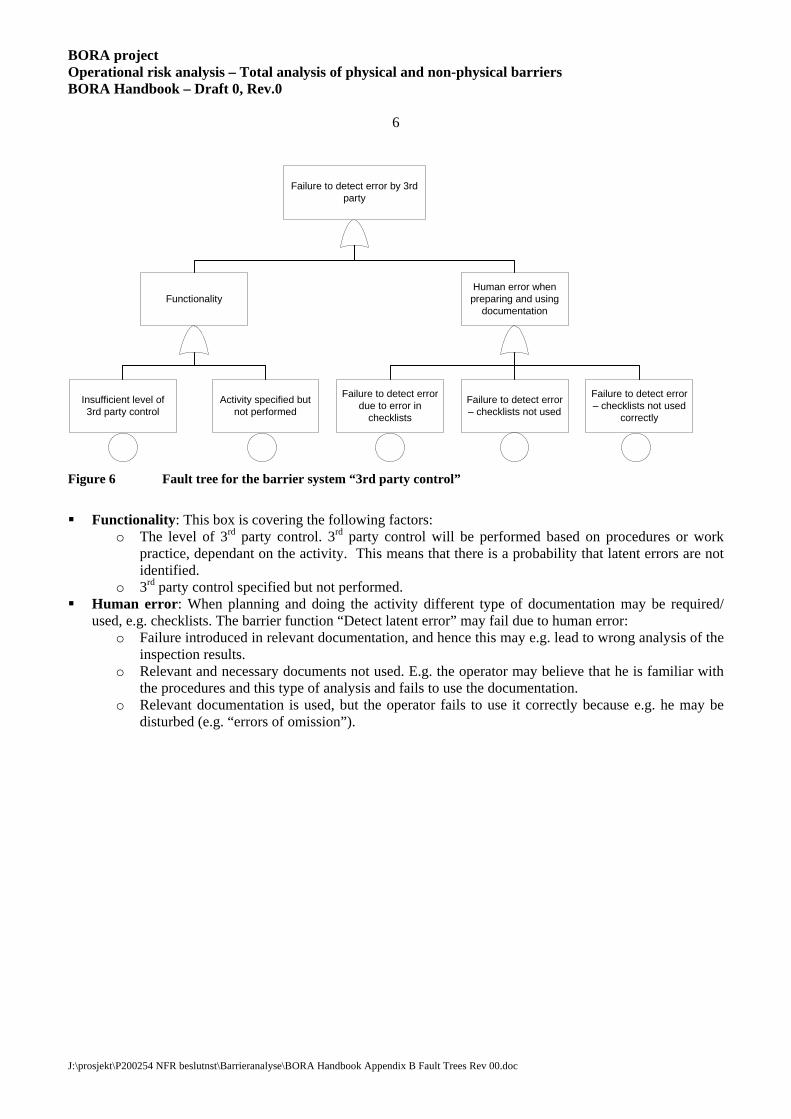
BORA project Operational risk analysis – Total analysis of physical and non-physical barriers BORA Handbook – Draft 0, Rev.0
6
J:\prosjekt\P200254 NFR beslutnst\Barrieranalyse\BORA Handbook Appendix B Fault Trees Rev 00.doc
Failure to detect error by 3rd party
Functionality
Insufficient level of 3rd party control
Activity specified but not performed
Failure to detect error due to error in
checklists
Failure to detect error – checklists not used
Failure to detect error – checklists not used
correctly
Human error when preparing and using
documentation
Figure 6 Fault tree for the barrier system “3rd party control”
Functionality: This box is covering the following factors:
o The level of 3rd party control. 3rd party control will be performed based on procedures or work practice, dependant on the activity. This means that there is a probability that latent errors are not identified.
o 3rd party control specified but not performed. Human error: When planning and doing the activity different type of documentation may be required/
used, e.g. checklists. The barrier function “Detect latent error” may fail due to human error: o Failure introduced in relevant documentation, and hence this may e.g. lead to wrong analysis of the
inspection results. o Relevant and necessary documents not used. E.g. the operator may believe that he is familiar with
the procedures and this type of analysis and fails to use the documentation. o Relevant documentation is used, but the operator fails to use it correctly because e.g. he may be
disturbed (e.g. “errors of omission”).

BORA project Operational risk analysis – Total analysis of physical and non-physical barriers BORA Handbook – Draft 0, Rev.0
7
J:\prosjekt\P200254 NFR beslutnst\Barrieranalyse\BORA Handbook Appendix B Fault Trees Rev 00.doc
Failure to detect latent error by use of leak test
Functionality
Leak test not specified
Leak test specified but not performed
Failure to detect error due to error in
procedures
Failure to detect error – procedures not
used
Failure to detect error – procedures not
used correctly
Technical failureFailure with leak test
equipment
Human error when preparing or using
documention
Figure 7 Fault tree for the barrier system “verification of system status – by use of leak test”
Functionality: This box is covering the following factors:
o Leak test not specified. o Leak test specified but not performed.
Technical failure: Different type of mechanical or instrumented equipment may be used when doing the leak test. Even though the equipment are used correctly and in accordance with procedures and technical descriptions, there may be some technical failure with the equipment.
Human error: When planning and doing leak tests different type of documentation may be required/ used, e.g. instruction manuals and work procedures. The barrier function “Detect latent error” may fail due to human error:
o Failure introduced in relevant documentation, and hence this may e.g. lead to wrong analysis of the inspection results.
o Relevant and necessary documents not used. E.g. the operator may believe that he is familiar with the procedures and this type of analysis and fails to use the documentation.
o Relevant documentation is used, but the operator fails to use it correctly because e.g. he may be disturbed (e.g. “errors of omission”).
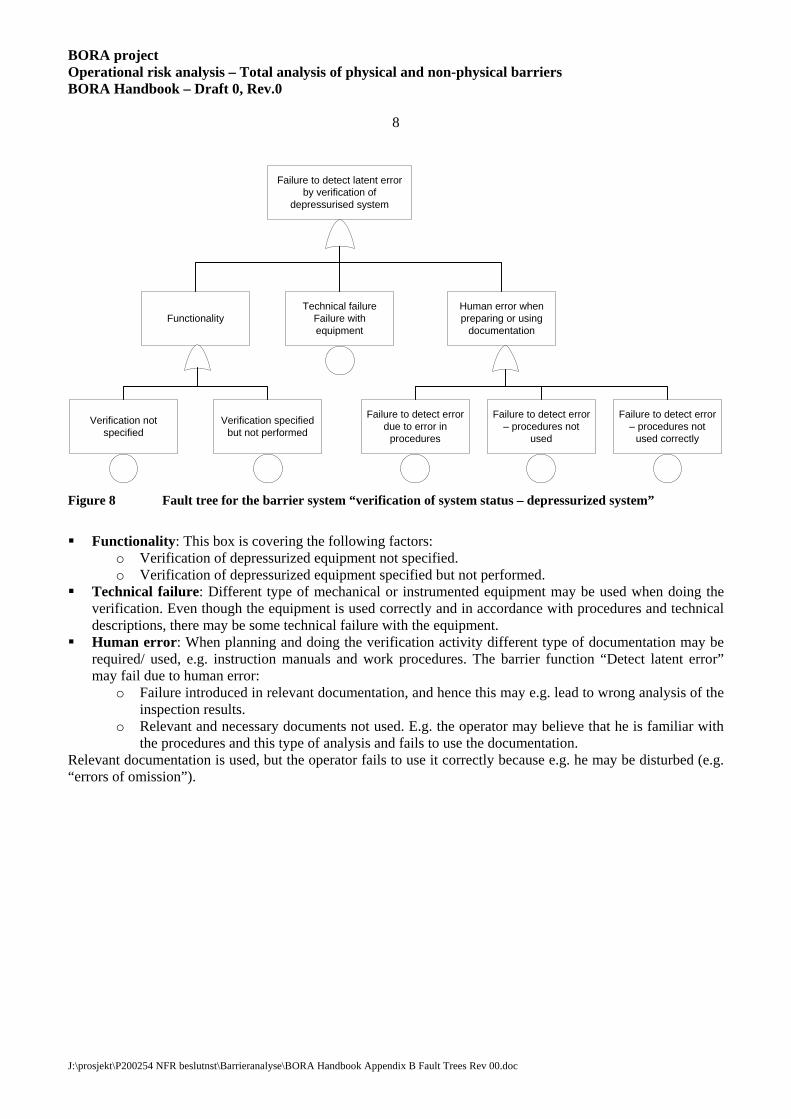
BORA project Operational risk analysis – Total analysis of physical and non-physical barriers BORA Handbook – Draft 0, Rev.0
8
J:\prosjekt\P200254 NFR beslutnst\Barrieranalyse\BORA Handbook Appendix B Fault Trees Rev 00.doc
Failure to detect latent error
by verification of depressurised system
Functionality
Verification not specified
Verification specified but not performed
Failure to detect error due to error in
procedures
Failure to detect error – procedures not
used
Failure to detect error – procedures not
used correctly
Technical failureFailure with equipment
Human error when preparing or using
documentation
Figure 8 Fault tree for the barrier system “verification of system status – depressurized system”
Functionality: This box is covering the following factors:
o Verification of depressurized equipment not specified. o Verification of depressurized equipment specified but not performed.
Technical failure: Different type of mechanical or instrumented equipment may be used when doing the verification. Even though the equipment is used correctly and in accordance with procedures and technical descriptions, there may be some technical failure with the equipment.
Human error: When planning and doing the verification activity different type of documentation may be required/ used, e.g. instruction manuals and work procedures. The barrier function “Detect latent error” may fail due to human error:
o Failure introduced in relevant documentation, and hence this may e.g. lead to wrong analysis of the inspection results.
o Relevant and necessary documents not used. E.g. the operator may believe that he is familiar with the procedures and this type of analysis and fails to use the documentation.
Relevant documentation is used, but the operator fails to use it correctly because e.g. he may be disturbed (e.g. “errors of omission”).