bosque river environmental infrastructure improvement plan
TRANSCRIPT
TR-312 2008
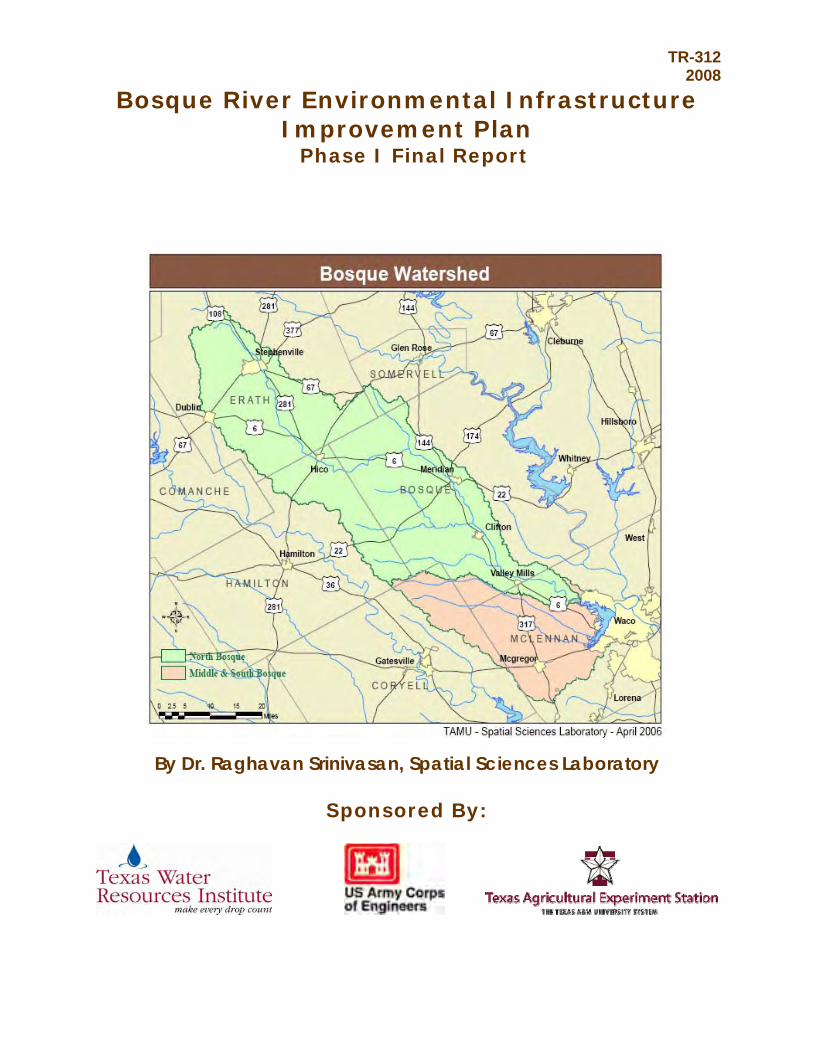
Bosque River Environmental Infrastructure Improvement Plan Phase I Final Report
By Dr. Raghavan Srinivasan, Spatial Sciences Laboratory
Sponsored By:
ii
Executive Summary
The Bosque River and its associated watershed face a myriad of water quality challenges. Previous attempts made to address these concerns have met with limited success due to a relatively narrow, specific problem approach. The goal of this project is to develop a comprehensive plan that considers all aspects of existing issues for collaborators to implement and assist in planning for improved environmental infrastructure. The project set forth will aid in identifying appropriate management practices and structures for rehabilitating and maintaining watershed health from a landscape scale approach. Implementation of an environmental infrastructure program employing a series of best management practices (BMPs) and efforts is desirable for addressing overall watershed health. This report is the first phase of a project that is focused on developing and employing a strategic approach to identifying priority areas in the watershed where field investigations should begin to investigate the need to reduce pollution and in choosing appropriate BMPs for specific areas that are best suited to meet pollution reduction needs both efficiently and economically. There needs to be more in-depth analysis of cost benefits and economic and environmental alternative analysis need to follow in the next phases of this project before any field implementation is undertaken.
In-depth analysis using applicable Geographic Information Systems (GIS) data generated specifically for this project identified specific areas of need. Sub-watersheds were evaluated using an impact index that assigns a ranking to each sub-watershed based on three pollution quantifying indices: a concentration impact index, a load per unit area index and a load impact index. The sum of the three index rankings yields the overall ranking for each sub-watershed.
A scientific advisory committee developed a list of potential BMPs. The list consists of 22
feasible BMPs that have been assigned a priority index based on potential water quality effects, capital and maintenance costs, and applicability of the practice in the watershed. After establishing the prioritized list, BMPs were evaluated by the Spatial Sciences Lab (SSL) at Texas A&M University using GIS to identify areas within the watershed where implementing these practices would be most effective. Six spatial criteria and six location-specific criteria were used to determine optimum potential locations within the watershed for each BMP to be implemented.
This document outlines an effective methodology for determining which locations in the
watershed should receive focus when field work begins, and which BMPs would be most effective in specific sub-watersheds. Six steps were identified as an effective process to choose the proper BMP for each sub-watershed in the basin. If these steps are followed, the best BMP(s) for each location should be effectively identified.
iii
Acknowledgements
Support for this project was received from Congressman Chet Edwards’ offices in Waco and Washington, D.C. Mr. Daniel Nichols and Mr. Stoney Burke were instrumental in bringing this project to fruition. Mr. Spivey Paup of Congressman John Carter’s Washington, D.C. office was also crucial in getting this project off the ground. We would like to thank the Texas A&M University Spatial Sciences Laboratory, the Texas Water Resources Institute and the U.S. Army Corps of Engineers for their continual support and coordination efforts on this project. Their organization and hard work supporting this project have been vital to phase I success. The scientific advisory committee has also been fundamental in accomplishing the objectives for phase I of the project. This advisory committee consists of members from BU, the Blackland Research and Extension Center, the Brazos River Authority, the Center for Reservoir and Aquatic Systems Research, the City of Waco, representatives from Congressman Chet Edwards’ office, Texas A&M University’s Biological and Agricultural Engineering Department, the Soil and Crop Sciences Department, the Spatial Sciences Laboratory, Texas Cooperative Extension, Texas Farm Bureau, the Texas Institute of Applied Environmental Research, the Texas State Soil and Water Conservation Board, the Texas Water Development Board, the Texas Water Resources Institute, the U.S. Department of Agriculture-Natural Resources Conservation Service, the U.S. Army Corps of Engineers, the University of Texas Marine Science Institute, and the Waco Chamber of Commerce. We would also like to thank the Blackland Research and Extension Center and the Texas Institute of Applied Environmental Research for their data contributions. They are greatly appreciated and critical to the project.
iv
Table of Contents
Page EXECUTIVE SUMMARY ii ACKNOWLEDGEMENTS iii TABLE OF CONTENTS iv LIST OF FIGURES vi LIST OF TABLES vii LIST OF ABBREVIATIONS viii INTRODUCTION 1
New Approach to an Old Problem (Watershed Management) 2 Previous Studies 2
TMDL Efforts 2 Water Quality Studies 3 Bacteria Source Tracking 4 Public Law 566 (PL566) Structure Influence 4 BMP Effectiveness 5
GIS DATA 6 FIELD EVALUATION 7
Background 7 Scientific Advisory Committee Field Visit 7 TWRI Field Visits 9 Field Summary 10
METHODOLOGY 11
Methodology Overview 11 Methodology Implementation 11
PRIORITIZING SUB-WATERSHEDS 12
Total Impact Index Implementation 12 Concentration Impact Index 13 Load per Unit Area Impact Index 14

v
Page Load Impact Index 15 BEST MANAGEMENT PRACTICES (BMPs) 16
BMP Description and Applicability 16 Optimal BMP Locations 22 Prioritizing BMPs 22 GIS Analysis 27
DISCUSSION 30 Prioritizing Sub-watersheds 30
New BMPs 30 Prioritizing BMPs 30 Determining Optimal BMP Locations 31 Existing BMPs 31 CONCLUSIONS 33 RECOMMENDATIONS 34 REFERENCES 35 APPENDIX I – GIS Data 39 APPENDIX II – PL566s Analysis – Drainage Area Spatial Data 48 APPENDIX III – Meetings Overview 52 APPENDIX IV – Meeting #1 55 APPENDIX V - Meeting #2 72 APPENDIX VI - Meeting #3 139 APPENDIX VII – Complete Meeting Attendance List 198 APPENDIX VIII – Maps 200

vi
List of Figures
Page Fig. 1. Map of the Bosque River watershed 1 Fig. 2. Location of PL566 structures in the Bosque River watershed 8 Fig. 3. Solid dam, silt build up occurring 9 Fig. 4. Back of dam, no seeps, good cover 9 Fig. 5. Stream bank de-stabilization 9 Fig. 6. Bank erosion upstream of structure 9 Fig. 7. Principal spillway and good cover 10 Fig. 8. Principal spillway outlet below dam 10 Fig. 9. Grassed, terraced hay field 10 Fig. 10. Bare, plowed field left fallow 10 Fig. 11. Total Impact Index Implementation 12 Fig. 12. Concentration impact index 14 Fig. 13. Load per unit area impact index 14 Fig. 14. Load impact index 15

vii
List of Tables
Page Table 1. Numeric rating values corresponding to low, medium and high priority
for the three impact indices 13 Table 2. Optimum BMP location criteria 23 Table 3. BMPs listed by category with their associated effectiveness priority as
designated by the scientific advisory committee 26
viii
List of Abbreviations
AFO Animal Feeding Operation APEX Agricultural Policy and Environmental Extender BASINS Better Assessment Science Integrating Point and Nonpoint Sources BMP Best Management Practice BRA Brazos River Authority BREC Blackland Research and Extension Center BU Baylor University CAFO Confined Animal Feeding Operation CAGSR Center for Applied Geographic and Spatial Research DOE Department of Energy GIS Geographic Information System K Potassium LULC Land Use Land Cover NHD National Hydrography Dataset NRCS Natural Resources Conservation Service N Nitrogen P Phosphorus PL566 Public Law - 566 PO4P Orthophosphate-phosphorus PRB Permeable Reactive Barrier SRP Soluble Reactive Phosphorus SSL Spatial Sciences Lab at Texas A&M University SSURGO Soil Survey Geographic SWAT Soil and Water Assessment Tool TCEQ Texas Commission on Environmental Quality TIAER Texas Institute for Applied Environmental Research TMDL Total Maximum Daily Load TNRIS Texas Natural Resources Information System TN Total Nitrogen TP Total Phosphorus TSS Total Suspended Solids TSSWCB Texas State Soil and Water Conservation Board TWRI Texas Water Resources Institute USACE United States Army Corps of Engineers USDA United States Department of Agriculture USEPA United States Environmental Protection Agency USGS United States Geological Survey USLE Universal Soil Loss Equation WAF Waste Application Field WWTP Wastewater Treatment Plant

1
Introduction The Bosque River watershed covers more than 1,190 square miles in the Brazos River Basin. The river originates in Erath County north of Stephenville and flows through the towns of Hico, Meridian, Clifton and Valley Mills before entering Lake Waco. The North Bosque River and Lake Waco serve as the primary drinking water supply for more than 200,000 people in the greater Waco area and provide water for agricultural production, recreational fishing and swimming. During the 1980s, the dairy industry expanded rapidly throughout the Bosque and Leon River watersheds. Dairy farming is the most prominent agricultural practice in the watershed: 80 dairies with more than 40,000 head of milking cows now operate in the basin. Concerns have been raised about the extent to which nonpoint pollution runoff into these rivers has increased since the rapid dairy expansion. In addition, water quality planning agencies also wanted to know the extent to which point sources of pollution (i.e., municipal wastewater treatment plants in the region) may be impairing water quality.
Elevated levels of phosphorus (P) have been found to be the primary problem and are a special concern since they can lead to excessive algae growth and other undesirable aquatic vegetation. Excessive algae growth may cause taste and odor problems in drinking water supplies and could lead to fish kills in the streams and reservoirs. P measurements exceeding the total maximum daily load for the North Bosque River led to its inclusion on the 1998 Texas Section
Fig. 1: Map of the Bosque River watershed
2
303(d) list of waters that do not meet water quality standards for their designated uses. In 2000, segments 1226 and 1255 of the Bosque River were classified as impaired due to elevated levels of P. Further, emerging concerns have arisen regarding potential bacteria and sediment problems within the Middle and South Bosque subwatersheds. New Approach to an Old Problem (Watershed Management)
The Bosque River Environmental Infrastructure Improvement Planning project differs from traditional approaches to solving single issue environmental problems. The purpose of this project focuses on ecosystem level solutions to environmental problems and does not view single issues/solutions, but landscape approaches to improving the entire ecosystem. The approach envisions applications of multiple, appropriate BMPs in concert to address overall environmental improvement within the watershed. In total, the project employs a strategic approach to identify environmental issues and solve them through comprehensive implementation of viable BMPs. The results of a watershed level infrastructure improvement project have the potential to reduce environmental impacts and restore proper functions and processes at a landscape scale. Previous Studies TMDL Efforts The Texas Commission on Environmental Quality (TCEQ) and the Texas State Soil and Water Conservation Board (TSSWCB) developed Total Maximum Daily Loads (TMDLs) to improve and protect water quality in the Bosque River. In basic terms, a TMDL specifies the maximum pollutant load allowed in the stream channel from all sources while the associated implementation plan provides a strategy to achieve pollution reductions.
TMDLs have been developed for segments 1255 of the Upper North Bosque River and 1226
of the North Bosque River. The goal of the TMDLs is to reduce soluble reactive phosphorus (SRP) loadings and concentrations at five sites by an average of 50% annually compared to conditions prior to 2000 (TCEQ, 2002b).
The TMDL program calls for voluntary and regulatory efforts to improve water quality. In
addition, a watershed protection plan is now being developed for the watershed. Success will be measured by the extent to which voluntary programs reduce SRP levels in the watershed. Under the current TMDL process, point sources of pollution can and are regulated while non-point sources can not be regulated, only urged to implement voluntary measures.
Under the implementation plan, seven municipal wastewater plants in the region, confined
animal feeding operations (CAFOs) and animal feeding operations (AFOs) are urged to take the following steps to reduce pollutant loadings (TCEQ and TSSWCB, 2004):
• Wastewater treatment plants (WWTPs) have to reduce the loads of P discharges by upgrading technology.
• CAFOs are urged to develop comprehensive nutrient plans. Newly proposed CAFOs and existing facility expansion must obtain new permits from TCEQ.
• AFOs are urged to develop nutrient management plans.

3
• Microwatershed councils are being established by TSSWCB and TCEQ to disseminate information and technical assistance through local soil and water conservation districts to dairy operators and other agricultural producers.
State and federal agencies have developed supporting programs to reduce pollutant loads from
the runoff of dairy manure, including the following: • The Texas Water Resources Institute (TWRI) has been working with the Department
of Defense and Natural Resource Conservation Service (NRCS) to apply composted dairy manure to restore military training areas at Fort Hood.
• The Dairy Manure Export Support Program, a TSSWCB project, working with participating dairies, sent more than 918,000 tons of manure to commercial composting facilities in Central Texas (TIAER, 2006).
• The Texas Department of Transportation purchased and applied more than 385,000 cubic yards of composted manure from the North Bosque and Leon River watersheds to more than 200 highway construction and maintenance projects.
• TCEQ is working with the Brazos River Authority (BRA) to design, build and manage an innovative waste management system that uses an anaerobic digester to reduce P levels in liquids used to irrigate waste application fields (WAFs).
• TWRI is working with the TSSWCB to field-test new technologies that may provide the ability to reduce P concentrations in dairy waste.
Water Quality Studies Several studies by researchers in academia and the private sector provide new insights into water quality issues facing the Bosque watershed. These studies have primarily focused on evaluating the ability of BMPs to lessen pollutant loads and identifying pollutant-contributing sources in the watershed.
In 1999, the Texas Institute of Applied Environmental Research (TIAER) measured flow and
nutrients at 17 sites in the Bosque River watershed to determine which land uses were contributing the largest concentrations of orthophosphate-phosphorus (PO4-P), total phosphorus (TP) and total nitrogen (TN). Field data verified by computer modeling suggests that the largest loadings of PO4-P and TP were associated with dairy WAFs in the upper portion of the North Bosque River watershed, while the highest loadings of TN are associated with agricultural row-crop production (McFarland & Hauck, 1999).
TIAER published a study that evaluates results of its water quality monitoring program from
1998 to 2003 (Easterling & McFarland, 2004). The report shows that nitrites and nitrates are more of a water quality concern in the Middle and South Bosque River, while ammonia, phosphates and TP were the major water quality threats in the North Bosque watershed. TIAER also published a report in 2005 suggesting that P concentrations were lower in sites along the tributaries of the North Bosque River where dairy operators participated in programs to convert dairy manure into compost (cited in Managing Nonpoint Source Pollution, 2005).

4
Bacteria Source Tracking In 2006, Parsons Engineering published results of a study that used bacterial source tracking to identify sources of fecal coliform and E. coli in the region. The study was initiated and coordinated by the Texas Farm Bureau and funded by the TSSWCB; other cooperators in the project were the BRA and the City of Waco. The report questions whether dairy cattle, as has been widely presumed, account for majority of fecal coliform loadings to the Bosque and Leon River watersheds. In the study, water quality was sampled at sites throughout the two watersheds, including Lake Waco and Lake Belton. Results suggest that dairy cattle account for only 29% of E. coli loadings to Lake Waco and the Bosque River. Wild birds were identified as the major source of E. coli (contributing 40% of the total), followed by non-avian wildlife (16%) and sewage (17%). In Lake Belton and the Leon River watershed, dairy cattle accounted for 32% E. coli loadings followed by wild birds (28%) and terrestrial wildlife (21%) (Parsons Engineering, 2006). The “Lake Waco comprehensive Study” involves documenting the limnology of the lake over time; assessing how nutrients are recycled in the lake; reviewing and refining analyses of pollutant loads; and developing a water quality management plan. This project was initiated and funded by the City of Waco, in cooperation with the U.S. Environmental Protection Agency (EPA), USACE, USGS, Texas Parks and Wildlife Department and Baylor University (BU). Public Law 566 (PL566) Structure Influence
In 2006, the Center for Applied Geographic and Spatial Research (CAGSR) researchers presented results from the “Lake Waco Comprehensive Study” which used the Soil and Water Assessment Tool (SWAT) and GIS to examine how water quality in Lake Waco would be affected if there were no man-made developments in the watershed and if small PL566 reservoirs were removed (Prochnow et al., 2006). Results of these simulations, presented in 2006, suggest that TP loadings would increase by 82% and TN loadings would rise by 92% if the PL566 dams were removed. The simulations also suggest that the natural condition of the watershed (which assumes that all human influences are withdrawn) would experience a 79% reduction over current levels in TP and a 73% decline in TN. Researchers at TIAER are also evaluating the possible influence of the PL566 structures. These dams were built in the 1950s and 1960s by the U.S. Soil Conservation Service. In an unpublished paper, McFarland (2006) examined two of the PL566 reservoirs in the Bosque River basin. One site was on the North Fork of the Bosque River and was considered impacted by agriculture. The other site was located in the South Fork of the river and was a site that was impacted very little by intensive agricultural practices. The project involved measuring inflows, outflows and water quality from both sites. Results indicated differences in nutrient loads and concentration in the inflow and outflow of these structures and serves as valuable data that can be used for modeling purposes.
5
BMP Effectiveness Collaborators from Texas A&M University and TIAER have used the SWAT model to evaluate the effects of growing turfgrass with composted dairy manure in the Bosque watershed and then exporting it out of the basin. Evidence shows that this practice may improve water quality (Stewart et al., 2006). Research examined growing and exporting sod produced with various application rates of composted dairy manure and evaluated its ability to reduce P and nutrient loadings to the region’s streams. Results suggest that instream P loads could be reduced by an average of 31% and sediment loads could decline by an average of 17%. Hanzlik et al. presented a methodology that used GIS to identify the optimal sites to grow and export turfgrass in order to maximize nutrient removal.
In 2004, researchers with the Blackland Research and Extension Center (BREC) in Temple
described how a GIS based-version of the SWAT model can be used to model water quality trends in the basin (DiLuzio, Arnold & Srinivasan, 2004). Rosenthal and Hoffman (1999) also demonstrated how the SWAT model and GIS can be used to effectively target the best sites to monitor water quality in the Leon River and Bosque River watersheds. In 2001, researchers at BREC and TIAER used the SWAT model to simulate the effect of using BMPs at wastewater plants and dairies on loadings of nutrients into the Bosque River watershed (Santhi et al., 2001). Dairy BMPs that were evaluated included hauling solid dairy manure out of the watershed and only applying liquid manure applying only enough fertilizer to meet the P needs of crops and reducing the P content in cattle feeds. Results suggest that the implementation of dairy BMPs can reduce episodic loadings of SRP into the watershed by up to 60% (Santhi et al., 2001). Researchers with TIAER and Tarleton State University evaluated five BMPs to prevent P loadings in the North Bosque River Basin (McFarland, Saleh, & Hauck, 2000). The results of the field studies were verified with the Agricultural Policy and Environmental Extender (APEX) water quality simulation model. The BMPs that were demonstrated and monitored included the following:
• Application of N for a crop of commercial Bermudagrass. • Strip plowing of coastal Bermudagrass with high levels of soil P. • Applying manure to a winter wheat crop based on plant P needs. • Application of N for a double-crop system growing summer forage sorghum and
winter wheat. • Deep plowing a field where summer sorghum and winter wheat were grown as a
double-crop. N was applied to this field, which had high levels of soil P. APEX results show that timing manure applications to meet plant needs for P was effective in
significantly decreasing phosphates and TP loads. BU researchers began investigating regional water quality in the early 1990s. These studies led BU to collaborate with the City of Waco, the USACE and the U.S. Fish and Wildlife Service to construct a 180-acre wetland near Lake Waco that was used for research and education in 1998. The CAGSR at BU has also been working with the City of Waco and ENSR Inc., to model water quality in the Lake Waco watershed.

6
GIS Data
Data collection for the Bosque River Environmental Infrastructure Improvement Plan focused on identifying and obtaining all known GIS data and any other pertinent data that could be incorporated into a GIS system or used to generate GIS data. Data was collected from the following sources: - The Texas Institute for Applied Environmental Research (TIAER) - The Blackland Research and Extension Center (BREC) - The Spatial Sciences Laboratory (SSL) from Texas A&M University - The Soil Survey Geographic (SSURGO) Database available online at
http://soildatamart.nrcs.usda.gov/ - The Texas Natural Resources Information System (TNRIS) website available at
http://www.tnris.state.tx.us/ - Dr. Munster and Dr. Vietor from Texas A&M University A complete list of detailed GIS data can be found in Appendix I. This section outlines what each dataset is, what it is used for, where it came from, and how it was adapted or modified for use in this project.

7
Field Evaluation
Background
The authorized purposes for these Natural Resources Conservation Service (NRCS)-assisted watershed projects are wide-ranging: watershed protection, flood prevention, agricultural water management, water based recreation, fish and wildlife habitat improvement, groundwater recharge, water quality management and municipal and industrial water supply. Program objectives have changed since these structures were built in response to legislative direction, environmental concerns and changing social values. Many of the original projects’ objectives were to reduce flooding, improve drainage, and increase irrigation efficiencies. In the 1960s, high priorities were placed on projects that provided jobs to combat poverty and encourage rural development; many of these projects involved establishing recreation areas. In recent years projects have focused on land treatment measures to solve natural resource problems, such as substandard water quality and loss of wildlife habitat (NRCS 2006).
There are 40 of these PL566 structures in the Bosque River watershed (Fig. 2) and the
majority of them are nearing the end of their evaluated life. It is estimated that 75% of the structural measures are designed with a 50-year evaluation life (silt life, not structural life). The two structures visited in Erath County for purposes of this field validation study appeared to be capable of accepting silt and sediment for several more decades. The dam structures are sound and the ground cover on the dam structures is exceptional. Field reports confirm that all of the PL566 structural dams are in good physical condition (Huffman 2006). Trees are controlled with chemical spray on the dam to prevent endangering dam structural stability from root channels (Dybala 2006).
Since the 1950s, local sponsors have signed agreements under which they assumed the
responsibilities of operating, maintaining and protecting project measures. Over time, the areas surrounding the structures have changed through population growth and development. Land uses have also changed potentially altering the projected sediment loadings and predicted life. In some cases, these changes may have prolonged the lifespan of these projects, while others may have been shortened. Clearly, local sponsors and other project stakeholders need to evaluate current conditions for all structures and will eventually have to address the environmental, public safety, liability, social, economic and funding issues that have come from these changes. Scientific Advisory Committee Field Visit
A field trip conducted February 21, 2006 made four stops: the Meridian Community Center,
property owned by Larry Lawson, the Meridian Golf Course and a PL566 structure near the headwaters of the Bosque River watershed. The trip’s purpose was to discuss issues and gain public input about potential BMPs to implement in the watershed. The consensus from local representatives is that they want a cleaner river. Secondary benefits mentioned include using recycled water on the Meridian golf course and improving wildlife habitat along the river. The purpose of this project was also discussed with local representatives; they were eager to participate and learn new management techniques.

8
Fig. 2 Location of PL566 structures in the Bosque River watershed
9
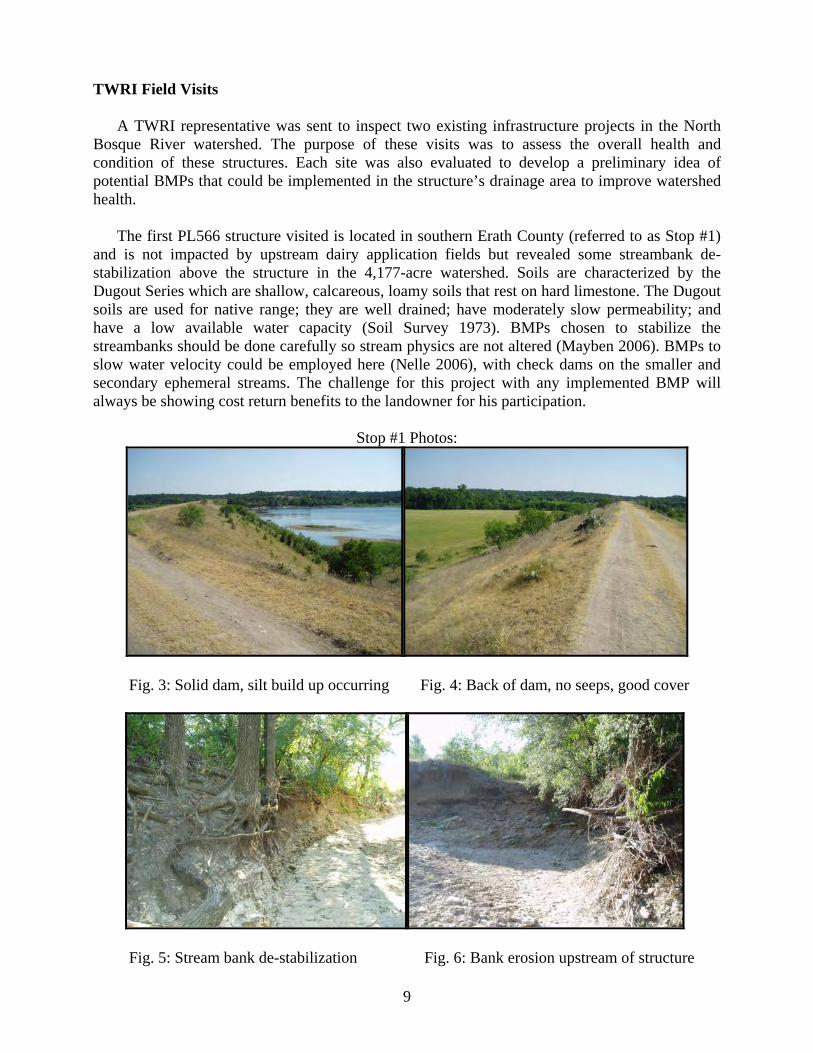
TWRI Field Visits A TWRI representative was sent to inspect two existing infrastructure projects in the North
Bosque River watershed. The purpose of these visits was to assess the overall health and condition of these structures. Each site was also evaluated to develop a preliminary idea of potential BMPs that could be implemented in the structure’s drainage area to improve watershed health.
The first PL566 structure visited is located in southern Erath County (referred to as Stop #1)
and is not impacted by upstream dairy application fields but revealed some streambank de-stabilization above the structure in the 4,177-acre watershed. Soils are characterized by the Dugout Series which are shallow, calcareous, loamy soils that rest on hard limestone. The Dugout soils are used for native range; they are well drained; have moderately slow permeability; and have a low available water capacity (Soil Survey 1973). BMPs chosen to stabilize the streambanks should be done carefully so stream physics are not altered (Mayben 2006). BMPs to slow water velocity could be employed here (Nelle 2006), with check dams on the smaller and secondary ephemeral streams. The challenge for this project with any implemented BMP will always be showing cost return benefits to the landowner for his participation.
Stop #1 Photos:
Fig. 3: Solid dam, silt build up occurring Fig. 4: Back of dam, no seeps, good cover
Fig. 5: Stream bank de-stabilization Fig. 6: Bank erosion upstream of structure

10
Another PL566 site (Stop #2) was visited in northern Erath County. It drains a 3,840-acre watershed that was highly impacted by upstream dairy operations and revealed an excellent structure with very good ground cover and well-managed hay fields above and below the main water body. Terracing had been performed on one field below. Contrarily, a poorly managed field was also left plowed and fallow adjacent to the structure. This site is characterized by Windthorst Series sandy and fine sandy soils. The soils are moderately well drained, moderately slowly permeable, and have a high available water capacity (USDA 1973).
Stop # 2 Photos:
Fig. 7: Principal spillway and good cover Fig. 8: Principal spillway outlet below dam
Fig. 9: Grassed, terraced hay field Fig. 10: Bare, plowed field left fallow Field Summary
The PL566 structures are in excellent shape even though they are nearing their 50-year service
life (Huffman 2006, Shrank 2006, Weems 2006). The major challenge to actually improving the infrastructure of the North Bosque River watershed will be to determine which BMPs to install in particular locations that will yield the best environmental results for the least capital cost. Figs. 3 through 10 show the condition of each structure as well as problem areas surrounding and upstream from the dams. Additionally, these photos illustrate how some BMPs can be effectively employed and highlight problem areas where BMPs could be used to improve watershed quality.
11
Methodology
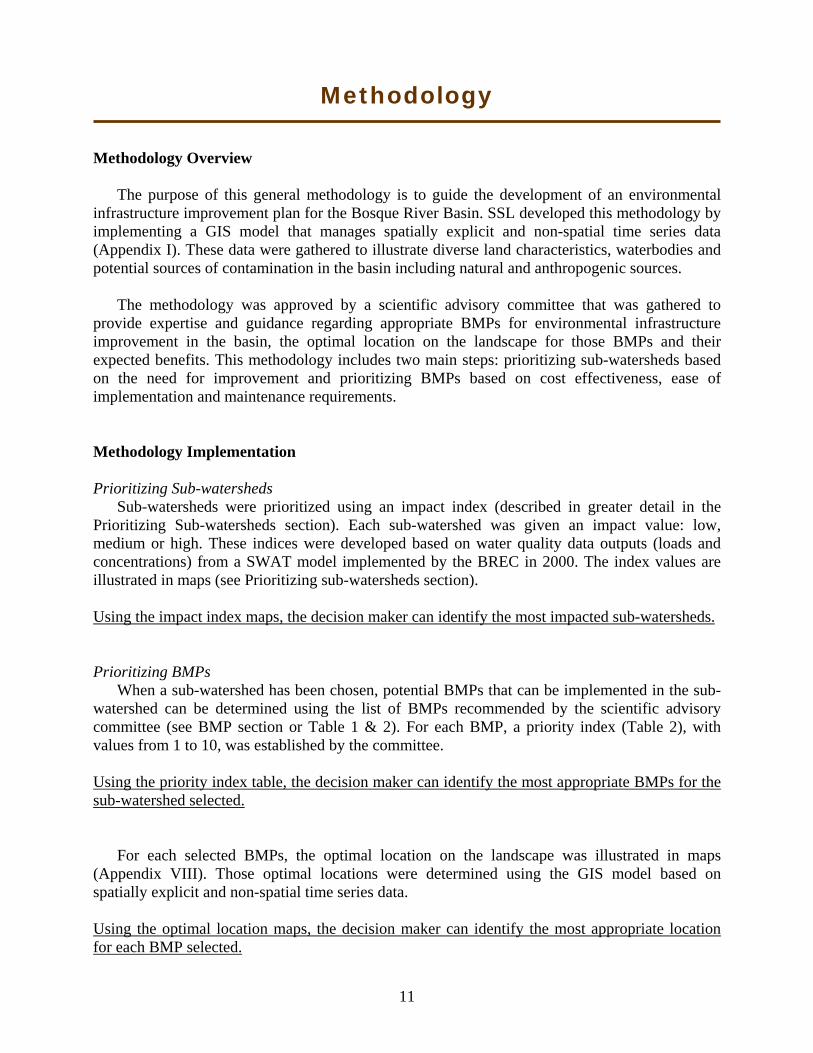
Methodology Overview
The purpose of this general methodology is to guide the development of an environmental
infrastructure improvement plan for the Bosque River Basin. SSL developed this methodology by implementing a GIS model that manages spatially explicit and non-spatial time series data (Appendix I). These data were gathered to illustrate diverse land characteristics, waterbodies and potential sources of contamination in the basin including natural and anthropogenic sources.
The methodology was approved by a scientific advisory committee that was gathered to provide expertise and guidance regarding appropriate BMPs for environmental infrastructure improvement in the basin, the optimal location on the landscape for those BMPs and their expected benefits. This methodology includes two main steps: prioritizing sub-watersheds based on the need for improvement and prioritizing BMPs based on cost effectiveness, ease of implementation and maintenance requirements. Methodology Implementation Prioritizing Sub-watersheds
Sub-watersheds were prioritized using an impact index (described in greater detail in the Prioritizing Sub-watersheds section). Each sub-watershed was given an impact value: low, medium or high. These indices were developed based on water quality data outputs (loads and concentrations) from a SWAT model implemented by the BREC in 2000. The index values are illustrated in maps (see Prioritizing sub-watersheds section). Using the impact index maps, the decision maker can identify the most impacted sub-watersheds. Prioritizing BMPs
When a sub-watershed has been chosen, potential BMPs that can be implemented in the sub-watershed can be determined using the list of BMPs recommended by the scientific advisory committee (see BMP section or Table 1 & 2). For each BMP, a priority index (Table 2), with values from 1 to 10, was established by the committee. Using the priority index table, the decision maker can identify the most appropriate BMPs for the sub-watershed selected.
For each selected BMPs, the optimal location on the landscape was illustrated in maps (Appendix VIII). Those optimal locations were determined using the GIS model based on spatially explicit and non-spatial time series data. Using the optimal location maps, the decision maker can identify the most appropriate location for each BMP selected.

12
Prioritizing Sub-Watersheds
To establish which areas of the watershed need the most improvement, the scientific advisory
committee advised that three impacts indices were needed. These indices were implemented using TSS, TP and TN. These three impact indexes were combined to develop a cumulative impact index that assigns a numerical ranking to each sub-watershed indicating its priority. Sub-watersheds were determined by dividing the Bosque River watershed into smaller watersheds.
An index is a numerical scale (no unit) used to compare variables with one another. Having no unit, indices can easily be summed and weighted to assess situations resulting from multiple factors regardless of the nature, unit and influence of the factors. Total Impact Index Implementation
The Total Impact Index helps to prioritize the sub-watersheds by assessing the impact on water quality by sub-watershed. The three factors -- TSS, TN and TP -- were converted to indexes with categories of: Low, Medium or High using the Natural Breaks1 method. A rating value was selected for each category using a log base of 2 just like in the Phosphorus Index implementation (NRCS, 2006). The categories Low, Medium or High were therefore given a value of 1, 2 and 4 respectively. The total impact index was obtained by adding the three indices with equal weight (Fig. 11).
Fig. 11: Total Impact Index Implementation
1 Natural Breaks: Classes are based on natural groupings inherent in the data. ArcMap identifies break points by picking the class breaks that best group similar values and maximize the differences between classes. The features are divided into classes whose boundaries are set where there are relatively big jumps in the data values.

13
The Impact Index also uses the Natural Breaks classes to distinguish priorities within the sub-watersheds. Low, Medium and High categories were used for this study and are defined as follows: LOW - This sub-watershed has a LOW potential for being impacted by sediment, P and/or N. If actual installations and practices are maintained at current level in the sub-watershed, the probability of an adverse impact in this sub-watershed would be low. MEDIUM - This sub-watershed has a MEDIUM potential for being impacted by sediment, P and/or N from the sub-watershed. The probability for an adverse impact to surface water resources is greater than that from a LOW vulnerability rated site. Some remedial action should be taken to lessen the probability of water quality degradation. HIGH - This sub-watershed has a HIGH potential for being impacted by sediment, P and/or N from the sub-watershed. There is a high probability for an adverse impact to surface water resources unless remedial action is taken. Soil and water conservation as well as BMPs are necessary to reduce the risk of water quality degradation.
Data for TSS, TN and TP were obtained from the outputs of a SWAT model implemented by the BREC in 2000 (Appendix I). The outputs considered were obtained by simulating existing conditions. These factors can be expressed in load (kg), in load per unit area (kg/ha) and concentration (kg/m3). It is important to highlight that the load per unit area data relate to individual sub-watershed, without considering the upstream watershed influences. On the other end, the concentration and the load data relate to the sub-watershed contribution as well as the entire upstream watershed contribution.
Three different impact indices were implemented: one using the factors expressed in load, one using the factors expressed in load per unit area and a last one using the factors expressed in concentration. Table 1. Numeric rating values corresponding to low, medium and high priority for the three impact indices
concentration impact index load impact index load per unit area
impact index Low 1 to 4 1 to 3 1 to 4
Medium 5 to 7 4 to 7 5 to 8 High 8 to 12 6 to 12 9 to 12
Concentration Impact Index The concentration impact index was developed based on the concentrations of TSS, TP and TN calculated from the SWAT model outputs (Appendix I). This index uses data extracted from the “reach output file,” and therefore considers the sub-watershed as well as the entire upstream watershed. Fig. 12 visually represents the priority assigned to each sub-watershed in the basin from this index. The Concentration Impact Index is useful in addressing local problems on

14
tributaries in low and high flow conditions. Implementing multiple BMPs and coordinating with various landowners is required to get positive results due to the influence of large land areas.
Fig. 12: Concentration impact index
Load per Unit Area Impact Index The load per unit area impact index was developed based on the load per unit area of TSS, TP and TN as estimated by the SWAT model (Appendix I). This index uses data extracted from the “subbasin output file” and therefore relates to contributions from individual sub-watersheds, without considering the upstream watersheds. Fig. 13 shows which sub-watersheds were labeled as low, medium and high priority using this index. The Load per Unit Area Impact Index is useful in addressing local problems on high flow tributaries.
Fig. 13: Load per unit area impact index
15
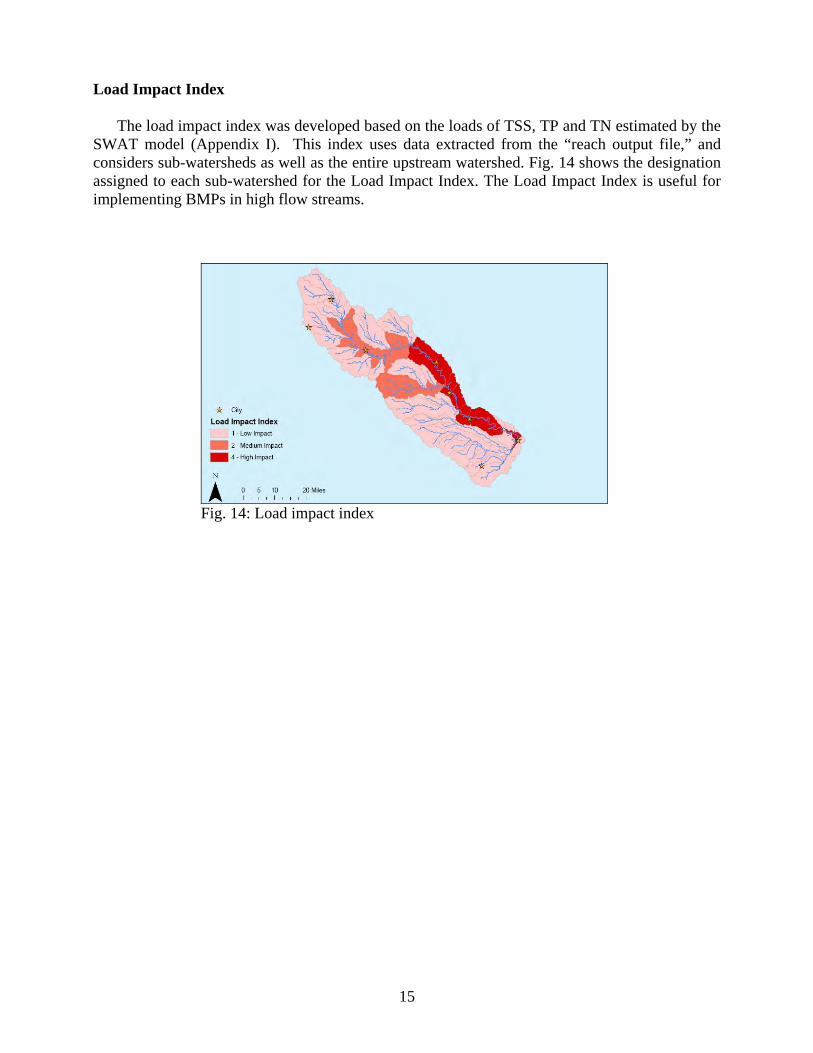
Load Impact Index The load impact index was developed based on the loads of TSS, TP and TN estimated by the SWAT model (Appendix I). This index uses data extracted from the “reach output file,” and considers sub-watersheds as well as the entire upstream watershed. Fig. 14 shows the designation assigned to each sub-watershed for the Load Impact Index. The Load Impact Index is useful for implementing BMPs in high flow streams.
Fig. 14: Load impact index
16
Best Management Practices (BMPs)
BMP Descriptions and Applicability Applying chemical agents to high P fields to reduce P solubility
P-immobilizing amendments can be useful in minimizing leaching from high P soils that receive wastewater or solid manure. Chemicals, especially aluminum sulfate and ferric chloride, can be used to remove P from the wastewater stream (Galarneau & Gehr, 1997). Dao et al. (2001, 2003) have illustrated the use of Al and Fe-based compounds to tie-up P in animal manure. Zvomuya et al. (2006) demonstrated that alum may be an effective amendment for immobilizing P and reducing P leaching in coarse-textured soils with a long history of waste application. Localized evaluation of this method within the Bosque River watershed would be beneficial to establishing a potential long-term solution to P leaching from WAFs within the watershed. Implementing sub-watershed soil conservation and erosion control plans
Soil conservation and erosion control plans encompass many different management practices and strategies. These plans are developed based on site location, topography, soil types, vegetation types, drainage conditions and adjacent land uses. Plans can be developed for any location after a proper site evaluation is conducted. Common soil conservation and erosion control plans include practices such as grassed waterways, contour farming, strip cropping, conservation tillage, planting cover crops, terracing and incorporating compost or manure among others. The Bosque River watershed would be a good candidate for the majority of these, but each location would need to be evaluated to determine the most feasible BMP (EPA 2003). Improving PL566 structures to increase sediment retention
For 50 years America’s small upstream dams have provided flood protection, municipal water supplies, wildlife habitat, water for livestock and recreational opportunities, but time has taken its toll on these structures and many of them are deteriorating. Many of Texas’ dams are in need of repair and are quickly approaching their expected lifespan. Upgrading flood control structures in the Bosque River watershed to include capabilities for continued soil retention (dredging, expanding retention capability, etc.) could be used to assure future benefits derived from these structures. Improving quality of water held by PL566 structures
Water quality improvements in waters held by PL566 structures could include reducing sediment, nutrients or numerous other structure specific objectives. The greatest improvement potential does not occur directly at the structures, but instead upstream or in the contributing watershed. Erosion and sediment control practices employed higher in the watershed would most likely have the best effect on decreasing sediment and nutrient loading into the reservoirs. Removing excess sediment trapped by the PL566 structure is one action occurring at the structure that could improve water quality and structure efficiency by increasing storage capacity,
17
removing nutrients trapped in sediment and potentially increasing recharge from the structure. Sediment removal would be a costly process that must include sediment quality evaluation before dredging and will have a small impact on downstream water quality. The greatest benefit from this action would be increased storage capacity; not improving water quality. Landowners will most likely be apprehensive to support this BMP due to associated costs and lack of on-site benefits. Installing crops that could be removed from the watershed (USDA)
Development of BMPs that provide “value-added” opportunities can provide a win-win situation for local landowners in providing innovative and economically beneficial revenues while potentially reducing nutrient concerns within the Bosque River watershed and assisting in meeting objectives and goals set by applicable TMDLs. As an example, Munster et al. (In Revision) have developed a BMP to include the use of watershed-generated nutrients (compost, manure) in the production of highly valuable sod grass that can be harvested and exported from the watershed. This approach may be feasible for other high value crops (nurseries, tree farms, etc.). Installing Grazing Management Practices
Grazing management plans aim to employ the best practical uses of forage resources and are important to improving or maintaining range condition, improving livestock forage harvest efficiency, and attempting to optimize plant and animal performance. Well-designed plans achieve management goals set by the operator while ensuring them a financial benefit and meeting the requirements of animals and plants. Plans improve ecosystem function and watershed protection, and are flexible and simple to operate. Grazing plans can be adapted for all range and pasture lands depending upon desired stocking rates, the species of grazing animals, grazing rotation schedules, plant species, and the number of herds and pastures (NRCS 2003). To make this a more appealing BMP, graduated cost sharing could be implemented to provide more funding for landowners who implement lower stocking rates.
Contour ripping/pasture renovation to maintain permeability of soils and increase residence time of water in soils
Contour ripping and other pasture renovation practices can provide a beneficial approach to maintaining soil sustainability and other natural resources within the Bosque River watershed. The practice of contour ripping (subsurface fracturing of claypan or compacted soils) increases infiltration and reduces runoff from treated landscapes. Increasing infiltration reduces the potential for soil erosion as overland flow is disrupted and runoff water is distributed downward into the soil profile. The reduction in overland flow could reduce the potential for nutrient-impacted sediment transport into local streams and rivers thus reducing the potential for downstream impacts. Terracing to reduce sediment transport
Terraces are earthen mounds constructed to shorten the length of a slope and reduce the erosive potential and sediment carrying capacity of runoff. If properly located, constructed and maintained, they reduce soil loss by slowing overland water movement and preventing rill and
18
gully formation. Terraces that are most effective and economical can be farmed using contour and conservation tillage techniques or replanted with herbaceous cover for grazing. Terraces are not cost effective on land with slopes that are too steep or too shallow. Extremely rocky, sandy, or shallow soils are not good places to employ terracing because of construction and maintenance problems; some areas in the Bosque River watershed may not be suitable for terracing. Terraces can have detrimental effects on water quality due to lack of maintenance or if they concentrate nutrients and accelerate their delivery to surface or groundwater (NRCS 1984). Developing nutrient management plans
Plans for nutrient management are developed in accordance with technical requirements of the NRCS Field Office Technical Guide (NRCS Website, 2006), policy requirements of the NRCS General Manual, procedures contained in the National Planning Procedures Handbook (NRCS Website, 2006), and technical guidance contained in the National Agronomy Manual (NRCS Website, 2006). These plans will include the following components, as applicable: 1) aerial site photographs or maps, and a soil map, 2) current and/or planned plant production sequence or crop rotation, 3) soil test results and recommended nutrient application rates, 4) plant tissue test results, when used for nutrient management, 5) complete nutrient budget for N, P and potassium (K) for the plant production system, 6) realistic yield goals and a description of how they were determined, 7) quantification of all important nutrient sources, 8) planned rates, methods and timing (month & year) of nutrient application, 9) location of designated sensitive areas or resources, and 10) guidance for implementation, operation, maintenance and recordkeeping. If the conservation management unit lies within a hydrologic unit area identified or designated as having impaired water quality associated with N or P, nutrient management plans include an assessment of the potential for N or P transport from the field. When such assessments are made, nutrient management plans will include: 1) a record of the site rating for each field and 2) information about conservation practices and management actions that can reduce the potential for P movement from the field. Educating Landowners
Education is the key to successfully employing any BMP. Until landowners completely understand the benefits of installing a BMP, they will be less likely to implement and properly maintain these structures or practices. The lack of information on cost-related benefits is also a deterrent for many landowners as well as the lack of funding in some cases. Key issues to address in education efforts are to illustrate the benefits that the landowner and environment will reap. Explain funding opportunities that will share or supply costs for BMP implementation and maintenance. Education emphasis should also be placed on what maintenance is required to keep BMPs working properly. Development of concise fact sheets that explain the BMP, where it should be located, benefits of installing that BMP, its maintenance needs, approximate costs for installation and maintenance and outline potential sources of funding would be an effective means to educate landowners about BMPs that they may consider on their land. Applying a waste injection program to directly inject fertilizer/manure/etc. into soils
Waste injection is a potentially effective way of incorporating liquid manure into soils. In this practice, liquid flows through a tube attached to a knife that places the material in a band below the soil surface. While this method is effective, care must be taken to prevent soil smearing and

19
compaction when the soil is too wet. Caution is also needed in soil conditions susceptible to macropore flow. Liquid manure injection offers a number of advantages over broadcasting including: 1) fewer odors, 2) ability to place nutrients directly into the seedbed, and 3) reduce loss of fertilizer value. Developing recharge structures to reduce runoff/sediment
Recharge structures are small-scale dams that are designed to retain a portion of water moving through a channel and hold it long enough for it to recharge into shallow groundwater tables. These structures are most effective on highly permeable soils, but can be used in almost any location. Recharge dams also decrease energy in the stream and in turn lower sediment carrying capacity; however, lack of sediment in the stream could lead to increased stream bank erosion down stream (Knight, 2002). Sediment trapped by the dam and settled out can reduce the rate at which water recharges, thus making the dam less effective and increasing maintenance costs. Recharge dams are designed for individual areas with specific goals in mind and can improve downstream water quality and increase recharge to shallow water tables if properly installed and managed. Installing vegetation buffers – “polishing strips”
The use of vegetation buffers (polishing strips) in riparian zones requires a different approach than traditional rangeland/pasture management and focuses primarily on conservation benefits such as filtering runoff and enhancing habitat. Buffers can vary in size, vegetation types, species compositions and spatial arrangements. For example, grasses, shrubs and trees have different capabilities to provide site-specific benefits (Dosskey, 1998). The challenge regarding an integrated approach to riparian management in private-land states is that riparian systems cross landownership thus requiring a concentrated effort across landowners in development of benefits throughout the watershed. However, individual landowners can benefit from localized development of the BMP to enhance habitat and control erosion on their property. Install permeable reactive barriers (PRB) along downstream gully systems to reduce sediment and dissolve P in runoff
PRBs are constructed with porous media bags filled with crushed stone allowing water to leach through the material inside the bags. These bags are stacked in channel in pyramid fashion and effectively form a permeable check dam that temporarily traps water moving down stream. Minerals inside the bags have an affinity for attracting nutrients depending upon the type of stone. Zeolite is used to retain ammonium and a crushed limestone is being tested for its ability to attract P. This technology has been used in groundwater applications and is currently being tested for the treatment of storm flows in the Bosque River watershed. Results will be available when testing is finished (Wolfe, 2006). Implementing a watershed riparian restoration program – streambank stabilization
Stream channels, streambanks and associated riparian areas are dynamic and sensitive ecosystems that respond to changes in land use activity. Streambank and channel disturbance resulting from human and natural disturbance can increase the stream’s sediment load, which can cause channel erosion or sedimentation and have adverse effects on the biotic system. BMPs can
20
reduce sediment and other pollutant discharges to minimize the impact of detrimental activities on watercourses. A multitude of BMPs regarding streambank stabilization exist (e.g. preservation of existing vegetation, hydraulic mulch, geotextiles, etc.), and strategic planning is a must for selection of proper stabilization programs. Streambank stabilization could provide a crucial BMP for addressing both sediment and nutrient issues in the Bosque River watershed. Installing permeable check dams in upper reaches of the watershed with ponds at the lower extent to reduce concentrated flow
Installation of permeable check dams upstream in combination with ponds at the lower extent of the drainage areas would also target reduction of runoff flow velocities while simultaneously decreasing sediment and nutrient transport. Check dams are not intended for watersheds larger than 10 acres or for use on a constantly flowing stream. These structures are also not intended for long-term use and typically require extensive maintenance following a high velocity event. This BMP would work best on localized erosion control that can be fixed by grassing the waterway; thus they would be a temporary measure until grass has been established. Ponds would serve as a sediment trap and would hold the majority of sediment and nutrients in the watershed (California Department of Transportation, 2003). Developing constructed wetlands
Constructed wetlands use natural processes involving wetland vegetation, soils and their associated microbial assemblages to assist, at least partially, in treating an effluent or other water sources (EPA, 2000). In general, these systems should be engineered and constructed in uplands, outside waters of the U.S., unless the source water can be used to restore a degraded or former wetland. Constructed wetlands can provide multiple benefits to landowners and the environment including: 1) habitat enhancement, 2) sediment retention, 3) nutrient retention, 4) aesthetic values, etc. The use of constructed wetlands as a BMP for environmental infrastructure improvement within the Bosque River watershed has considerable potential for addressing multiple issues of concern. Damming ephemeral gullies or installing porous “gully plugs”
Installing “gully plugs” or damming ephemeral gullies is a practice that slows water as it is moving down slope. The velocity decrease accomplishes two goals: 1) lowering the erosive potential of the channelized flow, and 2) allowing sediment and substances attached to it to settle out ahead of the dam. This sediment reduction by the dam could and usually does cause stream bank erosion problems downstream (Knight, 2002). Dams would most likely be constructed from soil or concrete while gully plugs use porous materials such as rocks or logs. The idea behind this practice is that the gully will eventually fill itself in as sediment is deposited upslope from the dam or “gully plug.” This practicemay not completely solve the problem and would work best in combination with other BMPs. When implementing these structures, extra care must be taken to prevent further streambank erosion or to change the overall physics of the stream (Mayben 2006).
21
Implementing range re-vegetation practices – management for species beneficial to water detention on land
Proper vegetation management has the potential to minimize non-point source pollution in many rangeland/pastureland systems. If proper and adequate vegetative cover is maintained, landowners can influence the development of healthy watersheds. Management for healthy bunchgrass dominated systems can increase infiltration, decrease surface runoff and reduce soil loss compared to sod grass or bareground (Knight, 2002). Range re-vegetation practices may include range seeding, grazing management or other vegetation associated practices. The BMP can provide multiple benefits to landowners within the Bosque River watershed and provide a beneficial tool in the implementation of environmental infrastructure improvement. Developing construction site runoff management for pre/post construction activities TCEQ currently regulates construction activities on sites that disturb more than 1 acre of soil. The contractor must complete a stormwater pollution prevention plan, obtain a Texas Pollutant Discharge Elimination System Permit, and file a notice of intent and notice of termination before beginning the project and after project completion. Several waivers are available for low erosion areas, but implementing erosion control practices is still a smart idea. Construction sites should employ stabilization and structural control measures to get the best results. These include temporary and permanent seeding, mulching, earthen dikes, silt fences, sediment traps, and sediment basins (Persyn et al. 2005). Proper maintenance is the key to these practices remaining effective. These practices can be and should be used on all construction sites throughout the basin. Treating storm runoff by temporary storm storage in retention ponds Retention ponds are designed to capture the bulk of rapid storm runoff. Water is held in these ponds until the structure reaches capacity and water begins to leave through the emergency spillway, evaporates, or infiltrates into the ground. Typically, retention ponds always have water in them (Persyn et al. 2005). These ponds allow almost all of the sediment and many of the nutrients carried in the water to settle into the basin. Retention ponds can be used effectively in many areas. In some cases, they have been incorporated into new developments to add a semi-natural ecosystem to the area that can add economic and aesthetic value to the property. Developing plans for recreation areas, including storm water planning for surrounding residential areas This BMP approach could include retention and detention ponds. Retention ponds typically have water in them at all times. Detention ponds basically slow water movement downstream and have the ability to capture a large volume of water and then regulate its release (Persyn et al. 2005). Retention ponds would be best suited as a focal point in a park where pond or wetland type ecosystem is desirable. Detention ponds could be incorporated into athletic parks that cover a large surface area. Playing fields (baseball, football, and soccer) could be constructed at a low point in the complex and serve as the detention pond with an outlet that regulates flow. Since these ponds are only temporarily wet, this would be a great dual purpose BMP.
22
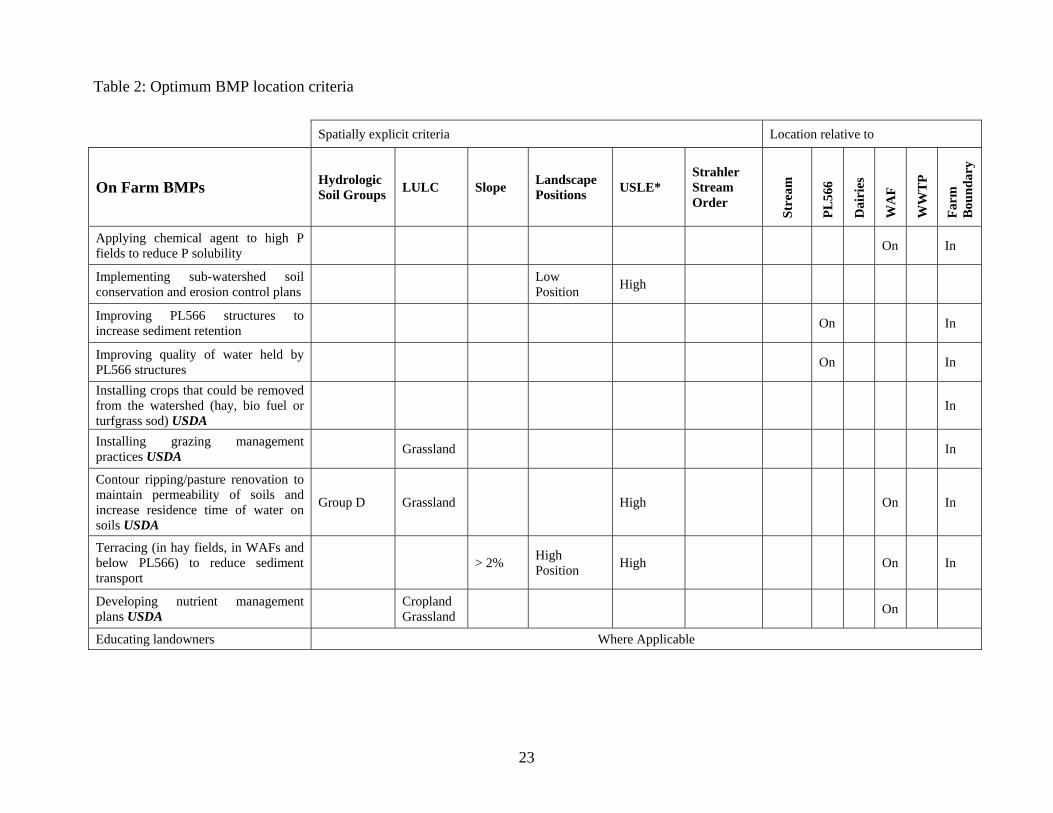
Optimal BMP Locations
Optimal locations for each BMP listed were determined using spatial criteria recommended by the scientific advisory committee. Those spatial criteria are:
• Dominant Hydrologic Soil Group: broken into four categories; A, B, C and D. Group A represents soils with the highest infiltration rates and lower erosion potential while Group D soils have the lowest infiltration rates and higher erosion potentials
• Dominant Land Use/Land Cover (LULC): dictates what vegetative cover is in place and what land use practices are employed. Runoff, infiltration and erosion rates can be inferred based on land use/land cover.
• Average slope: is the average slope for the entire sub-watershed; can be correlated to erosion and runoff potential
• Landscape position: denotes the general location in the sub-watershed (high or low) where the BMPs would be most effective
• Average soil loss: the average soil lost across the sub-watershed due to erosion as calculated by the Universal Soil Loss Equation (USLE)
• Strahler stream order: is a ranking system that identifies stream segments based on the number and size of tributaries feeding into the stream. First order streams are streams in the upper portion of the watershed that are small tributaries. Second order streams are formed when two second order streams join. Third order streams form when two second order streams join; and so on.
BMPs were also evaluated based on their proximity to certain features in the landscape such
as: streams, PL566 structures, dairies, WAFs, wastewater treatment plants and farm boundaries. Each BMP was individually evaluated for effectiveness using a combination of the six spatial criteria described above. The scientific advisory committee determined which criteria were best suited for use on each BMP. Criteria used to determine optimal locations for each BMP are presented in Table 2 along with specific elements that must be met for the BMP to be employed.
To illustrate, look at terracing in Table 2 as an example. The criteria considered for this BMP
are slope, landscape position and average soil loss (USLE). For this BMP to be considered for implementation in a sub-watershed, slope must be > 2%, landscape position must be high, and average soil loss must be high. In addition, the BMP must be used on a WAF and inside a farm’s boundaries. A map was developed that shows the optimal location for each BMP using the GIS model and selected criteria (Optimal Location Maps in Appendix VI).
Prioritizing BMPs
After finalizing the list of appropriate BMPs, the scientific advisory committee was invited to determine a priority index assigning each BMP a value from 1 to 10 (1 being the lowest priority and 10 being the highest priority). The scientific advisory committee made its decisions based on the member’s knowledge and expertise. Effects on water quality improvement, initial costs for BMP implementation, maintenance needs and costs, and the applicability of this practice in the watershed were all considered when prioritizing the BMPs. This priority index indicates which BMPs should be implemented first based on these considerations (Table 3).
23
Spatially explicit criteria Location relative to
On Farm BMPs Hydrologic Soil Groups LULC Slope Landscape
Positions USLE* Strahler Stream Order
Stre
am
PL56
6
Dai
ries
WA
F
WW
TP
Farm
B
ound
ary
Applying chemical agent to high P fields to reduce P solubility On In
Implementing sub-watershed soil conservation and erosion control plans Low
Position High
Improving PL566 structures to increase sediment retention On In
Improving quality of water held by PL566 structures On In
Installing crops that could be removed from the watershed (hay, bio fuel or turfgrass sod) USDA
In
Installing grazing management practices USDA Grassland In
Contour ripping/pasture renovation to maintain permeability of soils and increase residence time of water on soils USDA
Group D Grassland High On In
Terracing (in hay fields, in WAFs and below PL566) to reduce sediment transport
> 2% High Position High On In
Developing nutrient management plans USDA Cropland
Grassland On
Educating landowners Where Applicable
Table 2: Optimum BMP location criteria

24
Applying a waste injection program to directly inject fertilizer/manure/etc. into soils
Where Applicable
* Universal Soil Loss Equation
Spatially explicit criteria Location relative to
Between Field and Creek BMPs
Hydrologic Soil Groups LULC Slope Landscape
Positions USLE* Strahler Stream Order
Stre
am
PL56
6
Dai
ries
WA
F
WW
TP
Farm
B
ound
ary
Developing recharge structures to reduce runoff and sediment yield Group A/B <2% Low
Position
Installing vegetation buffers - "polishing strips" Low
Position Tributaries Order: 1st to 4th
100 ft Buffer
* Universal Soil Loss Equation Spatially explicit criteria Location relative to
In Stream or Gullies BMPs Hydrologic Soil Groups LULC Slope Landscape
Positions USLE* Strahler Stream Order
Stre
am
PL56
6
Dai
ries
WA
F
WW
TP
Farm
B
ound
ary
Installing permeable reactive barriers / check dams along downstream gully systems to reduce sediment and dissolve P in runoff
Small Tributaries Order: 1st to 2nd
Implementing a watershed riparian restoration program - streambank stabilization
Low Position
Main Order: 5th to 6th
Installing permeable check-dams in upper reaches of the watershed with ponds at the lower extent to reduce concentrated flow
Low Position
Small Tributaries Order: 1st to 2nd
Table 2: continued

25
Developing constructed wetlands (ex. below PL566 structures) Group D <2% Low
Position
* Universal Soil Loss Equation
Spatially explicit criteria Location relative to
Universal BMPs Hydrologic Soil Groups LULC Slope Landscape
Positions USLE* Strahler Stream Order
Stre
am
PL56
6
Dai
ries
WA
F
WW
TP
Farm
B
ound
ary
Damming ephemeral gullies or installing porous “gully plugs” > 5% Low
Position High
Implementing range re-vegetation practices - management for species beneficial to water detention on land
Where Applicable
* Universal Soil Loss Equation
Spatially explicit criteria Location relative to
City BMPs Hydrologic Soil Groups LULC Slope Landscape
Positions USLE* Strahler Stream Order
Stre
am
PL56
6
Dai
ries
WA
F
WW
TP
Farm
B
ound
ary
Developing construction site runoff management for pre/post construction activities
Where Applicable - At the city level
Treating storm runoff and water quality by temporary storm storage in retention ponds and/or associated wetland
Where Applicable - At the city level
Developing plans for recreation areas, including storm water planning for surrounding residential areas
Where Applicable - At the city level
* Universal Soil Loss Equation
Table 2: continued

26
Table 3: BMPs listed by category with their associated effectiveness priority as designated by the scientific advisory committee On Farm BMPs Priority
Applying chemical agent to high P fields to reduce P solubility 6
Implementing sub-watershed soil conservation and erosion control plans 8
Improving PL566 structures to increase sediment retention 7
Improving quality of water held by PL566 structures 7 Installing crops that could be removed from the watershed (hay, bio fuel or turfgrass sod) USDA 8
Installing grazing management practices USDA 6 Contour ripping/pasture renovation to maintain permeability of soils and increase residence time of water on soils USDA 6
Terracing (in hay fields, in WAFs and below PL566) to reduce sediment transport 5
Developing nutrient management plans USDA 8
Educating landowners 10
Applying a waste injection program to directly inject fertilizer/manure/etc. into soils 4 Between Field and Creek BMPs Priority
Developing recharge structures to reduce runoff and sediment yield 9
Installing vegetation buffers - "polishing strips" 10 In Stream or Gullies BMPs Priority Installing permeable reactive barriers / check dams along downstream gully systems to reduce sediment and dissolve P in runoff 7
Implementing a watershed riparian restoration program - streambank stabilization 9 Installing permeable check-dams in upper reaches of the watershed with ponds at the lower extent to reduce concentrated flow 8
Developing constructed wetlands (ex. below PL566 structures) 10 below PL566, 6 otherwise
Universal BMPs Priority
Damming ephemeral gullies or installing porous “gully plugs” 10 Implementing range re-vegetation practices - management for species beneficial to water detention on land 7
City BMPs Priority
Developing construction site runoff management for pre/post construction activities 6 Treating storm runoff and water quality by temporary storm storage in retention ponds and/or associated wetlands 9
Developing plans for recreation areas, including storm water planning for surrounding residential areas 7

27
GIS Analysis
GIS analysis was performed to determine which PL566 structures would theoretically require the most attention and should be considered for further field investigation based upon a series of indices listed below. Each PL566 was specified by an identification number as presented in Figure 14 and Appendix II. Spatial information for each of the six index criteria was collected for each PL566 watershed using the GIS model and is included in Appendix II.
This analysis consisted of studying the drainage of each PL566 structures using GIS data gathered and generated for this project. The following information was collected for each drainage area:
- Slope (%) min, max and average - USLE min, max and average - Percentage of Hydrologic Soil Group - Percentage of Land Use / Land Cover - Drainage Area in acres - Presence (or not) of Dairies and WAFs
Using these spatial data, a system of indices was implemented to determine which drainage
area should be most impacted by sediment erosion or/and water pollution and should be considered for further field investigation.
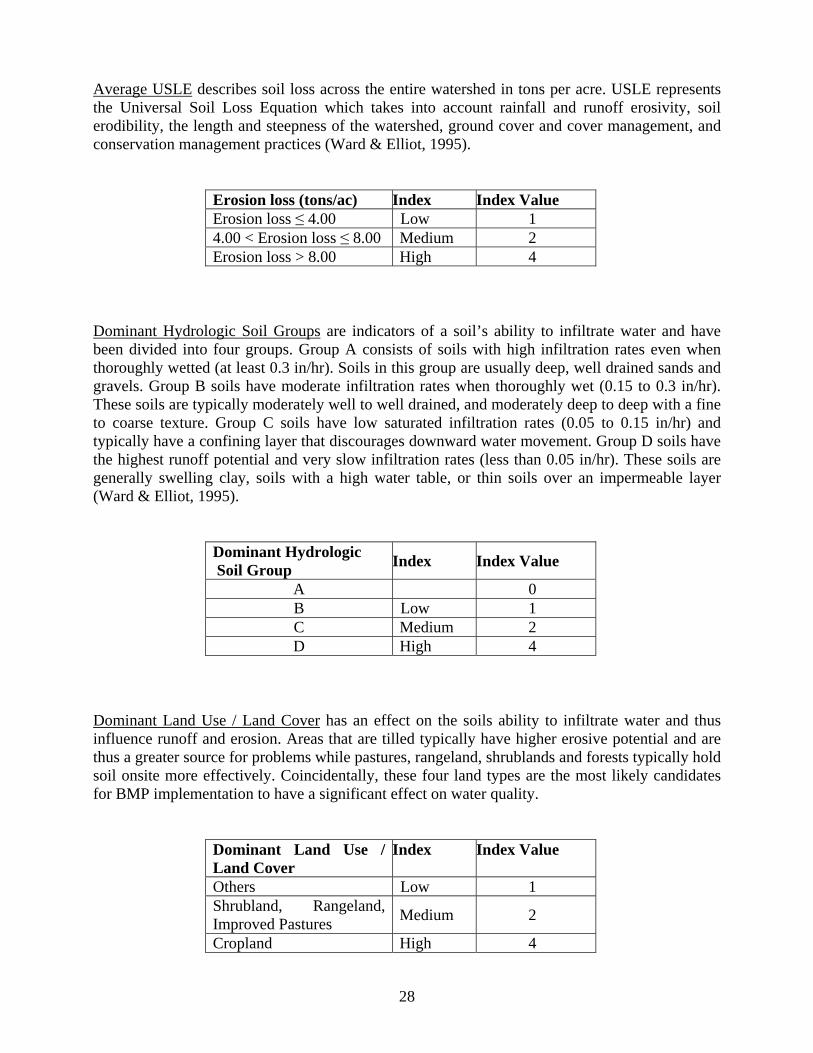
For each spatial criterion, an index of low, medium or high was determined to express the potential contribution to sediment erosion and/or water pollution. Values from referenced material were used to establish the thresholds between low, medium and high index values. The index values are rated using a log base of 2 similar to the NRCS Phosphorus Index (2006). The sum of all the indices yields a Guidance Index that categorizes each PL566 structure as low, medium or high priority based on the total index value accumulated. Indices Average Slope is a measure of overall slope within the contributing watershed. Slope is an important factor in determining the potential energy that water may have when traveling through a watershed. Lower sloping watersheds (typically ≤ 2%) provide less energy to a watershed than do steeper sloping watersheds (typically > 5%); however, slope length also contributes to the potential for soil erosion (Ward and Elliot, 1995). Index values for this particular criterion are representative of the watershed’s average slope.
Slope Index Index Value Slope ≤ 2% Low 1 2% < Slope ≤ 5% Medium 2 Slope > 5% High 4
28
Average USLE describes soil loss across the entire watershed in tons per acre. USLE represents the Universal Soil Loss Equation which takes into account rainfall and runoff erosivity, soil erodibility, the length and steepness of the watershed, ground cover and cover management, and conservation management practices (Ward & Elliot, 1995).
Erosion loss (tons/ac) Index Index Value Erosion loss ≤ 4.00 Low 1 4.00 < Erosion loss ≤ 8.00 Medium 2 Erosion loss > 8.00 High 4
Dominant Hydrologic Soil Groups are indicators of a soil’s ability to infiltrate water and have been divided into four groups. Group A consists of soils with high infiltration rates even when thoroughly wetted (at least 0.3 in/hr). Soils in this group are usually deep, well drained sands and gravels. Group B soils have moderate infiltration rates when thoroughly wet (0.15 to 0.3 in/hr). These soils are typically moderately well to well drained, and moderately deep to deep with a fine to coarse texture. Group C soils have low saturated infiltration rates (0.05 to 0.15 in/hr) and typically have a confining layer that discourages downward water movement. Group D soils have the highest runoff potential and very slow infiltration rates (less than 0.05 in/hr). These soils are generally swelling clay, soils with a high water table, or thin soils over an impermeable layer (Ward & Elliot, 1995).
Dominant Hydrologic Soil Group Index Index Value
A 0 B Low 1 C Medium 2 D High 4
Dominant Land Use / Land Cover has an effect on the soils ability to infiltrate water and thus influence runoff and erosion. Areas that are tilled typically have higher erosive potential and are thus a greater source for problems while pastures, rangeland, shrublands and forests typically hold soil onsite more effectively. Coincidentally, these four land types are the most likely candidates for BMP implementation to have a significant effect on water quality.
Dominant Land Use / Land Cover
Index Index Value
Others Low 1 Shrubland, Rangeland, Improved Pastures Medium 2
Cropland High 4

29
Waste Application Field and/or Dairy Presence is an important indicator that can have a significant effect on overall quality of the watershed. Dairies and WAFs can be a source for large amounts of pollutant entering into the stream channel and their presence must be acknowledged and accounted for. This index weighs dairies and WAFs equally while doubling the rank if both are present in the same PL566 drainage area.
Waste App. Field and/or Dairy presence Index Index Value
No WAF or Dairy Low 1 WAF or Dairy Medium 2 WAF and Dairy High 4
Drainage Area is the size of the watershed. Typically, larger watersheds have a greater potential for contributing pollutants to a waterway or reservoir due to their size. Despite a large drainage area receiving a larger load of pollutants, its size could work to its advantage by allowing for dilution or storage within the system. Small watersheds can also be significant contributors, but it is less likely. Large watersheds were assigned more weight in this study due to this possibility.
Drainage Area Index Index Value Area ≤ 2,500 acres Low 1 2,500 acres < Area ≤ 5,500 acres Medium 2 Area > 5,500 acres High 4
Guidance Index is a cumulative ranking from all six indices described above. The index labels each PL566 and its associated drainage area with a numerical indicator ranging from 5 for the lowest problem potential to 24 with the highest problem potential. This is not a final measure that specifies certain structures as being more at risk than others; it is only an initial screening tool that attempts to point out potential problem areas and gives us a starting point for further investigations.
Guidance Index Index # of PL566 ≤ 12 Low 11 13 to 15 Medium 18 > 15 High 11
30
Discussion
This project’s primary goal is to improve the environmental infrastructure in the Bosque River watershed. Phase I of the project specifically focused on determining a methodology that would lead to accomplishing this goal. A scientific advisory committee was established to provide knowledge and insight into developing the methodology, presenting impacted areas in the watershed, feasible BMPs, ranking these BMPs, and determining the location where these management strategies would have the greatest effect. Field evaluations were incorporated to establish baseline knowledge on existing conditions in the watershed. Prioritizing Sub-watersheds
The first step of the methodology is to establish which areas of the watershed need the most improvement and should be targeted for initial BMP projects. Three impact indices were created to evaluate sub-watersheds and categorize their potential pollutant contributions to the river. A concentration impact index, load per unit area impact index, and load impact index were created to evaluate the influence each sub-watershed has on entire watershed health. The load per unit area impact index evaluates pollutants derived from each individual sub-watershed while the load impact index and the concentration impact index evaluate pollutants derived from the entire watershed.
New BMPs
The scientific advisory committee recommended 22 BMPs (Table 1 & Table 2) that would be appropriate for use in the Bosque River watershed. This list was developed using their knowledge of the BMPs and their effects on landscape and ecosystem health. The BMPs listed focus on reducing erosion, pollutant and sediment transport, and improving watershed health.
Prioritizing BMPs
After developing the BMP list, each BMP was assigned a priority index (explained in the BMPs section) created by the scientific advisory committee to determine a rank for the BMPs based on their ability to effectively improve water quality, improve watershed health and economics. BMPs were evaluated for spatial and location sensitive parameters that are pertinent to their application and effectiveness.
After evaluating the list of BMPs and prioritizing them for relevance and effectiveness in the
watershed, the scientific advisory committee recommended six BMPs that they deemed to be the best choices for implementation. The six BMPs are:
• Educating landowners as an “On-Farm” BMP • Developing recharge structures to reduce runoff and sediment yield as a “Between Field
and Creek” BMP

31
• Installing vegetation buffers as a “Between Field and Creek” BMP • Developing wetlands downstream from PL566 structures as an “In Stream or Gullies”
BMP • Damming ephemeral gullies or installing porous “gully plugs” as a “Universal” BMP • Treating storm runoff and water quality by temporary storm storage in retention ponds
and/or associated wetland as a “City” BMP The advisory committee believes that these six BMPs will provide the best results in the
Bosque River watershed. These BMPs provide an economical yet effective means of improving watershed health and will serve to effectively protect current infrastructure. Other BMPs were deemed effective if used in the proper situation, but would most likely be less effective or more costly to implement and maintain than the six preferred BMPs. Ultimately, landowners will decide when and where BMPs they desire will be implemented. Determining Optimal BMP Locations
Extensive spatial analysis revealed a list of critical parameters that were recommended from the spatial data evaluated; these were sent to the scientific advisory committee for consideration. The scientific advisory committee identified and recommended six spatially explicit criteria/parameters for use in determining optimal BMP locations. Chosen criteria were hydrologic soil group, land use and land cover, slope of the sub-watershed, landscape position, average erosion and Strahler stream order. Potential locations for implementing each BMP within the Bosque watershed are illustrated by GIS derived location maps in Appendix VI. These maps serve as a guide that can be used as a starting point for BMP implementation. They suggest locations that appear to be optimum site for the specific BMP based on the data available. These locations must be verified by a site visit to determine their actual viability for implementing suggested BMPs.
The scientific advisory committee recommends the use of the concentration impact index to
prioritize location of “In-Stream or Gullies” and “Municipal” BMPs throughout the Bosque watershed and the load per unit area impact index to prioritize the location of “On-Farm,” “Between Field and Stream” and “Universal” BMPs throughout the Bosque watershed. The impetus for this decision was that some BMPs target pollutant concentration or load specifically and are more effectively placed if evaluated with a particular index. Existing BMPs
The scientific advisory committee also recommends maintenance and/or improvement to existing BMPs as an efficient substitute to building new BMPs. Currently, there are two categories of BMPs in place in the Bosque watershed: 1) a 180-acre wetland just north of Lake Waco and 2) PL566 structures located in the North Bosque River Sub-basin.
The constructed wetland was established to serve as a water filtering system for water
entering Lake Waco and to mitigate wetland acres inundated by raising water levels in the lake. The wetland is situated at the end of the watershed just above Lake Waco and intercepts about 11% of the river base flow or between 9 and 10 million gallons daily. This wetland is a relatively

32
low maintenance design that typically does not require heavy maintenance by machines. Selective removal of aggressive plant species is the only common maintenance practice (Conry, 2006).
The U.S. Department of Agriculture Soil Conservation Service built PL566 structures in the
1950s and 60s under funding from PL566. Their expected lifespan was estimated to be 50 years. Many of the structures are approaching or have exceeded the end of their projected lifespan and require maintenance and/or improvements to maintain their integrity and beneficial functions. These structures’ intended purpose was to store runoff during high magnitude rainfall events delay flow releases downstream. In addition, studies conducted by TIAER (McFarland, 2006) and BU (Prochnow et al., 2006) demonstrate that these structures play an important role in mitigating water quality constituents and reducing downstream nutrient concerns.
TIAER studied two PL566 structures and evaluated their ability to remove nutrients from
stormflow. Average removal efficiency ratios for measured constituents were 84% for TSS, 69% for Organic-P, 46% for Inorganic-P, 69% for NO2-N+NO3-N, 51% for NH3-N and 49% for Organic-N (McFarland, 2006).
The scientific advisory committee recommends further investigation of each PL566 structure
to determine the current status of each structure and their potential effects on water quality issues. Field inspections should occur based on highest priority using the guidance index presented in this report. McFarland (2006) and Prochnow et al. (2006) demonstrate that those structures in good condition should be consistently maintained and those in poor condition should be restored to proper function.

33
Conclusions
Phase I of this project was designed and implemented to develop an environmental
infrastructure improvement plan for the Bosque River Basin. Spatially explicit and non-spatial time series data were integrated from multiple resources to illustrate diverse land characteristics, water bodies, and potential natural and anthropogenic sources of contamination in the basin. The most current and readily available data were obtained from TIAER, BREC, TAMU-SSL, SSURGO, TNRIS and Texas A&M University.
The scientific advisory committee (Appendix VII) was assembled to provide expertise and
guidance regarding appropriate BMPs for environmental infrastructure improvement in the basin, optimal location on the landscape and potential benefits from implementation. They were charged with developing a strategy that matches priority areas within the watershed with appropriate BMPs that would improve the health and protect infrastructure in the watershed while remaining economical and easy to maintain.
The scientific advisory committee also approved a methodology that should be employed
when determining which BMPs to use in particular areas of the watershed. The recommended plan of action is:
1. List and categorize feasible BMPs as: “In-Stream or Gullies,” “Municipal,” “On- Farm,”
“Between Field and Creek” or “Universal.” 2. Identify sub-watersheds requiring the most improvement. 3. Use the concentration impact index map to prioritize the location of “In-Stream or Gullies”
and “Municipal” BMPs throughout the Bosque watershed. 4. Use the load per unit area impact index map to prioritize the location of “On-Farm,”
“Between Field and Creek” and “Universal” BMPs throughout the Bosque watershed. 5. For each sub-watershed selected, determine which BMPs should be implemented in priority
by considering the BMP list and the priority index associated to it. 6. Finalizing the location of each BMP in each sub-watershed by referring to the BMP location
maps. By determining most impacted areas, effective BMPs, optimal locations for these BMPs and
expected benefits; the current methodology provides a balanced approach to the development of an environmental infrastructure improvement plan for the Bosque River Basin. This system provides effective procedures for identifying priority areas and BMPs that will yield the most significant improvement in watershed health and quality.
34
Recommendations
• Recommend establishment of a Project Advisory Team composed of USACE, USDA-NRCS, Texas A&M research and Extension personnel, and watershed stakeholders in anticipation of receiving federal funding for BMP implementation and practice verification. Strengths from NRCS working with landowners to address on-farm activities partnered with USACE capabilities for in-stream and wetland issues can provide the systems approach necessary for infrastructure improvement. The university personnel can facilitate needed education and outreach, as well as studies necessary for assessment and practice verification.
• In conjunction with the Project Advisory Team, develop GIS-based prioritization of
watersheds and appropriate waterbodies, streams, tributaries with categorization of in-stream/gully, municipal, on-farm, upland/riparian interface and universal land units. Assess stakeholder willingness to participate in voluntary programs. Conduct stakeholder meetings within the watershed to further understand who would be interested in participation and specific cost share levels or other requirements to assure program viability. Determine appropriate subsidies and design cost-share program. Gather appropriate field information for prioritization process. (Bosque Environmental Infrastructure Improvement Plan – Phase II)
• Conduct economic feasibility study and watershed ranking based on priority matrix.
Conduct modeling exercise to determine potential impacts of selected BMP’s within priority sub-watersheds. Project Advisory Team begin implementation of BMP’s based upon potential impacts illustrated through watershed modeling efforts (Proposed Phase III).

35
References
Adams, T., N. Easterling, & A. McFarland. 2005. Semiannual Water Quality Report for the North Bosque River Watershed and Lake Waco, October 2005 – TR0508
California Department of Transportation. 2003. Construction Site Best Management Practices Manual. Accessed July 5, 2006. www.dot.ca.gov/hq/construc/stormwater/SC-04.pdf Conry, T. 2006. Water Quality Administrator, City of Waco, TX. Personal Communication. Dao, T.H., L.J. Sikora, A. Hamasaki & R.L. Chaney. 2001. “Manure phosphorus extractability as affected by aluminum- and iron byproducts and aerobic composting.” Journal of Environmental Quality. 30:1693-1698. DiLuzio, M., R. Srinivasan, & J. Arnold. 2004. “A GIS-Coupled Hydrological Model System for the Watershed Assessment of Agricultural Nonpoint and Sources of Pollution.” Transactions in GIS, 8: 113-136. Dosskey, M.G. 1998. Viewpoint: “Applying riparian buffers to Great Plains rangelands.” Journal of Range Management. 51:428-431. Dou, Z., G.Y. Zhang, W.L. Stout, J.D. Toth & J.D. Ferguson. 2003. “Efficacy of alum and coal combustion byproducts in stabilizing manure phosphorus.” Journal of Environmental Quality. 32:1490-1497.
Dybala, T. 2006. NRCS Engineer, Temple, TX. Personal communication.
Easterling, N., & A. McFarland. 2004. Semiannual Water Quality Report for the Bosque River Watershed: 1998-2003. Technical report TR-0401 published by TIAER, Tarleton State University. EPA. 2003. National Management Measures to Control Nonpoint Source Pollution from Agriculture. Accessed July 5, 2006. www.epa.gov/nps/agmm/index.html EPA. 2000. Guiding principles for constructed wetlands: Providing for water quality and wildlife habitat. EPA 843-B-00-003. Galarneau, E. and Gehr, R., 1997, ‘Phosphorus removal from waste waters: Experimental and theoretical support for alternative mechanisms’, Water Resources Management. 31:328–338.
Hanzlik, J., C. Munster, A. McFarland, D. Vietor, & R. White. 2004. “GIS Analysis to Identify Turfgrass Sod Production Sites for Phosphorus Removal.” Transactions of the ASAE, 47: 453-461.
36
Huffman, A. 2006. NRCS District Conservationist, Erath County. Stephenville, TX. Personal communication.
Knight, R.W. 2002. “Management applications of water quality information on rangelands.” In: Rangeland Hydrology and Water Quality in the Texas Coastal Bend, D.L. Drawe [Ed.]. NOAA NA07OZ0134.
Mayben, K. 2006. NRCS Engineer. Weatherford, TX. Personal communication.
Munster, C.L., J.E. Hanzlik, D.M. Vietor, R.H. White & A. McFarland. 2006. “Assessment of manure phosphorus export through turfgrass sod production in Erath County, Texas”, Journal of Environmental Management, in review McFarland, A. 2006. “Sediment and Nutrient Removal Efficiencies for Public Law 566 Flood Retardation Reservoirs.” Unpublished paper developed for TIAER, Tarleton State University. McFarland, A., J. Millican, A. Bekele, & A. Whisenant. 2006. “Trends in Water Quality along the North Bosque River: An Interim Update through 2004.” Technical report TR-0603 published by TIAER, Tarleton State University. McFarland, A., A. Saleh, & L. Hauck. 2000. “Demonstration of Phosphorus Best Management Practices in the North Bosque River Basin.” Technical report TR-0002 published by TIAER, Tarleton State University.
Nelle, S. 2006 NRCS Range Specialist, Zone 2, San Angelo, TX. Personal communication.
NRCS. 1984. Engineering Field Handbook. Accessed July 3, 2006. www.info.usda.gov/CED/Default.cfm?xSbj=53&xAud=24 NRCS. 2003. National Range and Pasture Handbook. Accessed July 3, 2006. www.glti.nrcs.usda.gov/technical/publications/nrph.html
NRCS Website. 2006. http://www.nrcs.usda.gov/programs/watershed/Locally_Led/locallyled.html
NRCS Website. 2006. Electronic Field Office Technical Guide. http://www.nrcs.usda.gov/Technical/efotg/
NRCS Website. 2006. Electronic Field Office Technical Guide – Grazing Land Mechanical Treatment (Contour Ripping). http://efotg.nrcs.usda.gov/treemenuFS.aspx
NRCS Website. 2006. National Agronomy Manual. http://policy.nrcs.usda.gov/scripts/lpsiis.dll/M/M_190_NAM.htm
37
NRCS Website. 2006. National Planning Procedures Handbook. http://www.nrcs.usda.gov/PROGRAMS/afo/cnmp_guide_index.html
NRCS Website. 2006. The Phosphorus Index: A Phosphorus Assessment Tool - Technical Note, August, 1994. http://www.nrcs.usda.gov/TECHNICAL/ECS/nutrient/pindex.html Parsons Engineering. 2006.”Assessment of Bacterial Sources Impacting Lake Waco and Belton Lake.” 2006. Technical report published for the Texas State Soil and Water Conservation Board. Persyn, R.A., M. Griffin, A.T. Williams. 2005. “Stormwater Management.” Technical Report B-6158. Published by Texas Cooperative Extension – The Texas A&M University System. Prochnow, S., J. White, C. Filstrup, L. Zygo, J. Scott, & B. Byars. 2006. “Multi-Scenario Watershed Management: GIS Modeling of the Waco Lake Basin.” Paper presented at the American Water Resources Association Geographic Information Systems and Water Resources Specialty Conference, May 8, 2006, Houston, Texas. Rosenthal, W., & D. Hoffman. 1999. “Hydrologic Modeling/ GIS as an Aid in Locating Monitoring Sites.” Transactions of the American Society of Agricultural Engineering, 42: 1591-1598. Santhi, C., J. Arnold, J. Williams, L. Hauck, & W. Dugas. 2001. “Application of a Watershed Model to Evaluate Management Effects on Point and Nonpoint Source Pollution.” Transactions of the American Society of Agricultural Engineering, 44: 1559-1570.
Shrank, F. 2006. NRCS Range Specialist for Erath County. Stephenville, TX. Personal communication.
Stewart, G., C. Munster, D. Vietor, J. Arnold, A. McFarland, R. White, & T. Provin. 2006. “Simulating Water Quality Improvements in the Upper North Bosque River Watershed Due to Phosphorus Export through Turfgrass Sod.” Transactions of the ASAE, 49: 357-366. TCEQ. 2006. “Water Quality in the North and Upper Bosque Rivers: An Updated Status of Activities to Address Elevated Nutrient Concentrations.” TCEQ. 2002a. “An Implementation Plan for Soluble Reactive Phosphorus in the North Bosque River Watershed: Segments 1226 and 1255.” TCEQ. 2002b. “Improving Water Quality in the North Bosque River: Two TMDLs for Phosphorus.” TCEQ & TSSWCB. 2005. “2005 Annual Report: Managing Nonpoint Source Pollution in Texas.” TCEQ & TSSWCB. 2003. “Reducing Phosphorus in the North Bosque River: Taking Action to Improve Water Quality.” Fact Sheet GI-306.

38
TIAER & Tarleton State University. 2005. “Evaluation of the Manure Composting Program on Stream Water Quality: Interim Report through 2004.”
USDA Soil Survey of Erath County. 1973. United States Department of Agriculture Soil Conservation Service.
Ward, A.D. & W.J. Elliot. Eds. 1995. Environmental Hydrology. Lewis Publishers: New York. 1995.
Weems, W. 2006. County Extension Agent, Hamilton county. Hamilton, TX. Personal communication.
Wolfe, J. 2006. Assistant Research Scientist. Blackland Research and Extension Center, Temple, TX. Personal Communication. Zvomuya, F., C.J. Rosen & S.C. Gupta. 2006. “Phosphorus sequestration by chemical amendments to reduce leaching from wastewater application.” Journal of Environmental Quality. 35:207-215.

39
APPENDIX I
GIS DATA

40
GIS DATA
For the Environmental Infrastructure Improvement Plan for the Bosque River Basin, all
known existing GIS data have been gathered. Those data came from: - The Texas Institute for Applied Environmental Research (TIAER) - The Blackland Research and Extension Center - The Spatial Sciences Laboratory (TAMU SSL) from Texas A&M University - The Soil Survey Geographic (SSURGO) Database available online at
http://soildatamart.nrcs.usda.gov/ - The Texas Natural Resources Information System (TNRIS) website available at
http://www.tnris.state.tx.us/ - Dr Munster and Dr Vietor from Texas A&M University
Using those data and some information extracted from studies related to the Bosque River Basin, GIS data were also generated by the Spatial Sciences Laboratory. Data from TIAER TIAER delivered the following data: PL566 Location & Design Information
Three spreadsheets listed below contain general location and design information for the 40 PL566 reservoirs in the upper North Bosque River watershed. These 40 PL566 reservoirs are labeled using SCS numbering for reservoirs in the Green Creek (GC) watershed and in the upper Bosque (UB) watershed, which corresponds to labeling on the GIS layer. PL566_labelingx.xls – defines the creek or tributary where the PL566 reservoir is located PL566_design_infox.xls – contains general design information, such as spillway elevation and weir length Storage_Volume_to_Elevation.xls – contains information relating storage volume and surface
area to the elevation of water in the reservoir Pl566_dd.shp Dairy Locations The dairy location GIS shapefile is named dairy2005_dd.shp and is current as of October 2005. The file is unprojected (decimal degree format). The attribute table associated with the file indicates the dairy’s status (active or inactive) and whether or not the permitted or unpermitted. The permitted number of cows is also listed. WAFs all_wafs_2005update_dd.shp (dairy) and Salebarn_feedlots_dd.shp (other) represent the most current WAF information found in TCEQ files as of May 2005. The layer includes both active and historical fields. Some fields receiving dairy waste (third party fields) may not be mapped due to dairy operators’ use of contract haulers. Information regarding waste applied by contract haulers is not noted in the current permits and thus is not mapped in the current 2005 GIS layer. Additionally, there are some calf-raising facilities in the watershed with pending permit applications for which we were unable to get WAF information.
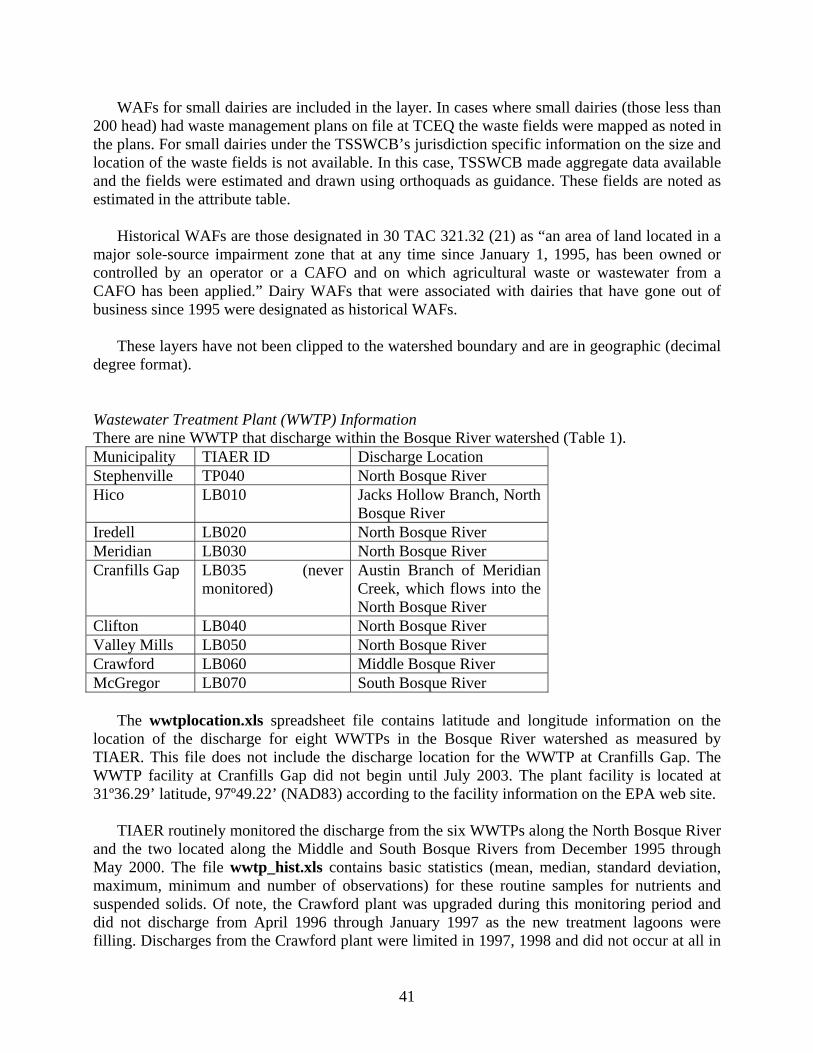
41
WAFs for small dairies are included in the layer. In cases where small dairies (those less than 200 head) had waste management plans on file at TCEQ the waste fields were mapped as noted in the plans. For small dairies under the TSSWCB’s jurisdiction specific information on the size and location of the waste fields is not available. In this case, TSSWCB made aggregate data available and the fields were estimated and drawn using orthoquads as guidance. These fields are noted as estimated in the attribute table. Historical WAFs are those designated in 30 TAC 321.32 (21) as “an area of land located in a major sole-source impairment zone that at any time since January 1, 1995, has been owned or controlled by an operator or a CAFO and on which agricultural waste or wastewater from a CAFO has been applied.” Dairy WAFs that were associated with dairies that have gone out of business since 1995 were designated as historical WAFs. These layers have not been clipped to the watershed boundary and are in geographic (decimal degree format). Wastewater Treatment Plant (WWTP) Information There are nine WWTP that discharge within the Bosque River watershed (Table 1). Municipality TIAER ID Discharge Location Stephenville TP040 North Bosque River Hico LB010 Jacks Hollow Branch, North
Bosque River Iredell LB020 North Bosque River Meridian LB030 North Bosque River Cranfills Gap LB035 (never
monitored) Austin Branch of Meridian Creek, which flows into the North Bosque River
Clifton LB040 North Bosque River Valley Mills LB050 North Bosque River Crawford LB060 Middle Bosque River McGregor LB070 South Bosque River The wwtplocation.xls spreadsheet file contains latitude and longitude information on the location of the discharge for eight WWTPs in the Bosque River watershed as measured by TIAER. This file does not include the discharge location for the WWTP at Cranfills Gap. The WWTP facility at Cranfills Gap did not begin until July 2003. The plant facility is located at 31º36.29’ latitude, 97º49.22’ (NAD83) according to the facility information on the EPA web site. TIAER routinely monitored the discharge from the six WWTPs along the North Bosque River and the two located along the Middle and South Bosque Rivers from December 1995 through May 2000. The file wwtp_hist.xls contains basic statistics (mean, median, standard deviation, maximum, minimum and number of observations) for these routine samples for nutrients and suspended solids. Of note, the Crawford plant was upgraded during this monitoring period and did not discharge from April 1996 through January 1997 as the new treatment lagoons were filling. Discharges from the Crawford plant were limited in 1997, 1998 and did not occur at all in

42
1999 and into 2000 due to the size of the new treatment lagoons and the effect of surface evaporation limiting potential discharge volume. Historical average daily discharge by month for the seven WWTPs in the North Bosque River watershed is contained in the spreadsheet waste_flowx.xls. The timeframe goes back to 1990, if data were available, and goes through early 2005. All discharge information is self-reporting data reported by the WWTPs to TCEQ. Most recent discharge and other self-reporting data are available from the USEPA Enforcement and Compliance History web site at http://www.epa.gov/echo/compliance_report_water.html. From May 2000 through February 2005, TIAER continued to monitor the effluent discharge from the Stephenville WWTP on a biweekly basis. Data from this time period for the Stephenville plant are summarized in the file tp040May00-Feb05.xls. A special study was also conducted in early 2005 of the discharge from the plants at Stephenville, Hico, Meridian and Clifton with the data summarized the spreadsheet wwtp_24hr_ss.xls. All eight plants along the North Bosque River are now required to report total P concentrations and loadings. TP and flow data available from TCEQ and EPA as of July 1, 2005 are contained in the spreadsheet WWTP_EPA_data_asof01jul05.xls. Of note, the Stephenville and Clifton WWTP have recently gone through upgrades as part of the North Bosque TMDL for SRP. The Clifton WWTP started using alum as part of its wastewater processing to decrease P discharges in early 2005 and is still refining the alum treatment amounts. The Stephenville WWTP is using alum and a polymer to decrease P. The Stephenville WWTP upgrade was due to come on line the end of 2005, so the data presented do not reflect discharge nutrients for the Stephenville plant with the new treatment system. Historical Water Quality Monitoring Data Historical water quality data are routinely summarized in TIAER’s Semiannual Water Quality reports. These can be found within the research library on our web site at: http://TIAER6.tarleton.edu/library/library.cfm The most recent report is TR0508 “Semiannual Water Quality Report for the North Bosque River watershed and Lake Waco, January 1, 2000 – December 31, 2004.” TIAER stopped monitoring along the South and Middle Bosque Rivers and Hog Creek in March 2003. For data for the South Bosque, Middle Bosque and Hogg Creek, I suggest you look at report TR0401, “Semiannual Water Quality Report for the Bosque River Watershed, July 1, 1998 – June 30, 2003.” Data from BREC BREC delivered the following data: SWAT Outputs The SWAT model was done with funding from USDA/NRCS through TIAER through National Pilot Project on Water Quality. The title of this study was "USDA Lake Waco/Bosque River Initiative: Water Quality Modeling of Bosque River watershed using SWAT for the Assessment of Phosphorus Control Strategies." The model was completed in June 2001. Most of the data was compiled using 1997-1998 data sources with historical climate and stream flow data going back to 1960.
43
The different scenarios included: • Current Conditions (1997-98) Baseline • Future conditions projections for year 2020 with existing practices. Baseline 2020 • Haul off --All solid manure was hauled out of the watershed. Liquid manure was applied to WAFs which amounted to approximately 12% of the manure from dairies. • Control of WWTP from urban communities in the study area. With Effluent levels of .5, 1.0, 1.5, and 2 mg/l from WWTP • Combined BMP's (1.0 mg/l of P) for WWTP and Haul off Scenarios.
1. Current conditions- Haul off plus 1.0mg/l of P in WWTP (Scenario 1) 2. Future conditions (2020) and 1.0 mg/l of P in WWTP and future population projections. (Scenario 2) 3. Scenario 2 plus restriction imposed to limit waste applications fields (WAF) to present day permitted WAF areas. (Scenario 3)
NHD The National Hydrography Dataset (NHD) is a newly combined dataset that provides hydrographic data for the United States. The NHD is the culmination of recent cooperative efforts of the USEPA and the U.S. Geological Survey (USGS). It is currently based on the content of the USGS 1:100,000-scale data, giving it accuracy consistent with those data. Data are in decimal degrees on the North American Datum of 1983. The bosque_NHD_waterbodies.shp and NHDflow.shp were extracted from the NHD of hydrologic unit 1206 and contains only the Bosque watershed. 12 digits watersheds The shapefile named 12_digit_watersheds.shp contains all the 12 digits sub-watersheds that composed the Bosque watershed. DEM Agreedem is a digital elevation model of 9.3 meter pixel. Two positions This shapefile two_position_catchments.shp represents the relative position between stream and ridge. There two types of position: high and low. The low position is composed of the 25-30% of this position and is defined as the lower points in the landscape. Bosque watershed boundary The shapefile named Watershed_boundaries.shp is the general boundaries of the Bosque watershed.

44
Data from TAMU SSL The Spatial Sciences Laboratory provided the following data: 2004 Digital Orthophoto Quadrangles (DOQs) for the following Counties:
- Bosque County - Comanche County - Coryell County - Eastland County - Erath County - Hamilton County - McLennan County - Somervell County
Those DOQs are color-infrared images with 1-meter ground resolution. Land Use A Land Use/ Land Cover data for Bosque river watershed has been developed by TAMU SSL from recent LANDSAT-7 ETM satellite imagery (2001-2003). The final data is a raster named mixutmnad83 that classifies the land use in the Bosque watershed in 10 major classes:
- Mines/Range/Pasture - Quarries/Mines - Urban - Cropland - Improved Pasture - Rangeland/Improved pasture - Shrubland/Rangeland - Evergreen - Deciduous - Water
Data from SSURGO The soil data downloaded were for: - Bosque County (TX035)
- Coryell County (TX099) - Erath County (TX143) - Hamilton County (TX193) - McLennan County (TX309) - Hood and Somervell Counties (TX609)
Those data covered the whole Bosque watershed. They contained spatial and tabular data. The tabular data were imported in a database. Data from TNRIS Highways The coverage highways represents the major highways for the state of Texas.

45
Cities boundaries The coverage cities represents the major cities for the state of Texas. Railroads The shapefile named rail100k.shp represents the major rail roads for the State of Texas at a scale of 1:100,000. Counties The coverage named Cnty24_dd.shp represents all the Counties for the State of Texas at 1:24,000. Data from Dr. Munster and Dr. Vietor – TAMU Dr. Munster and Dr. Vietor developed the concept of Turfgrass BMP, which they presented in various publications (Munster et al., 2004; Hanzlik et al., 2003 and Stewart et al., 2004). A geospatial database of suitable turfgrass production sites was developed for Erath County using GIS and was used in the Environmental Infrastructure Improvement Plan for the Bosque River Basin. Data generated by TAMU SSL for the study BMPs A combination of spatial criteria was used to define the potential location of each BMP. For each BMP a potential location data was generated (usually in raster format). A total of 16 potential BMP locations were generated. Slope Using the DEM provided by BREC, the slope was calculated in percent and a raster named slope was generated. Hydrologic Soils Groups Using the hydgrp field of the component table of SSURGO database a shapefile named SoilGroup.shp was generated. This shapefile represents a group of soils having similar runoff potential under similar storm and cover conditions. Soils are classified by the Natural Resource Conservation Service into four Hydrologic Soil Groups based on the soil's runoff potential. The four Hydrologic Soils Groups are A, B, C and D; where A's generally have the smallest runoff potential and Ds the greatest. Details of this classification can be found in ‘Urban Hydrology for Small Watersheds’ published by the Engineering Division of the NRCS, USDA, Technical Release–55.

46
Strahler Stream Order Using the NHDflow shapefile, the Strahler order was determined for each reach and a shapefile named Stralher.shp was generated. USLE Using the swat outputs for the existing scenario at the sub-watershed level, a shapefile named USLE.shp was generated. This shapefile presents the average annual soil loss in mass per unit area per year for each sub-basin. Water Quality Using the water quality data from TIAER publications (T. Adams, October 2005 and N. Easterling and A. McFarland, March 2004) and the spatial locations of the TCEQ stations, two shapefiles were generated: WaterQuality_utm14.shp and WaterQuality_sub.shp. WaterQuality_utm14.shp represents the water quality data at the TCEQ stations obtained from TIAER publications (TR0401 and TR0508). TP, PO4-P, Sediment, and E. coli concentrations are represented with the percentage exceeding screening level (defined by TCEQ) for grab and storm samples. WaterQuality_sub.shp represents the water quality data from TIAER publications (TR0401 and TR0508) generalized at the sub-watershed level. The TSS, TN, and TP concentrations are expressed in mg/L. PL566 drainage area Using the digital elevation model, a shapefile named PL566_nbed_40.shp was generated that present the drainage area of the 40 PL566 structures. Another shapefile named 2PL566watersheds_field.shp was created that represents the drainage area of the 2 PL566 structures visited during the field trip. High position / Low position Using the two_position_catchments.shp, two shapefiles were created Bosque_LowPosition.shp that contains only the low positions in the landscape and Bosque_HighPosition.shp that contains only the high positions in the landscape. SWAT outputs per sub-basin Using the swat outputs per sub-basin, a shapefile named swat_subbasin.shp was generated. The data are: loads per unit area. The data contained are: water yield in mm, precipitation in mm, ratio of water yield versus precipitation in percent, surface runoff in mm, sediment yield in t/ha, USLE in t/ha, sediment N in kg/ha, soluble N in kg/ha, TN in kg/ha, sediment P in kg/ha, SRP in kg/ha, and TP in kg/ha. Cumulative SWAT outputs Using the cumulative swat outputs through the watershed, a shapefile named swat_cumulative.shp was generated. The data are: loads and concentrations. The data contained are: sediment load in kg, TN load in kg, organic P load in kg, SRP load in kg, TP load in kg, flow

47
in m3, sediment concentration in kg/m3, TN concentration in kg/m3, organic P concentration in kg/m3, SRP concentration in kg/m3, TP concentration in kg/m3. Slopes Using the slope raster and reclassifying it, 3 rasters were generated: Slope_m5pct_30 that contains pixels of 30m with a slope more than 5%, Slope_m2pct_30 that contains pixels of 30m with a slope more than 2%, and Slope_l2pct_30 that contains pixels of 30m with a slope less than 2%. Active Dairies Using the dairy2005_dd data, a shapefile named Active_Dairies.shp was generated that represents only the location of active dairies. Bosque Counties Using the Cnty24_dd coverage, a shapefile named Counties_Bosque_utm14.shp was generated that comprises only the seven Counties containing the Bosque watershed:
- Bosque County - Coryell County - Erath County - Hamilton County - McLennan County - Comanche County - Somervell County

48
APPENDIX II
PL566 Analysis Drainage Area Spatial Data
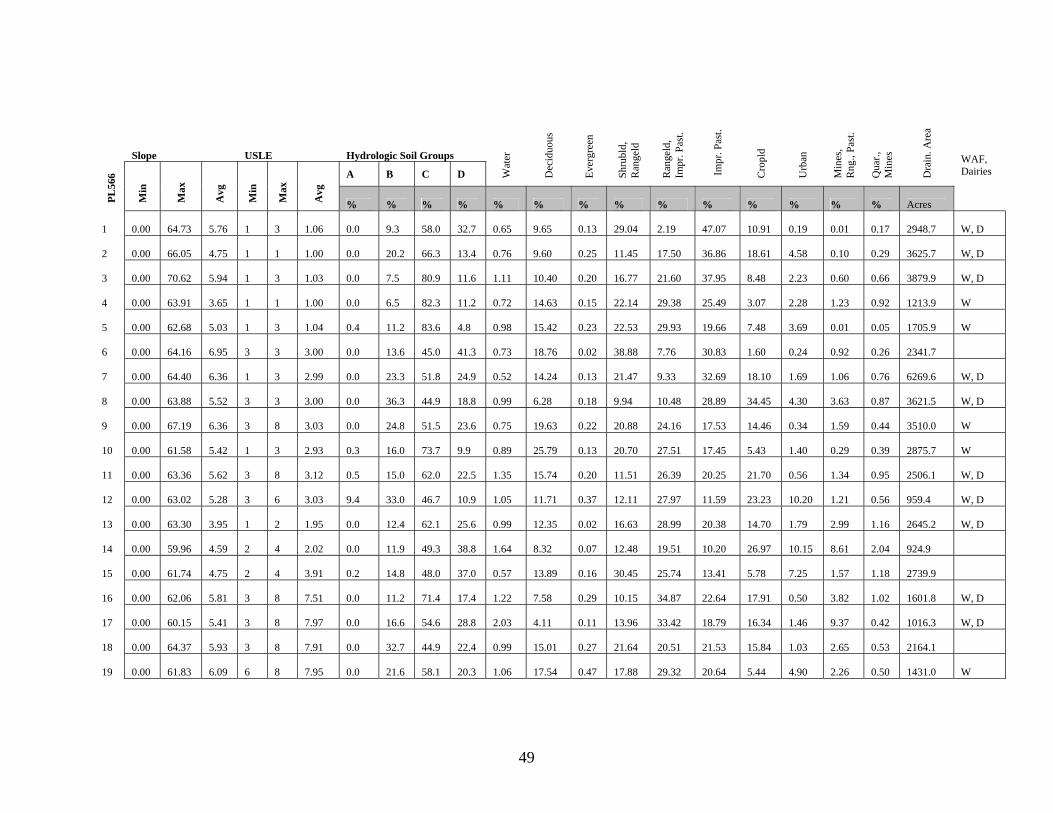
49
Slope USLE Hydrologic Soil Groups
A B C D Wat
er
Dec
iduo
us
Ever
gree
n
Shru
bld,
R
ange
ld
Ran
geld
, Im
pr. P
ast.
Impr
. Pas
t.
Cro
pld
Urb
an
Min
es,
Rng
., Pa
st.
Qua
r.,
Min
es
Dra
in. A
rea
PL56
6
Min
Max
Avg
Min
Max
Avg
% % % % % % % % % % % % % % Acres
WAF, Dairies
1 0.00 64.73 5.76 1 3 1.06 0.0 9.3 58.0 32.7 0.65 9.65 0.13 29.04 2.19 47.07 10.91 0.19 0.01 0.17 2948.7 W, D
2 0.00 66.05 4.75 1 1 1.00 0.0 20.2 66.3 13.4 0.76 9.60 0.25 11.45 17.50 36.86 18.61 4.58 0.10 0.29 3625.7 W, D
3 0.00 70.62 5.94 1 3 1.03 0.0 7.5 80.9 11.6 1.11 10.40 0.20 16.77 21.60 37.95 8.48 2.23 0.60 0.66 3879.9 W, D
4 0.00 63.91 3.65 1 1 1.00 0.0 6.5 82.3 11.2 0.72 14.63 0.15 22.14 29.38 25.49 3.07 2.28 1.23 0.92 1213.9 W
5 0.00 62.68 5.03 1 3 1.04 0.4 11.2 83.6 4.8 0.98 15.42 0.23 22.53 29.93 19.66 7.48 3.69 0.01 0.05 1705.9 W
6 0.00 64.16 6.95 3 3 3.00 0.0 13.6 45.0 41.3 0.73 18.76 0.02 38.88 7.76 30.83 1.60 0.24 0.92 0.26 2341.7
7 0.00 64.40 6.36 1 3 2.99 0.0 23.3 51.8 24.9 0.52 14.24 0.13 21.47 9.33 32.69 18.10 1.69 1.06 0.76 6269.6 W, D
8 0.00 63.88 5.52 3 3 3.00 0.0 36.3 44.9 18.8 0.99 6.28 0.18 9.94 10.48 28.89 34.45 4.30 3.63 0.87 3621.5 W, D
9 0.00 67.19 6.36 3 8 3.03 0.0 24.8 51.5 23.6 0.75 19.63 0.22 20.88 24.16 17.53 14.46 0.34 1.59 0.44 3510.0 W
10 0.00 61.58 5.42 1 3 2.93 0.3 16.0 73.7 9.9 0.89 25.79 0.13 20.70 27.51 17.45 5.43 1.40 0.29 0.39 2875.7 W
11 0.00 63.36 5.62 3 8 3.12 0.5 15.0 62.0 22.5 1.35 15.74 0.20 11.51 26.39 20.25 21.70 0.56 1.34 0.95 2506.1 W, D
12 0.00 63.02 5.28 3 6 3.03 9.4 33.0 46.7 10.9 1.05 11.71 0.37 12.11 27.97 11.59 23.23 10.20 1.21 0.56 959.4 W, D
13 0.00 63.30 3.95 1 2 1.95 0.0 12.4 62.1 25.6 0.99 12.35 0.02 16.63 28.99 20.38 14.70 1.79 2.99 1.16 2645.2 W, D
14 0.00 59.96 4.59 2 4 2.02 0.0 11.9 49.3 38.8 1.64 8.32 0.07 12.48 19.51 10.20 26.97 10.15 8.61 2.04 924.9
15 0.00 61.74 4.75 2 4 3.91 0.2 14.8 48.0 37.0 0.57 13.89 0.16 30.45 25.74 13.41 5.78 7.25 1.57 1.18 2739.9
16 0.00 62.06 5.81 3 8 7.51 0.0 11.2 71.4 17.4 1.22 7.58 0.29 10.15 34.87 22.64 17.91 0.50 3.82 1.02 1601.8 W, D
17 0.00 60.15 5.41 3 8 7.97 0.0 16.6 54.6 28.8 2.03 4.11 0.11 13.96 33.42 18.79 16.34 1.46 9.37 0.42 1016.3 W, D
18 0.00 64.37 5.93 3 8 7.91 0.0 32.7 44.9 22.4 0.99 15.01 0.27 21.64 20.51 21.53 15.84 1.03 2.65 0.53 2164.1
19 0.00 61.83 6.09 6 8 7.95 0.0 21.6 58.1 20.3 1.06 17.54 0.47 17.88 29.32 20.64 5.44 4.90 2.26 0.50 1431.0 W
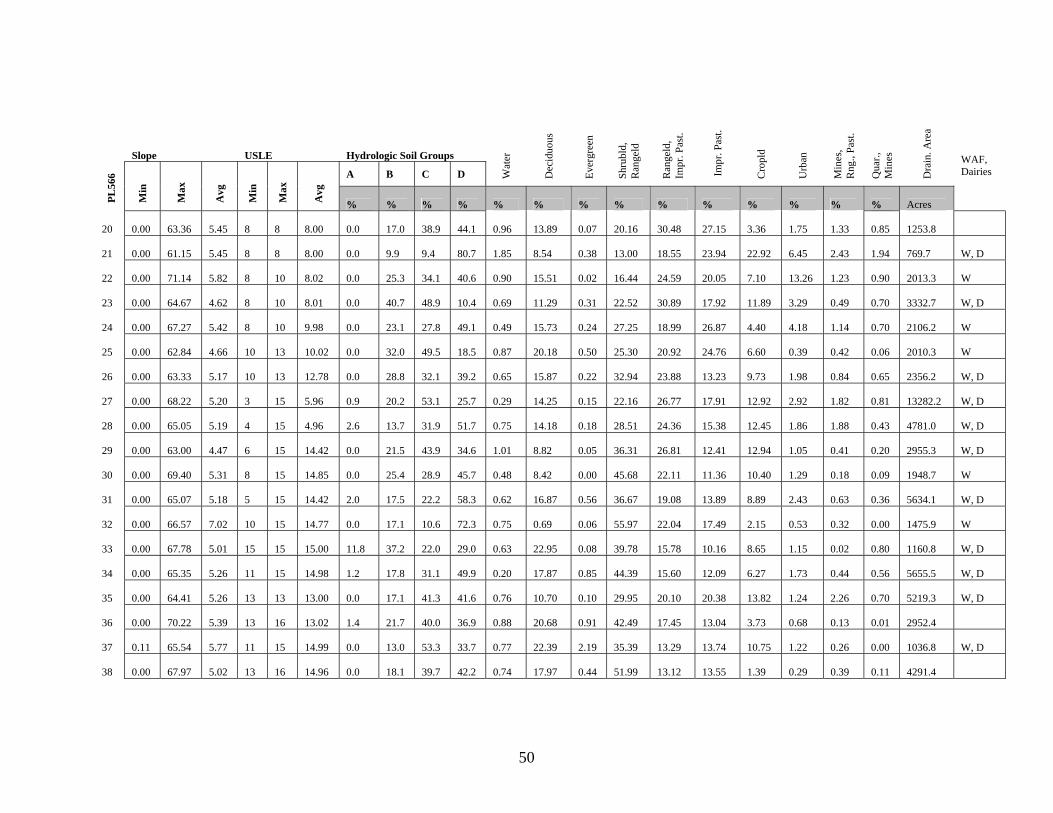
50
Slope USLE Hydrologic Soil Groups
A B C D Wat
er
Dec
iduo
us
Ever
gree
n
Shru
bld,
R
ange
ld
Ran
geld
, Im
pr. P
ast.
Impr
. Pas
t.
Cro
pld
Urb
an
Min
es,
Rng
., Pa
st.
Qua
r.,
Min
es
Dra
in. A
rea
PL56
6
Min
Max
Avg
Min
Max
Avg
% % % % % % % % % % % % % % Acres
WAF, Dairies
20 0.00 63.36 5.45 8 8 8.00 0.0 17.0 38.9 44.1 0.96 13.89 0.07 20.16 30.48 27.15 3.36 1.75 1.33 0.85 1253.8
21 0.00 61.15 5.45 8 8 8.00 0.0 9.9 9.4 80.7 1.85 8.54 0.38 13.00 18.55 23.94 22.92 6.45 2.43 1.94 769.7 W, D
22 0.00 71.14 5.82 8 10 8.02 0.0 25.3 34.1 40.6 0.90 15.51 0.02 16.44 24.59 20.05 7.10 13.26 1.23 0.90 2013.3 W
23 0.00 64.67 4.62 8 10 8.01 0.0 40.7 48.9 10.4 0.69 11.29 0.31 22.52 30.89 17.92 11.89 3.29 0.49 0.70 3332.7 W, D
24 0.00 67.27 5.42 8 10 9.98 0.0 23.1 27.8 49.1 0.49 15.73 0.24 27.25 18.99 26.87 4.40 4.18 1.14 0.70 2106.2 W
25 0.00 62.84 4.66 10 13 10.02 0.0 32.0 49.5 18.5 0.87 20.18 0.50 25.30 20.92 24.76 6.60 0.39 0.42 0.06 2010.3 W
26 0.00 63.33 5.17 10 13 12.78 0.0 28.8 32.1 39.2 0.65 15.87 0.22 32.94 23.88 13.23 9.73 1.98 0.84 0.65 2356.2 W, D
27 0.00 68.22 5.20 3 15 5.96 0.9 20.2 53.1 25.7 0.29 14.25 0.15 22.16 26.77 17.91 12.92 2.92 1.82 0.81 13282.2 W, D
28 0.00 65.05 5.19 4 15 4.96 2.6 13.7 31.9 51.7 0.75 14.18 0.18 28.51 24.36 15.38 12.45 1.86 1.88 0.43 4781.0 W, D
29 0.00 63.00 4.47 6 15 14.42 0.0 21.5 43.9 34.6 1.01 8.82 0.05 36.31 26.81 12.41 12.94 1.05 0.41 0.20 2955.3 W, D
30 0.00 69.40 5.31 8 15 14.85 0.0 25.4 28.9 45.7 0.48 8.42 0.00 45.68 22.11 11.36 10.40 1.29 0.18 0.09 1948.7 W
31 0.00 65.07 5.18 5 15 14.42 2.0 17.5 22.2 58.3 0.62 16.87 0.56 36.67 19.08 13.89 8.89 2.43 0.63 0.36 5634.1 W, D
32 0.00 66.57 7.02 10 15 14.77 0.0 17.1 10.6 72.3 0.75 0.69 0.06 55.97 22.04 17.49 2.15 0.53 0.32 0.00 1475.9 W
33 0.00 67.78 5.01 15 15 15.00 11.8 37.2 22.0 29.0 0.63 22.95 0.08 39.78 15.78 10.16 8.65 1.15 0.02 0.80 1160.8 W, D
34 0.00 65.35 5.26 11 15 14.98 1.2 17.8 31.1 49.9 0.20 17.87 0.85 44.39 15.60 12.09 6.27 1.73 0.44 0.56 5655.5 W, D
35 0.00 64.41 5.26 13 13 13.00 0.0 17.1 41.3 41.6 0.76 10.70 0.10 29.95 20.10 20.38 13.82 1.24 2.26 0.70 5219.3 W, D
36 0.00 70.22 5.39 13 16 13.02 1.4 21.7 40.0 36.9 0.88 20.68 0.91 42.49 17.45 13.04 3.73 0.68 0.13 0.01 2952.4
37 0.11 65.54 5.77 11 15 14.99 0.0 13.0 53.3 33.7 0.77 22.39 2.19 35.39 13.29 13.74 10.75 1.22 0.26 0.00 1036.8 W, D
38 0.00 67.97 5.02 13 16 14.96 0.0 18.1 39.7 42.2 0.74 17.97 0.44 51.99 13.12 13.55 1.39 0.29 0.39 0.11 4291.4
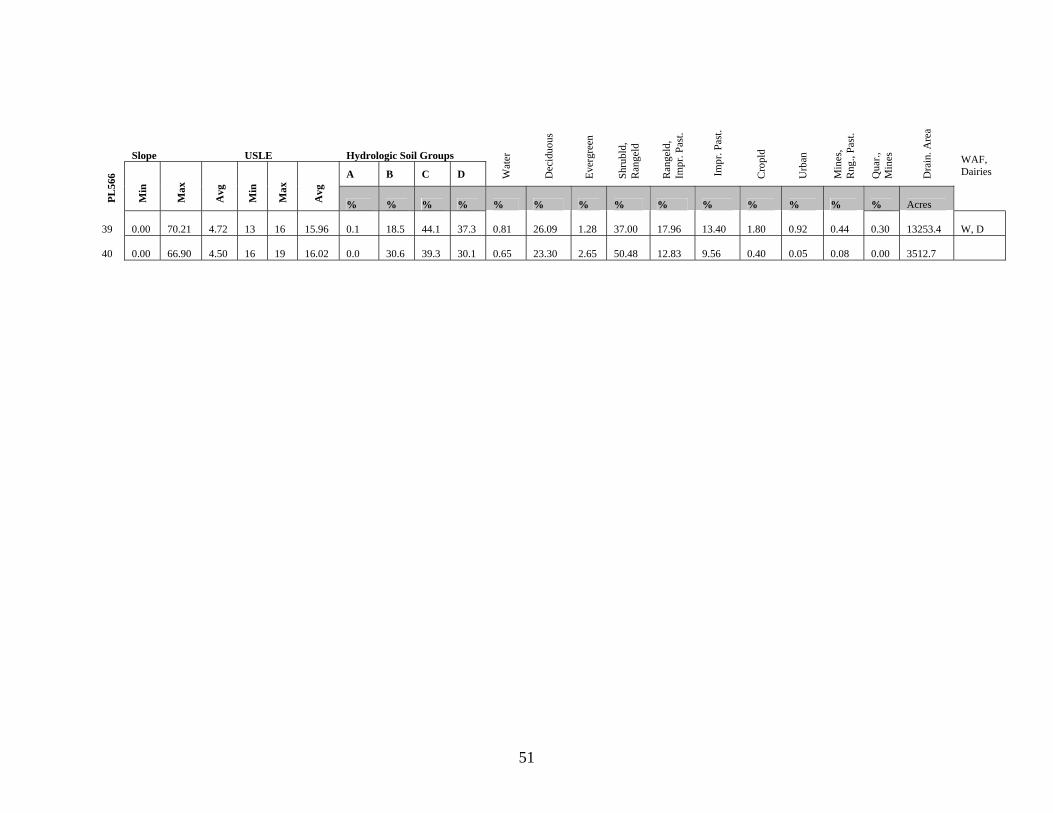
51
Slope USLE Hydrologic Soil Groups
A B C D Wat
er
Dec
iduo
us
Ever
gree
n
Shru
bld,
R
ange
ld
Ran
geld
, Im
pr. P
ast.
Impr
. Pas
t.
Cro
pld
Urb
an
Min
es,
Rng
., Pa
st.
Qua
r.,
Min
es
Dra
in. A
rea
PL56
6
Min
Max
Avg
Min
Max
Avg
% % % % % % % % % % % % % % Acres
WAF, Dairies
39 0.00 70.21 4.72 13 16 15.96 0.1 18.5 44.1 37.3 0.81 26.09 1.28 37.00 17.96 13.40 1.80 0.92 0.44 0.30 13253.4 W, D
40 0.00 66.90 4.50 16 19 16.02 0.0 30.6 39.3 30.1 0.65 23.30 2.65 50.48 12.83 9.56 0.40 0.05 0.08 0.00 3512.7

52
APPENDIX III
Meetings Overview

53
Meetings Overview
The purpose of these meetings was to gather a scientific advisory committee to provide
expertise and guidance regarding appropriate BMPs for environmental infrastructure improvement in the basin and their optimal location on the landscape and expected benefits.
This committee (see Appendix VII) was assembled containing scientists from: USDA, NRCS,
BRA, Waco Chamber of Commerce, City of Waco, BREC, Texas Cooperative Extension, University of Texas Marine Sciences Institute, TWRI, TIAER, Texas A&M University, Texas Farm Bureau, TSSWCB, BU, the Texas Water Development Board, and the USACE.
To determine where the improvements were needed, it was decided to use a GIS model based on spatially explicit data that illustrate divers land characteristics, waterbodies, and potential sources of contamination in the basin. Those data (see Appendix I) came from TIAER, BREC, TAMU SSL, the SSURGO Database, TNRIS website and Texas A&M University. This model was to be developed by the TAMU SSL and approved at every step by the scientific advisory committee
The committee was gathered every two months to follow up on the project’s development and provide expertise and guidance.
During the first meeting, the committee was invited to a field trip (Appendix IV) to meet local representatives and stay well-informed about what is occurring in the Bosque watershed. Then, the scientific advisory committee was encouraged to: 1. Recommend BMPs that could potentially be appropriate for improvement to the
environmental infrastructure of the Bosque River watershed 2. Determine what experts were missing to complete this committee For the second meeting, additional experts were invited to join the committee; they were principally scientists with soil expertise. Then, the scientific advisory committee was encouraged to: 1. Review the list of BMPs that would be most appropriate to improve the environmental
infrastructure of the Bosque watershed. This list was finalize to 22 BMPs that are subdivided in five types: “In-Stream or Gullies,” “City,” “On-Farm,” “Between Field and Creek” and “Universal”
2. Determine a priority index with values from 1 to 10 (1 being the lowest priority and 10 being the highest priority), for each BMP; this priority index indicating which BMPs should be implemented first.
3. Identify which parameters would be appropriate to determine the most impacted sub-watersheds in the Bosque River basin, and therefore the areas of main focus when localizing BMPs?
During the third and last meeting, the committee was invited to:

54
1. Review the impact index that was developed using concentration and load data. 2. Review the overall methodology developed to improve the environmental infrastructure on
the Bosque River Basin; this methodology determining what kind of improvements/BMPs should be considered and where should they take place.

55
APPENDIX IV
Meeting 1
- Meeting Agenda - Meeting Attendance
- Meeting Minutes - Meeting Pictures

56
AGENDA
Bosque River Environmental Infrastructure Planning Project Scientific Advisory Group Meeting #1
February 21-22, 2006 Brazos River Authority
Waco, Texas
February 21, 2006
Field Trip through the Watershed Field Trip Stops: - Meridian Community Center - Property of Larry Lawson – Bosque River Frontage – Bosque County - Meridian Golf Course – Bosque River Frontage – Bosque County - PL566 Structure – Headwaters Bosque River Watershed – Erath County
February 22, 2006 Discussions at BRA
8:45 a.m. – 9:45 a.m. Listing of BMPs * Off – Channel * On – Channel * On-Farm 10:00 a.m. – 10:45 a.m. Continued Development of BMP List & Landscape Parameters 11:00 a.m. – 12:00 p.m. Conclusion of discussions and Setting of Next Meeting

57
Meeting #1 Attendance: Allan Jones Bill Fox Scott Keating Ned Meister Michelle Thrift Becky Griffith John Ellis Jeff Walker Thad Scott Shane Prochnow Tom Conry Larry Hauck Paul Dyke Armen Kemanian Tom Gerik Daniel Nichols Stoney Burke Raghavan Srinivasan Julie Villeneuve

58
Bosque Meeting #1 Minutes February 21-22, 2006
Tuesday February 21, 2006 – Trip on the Bosque Watershed Stops:
- Meridian Community Center - Property of Larry Lawson – Bosque River Frontage – Bosque Co. - Meridian Golf Course – Bosque River Frontage – Bosque Co. - PL566 Structure – Headwaters Bosque River Watershed – Erath Co.
I. Meridian Community Center Meeting with the local representative and a landowner:
- County Agent: David Winkler - County Judge: Cole Word - County Commissioner from Precinct #2: Durwood Koonsman - Land Owner: Larry Lawson - Mayor:
Allan Jones: What would the city like to see take place to help with Bosque River issues? Local representatives: Work to get treated water to the golf course. A.J.: Would you like to put in wetlands? L.Rep: How much area do you need for wetlands? A.J.: It depends of the goal. What are your goals? L.Rep: Cleaning up the Bosque River. Becky Griffith: USACE wants to help suggest potential BMPs that could be voluntarily implemented within the watershed by communities, land-owners or other entities A.J.: It has to be something that you want more than what you already have in place. The USACE program is about improving environmental infrastructure associated with the river. This type of a program is a first for USACE. The current phase of the project is to get the initial pieces of a planning project together. L.Rep: Let’s do it. II. Visit of Larry Lawson’s property A.J.: What would you like on your property? L.L.: More wildlife and a better looking river. III. Visit of Golf Main idea: Set up a system that can further treat water from the city as it works its way through water features associated with the local golf course and prior to re-entering the Bosque River proper. Site at the bottom of the golf course: deep gully with natural limestone bottom. Might have some opportunities for local nature center or other uses. The local folks considered this area, lost land, however with some new ideas, might be able to convert to beneficial lands.

59
IV. Visit of the PL566 BRA: The area of this PL566 is about 40 acres. There used to be two dairies upstream. Nowadays only one of them is active. It is filled in at about 40%. Tuesday February 22, 2006 – Initial discussion on potential BMP’s for Bosque River Watershed – Brazos River Authority I. BMPs – Efficiency vs. Cost Benefits
• On-Farm BMP’s are less expensive and usually require lower maintenance costs: Examples provided by participants include
o Shallow depressions in upland systems – on-farm practice o Damming ephemeral gullies – on-farm practice o Installing grazing management practices with landowners – on-farm practice o Installation of vegetation buffer systems on farms o Development of water diversion systems at the lower slope of WAFs to provide
for more residence time of water on the land o Terracing in hay fields and WAFs o Development of constructed wetlands above PL566 structures o Implement range revegetation practices o Contour ripping/pasture renovation to maintain permeability of soils and increase
residence time of water on soils o Development of “polishing strips” downstream from WAFs or dairies to provide
secondary water treatment from runoff o Installation of rock/reed filter strips with controlled inlet and outlets o Bauxsol (sp.) – P “lockdown”…could be used in row crops or waste management
fields o Installation of hay meadows that provide secondary outputs that could be removed
from the watershed (selling hay outside Bosque watershed) o Ag Lime applications to WAFs o Break up of plowpan
• Off-Channel BMP’s o PRBs along downstream gully systems can vary the residence time of water on
landscape o New PL566 structures (if part of the approved plan and funding and landrights can
be obtained) o Application of a waste injection program to directly inject fertilizer/manure/etc.
into soils (must consider whether to purchase or contract such a system) o Implement watershed riparian restoration program including streambank
stabilization, constructed wetlands (small/med./large...must consider if they will become a source of nutrients in the future)
o Development of recharge structures o Vegetation management for species beneficial to water detention on land o Permeable check-dams installed in upper reaches of the watershed with ponds at
the lower extent to reduce the concentrated flow paths o Implementation of oxbow wetlands o Communities install nature centers with water management BMP’s associated

60
o Development of a bio-fuel resource in the watershed o Implementation of sub-watershed soil conservation and erosion control plans o Construction site runoff management for pre/post construction activities
Individual Subdivision Community
o Treatment of runoff o Development of nutrient management plans
Residential Community Agriculture
o Develop plans for recreation areas including water planning for surrounding residential areas (lower stretch of watershed)
o Development of sediment and bacterial reduction programs for Middle and South Bosque sub-watersheds
II. Other contacts/expertise needed? Geologist Sam Feagley Steve Bednarz Ducks Unlimited Texas Parks & Wildlife Department Stream Morphologist TCEQ & EPA must be aware North Texas Stream Team (EPA) – Bobby Hernandez John Cowan (Texas Dairy Association) Don Wilhelm (US Fish & Wildlife Service) III. Next Meeting – April 27th from 8:30-3:00 pm (Brazos River Authority)

61
Bosque Meeting #1 Photos February 21-22, 2006
Meridian Civic Center

62
Property of Larry Lawson

63
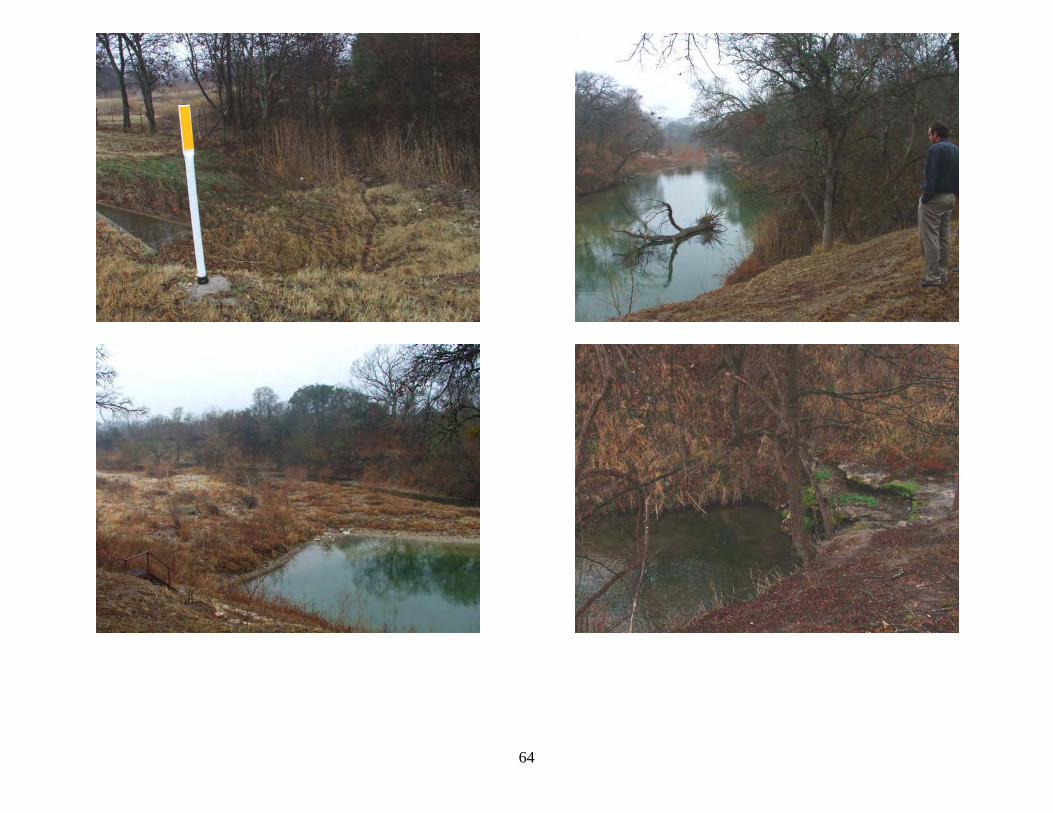
64
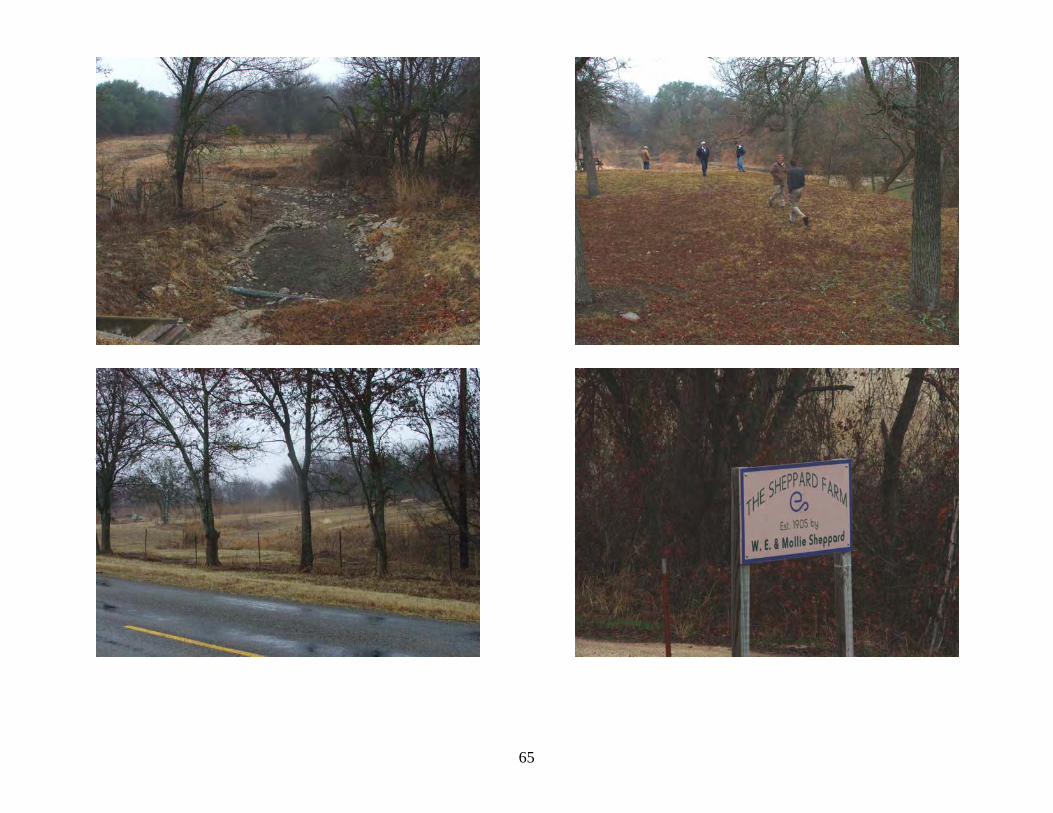
65
Meridian Golf Course

66

67
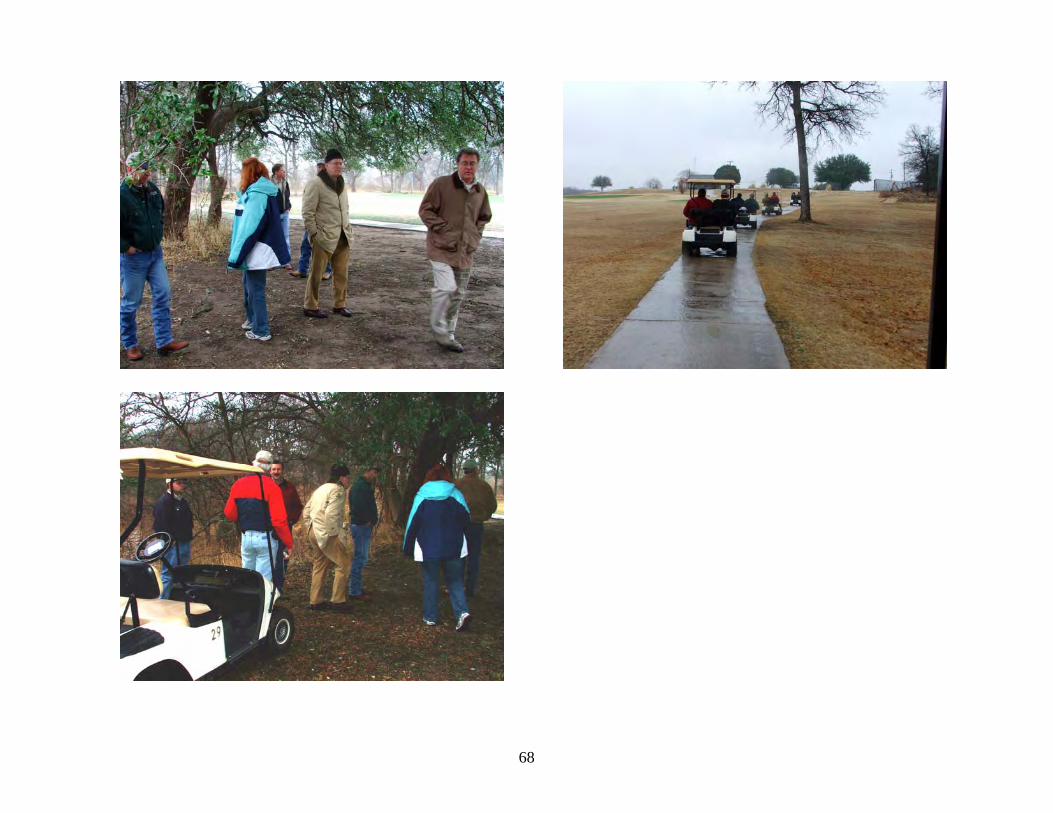
68

69
PL – 566

70
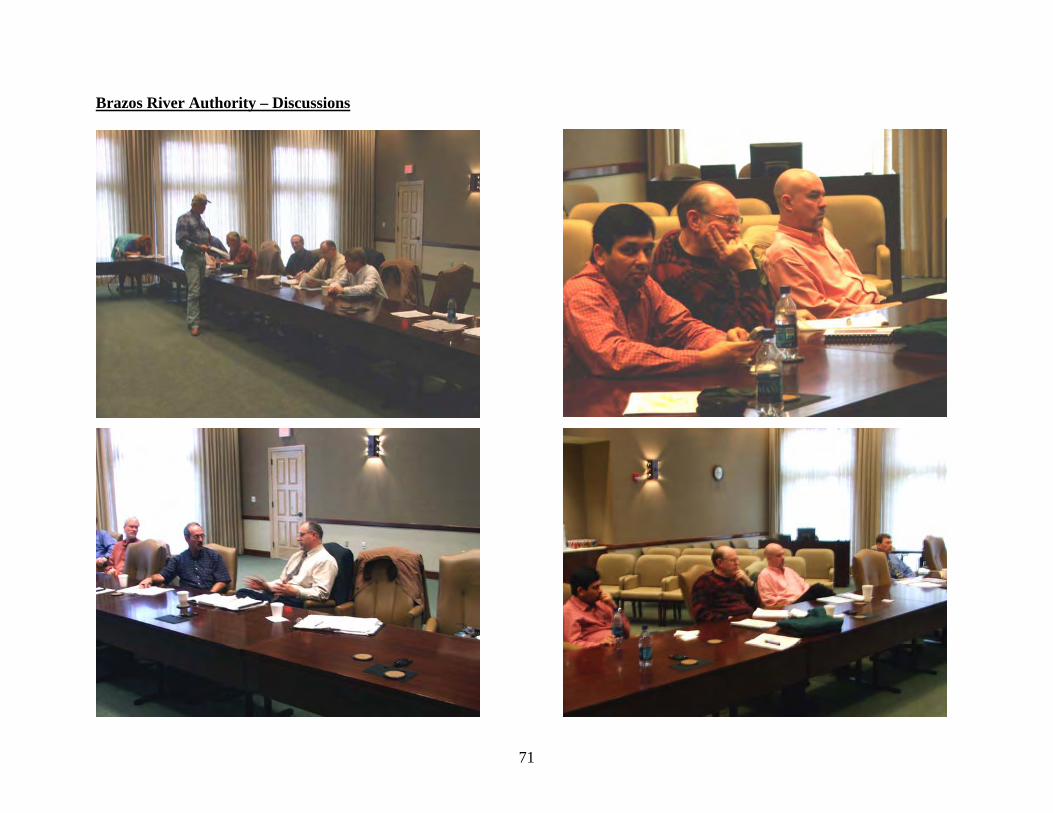
71
Brazos River Authority – Discussions

72
APPENDIX V
Meeting 2
- Meeting Agenda - Meeting Attendance
- Meeting Minutes - Feed Back
-Maps

73
AGENDA
Bosque River Environmental Infrastructure Planning Project Scientific Advisory Group Meeting #2
April 27, 2006 Brazos River Authority
Waco, Texas
9:00 a.m. – 9:30 a.m. Introduction
9:30 a.m. – 10:15 a.m. Overview of Project Allan Jones
10:15 a.m. – 10:30 a.m. Break
10:30 a.m. – 12:00 p.m. Overview of GIS System Development R. Srinivasan, J. Villeneuve
12:00 p.m. – 1:00 p.m. Lunch (provided)
1:00 p.m. – 2:00 p.m. Overview of Planning Outputs R. Srinivasan, J. Villeneuve
2:00 p.m. – 2:15 p.m. Advisory Group Input on Parameter Weighting Facilitated
2:15 p.m. – 2:45 p.m. Discussions/Planning Meeting #3
3:00 p.m. Adjourn Meeting

74
Meeting #2 Attendance: Susan Baggett Linda Beasley Jay Bragg Tom Conry Tim Dybala John Ellis Sam Feagley Maggie Forbes Becky Griffith Larry Hauck Bill Harris Allan Jones John Mueller Clyde Munster Lee Munz Daniel Nichols Shane Prochnow Thad Scott Raghavan Srinivasan Danielle Supercinski Michelle Thrift Don Vietor Julie Villeneuve

75
Bosque Meeting #2 Minutes April 27, 2006
I. Introduction II. Overview of Project – Allan Jones, TWRI • Working with USACE Fort Worth District, and close collaboration with NRCS
and others to try to prepare for what we hope will be some major funding on the Bosque for restoration of the ecosystem and management of the Bosque ecosystem
• Including, but going beyond, the normal water quality concerns we’ve been working on for a number of years.
• Small project over the course of a year to be finished at end of summer. • Help analyze a set of possible management practices that could be implemented
over a number of years to improve water quality and wildlife habitat and other issues related to the river and its environment.
• We’ve toured most of the length of the Bosque, looking at the situation, the river and some of the small tributaries, looking at a 566 structure, talking to the people in Meridian, getting a feel for the watershed.
• We met here next day and talked about the potential management practices to be put in should the USACE receive funding.
• Management practices, construction to complement other funding sources – 319, EQIP, etc. – to bring us all together to implement practices on the Bosque.
• A lot of suggestions for possible practices. • TAMU SSL, working with a number of others who provided data, has tried to
synthesize that into a first draft of BMPs and situations where those BMPs would be appropriate.
• Now we will go through this binder and look at where we are in the progress of this first draft. This afternoon is for discussion and feedback. Mostly technical input.
• We want your professional feedback and expertise. Make notes of your reaction and your advice because that will then be incorporated into this first draft.
• We’ll re-do it and come up with a second draft and have a third meeting to review that draft and put together a final draft before the final report is due to the corps.
Griffith (USACE)
• This effort is a pre-planning analysis for a program that doesn’t exist to improve environmental infrastructure in watershed – priorities, guidelines and framework.
• General planning parameters so if the program is authorized and funded we can move out smartly and not spend a lot of time flailing around waiting to figure out what to do.
• Most important areas geographically, most import methods from process standpoint, a framework we could use to implement a program if it’s funded.
• This is a different approach for the USACE.
76
• USACE strategic plan focuses on systems analysis and systems solutions for water resources problems to be thinking on a watershed scale and get away from big projects to solve problems.
• As we think about water resources problems and watersheds, it really has to change the USACE paradigm – evolution of the organization – solving water resource problems in a different way than in the past.
• We go in, find problems, find solution, build solution and then leave. This watershed systems is an integrated approach.
• We’re hoping to become something a little different and collaborate more with federal agencies and other agencies, offer scale of analysis and implementation lead to broad solutions.
• Deployed in small pieces in a way considerate of private property rights, look at working in watershed that’s very different to what we’re used to. Have to learn to be something different if we’re to be effective with this new strategic plan.
• We appreciate having Daniel Nichols here from Rep Edwards’ office. The other side of this is working with Congressman Carter and Senator Hutchinson to make them aware of this on-going project and to eventually (after final authorization) get the funding for some major effort.
• Hauck: If we call them BMPs, I have a sense we’re working on ecosystem restoration. We’re not talking about BMPs for this project of just nutrient management.
• It’s pretty broad. We’re operating under traditional authorities focusing on economic restoration. This program pulls us out of these constraints to improving environmental infrastructure.
• We’re not trying to duplicate anything NRCS would do thru EQIP or something done thru TSSWCB or TCEQ thru 319. We want to compliment those with other kinds of practices and structures that are beyond the scope of those programs.
• Munster: Is the USACE restricted to implementing these on public lands? • Under the program we believe it would be authorized, no. • The USACE would work very closely with other agencies on the implementation
– state and federal. could contract with other agencies to actually get the work done and implemented.
• This is modeled by a program in NY with similar problems (on the Hudson). A lot of the normal things that preclude the USACE from doing things that would be helpful are removed via this special authority. Don’t worry about what you know about how the USACE already does business. If there was a problem – what’s the most important? Where and why?
III. Overview of GIS System Development – Srinivasan, Villeneuve (TAMU SSL) Villeneuve
• How we arrived at map, location of BMPs, scenarios, etc. • Did we do the right thing? Did we miss something? Do we need to add more
variables? Etc. • We will gather inputs and will refine it – field verification.

77
• Will agree on a third meeting to present to you once more in June, then we’ll use these three information sessions to come up with a final outcome of the project.
• After the last meeting we went back with a list of BMPs and the idea was to see where we could apply those BMPs. We implemented a GIS model that has been implemented using all the data we gathered from all of you. This GIS model helped us to locate some potential BMPs.
• This is the first draft. We are here to get your feedback, and we’re going to improve it.
• List of potential BMPs (pages 4-6 from last meeting) • Special criteria – soil type, LULC, slope, landscape position and erosion
considered using t factor. It’s what we choose to use. If you want some more we can add some. If you feel some aren’t efficient enough, tell us we need to improve it.
• For each BMP, we determined: - Soil type (if there is one particular type for this BMP) - Land cover (grass or cropland) - Slope - Landscape position - Erosion, using the t factor
• Spatial Explicit Criteria – GIS layers: - Soil type: Main city, North Bosque, South Bosque and Main Road.
• Soil layer: If it was sand then we consider it as sand. If it’s a clay loam then we classified it as clay. If it’s a sandy loam it’s sand. Sandy clay – is it clay or sand? More sandy than clayey? Or vice versa? Let us know if you prefer another classification.
• General level of detail (pages 8-12). You’re seeing the basin, but there’s much more detail.
• All of these maps can zoom in to a fine level of detail and can determine if you have certain land and soil characteristics. All the layers are at 24,000 scale.
• Slope - three kinds: More than 5%, between 2 and 5%, and less than 2% • Landscape position (BREC): High position and low position. Low position is in
the flood plain. Very low scale is the position of landscape next to the stream. High position is everything that is not. High position not proximate to stream. Landscape position is relative to water.
• Soil loss tolerance – t factor: The maximum amount of erosion at which the quality of a soil as a medium for plant growth can be maintained. Only consider maximum factor equal to 5. - Had breaks with various soils where you look at certain levels of erosion where you can still maintain crops. - Some areas can allow that much erosion and still be production. Soil can restore itself and remain productive.
• Five or greater is more resilient soil. T factor 1 can use one ton per acre can maintain.
• What metric could you use to distinguish areas away from the streams that have high potential to lose soil to the streams, to erode and fill the streams with

78
sediment? Looking for a metric in the uplands, Describing uplands susceptible to erosion.
• Potential BMP Sites – which BMP meets which criteria? • 1.) On Farm: Applying Bauxsol to high P fields; location of the waste application;
27,573 acres of land available to use. - Bauxsol – aluminum oxide, the conglomerate that they mine for materials, leftover materials usually called red mud – will talk about that because it could cause a big problem – the materials have a lot of sodium and loaded with iron.
• 2.) Applying Ag Lime to high P fields to reduce P solubility – 27,573 acres available to use
• 3.) Implementing sub-watershed soil conservation and erosion control plans – 107,930 acres
• Comment: What are you using to consider the erosion? Are you using land t factor? Yes. We will be replacing t with something else later. Number of acres will change.
• 4.) Improving PL566 structures to increase sediment retention – clean them up and get rid of sediment that accumulated in it. PL566 structure is a retention pond, sediment retardation pond NRCS built in 50s-60s. - In last meeting a lot of discussion about building a new one. Asked for management plan – all PL566 structures have been built. Now to improve structures – dredging. - Improve water quality, structures, design 1,055 acres impounded by it. - 1,300 acres, 40 in this watershed.
- Sediment retention main purpose • 5.) There are a lot of other issues dealing with maintenance of PL566 structures –
trees, dams, look at structurally in terms of rusted out, corrugated drains, other than just sediment.
• Srini: When all is said and done, focusing on PL566 may get the best benefit • One problem to look at if doing sediment removal or dredging – look at potential
contaminants. • Think about new structures and places, improve existing ones. Building in a series
instead of PL566 may be an alternative. • 1,300 acres controlled by these – calculation based on elevation map, how much
area is land drainage. • Q: With sub watersheds, does NRCS look at sub-watershed, or just watershed? A:
In original plan each of the structures has to cost out by themselves. Sub-watershed first, then overall watershed. - Different criteria, if we exceed 250,000 acres it rolls over into a USACE project.
• Q: PL566 structures seem to be a real potential. Looked in terms of redesigning or modifying PL566 systems to have pump or drain to have wetland treatment to get rid of toxins, etc. in the system? A: That’s in the next level.
• One reason water quality of ponds is in great danger – dairies. Must have some treatment down stream. Larger drainage areas than typical.
• Create special program that has a lot more flexibility. Starts with consensus on if we could do what needs to be done, what would that be?
79
• BRA has monitoring sites on Duffau creek – west side • When NRCS is planning these watershed sites, they look at whole watershed. One
criterion for putting in these sites is it has to have a beneficial cost-benefit ratio. May be a large portion of rangeland. Hard to get a good cost-benefit ratio when just measuring rangeland.
• Special flexibility of a special program – in NY example – not a principle and guidelines based requirement. Strictly about source protection and modeling. In a special context, water quality or environmental improvement is substituted for cost-benefit analysis which is what got the USACE hung up in being successful in Bosque watershed. Didn’t match up right because of constraints. Let’s have a special program to allow us to remove these constraints.
• Water quality station – layer of TCEQ aquatic stations on the Bosque. TCEQ does stormwater monitoring on both creeks
• 6.) Applying a waste injection program to directly inject fertilizer/manure/etc., into the soil – not surface application, but chiseling it in. Look at subsoil texture. - It’s going to work bettering some soils than others.
• 7.) Installing crops that could be removed from watershed (hay or bio fuel) – consider only 159,195 acres of cropland
• Munster: BMP we’ve been working on is to utilize turfgrass sod production. - Sod is harvested and taken out of rural watershed to urban watershed. Can move large amounts of water out of the watershed in an economically sustainable matter, can remediate soils with high phosphorous levels. - Harvest sod year after year. Three sod harvests a year, plus phosphorous that is in the soil. Economically sustainable BMP. Large amount of land suitable for this turfgrass sod production – most in cropland like you have here.
• Will find soil or slope characteristics appropriate for turfgrass and make another map.
• What does it take to implement this BMP? What would it take from public sector standpoint? - As sod producers go looking for land it will take collaboration between those who have land to be in the market as sod producers look for land to say sod is available. - Producers tend to be the catalyst – I’ve got manure, I need to get rid of it and he started calling sod producers after last meeting.
• Public sector facilitating exchange. Market for sod. Sod production acreage doubled in last decade in Texas.
• Public policy improvements – from public sector requirement this is pretty cheap. At some point that’s one of the things we might want to look at.
• Municipal water demands – moving rural sod to urban. In the future with low water demands, how can we keep this a good market and keep the sod to keep the production? - Once transplanted, when it’s grown with manure, it’s a slow release of P and in urban areas it doesn’t require anymore P to be added for 10-20 years, which could improve water quality in urban sectors. - Sod that’s produced with manure has better water holding capacity than sod grown on clay.

80
• Q: Does it make any difference if you grow buffalograss or bermudagrass? Do we have supplemental irrigation? A: Buffalograss doesn’t re-grow as rapidly, so you don’t get as many sod crops. The benefit of buffalograss is it’s a low maintenance grass that will survive under water stress conditions once transplanted without irrigation. - One of negatives is buffalograss is that it doesn’t give two-three sod crops in one year; you’re doing good to get one crop. - The turfgrass industry is studying this right now. - It is an economically feasible solution that doesn’t solve whole problem, but does help.
• Munster: Turfgrass specialists tell us there’s no more soil loss in the harvesting of sod than there is in a typical row crop and erosion from that. Many disagree. You may remove soil from one place and transplant to another, but it doesn’t end up in stream.
• Q: If we’re adding irrigation to the flood plain and to the watershed, even though turfgrass cuts down on erosion, won’t it increase the amount of runoff? A: No, because we only add water as needed to supply the need of the crop. Use wastewater on some, but supplemental irrigation is needed to ensure that we don’t lose the sod crop. Once harvested, it re-grows very quickly. Leave bare soil for limited period. Harvested in strips. - We are going to see more sod farms on those watersheds. Like to see sod produced by manure because it’s expensive to move composted manure. - Someone to buy sod is more willing to pay the cost to haul sod. Case of Bosque, on some of those good lands, there’s a chance we can remediate P, crop of value.
• 8.) Installing grazing management practices – grassland erosion, will have to define better, 137,265 acres
• 9.) Contour ripping/pasture renovation to maintain permeability of soils and increase residence time of water on soils – any clay; 71,190 acres
• 10.) Terracing to reduce sediment transport – Add soil depth? First shot at looking at raw information. Talking about terraces that will retain water on-site to slow down the process of moving water.
• 11.) Developing nutrient management plans – cropland, grassland, WAFs • Between Field and Creek:
12.) Developing recharge structures to reduce runoff and sediment yield – permeable surface; used arbitrary, permeable surface; stormwater holding area, but not a large structure. - If you’re going to have subsurface runoff, need geological information. Interested in which kind of subsurface soil we need.
• 13.) Installing vegetation buffers – “polishing strips” –all streams with drainage area less than 100,000 acres was a tributary. Everything with tributary more than 100,000 was a mainstream.
• Q: Are you specifying what kind of vegetation buffers? Woodland, grass, all of the above? A: Cropland and grassland is number one. Anything touching the fields is of more priority than other fields, or anything close to a waste application or cultivation field – trees or grass.

81
• Q: Is there a particular reason for 200 ft? A: Regulatory 100 ft plus at least 60 ft. 200 ft probably over kill.
• Within tributaries, some streams won’t carry/hold water very often, making it more difficult to maintain vegetation – depends on year you’re talking about. Process to make up what are the potentials, then give priorities.
• In Stream or Gully: 14.) Installing “boiling stones” runoff barriers/check dams along downstream gully – based on stream ordering, stream order gets larger with river size.
• Q: What is “boiling stone”? A: Limestone rock within a wire mesh. Similar to long roll that would be placed against a long gully. Hoping to get some interaction. A little “check dam” in effect with some P absorbing material to absorb P as it passes thru. - Maybe we shouldn’t use that since it’s a company trademark.
• 15.) Implementing watershed riparian restoration program – stream-bank stabilization - perennial water source
• 16.) Implementing watershed riparian restoration program – constructed wetlands • 17.) Installing permeable check-dams in upper reaches of watershed – no
weighting(?) factors associated, what’s possible at the time. - Permeable check-dam compared to PL566 structure. - Per check-dam small 5 to 6 foot high dam that won’t let big flood of water into system; slow water and make permeable, take 10 days to lose the water. - Better opportunity to use P absorbing material, combine with previous BMP to get extra mileage out of it.
• This, check-dam and created wetland – seems like the miles of stream are not the best resource. Don’t know where gully is starting – GIS.
• This would be inappropriate on a lot of the tributaries you have designated. • 18.) Implementing oxbow wetlands • 19.) Developing constructed wetlands below PL566 structures – everything
upstream from PL566, might want to reduce. Do we want up to 2 or 5 miles downstream? How downstream should they be? Could be off the stream?
• Q: Number of existing acres in watershed? A: Talking about a lot about wetlands, but don’t know of any locations where any exist. There’s a reason why there’s not any existing – not much water and it’s an arid environment.
• Constructed wetlands that aren’t typical water source, use intermittent • Constructed wetlands associated with wastewater treatment plants – Meridian and
Clifton – interested in having a polishing wetlands associated with wastewater returns
• Possibility of taking water from Meridian plant and moving thru a pipeline where it could cross some gullies and into small drainage into the river to release it and put it in constructed wetland around these drainages to get retention of that water and interaction of vegetation. - One went thru a golf course and they were interested in it for irrigating golf courses with treated wastewater effluent.

82
• Q: Wetlands – do we need to include how high the bank is? A: Probably true. In some areas couldn’t get water to bottom lands surrounding the river.
• City – developing construction site runoff management for pre/post construction activities; treating storm runoff by temporary storm storage in retention ponds: 20.) Damming ephemeral gullies or installing porous “gully plugs”
• Current Overload Pollution Loads – SWAT Model from BREC – 2000 • Those are BMPs selected from discussions at last meeting. This is just a draft.
Define what would be best to use for soil type. IV. Overview of Planning Outputs – Srinivasan, Villeneuve (TAMU SSL)
• What are the sources of pollution? What are we finding? What are other contributions? SWAT Studies by BREC in 2000 used for data analysis
• 1.) Water yield – how much of the water is coming from the landscape; 47 sub-areas
• 2.) How much precipitation is needed throughout the basin over 39 year period • 3.) What percent of water yield based on precipitation in basin – water yield
coming from fields • This info is going to mainly be used to invest money in separate places – How can
we get the most benefit from what? • 4.) Surface runoff – get immediately after rainfall within the same day/hour – it’s
been simulated for 39 years; using actual, daily rainfall to see how much it goes up
• SWAT approximates those things • 5.) How much sediment yield by sub-basin – how much will reach the stream? • 6.) USLE – How much of the land is getting eroded from fields, and how much of
that is going to reach the stream? • From USLE the range goes up to eight; from simulated sediment yield goes up to
25 tons/acre actually going to the stream • 7.) Sediment N – How much N is leaving the fields/landscape? • 8.) Separate out into soluble N • 9.) TN – combination of what you saw – where would you get the most benefit? • 10.) Sediment P – all watersheds are not the same size
- Based on erosion rates based on USLE; needs to be relationship between potential source and simulated sediment P – primary problem of P is close to the source.
• 11.) SRP – See more SRP come off field; doesn’t leave a lot of organic P. Can hardly find organic P in the top two inches 0-2, 2-6, 0-6. What is dropped mineralizes fairly rapidly.
• 12.) TP sum (both Ps) – Use to select for location of BMPs. • Q: How have dairy operations, the climate, etc. differed from 50 years ago, and
what can we expect in the next 20 years? A: Climate doesn’t matter much. Animal operation is different story. It’s already gone down somewhat in past years. Use historical rainfall to go thru wet and dry

83
periods. Modeling was state of the art at that time, and we’ve come along way in the last 6 to 7 years.
• Current in Stream Water Quality Data – TIAER: - 5 years of sampling data, one point in the river
• 1.) Water Quality monitoring stations, TCEQ information number • If we want SWAT and Water Quality – see which watershed would be a priority
to work on. Generalize data and consider everything upstream from this station. - First was sediment – storm and grab samples.
• Sample sites different depending on number of samples – all samples are not the same –number of samples need to be entered into the equation.
• Grab samples – different levels of classification, and then consider all the samples for this station and the percentage of samples exceeding screening level - There are unknowns because we don’t have enough sampling in that particular locations. - During a storm, only a small number of people go out to get samples. Lack of samples. - Grab samples once every two weeks – trend analysis
• Help decide which watershed it would be important for us to focus on • Q: What about loading rates and values?
A: These aren’t loadings, these are concentrations. Would have to factor in flow to get load.
• We are going to be using land and in-stream as two variables – what BMPs can we do on land, off land, in water, etc?
• In June we’ll collect all criteria for BMP and decide priorities. Where would it make the most sense to put the BMPs and in what order?
• Any information we should be considering here that we’re not? Is the information we have so far adequate for what we want to do?
• Would like to see the different erosion data rather than BMP. There may be other things to see.
V. Advisory Group Input on Parameter Weighting – Facilitated, Page 57
• Various ways to prioritize schemes – how well the practice might work, how is this important?
• Water quality, efficiency and priority: Each practice might have a different priority to you. How would you rate these? Rate them from your opinions. What are we working towards?
• Look at how this practice affects the load or the concentration. • Look at each practice to see how beneficial it is. • Upper third seems to be the “hot spot” and is shown from modeling • What BMP works for what conditions? • First determine weather we want to look at loading or concentration, then
overland flow and base-flow. • Prochnow: Loads, overland flow and runoff • Reason for concentration is regulatory guidelines are often geared toward
concentration – monitoring and evaluating. If we’re evaluating the BMP, flow is

84
important – TMDL, etc. - For short-term, concentration becomes the quick and dirty way to assess the BMP.
• Have E. coli to consider as well as P and sediment and that tends to be more of a concentration issue because of the decay that occurs as you move further downstream. - If we can reduce E. coli concentrations, that could be helpful.
• We’re developing the capability to monitor and identify specific pathogens as well.
• Pathogen – least information. Current modeling efforts, but few and far in between.
• Strong correlation between stream flow and storm flow events and fecal concentrations in rivers and streams. - Concentration is never really an issue when talking about moving it downstream - Loading is going to impact the lake greatly, the river itself probably responds to base-flow concentration, unless we’re going to get into a lot of specifics. - We need to look at both if that suggestions different things, and then show them separately.
• Some of the BMPs could work throughout the watershed. Others are very specific • Conry: I like the implementing watershed and riparian restoration program –
stream bank stabilization. Get away from eroded or some other kind of monoculture. - Holistic approach, even if you went to an ephemeral or intermittent stream, I think you’d still have some kind of payback. Of course the cost would be a lot smaller, even though the benefit is a lot smaller. - I like the idea of the public sector providing these ideas and maybe some assistance from the private sector. I have a bias, I like the wetlands below the PL566, of course that’s more in the upper watershed. I think wetlands are neat, but they’re not going to be the answer. - Have potential to address higher storm influence loading. I was intrigued by the maintenance of the PL566. They are reaching they’re 50-year lifespan. If we don’t have the PL566 we are in horrible shape (because not controlling overland flow and storm flow is a lot higher, releasing sediment stored there for however many years).
• Mueller: Economic evaluation based on 50 years. If everything is going right and we still have sediment it may keep going for 20 years, if there’s reduced sediment then may not.
• Griffith: Does 50-year thing have any contractual analysis? • Mueller: Our operation and agreement is with the SWCD in most cases, so they
have an easement to maintain that dam, but the dam is actually on that landowner and they have a full right to do anything with it.
• Prochnow: Looking at loss of volume, type of terrain, drainage area, trap efficiency of these reservoirs. Thru time projecting loss of volume.
• Hauck: To me you’re losing what’s a benefit to landowners, which is that 200 acre-feet within that pipe that controls the volume that’s actively watered. - There’s still tons of area out there that’s not filled up with sediment to capture

85
storm events. I haven’t seen tremendous amounts of sediment in the ones I’ve looked at. The way these things operate is they have that standing structure in there and keeps water at the outlet level confined, because of water rights reasons, to no more than 200 acre-feet. There are hundreds of acre-feet of storage above that. Still a lot of functionality from sediment trapping.
• NRCS: In selected cases, usually those we’re looking at rehabilitating for some reason have a deficiency or we’re looking at rehabilitating structure and contracting with Peter Allan at BU and he’s going in and reconstructing. It varies. Some may be full to the pipe and some are hardly touched.
• Prochnow: Lately it’s dependent on the terrain. • Hauck: Land use has a lot to do with it also. • Griffith: Variables are things Srini could do an analysis on that subjectively can
suggest more or less sediment and we can look and see. • Srini: There are still questions about water quality. Quality is still poor. Benefit –
water passed thru or water released from dam, those could still be captured on-stream or thru channel.
• Griffith: If there are 40 of these structures, a finite number, identify characteristics that suggest certain ones may be in more need of reconstruction or water quality treatment than others.
• Srini: Should we identify this as a potential benefit and do a subset • Griffith: Screen which ones are likely to be prone to these problems and do
analysis now. • Prochnow, Hauck – agree • Ellis: District may be able to tell you which landowners may be more receptive to
having something done on their property • Prochnow: If you’re going to enhance field proximity to storm runoff – have to
have some runoff below PL566. Will deteriorate and be slowly released, stop storm flow, and something to clean-up as it’s coming out of it, doing something to solve the problem.
• Srini: I’m not sure base-flow will still have the same water quality problem • Hauck: The idea behind that would be somehow modifying outlet structures so
that they still, at the peak events, release enough water that they don’t damage their integrity. The majority of the time there’s not water going in. Reduce release rate of those waters. Majority of that goes out in a few days, shaves that peak off. Also makes wetland more viable.
• Conry: Would be more attractive to landowner • Hauck: Maintain the integrity • Ellis: Most of these will have draw down of 10 days. Person may have crops in
flood pool now inundated. Look at each of these on an individual basis. Same amount of water may need to come thru and deal with wetland on down side.
• Conry: Have a variable capacity wetland. • Ellis: Not sure on a scientific basis of base-flow in that channel, but something
where we have intake and two foot height in the channel • Feagley: Not a lot of change in P in rice fields in Louisiana. Using swamps for
sludge. Resonance time of a month, time cut in half. Ten day residence times in
86
some of these wetlands. If we’re looking for P reductions I don’t think we’re going to see a lot of reduction. N good responses from.
• Srini: Some work with constructed wetland, with trapping for sediment they have a pond that collects one to two days, when sediment settles down to bottom of pond, 70-80% reduction in P. Settle all sediment, capture 70% of soluble P. Seven day retention period; 250 acres of wetlands, have hard data to back up, big operation.
• Griffith: Different natural system too • Forbes: Wetlands are not good at removing dissolved P, not in long term. With
PL566 there’s the perfect opportunity to use the material John was talking about. Already have effluent that’s clean from suspended sediment point of view – ag lime or boiling stone or z-lite.
• Conry: Cascading or progressive check dams. Put them in at the area where you get the most benefit and walk away from it. They should require very little maintenance, but develop a natural system to do that. They would have to be on tributaries.
• Srini: Target tributaries near main Bosque. • Jones: Looking at a series of ponds, want water to stay behind him part of the
time. Anything between that and a lowland area back to gully plugs on upland where it will slow water down
• Srini: Ponds connect to check dam to slow down water. • Conry: Are these swelled so you get better efficiency? A: Kind of like rocks. • Hauck: Along lines of wetlands, last time was mentioned implementing oxbow
wetlands, people mentioned there were some oxbow sections in there. If they do exist and landowners are agreeable, it’s positioned properly. I would second what Tom Conry says I like the idea of looking at the kind of schemes we’re looking at now. I think these are ones that are very complimentary with existing programs that are out there, and they don’t overlap or duplicate the programs other agencies have.
• Srini: One other time we talked about last time is ___ 566 structures. Helping landowners in terms of taking care of the lagoon structure – BMP structure or technique. Water getting spread in field coming from lagoons so should we be thinking about that?
• Feagley: On the project being looked at, what do we do when we have to clean them out?
• Jones: Would this cause any problems with competitions with EQIP? • Ellis: No, the cleanout is typically considered a maintenance items and haven’t
been paid for in past, cost of producer. Can’t match federal funds with federal funds. On old oxbows, if have aerial photo, may find tree lines or something where they have been in the past.
• Munster: Seems like a lot of these solutions are dealing with in-stream...if we can keep the problem out of the stream then we’re ahead of game. Go to the source of the problem of where it occurs and keep it from coming into the stream. Most of BMPs are developed for specific problems. If we can identify specific problems then we can keep BMPs and keep contaminants in place and out of the streams and come up with a solution.

87
• Ellis: A combo of different issues – concept of doing sod farming or whatever to trap P and get it out, I think that’s one of the first things you need to look at.
• Forbes: Where do you think some of the biggest problems are? Dairies and lagoons?
• Munster: That’s where the waste is concentrated? • Ellis: A couple of cities are looking at polishing strips, something that might
become important. • Jones: Sam, in your experience, what two or three things would be most effective
to keep P sediment, bacteria, on that field? Maybe in place or just within the fence line?
• Feagley: Put everything in hybrid bermudagrass and manage it well. Regardless of slope, we see much less slope and runoff coming off of well managed hay or grazing pasture, regardless of what the soil type happens to be. Well managed meaning it’s a good pasture, 89% coverage, getting a good year with precipitation 6 to 7 tons of bermudagrass cut off it. Even if you don’t over-seed with ryegrass or wheat-rye or oats, actually have that vegetation that’s still there. Run test even in wintertime when grass is there. If you have a good stand of grass you get much better infiltration and a lot let runoff which gives you a lot better loading potential. If compare to similar field in row crop, get more SRP off row crop than managed pasture, whether waste app or runoff.
• Vietor: Put producers in the position of quantifying what goes on and off the land so they know what balance is and frequently testing soil to see what’s in the soil and on the land. In our experience we saw producers still supplying P fertilizer who were also still receiving manure on their pasture. As we calculated it they probably contributed more to P problems with annual fertilizer application than with manure. With programs that takes account of nutrients, huge in control of source factor.
• Scott: Nutrient management might be the key. • Education is one more BMP – waste management instead of waste disposal • Scott: Education seems to have most potential • Feagley: Producers are operators and are required to have 8 hours of training and
an additional 8 hours of CEUs each year after that – coordinated thru CEA. How to manage nutrients, dairy cows, give up to date information, etc.
• Srini: Any effectiveness that we know they’re changing. • Feagley: Philosophies seem to be changing in the way they’re managing – we
expect it’s having an impact. We do programs across the state about every four years. It’s reaching across the state. Do at least two here per year. Start to see the same producers.
• Srini: Do you think we should make a special emphasis on this area? • Griffith: What bubbles out is a BMP-called education; need to know what we
mean by this. What do we mean from what we’re already doing? Does it have more focus, emphasis? Public policy action somehow. What does it look like – where? Why?
• Harris: It involves the TSSWCB as well of how to implement nutrient and management plans

88
• Ellis: That’s one part of it. I know San Antonio has been looking and they have a lot of homeowners like my neighbor who wants the greenest yard. He puts on three times the recommended fertilizer and waters it until water runs down street – educate people in cities
• Srini: We will add education. • Hauck: Mentioned rainfall simulation. Did you feel like that kind of thing allowed
more hands on with individual producers? • Feagley: Yes, because they agreed to allow us to do it and they came out there
when we were on their fields to see what we were doing, what we were finding and how it compared to what most people thought. They told us how they had started changing their management practices. Finding out some of the different implementation systems that they had done because of the educational outreach we had throughout the last several years.
• Conry: Thru these approaches, we are including some documentation of the impact, right? I was assuming we would provide some mechanism to see what impact is.
• Griffith: This phase is not doing implementation, but recommendation to include management as part of implementation is a valid suggestion to come out of this phase. Benefit of way this program is structured is it doesn’t require us to meet any particular standard, just improve the situation. Flexibility, releases us from erroneous fact finding. We’ll make this better, yes or no. At some point we want to be able to say we all agree it will make things better, we tried something and here’s the results we suggest that made it successful or not. Should be part of implementation. When you make a public investment in something people like to know if it made a difference – results. The way program is currently envisioned it will be a cost-share program 75-25 and perhaps a monitoring and management recommendations.
• Feagley: Primary questions form TCEQ and USEPA, what is the potential reduction? We don’t have any idea on 99.9% of BMPs. Very conducive for us to set it up where we install BMP, look at PL566 monitoring station as water comes out of station and as it comes out of wetland. Any other BMPs we set up make sure we established BMP where we have it in the field and in another part of the field...see what percent reduction we get. If we don’t do that we’ll spend lots of people’s money without a story to tell.
• Srini: On-farm education main point, sod production to get P out of the watershed (Scott); in-stream combination of PL566 structures with wetlands, check dams
• Prochnow: Run some of it in the model • Griffith: Incorporate results of Clyde’s analysis, what part of watershed has the
right characteristics for that strategy? If every section of watershed did that, how would it help? How do you take it into a BMP and conceptualize/do it?
• Munster: One problem we’ve run into is dairyman aren’t interested in BMPs because they’re having manure moved off farm to composters basically for free
• Srini: Start looking thru all of this and see if you can prioritize these. We would like your info in next week or so, at least do ranking now based on expertise. If you’re not comfortable with efficiency number send info. If doing ranking, please rank within each category – 1-10 ranking. 1 – low, 10 – high

89
• Forbes: Done some research on material that absorbs P like John was talking about and I found it was very effective for municipal wastewater effluent. Expanded Shale manufactured by TXI, facility near Corsicana. Similar to boiling stone – comes in different particle sizes. Becomes stable rock in different particle sizes and absorbs dissolved P, can use in subsurface soil or placed in streams as check dam. Uses have not been fully developed. Haven’t figured out how to market it. Most used for road construction because it doesn’t crack windshields when flung up. Stable gravel to pebble size material so you can push a lot of water thru it and get a lot of dissolved P thru it. Very effective in context I’ve used it for. Efficiency consistently took 1-2 mg per liter down to about half mg per liter. Contact time/absorption almost immediate, trick to get water to surface of material. Has a lot of micropores inside of it. Don’t know long-term life of it. Below PL566, needs to be in something. Last part of dam, end of wastewater treatment plant.
VI. Discussions/Planning Meeting #3
• Tentatively block June 22nd same place, same time 3:00 p.m. Adjourn
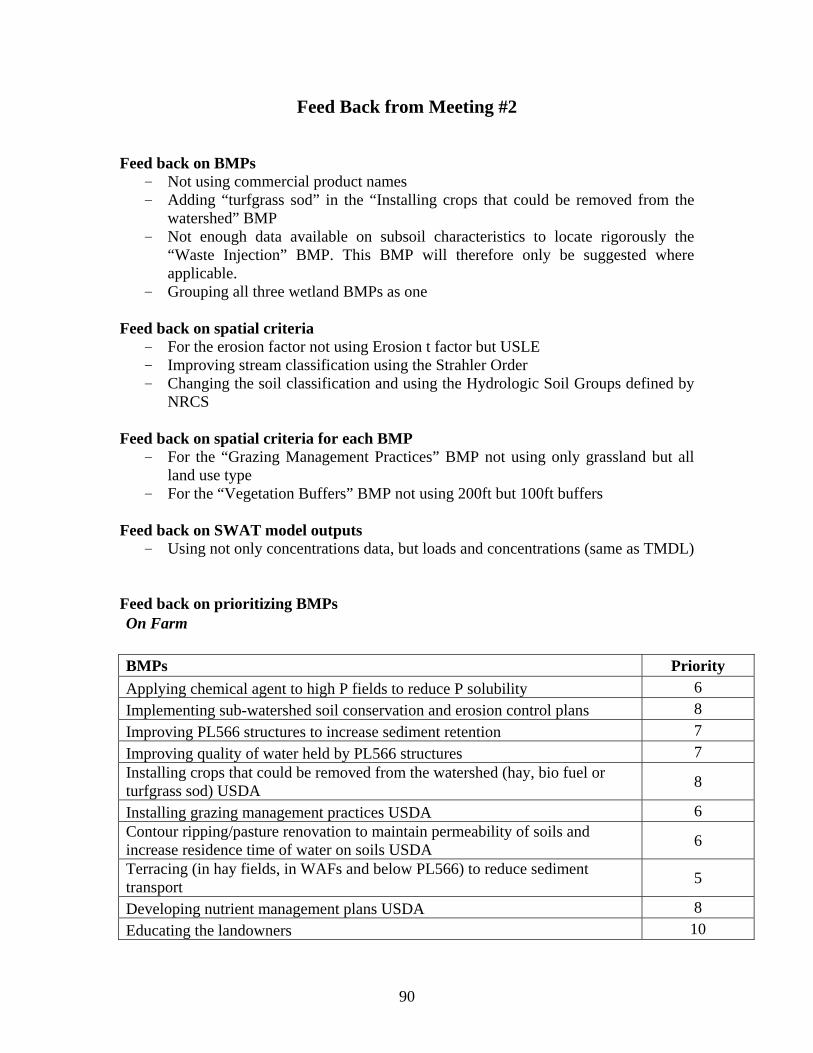
90
Feed Back from Meeting #2
Feed back on BMPs - Not using commercial product names - Adding “turfgrass sod” in the “Installing crops that could be removed from the
watershed” BMP - Not enough data available on subsoil characteristics to locate rigorously the
“Waste Injection” BMP. This BMP will therefore only be suggested where applicable.
- Grouping all three wetland BMPs as one Feed back on spatial criteria
- For the erosion factor not using Erosion t factor but USLE - Improving stream classification using the Strahler Order - Changing the soil classification and using the Hydrologic Soil Groups defined by
NRCS Feed back on spatial criteria for each BMP
- For the “Grazing Management Practices” BMP not using only grassland but all land use type
- For the “Vegetation Buffers” BMP not using 200ft but 100ft buffers Feed back on SWAT model outputs
- Using not only concentrations data, but loads and concentrations (same as TMDL) Feed back on prioritizing BMPs On Farm BMPs Priority Applying chemical agent to high P fields to reduce P solubility 6 Implementing sub-watershed soil conservation and erosion control plans 8 Improving PL566 structures to increase sediment retention 7 Improving quality of water held by PL566 structures 7 Installing crops that could be removed from the watershed (hay, bio fuel or turfgrass sod) USDA 8
Installing grazing management practices USDA 6 Contour ripping/pasture renovation to maintain permeability of soils and increase residence time of water on soils USDA 6
Terracing (in hay fields, in WAFs and below PL566) to reduce sediment transport 5
Developing nutrient management plans USDA 8 Educating the landowners 10
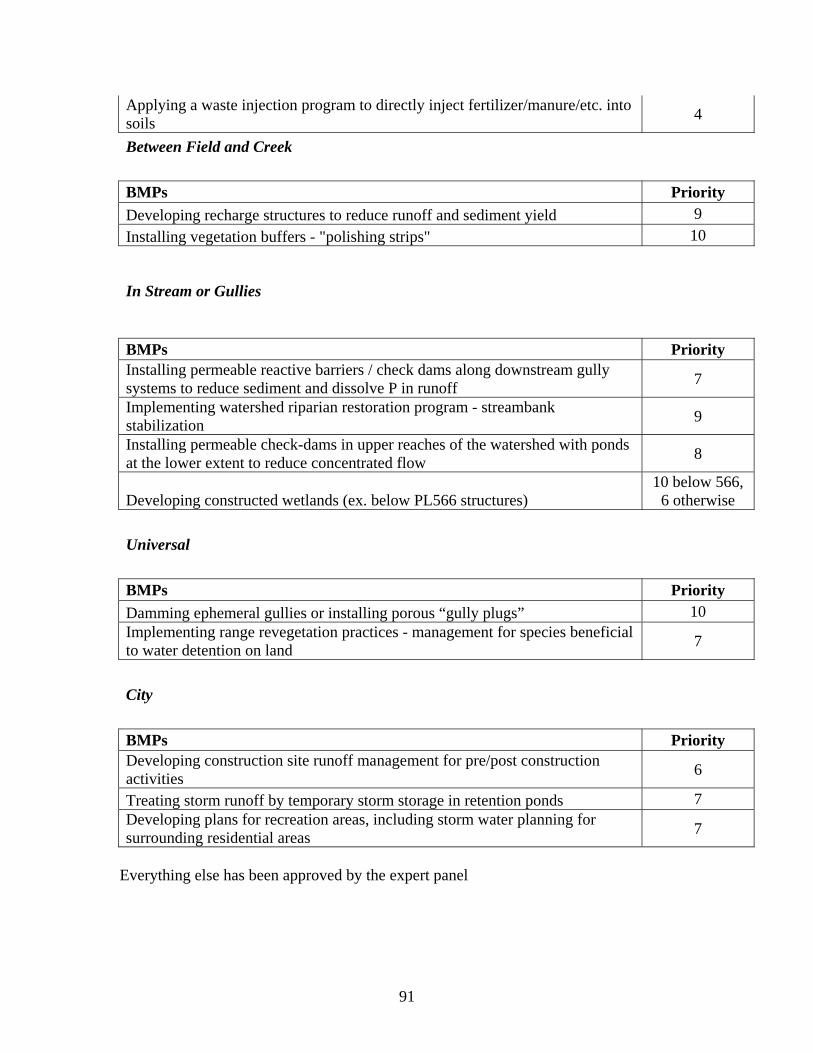
91
Applying a waste injection program to directly inject fertilizer/manure/etc. into soils 4
Between Field and Creek BMPs Priority Developing recharge structures to reduce runoff and sediment yield 9 Installing vegetation buffers - "polishing strips" 10
In Stream or Gullies
BMPs Priority Installing permeable reactive barriers / check dams along downstream gully systems to reduce sediment and dissolve P in runoff 7
Implementing watershed riparian restoration program - streambank stabilization 9
Installing permeable check-dams in upper reaches of the watershed with ponds at the lower extent to reduce concentrated flow 8
Developing constructed wetlands (ex. below PL566 structures) 10 below 566,
6 otherwise Universal BMPs Priority Damming ephemeral gullies or installing porous “gully plugs” 10 Implementing range revegetation practices - management for species beneficial to water detention on land 7
City BMPs Priority Developing construction site runoff management for pre/post construction activities 6
Treating storm runoff by temporary storm storage in retention ponds 7 Developing plans for recreation areas, including storm water planning for surrounding residential areas 7
Everything else has been approved by the expert panel

92
Meeting #2 Maps
Maps in this section are the first iteration of maps generated by SSL and are not the final product that will be used for evaluating a site or where a specific BMP should be implemented. Maps from meeting three are the final versions that were approved by the scientific advisory committee for use in the proposed methodology (included in following appendix).
Criteria Used in GIS Spatial Analysis BMPs
Sub-basin Factors Water Quality Indices
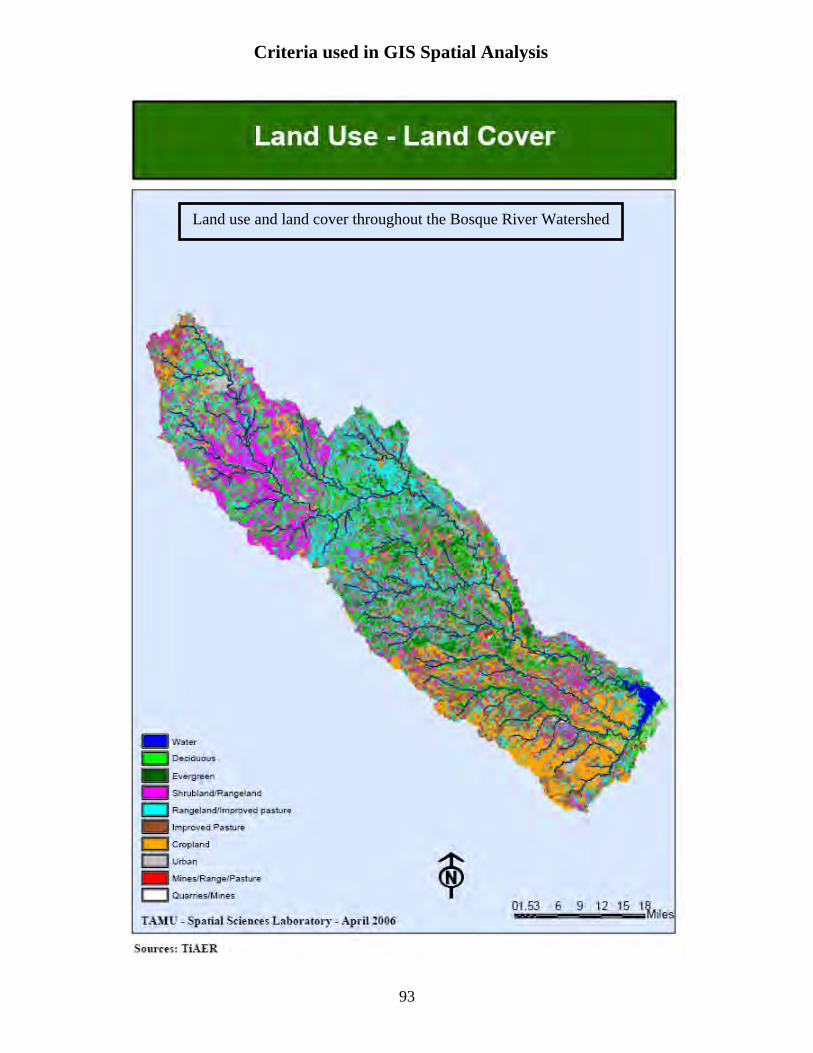
93
Criteria used in GIS Spatial Analysis
Land use and land cover throughout the Bosque River Watershed
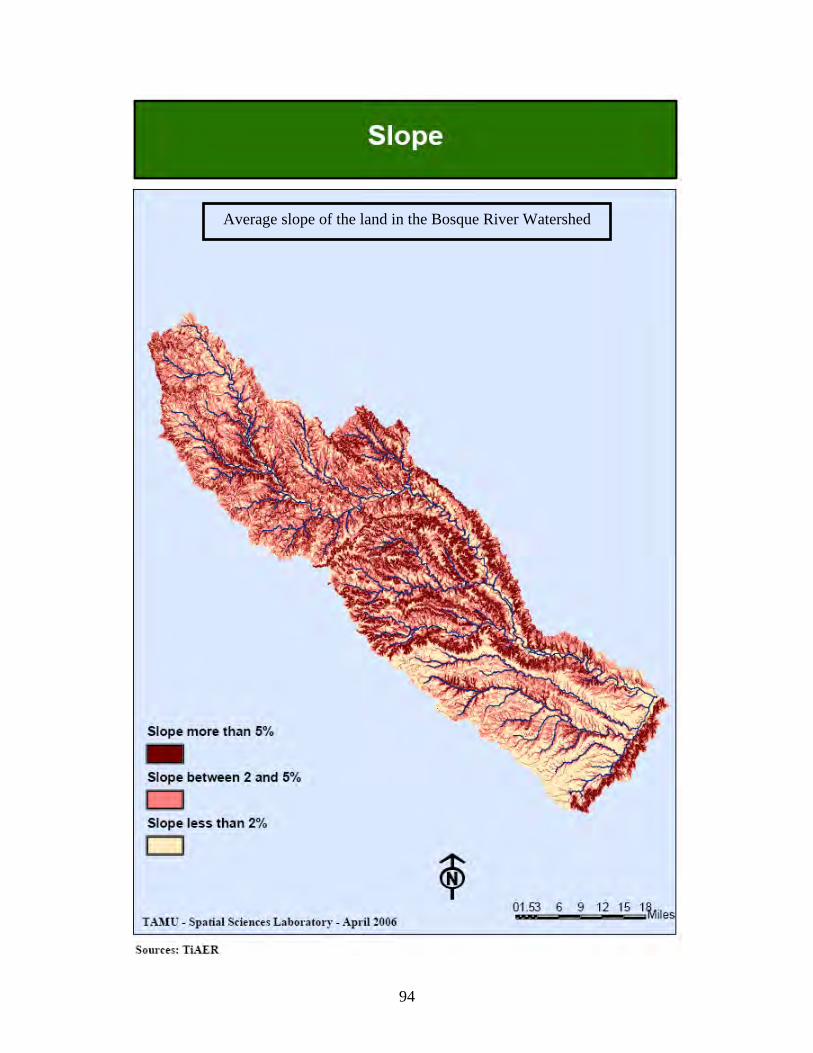
94
Average slope of the land in the Bosque River Watershed

95
General soil types and their respective locations in the watershed

96
Locations where soil loss potential could create a problem for establishing and maintaining plant cover in watershed
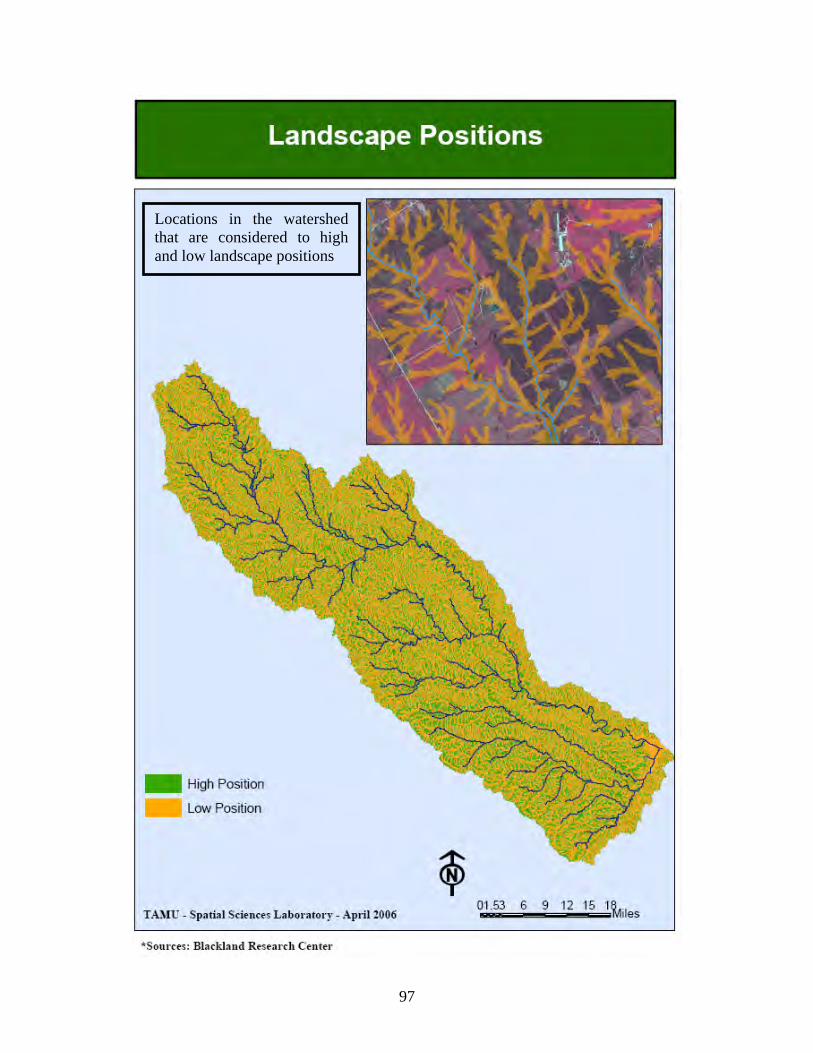
97
Locations in the watershed that are considered to high and low landscape positions

98
BMP Locations within the Bosque River watershed
Green area indicates waste application fields in the watershed that are feasible for the application of Ag Lime to reduce P solubility

99
Green area shows current waste application fields in the watershed that are feasible for the application of Bauxsol to effectively immobilize P

100
Green areas indicate locations that are feasible for growing crops that could be removed from the watershed
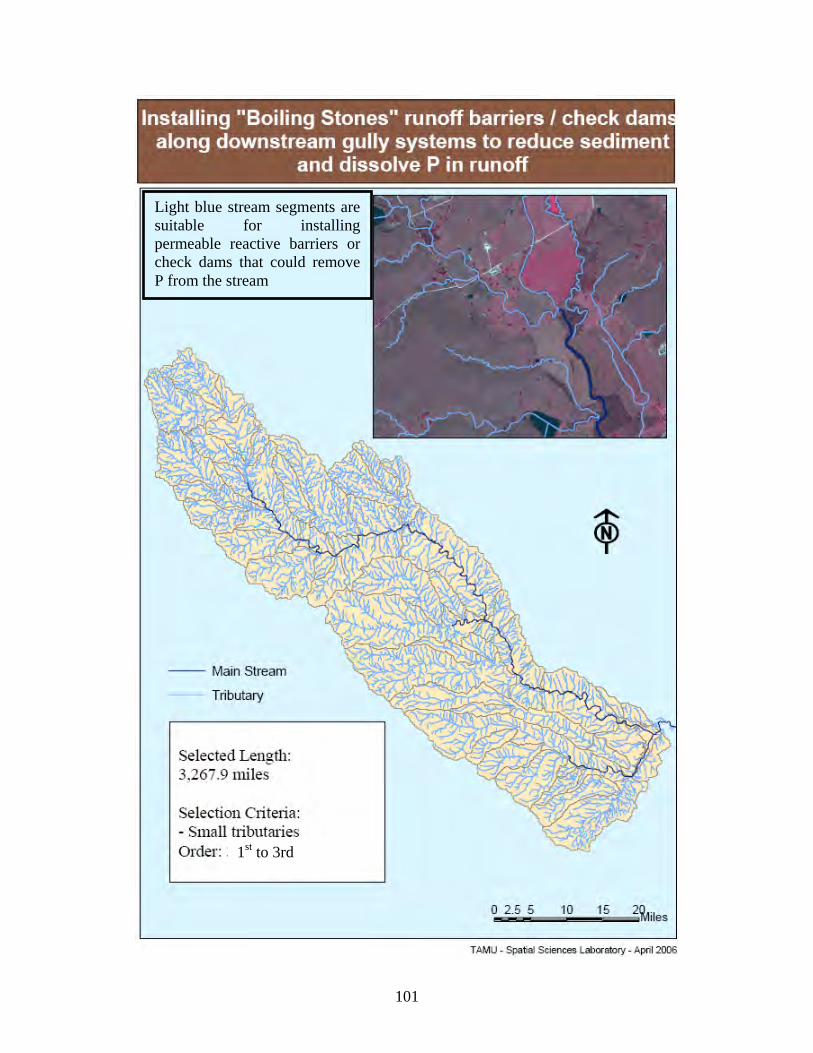
101
Light blue stream segments are suitable for installing permeable reactive barriers or check dams that could remove P from the stream
1st to 3rd

102
Light blue stream segments are suitable for installing permeable check dams in combination with ponds to reduce pollutant concentration
1st to 3rd

103
Green area indicates locations that are feasible for contour ripping or pasture renovation to increase soil infiltration based on listed criteria
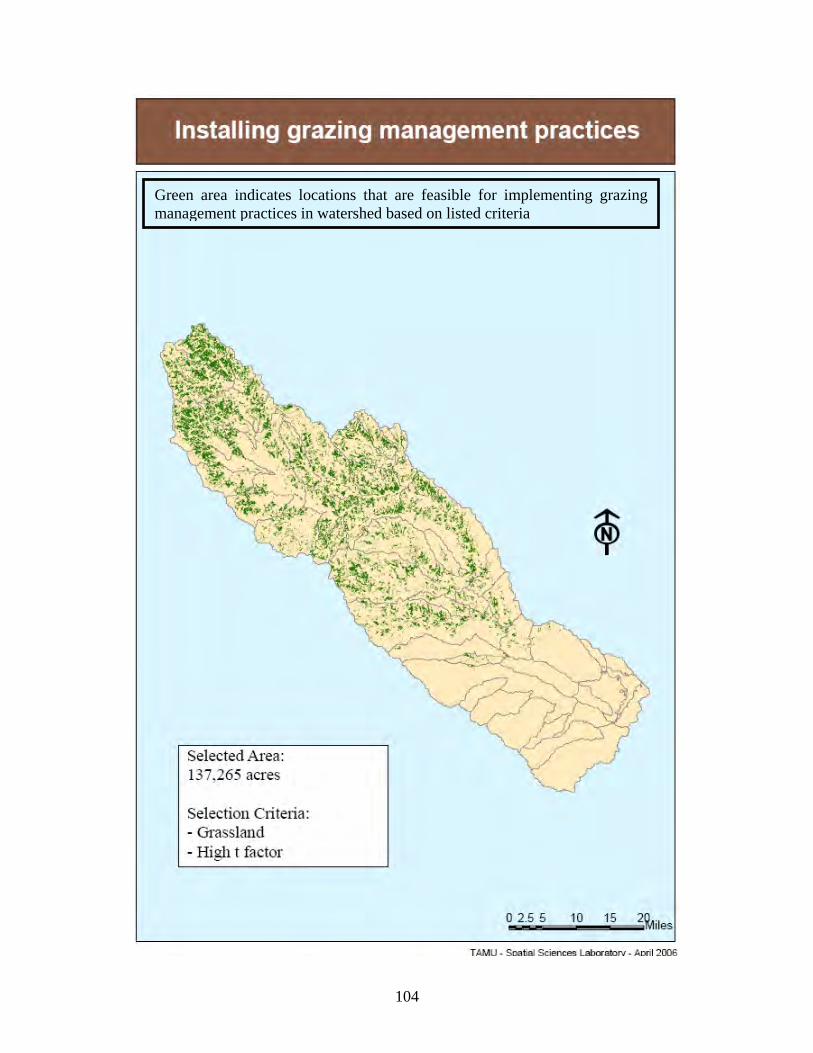
104
Green area indicates locations that are feasible for implementing grazing management practices in watershed based on listed criteria
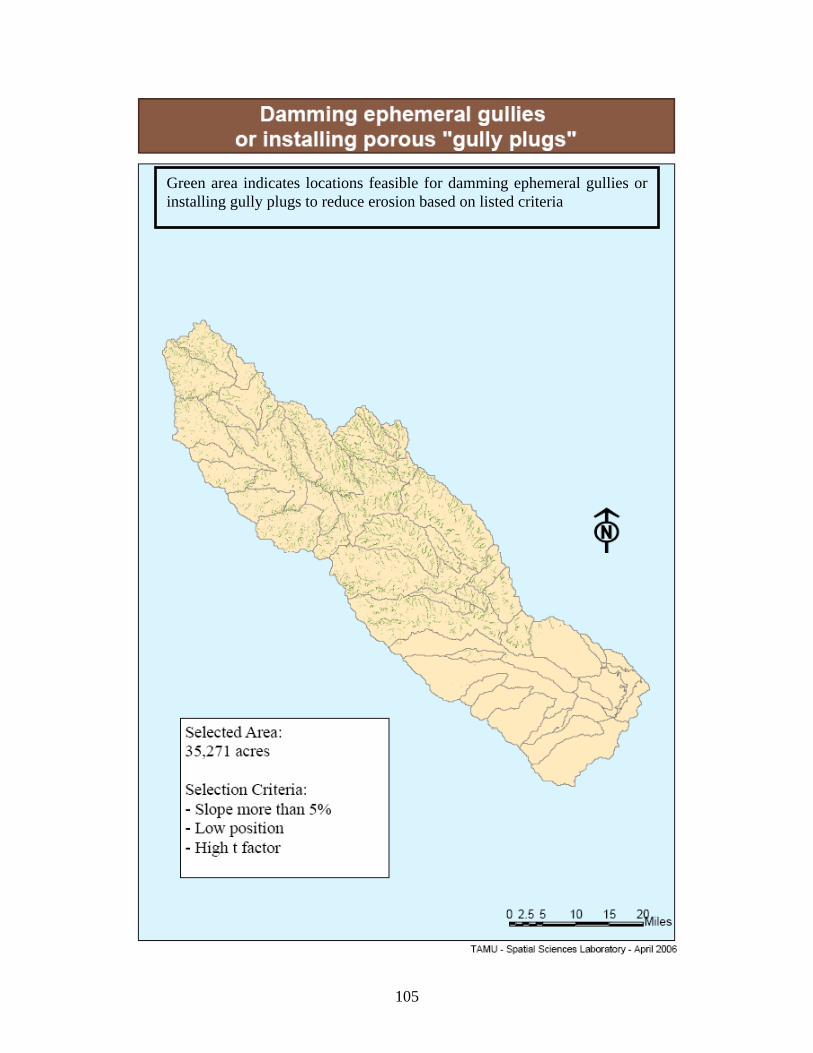
105
Green area indicates locations feasible for damming ephemeral gullies or installing gully plugs to reduce erosion based on listed criteria

106
Green area indicates lagoon locations that possibly need water quality improvements

107
Green area indicates lagoon locations that may need to have sediment removed
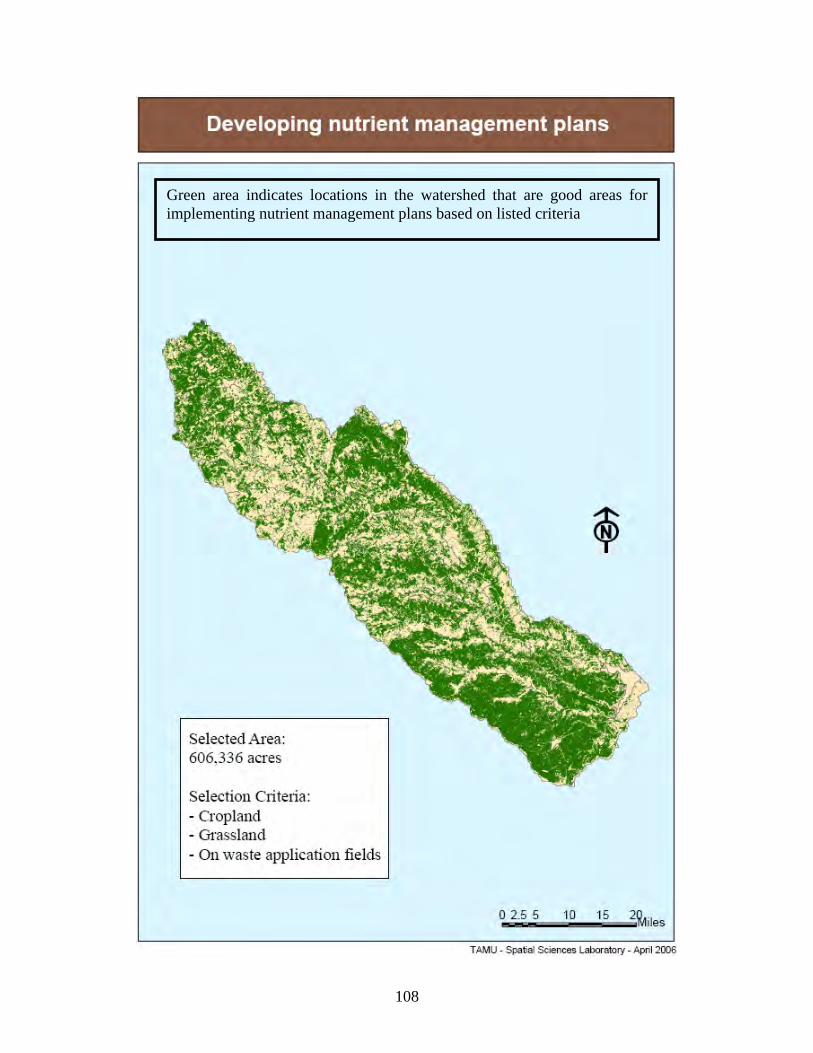
108
Green area indicates locations in the watershed that are good areas for implementing nutrient management plans based on listed criteria

109
Green area indicates suitable locations for implementing oxbow wetlands based on the criteria listed

110
Green area indicates suitable locations for constructing recharge structures to reduce runoff and sediment based on the criteria listed

111
Light blue stream segments are 1st to 3rd order streams that represent feasible locations for implementing watershed riparian restoration
1st to 3rd

112
Green area indicates suitable locations for implementing sub-watershed soil conservation and erosion control plans based on the listed criteria
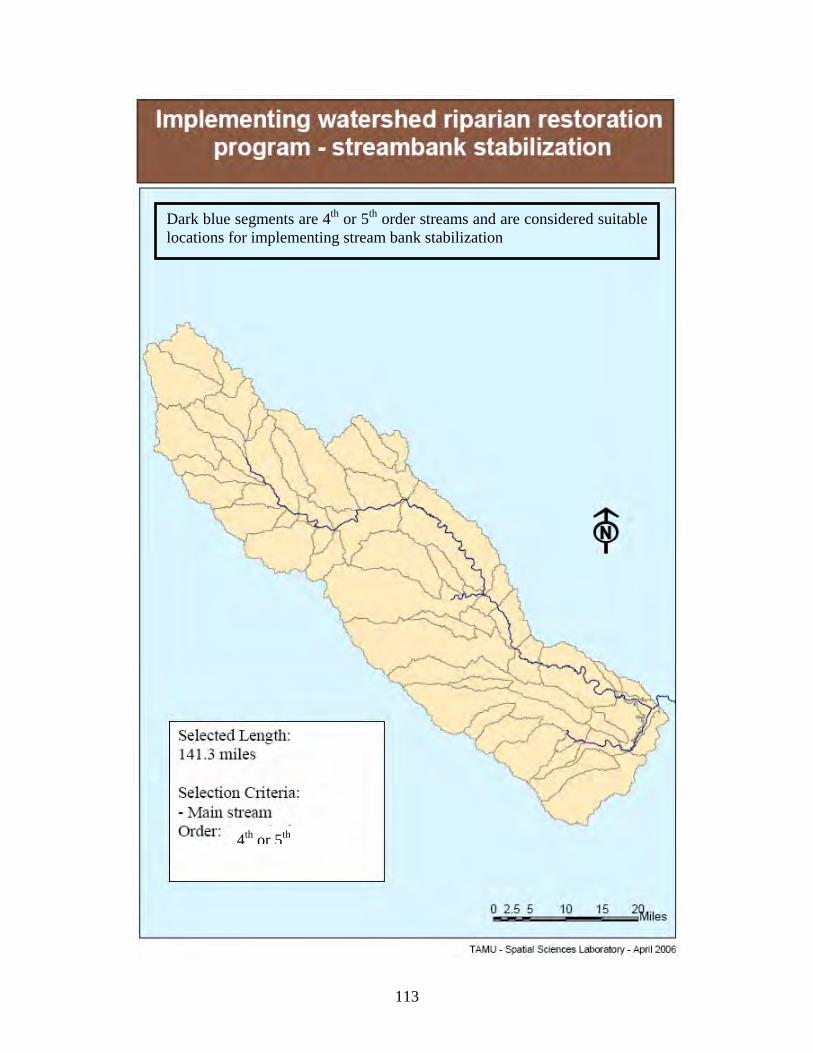
113
4th or 5th
Dark blue segments are 4th or 5th order streams and are considered suitable locations for implementing stream bank stabilization

114
Terracing to reduce sediment transport is a feasible BMP for the green areas based on criteria listed below
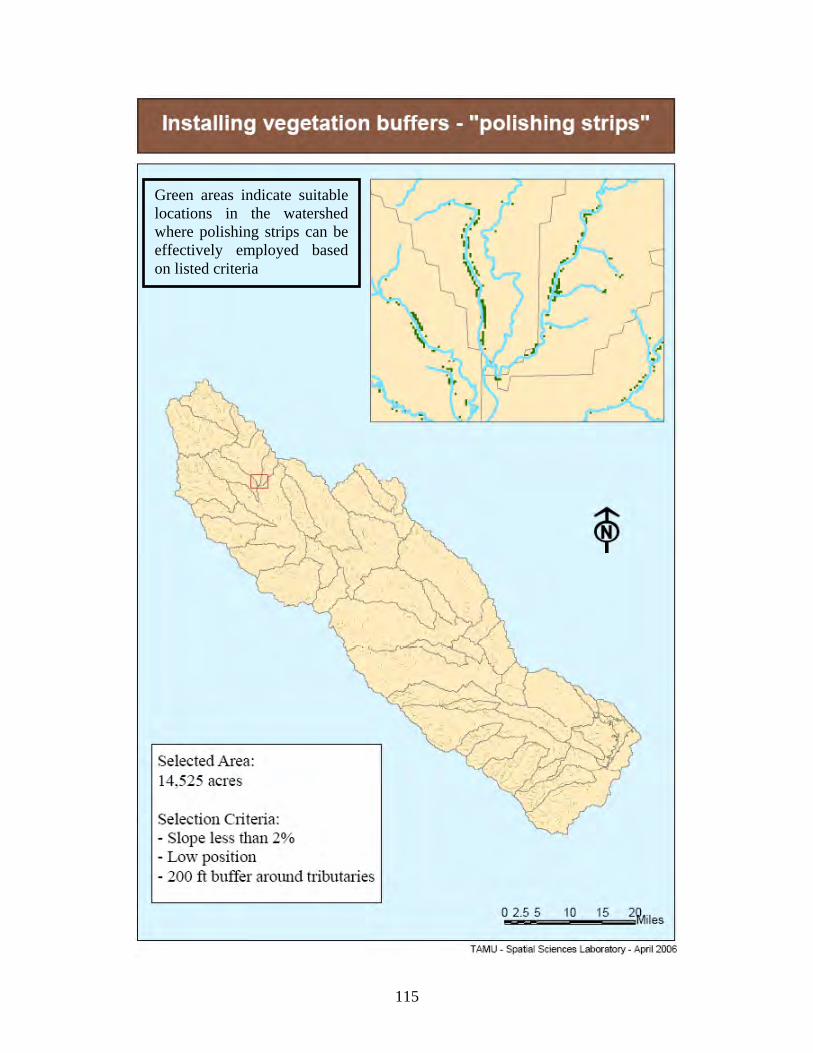
115
Green areas indicate suitable locations in the watershed where polishing strips can be effectively employed based on listed criteria

116
Green areas indicate suitable areas for injecting fertilizer or manure into the soil based on chosen criteria

117
Green areas show suitable locations for developing constructed wetlands based on selected criteria

118
Sub-basin Factors
Simulated annual soluble nitrogen load per sub-basin in kg/ha

119
Simulated annual sediment nitrogen load per sub-basin in kg/ha

120
Simulated annual precipitation in mm per sub-basin
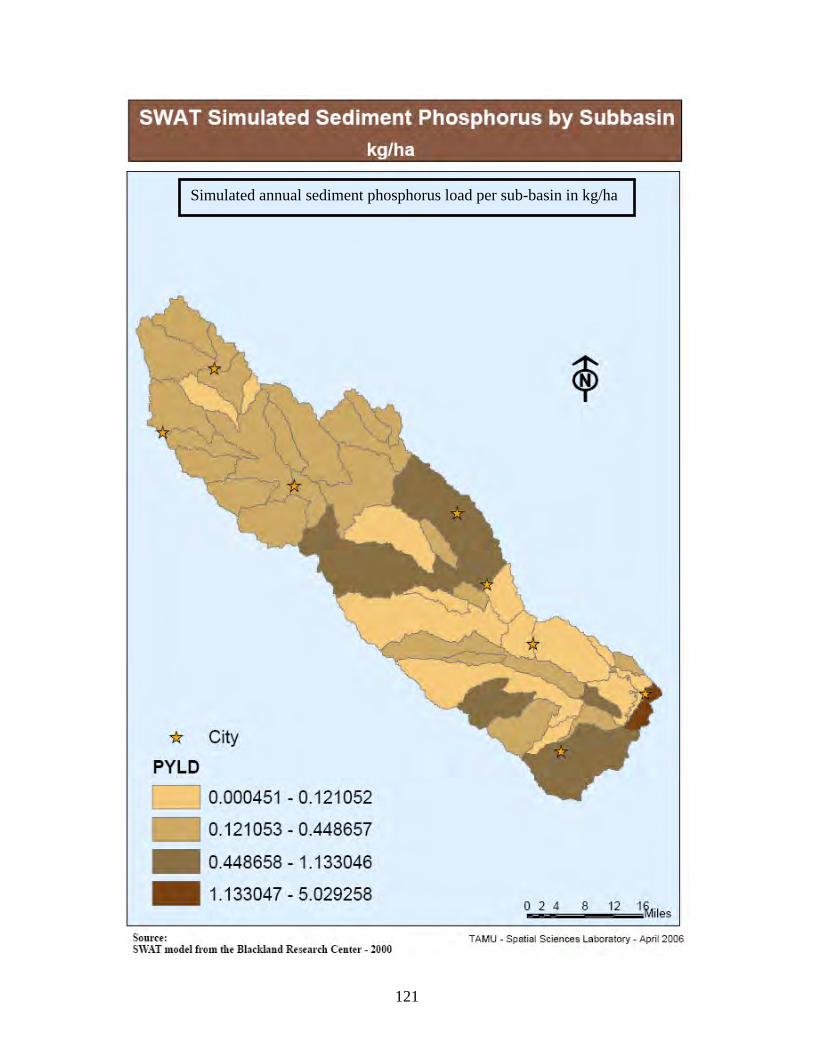
121
Simulated annual sediment phosphorus load per sub-basin in kg/ha

122
Simulated annual soluble phosphorus load per sub-basin in kg/ha

123
Simulated annual surface runoff in mm per sub-basin
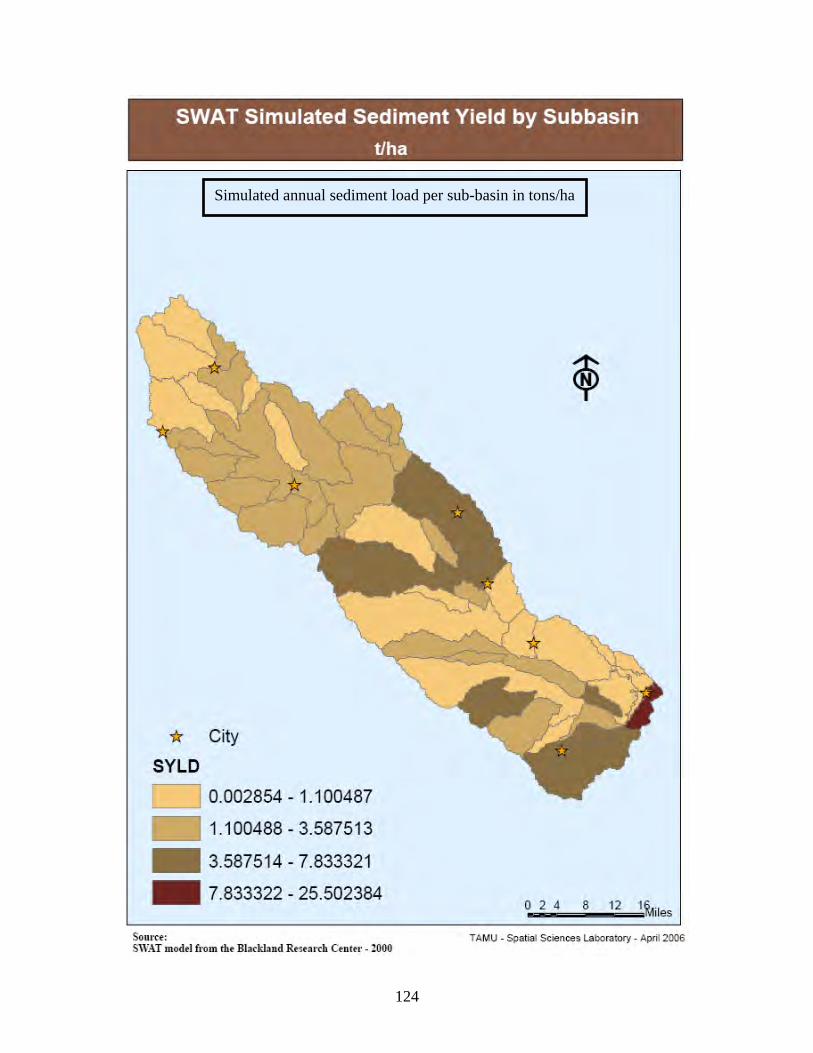
124
Simulated annual sediment load per sub-basin in tons/ha
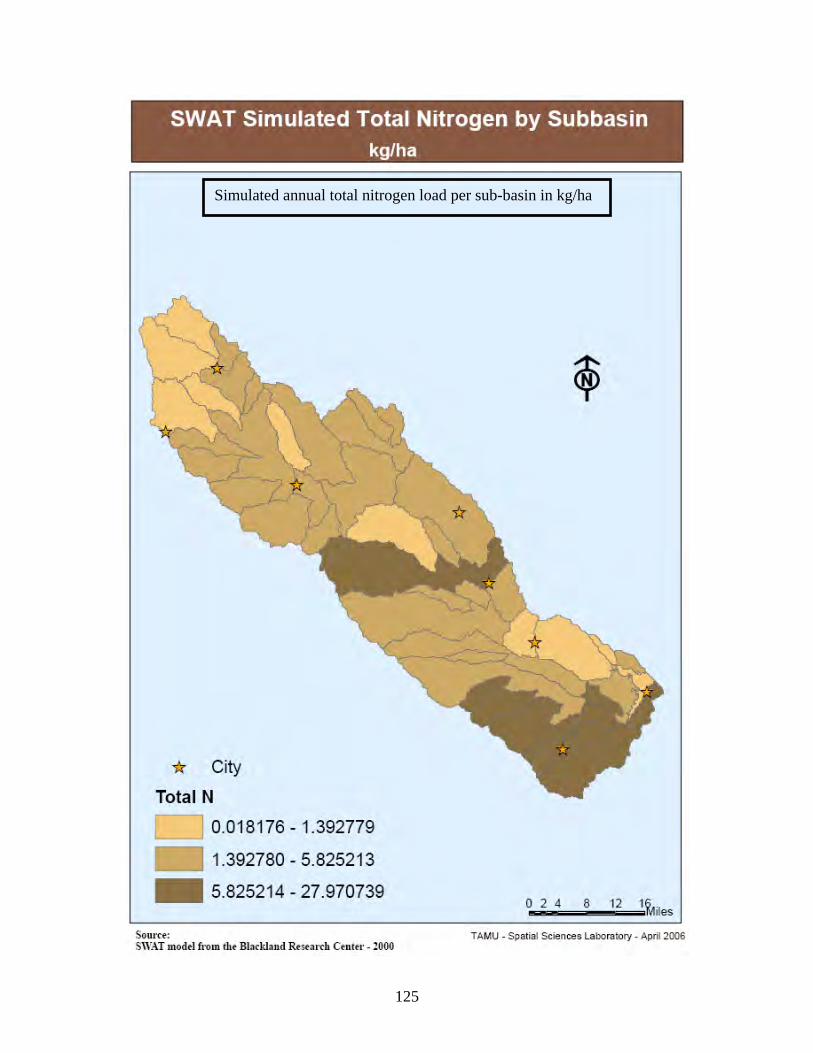
125
Simulated annual total nitrogen load per sub-basin in kg/ha
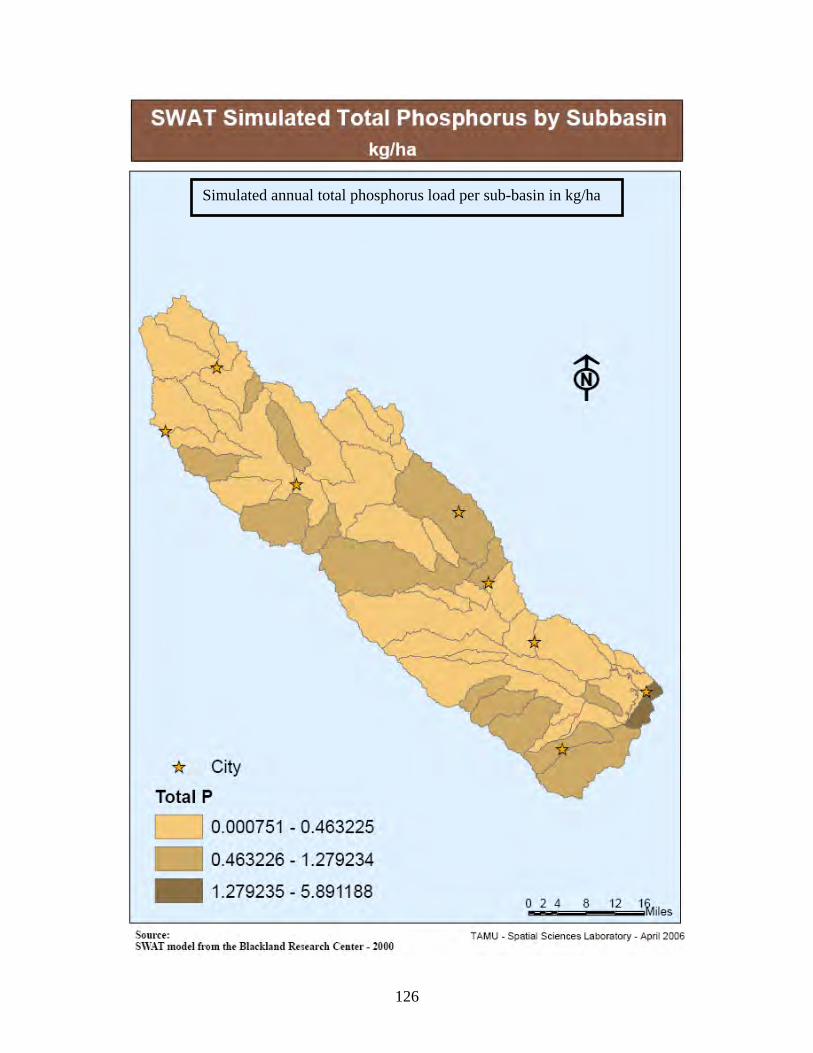
126
Simulated annual total phosphorus load per sub-basin in kg/ha

127
Simulated annual soil loss per sub-basin in tons/ha
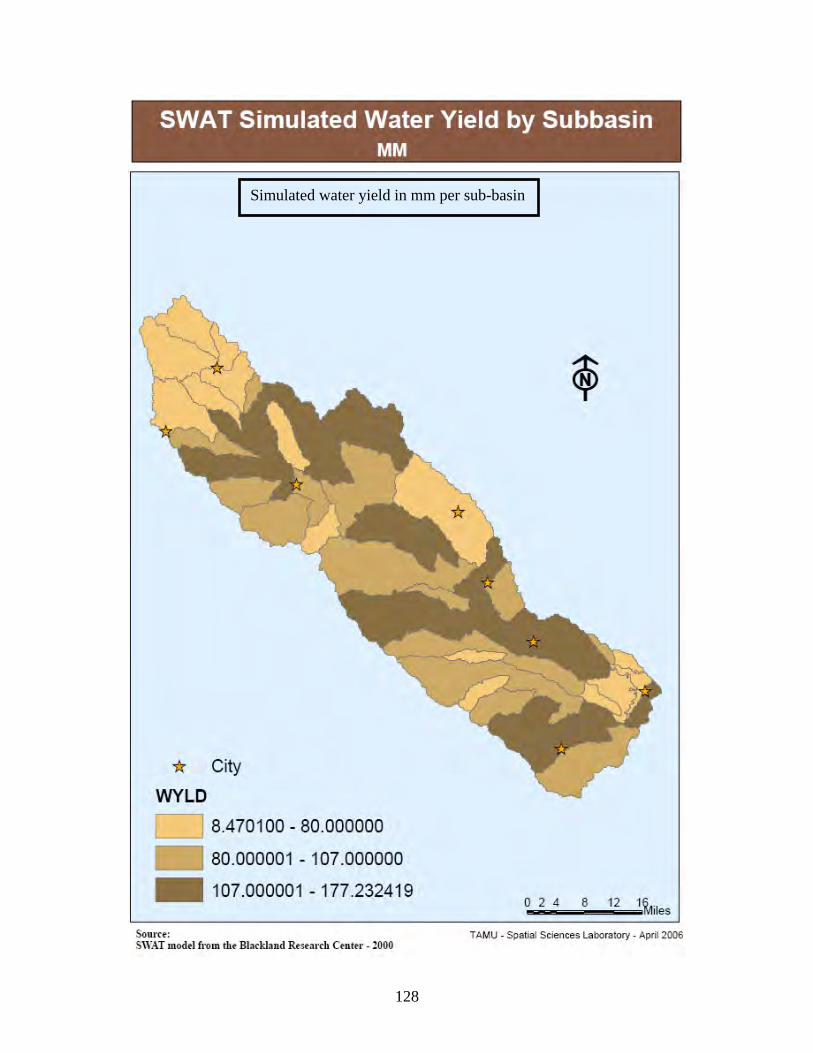
128
Simulated water yield in mm per sub-basin
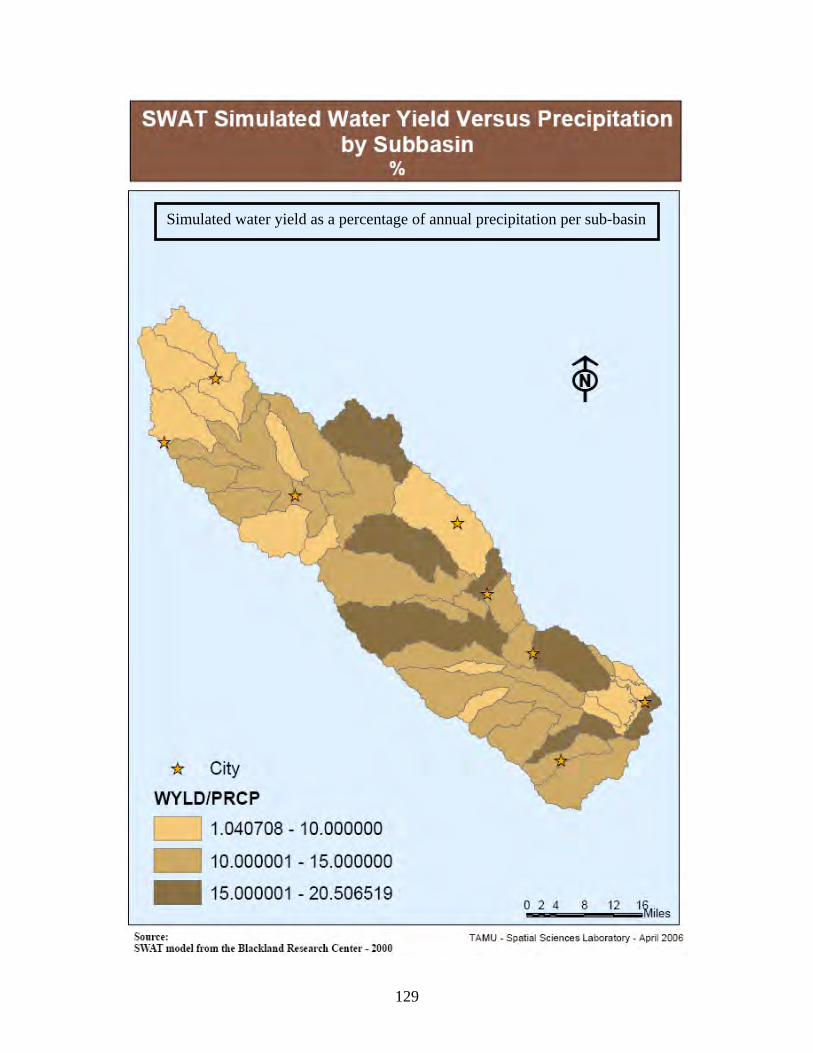
129
Simulated water yield as a percentage of annual precipitation per sub-basin

130
Sub-basin priority based on the percentage of E. coli grab samples exceeding the TCEQ screening levels
Water Quality Indices

131
Sub-basin priority based on the percentage of E. coli samples exceeding the TCEQ screening levels taken during or after storm events

132
Sub-basin priority based on the percentage of SRP samples exceeding the TCEQ screening levels taken during or after storm events
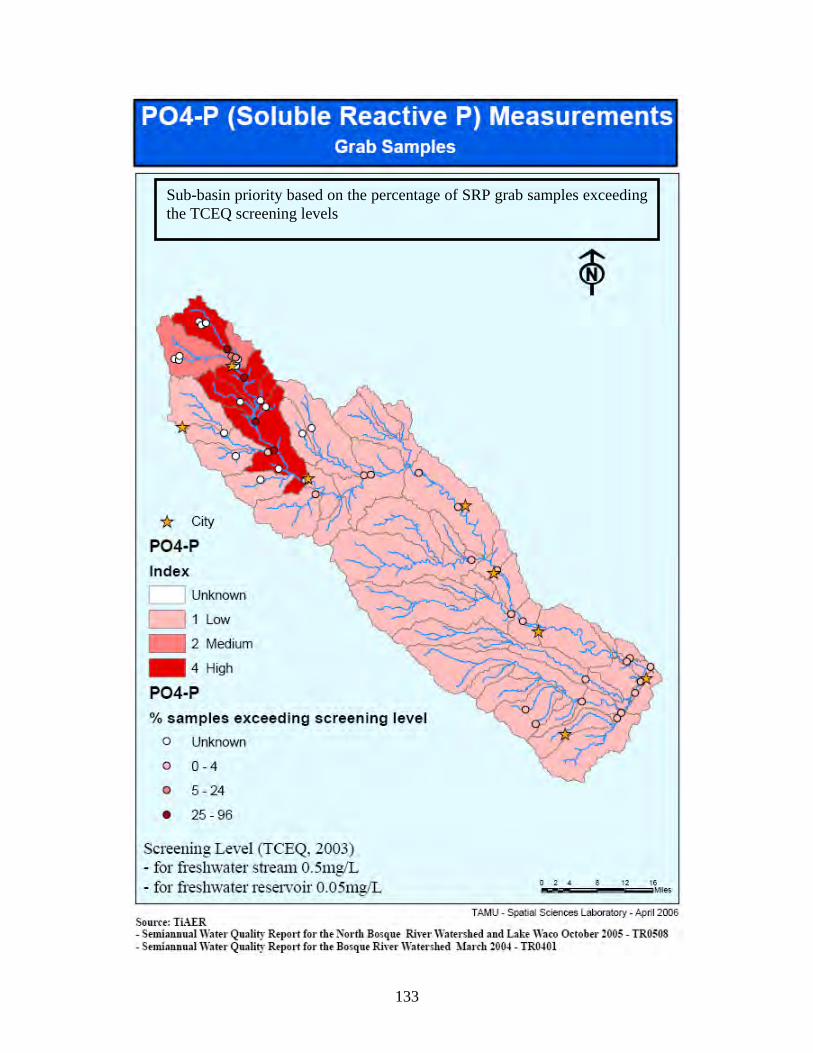
133
Sub-basin priority based on the percentage of SRP grab samples exceeding the TCEQ screening levels
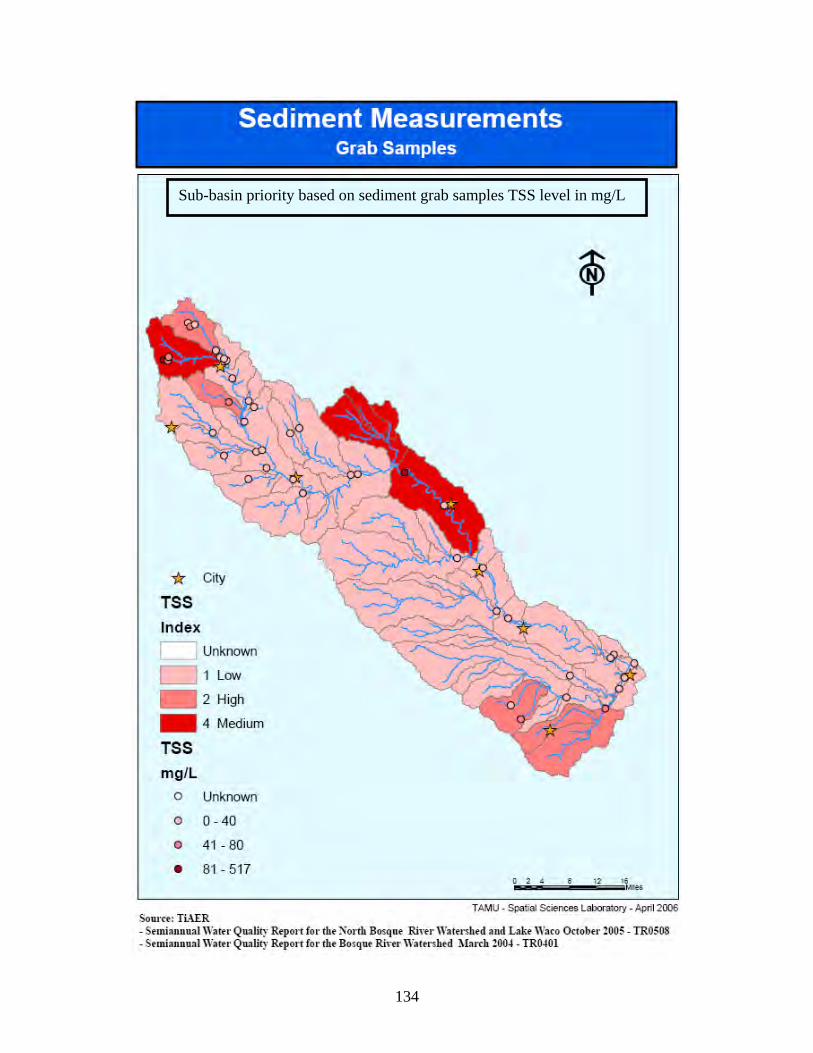
134
Sub-basin priority based on sediment grab samples TSS level in mg/L

135
Sub-basin priority based on sediment from storm samples in mg/L

136
Location of water quality monitoring stations in the Bosque River Watershed

137
Sub-basin priority based on the percentage of Total P samples exceeding the TCEQ screening levels taken during or after storm events
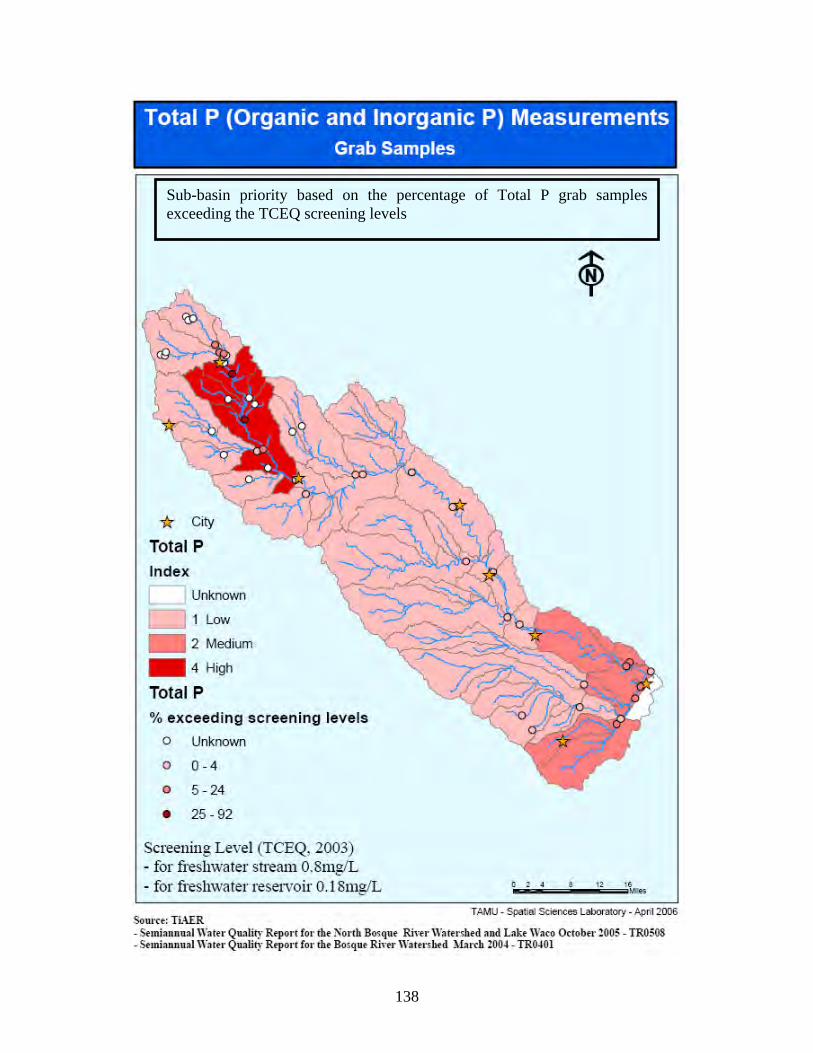
138
Sub-basin priority based on the percentage of Total P grab samples exceeding the TCEQ screening levels

139
APPENDIX VI
Meeting 3
- Meeting Agenda - Meeting Attendance
- Meeting Minutes - Meeting Pictures
- Feed Back -Maps
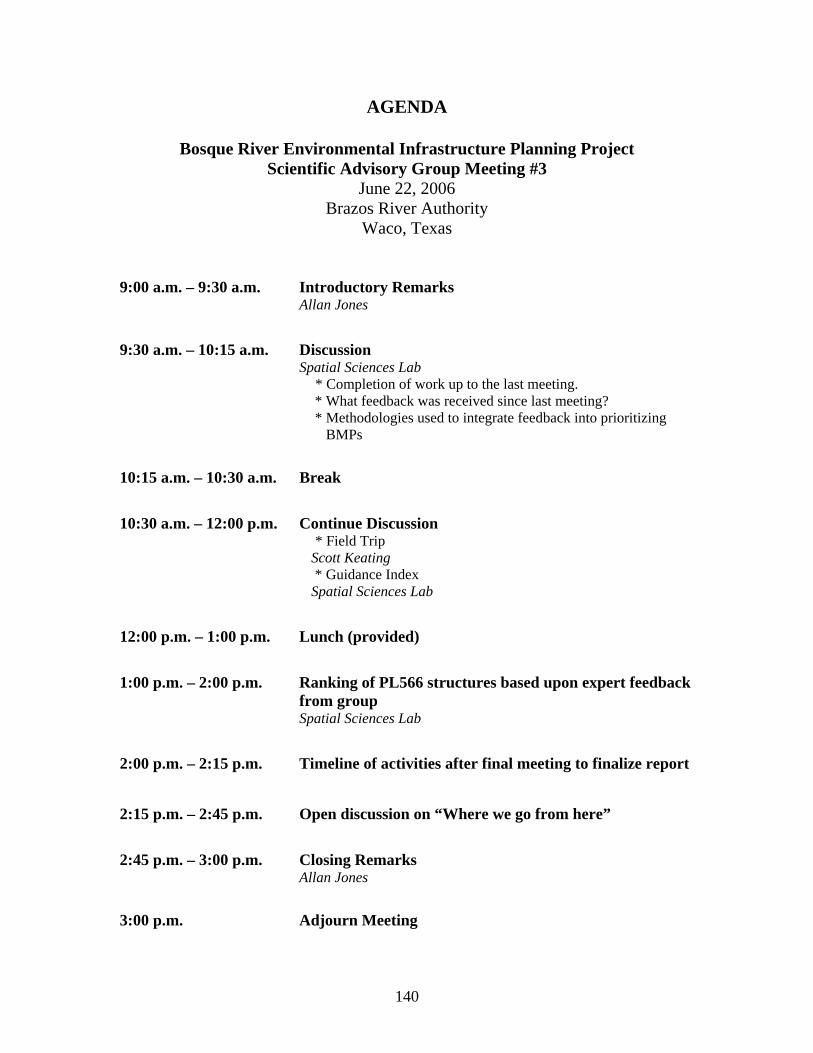
140
AGENDA
Bosque River Environmental Infrastructure Planning Project Scientific Advisory Group Meeting #3
June 22, 2006 Brazos River Authority
Waco, Texas
9:00 a.m. – 9:30 a.m. Introductory Remarks Allan Jones
9:30 a.m. – 10:15 a.m. Discussion Spatial Sciences Lab * Completion of work up to the last meeting. * What feedback was received since last meeting?
* Methodologies used to integrate feedback into prioritizing BMPs
10:15 a.m. – 10:30 a.m. Break
10:30 a.m. – 12:00 p.m. Continue Discussion * Field Trip Scott Keating * Guidance Index Spatial Sciences Lab
12:00 p.m. – 1:00 p.m. Lunch (provided)
1:00 p.m. – 2:00 p.m. Ranking of PL566 structures based upon expert feedback from group Spatial Sciences Lab
2:00 p.m. – 2:15 p.m. Timeline of activities after final meeting to finalize report 2:15 p.m. – 2:45 p.m. Open discussion on “Where we go from here”
2:45 p.m. – 3:00 p.m. Closing Remarks Allan Jones
3:00 p.m. Adjourn Meeting
141
Meeting #3 Attendance: Jay Bragg Tim Dybala Paul Dyke Bill Fox Lucas Gregory Bill Harris Larry Hauck Allan Jones Steve Junot Scott Keating Clyde Munster Daniel Nichols Matt Phillips Shane Prochnow Raghavan Srinivasan Danielle Supercinski Michelle Thrift Don Vietor Julie Villeneuve
142
Bosque Meeting #3 Minutes June 22, 2006
I. Introductory Remarks – Allan Jones, TWRI
• Funding Edwards got us for FY06 with Department of Energy to continue this kind of analytical work and take it on to the next stage
• It’s possible the USACE will have some funding for FY06 • Think about what the future needs to bring and how we can all gradually work to
improve the environmental infrastructure on the Bosque II. Discussion – Julie Villeneuve, TAMU SSL
• Showing results of feedback from everyone at the last meeting A. Completion of work up to the last meeting?
• List of potential BMPs (based on 1st expert panel meeting) • Five spatial criteria:
- Soil type (any clay/any sand) - LULC (land use/land cover) - Slope - Landscape position (high/low) - Erosion t factor
• Potential locations for each BMP • SWAT outputs (loads) • Water quality (% samples exceeding TCEQ screening level)
B. What feedback was received since last meeting? • Feedback on BMPs • Feedback on spatial criteria • Feedback on spatial criteria for each BMP • Feedback on SWAT model outputs • Prioritizing BMPs • Feedback on BMP:
- No commercial product names - Adding “turfgrass sod” in: Installing crops that could be removed from the watershed - Not enough data available on subsoil characteristics to locate rigorously: Waste Injection => Where Applicable - Grouping wetland BMPs – no need to have three, so combined three BMPs as one
• Feedback on spatial criteria: - Not using erosion t factor –USLE - Improving stream classification – Strahler Order - Changing soil classification – Hydrologic Soil Groups – NRCS
• Universal Soil Loss Equation (USLE) – An equation for predicting, A, the average annual soil loss in mass per unit area per year A = RKLSCP - R: the rainfall factor K: the soil erodibility factor L: the length of slope
143
S: the percent slope C: the cropping and management factor P: the conservation practice factor
• Strahler Order – Hierarchical ordering of streams based on the degree of branching. A first-order stream is an un-forked or un-branched stream. Two first-order streams flow together to form a second-order stream, two second-order streams combine to make a third-order stream, etc. (Strahler 1957).
• Hydrologic soil group – Soils are classified by NRCS into four hydrologic soil groups based on the soil’s runoff potential. The four groups are A, B, C and D. Where A’s generally classified as smallest runoff potential and D the greatest
• Feedback on spatial criteria for each BMP: - Using all soil for grazing management practices – not limiting soil type - Using a 100 ft buffer for vegetation buffers – 200 ft was not true
• Feedback on SWAT model outputs: - Using Loads and concentrations (cf. TMDL) – got concentration from SWAT model too and are considering both
• List of potential BMPs – pages 3-4 of note book - Low landscape position similar to flood plain
• Potential BMP sites: - Based on spatial criteria – location maps pages 13-28 of note book
• Give credit where credit is due – SWAT under BREC • Contour ripping/pasture renovation to maintain permeability of soils and
increase residence time of water on soils USDA (map page 19) C. Methodologies used to integrate feedback into prioritizing BMP’s
• Goal: Environmental improvement on Bosque River • Which BMPs should be implemented (results from last time)? • Where should we implement them (spatial criteria)? • Where is the priority? - North, Middle or South Bosque
1. Prioritizing sub-watersheds – methodology, factor/index, validity check 2. Prioritizing BMPs – which BMP should we consider first?
• Prioritizing Sub-watersheds (1): - Flow chart on page 30 - Top row – factors - Index – consider value (low, medium, high) - Summed all indices to get total index (low, medium or high priority)
• Prioritizing Sub-watersheds (2): - Factors: Current overload pollution; loads and concentrations (39 years of data)
• Prioritizing Sub-watersheds (3): - Sediment Load: 1 for values from: 24 to 18,660 kg; 2 for values from: 18,660 kg to 69,860; 4 for values from: 69,860 to 163,500 kg - Value indices are rated using a log base of 2 (similar to the NRCS Phosphorus Index) - If you improve watershed up stream it will decrease quality of watershed lower stream
144
• Prioritizing Sub-watersheds (4): - 10 to 14: Low Priority; - 15 to 20: Medium Priority; - 21 to 40: High Priority
• Prioritizing Sub-watersheds (5): - Comparison to current in stream water quality data - Problem: limited number of stations (23 of the 47 watersheds without stations) - Validity Check
• Prioritizing Sub-watersheds (6): - Integrating everything into total index – sum the factors and find natural break – simple sum, methodology, not rating yet
• Vietor: In summing, does it push the priority level downstream? Addressing lower priority upstream effects what happens downstream
• Consider this as cumulative. If we act on top of the watershed, we’re acting on bottom of the watershed as well.
• Vietor: Is this going to affect BMPs and can you make progress if this happens?
• Hauck: Because of adding concentration and loading last time, that’s what index gives, result of what happens. May need to deal with concentration to see how stream orders come out in index
• Dyke: With putting loading in it added more confusion. Need loading and concentration in separate maps.
• Comparing info across all sub-watersheds depends on priorities. A different BMP would lend itself to different analysis
• Srini: Should we treat rating factors equally? Do more rating to P? • Hauck: Project is not necessarily about P. Should be balanced, but the
reality is that P is the main factor and it’s the most difficult to manage • Munster: When you look at P there’s a higher priority upstream rather than
downstream • Hauck: Universal index becomes difficult; doesn’t deal with landscape
position • Srini: Take high priority. You cannot just work on that one area – has to be
all the medium ones also, so that means all of them • Vietor: If you have a shown high priority zone and have issues to deal with
that, how does that lead you to consider it medium priority too? • Srini: Not with way index was prepared. Like you said, medium affects high
priority downstream. Bring in more information to know what we need to do more of in medium priority watershed
• Consider impact index: are there things coming into watershed? Impact on concentration or impact considering loads? Then get index that shows priority. Of course it’s going to have more impacts downstream because everything accumulates and effects downstream
• Vietor: Is it possible with impact (water & dilution factor) as the index sorts it out, high impact zone is down low, depending on how much it gets

145
diluted, could dilute the effect that occurs upstream? Any evidence that’s occurring?
• Water quality station data, but don’t have many stations. Twenty-three of 47 sub-watersheds could have data coming from a water quality station. Consider as a validity check
• Sediment, N and P factors – total index, shows lower concentration impacts downstream; upstream high; use as validity check
• Jones: If you take this monitored concentration data compared to modeled concentration data, makes sense to do at top of watershed. Does it allow you do treat water that’s already in the water? If you’re trying to reduce concentration in the river water, you would want to deal with less river water rather than more river water, and you might argue to do that upstream as well, around Stephenville.
• Fox: Gives some guidance as to what’s feasible in certain areas of the basin. Helps guide as to what resources are necessary and what could actually be implemented. Can’t build 500 acre wetland, only 500 acre gully plugs. Helps figure out what can be done each year based on resources available
• Hauck: Hard to come up with universal index, but Paul’s idea of leaving concentration and loading separate allows us to weight things and add in other factors and judge information.
• Dyke: Critical need to display by per unit area. Will give you other issues when you get into how big of a wetland or area do you need.
• Hauck: Per unit area will be similar to concentration • Srini: Will have a lot of dilution effect • Jones: Any strong interest in very large, off/on-channel wetlands or
reservoirs that could process a large fraction of water in the Bosque? • Bragg: Did study and didn’t see feasibility of doing those from a dollar
standpoint. • Jones: BU/Waco Wetland at the end of watershed is really trying to respond
to that problem of removing water from river, treating it and releasing it back. But it seems to me that the question is do you want to duplicate or expand that substantially? What percentage of river-flow goes thru that wetland?
• Prochnow: About 11% of low flow • Jones: To treat a large fraction of nutrient/sediment that eventually make
way into Lake Waco you’d run out of money real quick • Fox: What they’re doing at Richland Chambers, would that be feasible on
Bosque? • Keating: Much better chance on Bosque of affecting higher percentage • Thrift: Is a lot of the land privately owned? A: Yes • Bragg: Two-mile floodplain on Trinity • Jones: Still have to pump a lot of water • Keating: You may have to pump some in there. Thinking of an oxbow with
150 acres, stand chance geographically to take 100+ acres and construct something you think would be effective for a wetland, primary way to get

146
low flows. Have to do something to keep colonization alive there. Not low maintenance.
• Jones: Any idea how many there might be? • Scott: Half a dozen or so • Jones: Any history of thinking about the oxbows or bringing oxbows back? • Munster: Experiment at Stephenville Research Center on wetland there. • Bragg: Final report at TSSWCB • Keating: Have to deal with priorities where we’d like to work, but areas
where we can work with people that will cooperate and work with us. • Jones: Does group think that considering those kinds of BMPs and actually
ferreting out where they might be is something that this project should do? Should we identify the available places and give a quick discussion of that as a BMP?
• Thrift: Need to remember this is private land, but if we were given money we could go forth and implement something. Again, it might not be feasible because it’s private land, but definitely something we should look at.
• Vietor: Use as reservoir or wetland? • Jones: Depends on landowner’s desire; if they want wetland have to look at
it, or if they want a pond, it’s a different thing. • Vietor: Serves as a demonstration point for change if it works well in a
setting. Take advantage of private enterprise and personal advantage. • Jones: Goes back to what USACE wants to do. These oxbows functioned
under natural conditions 150 years ago and were part of Bosque ecosystem. Do we want to restore this small component of Bosque ecosystem? My answer: Absolutely!
• Nichols: Want to look at what we could be producing • Munster: Use index to define priority watersheds. Factor in source of
contaminant and give a high weight to locations where the sources are located. If you can control it at the source, much better off than trying to control downstream where it has escaped. Consider factoring in the source.
• Can’t determine source point, but can determine most upstream high concentration sources
• Srini: Conclusion: Keep indices because concentration and load, and use per unit area for analysis for BMP to compare prioritizing the basin in the group of areas.
• Vietor: If you know watershed areas/concentrations or loads, and then express on area it’s associated with and the numbers high per unit area, like concentration, that’s a good indication.
• Srini: Do we need to be rating anymore or do we keep as is? • Jones: Take modeled weighting factor and split it into two – concern and
load – then reduce/change weighting factor for TN, TP and total sediment, then it will be analogous to this index and will work for comparison
• Hauck: Results from SWAT work for cumulative, but for landscape and going into sub-basin need complexity of individual area/landscape
• Srini: Debate on its own in terms of what kind of information and time
147
• Hauck: Lower portion dark red – whole watershed is contributing down there, gives good indication of N. Bosque experience.
• Harris: We’re talking about how you interpret data and implications of data interpretation. If you use load data for making BMP implementation only for those that deal with in-stream systems, you’re not looking at watershed because you know load from up above. If you look at concentration from watershed to larger water body look at other data. If looking at in-stream reductions, then those BMPs that deal with oxbows do look at loads and concentrations – partition out each one of those to look at those separately
• Dyke: Set up some criteria. If going to do oxbow BMP these are the criteria that would qualify oxbow treatment. What landowners out there would be interested in participating? Also, as we back up and look at sources higher in watershed, I think we can do that in a sense that you can set-up some straw-man kinds of criteria that if this is the BMP we want to look at, these are criteria (like selection criteria).
• Jones: Do we have a good floodplain map set for the Bosque (not just 100 yr) – 2 year kind of things for looking at wetland opportunities? A: Not sure.
• Consider three factors – sediment, TP and TN. Summing all of them with a weight gets impact index for concentration. On other side use loads, same three factors, load per unit area sum all equal weight and get impact index. Get two impact indices, determine where the priority is.
• Srini: Right. Like Dr. Harris said, use those indices for different BMPs – landscape/watershed BMPs, other in-stream loadings
• Vietor: Are you going to factor flow into this? Particularly load? • Srini: Not presenting anything, just say this is a candidate of something • Dyke: In addressing per unit issues – it might be as you’re building that
index you will want to display one as totally aggregated, and one by basin that relates only info in that basin and then one that cumulates it all down the system. You have it all there so you may as well display it both ways to see the whole picture to compare.
• Prioritizing BMPs – page 49: • Which watershed to focus on, which BMP to implement first. • On-farm – Educate farmer on how management affects stream, vegetative
cover and recharge structure • In-stream – Good feedback of stream bank stabilization and gully plugs;
constructed wetlands right under PL566 (three that had highest ranking) • Srini: As far as on-farm, in-stream and city BMPs, these are the priorities
based on second meeting results • Vietor: Councils play pivotal role in planning and administering funding,
and giving empowerment to various groups, and could be a focal point for education
• Hauck: Could be a good thought and feasible • Bragg: Something we’re very interested in doing. Against us has been
lawsuits back and forth and it wasn’t feasible. Some of those things are out of the way now and we can start moving toward that.

148
• There are five BMPs with high priority • Gully plugs: Could not locate with GIS model, trouble locating gully –
combination of erosion, slope, etc., but it’s not enough • Considering gully plug has high priority, don’t rely on what we have; we
need some field investigation. Field investigation is an important thing to think about for every BMP listed here to verify the issue.
• Fox: Baseline to provide good guidance tool to start looking at the landscape. Guidance of where to go to do field verification that has to be done. Don’t want to rely completely on modeling exercises to look at BMP, but it provides good starting point of where focus areas are to get on the ground.
• Vietor: Points us in direction of enriching quality of GIS map – increase density and quality of info in layers related to this.
• Dyke: Question of TIAER/Ft Hood, model isn’t sophisticated enough to provide info we need related to gully plugs. Do we have info of changes in water quality that have occurred where gully plugs are installed?
• Keating: They started to stop soil from moving and moved on • Fox: Water quality modeling in several places – watershed scale calibrating
prior to implementation and post implementation, combination of practices, 5 years of data before and 5 years after.
• Dyke: Any real-time data to grab as it’s coming in or going out? • Fox: Yes, installed an experiment like that this year, starting to address issue
to show efficiency of one particular gully plug. • Keating: It’s designed to last. Silt and plant colonies will create new issues. • Hauck: Each except city has one with a high number on it. It’s not a big part
of the watershed but one that contributes flow disproportionately. Rained two inches and part of watershed is still dry. Rain did runoff and set off samplers in Stephenville, but no flow downstream. Look at list to figure out any of the three to make one a nine or 10? Do we leave a large population out of the process?
• Dyke: Relevant question. Most know very little, default or no vote than area of importance. Many don’t understand issues of stormwater.
• Everyone has tendency if they don’t know about it to make it a medium priority
• Jones: Thinking about restoring watersheds, one thing to pre-western civilization conditions, one thing I would do is try to do something for stormwater runoff from impervious areas in the cities, because they weren’t there before. - Deal with both stormwater and sewage flows/treated sewage from cities because both are very different. The other thing is that the USACE may get some funding for the Meridian project at some point and their strong interest in putting treated wastewater thru a series of wetlands that are relatively natural, but an enhancement of something. - I would like to see us have a placeholder in our report that allows cities to step forward and say we want to treat our stormwater and/or do something additional to our treated wastewater.

149
• Fox: Early discussions of how do you go about that? How do you combine something like a pseudo-treatment wetland to use as nature center or educational center? What can you do to provide a benefit to the city? A wetland type of situation to be combined with some sort of natural history educational opportunity? Meridian came up as another way to use that treated water, wetland, golf course watering is way to bring community together with nature/community center.
• Dyke: Efficiencies of where we might treat some of those. Earlier we were talking about oxbows and catching water on acres. Stormwater discharge and potentially cities, if you have stormwater bypass that goes around sewage treatment, point sources and get heavy flows from that. - Take good look at where potential discharges are, maybe constructed wetland or oxbow close to that could be used to address those issues. Much higher concentration of a high flow area than you’ll find elsewhere in the watershed. - Catch a lot of this fertilizer coming out of the cities due to the impervious and pervious runoff. What could be constructed next to them to address these issues?
• Fox: When we first looked at map, two oxbow potentials were associated with Clifton and Meridian. Thinking about it from that perspective, might be worth some of the GIS effort to identify more than what we did on an amateur scale.
• Srini: Don’t know if GIS can help that. Point sources of eight cities. • Fox: Looked at as a relationship of the river course of itself. • Srini: If all cities try to do this operation, no water will go into Lake Waco • Nichols: Only cities in watershed, Lake Waco. Don’t know if two point
sources would address those problems. Using Meridian, have Moxon Creek that runs thru. Residents know it’s an issue with chemical pollutants, but how do you address it?
• Dyke: If rain comes and takes it to city/community, could be addressed as flow
• Srini: Not a point source. Many things can contribute • Jones: Would like to leave it open so if a city wants to address it we can add
it in, but it may not be feasible. • What do we do in cities? Add another BMP or reconsider index? • Harris: Take “treating storm runoff” and change to “treating storm runoff
and treated wastewater in retention ponds and associated wetlands” III. Ranking of PL566 structures based upon expert feedback from group A. Field Trip – Scott Keating
• Went into field and looked at ecosystems. • Questions from perspective of a raindrop. Bosque River Evaluation Infrastructure
Improvement PL566 Field Verification • Four hours at each stop, two stops • Stop 1 – not impacted by upstream dairies, southern Erath County

150
• PL566 built by TSSWCB(?), will last 50 more years, but would like the trees to be gone
• Tells story of holding capacity of soils – reputation to not hold water too good. Wonderfully engineered structure, but limestone outcrop doesn’t hold water well.
• 18 point checklist to go thru – looking for silting (some present) don’t know if it came from upstream or dam before being vegetated. Regardless, not much silt in 50 years; wonderful ground cover, soil integrity in place, road on top of dam in excellent shape, just take rooted trees out
• Drain – at one time carried more water than this. Water has been well over drain at one point. Has natural spillway, couldn’t find evidence that water was ever over the spillway
• No leaking, no seeping, no plant communities supporting constant water coming out
• Soil is not going to support what we’d like to think of as ideal wetland. Pretty good hay field right now. Ripping comes to mind, but will have low application on project because doesn’t do much for landowner. If he doesn’t get something out of this, project isn’t going to be a go.
• Visions of gated irrigation ditches, gravity flowing on whatever crop • Spillway – pretty natural, hard limestone, below spillway is hayfield. • Upper edge of mouth of creek (no water present). Some not so stable stream
banks, pretty good biomass cover up to spillway; rain come down and would hurt – needs stabilizing
• Supports a lot of biomass, but limestone doesn’t support pond. Can’t vision wetland we’d like to have. Can see check dams and gully plugs working there.
• Need to stop horizontal tree • Jones: If you put gully plugs across something like that, would silt get in behind it
and get vegetation around it? If so, would it hold? • Not sure. Velocity will come when raindrops gets into the channel. • Jones: Need multiple check dams to slow it down • Need 3 to 20 check dams depending, 5 to 6% slope every couple hundred yards • Fox: Also trying to manage the drop-off • Steal velocity, take it away • Vietor: Why put it there? Reservoir downstream hasn’t overflowed. What’s the
incentive to put it there? • For him: create wildlife habitat, duck hole; but good point. He needs benefits out
of this. • Harris: If I have $50,000 to build gully plugs, why put in this catchment? Why
not move over to next watershed that doesn’t have 566 structure • Jones: Other areas don’t have 566 structures. So why not go to a different
watershed that does NOT have a 566 structure? • Dyke: Representative of if the first picture reflected much sediment or not?
Depends on how deep it was before completed the dam. Regardless there are other 566 you do have issues in, other streams can reduce filling of 566 structure so you don’t have the sediment
• It’s case by case and site-specific

151
• A lot of groundcover • Jones (to Tim): There’s no issue with NRCS/SWCD if you did something above a
566 structure? Not on the plot of land 566 structure’s defined by? • Dybala: Obtain land rights when constructing structure, rest is private. If proved
conservation treatment, that’s better. When you put structures in must have treatment; if they don’t have treatment not as effective because it silts in later on
• Prochnow: May be source of sediment because carrying that much of a load and that size gravel; if put check dams in they won’t last as long because of that size of load. A lot of material would have to come out before it would be stabilized.
• Fox: Hopefully what will be prompted is what will be necessary to stabilize this dam. From what you’re saying, the check dams will fill up and wear out, so what are some other BMPs?
• Prochnow: Dallas area came up with a way of fixing these types of dams, but costs a lot
• Deep turn, need to change; mid succession grass, ecosystem in middle – half that’s healing or half that’s degraded; see slopes
• All rangeland on this structure • Don’t see range sight doing more than growing the vegetation it is now • Fox: Consider small size of this tributary, scale up as move to stream bank
stabilization; one area of major BMP is stream bank stabilization • Dyke: As you start stabilizing stream banks and moving system down, hydrology
guys say if you don’t do something about speed and energy levels it will erode downstream and take out stream banks. Doesn’t mean it will be clean if you don’t consider reducing energy level because it will collect other issues.
• Branch going to west, different soil type, may be able to hold water, could be a pond
• Below 566 (hayfield), canalized irrigation might fit there • Harris: Why would you want something that doesn’t hold water? • Wouldn’t want to do that on this area • Dyke: Is there any water leaving 566? No. • Harris: 566s were not designed to hold water; designed to be leaky bottom
structures • Dybala: Some are made to hold water, others aren’t. Depends on the structure • Hauck: Most hold water. • Harris: But it’s not their primary purpose, not a poor design, as long as it doesn’t
harm dam structure • Fox: Points they’re pointing to as a guidance to say here’s one, even if you look at
second to last page, actually came out as medium in arbitrary index. Doesn’t have major issues at the top, has other characteristics to make it show up on a yellow flag.
• Stop #2 – heavily impacted by upstream dairies, northern Erath County, 3,840 acre watershed
• Stopped here on tour in February (Meeting 1), mostly sandy country, carrying more water
152
• Neat idea, collection pit, only hydric soils this end of county, half acre of pond used to irrigate fields, good hay farm, sandy to fine sandy soils, only hydric soil over spillway below dam with pipe going to it is overflow/principal spillway from the dam itself
• Can see tree farms down here, good hay farm; down from the dam about quarter of a mile, can see more of a sloped landscape (~2%), terrace
• Didn’t understand bare, plowed field from top of dam (Edge of Blackberry’s field)
• Do have tree farms • Junot: Tension of water, especially as seepage field, does it affect TDS in terms
of sediment contact? A: No issues of salt in this; not close to salinity. • Hauck: A number of years ago there was a salinity issue, but not so much
anymore. B. Guidance Index – Julie Villeneuve (TAMU SSL)
• Page 52 – Map of Field Trip Stop #1, corresponding pictures on page 53: no dairies or WAFs
• Page 54 – Map of Field Trip Stop #2, corresponding pictures on page 55: WAFs and dairies inside the watershed
• Need state of structure – guidance index will help show us which structures to focus on
• Data considered for each PL566 drainage area: Slope (%), USLE, percentage of Hydrologic soil group, percentage of land use/land cover, area, presence of dairies and WAFs (40 PL566)
• Excel spreadsheet – page 58 • Guidance Index for PL566 Structures – page 59 • Detail value, most between 5 and 7% • Summed all indices to get the guidance index • Focus on getting into the high priority structures and develop relationship with
landowner to look at the structures • Page 60 – Lists the 40 PL566 structures, guidance index and priority of each • Srini: Need participation from farmers/landowners to get inside and evaluate
structures • Consider presence, not density, of WAF • Page 57 – Map of PL566 locations • Ranking is very diverse • Only guidance, not a priority of where structures need to be addressed
immediately; gives idea of where to go on the ground first before going to lower indexed areas
• Jones: If we wanted to engage the responsible parties for these 566 structures, the people who currently have the responsibility to maintain the facility/structure, would these mainly be county contacts? Would we go to the county judge in most of these cases?
• Dybala: Not familiar with sponsorship...could be city, county, district. Contact Steve Bernard’s office – he has access to and control of all the watershed plans and he can tell you who sponsors which watershed

153
• Jones: Next want to talk to people in the county and talk to local sponsors • Harris: The 566 protected watersheds are not the priority watersheds because
they are protected watersheds; it’s the other watersheds that are the problem. • Srini: At the same time, if you don’t maintain the watershed that is in danger of
accumulating the water quality problems • Harris: Significant need for good O&M, but watersheds contributing most of the
P and nutrients are on those watersheds that do not have 566 structures • Fox: It’s a situation where again, are there some precautionary types of BMPs that
would be relevant for these situations that are low cost that ensure longer lifetime • Harris: You have a catchment facility that is heavily calcium charged because of
the nature of the watershed, you have a lot of pre-calcium and solution, a lot of precipitation of P and removal of P from those waters contained in that facility and slowly percolates from layers to groundwater. If you look at watershed, from my perspective, you don’t need to put your money into those watersheds, look at the next watershed that doesn’t have those 566 structures to reduce erosion and runoff from application fields, not those within the 566 structures.
• Srini: Based on work Larry and others have done, going to principal spillway, concentration matters in P and water quality parameters high could be leaking down stream system and could end up in the Bosque and other rivers.
• Harris: Needs to be constructed wetland at end of spillway instead of running into stream
• Dyke: My recollection is, when looking and talking with Steve after first meeting about 566 structures, everything designed was built in area of the North Bosque. If you mapped the drainage areas of the 566, most of the land area in that is presently protected by 566. There are not drainage areas that don’t have 566 on them. In principal I agree, in practice I think there’s areas that aren’t treated.
• There were specific BMPs related to the PL566 structures, related to the sub-watershed
• Srini: Harris’ point is well taken • Dyke: In general, do the 566 structures have what percent of the annual runoff
would go thru the primary runway and go in stream? (Don’t know). Were they designed to let a small percentage thru or slowly seep?
• Srini: It takes about 10 days for water to go from start to principal spillway • Dyke: How much of annual runoff would be let thru the dam of that? How much
bad stuff leaves thru spillway? • Srini: Waste application not protected by PL566 structures. • Bragg: Structures are 50 years old, not saying they won’t be good for another 50
years, but they may not be. Need structures in the future. • Keating: Knew they were built for 50 year life and it has been 49+ years, so we
went to see some representation of it. • Dyke: We do not want to ignore the fact that there may be modifications either the
way the spillway was originally designed, modifications of that to provide more control because it was an old design; put gates on them, raise them higher, etc. Are there other things that could be added that would help manage it better?
• Bragg: Local sponsor in Erath is with SWCD and he takes good care of it
154
• Fox: Some BMPs were directly associated with a structure that led us down this path. How do we index or guide someone to think about those particular BMPs in a watershed? There are other issues outside of the most well publicized issues that could be considered for these types of programs too.
IV. Timeline of activities after final meeting to finalize report
• Srini: Have good feedback this morning. We will include the indices Julie prepared and rework that to do those indices again and start writing a report of what we found in this whole analysis. We’ll get back to you by end of July to beginning of August to comment on that all. Two weeks time to get feedback before sending draft report. That’s where we are right now. Ask Allan to talk about where we go from here, where Nicole is going to be?
V. Open discussion on “Where We Go from Here”
• Jones: Go ahead and immediately have a small group write the first draft report including data. Take the first draft out to this committee as quickly as possible and to the USACE. Move the report forward. Then I would like to, possibly at the same time, try to figure out how to engage a discussion, especially with the USACE, and also the remaining group, on what you feel we need to do for the next phase of the project. - We have about the same amount of money for another year coming from the Department of Energy, and how we use that to compliment whatever the USACE may be thinking of doing that’s related. - And I guess Michelle, what would be the best way to engage you and Becky? Sit down and talk about it? Telephone? We’ll make ourselves accessible. - Create detailed work plan of what to do for next phase. Input from committee about any thoughts you have and whatever options the USACE may be thinking about over the next 24-36 months, things that could benefit from us fine-tuning our analyses. - We’re committed to getting the first draft in by the first of September, but I would imagine we’d have it in long before that. - The things I’m thinking about for next 12 months using funds that are already/will be available are discussions with the county leadership and the county, city and district leadership in these counties, education programs that talks about our project and what we’ve been doing, any additional analyses that would allow us to estimate how much we could improve the situation, however we want to improve and define situation (say we had $10 million). I would like to see what others are thinking
• Thrift: What are the Department of Energy’s (DOE) criteria? We’re charged with making the watershed better, not just about P. - Thank you all for participating. This is our opportunity to make a difference in this watershed. What you’re saying for the next phase, I definitely see the educational pieces you were talking about as vitally important. What would make this watershed better, what would make water quality? More education, more buy-in... We’ll have those partnerships with community and landowners. Have
155
money to review from DOE, so with educational piece, look at it as good money to spend so we don’t have to spend it later on with next funding.
• Jones: This is a Congressional earmark. If we don’t get out there and engage community leaders who typically talk to Congressman and Senators, and don’t engage public for support, then chances of getting large project are made substantially smaller. I think that would be very useful and if we’re going to convince appropriators/authorizers that this is a good project, we need projected impacts. If we do “this,” “this” would be the impact...
• Thrift: May get public input from that, give us public interface done; new issues can tend to come up from public.
• Jones: Public meetings using Extension, SWCD, involving NRCS, BRA and USACE; do you see the willingness to participate in small meetings with county leaders or public meetings? Any red flags? If you feel like organizations will be willing to sit down with county judges and leaders, then we can go ahead and think about how we can get that done. Wouldn’t want to schedule anything where you’d be too hesitant to be there.
• Hauck: I don’t think TIAER would have any problem at all. Public interface narrows down...I can see just you guys, a very few people presenting than a bunch of experts. Don’t see a big role for a lot of institutes in the public process.
• Jones: If we go talk to county judges, may want someone from BRA or NRCS depending on relationship; or if we’re having a public meeting in Hamilton County we might want to be careful of how we portray it
• Thrift: One of the final deliverables is a power point presentation • Fox: Try to get a cursory view of what people in the watershed might be thinking.
How much interest would be for different things? Not specific questions, but if a program like this were to come into being, would you be interested in participating? Overview survey types of things. Goes in line with community/county leaders if we wanted to get the pulse of the public itself
• Bragg: Talk to County Farm Bureau with landowners....if program were available, what would we need to do to make you interested in a program like this?
• Jones: In course of next year, continue where we’re headed now. This time next year could be assured we have a very good lead on public and leadership interest. - No problem getting newspaper stories, we could draft some materials to give to newspapers to get out. - What is best case scenario for timing for authorization and appropriations?
• Thrift: Earmark FY08. Will get back to you on that. They’ve just gotten appropriations for FY07 just the other week – told what they were getting for various things – so I’d have to get back to you on that.
• Jones: Need to develop an appropriations strategy for FY08. Yesterday submitted thru A&M process. BRA and USACE process, if we could share the information that we’re sending in, if we could do things to develop the same language, title and request info for FY08 (this summer and early fall) and get up and organized that way, I think that would be very helpful because then we could talk to our appropriating Congressman with one clear vision. Asking for help in watershed, not for yourself. Can share materials by e-mail. Have a couple months to tweak
156
and get in if you want to make some suggestions. We’ll send our language we have as a placeholder right now.
• Thrift: I will link you with the guy in our office that works with things like that. • Jones: All need same title, same amount, same number of years • Harris: Need something to document what the dollar amount will be and
documentation to show how PL566 structures reduce nutrients, show unprotected areas, etc.
VI. Closing Remarks – Allan Jones, TWRI
• Can we work with City of Waco and BRA to get some numbers and maybe some support? February/March of next year is when we need some real, hard numbers. When we sit there we’ll say $10 million over 5 years will buy you this... a percent reduction in X, Y and Z. It’s important we all say the same thing.
• Prochnow: We’ve been running fantasy numbers, have estimated reductions, haven’t been published yet
• Would be nice to show: BU studies indicate, TIAER studies indicate, etc. to show we’re all involved, in support of this and are all going to benefit. But if they get the idea A&M is asking for something or that BU, or TIAER or the USACE would like to do then that’s a bad deal because they don’t want to choose sides. - I would like to jointly work on this document and get our input all together so when it gets to the key offices up there they see we’re all involved.
• Keating: May want to do some canvassing of newspapers, put out a story, educate the public... they’re slow to take it on... landowners are already burdened on what they HAVE to do... to counter that, put out a massive informational campaign
• Thrift: I would like the whole group to look at the outline ya’ll discussed putting together.
• Fox: Thanks to BRA for hosting us and letting us sit down and do this. • Srini: Thanks to all the experts for coming and giving us their open, unbiased
opinions. 2:00 p.m. – Adjourn Meeting
Feed Back from Meeting # 3

157
• Three independent impact indices should be calculated:
1. one using concentrations 2. one using loads 3. one using loads per unit area
• For each index, only three factors should be considered: 1. TP 2. TN 3. Sediment
• Everything else has been approved by the expert panel
158
Bosque Meeting #3 June 22, 2006
Brazos River Authority – Discussions

159
160
Meeting #3 Maps
These maps are revised versions of the maps presented in Appedix V. Feedback from the scientific advisory committee was used to update these maps. This set of maps is considered the final set for determining potential BMP locations. Water quality index maps were updated after the third meeting and are presented in the last appendix of this document.
Criteria Used in GIS Spatial Analysis
BMPs Sub-basin Factors
Water Quality Indices

161
Criteria Used in GIS Spatial Analysis

162

163
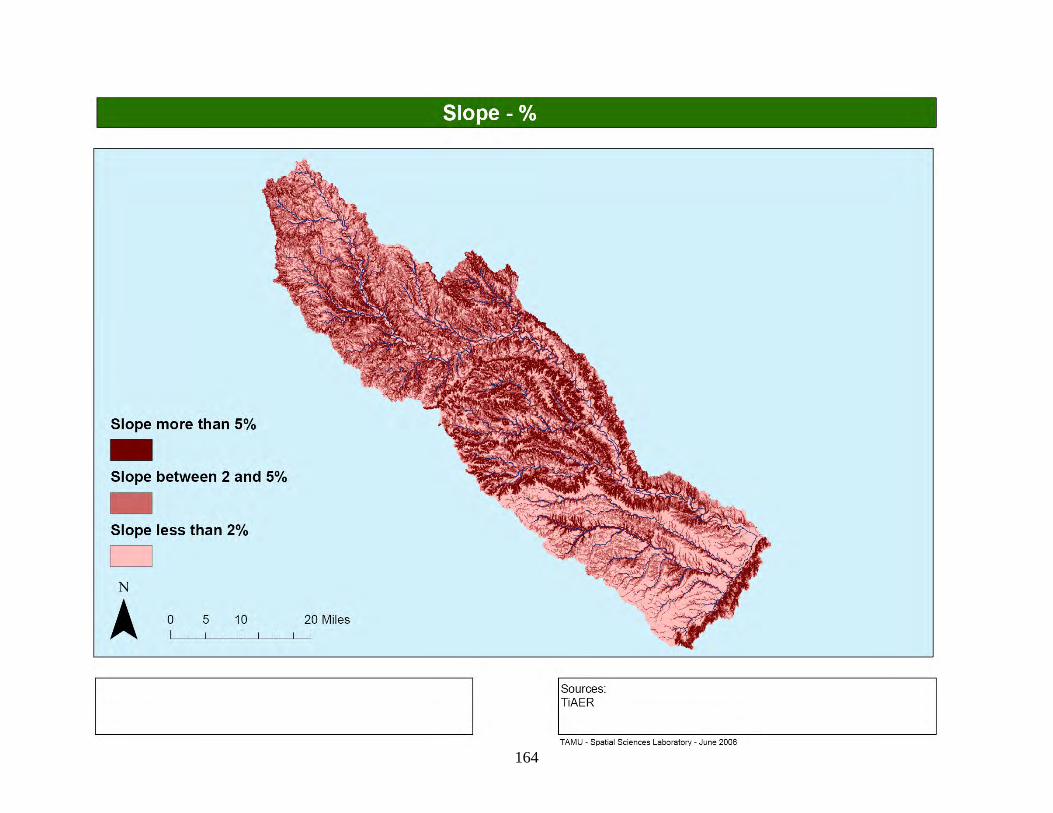
164
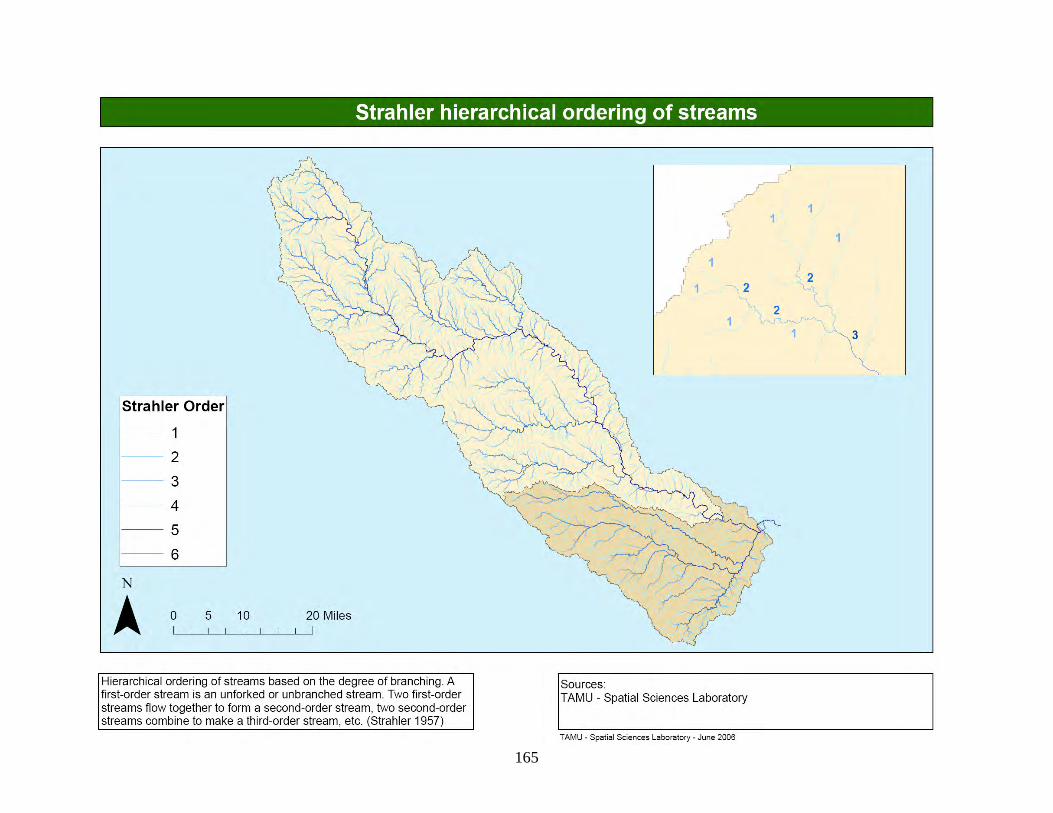
165

166

167
Highlighted stream segments represent ideal locations for installing permeable reactive barriers or check dams based on stream order
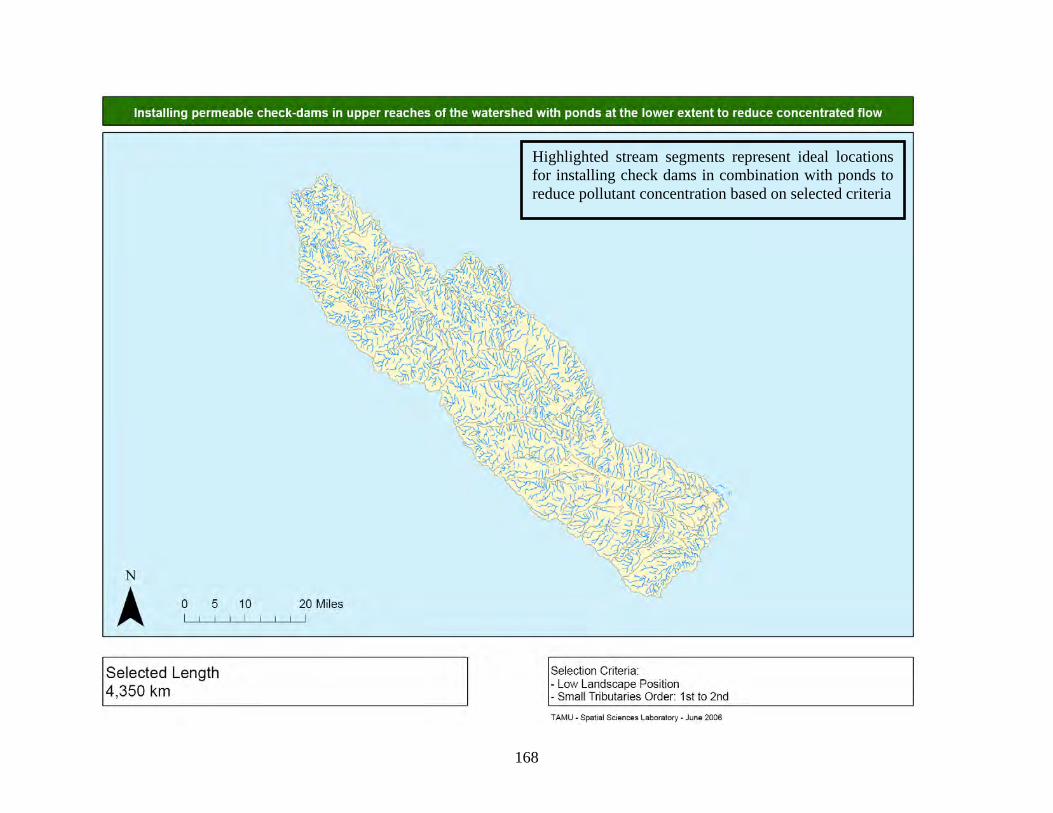
168
Highlighted stream segments represent ideal locations for installing check dams in combination with ponds to reduce pollutant concentration based on selected criteria

169
Green areas represent ideal locations for applying chemical to fields with high P solubility based on selected criteria

170
Green areas represent ideal locations for implementing sub-watershed soil conservation and erosion plans based on selected criteria
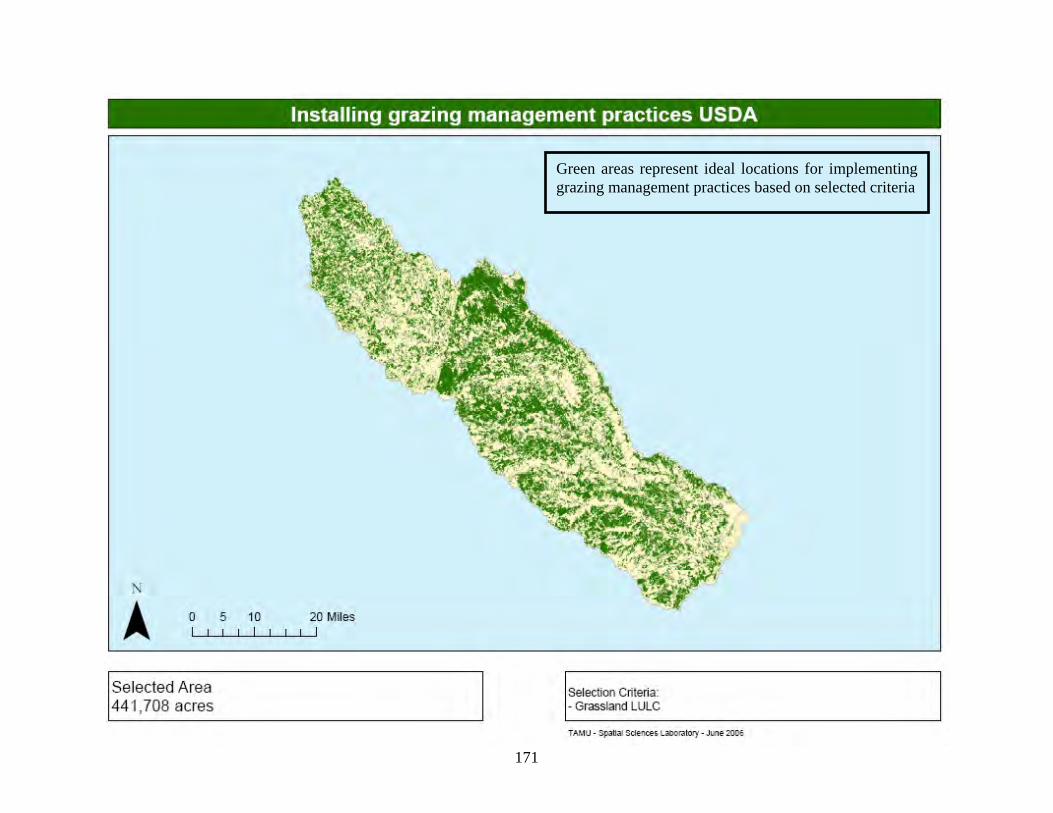
171
Green areas represent ideal locations for implementing grazing management practices based on selected criteria

172
Green areas represent ideal locations for damming ephemeral gullies or installing gully plugs based on selected criteria

173
Development of nutrient management plans in the green area below is a feasible BMP based on selected criteria

174
Green areas represent PL-566 structures and their associated lagoons in the watershed

175
Green areas represent PL-566 structures and their associated lagoons in the watershed

176
Green areas represent ideal locations for developing recharge structures to reduce runoff and sediment based on selected criteria
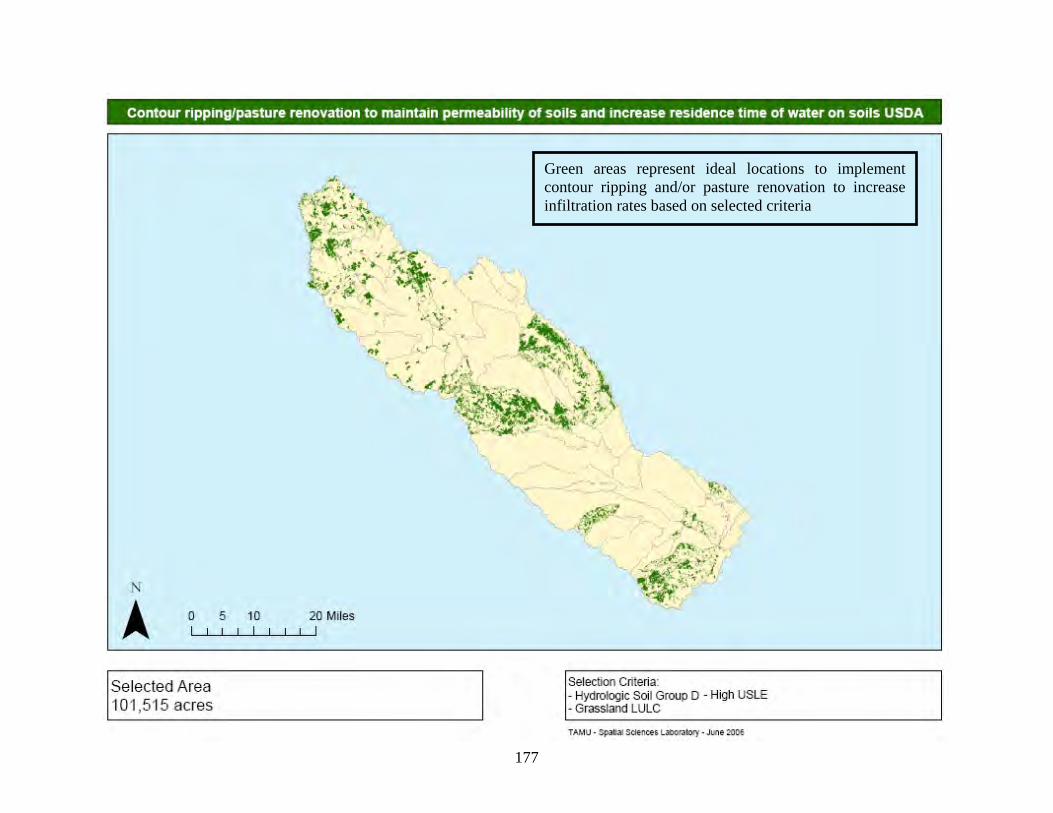
177
Green areas represent ideal locations to implement contour ripping and/or pasture renovation to increase infiltration rates based on selected criteria

178
Blue stream segments represent suitable locations for implementing streambank stabilization based on selected criteria

179
Green areas represent feasible locations for terracing to reduce sediment transport based on selected criteria
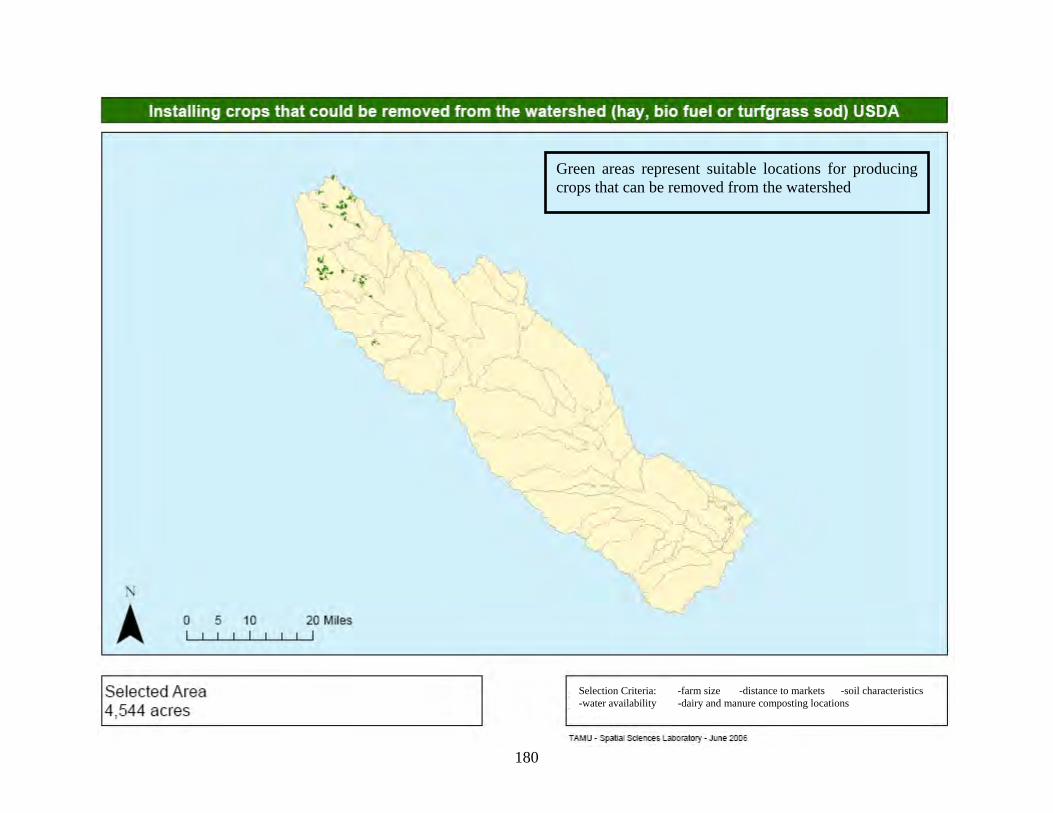
180
Green areas represent suitable locations for producing crops that can be removed from the watershed
Selection Criteria: -farm size -distance to markets -soil characteristics -water availability -dairy and manure composting locations

181
Green areas represent suitable locations for installing vegetation buffers based on selected criteria

182
Green areas represent suitable locations for constructing wetlands below PL566 structures based on selected criteria

183
Sub-basin Factors
Index assigned to each sub-basin based on its cumulative index scores from load and concentration indices

184
Index assigned to each sub-basin based on its organic phosphorus concentration in kg/m3

185
Index assigned to each sub-basin based on its annual organic phosphorus load in kg

186
Index assigned to each sub-basin based on its sediment concentration yield in kg/m3

187
Index assigned to each sub-basin based on its annual sediment load in kg
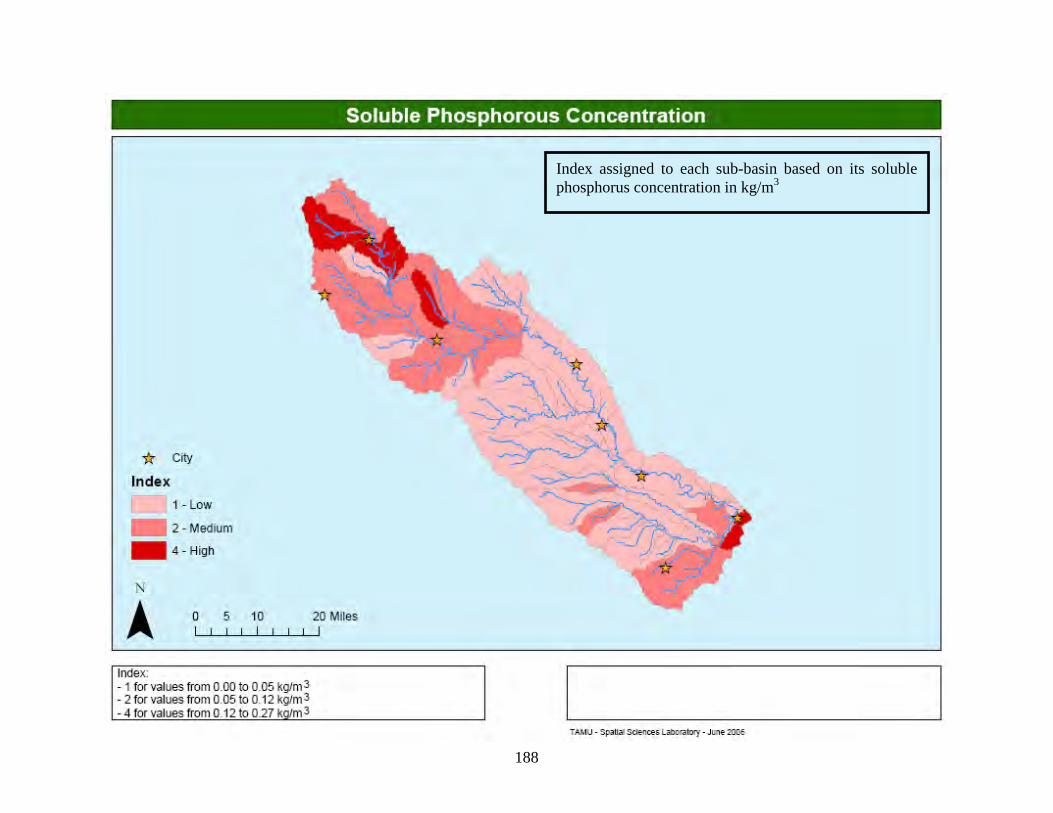
188
Index assigned to each sub-basin based on its soluble phosphorus concentration in kg/m3
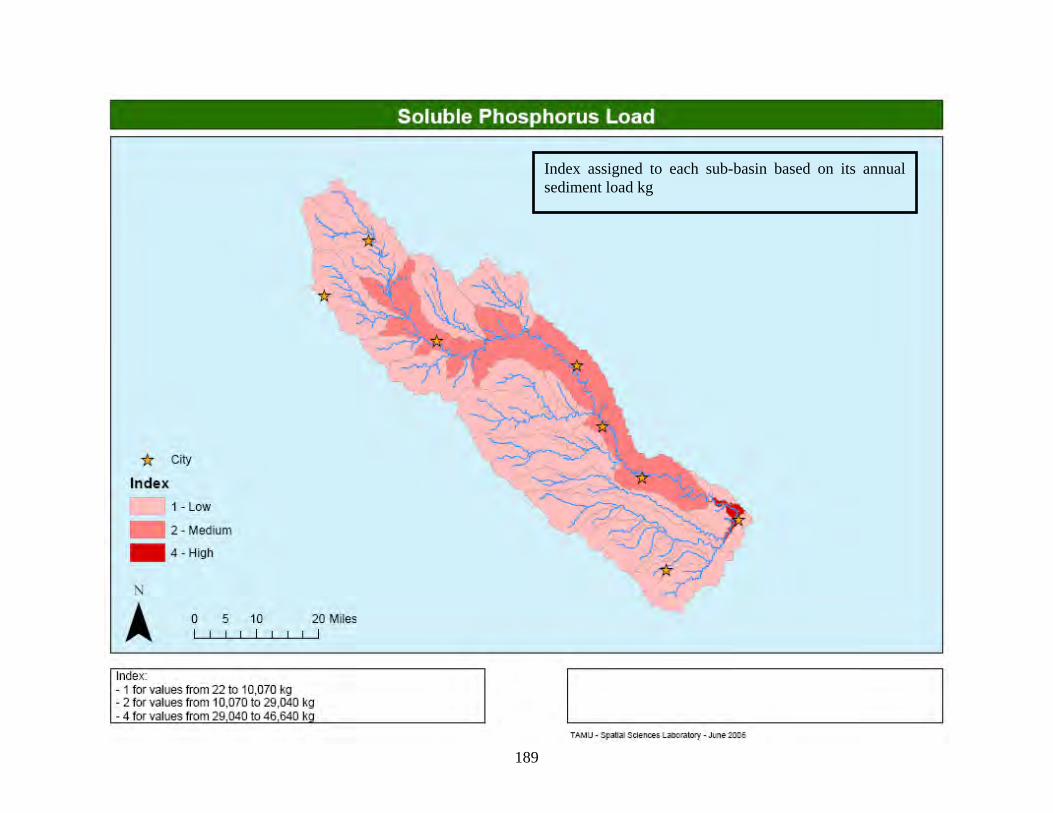
189
Index assigned to each sub-basin based on its annual sediment load kg
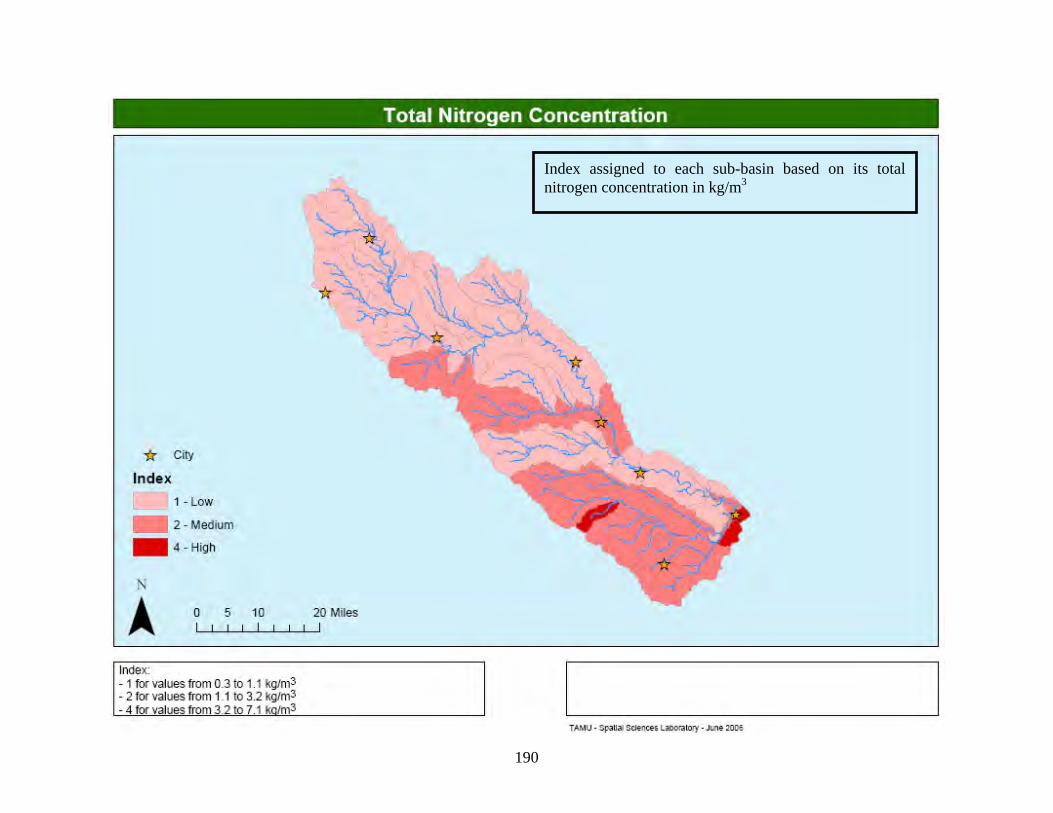
190
Index assigned to each sub-basin based on its total nitrogen concentration in kg/m3
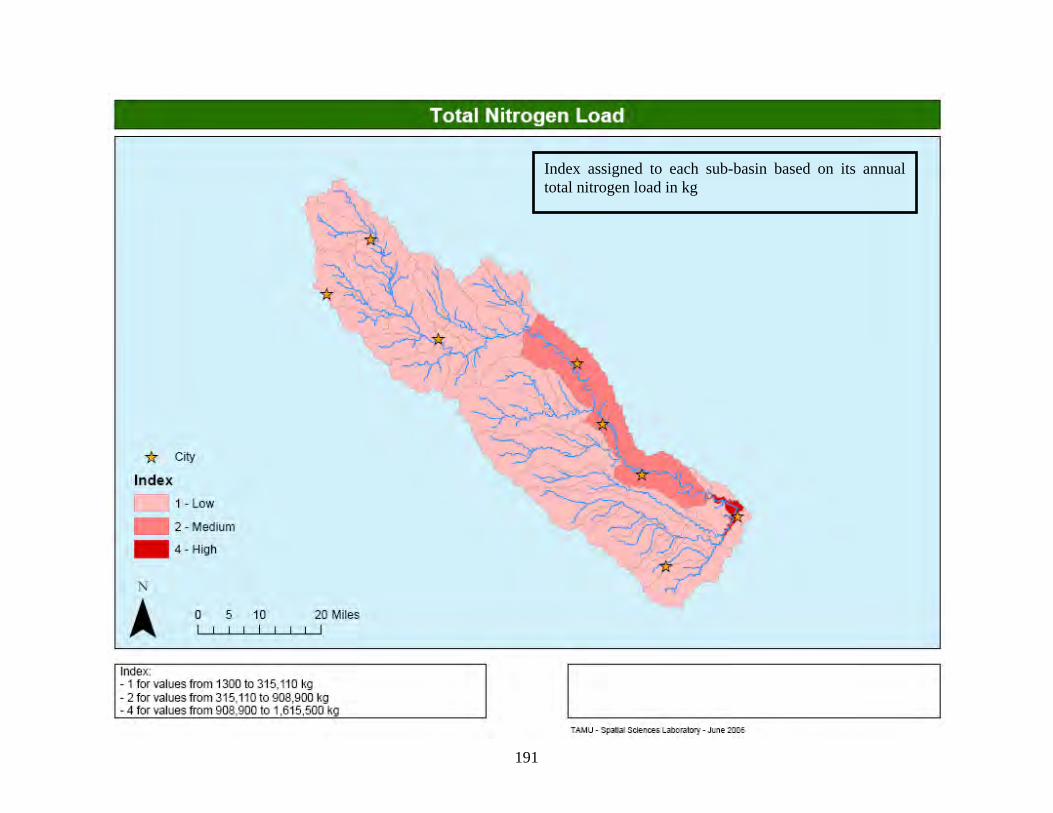
191
Index assigned to each sub-basin based on its annual total nitrogen load in kg
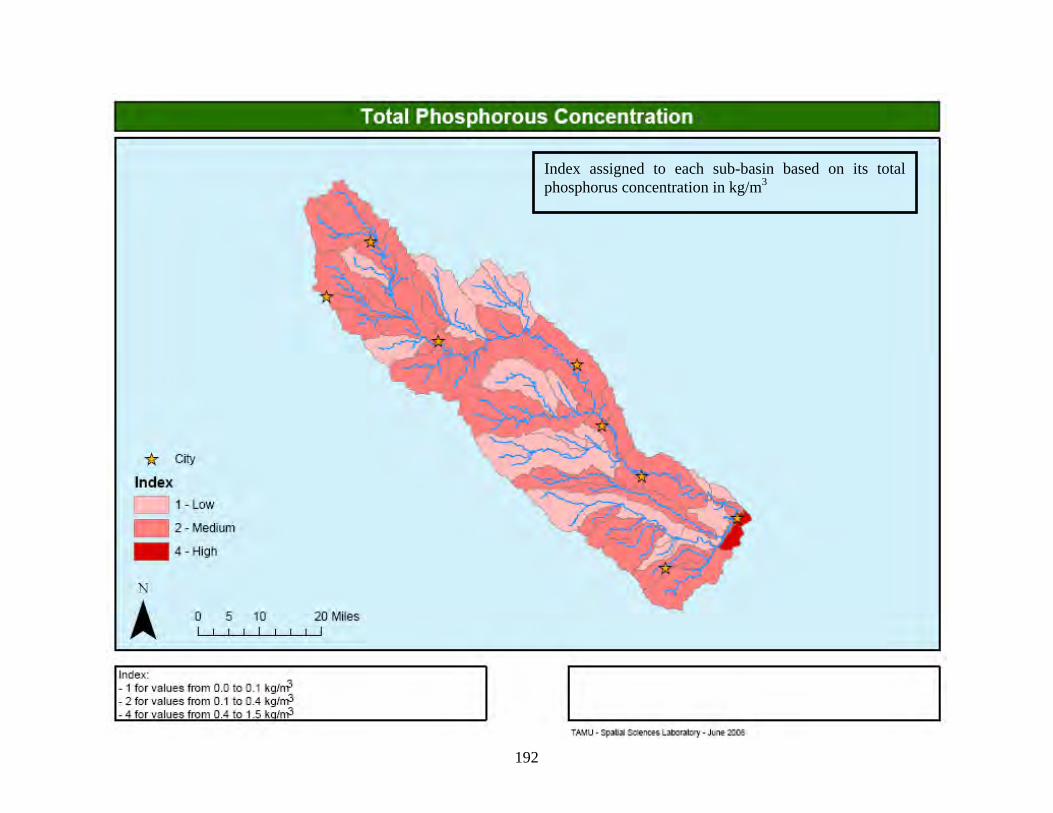
192
Index assigned to each sub-basin based on its total phosphorus concentration in kg/m3

193
Index assigned to each sub-basin based on its annual total phosphorus load in kg
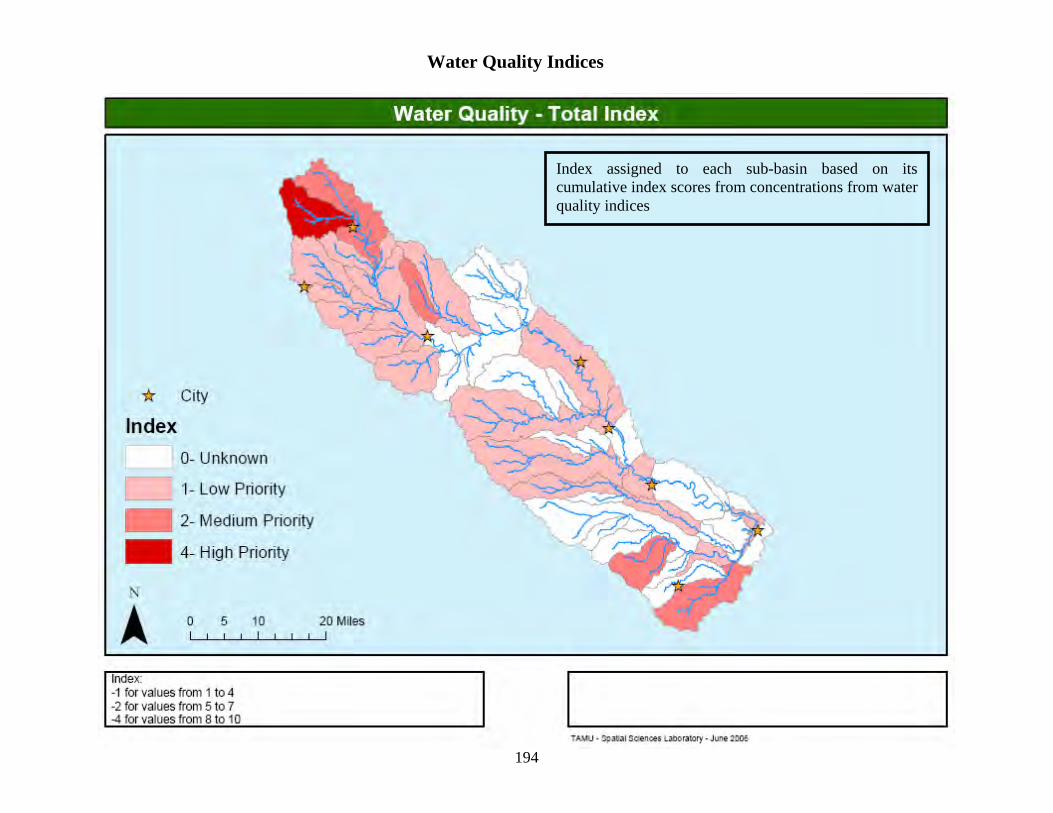
194
Water Quality Indices
Index assigned to each sub-basin based on its cumulative index scores from concentrations from water quality indices

195
Index assigned to each sub-basin based on its total nitrogen concentration in mg/L
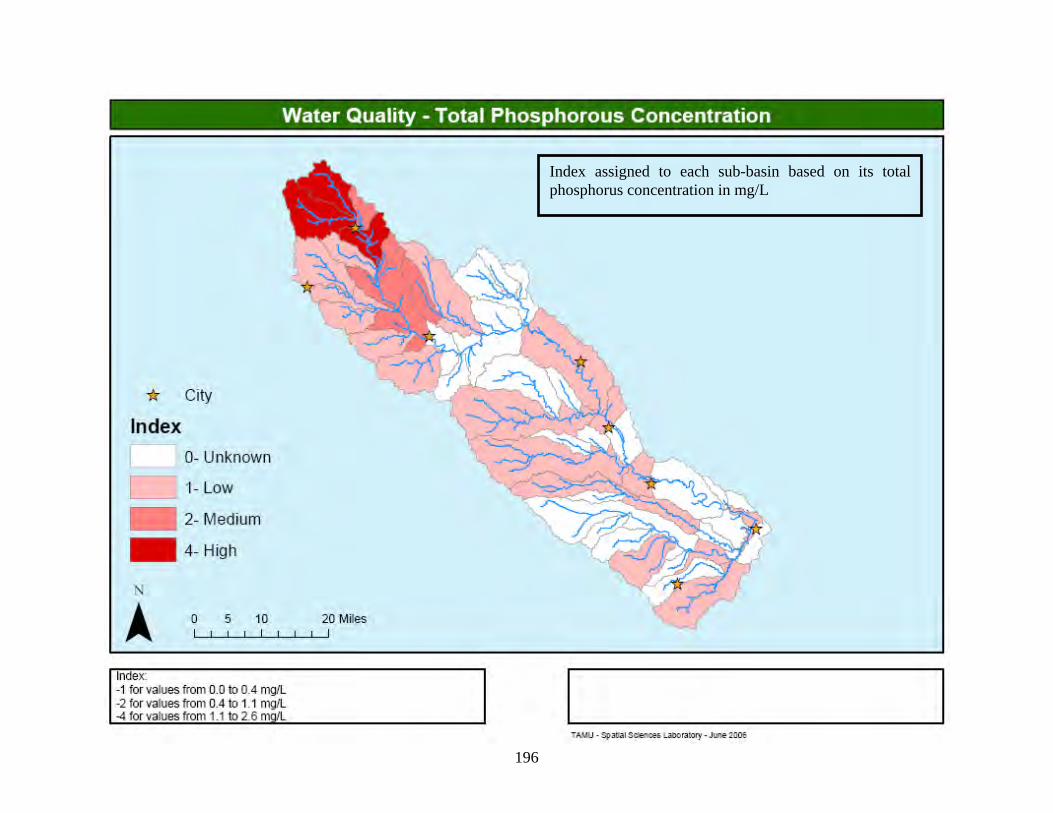
196
Index assigned to each sub-basin based on its total phosphorus concentration in mg/L
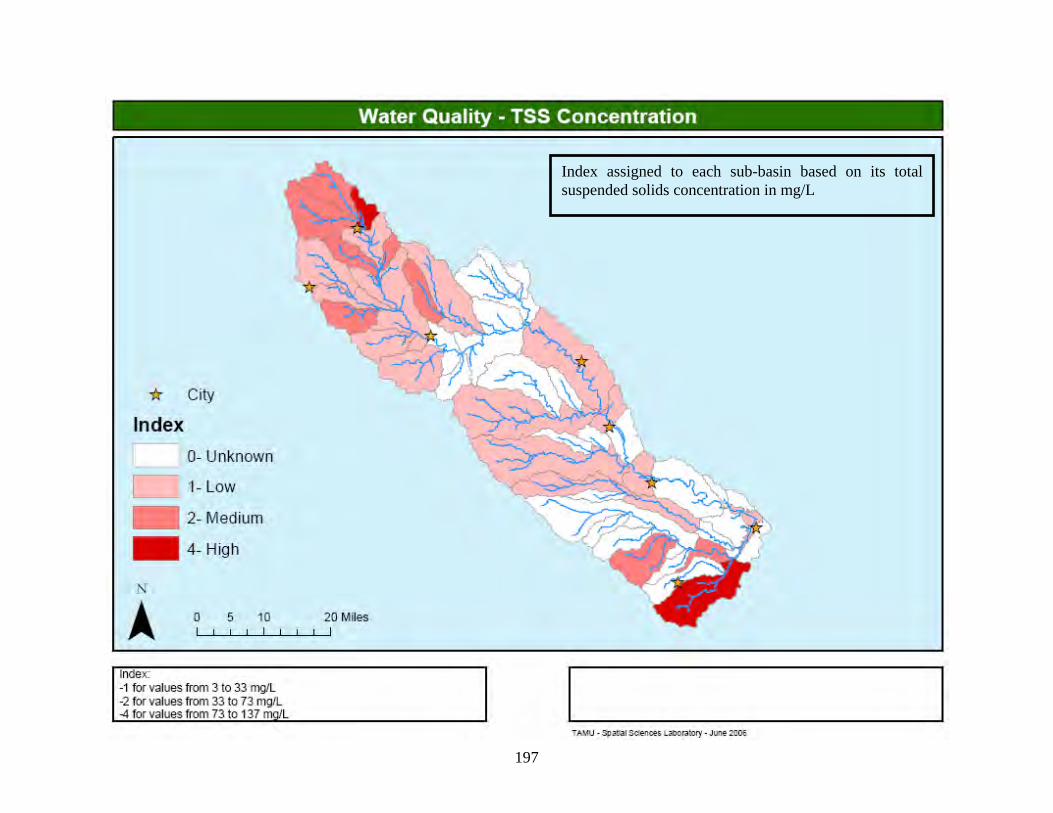
197
Index assigned to each sub-basin based on its total suspended solids concentration in mg/L

198
APPENDIX VII
Complete Meeting Attendance List

199
Bosque Meetings - Spring 2006 Complete Participant List
Name Organization E-mail Susan Baggett USDA-NRCS [email protected] Linda Beasley Waco Chamber [email protected] Jay Bragg BRA [email protected] Stoney Burke Congressman Chet Edwards Office [email protected] Tom Conry City of Waco [email protected] Tim Dybala USDA-NRCS [email protected] Paul Dyke BREC [email protected] John Ellis BRA [email protected] Sam Feagley Texas Cooperative Extension - TCE [email protected] Maggie Forbes UTMSI [email protected] Bill Fox TWRI [email protected] Tom Gerik BREC [email protected] Lucas Gregory TWRI [email protected] Becky Griffith USACE [email protected] B.L. Harris TWRI [email protected] Larry Hauck TIAER [email protected] Allan Jones TWRI [email protected] Steve Junot City of Waco [email protected] Scott Keating TWRI [email protected] Armen Kemanian BREC [email protected] Bruce Lesikar Agricultural Engineering TAMU [email protected] Ned Meister Texas Farm Bureau [email protected] John Mueller NRCS [email protected] Clyde Munster TAMU-BAEN Department [email protected] Lee Munz TSSWCB [email protected] Daniel Nichols Congressman Chet Edwards' Office [email protected] Matt Phillips BRA [email protected] Shane Prochnow BU [email protected]
Thad Scott Center for Reservoir and Aquatic Systems Research - BU [email protected]
Raghavan Srinivasan TAMU SSL [email protected] Danielle Supercinski TWRI [email protected] Michelle Thrift USACE [email protected] Don Vietor Soil & Crop - TAMU [email protected] Julie Villeneuve TAMU SSL [email protected]
Jeff Walker Texas Water Development Board - TWDB [email protected]

200
APPENDIX VIII
Final Maps
Impact Index Maps Load per Unit Area Factors
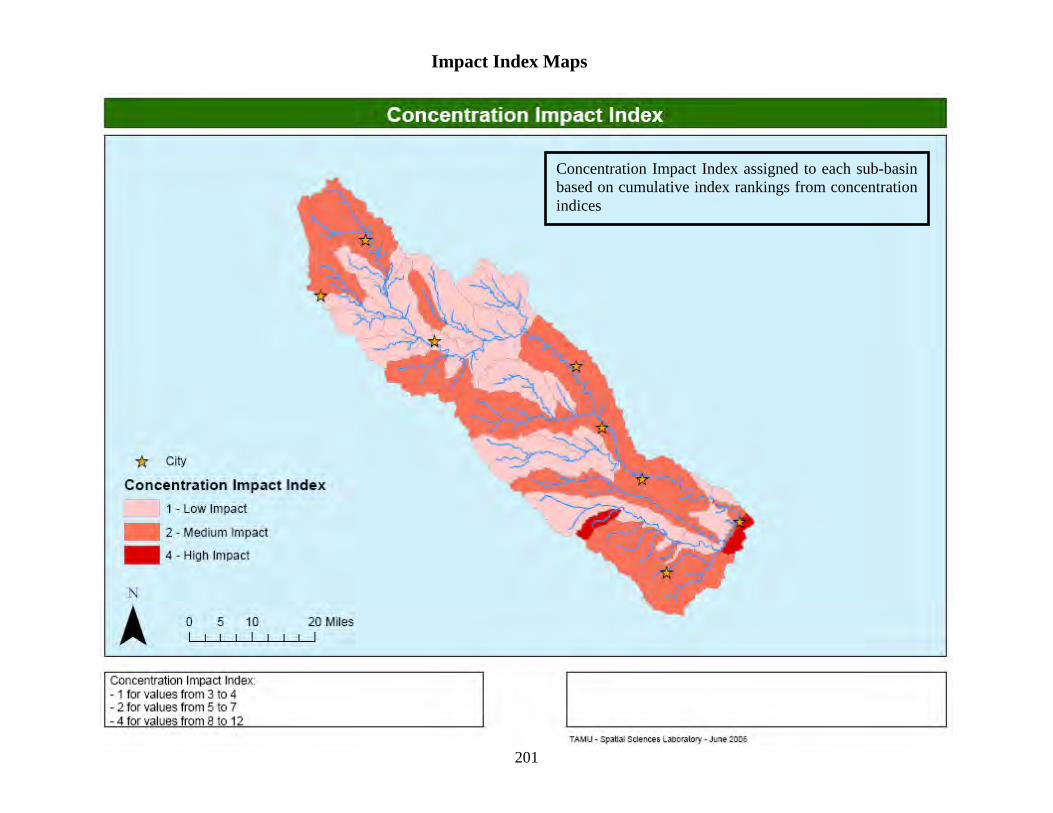
201
Impact Index Maps
Concentration Impact Index assigned to each sub-basin based on cumulative index rankings from concentration indices
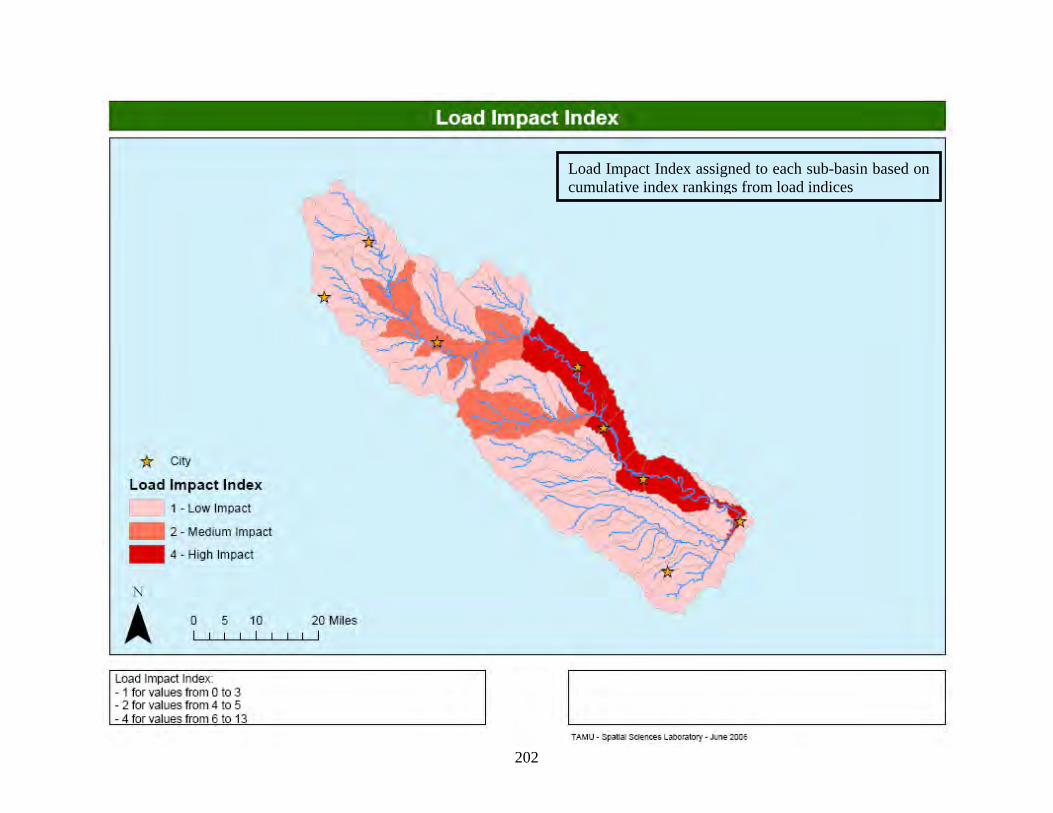
202
Load Impact Index assigned to each sub-basin based on cumulative index rankings from load indices
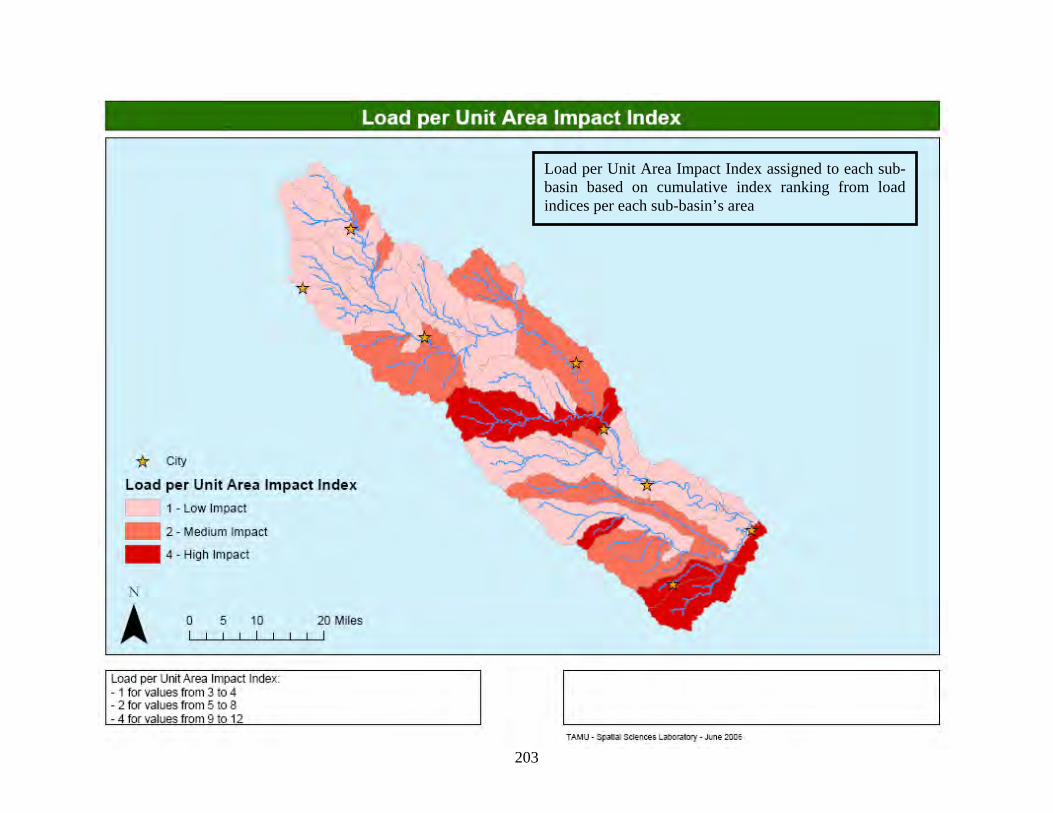
203
Load per Unit Area Impact Index assigned to each sub-basin based on cumulative index ranking from load indices per each sub-basin’s area

204
Load per Unit Area Factors
Sediment load per unit area index assigned to each sub-basin based on annual sediment yield per acre
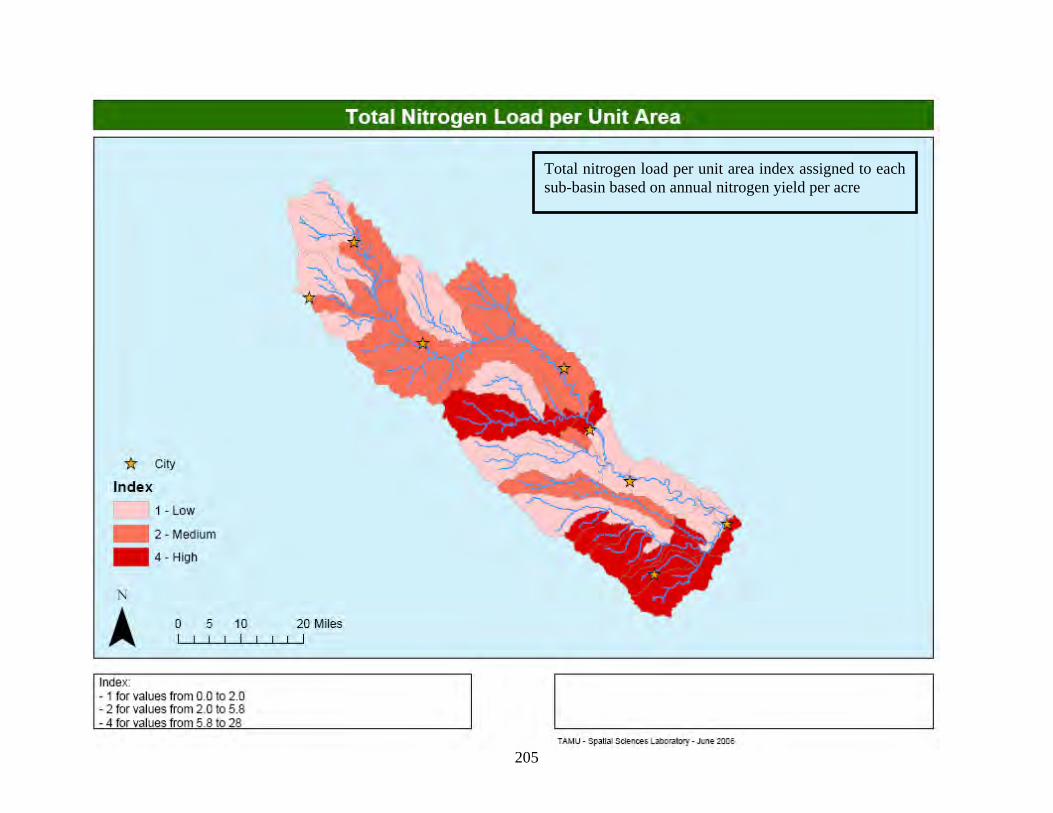
205
Total nitrogen load per unit area index assigned to each sub-basin based on annual nitrogen yield per acre
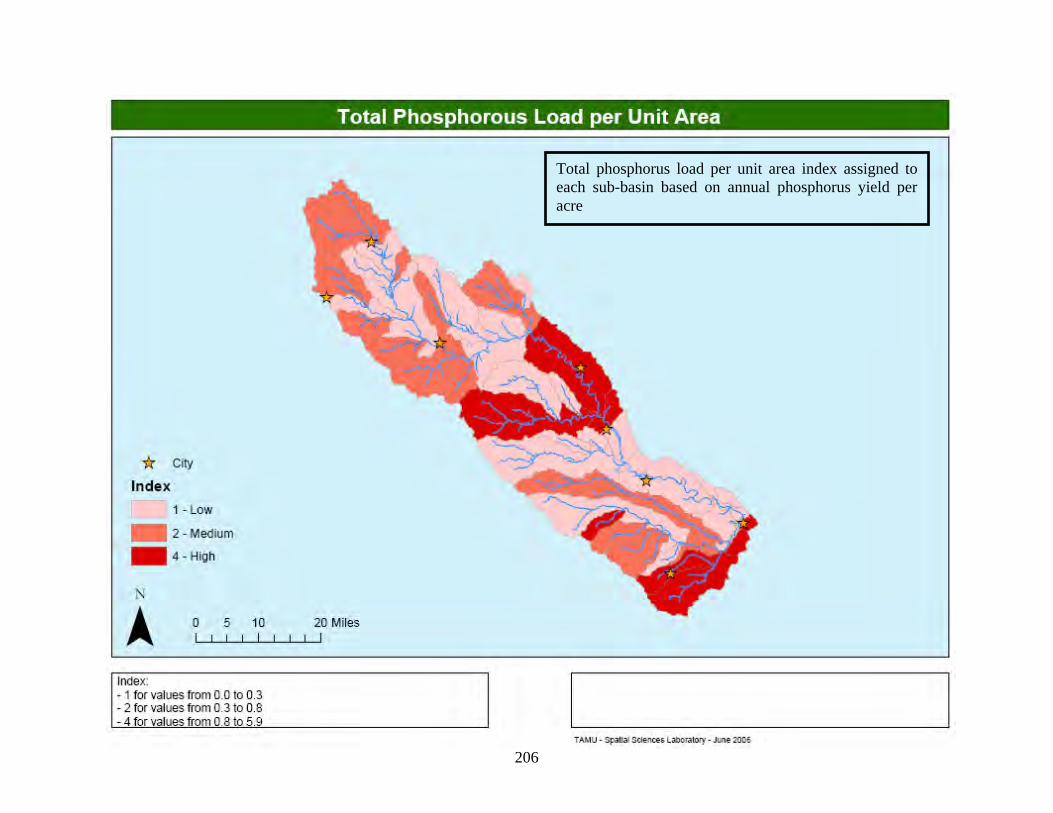
206
Total phosphorus load per unit area index assigned to each sub-basin based on annual phosphorus yield per acre