boston globe poll on key political races in mass
TRANSCRIPT

8/8/2019 Boston Globe poll on key political races in Mass.
http://slidepdf.com/reader/full/boston-globe-poll-on-key-political-races-in-mass 1/43
BOSTON GLOBE POLL #28
MA 2010 GUBERNATORIAL ELECTION
Prepared by:
Andrew E. Smith, Ph.D.
The Survey Center University of New Hampshire
October 23, 2010

8/8/2019 Boston Globe poll on key political races in Mass.
http://slidepdf.com/reader/full/boston-globe-poll-on-key-political-races-in-mass 2/43
Contents
Technical Report.......................................................................... 1
Questionnaire............................................................................... 2
Data Tables ................................................................................15

8/8/2019 Boston Globe poll on key political races in Mass.
http://slidepdf.com/reader/full/boston-globe-poll-on-key-political-races-in-mass 3/43
1
The Boston Globe Poll #28
MA 2012 Gubernatorial Election
Conducted by the UNH Survey Center
October, 2010
Technical Report
Field Period: October 17 to October 22, 2010
Hours: 10 a.m. to 9 p.m.
Median Completion Time: 16 minutes
Full Sample
Sample Size: 601 randomly selected Massachusetts adults (RDD)519 randomly selected likely November, 2010 voters
Sampling Error: Full sample +/- 4.0%Likely voters +/- 4.3%
Response Rate, Full Sample (AAPOR #4): 29%
4th
CDSample Size: 407 randomly selected MA 4 th CD adults (RDD)
385 randomly selected likely November, 2010 voters
Sampling Error: Full 4th CD sample +/- 4.9%4th CD Likely voters +/- 5.0%
10th
CDSample Size: 367 randomly selected MA 10 th CD adults (RDD)
349 randomly selected likely November, 2010 voters
Sampling Error: Full 4th CD sample +/- 5.1%4th CD Likely voters +/- 5.2%
Response Rate, 4th
and 10th
CD oversample (AAPOR #4): 20%
The data have been weighted by the number of adults in a household and the number of telephone numbers atwhich a household can be reached in order to equalize the chances of an individual MA adult being selected.The data have also been weighted by the sex and race of the respondent and the region of the state based onthe American Community Survey conducted by the US Census.
8/8/2019 Boston Globe poll on key political races in Mass.
http://slidepdf.com/reader/full/boston-globe-poll-on-key-political-races-in-mass 4/43
2
The Boston Globe Poll #28
Conducted by the UNH Survey Center
October, 2010
FINAL
INTRO:
“Good afternoon / evening. My name is _____________________ and I'm calling from the University of New Hampshire Survey Center. We are conducting a short, confidential study about politics and policy inMassachusetts, and we'd really appreciate your help and cooperation.”
1 CONTINUE99 REFUSED
BIR1“In order to determine who to interview, could you tell me, of the adults aged 18 or older who currently livein your household -- including yourself -- who had the most recent birthday? I don't mean who is theyoungest, but rather, who had the most recent birthday?”
1 INFORMANT SKIP TO SEX2 SOMEONE ELSE (SPECIFY): ________________ SKIP TO INT23 DON'T KNOW ALL BIRTHDAYS, ONLY SOME CONTINUE WITH BIR24 DON'T KNOW ANY BIRTHDAYS OTHER THAN OWN SKIP TO SEX
99 REFUSED -- ENTER NON-RESPONSE INFORMATION
BIR2“Of the ones that you do know, who had the most recent birthday?”
1 INFORMANT SKIP TO SEX2 SOMEONE ELSE (SPECIFY): ___________________ SKIP TO INT2
99 REFUSED
INT2ASK TO SPEAK TO THAT PERSON“Good afternoon / evening, this is _____________________ calling from the University of New Hampshire.This month, we are conducting a confidential study about politics and policy in Massachusetts, and we'dreally appreciate your help and cooperation. You have been identified as the adult in your household who hadthe most recent birthday. Is this correct?”
1 YES SKIP TO SEX2 APPOINTMENT
99 REFUSAL TERMINATE
8/8/2019 Boston Globe poll on key political races in Mass.
http://slidepdf.com/reader/full/boston-globe-poll-on-key-political-races-in-mass 5/43

8/8/2019 Boston Globe poll on key political races in Mass.
http://slidepdf.com/reader/full/boston-globe-poll-on-key-political-races-in-mass 6/43
4
GOVAPP“GENERALLY SPEAKING, do you approve or disapprove of the way Deval Patrick is handling his job asgovernor?”
(IF APPROVE): “Would you say that you STRONGLY approve of the way he is handling his job asgovernor, or that you approve only SOMEWHAT?”
(IF DISAPPROVE): “Would you say that you STRONGLY disapprove of the way he is handling his job as
governor, or that you disapprove only SOMEWHAT?”(IF NEITHER, NOT SURE, DK): “Would you say that you lean a little more toward APPROVING or DISAPPROVING of the way he is handling his job as governor?”
1 STRONGLY APPROVE2 APPROVE SOMEWHAT3 LEAN TOWARD APPROVING
4 NEITHER, NOT SURE, DK
5 LEAN TOWARD DISAPPROVING6 DISAPPROVE SOMEWHAT
7 STRONGLY DISAPPROVE
* 99 NA / REFUSED
REGVOTE“Are you registered to vote at your current address?”
IF YES: “Are you registered to vote as a Democrat, Independent, Republican or something else?”
1 REGISTERED DEMOCRAT2 REGISTERED INDEPENDENT / UNAFFILIATED3 REGISTERED REPUBLICAN4 REGISTERED OTHER
98 NOT REGISTERED / DK (DO NOT PROBE) SKIPTO VOTEMOT* 99 NA / REFUSED SKIPTO VOTEMOT
VOTEINT“And as you know, the general election for Governor of Massachusetts and other offices is being held in November 2010. How interested would you say you are in the 2010 general election ... extremely interested... very interested ... somewhat interested ... or not very interested?”
1 EXTREMELY INTERESTED2 VERY INTERESTED3 SOMEWHAT INTERESTED4 NOT VERY INTERESTED
98 DK (DO NOT PROBE)* 99 NA

8/8/2019 Boston Globe poll on key political races in Mass.
http://slidepdf.com/reader/full/boston-globe-poll-on-key-political-races-in-mass 7/43
5
VOTELIKE“Which of the following statements best describes you ... (READ NUMBERS 1 TO 5)
1 I will probably NOT vote in the November 2010 general election, SKIPTO VOTEMOT2 I MAY vote in the November 2010 general election, , SKIPTO VOTEMOT3 Unless some emergency comes up, I WILL vote in the 2010 general election,4 I will DEFINITELY vote in the 2010 general election, or
5 I just don't know at this time.”
SKIPTO VOTEMOT
* 99 NA/REFUSED SKIPTO VOTEMOT
FAV
“Next, I'd like to get your overall opinion of some people in the news. As I read each name, please say if youhave a favorable or unfavorable opinion of this person -- or if you don’t know enough about him or her to say.First, how about ... ROTATE FAV1 TO FAV8
FAV1“Governor Deval Patrick.”
IF NECESSARY: “Do you have a favorable or unfavorable opinion about him, or don’t you know enoughabout him to say?”
1 FAVORABLE2 NEITHER FAVORABLE OR UNFAVORABLE - VOLUNTEERED3 UNFAVORABLE
98 DK / NEVER HEARD OF / KNOW TOO LITTLE TO SAY* 99 NA / REFUSED
FAV2 “State Treasurer Tim Cahill.”
FAV3 “Republican gubernatorial candidate Charlie Baker.”
FAV4 “Green Party gubernatorial candidate Jill Stein.”
GOV1“Have you definitely decided who you will vote for in the election for Massachusetts governor in 2010 … areyou leaning toward someone … or have you considered some candidates but are still trying to decide?”
1 DEFINITELY DECIDED WHO WILL VOTE FOR 2 LEANING TOWARD SOMEONE3 STILL TRYING TO DECIDE
99 NA / REFUSED

8/8/2019 Boston Globe poll on key political races in Mass.
http://slidepdf.com/reader/full/boston-globe-poll-on-key-political-races-in-mass 8/43
6
GOV2“If the 2010 Massachusetts gubernatorial election was being held TODAY and the candidates are CharlieBaker, the Republican … Deval Patrick, the Democrat … Tim Cahill, the Independent … and Jill Stein, theGreen-Rainbow candidate, who would you vote for ... Charlie Baker … Deval Patrick … Tim Cahill … or JillStein?" ROTATE CANDIDATES
1 BAKER
2 PATRICK 3 CAHILL4 STEIN5 OTHER
6 WILL NOT VOTE IN GUBERNATORIAL ELECTION SKIPTO TREAS
98 DK / UNSURE SKIPTO TREAS* 99 NA/REFUSED SKIPTO TREAS
GOV3
“Who would your second choice be?
1 BAKER 2 PATRICK 3 CAHILL4 STEIN5 OTHER
6 NO SECOND CHOICE
98 DK / UNSURE* 99 NA/REFUSED
TREAS“If the 2010 election for Massachusetts state Treasurer was being held TODAY and the candidates are KarynPolito, the Republican and Steve Grossman, the Democrat, who would you vote for ... Karyn Polito … or Steve Grossman?" ROTATE CANDIDATES
1 POLITO2 GROSSMAN3 OTHER
4 WILL NOT VOTE IN STATE TREASURER ELECTION
98 DK / UNSURE* 99 NA/REFUSED

8/8/2019 Boston Globe poll on key political races in Mass.
http://slidepdf.com/reader/full/boston-globe-poll-on-key-political-races-in-mass 9/43
7
AUDIT“And if the 2010 election for Massachusetts state Auditor was being held TODAY and the candidates areMary Connaughton, the Republican and Suzanne Bump, the Democrat, who would you vote for ... MaryConnaughton … or Suzanne Bump " ROTATE CANDIDATES
1 CONNAUGHTON2 BUMP
3 OTHER
4 WILL NOT VOTE IN STATE AUDITOR ELECTION
98 DK / UNSURE* 99 NA/REFUSED
AG“And if the 2010 election for Massachusetts Attorney General was being held TODAY and the candidates areMartha Coakley, the Democrat, and James McKenna, the Republican, who would you vote for ... MarthaCoakley … or James McKenna?” ROTATE CANDIDATES
1 MCKENNA2 COAKLEY3 OTHER
4 WILL NOT VOTE IN ATTORNEY GENERAL ELECTION
98 DON’T KNOW* 99 NA/REFUSED
IF (DIST = 4) SKIPTO CONGD4IF (DIST = 10) SKIPTO CONGD10
CONGVOTE"Please think about the November election for your representative to the U.S. House of Representatives. Doyou plan to vote for the Democratic or Republican candidate for the U.S. House of Representatives ... or doyou plan to skip the election for U.S. House of Representatives this time?" ROTATE PARTIES
ROTATE PARTIES
1 REPUBLICAN2 DEMOCRAT3 OTHER 4 WILL NOT VOTE IN US HOUSE ELECTION
98 DK / NOT SURE* 99 NA / REFUSED
SKIPTO REPVOTE

8/8/2019 Boston Globe poll on key political races in Mass.
http://slidepdf.com/reader/full/boston-globe-poll-on-key-political-races-in-mass 10/43
8
CONG4"Please think about the November election for your representative to the U.S. House of Representatives. Doyou plan to vote for Barney Frank, the Democrat … Sean Bielat (BEE – lat), the Republican … some other candidate ... or do you plan to skip the election for U.S. House of Representatives this time?" ROTATECANDIDATES
1 BIELAT
2 FRANK 3 OTHER 4 WILL NOT VOTE IN US HOUSE ELECTION
98 DK / NOT SURE* 99 NA / REFUSED
SKIPTO REPVOTE
CONG10"Please think about the November election for your representative to the U.S. House of Representatives. Doyou plan to vote for William Keating, the Democrat … Jeffrey Perry, the Republican … Maryanne Lewis, the
independent candidate ... James Sheets, the other independent candidate … some other candidate ... or do you plan to skip the election for U.S. House of Representatives this time?" ROTATE CANDIDATES
1 PERRY2 KEATING3 LEWIS4 SHEETS5 OTHER 6 WILL NOT VOTE IN US HOUSE ELECTION
98 DK / NOT SURE* 99 NA / REFUSED
REPVOTE"And turning to the November election for your representative for the Massachusetts House of Representatives. Do you plan to vote for the Democratic or Republican candidate for the MassachusettsHouse of Representatives ... or do you plan to skip the election for Massachusetts House of Representativesthis time?" ROTATE PARTIES
1 REPUBLICAN2 DEMOCRAT3 OTHER
4 WILL NOT VOTE IN US HOUSE ELECTION
98 DK / NOT SURE* 99 NA / REFUSED

8/8/2019 Boston Globe poll on key political races in Mass.
http://slidepdf.com/reader/full/boston-globe-poll-on-key-political-races-in-mass 11/43
9
BALLOT1“As you may know, Question 1 on the November ballot is a proposal to eliminate sales tax on alcohol sold inMassachusetts. Do you favor or oppose ballot Question 1, the proposal to eliminate the sales tax on alcoholsold in Massachusetts, or haven’t you thought about this enough to say?”
“Is that strongly or just somewhat?”
1 STRONGLY FAVOR 2 SOMEWHAT FAVOR 3 SOMEWHAT OPPOSE4 STRONGLY OPPOSE
98 DK / NOT SURE / HAVEN’T THOUGHT ENOUGH ABOUT IT TO SAY* 99 NA / REFUSED
BALLOT2“And as you may know, Question 2 on the November ballot is a proposal that would repeal the state’saffordable housing law. Do you favor or oppose Question 2, the proposal to repeal the state’s affordable
housing law, or haven’t you thought about this enough to say?”
“Is that strongly or just somewhat?”
1 STRONGLY FAVOR 2 SOMEWHAT FAVOR 3 SOMEWHAT OPPOSE4 STRONGLY OPPOSE
98 DK / NOT SURE / HAVEN’T THOUGHT ENOUGH ABOUT IT TO SAY* 99 NA / REFUSED
BALLOT3“And as you may know, Question 3 on the November ballot is a proposal to reduce the state sales tax from 6 point two-five percent to 3 percent. Do you favor or oppose ballot Question 3, the proposal to reduce the statesales tax from 6 point two-five percent to 3 percent, or haven’t you thought about this enough to say?”
“Is that strongly or just somewhat?”
1 STRONGLY FAVOR 2 SOMEWHAT FAVOR 3 SOMEWHAT OPPOSE4 STRONGLY OPPOSE
98 DK / NOT SURE / HAVEN’T THOUGHT ENOUGH ABOUT IT TO SAY* 99 NA / REFUSED

8/8/2019 Boston Globe poll on key political races in Mass.
http://slidepdf.com/reader/full/boston-globe-poll-on-key-political-races-in-mass 12/43
10
CCCHAR “Let’s turn back to the election for Governor. I'm going to read you a few phrases which describe thecandidates running for Governor, and for each one, tell me who you think that phrase best describes,regardless of who you are voting for. Please feel free to name a candidate even if you may not be voting for that person.”
ROTATE CCHAR1 TO CCHAR3
CCHAR1“Which candidate do you think is the strongest leader?” READ LIST IF NECESSARY
1 CHARLIE BAKER 2 DEVAL PATRICK 3 TIM CAHILL4 JILL STEIN5 SOMEONE ELSE
97 NONE98 DK / NOT SURE
99 NA / REFUSED
CCHAR2“Which candidate do you think best understands people like me?” READ LIST IF NECESSARY
CCHAR3“Which candidate do you think is most likable?” READ LIST IF NECESSARY
VOTEMOT“Think for a minute about political incumbents, the people in Washington and Massachusetts who arecurrently in office. Overall, do you trust current political incumbents to provide leadership in Washingtonand Massachusetts or do you think political incumbents in Washington and Massachusetts need to be replaced by a new crop of leaders?” ROTATE RESPONSES
1 TRUST CURRENT INCUMBENTS2 WANT NEW CROP OF LEADERS3 OTHER – IT DEPENDS ON THE PERSON
98 DK / NOT SURE – DO NOT PROBE* 99 NA / REFUSED

8/8/2019 Boston Globe poll on key political races in Mass.
http://slidepdf.com/reader/full/boston-globe-poll-on-key-political-races-in-mass 13/43
11
HOPE“Thinking about all of the elections in November, both in Massachusetts and in other parts of the country,how do you feel about what will happen in the November elections? Are you very excited … somewhatexcited … somewhat depressed … or very depressed?”
1 VERY EXCITED2 SOMEWHAT EXCITED
3 NEUTRAL - VOLUNTEERED4 SOMEWHAT DEPRESSED5 VERY DEPRESSED
98 DK / NOT SURE* 99 NA / REFUSED
D1“Now, a few final questions . . .”“What is the highest grade in school, or level of education that you've completed and got credit for ...”[READ RESPONSES]
1 “Eighth grade or less,2 Some high school,3 High school graduate, (INCLUDES G.E.D.)4 Technical school,5 Some college,6 College graduate,7 Or postgraduate work?”
98 DK (DO NOT PROBE)* 99 NA / REFUSED
D2“GENERALLY SPEAKING, do you usually think of yourself as a Republican, a Democrat, an Independentor what?”
(IF REPUBLICAN): “Would you call yourself a STRONG Republican or a NOT VERY STRONGRepublican?”(IF DEMOCRAT): “Would you call yourself a STRONG Democrat or a NOT VERY STRONG Democrat?”(IF INDEPENDENT, NO PREFERENCE, OR OTHER): “Do you think of yourself as closer to theRepublican or to the Democratic party?”
1 STRONG DEMOCRAT2 NOT VERY STRONG DEMOCRAT3 INDEPENDENT, BUT CLOSER TO DEMOCRATS4 INDEPENDENT--CLOSER TO NEITHER 5 INDEPENDENT, BUT CLOSER TO REPUBLICANS6 NOT VERY STRONG REPUBLICAN7 STRONG REPUBLICAN8 OTHER PARTY
* 99 DK / NA / REFUSED

8/8/2019 Boston Globe poll on key political races in Mass.
http://slidepdf.com/reader/full/boston-globe-poll-on-key-political-races-in-mass 14/43
12
VOTEHIST"Now, please think about elections you have voted in over the last five years . . . including local, state, andnational elections. Would you say you have voted for more Democrats . . . more Republicans . . . or that youhave voted for almost exactly the same number of each?"
IF DEMOCRATS--"Have you voted only for Democrats, mostly for Democrats, or for slightly moreDemocrats than Republicans?"
IF REPUBLICANS--"Have you voted only for Republicans, mostly for Republicans, or for slightly moreRepublicans than Democrats?"
1 ONLY DEMOCRATS2 MOSTLY DEMOCRATS3 SLIGHTLY MORE DEMOCRATS4 ALMOST SAME DEMOCRATS AND REPUBLICANS5 SLIGHTLY MORE REPUBLICANS6 MOSTLY REPUBLICANS7 ONLY REPUBLICANS
98 DK 99 NA
D3“What is your current age?”
RECORD EXACT NUMBER OF YEARS OLD -- E.G., 45
96 NINETY-SIX YEARS OF AGE OR OLDER
97 REFUSED98 DK
* 99 NA
D5“Are you of Hispanic or Spanish origin?"
1 YES2 NO
98 DON'T KNOW* 99 REFUSED

8/8/2019 Boston Globe poll on key political races in Mass.
http://slidepdf.com/reader/full/boston-globe-poll-on-key-political-races-in-mass 15/43
13
D6“Which of the following best describes your race? Is it ...White ... African-American ... Asian ... Native-American ... or some other race?”
1 WHITE (CAUCASIAN)2 BLACK (AFRICAN-AMERICAN)3 HISPANIC
4 ASIAN5 NATIVE AMERICAN6 OTHER - SPECIFY: ________________________________
98 DON'T KNOW* 99 NO ANSWER/REFUSED
D7“Including yourself, how many adults CURRENTLY live in your household?”
1 ONE - JUST RESPONDENT
2 TWO3 THREE4 FOUR 5 FIVE6 SIX7 SEVEN OR MORE
98 DK * 99 NA / REFUSED
D8“How much TOTAL income did you and your family receive in 2009, not just from wages or salaries butfrom ALL sources -- that is, before taxes and other deductions were made? Was it ….” (READCATEGORIES)
ANNUAL MONTHLY EQUIVALENT
1 Less than $15,000, LESS THAN $1,2502 $15,000 - $29,999, $1,250 - $2,4993 $30,000 - $44,999, $2,500 - $3,7494 $45,000 - $59,999, $3,750 - $4,9995 $60,000 - $74,999, $5,000 - $6,2496 $75,000 - $99,999, $6,250 - $8,3337 $100,000 to $149,999, or $8,334 - $12,49998 $150,000 and over?” $12,500 or more
* 97 REFUSED – PROBE: “Which of these categories is closest to your income …”* 98 DK – PROBE: “Which of these categories is closest to your income …”* 99 NA – PROBE: “Which of these categories is closest to your income …”

8/8/2019 Boston Globe poll on key political races in Mass.
http://slidepdf.com/reader/full/boston-globe-poll-on-key-political-races-in-mass 16/43
14
D9“Not counting business lines, extension phones, or cellular phones -- on how many different telephone NUMBERS can your household be reached?”
1 ONE2 TWO3 THREE
4 FOUR 5 FIVE6 SIX7 SEVEN OR MORE
98 DK * 99 NA / REFUSED
D10“Finally, would you be willing to be interviewed by a reporter to discuss your reactions to some of the topicswe've been talking about?”
1 YES “Could I have just your first name in case a reporter wants to call you?” ____________ 2 NO / DK (DO NOT PROBE)
99 NA / REFUSED
“Thank you for your time and participation. Your input has been very valuable. Goodbye.”

8/8/2019 Boston Globe poll on key political races in Mass.
http://slidepdf.com/reader/full/boston-globe-poll-on-key-political-races-in-mass 17/43
15
Tabular Results

8/8/2019 Boston Globe poll on key political races in Mass.
http://slidepdf.com/reader/full/boston-globe-poll-on-key-political-races-in-mass 18/43
16
“Do you think things in Massachusetts are generally going in the right direction or are they seriously off on the wrong track?”
Right Wrong Don't
Direction Track Know (N=)
MA LIKELY VOTERS 39% 55% 5% 515
Registered Democrat 62% 32% 7% 180Registered Undeclared 30% 64% 6% 265Registered Republican 15% 83% 1% 71
Democrat 65% 28% 7% 255Independent 15% 82% 3% 95Republican 11% 85% 4% 160
Core Republican 6% 92% 2% 142Swing Voter 23% 73% 5% 133Core Democrat 68% 25% 8% 240
Baker voter 8% 89% 3% 197Patrick voter 75% 17% 8% 219Cahill voter 21% 77% 2% 39Other/Undecided voter 21% 72% 7% 52
Excited about November 33% 63% 4% 290
Depressed about November 52% 43% 5% 139 Neither Excited/Depressed 42% 49% 10% 85
Extremely interested in election 28% 70% 2% 209Very interested 48% 45% 6% 237Somewhat/Not Very interested 42% 47% 12% 69
Definitely will vote 38% 57% 5% 453Will vote unless emergency 47% 44% 9% 62
Trust current incumbents 77% 20% 3% 144Want new crop of leaders 12% 85% 2% 251Other/Don't Know 50% 36% 14% 119
Approve of Patrick 76% 17% 6% 227Disapprove of Patrick 8% 91% 1% 253
Neither Approve/Disapprove 23% 46% 31% 34
Male 38% 59% 2% 254Female 40% 52% 8% 262
35 or under 41% 56% 3% 3935 to 49 33% 58% 9% 11350 to 64 47% 49% 4% 19465 and over 35% 59% 6% 155
High school or less 22% 76% 2% 77Some college 32% 65% 3% 96College graduate 39% 54% 7% 209
Post-graduate 55% 38% 7% 128
White 39% 56% 5% 455Minority 49% 44% 6% 50
Inside 128 49% 47% 4% 111128 to 495 37% 57% 7% 191Central MA 30% 64% 6% 91Western MA 43% 54% 3% 60Southern MA/Cape/Islands 40% 55% 4% 62

8/8/2019 Boston Globe poll on key political races in Mass.
http://slidepdf.com/reader/full/boston-globe-poll-on-key-political-races-in-mass 19/43
17
“GENERALLY SPEAKING, do you approve or disapprove of the way Deval Patrick is handling his job as governor?”
Approve Neutral Disapprove (N=)
MA LIKELY VOTERS 44% 6% 49% 518
Registered Democrat 68% 8% 24% 181Registered Undeclared 37% 6% 57% 266Registered Republican 12% 3% 85% 72
Democrat 73% 7% 19% 256Independent 21% 10% 69% 95Republican 11% 3% 86% 161
Core Republican 7% 2% 90% 144Swing Voter 26% 9% 66% 133Core Democrat 76% 8% 16% 241
Baker voter 7% 1% 92% 198Patrick voter 85% 8% 7% 220Cahill voter 21% 12% 67% 39Other/Undecided voter 32% 13% 55% 53
Excited about November 37% 3% 60% 291
Depressed about November 58% 9% 33% 140 Neither Excited/Depressed 48% 13% 39% 85
Extremely interested in election 32% 5% 62% 211Very interested 53% 6% 41% 237Somewhat/Not Very interested 51% 11% 38% 69
Definitely will vote 42% 6% 51% 454Will vote unless emergency 57% 7% 36% 64
Trust current incumbents 82% 4% 14% 145Want new crop of leaders 16% 5% 79% 253Other/Don't Know 58% 12% 30% 119
Approve of Patrick 100% 0% 0% 229Disapprove of Patrick 0% 0% 100% 255
Neither Approve/Disapprove 0% 100% 0% 34
Male 39% 5% 56% 256Female 50% 7% 43% 262
35 or under 48% 9% 43% 3935 to 49 34% 7% 59% 11350 to 64 49% 5% 46% 19765 and over 45% 8% 47% 155
High school or less 22% 8% 70% 77Some college 44% 8% 48% 98College graduate 45% 6% 48% 209
Post-graduate 56% 5% 39% 129
White 43% 6% 51% 458Minority 58% 15% 27% 50
Inside 128 58% 3% 38% 112128 to 495 37% 10% 53% 190Central MA 38% 3% 59% 91Western MA 51% 4% 45% 60Southern MA/Cape/Islands 44% 9% 47% 65
8/8/2019 Boston Globe poll on key political races in Mass.
http://slidepdf.com/reader/full/boston-globe-poll-on-key-political-races-in-mass 20/43
18
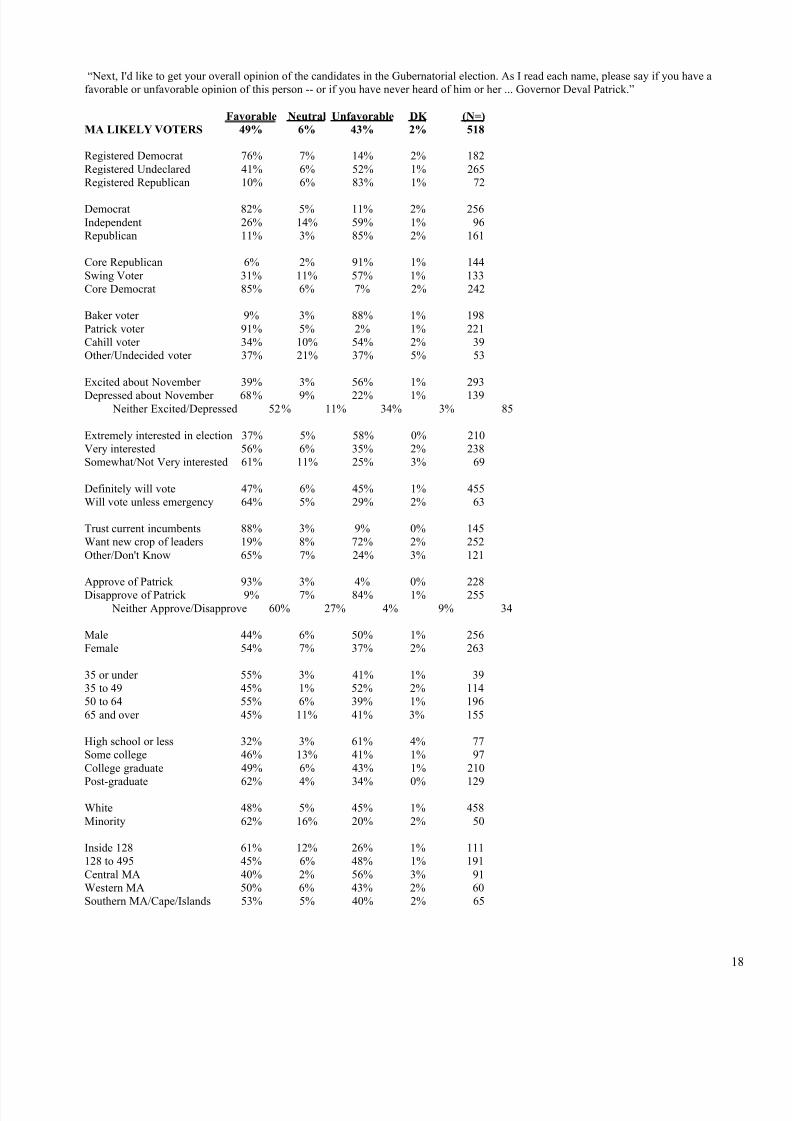
“Next, I'd like to get your overall opinion of the candidates in the Gubernatorial election. As I read each name, please say if you have afavorable or unfavorable opinion of this person -- or if you have never heard of him or her ... Governor Deval Patrick.”
Favorable Neutral Unfavorable DK (N=) MA LIKELY VOTERS 49% 6% 43% 2% 518
Registered Democrat 76% 7% 14% 2% 182Registered Undeclared 41% 6% 52% 1% 265Registered Republican 10% 6% 83% 1% 72
Democrat 82% 5% 11% 2% 256Independent 26% 14% 59% 1% 96Republican 11% 3% 85% 2% 161
Core Republican 6% 2% 91% 1% 144Swing Voter 31% 11% 57% 1% 133Core Democrat 85% 6% 7% 2% 242
Baker voter 9% 3% 88% 1% 198Patrick voter 91% 5% 2% 1% 221Cahill voter 34% 10% 54% 2% 39Other/Undecided voter 37% 21% 37% 5% 53
Excited about November 39% 3% 56% 1% 293
Depressed about November 68% 9% 22% 1% 139 Neither Excited/Depressed 52% 11% 34% 3% 85
Extremely interested in election 37% 5% 58% 0% 210Very interested 56% 6% 35% 2% 238Somewhat/Not Very interested 61% 11% 25% 3% 69
Definitely will vote 47% 6% 45% 1% 455Will vote unless emergency 64% 5% 29% 2% 63
Trust current incumbents 88% 3% 9% 0% 145Want new crop of leaders 19% 8% 72% 2% 252Other/Don't Know 65% 7% 24% 3% 121
Approve of Patrick 93% 3% 4% 0% 228Disapprove of Patrick 9% 7% 84% 1% 255
Neither Approve/Disapprove 60% 27% 4% 9% 34
Male 44% 6% 50% 1% 256Female 54% 7% 37% 2% 263
35 or under 55% 3% 41% 1% 3935 to 49 45% 1% 52% 2% 11450 to 64 55% 6% 39% 1% 19665 and over 45% 11% 41% 3% 155
High school or less 32% 3% 61% 4% 77Some college 46% 13% 41% 1% 97College graduate 49% 6% 43% 1% 210
Post-graduate 62% 4% 34% 0% 129
White 48% 5% 45% 1% 458Minority 62% 16% 20% 2% 50
Inside 128 61% 12% 26% 1% 111128 to 495 45% 6% 48% 1% 191Central MA 40% 2% 56% 3% 91Western MA 50% 6% 43% 2% 60Southern MA/Cape/Islands 53% 5% 40% 2% 65

8/8/2019 Boston Globe poll on key political races in Mass.
http://slidepdf.com/reader/full/boston-globe-poll-on-key-political-races-in-mass 21/43
19
“Next, I'd like to get your overall opinion of the candidates in the Gubernatorial election. As I read each name, please say if you have afavorable or unfavorable opinion of this person -- or if you have never heard of him or her ... State Treasurer Tim Cahill.”
Favorable Neutral Unfavorable DK (N=) MA LIKELY VOTERS 24% 15% 46% 15% 519
Registered Democrat 28% 18% 32% 22% 182Registered Undeclared 23% 15% 50% 12% 266Registered Republican 22% 5% 63% 9% 72
Democrat 28% 20% 34% 18% 257Independent 21% 16% 51% 13% 96Republican 20% 6% 63% 11% 161
Core Republican 15% 3% 74% 9% 144Swing Voter 27% 19% 39% 15% 134Core Democrat 29% 19% 33% 19% 242
Baker voter 16% 7% 70% 8% 198Patrick voter 22% 22% 37% 19% 221Cahill voter 82% 5% 5% 8% 39Other/Undecided voter 25% 18% 25% 32% 53
Excited about November 24% 10% 52% 14% 293
Depressed about November 22% 21% 38% 19% 140 Neither Excited/Depressed 30% 19% 37% 14% 85
Extremely interested in election 25% 12% 55% 8% 211Very interested 22% 18% 43% 18% 238Somewhat/Not Very interested 32% 10% 29% 29% 69
Definitely will vote 24% 15% 47% 14% 455Will vote unless emergency 30% 12% 35% 23% 64
Trust current incumbents 28% 18% 33% 21% 145Want new crop of leaders 19% 11% 58% 12% 253Other/Don't Know 32% 19% 35% 14% 121
Approve of Patrick 27% 19% 36% 17% 229Disapprove of Patrick 22% 7% 59% 12% 255
Neither Approve/Disapprove 23% 38% 13% 26% 34
Male 23% 12% 53% 12% 256Female 25% 18% 39% 18% 264
35 or under 28% 8% 45% 19% 3935 to 49 30% 12% 44% 14% 11450 to 64 23% 18% 46% 13% 19765 and over 22% 14% 47% 18% 155
High school or less 28% 6% 48% 18% 77Some college 25% 17% 44% 14% 98College graduate 25% 16% 41% 17% 210
Post-graduate 21% 15% 54% 9% 129
White 25% 14% 46% 14% 460Minority 19% 25% 34% 22% 50
Inside 128 30% 21% 40% 10% 112128 to 495 22% 15% 54% 10% 191Central MA 21% 12% 48% 18% 91Western MA 23% 14% 30% 34% 60Southern MA/Cape/Islands 28% 9% 44% 18% 65
8/8/2019 Boston Globe poll on key political races in Mass.
http://slidepdf.com/reader/full/boston-globe-poll-on-key-political-races-in-mass 22/43
20
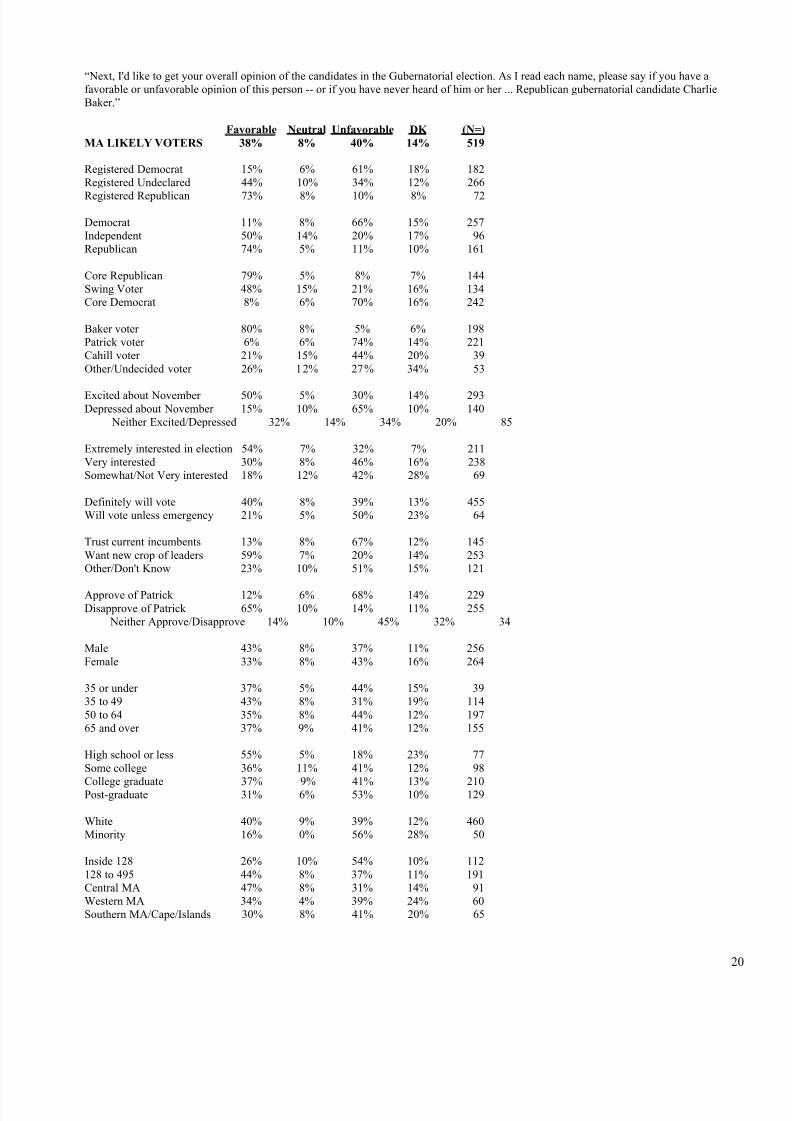
“Next, I'd like to get your overall opinion of the candidates in the Gubernatorial election. As I read each name, please say if you have afavorable or unfavorable opinion of this person -- or if you have never heard of him or her ... Republican gubernatorial candidate CharlieBaker.”
Favorable Neutral Unfavorable DK (N=) MA LIKELY VOTERS 38% 8% 40% 14% 519
Registered Democrat 15% 6% 61% 18% 182Registered Undeclared 44% 10% 34% 12% 266
Registered Republican 73% 8% 10% 8% 72
Democrat 11% 8% 66% 15% 257Independent 50% 14% 20% 17% 96Republican 74% 5% 11% 10% 161
Core Republican 79% 5% 8% 7% 144Swing Voter 48% 15% 21% 16% 134Core Democrat 8% 6% 70% 16% 242
Baker voter 80% 8% 5% 6% 198Patrick voter 6% 6% 74% 14% 221Cahill voter 21% 15% 44% 20% 39Other/Undecided voter 26% 12% 27% 34% 53
Excited about November 50% 5% 30% 14% 293Depressed about November 15% 10% 65% 10% 140
Neither Excited/Depressed 32% 14% 34% 20% 85
Extremely interested in election 54% 7% 32% 7% 211Very interested 30% 8% 46% 16% 238Somewhat/Not Very interested 18% 12% 42% 28% 69
Definitely will vote 40% 8% 39% 13% 455Will vote unless emergency 21% 5% 50% 23% 64
Trust current incumbents 13% 8% 67% 12% 145Want new crop of leaders 59% 7% 20% 14% 253Other/Don't Know 23% 10% 51% 15% 121
Approve of Patrick 12% 6% 68% 14% 229Disapprove of Patrick 65% 10% 14% 11% 255
Neither Approve/Disapprove 14% 10% 45% 32% 34
Male 43% 8% 37% 11% 256Female 33% 8% 43% 16% 264
35 or under 37% 5% 44% 15% 3935 to 49 43% 8% 31% 19% 11450 to 64 35% 8% 44% 12% 19765 and over 37% 9% 41% 12% 155
High school or less 55% 5% 18% 23% 77Some college 36% 11% 41% 12% 98
College graduate 37% 9% 41% 13% 210Post-graduate 31% 6% 53% 10% 129
White 40% 9% 39% 12% 460Minority 16% 0% 56% 28% 50
Inside 128 26% 10% 54% 10% 112128 to 495 44% 8% 37% 11% 191Central MA 47% 8% 31% 14% 91Western MA 34% 4% 39% 24% 60Southern MA/Cape/Islands 30% 8% 41% 20% 65

8/8/2019 Boston Globe poll on key political races in Mass.
http://slidepdf.com/reader/full/boston-globe-poll-on-key-political-races-in-mass 23/43
21
“Next, I'd like to get your overall opinion of the candidates in the Gubernatorial election. As I read each name, please say if you have afavorable or unfavorable opinion of this person -- or if you have never heard of him or her ... Green Party gubernatorial candidate Jill Stein.”
Favorable Neutral Unfavorable DK (N=) MA LIKELY VOTERS 16% 10% 24% 49% 519
Registered Democrat 27% 8% 21% 43% 182Registered Undeclared 12% 10% 24% 54% 266Registered Republican 5% 17% 31% 47% 72
Democrat 24% 8% 19% 49% 257Independent 16% 12% 21% 51% 96Republican 4% 13% 34% 49% 161
Core Republican 4% 14% 38% 43% 144Swing Voter 12% 9% 22% 58% 134Core Democrat 26% 9% 17% 48% 242
Baker voter 4% 12% 35% 48% 198Patrick voter 22% 10% 21% 48% 221Cahill voter 18% 10% 8% 63% 39Other/Undecided voter 34% 8% 12% 46% 53
Excited about November 12% 13% 26% 50% 293
Depressed about November 26% 7% 17% 51% 140 Neither Excited/Depressed 15% 8% 30% 47% 85
Extremely interested in election 13% 14% 32% 41% 211Very interested 19% 9% 18% 54% 238Somewhat/Not Very interested 18% 3% 21% 58% 69
Definitely will vote 16% 11% 26% 46% 455Will vote unless emergency 17% 5% 10% 68% 64
Trust current incumbents 26% 11% 19% 44% 145Want new crop of leaders 9% 10% 26% 54% 253Other/Don't Know 19% 10% 27% 44% 121
Approve of Patrick 24% 11% 20% 45% 229Disapprove of Patrick 9% 11% 29% 52% 255
Neither Approve/Disapprove 22% 6% 15% 57% 34
Male 14% 12% 30% 44% 256Female 18% 9% 19% 54% 264
35 or under 23% 13% 14% 51% 3935 to 49 9% 14% 26% 51% 11450 to 64 21% 8% 23% 48% 19765 and over 13% 12% 26% 48% 155
High school or less 9% 7% 15% 69% 77Some college 17% 6% 27% 50% 98College graduate 16% 13% 24% 47% 210
Post-graduate 21% 12% 27% 40% 129
White 16% 10% 25% 49% 460Minority 19% 15% 16% 50% 50
Inside 128 33% 11% 15% 42% 112128 to 495 10% 10% 31% 49% 191Central MA 11% 11% 25% 53% 91Western MA 17% 8% 22% 53% 60Southern MA/Cape/Islands 15% 12% 20% 54% 65
8/8/2019 Boston Globe poll on key political races in Mass.
http://slidepdf.com/reader/full/boston-globe-poll-on-key-political-races-in-mass 24/43
22
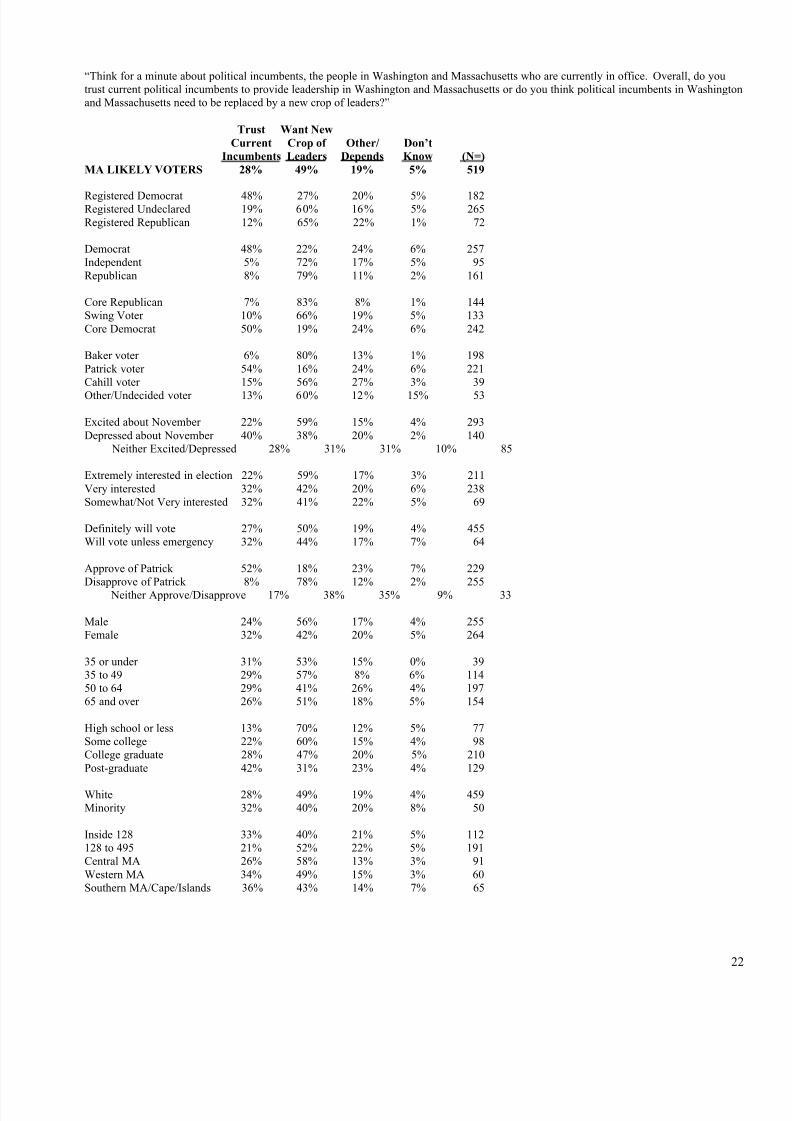
“Think for a minute about political incumbents, the people in Washington and Massachusetts who are currently in office. Overall, do youtrust current political incumbents to provide leadership in Washington and Massachusetts or do you think political incumbents in Washingtonand Massachusetts need to be replaced by a new crop of leaders?”
Trust Want New
Current Crop of Other/ Don’t
Incumbents Leaders Depends Know (N=) MA LIKELY VOTERS 28% 49% 19% 5% 519
Registered Democrat 48% 27% 20% 5% 182Registered Undeclared 19% 60% 16% 5% 265Registered Republican 12% 65% 22% 1% 72
Democrat 48% 22% 24% 6% 257Independent 5% 72% 17% 5% 95Republican 8% 79% 11% 2% 161
Core Republican 7% 83% 8% 1% 144Swing Voter 10% 66% 19% 5% 133Core Democrat 50% 19% 24% 6% 242
Baker voter 6% 80% 13% 1% 198Patrick voter 54% 16% 24% 6% 221Cahill voter 15% 56% 27% 3% 39
Other/Undecided voter 13% 60% 12% 15% 53
Excited about November 22% 59% 15% 4% 293Depressed about November 40% 38% 20% 2% 140
Neither Excited/Depressed 28% 31% 31% 10% 85
Extremely interested in election 22% 59% 17% 3% 211Very interested 32% 42% 20% 6% 238Somewhat/Not Very interested 32% 41% 22% 5% 69
Definitely will vote 27% 50% 19% 4% 455Will vote unless emergency 32% 44% 17% 7% 64
Approve of Patrick 52% 18% 23% 7% 229Disapprove of Patrick 8% 78% 12% 2% 255
Neither Approve/Disapprove 17% 38% 35% 9% 33
Male 24% 56% 17% 4% 255Female 32% 42% 20% 5% 264
35 or under 31% 53% 15% 0% 3935 to 49 29% 57% 8% 6% 11450 to 64 29% 41% 26% 4% 19765 and over 26% 51% 18% 5% 154
High school or less 13% 70% 12% 5% 77Some college 22% 60% 15% 4% 98College graduate 28% 47% 20% 5% 210Post-graduate 42% 31% 23% 4% 129
White 28% 49% 19% 4% 459Minority 32% 40% 20% 8% 50
Inside 128 33% 40% 21% 5% 112128 to 495 21% 52% 22% 5% 191Central MA 26% 58% 13% 3% 91Western MA 34% 49% 15% 3% 60Southern MA/Cape/Islands 36% 43% 14% 7% 65
8/8/2019 Boston Globe poll on key political races in Mass.
http://slidepdf.com/reader/full/boston-globe-poll-on-key-political-races-in-mass 25/43
23
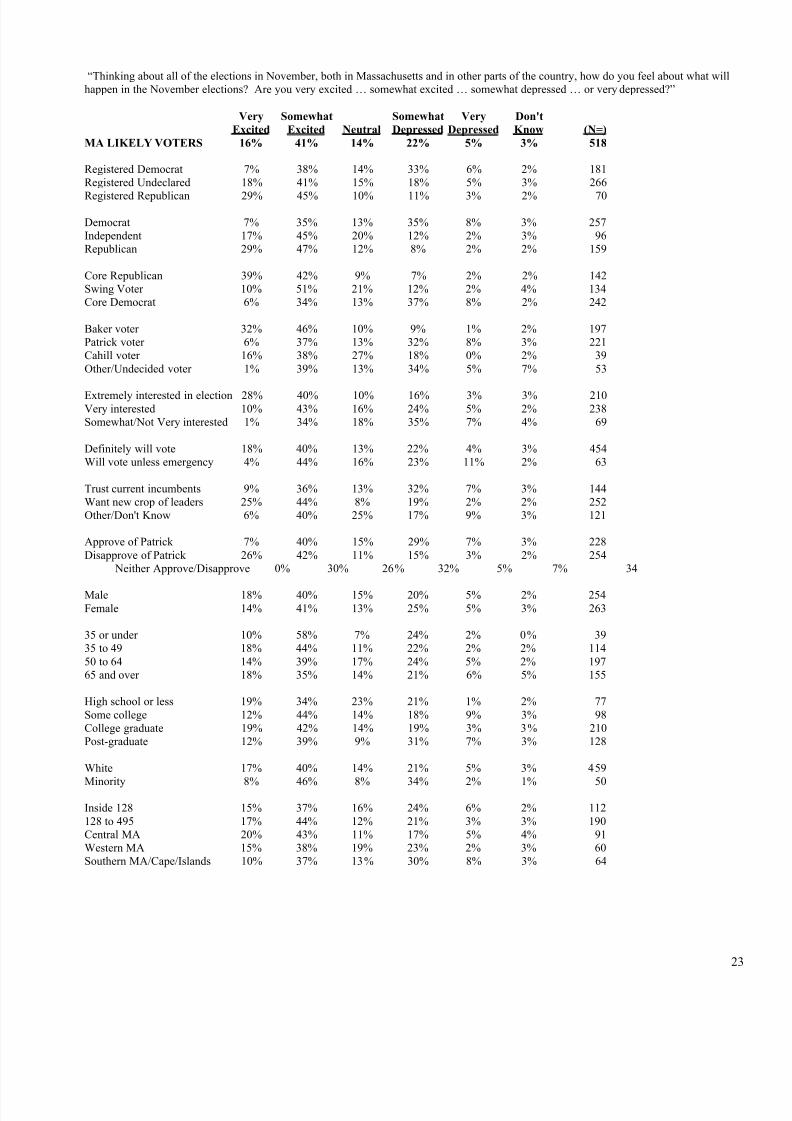
“Thinking about all of the elections in November, both in Massachusetts and in other parts of the country, how do you feel about what willhappen in the November elections? Are you very excited … somewhat excited … somewhat depressed … or very depressed?”
Very Somewhat Somewhat Very Don't
Excited Excited Neutral Depressed Depressed Know (N=)
MA LIKELY VOTERS 16% 41% 14% 22% 5% 3% 518
Registered Democrat 7% 38% 14% 33% 6% 2% 181Registered Undeclared 18% 41% 15% 18% 5% 3% 266
Registered Republican 29% 45% 10% 11% 3% 2% 70
Democrat 7% 35% 13% 35% 8% 3% 257Independent 17% 45% 20% 12% 2% 3% 96Republican 29% 47% 12% 8% 2% 2% 159
Core Republican 39% 42% 9% 7% 2% 2% 142Swing Voter 10% 51% 21% 12% 2% 4% 134Core Democrat 6% 34% 13% 37% 8% 2% 242
Baker voter 32% 46% 10% 9% 1% 2% 197Patrick voter 6% 37% 13% 32% 8% 3% 221Cahill voter 16% 38% 27% 18% 0% 2% 39Other/Undecided voter 1% 39% 13% 34% 5% 7% 53
Extremely interested in election 28% 40% 10% 16% 3% 3% 210Very interested 10% 43% 16% 24% 5% 2% 238Somewhat/Not Very interested 1% 34% 18% 35% 7% 4% 69
Definitely will vote 18% 40% 13% 22% 4% 3% 454Will vote unless emergency 4% 44% 16% 23% 11% 2% 63
Trust current incumbents 9% 36% 13% 32% 7% 3% 144Want new crop of leaders 25% 44% 8% 19% 2% 2% 252Other/Don't Know 6% 40% 25% 17% 9% 3% 121
Approve of Patrick 7% 40% 15% 29% 7% 3% 228Disapprove of Patrick 26% 42% 11% 15% 3% 2% 254
Neither Approve/Disapprove 0% 30% 26% 32% 5% 7% 34
Male 18% 40% 15% 20% 5% 2% 254Female 14% 41% 13% 25% 5% 3% 263
35 or under 10% 58% 7% 24% 2% 0% 3935 to 49 18% 44% 11% 22% 2% 2% 11450 to 64 14% 39% 17% 24% 5% 2% 19765 and over 18% 35% 14% 21% 6% 5% 155
High school or less 19% 34% 23% 21% 1% 2% 77Some college 12% 44% 14% 18% 9% 3% 98College graduate 19% 42% 14% 19% 3% 3% 210Post-graduate 12% 39% 9% 31% 7% 3% 128
White 17% 40% 14% 21% 5% 3% 459
Minority 8% 46% 8% 34% 2% 1% 50
Inside 128 15% 37% 16% 24% 6% 2% 112128 to 495 17% 44% 12% 21% 3% 3% 190Central MA 20% 43% 11% 17% 5% 4% 91Western MA 15% 38% 19% 23% 2% 3% 60Southern MA/Cape/Islands 10% 37% 13% 30% 8% 3% 64

8/8/2019 Boston Globe poll on key political races in Mass.
http://slidepdf.com/reader/full/boston-globe-poll-on-key-political-races-in-mass 26/43
24
“And as you know, the general election for Governor of Massachusetts and other offices is being held in November 2010. How interestedwould you say you are in the 2010 general election ... extremely interested ... very interested ... somewhat interested ... or not veryinterested?”
Extremely Very Somewhat Not Very
Interested Interested Interested Interested (N=) ALL MA ADULTS 41% 46% 12% 2% 519
Registered Democrat 35% 51% 13% 1% 181
Registered Undeclared 40% 45% 12% 3% 266Registered Republican 56% 35% 8% 1% 72
Democrat 31% 53% 14% 2% 257Independent 44% 43% 10% 3% 96Republican 55% 35% 10% 0% 161
Core Republican 59% 34% 7% 0% 144Swing Voter 42% 45% 11% 2% 134Core Democrat 29% 54% 15% 2% 242
Baker voter 56% 37% 7% 0% 198Patrick voter 27% 55% 15% 3% 221Cahill voter 57% 38% 5% 0% 39Other/Undecided voter 27% 47% 22% 4% 53
Excited about November 49% 43% 8% 1% 293Depressed about November 29% 50% 18% 3% 140
Neither Excited/Depressed 31% 51% 15% 3% 85
Definitely will vote 45% 45% 9% 1% 455Will vote unless emergency 11% 53% 30% 7% 63
Trust current incumbents 32% 53% 13% 3% 144Want new crop of leaders 49% 40% 11% 1% 253Other/Don't Know 34% 51% 12% 3% 121
Approve of Patrick 30% 55% 12% 3% 228Disapprove of Patrick 52% 38% 10% 0% 255
Neither Approve/Disapprove 33% 44% 23% 0% 34
Male 47% 42% 9% 2% 256Female 35% 50% 14% 1% 263
35 or under 28% 50% 22% 0% 3935 to 49 43% 39% 14% 4% 11450 to 64 41% 48% 10% 1% 19765 and over 40% 49% 10% 1% 155
High school or less 37% 47% 15% 1% 77Some college 43% 47% 10% 0% 98College graduate 43% 42% 13% 3% 210Post graduate 39% 50% 9% 2% 129
White 42% 45% 11% 2% 459Minority 27% 52% 21% 0% 50
Inside 128 35% 50% 13% 1% 112128 to 495 41% 45% 11% 3% 190Central MA 43% 42% 14% 1% 91Western MA 43% 49% 8% 0% 60Southern MA/Cape/Islands 43% 45% 11% 1% 65

8/8/2019 Boston Globe poll on key political races in Mass.
http://slidepdf.com/reader/full/boston-globe-poll-on-key-political-races-in-mass 27/43
25
"Which of the following statements best describes you ... I will probably not vote in the November general election, I may vote in the November general election, unless some emergency comes up, I will vote in the November general election, I will definitely vote in the November general election, or I just don't know at this time."
Will Vote Will
Unless Definitely
Emergency Vote (N=) ALL MA ADULTS 12% 88% 519
Registered Democrat 11% 89% 182Registered Undeclared 14% 86% 266Registered Republican 8% 92% 72
Democrat 15% 85% 257Independent 12% 88% 96Republican 10% 90% 161
Core Republican 7% 93% 144Swing Voter 14% 86% 134Core Democrat 14% 86% 242
Baker voter 9% 91% 198Patrick voter 16% 84% 221Cahill voter 8% 92% 39
Other/Undecided voter 14% 86% 53
Excited about November 10% 90% 293Depressed about November 16% 84% 140
Neither Excited/Depressed 13% 87% 85
Extremely interested in election 3% 97% 211Very interested 14% 86% 238Somewhat/Not Very interested 33% 67% 69
Trust current incumbents 14% 86% 145Want new crop of leaders 11% 89% 253Other/Don't Know 13% 87% 121
Approve of Patrick 16% 84% 229Disapprove of Patrick 9% 91% 255
Neither Approve/Disapprove 14% 86% 34
Male 11% 89% 256Female 14% 86% 264
35 or under 10% 90% 3935 to 49 18% 82% 11450 to 64 13% 87% 19765 and over 8% 92% 155
High school or less 11% 89% 77Some college 16% 84% 98College graduate 13% 87% 210
Post-graduate 11% 89% 129
White 12% 88% 460Minority 14% 86% 50
Inside 128 12% 88% 112128 to 495 13% 87% 191Central MA 13% 87% 91Western MA 13% 87% 60Southern MA/Cape/Islands 10% 90% 65
8/8/2019 Boston Globe poll on key political races in Mass.
http://slidepdf.com/reader/full/boston-globe-poll-on-key-political-races-in-mass 28/43
26
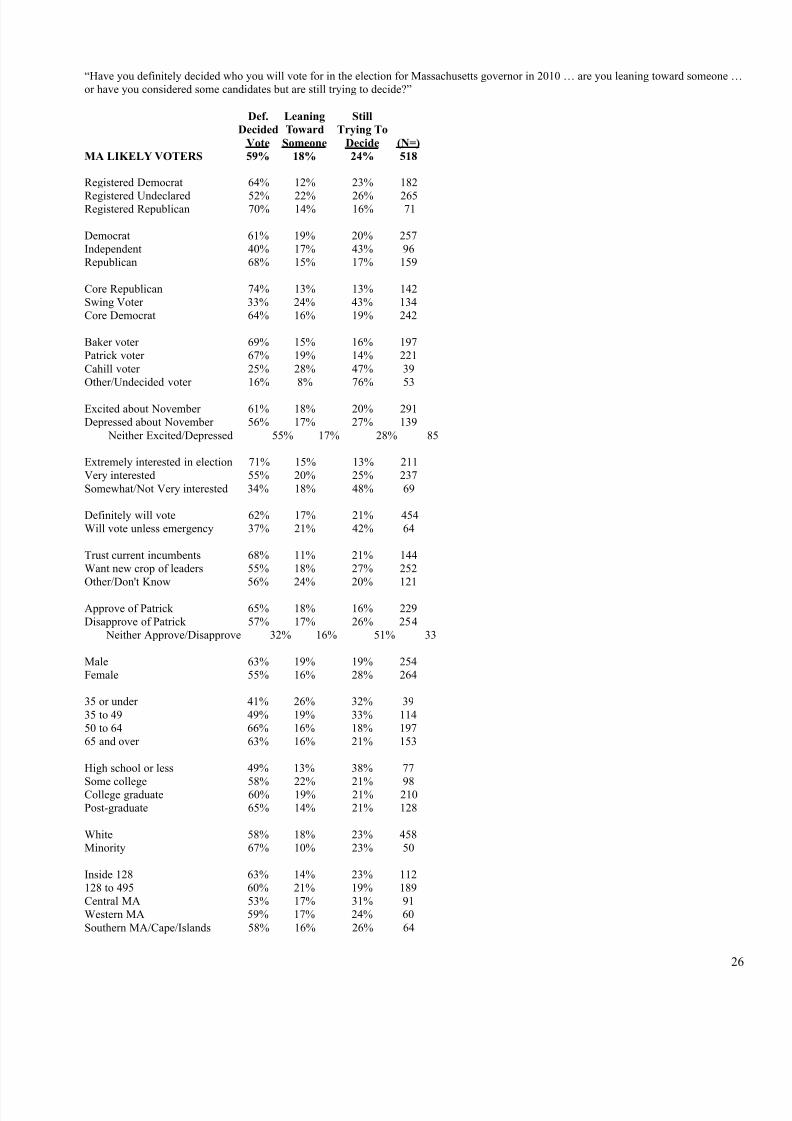
“Have you definitely decided who you will vote for in the election for Massachusetts governor in 2010 … are you leaning toward someone …or have you considered some candidates but are still trying to decide?”
Def. Leaning Still
Decided Toward Trying To
Vote Someone Decide (N=)
MA LIKELY VOTERS 59% 18% 24% 518
Registered Democrat 64% 12% 23% 182
Registered Undeclared 52% 22% 26% 265Registered Republican 70% 14% 16% 71
Democrat 61% 19% 20% 257Independent 40% 17% 43% 96Republican 68% 15% 17% 159
Core Republican 74% 13% 13% 142Swing Voter 33% 24% 43% 134Core Democrat 64% 16% 19% 242
Baker voter 69% 15% 16% 197Patrick voter 67% 19% 14% 221Cahill voter 25% 28% 47% 39Other/Undecided voter 16% 8% 76% 53
Excited about November 61% 18% 20% 291Depressed about November 56% 17% 27% 139
Neither Excited/Depressed 55% 17% 28% 85
Extremely interested in election 71% 15% 13% 211Very interested 55% 20% 25% 237Somewhat/Not Very interested 34% 18% 48% 69
Definitely will vote 62% 17% 21% 454Will vote unless emergency 37% 21% 42% 64
Trust current incumbents 68% 11% 21% 144Want new crop of leaders 55% 18% 27% 252Other/Don't Know 56% 24% 20% 121
Approve of Patrick 65% 18% 16% 229Disapprove of Patrick 57% 17% 26% 254
Neither Approve/Disapprove 32% 16% 51% 33
Male 63% 19% 19% 254Female 55% 16% 28% 264
35 or under 41% 26% 32% 3935 to 49 49% 19% 33% 11450 to 64 66% 16% 18% 19765 and over 63% 16% 21% 153
High school or less 49% 13% 38% 77
Some college 58% 22% 21% 98College graduate 60% 19% 21% 210Post-graduate 65% 14% 21% 128
White 58% 18% 23% 458Minority 67% 10% 23% 50
Inside 128 63% 14% 23% 112128 to 495 60% 21% 19% 189Central MA 53% 17% 31% 91Western MA 59% 17% 24% 60Southern MA/Cape/Islands 58% 16% 26% 64

8/8/2019 Boston Globe poll on key political races in Mass.
http://slidepdf.com/reader/full/boston-globe-poll-on-key-political-races-in-mass 29/43
27
“If the 2010 Massachusetts gubernatorial election was being held TODAY and the candidates are Charlie Baker, the Republican … DevalPatrick, the Democrat … Tim Cahill, the Independent … and Jill Stein, the Green-Rainbow candidate, who would you vote for ... CharlieBaker … Deval Patrick … Tim Cahill … or Jill Stein?”
Don't
Baker Patrick Cahill Stein Other Know (N=)
MA LIKELY VOTERS 39% 43% 8% 2% 1% 8% 512
Registered Democrat 9% 71% 7% 3% 0% 10% 181
Registered Undeclared 47% 33% 9% 2% 2% 7% 260Registered Republican 82% 10% 4% 0% 0% 4% 72
Democrat 8% 78% 7% 1% 0% 6% 255Independent 49% 9% 14% 9% 2% 18% 91Republican 83% 7% 5% 0% 1% 4% 160
Core Republican 90% 3% 3% 0% 0% 4% 144Swing Voter 47% 15% 16% 4% 2% 16% 128Core Democrat 4% 82% 6% 2% 0% 5% 241
Excited about November 53% 33% 7% 1% 0% 6% 291Depressed about November 15% 65% 5% 6% 1% 8% 137
Neither Excited/Depressed 29% 44% 14% 0% 1% 12% 82
Extremely interested in election 53% 29% 11% 1% 0% 6% 208Very interested 31% 52% 6% 1% 2% 8% 235Somewhat/Not Very interested 22% 56% 3% 8% 1% 11% 69
Definitely will vote 40% 41% 8% 2% 1% 7% 449Will vote unless emergency 28% 55% 5% 0% 2% 10% 63
Trust current incumbents 9% 82% 4% 1% 0% 4% 144Want new crop of leaders 64% 14% 9% 4% 1% 8% 249Other/Don't Know 22% 56% 10% 0% 1% 11% 119
Approve of Patrick 6% 82% 4% 1% 0% 7% 227Disapprove of Patrick 72% 6% 10% 4% 2% 6% 252
Neither Approve/Disapprove 7% 58% 14% 0% 0% 21% 32
Male 46% 37% 9% 2% 1% 5% 250Female 32% 49% 6% 3% 1% 10% 262
35 or under 36% 41% 6% 7% 3% 6% 3935 to 49 43% 37% 12% 1% 0% 6% 11450 to 64 38% 50% 6% 0% 1% 6% 19065 and over 38% 41% 7% 4% 0% 9% 154
High school or less 53% 22% 15% 2% 1% 7% 74Some college 37% 44% 8% 1% 1% 8% 97College graduate 40% 42% 7% 3% 1% 7% 208Post-graduate 31% 58% 3% 2% 0% 6% 129
White 41% 42% 8% 1% 1% 7% 454
Minority 13% 62% 1% 11% 2% 10% 50
Inside 128 24% 53% 13% 2% 0% 8% 110128 to 495 46% 41% 4% 2% 1% 6% 186Central MA 48% 36% 7% 1% 1% 7% 91Western MA 32% 40% 14% 2% 0% 12% 60Southern MA/Cape/Islands 36% 45% 5% 5% 1% 7% 65

8/8/2019 Boston Globe poll on key political races in Mass.
http://slidepdf.com/reader/full/boston-globe-poll-on-key-political-races-in-mass 30/43
28
“Who would your second choice be?”
No Second Don't
Baker Patrick Cahill Stein Other Choice Know (N=)
MA LIKELY VOTERS 8% 6% 25% 13% 1% 44% 3% 472
Registered Democrat 8% 5% 24% 21% 0% 40% 2% 162Registered Undeclared 9% 8% 24% 10% 1% 44% 3% 242Registered Republican 5% 4% 28% 5% 2% 53% 2% 69
Democrat 10% 4% 25% 21% 1% 37% 3% 238Independent 6% 13% 16% 6% 1% 55% 3% 75Republican 6% 6% 30% 5% 2% 49% 2% 154
Core Republican 4% 5% 25% 6% 2% 55% 3% 137Swing Voter 11% 13% 29% 4% 2% 39% 2% 107Core Democrat 9% 4% 23% 22% 0% 39% 3% 228
Baker voter 1% 9% 29% 4% 2% 52% 2% 198Patrick voter 8% 0% 27% 22% 0% 40% 3% 220Cahill voter 46% 22% 0% 13% 1% 16% 2% 39Other/Undecided voter 0% 16% 12% 0% 0% 64% 8% 15
Excited about November 6% 6% 25% 9% 1% 50% 3% 273
Depressed about November 6% 3% 25% 24% 1% 38% 2% 125 Neither Excited/Depressed 17% 11% 25% 11% 1% 32% 4% 72
Extremely interested in election 8% 4% 26% 12% 2% 48% 1% 194Very interested 8% 7% 25% 16% 1% 39% 4% 217Somewhat/Not Very interested 9% 10% 22% 7% 0% 49% 4% 61
Definitely will vote 8% 6% 26% 14% 1% 43% 2% 416Will vote unless emergency 8% 5% 17% 7% 0% 54% 9% 57
Trust current incumbents 6% 3% 23% 25% 0% 39% 4% 137Want new crop of leaders 9% 8% 22% 6% 2% 50% 3% 230Other/Don't Know 9% 5% 34% 13% 0% 38% 1% 105
Approve of Patrick 6% 5% 24% 20% 0% 41% 3% 209Disapprove of Patrick 9% 7% 25% 6% 2% 48% 3% 236
Neither Approve/Disapprove 11% 9% 32% 17% 0% 29% 2% 25
Male 8% 6% 26% 13% 1% 45% 1% 236Female 8% 6% 24% 13% 1% 43% 4% 237
35 or under 0% 9% 34% 8% 3% 40% 6% 3735 to 49 12% 5% 24% 12% 0% 42% 6% 10850 to 64 5% 4% 33% 18% 2% 38% 0% 17965 and over 9% 9% 14% 9% 0% 55% 3% 138
High school or less 16% 12% 20% 2% 5% 38% 7% 69Some college 7% 7% 24% 8% 1% 50% 3% 89College graduate 7% 6% 27% 13% 1% 45% 1% 194
Post-graduate 4% 2% 25% 24% 0% 41% 4% 120
White 8% 6% 26% 13% 1% 42% 3% 422Minority 4% 5% 18% 18% 0% 55% 0% 45
Inside 128 12% 8% 21% 14% 0% 43% 2% 101128 to 495 5% 6% 30% 11% 2% 45% 1% 173Central MA 6% 5% 27% 13% 1% 45% 3% 85Western MA 11% 10% 16% 18% 1% 40% 5% 54Southern MA/Cape/Islands 10% 3% 22% 14% 0% 46% 6% 60

8/8/2019 Boston Globe poll on key political races in Mass.
http://slidepdf.com/reader/full/boston-globe-poll-on-key-political-races-in-mass 31/43
29
“If the 2010 election for Massachusetts state Treasurer was being held TODAY and the candidates are Karyn Polito, the Republican andSteve Grossman, the Democrat, who would you vote for ... Karyn Polito … or Steve Grossman?”
Don't
Polito Grossman Other Know (N=)
MA LIKELY VOTERS 37% 39% 1% 23% 515
Registered Democrat 13% 69% 0% 17% 182Registered Undeclared 44% 27% 2% 28% 261
Registered Republican 72% 7% 0% 21% 72
Democrat 12% 66% 0% 22% 257Independent 44% 22% 3% 31% 91Republican 73% 7% 1% 19% 161
Core Republican 83% 3% 0% 14% 144Swing Voter 40% 21% 3% 36% 129Core Democrat 8% 70% 0% 21% 242
Excited about November 48% 28% 1% 23% 291Depressed about November 18% 59% 0% 22% 140
Neither Excited/Depressed 31% 45% 0% 24% 82
Extremely interested in election 51% 31% 1% 17% 210
Very interested 29% 46% 1% 24% 235Somewhat/Not Very interested 21% 41% 0% 38% 69
Definitely will vote 39% 39% 1% 21% 451Will vote unless emergency 26% 38% 1% 36% 64
Trust current incumbents 15% 65% 0% 20% 145Want new crop of leaders 58% 20% 2% 20% 250Other/Don't Know 19% 49% 0% 32% 119
Approve of Patrick 14% 62% 0% 24% 229Disapprove of Patrick 61% 18% 2% 19% 252
Neither Approve/Disapprove 13% 41% 0% 46% 32
Male 45% 36% 1% 17% 251Female 29% 42% 0% 28% 263
35 or under 39% 34% 3% 23% 3935 to 49 44% 33% 0% 23% 11450 to 64 33% 46% 0% 21% 19365 and over 37% 38% 2% 24% 155
High school or less 53% 28% 1% 19% 74Some college 40% 36% 1% 23% 98College graduate 37% 41% 0% 22% 209Post-graduate 26% 46% 1% 26% 129
White 39% 37% 1% 23% 457Minority 15% 63% 2% 20% 50
Inside 128 21% 59% 0% 20% 112128 to 495 38% 34% 1% 27% 186Central MA 52% 23% 2% 23% 91Western MA 41% 40% 0% 19% 60Southern MA/Cape/Islands 36% 43% 0% 21% 65

8/8/2019 Boston Globe poll on key political races in Mass.
http://slidepdf.com/reader/full/boston-globe-poll-on-key-political-races-in-mass 32/43
30
“And if the 2010 election for Massachusetts state Auditor was being held TODAY and the candidates are Mary Connaughton, the Republicanand Suzanne Bump, the Democrat, who would you vote for ... Mary Connaughton … or Suzanne Bump”
Conn- Don't
aughton Bump Other Know (N=)
MA LIKELY VOTERS 32% 33% 2% 33% 509
Registered Democrat 10% 62% 1% 27% 180Registered Undeclared 40% 18% 3% 39% 257
Registered Republican 57% 15% 0% 29% 72
Democrat 12% 54% 2% 32% 253Independent 37% 13% 4% 46% 91Republican 61% 11% 1% 27% 159
Core Republican 71% 6% 1% 22% 142Swing Voter 31% 16% 4% 49% 127Core Democrat 9% 58% 1% 31% 239
Excited about November 40% 24% 2% 34% 290Depressed about November 16% 48% 2% 34% 135
Neither Excited/Depressed 30% 39% 0% 30% 82
Extremely interested in election 44% 28% 2% 27% 208
Very interested 25% 38% 3% 35% 231Somewhat/Not Very interested 20% 33% 0% 47% 69
Definitely will vote 34% 31% 2% 33% 447Will vote unless emergency 18% 44% 0% 38% 61
Trust current incumbents 13% 56% 1% 30% 143Want new crop of leaders 51% 16% 2% 31% 246Other/Don't Know 16% 41% 2% 41% 119
Approve of Patrick 12% 50% 2% 36% 224Disapprove of Patrick 51% 17% 2% 30% 251
Neither Approve/Disapprove 19% 38% 0% 43% 32
Male 38% 29% 3% 30% 250Female 26% 37% 1% 36% 259
35 or under 17% 41% 7% 35% 3935 to 49 33% 26% 1% 40% 11450 to 64 30% 39% 0% 30% 18765 and over 36% 29% 3% 32% 154
High school or less 40% 28% 1% 32% 73Some college 29% 31% 3% 38% 96College graduate 34% 33% 1% 32% 207Post-graduate 26% 39% 3% 32% 128
White 34% 30% 2% 34% 452Minority 11% 64% 3% 22% 49
Inside 128 24% 42% 1% 34% 109128 to 495 37% 26% 2% 35% 185Central MA 38% 22% 4% 37% 90Western MA 29% 39% 2% 30% 60Southern MA/Cape/Islands 26% 47% 2% 25% 64
8/8/2019 Boston Globe poll on key political races in Mass.
http://slidepdf.com/reader/full/boston-globe-poll-on-key-political-races-in-mass 33/43
31
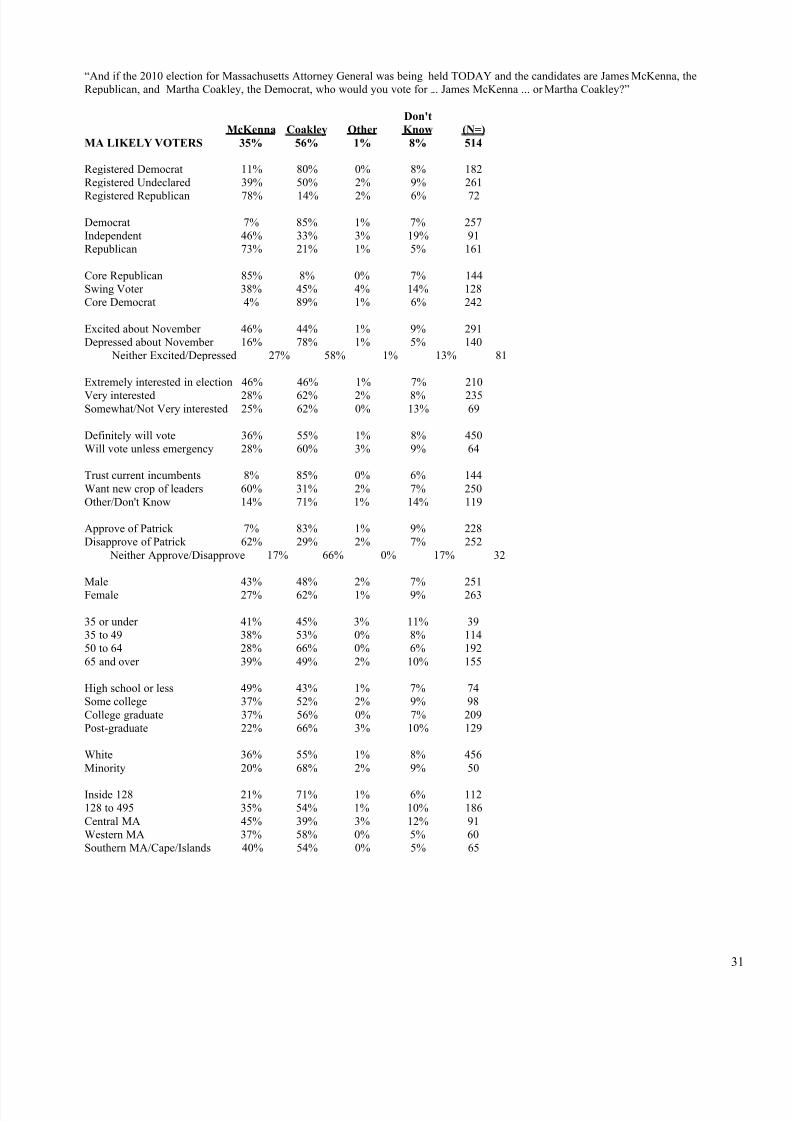
“And if the 2010 election for Massachusetts Attorney General was being held TODAY and the candidates are James McKenna, theRepublican, and Martha Coakley, the Democrat, who would you vote for ... James McKenna ... or Martha Coakley?”
Don't
McKenna Coakley Other Know (N=)
MA LIKELY VOTERS 35% 56% 1% 8% 514
Registered Democrat 11% 80% 0% 8% 182Registered Undeclared 39% 50% 2% 9% 261
Registered Republican 78% 14% 2% 6% 72
Democrat 7% 85% 1% 7% 257Independent 46% 33% 3% 19% 91Republican 73% 21% 1% 5% 161
Core Republican 85% 8% 0% 7% 144Swing Voter 38% 45% 4% 14% 128Core Democrat 4% 89% 1% 6% 242
Excited about November 46% 44% 1% 9% 291Depressed about November 16% 78% 1% 5% 140
Neither Excited/Depressed 27% 58% 1% 13% 81
Extremely interested in election 46% 46% 1% 7% 210
Very interested 28% 62% 2% 8% 235Somewhat/Not Very interested 25% 62% 0% 13% 69
Definitely will vote 36% 55% 1% 8% 450Will vote unless emergency 28% 60% 3% 9% 64
Trust current incumbents 8% 85% 0% 6% 144Want new crop of leaders 60% 31% 2% 7% 250Other/Don't Know 14% 71% 1% 14% 119
Approve of Patrick 7% 83% 1% 9% 228Disapprove of Patrick 62% 29% 2% 7% 252
Neither Approve/Disapprove 17% 66% 0% 17% 32
Male 43% 48% 2% 7% 251Female 27% 62% 1% 9% 263
35 or under 41% 45% 3% 11% 3935 to 49 38% 53% 0% 8% 11450 to 64 28% 66% 0% 6% 19265 and over 39% 49% 2% 10% 155
High school or less 49% 43% 1% 7% 74Some college 37% 52% 2% 9% 98College graduate 37% 56% 0% 7% 209Post-graduate 22% 66% 3% 10% 129
White 36% 55% 1% 8% 456Minority 20% 68% 2% 9% 50
Inside 128 21% 71% 1% 6% 112128 to 495 35% 54% 1% 10% 186Central MA 45% 39% 3% 12% 91Western MA 37% 58% 0% 5% 60Southern MA/Cape/Islands 40% 54% 0% 5% 65
8/8/2019 Boston Globe poll on key political races in Mass.
http://slidepdf.com/reader/full/boston-globe-poll-on-key-political-races-in-mass 34/43
32
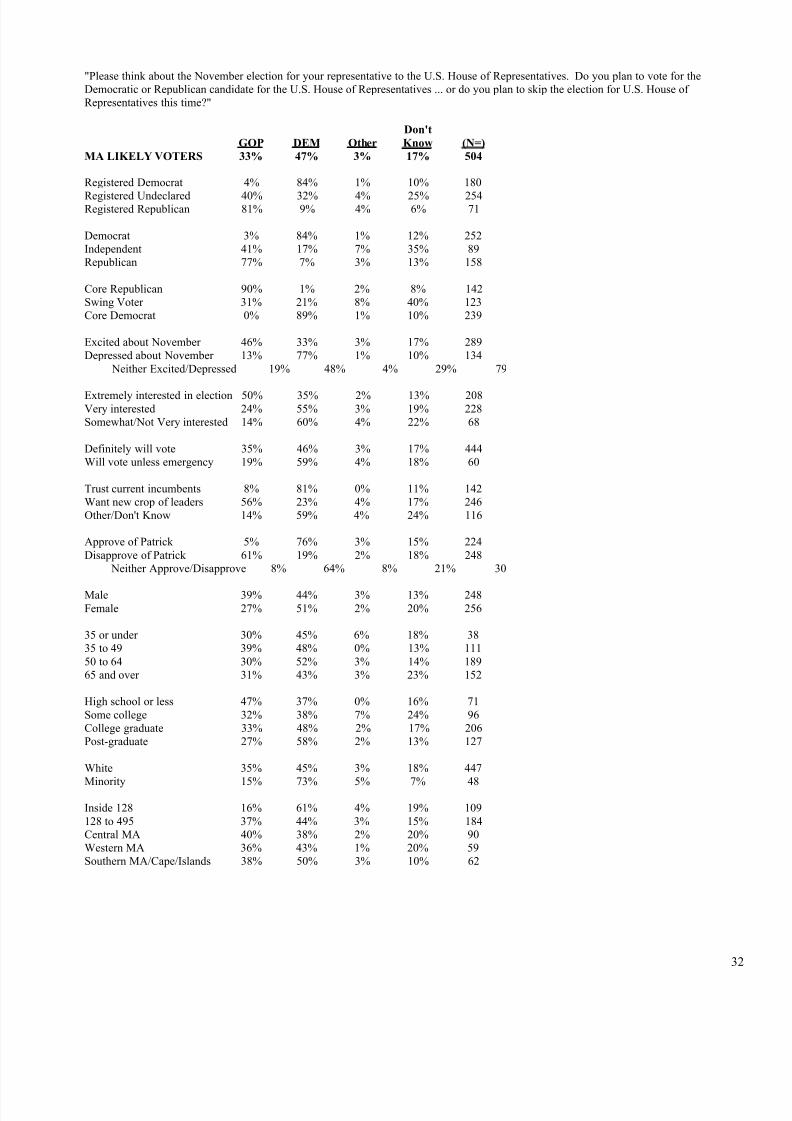
"Please think about the November election for your representative to the U.S. House of Representatives. Do you plan to vote for theDemocratic or Republican candidate for the U.S. House of Representatives ... or do you plan to skip the election for U.S. House of Representatives this time?"
Don't
GOP DEM Other Know (N=)
MA LIKELY VOTERS 33% 47% 3% 17% 504
Registered Democrat 4% 84% 1% 10% 180
Registered Undeclared 40% 32% 4% 25% 254Registered Republican 81% 9% 4% 6% 71
Democrat 3% 84% 1% 12% 252Independent 41% 17% 7% 35% 89Republican 77% 7% 3% 13% 158
Core Republican 90% 1% 2% 8% 142Swing Voter 31% 21% 8% 40% 123Core Democrat 0% 89% 1% 10% 239
Excited about November 46% 33% 3% 17% 289Depressed about November 13% 77% 1% 10% 134
Neither Excited/Depressed 19% 48% 4% 29% 79
Extremely interested in election 50% 35% 2% 13% 208Very interested 24% 55% 3% 19% 228Somewhat/Not Very interested 14% 60% 4% 22% 68
Definitely will vote 35% 46% 3% 17% 444Will vote unless emergency 19% 59% 4% 18% 60
Trust current incumbents 8% 81% 0% 11% 142Want new crop of leaders 56% 23% 4% 17% 246Other/Don't Know 14% 59% 4% 24% 116
Approve of Patrick 5% 76% 3% 15% 224Disapprove of Patrick 61% 19% 2% 18% 248
Neither Approve/Disapprove 8% 64% 8% 21% 30
Male 39% 44% 3% 13% 248Female 27% 51% 2% 20% 256
35 or under 30% 45% 6% 18% 3835 to 49 39% 48% 0% 13% 11150 to 64 30% 52% 3% 14% 18965 and over 31% 43% 3% 23% 152
High school or less 47% 37% 0% 16% 71Some college 32% 38% 7% 24% 96College graduate 33% 48% 2% 17% 206Post-graduate 27% 58% 2% 13% 127
White 35% 45% 3% 18% 447
Minority 15% 73% 5% 7% 48
Inside 128 16% 61% 4% 19% 109128 to 495 37% 44% 3% 15% 184Central MA 40% 38% 2% 20% 90Western MA 36% 43% 1% 20% 59Southern MA/Cape/Islands 38% 50% 3% 10% 62

8/8/2019 Boston Globe poll on key political races in Mass.
http://slidepdf.com/reader/full/boston-globe-poll-on-key-political-races-in-mass 35/43
33
"And turning to the November election for your representative for the Massachusetts House of Representatives. Do you plan to vote for theDemocratic or Republican candidate for the Massachusetts House of Representatives ... or do you plan to skip the election for MassachusettsHouse of Representatives this time?"
Don't
GOP DEM Other Know (N=)
MA LIKELY VOTERS 35% 47% 1% 18% 502
Registered Democrat 7% 85% 0% 8% 178
Registered Undeclared 40% 31% 2% 27% 255Registered Republican 84% 6% 2% 8% 69
Democrat 5% 82% 0% 13% 251Independent 43% 16% 5% 36% 89Republican 77% 9% 1% 12% 157
Core Republican 88% 1% 0% 11% 143Swing Voter 37% 20% 5% 38% 123Core Democrat 1% 88% 0% 11% 236
Excited about November 46% 36% 1% 17% 285Depressed about November 14% 69% 1% 16% 135
Neither Excited/Depressed 26% 48% 3% 23% 79
Extremely interested in election 50% 36% 1% 13% 208Very interested 26% 53% 2% 20% 228Somewhat/Not Very interested 16% 60% 1% 23% 65
Definitely will vote 36% 46% 1% 17% 440Will vote unless emergency 22% 54% 1% 23% 61
Trust current incumbents 11% 80% 0% 9% 139Want new crop of leaders 54% 22% 2% 22% 244Other/Don't Know 22% 58% 2% 19% 118
Approve of Patrick 7% 74% 1% 18% 224Disapprove of Patrick 62% 19% 1% 18% 246
Neither Approve/Disapprove 11% 74% 3% 11% 30
Male 41% 41% 2% 16% 245Female 29% 52% 1% 19% 256
35 or under 29% 34% 3% 34% 3735 to 49 42% 45% 0% 13% 11150 to 64 34% 52% 0% 14% 18965 and over 32% 45% 3% 21% 151
High school or less 51% 37% 0% 12% 70Some college 36% 40% 2% 22% 95College graduate 32% 47% 0% 20% 207Post-graduate 28% 56% 3% 13% 125
White 37% 44% 1% 18% 449
Minority 12% 74% 5% 9% 45
Inside 128 14% 59% 1% 26% 109128 to 495 41% 43% 2% 14% 184Central MA 41% 38% 2% 19% 90Western MA 34% 46% 0% 20% 59Southern MA/Cape/Islands 41% 49% 1% 9% 59

8/8/2019 Boston Globe poll on key political races in Mass.
http://slidepdf.com/reader/full/boston-globe-poll-on-key-political-races-in-mass 36/43
34
“As you may know, Question 1 on the November ballot is a proposal to eliminate sales tax on alcohol sold in Massachusetts. Do you favor oroppose ballot Question 1, the proposal to eliminate the sales tax on alcohol sold in Massachusetts, or haven’t you thought about this enough tosay?”
Strongly Somewhat Somewhat Strongly Don't
Favor Favor Oppose Oppose Know (N=)
MA LIKELY VOTERS 29% 8% 14% 38% 11% 518
Registered Democrat 20% 6% 15% 44% 14% 182
Registered Undeclared 31% 9% 14% 36% 10% 264Registered Republican 43% 10% 13% 27% 8% 72
Democrat 14% 7% 16% 50% 13% 257Independent 48% 4% 13% 27% 8% 94Republican 42% 12% 12% 23% 10% 161
Core Republican 49% 8% 13% 22% 8% 144Swing Voter 35% 10% 13% 31% 11% 132Core Democrat 14% 7% 16% 50% 13% 242
Baker voter 51% 10% 10% 21% 8% 198Patrick voter 11% 7% 16% 52% 13% 221Cahill voter 28% 12% 10% 39% 12% 39Other/Undecided voter 23% 6% 23% 35% 13% 53
Excited about November 35% 9% 13% 35% 9% 293Depressed about November 19% 8% 14% 47% 13% 140
Neither Excited/Depressed 23% 8% 21% 33% 15% 83
Extremely interested in election 41% 7% 9% 33% 10% 211Very interested 23% 8% 19% 41% 10% 237Somewhat/Not Very interested 12% 13% 15% 43% 17% 69
Definitely will vote 31% 8% 13% 38% 10% 454Will vote unless emergency 13% 13% 21% 36% 18% 64
Trust current incumbents 11% 3% 17% 59% 10% 145Want new crop of leaders 42% 10% 11% 26% 10% 252Other/Don't Know 22% 10% 18% 36% 14% 121
Approve of Patrick 12% 8% 18% 49% 13% 229Disapprove of Patrick 46% 9% 10% 29% 6% 253
Neither Approve/Disapprove 16% 2% 20% 28% 34% 34
Male 33% 11% 12% 36% 8% 254Female 25% 5% 16% 39% 14% 264
35 or under 34% 22% 16% 21% 7% 3935 to 49 23% 10% 12% 45% 10% 11450 to 64 31% 6% 16% 40% 8% 19565 and over 27% 6% 15% 36% 17% 155
High school or less 38% 9% 15% 27% 12% 75
Some college 29% 7% 18% 32% 14% 98College graduate 32% 11% 13% 36% 9% 210Post-graduate 18% 5% 14% 50% 13% 129
White 29% 8% 14% 39% 10% 460Minority 23% 12% 19% 29% 18% 50
Inside 128 25% 11% 15% 40% 9% 112128 to 495 32% 6% 12% 38% 12% 189Central MA 31% 9% 12% 38% 11% 91Western MA 22% 8% 13% 40% 16% 60Southern MA/Cape/Islands 28% 10% 24% 30% 8% 65
8/8/2019 Boston Globe poll on key political races in Mass.
http://slidepdf.com/reader/full/boston-globe-poll-on-key-political-races-in-mass 37/43
35
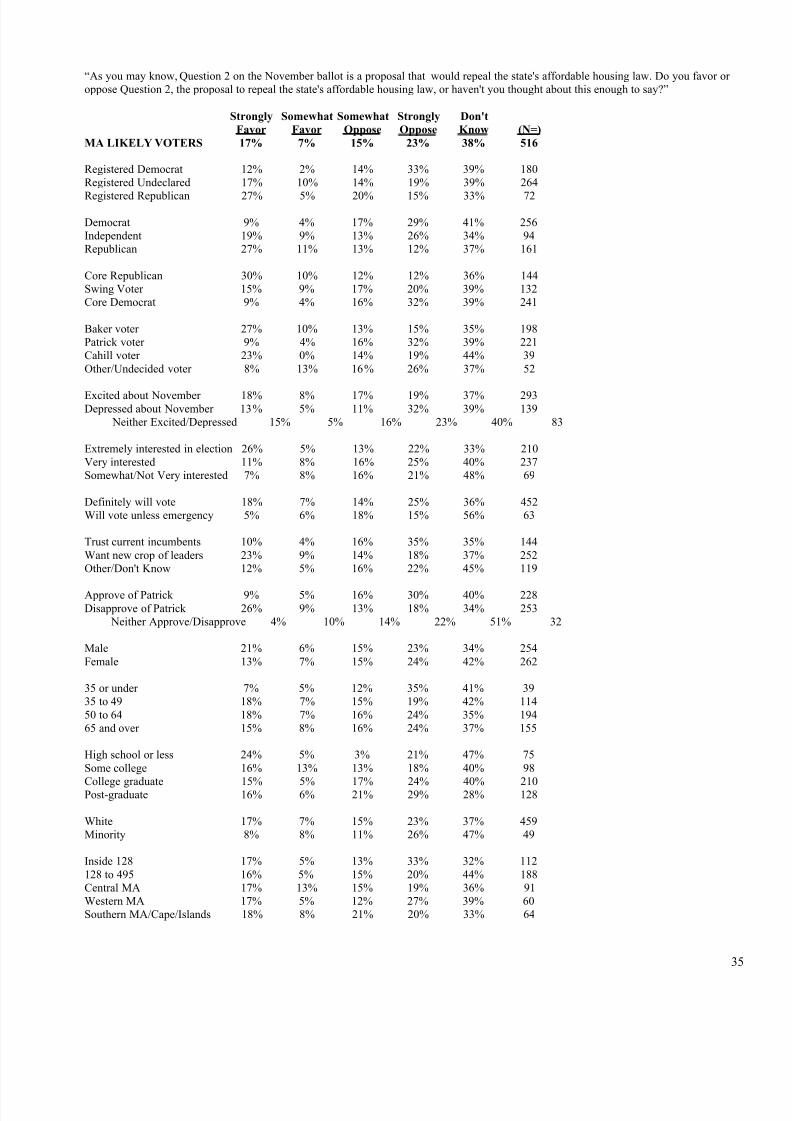
“As you may know, Question 2 on the November ballot is a proposal that would repeal the state's affordable housing law. Do you favor or oppose Question 2, the proposal to repeal the state's affordable housing law, or haven't you thought about this enough to say?”
Strongly Somewhat Somewhat Strongly Don't
Favor Favor Oppose Oppose Know (N=)
MA LIKELY VOTERS 17% 7% 15% 23% 38% 516
Registered Democrat 12% 2% 14% 33% 39% 180Registered Undeclared 17% 10% 14% 19% 39% 264
Registered Republican 27% 5% 20% 15% 33% 72
Democrat 9% 4% 17% 29% 41% 256Independent 19% 9% 13% 26% 34% 94Republican 27% 11% 13% 12% 37% 161
Core Republican 30% 10% 12% 12% 36% 144Swing Voter 15% 9% 17% 20% 39% 132Core Democrat 9% 4% 16% 32% 39% 241
Baker voter 27% 10% 13% 15% 35% 198Patrick voter 9% 4% 16% 32% 39% 221Cahill voter 23% 0% 14% 19% 44% 39Other/Undecided voter 8% 13% 16% 26% 37% 52
Excited about November 18% 8% 17% 19% 37% 293Depressed about November 13% 5% 11% 32% 39% 139
Neither Excited/Depressed 15% 5% 16% 23% 40% 83
Extremely interested in election 26% 5% 13% 22% 33% 210Very interested 11% 8% 16% 25% 40% 237Somewhat/Not Very interested 7% 8% 16% 21% 48% 69
Definitely will vote 18% 7% 14% 25% 36% 452Will vote unless emergency 5% 6% 18% 15% 56% 63
Trust current incumbents 10% 4% 16% 35% 35% 144Want new crop of leaders 23% 9% 14% 18% 37% 252Other/Don't Know 12% 5% 16% 22% 45% 119
Approve of Patrick 9% 5% 16% 30% 40% 228Disapprove of Patrick 26% 9% 13% 18% 34% 253
Neither Approve/Disapprove 4% 10% 14% 22% 51% 32
Male 21% 6% 15% 23% 34% 254Female 13% 7% 15% 24% 42% 262
35 or under 7% 5% 12% 35% 41% 3935 to 49 18% 7% 15% 19% 42% 11450 to 64 18% 7% 16% 24% 35% 19465 and over 15% 8% 16% 24% 37% 155
High school or less 24% 5% 3% 21% 47% 75Some college 16% 13% 13% 18% 40% 98
College graduate 15% 5% 17% 24% 40% 210Post-graduate 16% 6% 21% 29% 28% 128
White 17% 7% 15% 23% 37% 459Minority 8% 8% 11% 26% 47% 49
Inside 128 17% 5% 13% 33% 32% 112128 to 495 16% 5% 15% 20% 44% 188Central MA 17% 13% 15% 19% 36% 91Western MA 17% 5% 12% 27% 39% 60Southern MA/Cape/Islands 18% 8% 21% 20% 33% 64

8/8/2019 Boston Globe poll on key political races in Mass.
http://slidepdf.com/reader/full/boston-globe-poll-on-key-political-races-in-mass 38/43
36
“And as you may know, Question 3 on the November ballot is a proposal to reduce the state sales tax from 6 point two-five percent to 3 percent. Do you favor or oppose ballot Question 3, the proposal to reduce the state sales tax from 6 point two-five percent to 3 percent, or haven’t you thought about this enough to say?”
Strongly Somewhat Somewhat Strongly Don't
Favor Favor Oppose Oppose Know (N=)
MA LIKELY VOTERS 35% 8% 12% 38% 7% 518
Registered Democrat 20% 6% 12% 53% 9% 182
Registered Undeclared 39% 8% 13% 35% 4% 264Registered Republican 59% 10% 12% 11% 8% 72
Democrat 15% 7% 12% 59% 7% 257Independent 53% 5% 9% 27% 6% 94Republican 57% 11% 14% 12% 6% 161
Core Republican 65% 11% 14% 7% 3% 144Swing Voter 44% 6% 12% 30% 8% 132Core Democrat 13% 6% 12% 61% 8% 242
Baker voter 59% 9% 12% 16% 4% 198Patrick voter 10% 8% 11% 62% 9% 221Cahill voter 55% 8% 10% 26% 2% 39Other/Undecided voter 39% 4% 16% 33% 8% 53
Excited about November 48% 9% 8% 30% 5% 293Depressed about November 15% 3% 16% 55% 10% 140
Neither Excited/Depressed 25% 11% 20% 38% 6% 83
Extremely interested in election 51% 5% 8% 29% 7% 211Very interested 25% 9% 13% 48% 5% 237Somewhat/Not Very interested 23% 10% 23% 33% 12% 69
Definitely will vote 37% 8% 10% 39% 6% 454Will vote unless emergency 22% 7% 28% 33% 10% 64
Trust current incumbents 12% 3% 16% 63% 6% 145Want new crop of leaders 55% 10% 11% 19% 4% 252Other/Don't Know 22% 9% 10% 48% 12% 121
Approve of Patrick 11% 6% 13% 62% 7% 229Disapprove of Patrick 58% 8% 10% 17% 6% 253
Neither Approve/Disapprove 29% 7% 20% 32% 11% 34
Male 42% 7% 11% 36% 4% 254Female 28% 9% 13% 41% 9% 264
35 or under 43% 4% 18% 27% 8% 3935 to 49 41% 7% 17% 32% 3% 11450 to 64 34% 6% 12% 45% 4% 19565 and over 30% 11% 9% 39% 10% 155
High school or less 45% 6% 16% 28% 4% 75
Some college 37% 12% 13% 31% 7% 98College graduate 36% 9% 10% 39% 6% 210Post-graduate 27% 3% 13% 48% 8% 129
White 35% 8% 12% 40% 6% 460Minority 37% 8% 20% 26% 10% 50
Inside 128 26% 11% 6% 50% 7% 112128 to 495 37% 7% 12% 36% 8% 189Central MA 40% 5% 13% 36% 5% 91Western MA 33% 8% 16% 37% 5% 60Southern MA/Cape/Islands 41% 8% 18% 26% 6% 65

8/8/2019 Boston Globe poll on key political races in Mass.
http://slidepdf.com/reader/full/boston-globe-poll-on-key-political-races-in-mass 39/43
37
“Which candidate do you think is the strongest leader?”
Don't
Baker Patrick Cahill Other Know (N=)
MA LIKELY VOTERS 40% 42% 5% 1% 12% 496
Registered Democrat 16% 67% 4% 0% 12% 172Registered Undeclared 47% 33% 6% 1% 13% 257Registered Republican 78% 11% 4% 0% 8% 67
Democrat 16% 68% 4% 0% 11% 247Independent 45% 22% 11% 1% 20% 88Republican 78% 9% 3% 1% 9% 154
Core Republican 80% 7% 4% 0% 10% 139Swing Voter 48% 22% 9% 3% 18% 127Core Democrat 13% 73% 4% 0% 11% 229
Baker voter 84% 7% 1% 1% 8% 194Patrick voter 8% 83% 1% 0% 7% 211Cahill voter 28% 19% 45% 0% 9% 37Other/Undecided voter 18% 22% 7% 5% 48% 47
Excited about November 50% 32% 6% 1% 11% 290
Depressed about November 19% 66% 3% 0% 12% 124 Neither Excited/Depressed 40% 40% 5% 0% 15% 80
Extremely interested in election 53% 34% 4% 1% 8% 206Very interested 32% 48% 5% 1% 14% 228Somewhat/Not Very interested 30% 45% 7% 0% 18% 62
Definitely will vote 41% 41% 5% 1% 12% 437Will vote unless emergency 40% 43% 4% 0% 12% 59
Trust current incumbents 15% 73% 3% 0% 9% 138Want new crop of leaders 65% 17% 6% 1% 10% 241Other/Don't Know 21% 54% 6% 0% 19% 116
Approve of Patrick 10% 76% 4% 0% 9% 219Disapprove of Patrick 71% 10% 6% 1% 12% 245
Neither Approve/Disapprove 12% 44% 4% 4% 36% 31
Male 50% 35% 5% 1% 9% 247Female 31% 48% 5% 0% 16% 249
35 or under 36% 41% 6% 6% 12% 3935 to 49 50% 31% 6% 1% 11% 11150 to 64 36% 48% 5% 0% 11% 19065 and over 39% 42% 4% 0% 15% 142
High school or less 50% 28% 8% 0% 14% 72Some college 39% 42% 4% 1% 14% 96College graduate 40% 40% 7% 1% 12% 198
Post-graduate 37% 53% 1% 0% 9% 125
White 42% 41% 5% 1% 11% 440Minority 17% 52% 9% 3% 19% 46
Inside 128 33% 54% 3% 0% 11% 104128 to 495 49% 36% 4% 0% 11% 184Central MA 49% 30% 7% 1% 12% 88Western MA 21% 51% 11% 2% 15% 57Southern MA/Cape/Islands 34% 47% 3% 2% 14% 63
8/8/2019 Boston Globe poll on key political races in Mass.
http://slidepdf.com/reader/full/boston-globe-poll-on-key-political-races-in-mass 40/43
38
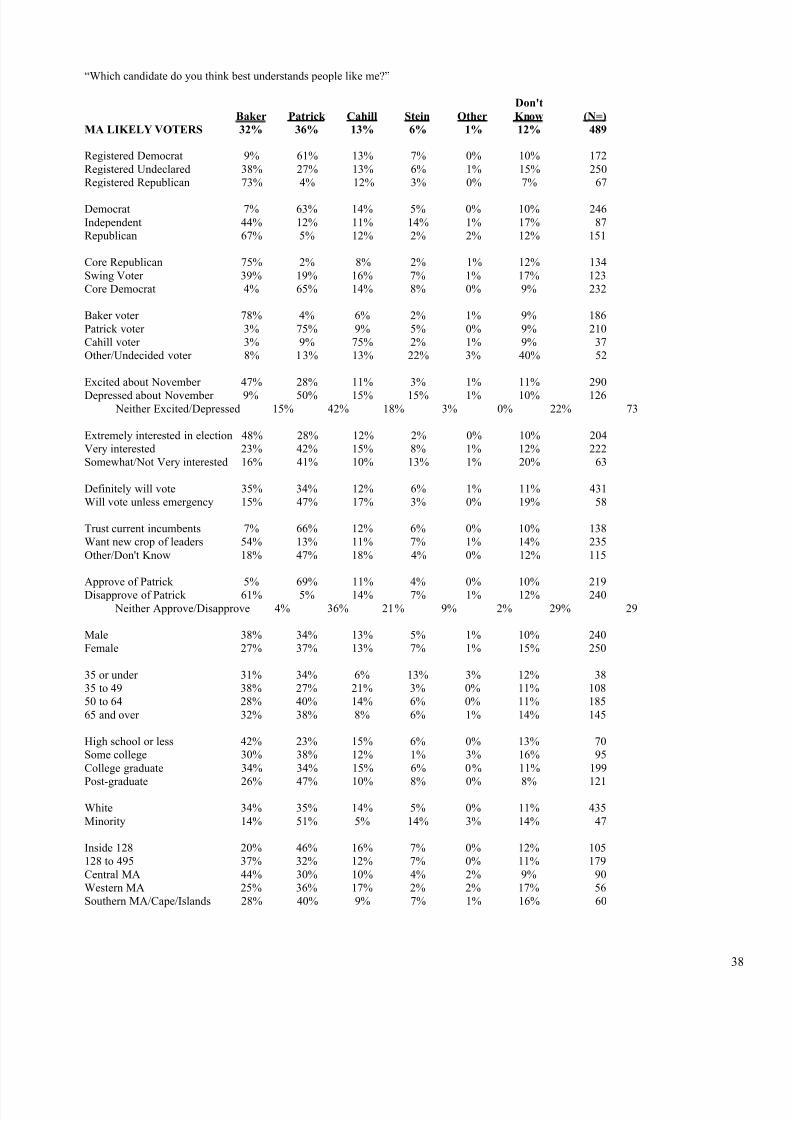
“Which candidate do you think best understands people like me?”
Don't
Baker Patrick Cahill Stein Other Know (N=)
MA LIKELY VOTERS 32% 36% 13% 6% 1% 12% 489
Registered Democrat 9% 61% 13% 7% 0% 10% 172Registered Undeclared 38% 27% 13% 6% 1% 15% 250Registered Republican 73% 4% 12% 3% 0% 7% 67
Democrat 7% 63% 14% 5% 0% 10% 246Independent 44% 12% 11% 14% 1% 17% 87Republican 67% 5% 12% 2% 2% 12% 151
Core Republican 75% 2% 8% 2% 1% 12% 134Swing Voter 39% 19% 16% 7% 1% 17% 123Core Democrat 4% 65% 14% 8% 0% 9% 232
Baker voter 78% 4% 6% 2% 1% 9% 186Patrick voter 3% 75% 9% 5% 0% 9% 210Cahill voter 3% 9% 75% 2% 1% 9% 37Other/Undecided voter 8% 13% 13% 22% 3% 40% 52
Excited about November 47% 28% 11% 3% 1% 11% 290
Depressed about November 9% 50% 15% 15% 1% 10% 126 Neither Excited/Depressed 15% 42% 18% 3% 0% 22% 73
Extremely interested in election 48% 28% 12% 2% 0% 10% 204Very interested 23% 42% 15% 8% 1% 12% 222Somewhat/Not Very interested 16% 41% 10% 13% 1% 20% 63
Definitely will vote 35% 34% 12% 6% 1% 11% 431Will vote unless emergency 15% 47% 17% 3% 0% 19% 58
Trust current incumbents 7% 66% 12% 6% 0% 10% 138Want new crop of leaders 54% 13% 11% 7% 1% 14% 235Other/Don't Know 18% 47% 18% 4% 0% 12% 115
Approve of Patrick 5% 69% 11% 4% 0% 10% 219Disapprove of Patrick 61% 5% 14% 7% 1% 12% 240
Neither Approve/Disapprove 4% 36% 21% 9% 2% 29% 29
Male 38% 34% 13% 5% 1% 10% 240Female 27% 37% 13% 7% 1% 15% 250
35 or under 31% 34% 6% 13% 3% 12% 3835 to 49 38% 27% 21% 3% 0% 11% 10850 to 64 28% 40% 14% 6% 0% 11% 18565 and over 32% 38% 8% 6% 1% 14% 145
High school or less 42% 23% 15% 6% 0% 13% 70Some college 30% 38% 12% 1% 3% 16% 95College graduate 34% 34% 15% 6% 0% 11% 199
Post-graduate 26% 47% 10% 8% 0% 8% 121
White 34% 35% 14% 5% 0% 11% 435Minority 14% 51% 5% 14% 3% 14% 47
Inside 128 20% 46% 16% 7% 0% 12% 105128 to 495 37% 32% 12% 7% 0% 11% 179Central MA 44% 30% 10% 4% 2% 9% 90Western MA 25% 36% 17% 2% 2% 17% 56Southern MA/Cape/Islands 28% 40% 9% 7% 1% 16% 60

8/8/2019 Boston Globe poll on key political races in Mass.
http://slidepdf.com/reader/full/boston-globe-poll-on-key-political-races-in-mass 41/43
39
“Which candidate do you think is most likable?”
Don't
Baker Patrick Cahill Stein Other Know (N=)
MA LIKELY VOTERS 25% 44% 14% 4% 0% 13% 485
Registered Democrat 12% 61% 14% 5% 0% 8% 171Registered Undeclared 27% 37% 17% 4% 0% 16% 250Registered Republican 49% 27% 9% 4% 0% 11% 65
Democrat 12% 63% 13% 3% 0% 9% 244Independent 24% 27% 17% 11% 1% 20% 86Republican 46% 24% 16% 1% 0% 13% 149
Core Republican 55% 18% 11% 3% 0% 13% 133Swing Voter 18% 35% 24% 4% 0% 18% 119Core Democrat 11% 64% 11% 4% 0% 9% 232
Baker voter 50% 23% 15% 2% 0% 10% 185Patrick voter 9% 71% 7% 3% 0% 10% 209Cahill voter 16% 19% 47% 3% 0% 14% 35Other/Undecided voter 5% 28% 20% 14% 1% 31% 51
Excited about November 33% 39% 14% 3% 0% 11% 278
Depressed about November 13% 56% 12% 7% 0% 11% 129 Neither Excited/Depressed 15% 43% 19% 3% 0% 20% 77
Extremely interested in election 30% 37% 16% 3% 0% 14% 205Very interested 21% 52% 13% 3% 0% 12% 217Somewhat/Not Very interested 18% 42% 16% 11% 1% 12% 63
Definitely will vote 27% 41% 14% 4% 0% 14% 428Will vote unless emergency 8% 68% 18% 0% 0% 6% 57
Trust current incumbents 9% 67% 9% 3% 0% 13% 133Want new crop of leaders 41% 25% 18% 5% 0% 11% 232Other/Don't Know 10% 56% 15% 4% 0% 16% 119
Approve of Patrick 11% 67% 8% 3% 0% 11% 217Disapprove of Patrick 40% 22% 20% 5% 0% 13% 235
Neither Approve/Disapprove 6% 49% 19% 4% 0% 23% 31
Male 27% 42% 16% 3% 0% 13% 237Female 23% 46% 13% 5% 0% 13% 248
35 or under 21% 43% 11% 17% 0% 8% 3735 to 49 26% 41% 19% 3% 0% 11% 10850 to 64 26% 46% 15% 2% 0% 11% 18465 and over 24% 43% 12% 5% 0% 16% 143
High school or less 41% 26% 18% 4% 1% 10% 71Some college 23% 49% 13% 2% 0% 12% 97College graduate 21% 46% 16% 5% 0% 11% 193
Post-graduate 22% 49% 10% 4% 0% 15% 120
White 26% 43% 15% 3% 0% 13% 427Minority 17% 54% 11% 11% 0% 7% 50
Inside 128 19% 47% 20% 5% 0% 10% 107128 to 495 27% 47% 12% 2% 0% 11% 173Central MA 32% 33% 16% 4% 0% 15% 90Western MA 21% 52% 9% 4% 0% 14% 54Southern MA/Cape/Islands 23% 41% 13% 6% 0% 17% 62

8/8/2019 Boston Globe poll on key political races in Mass.
http://slidepdf.com/reader/full/boston-globe-poll-on-key-political-races-in-mass 42/43
40
"Please think about the November election for your representative to the U.S. House of Representatives. Do you plan to vote for Sean Bielat(BEE - lat), the Republican ... Barney Frank, the Democrat ... some other candidate ... or do you plan to skip the election for U.S. House of Representatives this time?”
Bielat Frank Other DK (N=) 4TH CD LIKELY VOTERS 33% 46% 10% 11% 385
Registered Democrat 7% 75% 8% 10% 143Registered Undeclared 39% 36% 11% 13% 186
Registered Republican 76% 2% 15% 7% 56
Democrat 5% 79% 6% 10% 191Independent 41% 26% 15% 18% 69Republican 75% 5% 13% 7% 117
Excited about November 46% 33% 12% 10% 209Depressed about November 13% 68% 12% 7% 104
Neither Excited/Depressed 23% 51% 6% 21% 72
Extremely interested in election 47% 36% 9% 9% 162Very interested 27% 48% 11% 14% 160Somewhat/Not Very interested 10% 65% 15% 9% 62
Definitely will vote 34% 43% 10% 12% 325
Will vote unless emergency 24% 59% 13% 4% 60
Approve of Patrick 8% 74% 7% 10% 172Disapprove of Patrick 58% 21% 13% 8% 183
Neither Approve/Disapprove 20% 40% 8% 32% 26
Male 41% 39% 11% 9% 182Female 26% 51% 10% 13% 203
35 or under 25% 42% 20% 13% 2535 to 49 35% 42% 14% 8% 8350 to 64 34% 50% 8% 9% 13365 and over 32% 46% 8% 14% 139

8/8/2019 Boston Globe poll on key political races in Mass.
http://slidepdf.com/reader/full/boston-globe-poll-on-key-political-races-in-mass 43/43
"Please think about the November election for your representative to the U.S. House of Representatives. Do you plan to vote for JeffreyPerry, the Republican ... William Keating, the Democrat ... Maryanne Lewis, the independent candidate ... James Sheets, the other independent candidate ... some other candidate ... or do you plan to skip the election for U.S. House of Representatives this time?"
Perry Keating Lewis Sheets Other DK (N=) 10TH CD LIKELY VOTERS 33% 37% 3% 2% 3% 23% 349
Registered Democrat 3% 71% 2% 2% 2% 20% 95Registered Undeclared 35% 32% 3% 1% 2% 26% 194
Registered Republican 73% 2% 0% 4% 4% 16% 60
Democrat 4% 70% 3% 1% 3% 19% 157Independent 27% 26% 1% 1% 3% 42% 56Republican 69% 4% 2% 3% 2% 20% 135
Excited about November 46% 25% 3% 3% 1% 23% 209Depressed about November 15% 63% 4% 0% 4% 14% 86
Neither Excited/Depressed 9% 47% 0% 1% 6% 37% 52
Extremely interested in election 42% 29% 4% 2% 2% 21% 154Very interested 27% 47% 1% 1% 2% 21% 147Somewhat/Not Very interested 20% 34% 4% 1% 4% 36% 47
Definitely will vote 35% 38% 2% 2% 3% 21% 309
Will vote unless emergency 19% 33% 6% 3% 0% 39% 40
Approve of Patrick 9% 67% 3% 2% 3% 16% 155Disapprove of Patrick 54% 11% 2% 2% 2% 28% 183
Neither Approve/Disapprove 12% 43% 6% 0% 0% 38% 10
Male 37% 38% 1% 2% 1% 21% 182Female 28% 37% 4% 2% 4% 25% 168
35 or under 36% 31% 3% 0% 0% 30% 2235 to 49 28% 37% 2% 0% 3% 29% 7350 to 64 36% 39% 3% 5% 3% 15% 11865 and over 31% 38% 2% 1% 2% 25% 133